smart business strategy
TRANSCRIPT

Smart Business StrategyMinnesota’s eWorkPlace continues!

2

Executive Summary
What is eWorkPlace?
eWorkPlace is a ground-breaking telework program. It is a true public-private partnership, where the
public sector provides incentives, education, and support to employers who commit to integrating
teleworking, or allow flexible work arrangements that lead to real bottom-line benefits for employ-
ers, employees, and the community.
eWorkPlace demonstrates that flexible work is a win-win concept. It is shown to help reduce con-
gestion during peak periods; increases employee productivity and voluntary retention; reduces real
estate costs for employers; saves employees time and money while boosting quality of life; and
reduces greenhouse gas emissions and the need for costly infrastructure investments for our com-
munity. Nearly 3,000 employees from 58 Minnesota employers participated in eWorkPlace from May
2015 to August 20161. Visit the eWorkPlace website at eWorkPlace-mn.com or click on the
Telework Champions logo above to see our list of the Top Companies to Telework in the
Twin Cities.
Based on a program evaluation conducted by the University Minnesota, eWorkPlace benefits from
travel time saving and vehicle costs amounts to more than $12 million annually2. This does not
include additional savings from reduced congestion and less wear on roads and infrastructure.
eWorkPlace Phase II
The purpose of Phase II was to build on the momentum gained during Phase I and continue to reduce
congestion and improve air quality in the Twin Cities by increasing telework participation. Through
continued outreach to employers the program helped bring awareness of the benefits of telework-
ing to organizations and employees. The program provided consulting and training to organizations
through events, webinars, and an interactive website.
Phase II of the project focused its resources on organizations located in Hennepin County. This area
was chosen because of its dense employment concentrations, heavy congestion, and high amount
of air pollution.
Over an 18 month period eWorkPlace promoted, educated, and tracked teleworking in the Twin Cit-
ies metro region. Revamping the project website with new content, more interactive features, and
implementing the Commuter Calculator were among the first tasks. Marketing efforts throughout
the project focused on directing employers and employees to the website. The website provided
training and resources to implement teleworking. It also provided the Commuter Calculator which
was used to track teleworking habits. The Commuter Calculator as well as the employer survey were
used to evaluate teleworking trends. The results of the evaluations are presented in later sections of
this report.
1 eWorkPlace Phase II Employer Survey
2 eWorkPlace Phase II Commuter Calculator and Employer Survey
3

Productivity Gains
More than two-thirds of eWorkPlace employee participants surveyed feel that their pro-
ductivity has increased as a result of teleworking and none feel their productivity has
decreased. More than half of eWorkPlace employers report an increase in productivity,
employee retention, and employee motivation as benefits of teleworking.
Rich Hughes, Senior Vice President and Chief Operating Officer of Human Capital, United
Health Group said, “We have long embraced flexible scheduling and telecommuting when
feasible and appropriate, as our experience and the data associated with it has proven that
telecommuters are very productive, engaged, and produce high quality results.” United
Health Group has seen not only an increase in productivity but better engagement from
their employees.
Congestion Relief
On average, eWorkPlace participants work remotely between two to three days per week,
which saves nearly 260,000 vehicle miles of travel per week. That’s a savings of more than
13 million vehicle miles per year. A small reduction in trips can have exponential effects on
reducing congestion.
Pollution Mitigation
eWorkPlace participants saved approximately 11.2 million pounds of CO2 annually, which
requires the equivalent of around 4,786 acres of mature U.S. forest to absorb. This amount
of CO2 would require 130,094 acres of 10-year-old tree seedlings to be planted in order
to offset the carbon.
Employee Benefits
eWorkPlace participants on average save about three hours in commute time per week.
Over the course of a year, this represents more than 120 hours (more than three work
weeks) of otherwise idle car time to spend with family, exercise, and volunteer in the com-
munity. In addition, eWorkPlace participants avoided an estimated $5.5 million in vehicle
costs annually by working remotely. That is a $1,888 annual saving per participant in gas
and vehicle maintenance.
65 percent of employers report
improved employee retention
11.2 million pounds of CO2 reduced annually,
the equivalent of 4,786 acres of mature U.S. forest needed to
absorb
Nearly 260,000 vehicle miles reduced per
week
Annual savings of $1,888 per participant
for gas and vehicle maintenance
=65%
4

Phase II Purpose and Objectives
The purpose of eWorkPlace is to promote teleworking in the Twin Cities. The main component of Phase II
includes outreach to employers to create awareness of the benefits of teleworking to their organization and
employees, as well as the community at large. Consulting and training designed to make telework a success-
ful and lasting operational change were provided to individual organizations and employer groups. Addition-
ally, the program registered teleworking employees through the Commuter Calculator to measure success.
The primary objectives of Phase II were to recruit 1,000 teleworkers to telework at least one day per week.
This would eliminate 4,500 trips per week which reduces congestion and emissions. Additional benefits to
the region, employers, and businesses are outlined in Table 1 below.
Table 1: Teleworking Benefits
Benefits to Region Benefits to Employees Benefits to Businesses
Reduced number of rush hour work trips which contribute to traffic congestion
Save drive time Increased employee productivity
Improved air quality Save money on gas and parking Enhanced recruitment and retention
Energy conservation Greater productivity Greater geographic flexibility
Maximized infrastructure investment Enhanced quality of life Reduced cost of real estate and overhead
Improved highway safety Reduced cost of living expenses Reduced absenteeism
Energy and environmental benefits Greater economic opportunity for lower income households and people with disabilities
Expanded access to talented people
Better resiliency—economic and disaster
Opportunity to provide employees soft dollar perks
In order to achieve these objectives, project team members met one-on-one with employers to help them
better understand the benefits of teleworking and start their own programs. Public training sessions on how
to plan and implement telework in their workplace also took place to provide instruction aimed at human
resources staff and management.
In addition to meeting in-person with employers, an interactive website (eworkplace-mn.com) was devel-
oped. This website showcased online trainings, tools, up-to-date news and events, and the Commuter Cal-
culator. The Commuter Calculator, employer interviews, and an employer survey were used to measure the
impacts of Phase II.
5

Tools for Twin Cities’ Employers
Phase II of eWorkPlace included revamped tools and an interactive website that were developed by nationally
recognized consultants. The tools and website help employers and employees decide how best to incorporate
teleworking into their organization and help address common concerns through fun and interactive trainings.
Interactive website
eWorkPlace provides free, online tools to help employers implement their telework program. In Phase II the
website was significantly upgraded and enhanced. It is more interactive and engaging while retaining the
high quality tools and modules that eWorkPlace is known for. The following tools are featured on the eWork-
Place website:
• Online Learning Modules – These modules train managers and employees in the use of telework.
The courses are available to participants registered in the eWorkPlace program. Available modules are
discussed in more detail in the High Quality Training and Resources Section.
• Webcasts – A series of interviews with existing eWorkPlace employers and employees was created to
provide training on aspects of telework or telework management.
• Social Media – The team created a dynamic community through the use of social networks and develop-
ment of blog posts. These social media sources were linked via a news feed on the website that displayed
all activity on these sites.
• Commuter Calculator Telework Savings Tool – Registered participants logged the number of
roundtrip miles to work, number of days worked, number of days teleworked, and the type of car driven.
The calculator computes the potential cost savings, environmental benefit, and time saved. Interested
users can use this customized information to quantify the benefits of teleworking and advocate for
expanding teleworking at their workplace.
6

• Events Calendar – Upcoming regional and local events that provide outreach and education opportuni-
ties regarding telework and other flexible work options are listed. This is an excellent networking resource
for those organizations considering implementing or expanding telework and other flexible work options.
• Quizzes – This is a fun and informative way to increase the interactivity of the website as well as provide
information about the benefits of telework.
High Quality Training and Resources
In addition, eWorkPlace provides nationally recognized consultants who have worked with dozens of Min-
nesota employers to establish telework programs. These consultants assist managers with choosing the right
technology, and their services help jumpstart eWorkPlace employers. They have developed the eWorkPlace
Telework Tool Kit which includes:
• Manager’s Guide to Telework contains facts, questionnaires, tips, and processes crucial to establishing
a telework program.
• Telework and Quickstart Advice contains suggestions for customizing your telework strategies.
• Quickstart Telework Agreement is a tool for managers and teleworkers to mutually and quickly deter-
mine and agree on effective telework arrangements.
• Telework Discussion Application assists the potential teleworker and supervisor in analyzing the vari-
ous considerations for telework.
• Telework Implementation Steps contains a general planning guide for implementing telework.
• Telework Policy Agreement contains a guide to develop either company policy or an individual agree-
ment that the manager and teleworker sign.
7

Phase II Performance Measures and Results
An important component of the eWorkPlace program is to measure and evaluate the
impacts of telework for the community, businesses, and individual participants. Through
this evaluation trends are identified and the true impact of teleworking is assessed.
Phase II had a goal to document 1,000 individual participants who telework at least one
day per week. The program was able to show that 2,927 participants regularly telework.
These individuals work at a variety of organizations ranging from large national corpora-
tions such as Wells Fargo to small businesses. They also include public agencies such as
Hennepin County and for profit companies like CBRE.
The focus of the eWorkPlace program is to fight congestion, reduce emissions, and pro-
vide a value-added benefit to Twin Cities’ employers and their employees. For Phase II a
Commuter Calculator, employer interviews, and employer survey were used to measure
and track program results. The Commuter Calculator asked a number of questions related
to commute habits and helped develop accurate averages for vehicle miles traveled and
commute time. These averages were applied to the aggregate number of teleworkers
found in the employer survey and employer interviews to determine eWorkPlace’s impact
on the region. The following results are for Phase II participants only.
Benefits
About 5 percent of all Minnesota workers are engaged in teleworking. There has been
a growth of more than 50 percent in teleworking since the year 20003. This increase in
teleworking has widespread community benefits. Teleworking eliminates vehicles on the
road which reduces congestion and air pollution. It also results in higher productivity and
greater employee retention for organizations. Furthermore, teleworkers enjoy a high work
satisfaction and benefit due to savings from fuel costs, vehicle maintenance, and time
spent commuting.
Trips and Vehicle Miles Reduced
The most effective strategy to reduce congestions is to reduce the number of vehicles on
the road during the peak travel times of 6 a.m. to 9 a.m. and 3 p.m. and 6 p.m. A small
reduction in vehicles during rush hours has an exponential effect on reducing congestion
due to driver behavior and traffic patterns.
On average eWorkPlace participants work remotely 2.5 times per week, which equates to
five commuter trips per week. The average round trip commute distance for eWorkPlace
participants is 35 miles. This results in an elimination of more than 7,000 trips and 250,000
vehicle miles traveled (VMT) per week. This was well above the Phase II goal of 4,500 trips
and 58,500 vehicle miles traveled. The elimination of trips not only reduces congestion, it
also lessens wear and tear on roads, saving money on infrastructure investment.
Teleworking is up 50% in Minnesota
since 2000
On average teleworkers reduce commuting by 2.5
trips per week
=
=
50%
3 http://www.startribune.com/minnesota-a-national-leader-in-telecommuting-trend/384401421/
8

Emissions Reduction
Less VMT also means less air pollution. By eliminating trips through teleworking there is an elimination of the
emissions of the trip. eWorkPlace participants had an average reduction of 4,147 lbs. of CO2 annually, which
would otherwise require 48 acres of 10-year-old tree seedlings to be absorbed or offset.
Table 2: Emission Reduction
Pounds of Carbon Dioxide
Equivalent4
Pounds of Carbon
Monoxide
Pounds of Particulate
Matter
Pounds of Nitrogen
Oxide
Tree Seedlings (10
years old) needed to
absorb/offset carbon3
Acres of U.S. forests needed to
absorb/offset carbon3
Average eWorkPlace Participant Savings per Week
86.4 82.07 0.002 1.11 1.0 0.04
Average eWorkPlace Participant Savings per Year
4,147 3,939 .09 53.43 48 1.77
Total eWorkPlace Participants Savings per Year
11,185,436 10,624,473 2,380 699,550 130,094 4,786
Employer benefits
Through an employer survey, the Commuter Calculator survey, and individual company interviews eWork-
Place is able to show that organizations benefit from teleworking in their organization. Benefits include
increased productivity, employee retention, better employee motivation, and financial savings, among others.
The most cited benefits employers report as a result of teleworking is improved employee retention and bet-
ter employee motivation. About two-thirds of respondents of the employer survey saw improved employee
retention while more than half benefited from better employee motivation. Similarly, 86 percent of individuals
who completed the Commuter Calculator reported an increase in job satisfaction, while 79 percent experi-
enced an increase in organization loyalty since starting teleworking.
Additional benefits of teleworking include better employee productivity and financial savings. Half of the
respondents of the employer survey reported better employee productivity, while 43 percent saw financial
savings. Of the individuals who completed the Commuter Calculator, 69 percent reported an increase in pro-
ductivity and 30 percent reported no change.
4 https://www3.epa.gov/carbon-footprint-calculator/
9

Organizations experience savings in a number of ways. LifeTrack reported seeing “a decrease in sick use and
reduction in mileage reimbursement.” This was a result of the improved flexibility in schedule and location
because of their teleworking initiative. Allina Health not only reported that their teleworking employees were
happy working at home but also that they have incorporated “home agents,” who can take over during fire
drills, weather disruptions, etc. as part of their emergency procedures.
Figure 1: Employer Benefits from Teleworking
Other
Employee Retention
Geographically Broader Recruiting Pool
Better Employee Motivation
Better Employee Productivity
Financial Savings
0% 10% 20% 30% 40% 50% 60% 70%
Employee Benefits
Based on data collected through the eWorkPlace Commuter Calculator, the average participant saves about
$39.33 per week in fuel and maintenance costs. Annually this comes to about $1,888 per teleworker. eWork-
Place participants avoided an estimated $5.1 million in vehicle costs annually by teleworking. The average
fuel savings was based on actual input from participants into the Commuter Calculator while vehicle wear
and tear savings are based on estimates from AAA. These do not include other potential savings or costs of
parking, eating out, or other business-related expenses.
In addition, individual eWorkPlace participants save more than three hours of commute time per week by
teleworking. In the course of a year, this represents 156 hours (or nearly four work weeks) of time to spend
with family, exercise, invest in profession growth opportunities, and volunteer in the community. The aver-
age annual value of this time savings is approximately $2,653 per teleworker. The total participant benefit is
$4,541 annually for vehicle cost and time savings.
10
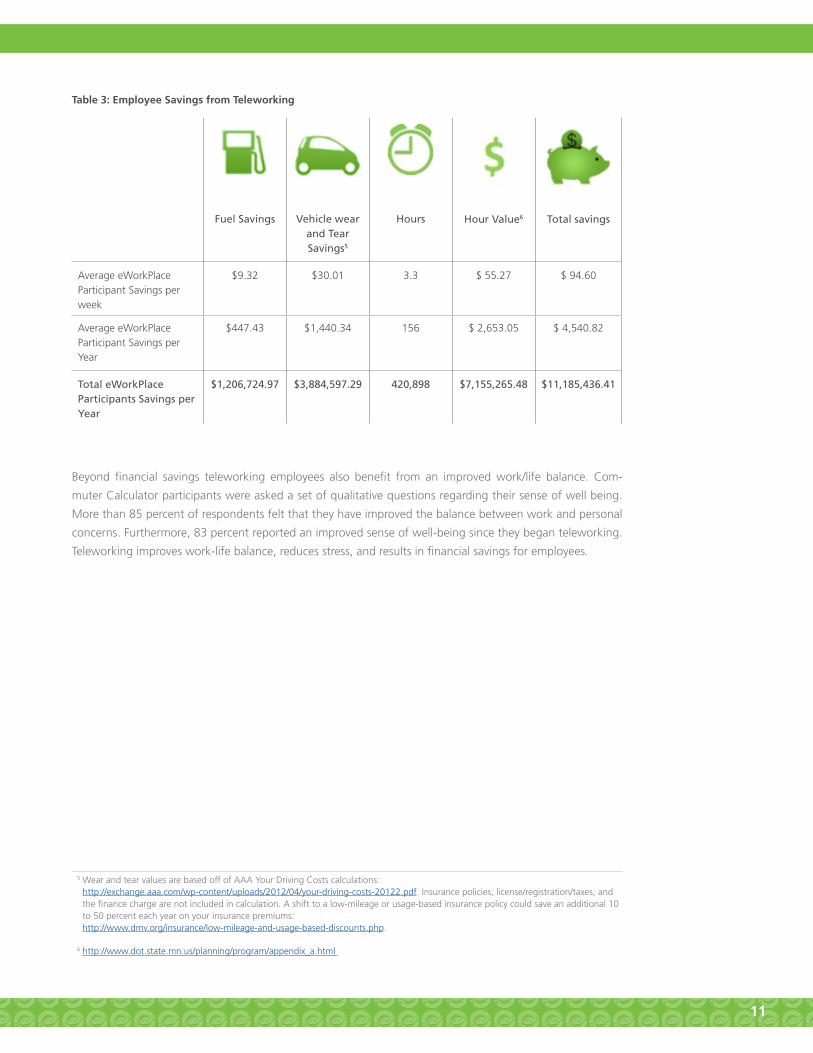
Table 3: Employee Savings from Teleworking
Fuel Savings Vehicle wear and Tear Savings5
Hours Hour Value6 Total savings
Average eWorkPlace Participant Savings per week
$9.32 $30.01 3.3 $ 55.27 $ 94.60
Average eWorkPlace Participant Savings per Year
$447.43 $1,440.34 156 $ 2,653.05 $ 4,540.82
Total eWorkPlace Participants Savings per Year
$1,206,724.97 $3,884,597.29 420,898 $7,155,265.48 $11,185,436.41
Beyond financial savings teleworking employees also benefit from an improved work/life balance. Com-
muter Calculator participants were asked a set of qualitative questions regarding their sense of well being.
More than 85 percent of respondents felt that they have improved the balance between work and personal
concerns. Furthermore, 83 percent reported an improved sense of well-being since they began teleworking.
Teleworking improves work-life balance, reduces stress, and results in financial savings for employees.
5 Wear and tear values are based off of AAA Your Driving Costs calculations: http://exchange.aaa.com/wp-content/uploads/2012/04/your-driving-costs-20122.pdf. Insurance policies, license/registration/taxes, and the finance charge are not included in calculation. A shift to a low-mileage or usage-based insurance policy could save an additional 10 to 50 percent each year on your insurance premiums: http://www.dmv.org/insurance/low-mileage-and-usage-based-discounts.php.
6 http://www.dot.state.mn.us/planning/program/appendix_a.html
11

Program Achievements
Primary Objective Outcome
To recruit 1,000 users to reduce congestion by 4,500 trips per week.
Documented 2,927 teleworkers who commute on average 2.5 days per week to reduce trips by 7,317 per week
To reduce VMT by 58,500 miles per week. VMT was reduced by 258,229 miles per week
To reduce emissions by 53,455 pounds per week. Emissions were reduced by 235,966 pounds per week
Secondary Objectives Outcome
To realize the demonstrated benefits of telework as it relates to the region, employees, and businesses.
The demonstrated benefits of telework are explained in detail in the Regional Benefits, Employer Benefits, and Employee Benefits section.
To maintain the 9-to-1 Return on Investment (ROI) experienced in Phase I of the project.
eWorkPlace participants saved an estimated $11 million in time and vehicle related costs, yielding a ROI that is greater than 29-to-1 when weighed against the Phase II costs.
To recoup project funding costs approximately seven months after the start of the project based on monetized project benefits in the form of travel time savings and vehicle costs (assumes the same level of benefits per person as experienced in Phase I).
The estimated $11 million in annual monetized benefits accruing to participants exceeded project costs enough to show that the costs were covered within the first months of the project.
To create a center of telework expertise, education, and networking for the Twin Cities metropolitan area via the website www.eWorkplace-MN.com.
eWorkplace-MN.com has become the center for telework research, materials, and news.
To provide the necessary information and support and measurement that will enable organizations to make effective and lasting change in the work locations of their employees, beyond the timespan of the project.
eWorkPlace employers have been interviewed and surveyed regarding cultural shifts in their organization. More than 80 percent of companies agree that managers agree or strongly agree with teleworking in their organization.
To build on and protect the initial $3.2 million investment made in eWorkPlace in Phase I by using existing resources where possible.
The eWorkplace-MN brand and website have been critical to the success of Phase II. By building on these resources and existing contacts with organizations Phase II was able to show an increase in teleworking in the Twin Cities.
Reconnect with Phase I companies to encourage them to expand their programs and as a result collect longitudinal data on existing teleworkers.
Beyond attending events and direct contact with employers, eWorkPlace Telework Champions were identified and promoted. These organizations demonstrated their commitment to expanding telework in their organizations.
12

Key Takeaways and Lessons Learned
1. Teleworking is more prevalent in the Twin Cities, making it a national leader in teleworking.
About 5 percent of all Minnesota workers are engaged in teleworking. There has been a growth of
more than 50 percent in teleworking since the year 20007. This growth has propelled Minnesota and
the Twin Cities to be a nationwide leader in teleworking. Forbes magazine ranks Minneapolis 15th in
the nation for teleworking8.
2. Teleworking is commonplace and can be regular or on as-needed basis.
About 80 percent of employers surveyed said that they agree or strongly agree that most managers in
their organization are willing to manage employees who telework. As a result teleworking has become
an informal arrangement between managers and employees.
3. Employees are teleworking more often and from farther distances than before which creates
even greater benefits.
The average number of days and average commute distance has increased in Phase II. This was con-
firmed in both the Commuter Calculator results and employer survey results. Reducing vehicle miles
traveled means less congestion, less emissions, and more vehicle cost savings.
4. Employers and employees see a range of benefits from teleworking.
There is no one single benefit that employers and employees experience from teleworking. eWorkPlace
has seen improvements in employee satisfaction, productivity, and financial savings. Each employer and
employee will experience different benefits depending on their organization’s location and telework
policies.
5. Fewer Employers are tracking telework, making accurate measurement of its impacts more
difficult.
Advances in technology have allowed telework to become an informal arrangement between manag-
ers and employees, leading to fewer formal mechanisms in place for tracking its impacts. To address
this, the Commuter Calculator was designed to assist organizations with tracking teleworking habits
over time. It was most successful when employers, such as Wells Fargo Bank, encouraged employee
participation. However, while organizations support teleworking, they are protective of their employ-
ees. Many organizations do not want to overwhelm their employees with emails and limit the amount
of companywide communication to the most essential. This was reflected in the employer survey,
where 84 percent of surveyed organizations said they were not willing to send out a short survey to
their employees. However, by not tracking telework or encouraging employees to complete the Com-
muter Calculator, organizations miss out on important information that can help them understand the
value of teleworking in their organization.
7 http://www.startribune.com/minnesota-a-national-leader-in-telecommuting-trend/384401421/
8 http://www.forbes.com/sites/karstenstrauss/2016/02/04/the-top-20-cities-for-remote-workers/#5036afb64ee1
13

Appendix ACommuter Calculator Results
A-1

CommuterCalculatorResults
eWorkplacePhaseIISurveyAugust23,2016
159respondents
Whendidyoubegintelecommutingwithyourcurrentemployer?
Average–2011,Median–2013,Rangingfrom1995to2016
Howmanydaysperweekdoyoutelecommute?
Average-2.5,Median-2
78.6%
13.2%8.2%
0.0%
20.0%
40.0%
60.0%
80.0%
100.0%
DedicatedWorkspace SharedWorkspace NoDedicatedWorkspaceor
SharedWorkspace
Doyouhaveadedicatedworkspaceatyour
employer,orisitsharedwithotherswho
telecommute?
15.7%
84.3%
Ondayswhichyoutelecommutedoyoumake
anytrips?
Yes
No
A-2

Howmanytripsdoyoutypicallymake?
Mean-1.4,Median–1
Whichmodedoyouuseformostofthesetrips?
94.4%useautomobile
Howmanydayshaveyoutelecommutedforanyofthesepurposesinthepast
threemonths?
Average–4.9days,Median–3days
32.0%
60.0%
8.0%
0.0%
10.0%
20.0%
30.0%
40.0%
50.0%
60.0%
70.0%
WithinNeighborhood Within10Miles 11to24Miles
Howfardoyoutypicallytravel?
77.40%
22.60%
Inadditiontoyourregulartelecommutingschedule,doyou
workfromhomeortelecommutewhenschooliscancelled,
weatherconditionsarepoor,orifyouneedtocarefora
sickfamilymember?
Yes
No
A-3

Whatwastheaverageround-tripdistance,inmiles,ofyourcommute?
Average–38.8,Median–34miles
Whatwastheaverageduration,inminutes,ofyourAM(beginningofworkday)
commute?
Average–36.5,Median–35,Rangingfrom10-120minutes
Whatwastheaverageduration,inminutes,ofyourPM(endofworkday)
commute?
Average–42.6,Median–40,Rangingfrom10–120
Whatistheaveragefueleconomyofyourcommutevehicle,inmilespergallon?
Average-23.1, Median–23,Rangingfrom5.6to46
Whatwastheapproximatepriceofgaspergallonthelasttimeyoufilledyour
tank?
Average-$2.12,Median-$2.09,Rangingfrom$1.2to$3.00
Howmuchdoyoupayfordailyparkingatyourworksite?
Average-$3.93,Median-$0,Rangingfrom$0to$22
5.7%
76.6%
17.7%
Carpool
DriveAlone
Transit
0.0% 10.0% 20.0% 30.0% 40.0% 50.0% 60.0% 70.0% 80.0% 90.0%
Howdoyoumostoftentraveltowork?
A-4

69.2%
29.6%
1.8%
0.0%
10.0%
20.0%
30.0%
40.0%
50.0%
60.0%
70.0%
80.0%
Increased NotChanged Decreased
MyproductivitysinceIstartedorcontinuedto
telecommutehas:
86.2%
13.8% 0.0%
0.0%
20.0%
40.0%
60.0%
80.0%
100.0%
Improved NotChanged Decreased
MyjobsatisfactionsinceIstartedorcontinueto
telecommutehas:
86.8%
11.9% 1.3%
0.0%
20.0%
40.0%
60.0%
80.0%
100.0%
Improved NotChanged Decreased
MyabilitytobalanceworkandpersonalconcernssinceI
beganorcontinuedtotelecommutehas:
A-5

Contactinformation:
FrankDouma
StateandLocalPolicyProgramDirectorand
MasterofUrbanandRegionalPlanningDegreeProgramCoordinator
HubertH.HumphreySchoolofPublicAffairs
UniversityofMinnesota
612/626-9946
83.6%
15.1%
1.3%
0.0%
10.0%
20.0%
30.0%
40.0%
50.0%
60.0%
70.0%
80.0%
90.0%
Improved NotChanged Decreased
Myfeelingsofwell-beingsinceIbeganorcontinuedto
telecommutehave:
78.6%
20.8%
0.6%
0.0%
10.0%
20.0%
30.0%
40.0%
50.0%
60.0%
70.0%
80.0%
90.0%
Improved NotChanged Decreased
MyfeelingsofloyaltytomyorganizationsinceIbeganor
continuedtotelecommutehave:
A-6

Fuel Savings Vehicle wear and Tear Savings1
Hours Hour Value2 Pounds of Carbon Dioxide
Equivalent3
Tree Seedlings (10 years old)
needed to absorb/offset
carbon3
Acres of U.S. forests needed to
absorb/offset carbon3
Total savings
Average Telecommuter Savings per week
$ 9.32 $ 30.01 3 $ 55.27 86 1.0 0.04 $ 94.60
Your Savings this past Week:
$ 1,211.80 $ 3,900.92 423 $ 7,185.33 11,232 130.6 4.81 $ 12,298.05
Your Average Savings Over One Month:
$ 4,847.18 $ 15,603.68 1691 $ 28,741.33 44,930 522.6 19.23 $ 49,192.20
If you continue to telecommute, you will save the following over one year:
$ 58,166.20 $ 187,244.21 20288 $ 344,896.00 539,157 6,270.8 230.71 $ 590,306.42
1WearandtearvaluesarebasedoffofAAAYourDrivingCostscalculations:http://exchange.aaa.com/wp-content/uploads/2012/04/your-driving-costs-
20122.pdf.Insurancepolicies,license/registration/taxes,andthefinancechargearenotincludedincalculation.Ashifttoalow-mileageorusage-based
insurancepolicycouldsaveanadditional10to50percenteachyearonyourinsurancepremiums:http://www.dmv.org/insurance/low-mileage-and-usage-
based-discounts.php.2http://www.dot.state.mn.us/planning/program/appendix_a.html
3https://www3.epa.gov/carbon-footprint-calculator/
A-7

Appendix B2016 Employer Survey Results
B-1

2016 Employer Survey Results
eWorkplace Phase II Survey
September 19th 2016, 8:43 am MDT
37 respondents
Q1 - Do you have an estimate of the number of employees that participated in your telework program in its first year?
Answer % Count
Yes 24.32% 9
No 75.68% 28
Total 100% 37
B-2

Q2 - How many employees participated in your telework program in its first year?
How many employees participated in your telework program in its first year?
50
200
50
30
6
20
8
B-3

Q3 - Do you have an estimate of the number of employees that are now participating in your telework program?
Answer % Count
Yes 41.18% 14
No 58.82% 20
Total 100% 34
B-4

Q4 - How many employees are now participating in your telework program?
How many employees are now participating in your telework program?
2000
150
39
1
230
5
50
5
50
15
223
B-5

Q5 - How many employees are teleworking:
Answer % Count
Full-time: 45.45% 5
Between half and full time: 18.18% 2
Between quarter and half time: 9.09% 1
Less than quarter time: 18.18% 2
Unknown 18.18% 2
Total 100% 11
Q5_1_TEXT Number of employees working:
Full-time:
39
15
223 Between quarter and half time:
Less than quarter time:
5
45
B-6

Q6 - If there are 20 work days in a typical month, on average about how many days out of 20 do your telework employees work remotely?
If there are 20 work days in a typical month, on average about how many day...
10
4
2
3
8
5
8
20
15 - 20
18
B-7

Q7 - What is the average round-trip commute time (in minutes) for your employees?
What is the average round-trip commute time (in minutes) for your employees...
60
30
30 minutes
20
15
25
20
40
B-8

Q8- What is the primary commute method for your employees?
Answer % Count
Carpool 0.00% 0
Drive alone 80.00% 24
Public transit 6.67% 2
Bike 0.00% 0
Other: 10.00% 3
Unknown 3.33% 1
Total 100% 30
Other:
Other:
Work from home
half drive/half public transit
all of the above
B-9

Q9 - What percentage of positions within your company are telework compatible? (Please insert number without percent sign.)
Field Minimum Maximum Mean Count
What percentage of positions within your company are telework compatible? (Please insert number without percent sign.) 0.00 100.00 39.50 24
B-10

Q10- What prevents you from having more telework-compatible jobs?
Answer % Count
Employee needs to interface with team 38.46% 10
Employee needs specialized equipment 23.08% 6
Employee needs to interface with clients/customers 65.38% 17
IT limitations 15.38% 4
Other: 23.08% 6
Total 100% 26
Q10_1_TEXT - Other:
Other:
N/A
company's decision
U.S. Dept. of Labor restrictions
Nature of data they access requires them to be in the office to do their work.
Field staff need to go where projects are
Security Clearances Prohibit work from being taken home
B-11

Q10_2 - Please comment on your responses to the previous question if need be.
Please comment on your responses to the previous question if need be.
A majority of our internal shared services support is able to telecommute as they support national practices and not needed for local interaction More had this option but some employees abused the program so the company back out a lot of depts. from using the lifework program
Some get to tele-work, others don't. It depends on which office you work out of and who your manager is.
We don't allow telework by nonexempt employees due to DOL. Most of our exempt employees have the option to work remotely.
We are a construction company, none of our field force can telecommute. A small minority of the office staff can.
50% is my estimate, but on a given day it could be 100% or none, depending on the work being done and the amount of face to face interaction needed with staff and external partners. We are a manufacturing organization, which limits the opportunities for our Production staff to be able to work from home.
B-12

Q11- What benefits do you get from making telework available to your employees?
Answer % Count
Financial savings 42.31% 11
Better employee productivity 50.00% 13
Better employee motivation 53.85% 14
Geographically broader recruiting pool 19.23% 5
Employee retention 65.38% 17
Other: 15.38% 4
Unknown 3.85% 1
Total 100% 26
Q11_1_TEXT - Other:
Other:
No disruptions
their jobs require flexible hours
some work can be done much better off site
Stability of operations during weather events
B-13

Q12 - What reasons do your employees give for choosing to telework?
Answer % Count
Desire to avoid commute time 57.69% 15
Flexibility to care for a dependent 50.00% 13
Ability to adjust work hours as needed 57.69% 15
Fewer distractions 46.15% 12
Financial savings 23.08% 6
Other: 3.85% 1
Unknown 3.85% 1
Total 100% 26
Other:
Other:
N/A
B-14

Q13 - What do you feel prevents people in your company from teleworking if they have the option?
What do you feel prevents people in your company from teleworking if they h...
All telecommute
They haven't figured out logistically how to make it work for their position.
impacts of needing to meet with clients (internal or external) on short notice
some teams have a culture of in-person meetings and aren't friendly to people skyping in
Need technology and team members to complete projects. Home environment not conducive to productivity. We don't encourage teleworking in general, but its available on as needed basis. We prefer that people are in the office as much as possible.
They feel more comfortable at work.
none
They have never done it before and are unsure on how to do so and be successful.
home is distracting
Some managers prefer more face time with employees that other managers. Also, for some positions like mine (HR), it's better to be in the office and accessible in person.
They miss the interaction with the team.
Nothing
Personal want
The nature of the work is not compatible with offsite work.
N/A not an option
The type of work we do prohibits work from home
not sure
Nothing
I don't think we have this problem.
Fear of missing out on team discussions, day to day interactions, being seen as hard working.
No separate work area at home. Desire to interact with coworkers.
Having the space and privacy to work at home.
Like to be around others who share the same job responsibility. Experience (new employees are not allowed to telecommute in their first year of employment. Some positions require face-to-face interaction with clients and customers at a specific work site. Some departments are not as comfortable not being able to see employees working/lack of criteria and measurement for work.
Needs to interact with other team members, customers and clients.
Home environment not suitable for work. Ability to connect with others in the office over breaks/coffee.
B-15

Q14 - Please indicate the extent to which you agree or disagree with the following statements. - Most teleworking employees in my company are easily accessible during standard work hours.
Question Strongly Agree Agree Disagree Strongly
Disagree Total
Most teleworking employees in my company are easily accessible during standard work hours.
60.00% 15 40.00% 10 0.00% 0 0.00% 0 25
Most teleworking employees in my company are easily accessible before or after standard work hours.
8.00% 2 80.00% 20 12.00% 3 0.00% 0 25
Most managers in my organization are willing to manage employees who telework.
12.00% 3 68.00% 17 16.00% 4 4.00% 1 25
B-16

Q15 - Please add any additional comments you have about your company's telework program.
Please add any additional comments you have about your company's telework p...
We don't have a "formal" telework program, but on a case by case basis, we have employees working from home on a regular basis. And most employees work from home to some extent on an "irregular" as needed basis. We try and be a flexible organization. And, as we continue to have "new" employees transition into the workforce it will continue to be more and more important to have that sort of work/life balance and flexibility in a schedule. We have an informal rather than formal telework program. My boss and I had attended an e-work seminar several years ago but didn't institutionalize it. Our exempt executives have jobs that require frequent travel, so remote work is a given for them.
We don't have one
Habits would be a better word to use than program.
B-17

Q16 - Would you be willing to send out a short survey to your employees about their telework habits?
Answer % Count
Yes 16.00% 4
No 84.00% 21
Total 100% 25
B-18

Q17 - If yes, will you allow your employees to complete the survey during work hours?
Answer % Count
Yes 75.00% 3
No 25.00% 1
Total 100% 4
B-19

CONTACT INFORMATION
Adeel Lari Program Director
Humphrey School of Public Affairs University of Minnesota
[email protected] 612.624.7746
The Future is Now.eWorkPlace is a program to help Twin Cities metro area employers introduce telework and enjoy its benefits. In the
past five years, eWorkPlace has proven itself as a smart business strategy that enables employees to work from home,
full-or part-time, and connect to the office and clients via internet, phone, and mobile devices.
Version 4 |December 2016 | SRF Consulting Group, Inc.
Productivity. Innovation. Efficiency.