smart city, smart growth - atlantis press
TRANSCRIPT
Smart city, smart growth
Yi Han
School of Electrical & Electronic Engineering, North China Electric Power University, Baoding 071003, China
Keywords: Three E Metric Model, Analytic Hierarchy Process, Smart Growth Index (SGI)
Abstract. The world is rapidly urbanizing, it is more and more important to coordinate the balance between rapid urbanization and sustainable development. To make contribution to explore this project, we determine a metric model, named Three E Metric Model, to assess the degree of the urban smart growth. First, considering the principles of smart growth, 17 influence factors are selected and divided into three subsystems include Economy(affected by GDP per capita, the proportion of tertiary industrial output-value, etc.), Environment (affected by water use efficiency, wastewater treatment rate, land use, etc.) and Social Equity (unemployment rate, Gini coefficient, etc.). The actual value of each factor is divided by standard value (refer to international standards) and then multiply corresponding weight calculated by Analytic Hierarchy Process. In this way, we construct Smart Growth Index (SGI) and divide the cities into five grades. The higher SGI is, the better smart growth is.
1. Introduction In today’s increasing global and interconnected world, over half of the world’s population (54 per
cent) lives in urban areas although there is still substantial variability in the levels of urbanization across countries. The coming decades will bring further profound changes to the size and spatial distribution of global population. The continuing urbanization and overall growth of the world’s population is projected to add 2.5 billion people to the urban population by 2050, with nearly 90 per cent of the increase concentrated in Asia and Africa. At the same time, the proportion of the world’s population living in urban areas is expected to increase, reaching 66 per cent by 2050. [1] In order to ensure the coordination of rapid urbanization and sustainable development, smart growth initiatives are implemented.
2 Three E Metric Model In this section, we construct a metric model capable of measuring the success of smart growth of a
city, named Three E Metric Model. Then we define a index, named Smart Growth Index (SGI).It measures the success of smart growth of a city, on the basis of the three E’s of sustainability. A larger SGI means a high level of smart growth and sustainability, that is, the growth plan of this city can be carried out well. On the contrary, we need to consider adjusting the current initiatives. 2.1 Review of literatures
Before we research smart growth of a city, we go through the numerous indicators widely-used in the literatures, and then selected some indicators that are mostly related to the objective and themes of this issue. In the view of city and citizen, here we chose the following index and evaluation system for reference:
Urban sustainable development evaluation system Sustainable development is the goal that each city pursuits, but what is sustainable development
on earth? How to realize the sustainable development? A Estate Research institution, built a set of operable and evaluable urban sustainable development Index system designed to evaluate the urban development, find out the deficiency and provide the suggestion for a developing city. [2] It was divided into five subsystems, including 23 indicators. For application, it chose the index of domestic
2nd International Conference on Machinery, Electronics and Control Simulation (MECS 2017)
Copyright © 2017, the Authors. Published by Atlantis Press. This is an open access article under the CC BY-NC license (http://creativecommons.org/licenses/by-nc/4.0/).
Advances in Engineering Research, volume 138
580

TOP10 city as the benchmark value, the average level of National City as the reference value. Then score the city according to their development situation, finding out the problems existing in the development.
City Prosperity Index Prosperity implies success, wealth, thriving conditions, and wellbeing as well as opportunity. In
general terms, a prosperous city offers a profusion of public goods and develops policies and actions for a sustainable use and equitable access to ‘commons’. [3] In some degree, it is close to the principle of smart growth.
Table 1 City Prosperity Index: definition and variables
Productivity index
It measures the total output of goods and services (value added) produced by a city's population during a specific year by including variables such as capital
investment, formal/informal employment, inflation, trade, savings, export/import and household income/consumption.
Quality of life index It is a combination of three sub-indices: education, health and public space.
Infrastructure development index It combines two sub-indices: infrastructure proper and housing.
Equity and social inclusion index
It has three sub-indexes: air quality (PM10), CO2 emissions and indoor pollution.
Environmental sustainability
index
It combines measures of inequality of income/consumption (Gini coefficient) and inequality of access to services and infrastructure.
Source: UN-Habitat, 2012: 14. Happiness Index Happiness index is a measure of people's satisfaction with social and economic development.
Among the dimensions of material living conditions are Income & Jobs and Housing Conditions. The immaterial dimensions of the quality of life include Health, Education, Environmental Quality, Personal Security, Civic Engagement and Work-Life Balance. [4] Figure 2 shows the partition of life quality based on these dimensions. Source: OECD (2014), how is life in your region?
Figure 1 quality of life dimensions
As the main part of a city, we cannot ignore the feelings of the residents in the process of building and developing the modern city, so we analyze and research on the Happiness Index evaluation system
Uniquely among these system or index, smart growth model is a reflection of the new urbanism in city planning. The smart growth model explores a harmony among economic, community development and environmental protection. Its main topic is not no-growth, but where and how to start the new growth. Smart growth mostly focuses on building cities that embrace the E’s of sustainability—Economically prosperous, socially Equitable, and Environmentally Sustainable. 2.2 Construction of model 2.2.1 Influence factors
For a city's sustainable development and smart growth, we need to consider various factors. The basic principles of establishing the index system of smart growth are: Science, Feasibility
Advances in Engineering Research, volume 138
581
(operational), Hierarchy, Completeness, Dynamics. As an improvement and integration on reference, we take 17 factors as the object. They can totally measure the success of smart growth of a city. Also we develop a "smart growth index"(SGI) based on the combination of three subsystems, which shown in Table 2. 2.2.2 Refined AHP
Analytic Hierarchy Process, [6] is a multiple criteria decision-making tool. This is an Eigen value approach to the pair-wise comparisons. It also provides a methodology to calibrate the numeric scale for the measurement of quantitative as well as qualitative performances. The scale ranges from 1/9 for ‘least valued than’, to 1 for ‘equal’, and to 9 for ‘absolutely more important than’ covering the entire spectrum of the comparison. Our model is based on AHP:
Step 1: Analyze the objectives of smart growth and influent factors. Step 2: Identify the criteria that influence the smart growth. Step 3: Structure the problem in a hierarchy of different levels constituting goal, criteria,
sub-criteria and alternatives. Step 4: Compare each element in the corresponding level and calibrate them on the numerical
scale. Step 5: Perform calculations to find the maximum Eigen value, consistency index, consistency
ratio, and normalized values for each criteria/alternative. Step 6: If the maximum Eigen value, consistency index, and consistency ratio are satisfactory then
decision is taken based on the normalized values; else the procedure is repeated till these values lie in a desired range.
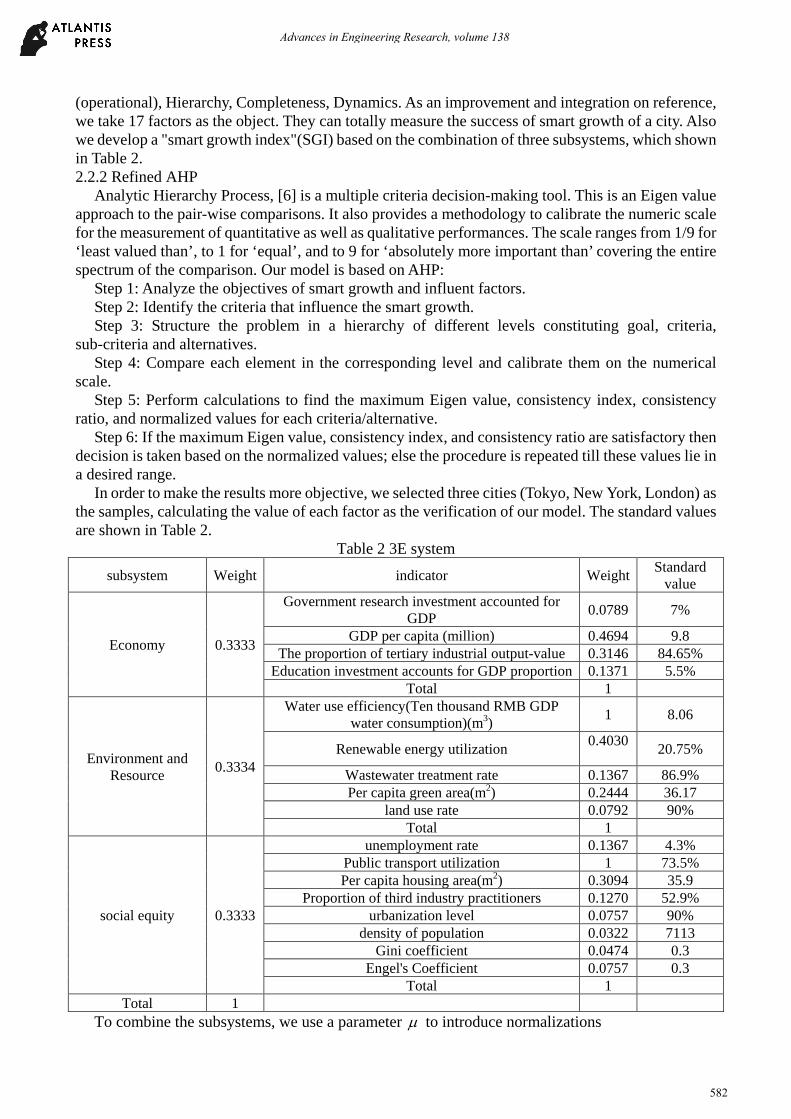
In order to make the results more objective, we selected three cities (Tokyo, New York, London) as the samples, calculating the value of each factor as the verification of our model. The standard values are shown in Table 2.
Table 2 3E system subsystem Weight indicator Weight Standard
value
Economy 0.3333
Government research investment accounted for GDP 0.0789 7%
GDP per capita (million) 0.4694 9.8 The proportion of tertiary industrial output-value 0.3146 84.65%
Education investment accounts for GDP proportion 0.1371 5.5% Total 1
Environment and Resource 0.3334
Water use efficiency(Ten thousand RMB GDP water consumption)(m3) 1 8.06
Renewable energy utilization 0.4030 20.75%
Wastewater treatment rate 0.1367 86.9% Per capita green area(m2) 0.2444 36.17
land use rate 0.0792 90% Total 1
social equity 0.3333
unemployment rate 0.1367 4.3% Public transport utilization 1 73.5% Per capita housing area(m2) 0.3094 35.9
Proportion of third industry practitioners 0.1270 52.9% urbanization level 0.0757 90%
density of population 0.0322 7113 Gini coefficient 0.0474 0.3
Engel's Coefficient 0.0757 0.3 Total 1
Total 1 To combine the subsystems, we use a parameter µ to introduce normalizations
Advances in Engineering Research, volume 138
582
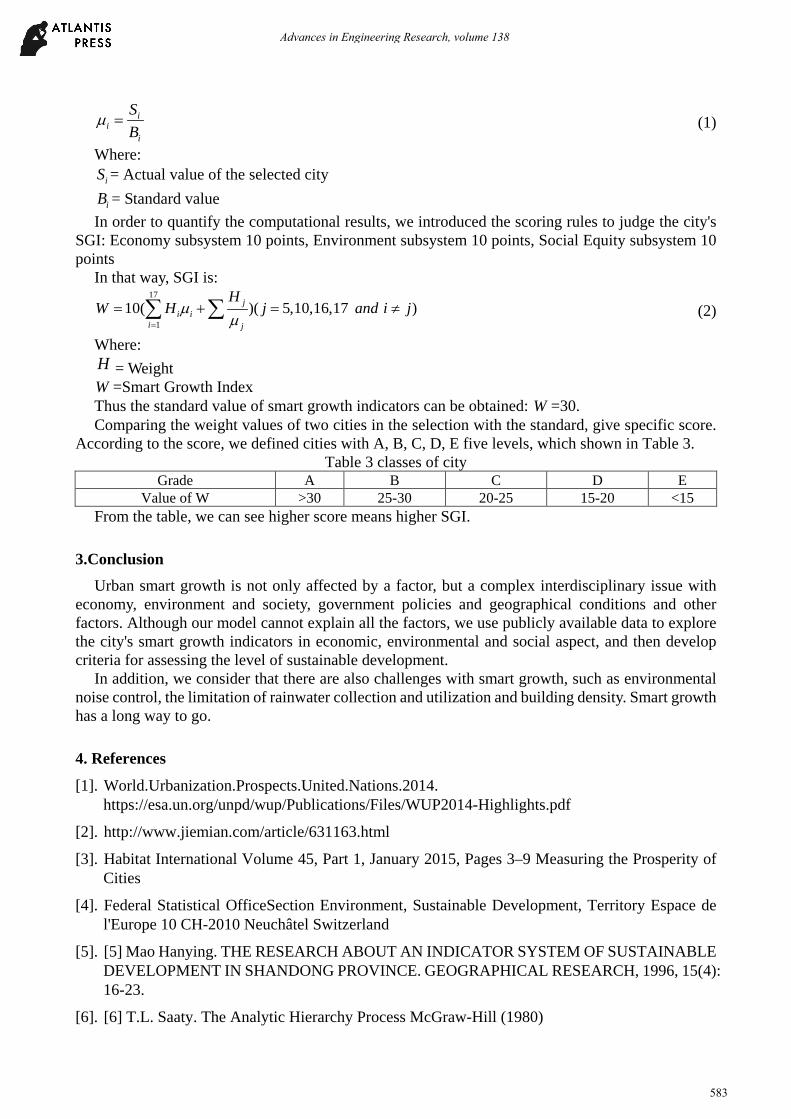
ii
i
SB
µ = (1)
Where: iS = Actual value of the selected city
iB = Standard value In order to quantify the computational results, we introduced the scoring rules to judge the city's
SGI: Economy subsystem 10 points, Environment subsystem 10 points, Social Equity subsystem 10 points
In that way, SGI is: 17
110( )( 5,10,16,17 )j
i ii j
HW H j and i jµ
µ=
= + = ≠∑ ∑ (2)
Where: H = Weight W =Smart Growth Index Thus the standard value of smart growth indicators can be obtained: W =30. Comparing the weight values of two cities in the selection with the standard, give specific score.
According to the score, we defined cities with A, B, C, D, E five levels, which shown in Table 3. Table 3 classes of city
Grade A B C D E Value of W >30 25-30 20-25 15-20 <15
From the table, we can see higher score means higher SGI.
3.Conclusion
Urban smart growth is not only affected by a factor, but a complex interdisciplinary issue with economy, environment and society, government policies and geographical conditions and other factors. Although our model cannot explain all the factors, we use publicly available data to explore the city's smart growth indicators in economic, environmental and social aspect, and then develop criteria for assessing the level of sustainable development.
In addition, we consider that there are also challenges with smart growth, such as environmental noise control, the limitation of rainwater collection and utilization and building density. Smart growth has a long way to go.
4. References
[1]. World.Urbanization.Prospects.United.Nations.2014. https://esa.un.org/unpd/wup/Publications/Files/WUP2014-Highlights.pdf
[2]. http://www.jiemian.com/article/631163.html
[3]. Habitat International Volume 45, Part 1, January 2015, Pages 3–9 Measuring the Prosperity of Cities
[4]. Federal Statistical OfficeSection Environment, Sustainable Development, Territory Espace de l'Europe 10 CH-2010 Neuchâtel Switzerland
[5]. [5] Mao Hanying. THE RESEARCH ABOUT AN INDICATOR SYSTEM OF SUSTAINABLE DEVELOPMENT IN SHANDONG PROVINCE. GEOGRAPHICAL RESEARCH, 1996, 15(4): 16-23.
[6]. [6] T.L. Saaty. The Analytic Hierarchy Process McGraw-Hill (1980)
Advances in Engineering Research, volume 138
583