smart context-aware qos-based admission control for
TRANSCRIPT

UNCO
RREC
TED
PROO
F
Journal of Network and Computer Applications xxx (2017) xxx-xxx
Contents lists available at ScienceDirect
Journal of Network and Computer Applicationsjournal homepage: www.elsevier.com
Smart context-aware QoS-based admission control for biomedical wireless sensornetworksCarlos Abreu a, b, ⁎, Francisco Miranda a, c, P.M. Mendes b
a Instituto Politécnico de Viana do Castelo, Portugalb CMEMS-UMinho, Universidade do Minho, Portugalc Center for Research and Development in Mathematics and Applications, University of Aveiro, Portugal
A R T I C L E I N F O
Keywords:Context-Aware QoSAdmission ControlBiomedical Wireless Sensor Networks
A B S T R A C T
Wireless sensor networks are being used as the enabling technology that helps to support the development ofnew applications and services targeting the domain of healthcare, in particular, regarding data collection forcontinuous health monitoring of patients or to help physicians in their diagnosis and further treatment assess-ment. Therefore, due to the critical nature of both medical data and medical applications, such networks haveto satisfy demanding quality of service requirements. Despite the efforts made in the last few years to developquality of service mechanisms targeting wireless sensor networks and its wide range of applications, the net-work deployment scenario can severely restrict the network's ability to provide the required performance. Fur-thermore, the impact of such environments on the network performance is hard to predict and manage due toits random nature. In this way, network planning and management, in complex environments like general orstep-down hospital units, is a problem still looking for a solution. In such context, this paper presents a smartcontext-aware quality of service based admission control method to help engineers, network administrators, andhealthcare professionals managing and supervising the admission of new patients to biomedical wireless sensornetworks. The proposed method was tested in a small sized hospital. In view of the results achieved during theexperiments, the proposed admission control method demonstrated its ability, not only to control the admissionof new patients to the biomedical wireless sensor network, but also to find the best location to admit the newpatients within the network. By placing the new sensor nodes on the most favourable locations, this method isable to select the network topology in view of mitigating the quality of service provided by the network.
1. Introduction
Data gathering of physiological signals for health monitoring shouldnot interfere with the patients’ mobility. This may be achieved usingwireless technology through the use of Biomedical Wireless Sensor Net-works (BWSNs). Since they must be worn unobtrusively by patients,BWSNs are composed of small-sized wireless nodes equipped with sen-sors for biomedical data collection, designed for medical applicationsor healthcare services. Typical applications of BWSNs include emer-gency response, ambient assisted living applications to monitor and as-sist disabled or elderly people (Hadjidj et al., 2013; Carmen Domingo,2012), and patient monitoring systems for chronically ill persons (Laiet al., 2009). Among these application fields, this work will focus on
the aspects related to the Quality of Service (QoS) guarantees requestedto BWSNs by patient monitoring systems used to collect vital and phys-iological signs of patients in step-down hospital units or nursing homes.
Typical patient monitoring applications, supported by BWSNs, areused to collect vital or physiological signs, such as respiratory rate, pulserate, temperature, blood pressure, and oximetry in order to complementthe measurements performed manually by nursing professionals a fewtimes a day and thus, enhancing the quality of the health care providedto patients. The sensed data are then sent to a local or remote databaseto be used to support healthcare professionals on their medical practice.As an abstraction, BWSNs can be seen as the lowest layer for HealthcareInformation System (HIS), collecting data to support healthcare profes-sionals on their decisions and medical diagnosis, as shown in Fig. 1.
⁎ Corresponding author at: Instituto Politécnico de Viana do Castelo, Portugal.
http://dx.doi.org/10.1016/j.jnca.2017.01.034Received 31 October 2015; Received in revised form 23 September 2016; Accepted 30 January 2017Available online xxx1084-8045/ © 2016 Published by Elsevier Ltd.

UNCO
RREC
TED
PROO
F
C. Abreu et al. Journal of Network and Computer Applications xxx (2017) xxx-xxx
Fig. 1. Reference network architecture used to develop and test the proposed QoS probing methodology.
The use of BWSNs in healthcare can enhance the services providedto citizens. In particular, they have the potential to play an importantrole in the development of new real-time patient monitoring applica-tions. However, due to the critical nature of the data carried by them,they have to fulfil high levels of QoS in order to be fully accepted byboth the healthcare providers and the patients. The QoS level requestedto a BWSN depend on its use, i.e., on the requirements of the applica-tion using the BWSN as communication infrastructure. Regarding theQoS requirements imposed to BWSNs (e.g., considering the signals beingmonitored), they can include timeliness, reliability, robustness, privacyand security (Abreu et al., 2014). On its turn, depending on the purposeof the BWSN application, QoS requirements such as mobility support ornetwork lifetime can be very important (Abreu et al., 2014a).
The deployment of real-time monitoring applications, such as patientmonitoring, is dependent on a robust communication infrastructure ableto provide admission control in order to keep the required QoS levels.Despite the several QoS mechanisms proposed in the last few years, tar-geting Wireless Sensor Networks (WSNs) and their applications, the net-work deployment scenario can severely restrict the network's ability toprovide the required QoS. Bearing in mind BWSNs and their typical de-ployment scenarios (i.e., hospitals or nursing homes), several obstacleshave to be faced by engineers and network administrators. Harsh en-vironments, like hospital facilities, can expose BWSNs to very hostilesituations regarding the radio communications and thus, the network'sability to provide the required QoS. In such harsh environments the net-work performance depends on either random or deterministic factors.Random factors, such as the dynamics of the hospital environment, theradio interferences, and the patient's mobility can affect the network ca-pability to provide the necessary QoS in an unexpected way (Ko et al.,2010a, 2010b). On its turn, deterministic factors, such as network con-gestion due to the over the populated network can be avoided usingproper admission control methods.
Since the network conditions will change with time, the solution tomaintain the QoS levels is to deploy algorithms to control different net-work aspects in order to get the best QoS (Chen et al., 2011). As a fewexamples, it can be mentioned the design of medium access mechanisms(Gama, 2011; Mir Mehedi et al., 2015; Anjum et al., 2013), the use ofalgorithms that are energy friendly (Jacob and Jacob, 2015; Khan et al.,2014), or even more complex solutions to detect and remove bad datafrom the network to improve the QoS (Paola et al., 2013).
Despite the many proposed mechanisms that may be used to max-imise the QoS available in a WSN, in some scenarios the required levelsof QoS may not be available in the network. To prevent new nodes inthe network operating with QoS levels below the required by the appli-cation, the QoS level in the network must be monitored and, eventually,the admission to the network must be controlled. As discussed in Abreuet al. (2014), Pereira et al. (2012), Lindh and Orhan (2009) and Farooqand Kunz (2014), both QoS monitoring systems and admission controlsystems are keystones to achieve high levels of reliability and perfor-mance in WSNs; in fact, they complement each other.
Regarding the admission control, a few approaches have been pro-posed in recent years. The authors of Sun et al. (2005) propose Sen-Probe, an end-to-end capacity estimation tool that can be used for per-formance analysis and network deployment planning. SenProbe usesone-way active measurements to estimate the end-to-end path capacityby injecting packet trains in the network to measure the packet disper-sion. As an alternative to real-time active measurements, the authorsof Yaling Yang and Kravets (2005) propose a contention-aware admis-sion control protocol designed for IEEE 802.11 ad‐hoc networks, whichestimates the available channel capacity by allowing each node to es-timate the time that the communication channel is being used. Thework presented in Ibrahim Orhan and Lindh (2011) proposed a mea-surement-based admission control system, where the admission decisionis made by the network coordinator, based on real-time measurementsof the packet loss ratio provided by a performance meter. The perfor-mance meter runs on each sensor node and it is continually tracking thenumber of sent and received data packets and bytes. By running on eachsensor node, the performance meter contributes to its energy depletion,reducing the network lifetime. Since WSNs are composed, typically, ofenergy-constrained sensor nodes, the increase of energy consumption ontheir nodes must be avoided. In fact, depending on the network appli-cation, it could be a strong drawback. Although proposing different so-lutions, all these studies support the importance and the need of usingboth QoS monitoring and admission control systems, to manage and im-prove the performance of WSNs.
In this context, the objective of this work is to contribute with asmart context-aware QoS-based admission control method for BWSNs.The proposed admission control method uses a probe based procedureto find the best location to place new patients in a nursing room orstep-down hospital unit, minimising their impact on the performanceof the BWSN, in order to preserve the QoS being provided to the pa-tients already within the network. To avoid the problem of energy de
2

UNCO
RREC
TED
PROO
F
C. Abreu et al. Journal of Network and Computer Applications xxx (2017) xxx-xxx
pletion in the energy-constrained sensor nodes, the proposed methoduses the node that, usually, is plugged to the power line (i.e., the WSNborder router) to collect the dataset used by the mathematical decisionalgorithm. To mitigate the power consumption in each sensor node, theQoS Probe was designed to be triggered for short time periods, and onlyon demand, leading to an insignificant extra power use.
2. Proposed admission control for biomedical wireless sensornetworks
The proposed smart context-aware QoS-based admission controlmethod uses a probe-based admission control procedure to decidewhere a new sensor node can join the network. The decision regardingwhere to admit the new sensor node on the network is based on time-do-main analysis of the performance metrics used to quantify the QoS pro-vided by the network. In this work, and to assess the performance of theproposed methodology, the Packet Reception Ratio (PRR) was the met-ric selected for QoS measuring purposes. Within the proposed method,the probe-based procedure uses a “virtual sensor node” called QoS Probeto mimic the presence of a new real sensor node in its neighbourhood,when necessary (e.g., on-demand or periodically triggered by software).The use of a “virtual sensor node” avoids the need of the new sensornode to be physically present within the network and enables to assessthe network performance from a remote location.
2.1. Context-awareness
Biomedical wireless sensor networks designed to support patientmonitoring applications inside hospital facilities have to face severalchallenges, in particular, regarding the dynamic nature of the surround-ing environment. Hospital facilities can be very hostile environmentsfor radio frequency communications. Such adversities result from struc-tural factors such as the presence of metallic doors and furniture, as wellas the existence of radiation shields (Ko et al., 2010). In fact, Ko et al.(2009) confirmed that the packet losses for IEEE 802.15.4-based radiosare higher in hospitals than in other indoor environments. Moreover,IEEE 802.15.4-based networks are prone to interferences from othercommunication technologies such as IEEE 802.11 (i.e., Wi-Fi networks),Bluetooth devices, and cordless phones, all of which are habitually usedin hospitals (Ko et al., 2010). To further worsen this scenario, low-powernetworks are highly vulnerable to obstacles, interferences and humanbodies (Ko et al., 2010; Chen et al., 2011). Furthermore, from the previ-ous discussion, it becomes clear that hospital environments could havea significant impact on the QoS provided by BWSNs. Moreover, the dy-namic of the deployment environment affects the network performancein an unpredictable way.
The existence of such adverse effects makes clear the necessity forQoS-based admission control systems able to make decisions consider-ing the effects of the surrounding environment (i.e., the context) on the
network performance. Moreover, the context awareness is not only dueto the fact that the network collects information about its operation,which is influenced by the network deployment context, but also be-cause such information will be obtained taking into account the type ofsignals the new patient requires. Since the network will be probed bya node that emulates the new patient, this solution is also aware of thelevel of monitoring that is required (n.b., network requirements are dif-ferent when different physiological signals needs to be monitored).
2.2. Working principle of the proposed admission control method
A common approach to control the admission of new data flows isto reserve the required bandwidth in each router that will support suchdata. Such solution requires a signalling protocol to preserve per-flowstate, and to process per-flow reservation messages at all routers. Themain drawback of that solution will be the lack of scalability, a require-ment of major relevance when sensor nodes are in place. A way to avoidthe above mentioned problems is to use an admission control methodol-ogy that controls the network QoS at the endpoints. Such approach usesthe edge nodes to test each new admission, assessing the entire pathfrom sink to source (Ignacio Más and Karlsson, 2007, 2008). The newproposed methodology was designed to avoid of per-hop schemes with-out adding any complexity to the network nodes (Abreu et al., 2014b).The proposed admission control is based on a “virtual sensor node”,which is added to the network to mimic and predict the effect on theQoS when adding a new real node. Fig. 2 shows the developed method-ology used to probe the network, as well all the messages exchanged toassess if the new sensor node can be admitted to the network.
The admission procedure, which is controlled by the network admin-istrator (or who is in charge, hereinafter referred as operator), has thefollowing phases: first the operator selects the type of sensor node tobe added to the network and its preferential location in the network;then the operator requests the system to evaluate the network in orderto assess its QoS; finally, based on the information retrieved by the sys-tem, the operator decides where the node can be admitted to the net-work. During the network evaluation phase, the system configures theQoS Probe, running on one of the sensor nodes placed in the locationchosen to add the new sensor node, to mimic the presence of the newsensor node. Then, the QoS Probe starts sending a data flow, identicalto that which will be generated by the real node, to the sink. Finally,the system analyses the changes in the network's QoS introduced by thenew data flow and reports it to the operator that decides where the newsensor node can be admitted to the network.
2.3. Developed software and its architecture
The software developed to implement the proposed smart con-text-aware QoS-based admission control method, and to run on each
Fig. 2. Protocol implemented to detect if a new node can be admitted into the network.
3
UNCO
RREC
TED
PROO
F
C. Abreu et al. Journal of Network and Computer Applications xxx (2017) xxx-xxx
node within the BWSN, was built on top of the Contiki OS (Dunkels etal., 2004) and follows the architecture presented in Fig. 3. The softwaredeveloped interacts with the Contiki OS at two levels, namely at the ap-plication layer and at the network layer. This architecture facilitates thesoftware portability to other operating systems or to be used with othercommunication stacks.
The software developed to implement the proposed admission con-trol method adds the following modules to the base operating systemarchitecture: QoS Manager, QoS Profile, QoS Probe, QoS Analyser andQoS Daemon. The QoS Manager is the interface between the applica-tion and the QoS-based network management software. It is responsibleto manage the interactions between all the remaining components. Theapplication uses the QoS Manager to receive information about the QoSprovided by the network or to trigger actions, such as the admissioncontrol procedure. The QoS Profile contains all the relevant informationabout each data flow, including the required QoS. The QoS Probe (i.e.,the “virtual sensor node”) runs only on the sensor nodes. It can be con-figured, on demand, to perform remote tasks. Such tasks include gener-ating specific data flows or collecting information about the node per-formance (e.g., its radio link quality). The QoS Analyser runs only in thesink node and extracts the relevant information about each data flowto assess the real-time QoS provided by the network and, if necessary,generates alerts to the healthcare information system. Finally, the QoSDaemon is in charge of all the control and signalling communicationsbetween the nodes within the BWSN.
2.4. Foundations to use the concept of virtual sensor node
Considering the demanding QoS requirements imposed to BWSNs, itis important to know the QoS provided by the network at any instant.This requisite is straightforward to achieve once all network nodes arewithin the network and running some kind of QoS monitoring software.Nevertheless, knowing the QoS being provided by the network is fun-damental, it may be insufficient. In some scenarios, such as a hospi
Fig. 3. Software architecture adopted to deploy the developed QoS mechanism.
tal, it is necessary to anticipate the behaviour of the network beforeadding a new sensor node (i.e., a patient being monitored) to it, e.g., tofind the most favourable location to place new patients instead of plac-ing them in a random location potentially dangerous for the network.However, predicting the QoS that will be provided by the network afteradding a new sensor node to the network is a challenging task.
Our approach to face this challenge is to postulate that we can usethe deployed network to assess if a new node may be added. If we canuse the network to probe itself about the consequences of adding a newnode, with some specific traffic characteristics, we avoid to disrupt thenetwork by overloading it. In this way, we propose to virtualize the sen-sor node that will be added to the network. Using the concept of “virtualsensor node” it is possible to assess the network without placing the newnode physically in the hospital. Such node will be emulated by a realsensor node already available in the network, in the place required tobe tested. However, before we proceed further with the use of a virtualnode to replace the real node for test purposes, it is required to verifyif both scenarios may be equivalents and what are the conditions wheresuch approach holds.
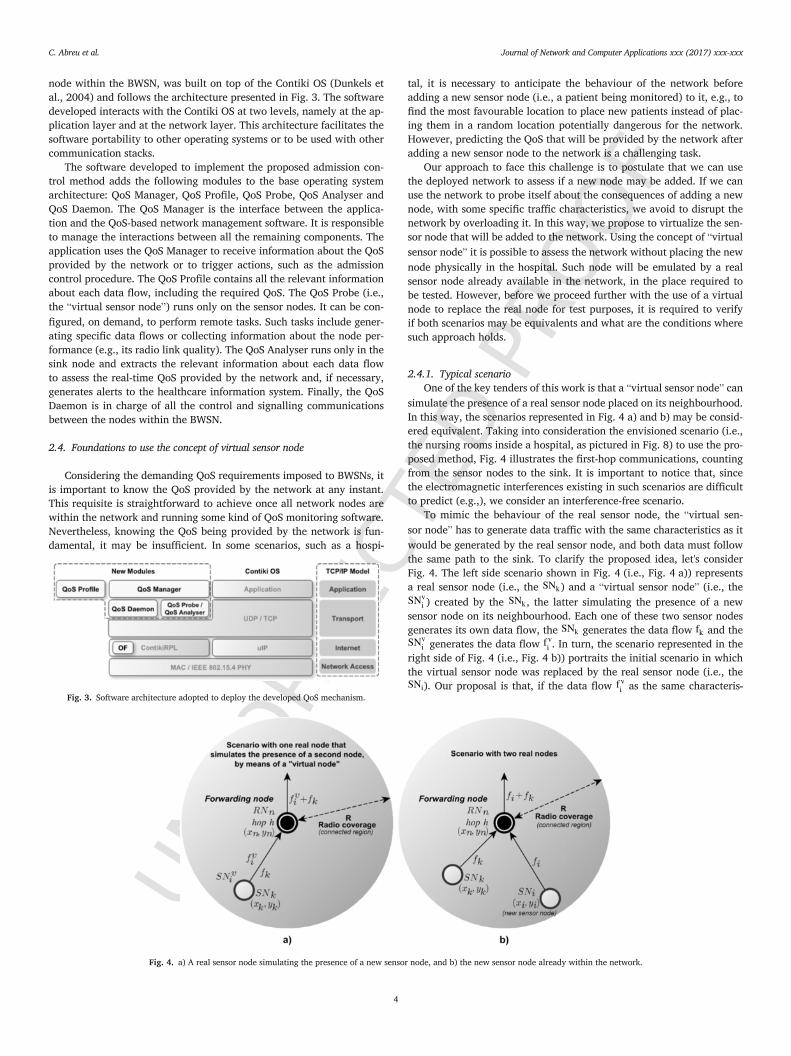
2.4.1. Typical scenarioOne of the key tenders of this work is that a “virtual sensor node” can
simulate the presence of a real sensor node placed on its neighbourhood.In this way, the scenarios represented in Fig. 4 a) and b) may be consid-ered equivalent. Taking into consideration the envisioned scenario (i.e.,the nursing rooms inside a hospital, as pictured in Fig. 8) to use the pro-posed method, Fig. 4 illustrates the first-hop communications, countingfrom the sensor nodes to the sink. It is important to notice that, sincethe electromagnetic interferences existing in such scenarios are difficultto predict (e.g.,), we consider an interference-free scenario.
To mimic the behaviour of the real sensor node, the “virtual sen-sor node” has to generate data traffic with the same characteristics as itwould be generated by the real sensor node, and both data must followthe same path to the sink. To clarify the proposed idea, let's considerFig. 4. The left side scenario shown in Fig. 4 (i.e., Fig. 4 a)) representsa real sensor node (i.e., the ) and a “virtual sensor node” (i.e., the
) created by the , the latter simulating the presence of a newsensor node on its neighbourhood. Each one of these two sensor nodesgenerates its own data flow, the generates the data flow and the
generates the data flow . In turn, the scenario represented in theright side of Fig. 4 (i.e., Fig. 4 b)) portraits the initial scenario in whichthe virtual sensor node was replaced by the real sensor node (i.e., the
). Our proposal is that, if the data flow as the same characteris
Fig. 4. a) A real sensor node simulating the presence of a new sensor node, and b) the new sensor node already within the network.
4

UNCO
RREC
TED
PROO
F
C. Abreu et al. Journal of Network and Computer Applications xxx (2017) xxx-xxx
tics of the data flow , then, those scenarios can be considered equiva-lent.
Looking to Fig. 4, one of the principal differences between thetwo scenarios presented is the different location of the sensor nodes
and . As a consequence, the data flows and may reachthe with different delivery probabilities (n.b., the signal strengthdecays exponentially with respect to the distance between the nodesthat are communicating. Moreover, for a given distance , the signalstrength is randomly distributed among the mean distance dependentvalue (Zuniga and Krishnamachari, 2004)). In fact, several experimen-tal studies, considering real-world deployments, performed during thelast few years have shown that wireless links can be found in one ofthree regions, namely connected, transitional, and disconnected (Zunigaand Krishnamachari, 2004; Nouha Baccour et al., 2012; Zamalloa andKrishnamachari, 2007). The links within the connected region are oftenof good quality, stable and symmetric leading to high PRR. On the otherhand, the links in the disconnected region have poor quality and are in-adequate to support communications (Nouha Baccour et al., 2012). Fi-nally, within the transitional region, the links are of intermediate qual-ity (n.b., considering a long-term evaluation), unstable, have higher co-efficient of correlation in their PRRs, when compared to nearby receivernodes located in the connected or disconnected regions, and a lot asym-metric. In view of these outcomes it is possible to make the followingobservations to support the proposed method:
1. Sensor nodes within the connected region have high PRRs;2. Sensor nodes geographically close to each other, inside the connected
region, have low spatial correlation in their PRRs.
Therefore, the scenarios presented in Fig. 4 can be considered equiv-alent if the “virtual sensor node” (i.e., the ) and the new real sensornode (i.e., the ) are located inside of the connected region. In thisway, it is of extreme importance to find the limits of the transitional re-gion.
The authors Zuniga and Krishnamachari (2004) have identified thecauses of the transitional region and have quantified their influence inthe network performance. Indeed, they have derived not only expres-sions for the PRR as a function of the distance between the transmit-ter and the receiver, but also expressions to find the limits of the tran-sitional region. Furthermore, such expressions show how the radio pa-rameters (i.e., the modulation, the encoding, the output power at thetransmitter, the noise floor, and the noise at the receiver), and the en-vironmental parameters (i.e., the path loss exponent, the log-normalshadow variance, and the noise floor) influence the length of the transi-tional region. Bearing those parameters in mind, the transmitter outputpower is of utmost importance. It can be easily used to tune the limitsof the transitional region to the needs of each specific application, tak-ing into consideration the particular characteristics of each environmentand the network deployment area. More insights about how the trans-mitter output power impact the beginning of the transitional region canbe found in (Zuniga and Krishnamachari, 2004; Nouha Baccour et al.,2012; Zamalloa and Krishnamachari, 2007).
In view of the scenarios presented in Fig. 4 and Fig. 8, the connectedregion must have about 5 m in length around the receiver node (i.e.,considering the dimensions of typical nursing rooms). In other words,the beginning of the transitional region must be at 5 m from the re-ceiver. Moreover, considering the severe QoS requirements imposed toBWSNs a lower limit of 90% was imposed to the PRR in the connectedregion (n.b., this value can be adjusted according to the needs of eachparticular application). Thus, it is necessary to find the minimum trans-mitter output power necessary to fulfil those requirements.
In the following, the model presented in Zuniga and Krishnamachari(2004) will be used to find the minimum output power
at the transmitter necessary to achieve the desired length for the con-nected region, considering the PRR limit imposed by the application.It is important to notice that this model was designed for non-coher-ent FSK modulation and Manchester encoding used by several radiochips (e.g., CC1000, 2005). Nevertheless, Zamalloa and Krishnamachari(2007) have shown that this model can be used as a worst case approx-imation for radio chips using O-QPSK modulation and DSSS encoding,e.g.: CC2420 (2011) present in the TelosB motes (Polastre et al., 2005),used in this work. Then, in order to fundament the proposed method, itwill be analysed at two levels. First, at the node level, the effects of posi-tioning the sensor nodes at different locations were investigated in viewof single-hop communications. In particular, at the first hop countingfrom the sensor node to the sink. Then, the effects of having differentdelivery probabilities at single-hop communications are studied at thenetwork level, i.e., considering multi-hop communications. Our analysedoes not consider sensor nodes mobility nor dynamic objects inside thedeployment environment, and the channel conditions for each wirelesslink are considered to be constant along the time, or at least during sig-nificant time intervals.
2.4.2. Finding the output power necessary to achieve the required connectedregion
The following analysis uses the log-normal shadowing path lossmodel (Rappapport, 2002) and the outcomes presented in Zuniga andKrishnamachari (2004) to find the minimum transmitting power, ,necessary to achieve a connected region with a radius of 5 m . The pa-rameters used to model the indoor environment are: path loss exponent(rate at which signal decays) ; standard deviation (shadowing ef-fects) ; power decay at the reference distance ,; noise floor (n.b., considering scenarios with interfer-ences, changes over time and can be modelled as a random process(Zamalloa and Krishnamachari, 2007)); and the size of the frames usedto communicate is .
Let us bound the connected region to PRRs greater than 0.9 and thetransitional region to PRRs between 0.9 and 0.1. From the theoreticalmodel deduced in Zuniga and Krishnamachari (2004), we obtain the fol-lowing SNR values for PRRs of 0.1 and 0.9, and , respectively,
and we have
for the minimum transmitting power necessary to achieve the length offor the connected region. In the following we analyse if a “vir-
tual sensor node” can simulate the presence of a real sensor node placedin the connected region of 5 m in length.
2.4.3. Analysing the virtual sensor node's PRR considering single-hopcommunications
Consider the scenario presented in Fig. 4 without noise, i.e.,. To obtain the maximum difference between the PRR achieved by thevirtual data flow and the real data flow , considering only first-hop(i.e., the link between the , or the , and the ), we use theequation of PRR at a transmitter-receiver distance d obtained in Zunigaand Krishnamachari (2004):
5

UNCO
RREC
TED
PROO
F
C. Abreu et al. Journal of Network and Computer Applications xxx (2017) xxx-xxx
(1)
where , andis the received signal strength at a given distance d from the trans-mitter. From Rappapport (2002) we have
, where is a zero-meanGaussian random variable (in dB) with standard deviation (shad-owing effects). First, we obtain a relationship between and
for an increment at the distance between and. Using the Taylor's theorem for the first-order case at the point ,
we have:
(2)
where is the remainder term. By properties of Eq. (1) we canstate that the remainder term is residual in interval andEq. (2) with is a good linear approximation to Eq. (1) on
. Then, we have for, where:
(3)
and. Since Eq. (3)
is a decreasing non-positive function on we obtain that. Therefore, since , we have
in the connected region of 5 min length. Thus, the difference between the PRR achieved by the vir-tual data flow and the real data flow , considering only first-hop,is approximately equal to zero. Moreover, considering shadowing ef-fects corresponding to , by Eq. (1), we can find a sub-regionwith radius into the connected region of length of 5 msuch that for . So,we also conclude that the virtual data flow is approximately equalto real data flow inside this sub-region with radius . If one of thetwo sensor nodes or is out of this sub-region, we obtain
i.e., the maximum difference between thePRR achieved by the virtual data flow and the real data flow is 0.1.However, both have a rate greater than or equal to 90%.
2.4.4. Analysing the virtual sensor node's PRR considering multi-hopcommunications
Rather than single-hop communications, typical BWSNs have mul-tiple hops between the source sensor nodes and the sink. In fact, theymay have not only several hops between those nodes but also severalpaths to route the data gathered by the sensor nodes to the sink. Inthat way, two sensor nodes can send their data to the sink using dis-tinct data paths, each one having a particular PRR associated. In ourproposal we consider that the data flow , generated by the “virtualsensor node” of Fig. 4a), follows the best path to reach the sink(n.b., the rule to find the best path depend on the routing protocol inuse). Moreover, the sensor node will use the same path to send itsdata to the sink. In other words, we are assuming that the “virtual sen-sor node”, , and the real sensor node, , use the same data pathto send their data to the sink. In this way, the PRR associated with thepath between the and the sink is the same for both data flows. Ad-ditionally, as it was shown in the last subsection, the PRRs achieved bythe virtual data flow and the real data flow at the first hop arevery similar (with a maximum error of 10%). Consequently, it is possi
ble to argue that the PRRs of both data flows, for the entire path (i.e.,from the sensor node until the sink) are almost equivalent.
In summary, our proposal is that a “virtual sensor node” can producean equivalent effect in the performance of a WSN, when compared witha real sensor node, if both sensor nodes produce data with the samecharacteristics, both data flows follow the same path to the sink, andthey are within the connected region experiencing the same radio con-ditions.
2.4.5. Experimental validationBearing in mind the previous requirements, the following experi-
ment was performed in a real world scenario recreating the conditionsexisting in a nursing room (e.g., with fixed obstacles and metal fur-niture), as follows: a sink node and a sensor node were used to mea-sure the PRR at different distances between the two nodes and for sev-eral angles all around the receiver as pictured in Fig. 5, in order tofind the minimum transmitter power necessary to achieve a PRR of, atleast, 90% inside the connected region and set the beginning of the tran-sitional region to 5 m from the transmitter. Assessing the PRR in dif-ferent directions is crucial since the radiation pattern of the antennais anisotropic due to the fact that the antennas have different gainsat different propagation directions, resulting in different PRRs (NouhaBaccour et al., 2012). Therefore, it is necessary to tune the output powerof the network nodes in order to ensure the desired connected regionin all directions. The PRR for each pair (distance, angle) was calculatedafter the sensor node had sent five hundred messages to the receiver.
The results obtained from such experiment are pictured in Fig. 5.Considering such results it is possible to argue that the minimum outputpower at the transmitter necessary to achieve a connected region of 5 min length, with a PRR of, at least, 90%, is , as predict earlier bythe analytic model. It is important to notice that these results depend oneach specific environment and network deployment area. Consequently,these results must be tuned for each network deployment.
3. Methodology assessment in a real hospital environment
Real-world experiments were performed to evaluate the smart con-text-aware QoS-based admission control method. The experiments weremade in a small-sized hospital situated in Esposende, a small city nearBraga, Portugal.
3.1. Preliminary findings and initial deployment
The deployment of BWSNs in real-world environments is a challeng-ing task even to engineers with high levels of expertise in BWSNs sys-tems. Moreover, when harsh environments are at stake, such as hospitalfacilities or nursing homes, the difficulties to get BWSNs working prop-erly worsens. Hence, each real-world BWSN deployment must be care-fully designed not merely according to the demands of each target ap-plication, but also considering the particular characteristics of each de-ployment area.
3.1.1. Preliminary findingsBased on the knowledge obtained from this particular deployment,
it is possible to argue that each real-world deployment is unique. More,it is strictly necessary to study and understand the intrinsic character-istics of each deployment site, namely those that can compromise thequality of the wireless channel, such as: attenuation of the radio sig-nal caused by metallic furniture, interferences caused by other med-ical equipment's, and other negative effects caused by peoples’ routines(e.g., staff shifts or visiting times). Such study is vital to design a suit
6

UNCO
RREC
TED
PROO
F
C. Abreu et al. Journal of Network and Computer Applications xxx (2017) xxx-xxx
Fig. 5. The PRR as a function of the transmitter output power, the distance and angle between the sender and the receiver.
able network deployment strategy in order to achieve the required per-formance.
Regarding the deployment scenario used to evaluate the proposedadmission control method, the following procedure was made in or-der to understand the intrinsic characteristics of the network deploy-ment site. First, information was collected about the use made of thenetwork deployment area. Second, an inspection was made to iden-tify other radio communication infrastructures (e.g., an IEEE802.11 net-work) existing on the network deployment area. Third, an examina-tion was made to find hospital furniture and/or medical equipment ableto cause attenuation/interferences in the radio signals (e.g., fading dueto multipath or due to shadowing from obstacles). Finally, information
was requested about the hospital staff shifts and about the visitingschedule.
It is important to emphasise that the research team had no controlon the environment conditions, or on the use of any hospital/medicalequipment, during the field tests. All the tests were made under the su-pervision of the hospital staff.
The area used to perform the field tests (i.e., the shaded area pre-sented in the Fig. 6) has a nursing desk and three nursing rooms inwhich low-acuity patients stay for a period that, typically, do not ex-ceed eight days. Those nursing rooms are not private, if necessary twoor three patients can share the same room.
Fig. 6. Floor plan of the Hospital showing the nursing rooms and the nursing desk used to deploy the BWSN.
7

UNCO
RREC
TED
PROO
F
C. Abreu et al. Journal of Network and Computer Applications xxx (2017) xxx-xxx
From our survey, it was found that the deployment area does nothave any other wireless communication technology. Instead, the infor-mation system uses a wired communication infrastructure. Therefore, itwas not necessary to perform any tests to study the radio activity in thedeployment area. When other wireless communication technologies aredetected, it is necessary to study the coexistence of both technologies,as explained by in Ko (2012).
Concerning the signal propagation and electromagnetic interferences(or any other effect able to deteriorate the radio signal), neither thehospital furniture nor the medical equipment found in the deploymentarea is susceptible of causing significant damages to the radio channel.On its turn, the staff daily routines can be classified as regular concern-ing the normal activities of a non-acute hospital area. So, on this par-ticular deployment area, the radio signal propagation is affected onlyby the building structure (e.g., walls, corridors or steel doors) and bythe human bodies present on the site. During the field tests the aver-age amount of people inside of the network deployment area, simulta-neously, did not exceed a dozen. So, the network deployment area canbe considered as having low density of people.
Fig. 7. The network topology makes use of a backbone of relay nodes to ensure the nec-essary coverage and to route the data packets to the sink.
3.1.2. Initial deploymentAfter the preliminary study just described, it was necessary to design
the network deployment strategy. First, the network physical topologywas defined. Following the strategy proposed by the MEDiSN project(Ko et al., 2010a, 2010b), the solution adopted makes use of a backboneof Relay Nodes (RNs) and several Sensor Nodes (SNs), defining a treetopology as represented in the in Fig. 7. As explained by the authors ofthe MEDiSN project, the backbone is used both to form a bidirectionallink to the Sink and to ensure the required network coverage. Moreover,the use of a backbone has several benefits. It allows expanding the net-work, both to improve its performance (e.g., by carefully placing moreRNs in the same area) and to increase the network coverage (i.e., im-proving the network scalability).
Since the nursing staff will use information retrieved by the pro-posed smart context-aware QoS-based admission control method tomake a decision about the best location to place the patients, the nat-ural location to place the sink is the nursing desk, so it can be connectedto the computer running the frontend interface of the network manage-ment system. The backbone contains two RNs strategically placed to en-sure good connectivity inside the nursing rooms three and four.
Fig. 8 shows the deployment of both the sink and the backbone (n.b.,the links between the RNs within the backbone and between the RNsand the sink are merely for example purposes. In reality, the backboneis self-organized).
Several tests were made in order to determine the best spots to setup the RNs, while ensuring both the necessary network coverage andthe required network performance. To assess the network's performancethe end-to-end PRR was used as a figure-of-merit. Based on the tests per-formed the RNs were deployed as shown in the Fig. 8. After deployingthe RNs backbone, the BWSN became fully functional and ready to ad-mit the patients, i.e. the sensor nodes.
3.2. Experiments
In the following all the experiments performed to evaluate the smartcontext-aware QoS-based admission control method are explained in de-tail, in particular the use of a “virtual sensor node” to mimic the pres-ence of a new real sensor node within the network.
Fig. 8. Initial deployment, showing the relay nodes forming a backbone to the sink.
8
UNCO
RREC
TED
PROO
F
C. Abreu et al. Journal of Network and Computer Applications xxx (2017) xxx-xxx
The evaluation procedure was made in two distinct scenarios, ac-cording to the number of nursing rooms used and patients being moni-tored. By using different nursing rooms, it was possible to assess the pro-posed method taking into account the impact of the hospital structure(e.g., granite walls, corridors and doors) on the propagation of the radiosignals and, consequently, on the network performance. On its turn, theuse of several patients makes the experiments closer to reality, assessingthe suggested method under realistic conditions.
In the first scenario, no more than three patients were monitoredwhile sharing the same nursing room (i.e., the room 4 from Fig. 8). Thisscenario was designed to assess the proposed method without interfer-ences from patients being monitored in the neighbourhood and, at thesame time, experiencing the minimum impact from the deployment en-vironment. By using this scenario, the proposed method will be used toassess the impact of adding a new patient to the network.
Then, in the second scenario, a maximum of five patients were mon-itored while distributed by two non-adjacent nursing rooms (i.e., therooms 3 and 4, separated by two bathrooms, as pictured in Fig. 8). Thisscenario was designed to assess the suggested QoS-based admission con-trol method under interferences from patients being monitored in theneighbourhood of the “virtual sensor node”. Moreover, this scenario isalso useful to study the impact of using the proposed method, on thepatients being monitored in the neighbourhood of the “virtual sensornode”.
These scenarios were designed with the purpose to verify the follow-ing hypothesis:
HypothesisAdding a “virtual sensor node” to a BWSN produces an equivalent
impact in the network's performance, when comparing with the addi-tion of a new real sensor node. H. 1.
If this hypothesis was confirmed, the proposed smart context-awareQoS-based admission control method can be used to answer the follow-ing questions:
• Which is the impact of adding a new patient to a BWSN, in the QoSbeing provided to the patients already within the network?
• Which is the best location to add a new patient to a BWSN, while min-imising its impact in the QoS being provided by the network?
In such context, all the experiments were performed under the fol-lowing assumptions and constraints:
• The term patient is only a nomenclature used to improve the under-standing of the experiments. In reality, they are represented by thesensor nodes;
• The physiological data are generated by the sensor nodes;• The data generated by the “virtual sensor node” and by the new pa-
tient follow the same path to the sink.• The mobility of the sensor nodes is very limited and unable to cause
changes in the network topology (i.e., in both the physical and logicaltopologies).
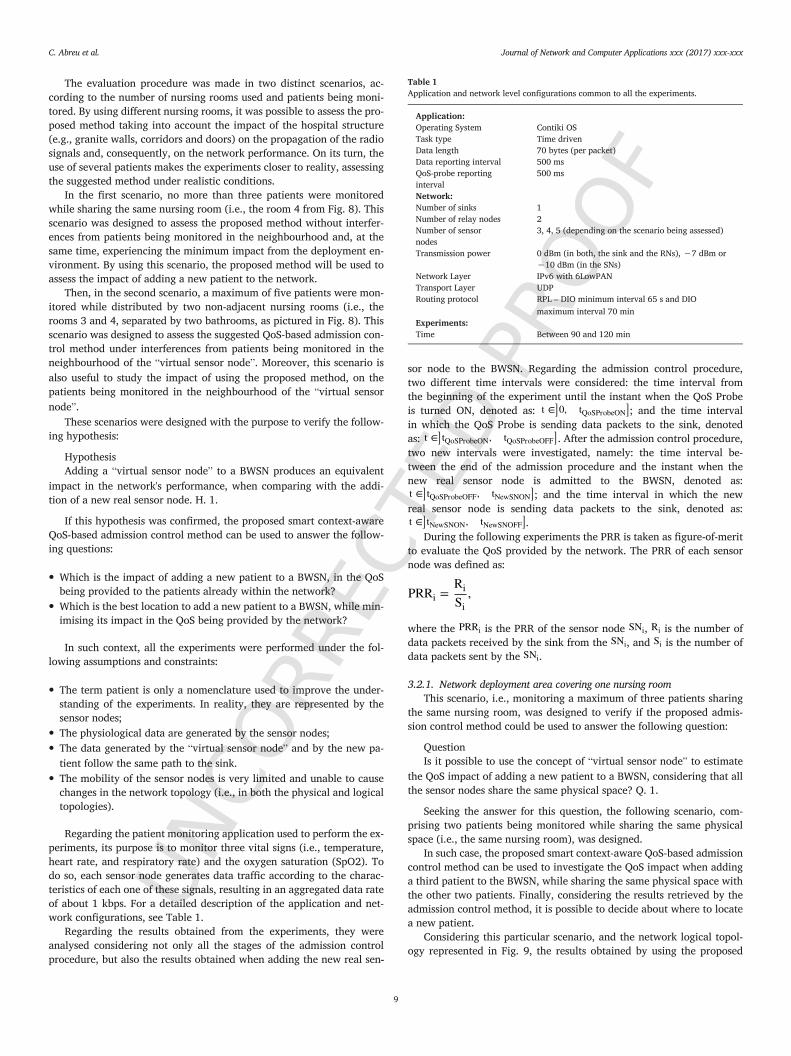
Regarding the patient monitoring application used to perform the ex-periments, its purpose is to monitor three vital signs (i.e., temperature,heart rate, and respiratory rate) and the oxygen saturation (SpO2). Todo so, each sensor node generates data traffic according to the charac-teristics of each one of these signals, resulting in an aggregated data rateof about 1 kbps. For a detailed description of the application and net-work configurations, see Table 1.
Regarding the results obtained from the experiments, they wereanalysed considering not only all the stages of the admission controlprocedure, but also the results obtained when adding the new real sen
Table 1Application and network level configurations common to all the experiments.
Application:Operating System Contiki OSTask type Time drivenData length 70 bytes (per packet)Data reporting interval 500 msQoS-probe reportinginterval
500 ms
Network:Number of sinks 1Number of relay nodes 2Number of sensornodes
3, 4, 5 (depending on the scenario being assessed)
Transmission power 0 dBm (in both, the sink and the RNs), −7 dBm or−10 dBm (in the SNs)
Network Layer IPv6 with 6LowPANTransport Layer UDPRouting protocol RPL – DIO minimum interval 65 s and DIO
maximum interval 70 minExperiments:Time Between 90 and 120 min
sor node to the BWSN. Regarding the admission control procedure,two different time intervals were considered: the time interval fromthe beginning of the experiment until the instant when the QoS Probeis turned ON, denoted as: ; and the time intervalin which the QoS Probe is sending data packets to the sink, denotedas: . After the admission control procedure,two new intervals were investigated, namely: the time interval be-tween the end of the admission procedure and the instant when thenew real sensor node is admitted to the BWSN, denoted as:
; and the time interval in which the newreal sensor node is sending data packets to the sink, denoted as:
.During the following experiments the PRR is taken as figure-of-merit
to evaluate the QoS provided by the network. The PRR of each sensornode was defined as:
where the is the PRR of the sensor node , is the number ofdata packets received by the sink from the , and is the number ofdata packets sent by the .
3.2.1. Network deployment area covering one nursing roomThis scenario, i.e., monitoring a maximum of three patients sharing
the same nursing room, was designed to verify if the proposed admis-sion control method could be used to answer the following question:
QuestionIs it possible to use the concept of “virtual sensor node” to estimate
the QoS impact of adding a new patient to a BWSN, considering that allthe sensor nodes share the same physical space? Q. 1.
Seeking the answer for this question, the following scenario, com-prising two patients being monitored while sharing the same physicalspace (i.e., the same nursing room), was designed.
In such case, the proposed smart context-aware QoS-based admissioncontrol method can be used to investigate the QoS impact when addinga third patient to the BWSN, while sharing the same physical space withthe other two patients. Finally, considering the results retrieved by theadmission control method, it is possible to decide about where to locatea new patient.
Considering this particular scenario, and the network logical topol-ogy represented in Fig. 9, the results obtained by using the proposed
9

UNCO
RREC
TED
PROO
F
C. Abreu et al. Journal of Network and Computer Applications xxx (2017) xxx-xxx
Fig. 9. The BWSN used to monitor three patients sharing the same nursing room. In such network logical topology, all the patients (i.e., the , the and the ) sent their datapackets to the sink through the backbone. The network topology is pictured according the sink's routing table.
admission control method to assess the BWSN and decide about the ad-mission of a new patient are summarised in Table 2.
Initially the network was being used to carry the data generated bytwo patients (i.e., the and the ). In such case, the network can beconsidered highly efficient and providing high standards of QoS. Suchfact can be confirmed by analysing the PRR of the data flows gener-ated by both sensor nodes, during the time periods:and . To be precise, during these two timeintervals, the of the data flow generated by the is of about
and , respectively. On its turn, the related to thedata flow generated by the , during the same time intervals, isof about and , respectively. Then, when using the QoSProbe to assess the possibility of adding a new patient to the net-work, sharing the same nursing room, which comprises the interval
, the PRR of the data flows generated byboth the and the drops considerably. Indeed, the of thedata flow generated by the drops about from toand the of the data flow generated by the drops from about
to , corresponding to a degradation of about . On itsturn, the achieved by the QoS Probe is around , which is com-parable with the values achieved by the other sensor nodes. Such degra-dation in the PRR of both data flows can be justified by the additionaltraffic generated by the QoS Probe. In fact, such additional traffic makesthe competition for the transmission medium more difficult, increasingthe probability of collisions as well as the interferences experienced byeach sensor node, not only due to the presence of the QoS Probe withinthe network but also due to the additional retransmissions performed bythe .
Finally, after the admission of the (i.e., the new patient), thatcorresponds to the time interval , the ofthe data flows generated both by the and by the falls about
, from to , and , from to , respectively.On its turn, the of the data flow generated by the is of about
, which is comparable with the PRR achieved by the other sensornodes. In that case, the degradation on the PRR can also be explainedusing the arguments presented earlier. However, since the data genera-tion processes are not time synchronised, the impact of adding the sen-sor nodes (i.e., the QoS Probe and the ) in different moments affectsthe performance of the network in diverse ways.
To that end, it is necessary to compare the PRR achieved duringthose time intervals. So, to study the similarity between the PRRs ofeach data flow during the assessment period and after adding the newsensor node to the network, the percentage difference was used:
(4)
where the and represent the PRRs being studied.Considering the percentage difference between the of each sen-
sor node regarding the time periods, and, as shown in Table 2, it is possible to verify
that, considering this experiment, the impact of adding a “virtual sen-sor node” to the network is comparable (i.e., with a maximum aver-age difference of about 6.4%) to the impact of adding a real sensornode to the network. Moreover, considering the percentage differencebetween the of each sensor node after the admission of the new
Table 2Results obtained when assessing the BWSN considering the network topology presented in Fig. 9.
Network Running Time (t) Packet Reception Ratio
QoS Probe New SN ( )
n.a. n.a.n.a.
n.a. n.a.n.a.
10

UNCO
RREC
TED
PROO
F
C. Abreu et al. Journal of Network and Computer Applications xxx (2017) xxx-xxx
patient and the achieved by the QoS Probe, it is possible to con-clude that the of each sensor node after adding the new sensornode to the network is equivalent (i.e., with a maximum average dif-ference of about 3.5%) to the one achieved by the QoS Probe. Consid-ering these results, the proposed smart context-aware QoS-based admis-sion control method was able to predict the impact of adding the newpatient to the network.
The results obtained allow us to conclude that the response to thequestion formulated in the beginning of this experiment (i.e., the ques-tion Q. 1) is affirmative. Moreover, in the context of the present sce-nario, the hypothesis H. 1 was confirmed to be true.
3.2.2. Network deployment area covering two nursing roomsRegarding the second scenario, i.e., monitoring a maximum of five
patients spatially distributed into two non-adjacent nursing rooms (i.e.,the rooms 3 and 4 from Fig. 10), it was designed to verify if the pro-posed admission control method can be used to answer the followingquestion:
QuestionIs it possible to use the concept of “virtual sensor node” to estimate
the QoS impact when adding a new patient to a BWSN, if the new pa-tient does not share the same physical space with all the others patientswithin the network? Q. 2.
Among all the experiments performed using this scenario, the fol-lowing was chosen to be discussed in order to find the response to thequestion Q. 2.
Regarding this experiment, the sends its data to the sink throughthe while the remaining sensor nodes, including the QoS Probe andthe new sensor node (i.e., the ), use the to forward their datapackets to the sink (see Fig. 10 for more details). In this case, the datagenerated by the QoS Probe and by the new sensor node follow the samepath to reach the sink. Unlike the former experiment, in this case it islikely that the QoS Probe and the new sensor node achieve comparableperformance in terms of PRR. The results obtained when assessing thecurrent scenario, using the network topology pictured in Fig. 10 and ex-plained in detail in Table 3.
Considering the results presented in Table 3, it is possible to verifythat during both the assessment period using the QoS Probe and the pe-riod next to the introduction of the new sensor node, the network's per-formance suffers a significant degradation. Moreover, it is important tonotice that the performance degradation experienced by all the sensornodes inside the room 4 is comparable, including the QoS Probe and thenew sensor node (i.e., the ). This outcome was expected since thedata generated both by the QoS Probe and by the use the same pathto reach the sink. By using the same data path, it is expected that bothhave the comparable impact on the performance of the sensor nodes ontheir neighbouring (i.e., inside the room 4).
Fig. 10. BWSN used to monitor five patients distributed by two non-adjacent rooms (i.e., the rooms 3 and 4). The network topology is pictured according the sink's routing table.
Table 3Results obtained when assessing the BWSN, considering the network topology presented in Fig. 10.
11

UNCO
RREC
TED
PROO
F
C. Abreu et al. Journal of Network and Computer Applications xxx (2017) xxx-xxx
Comparing the of all the sensor nodes within the network dur-ing the network assessment period (i.e., )and the period after the admission of the new sensor node to the net-work (i.e., ) using the percentage difference asdefined in Eq. (4), it is possible to conclude that both the QoS Probeand the new sensor node affect the sensor nodes within the network dis-tinctly. In fact, looking to the results of Table 3 it is clear that the perfor-mance of the sensor nodes inside the room 3 (i.e., the and the) are distinctly affected by the QoS Probe and by the new sensor node.Nevertheless, the sensor nodes inside the room 4 (i.e., the and the
) have seen their performance affected in a comparable way by theQoS Probe and by the new sensor node. Moreover, when comparing the
achieved by each sensor node within the network, including thenew one, with the achieved by the QoS Probe during its operation,it is possible to verify that the of all the sensor nodes after the ad-mission of the new sensor node is comparable with the one achieved bythe QoS Probe. In view of these results it is possible to argue that theproposed method was able to predict the impact of adding the new nodeto the network.
Regarding the results obtained during the aforementioned experi-ment, it is possible to claim that the proposed QoS-based admission con-trol method was able to predict the impact of adding the new patient tothe network. So, the response to the question Q. 2 is affirmative and thehypothesis H. 1 is considered to be true.
Considering the results found from the previous experiments, underthe previously stated assumptions and constraints, it is possible to ar-gue that, the proposed QoS-based admission control method can be usedto predict the impact of adding a new sensor node to a BWSN. More-over, applying this method to different locations, manually or using anautonomous process and a proper graphical user interface (e.g., a dash-board showing the QoS at each location), it is possible to decide whichis the best location to place the new sensor node minimising its impactin the QoS being provided by the network.
4. Conclusions
Wireless sensor networks combined with low-power sensor devices,have the potential to integrate the physical world with widely used com-puting systems. Furthermore, such networks can be used to create ubiq-uitous and pervasive intelligent systems with the potential to greatly im-pact our daily lives. Among all the application areas of the wireless sen-sor network, the healthcare is one of the most promising. In particular,concerning its potential to change not only the today's healthcare ser-vices provided to the citizens but also the clinical practice. The use ofWSNs in healthcare brings several advantages, in particular as regardsto the automation of routine processes such as periodic patient monitor-ing. Automatic patient monitoring systems can be used to complementthe episodic measurements made by the healthcare professionals (e.g.,body temperature, pulse and respiratory rates, blood pressure or oxime-try), bringing out an enhancement of the quality of care, while freeingthe nursing staff to provide extra attention to the patients.
Nevertheless, due to the demanding requirements of healthcare ser-vices and applications, WSNs have to fulfil high levels of quality of ser-vice (QoS) to be fully accepted by the healthcare professionals and pa-tients. As an effort to provide healthcare professionals with a tool tomanage such networks, bearing in mind the objective of maximising theQoS provided by WNSs supporting patient monitoring applications, thiswork proposes a new smart context-aware QoS-based network manage-ment method able to manage the admission of new nodes to the net-work.
The proposed admission control method makes use of a “virtual sen-sor node” to verify if a new patient (i.e., a new sensor node) can be
added to the network and decides which would be the best place to ad-mit the new patient into the network. The use of a “virtual sensor node”avoids the necessity of the new patient to be physically present withinthe network and enables to assess the on-the-fly QoS provided by thenetwork from a remote location. By using a “virtual sensor node”, theproposed admission control method enables the network administrator(n.b., the figure of the network administrator must be seen in a broadsense since it could be either a person or a virtual process) to estimatethe presence of a real sensor node within the network from a remotelocation. This characteristic gives the proposed method an innovativefeel, when comparing it with other proposals. Moreover, the possibilityto know in advance the best location to place a patient gives the health-care providers an important tool to optimise their work and organiza-tional processes.
Considering the results obtained from several experiments inreal-world environments, it is possible to outcome that the proposed ad-mission control method, based on the use of a “virtual sensor node” topredict the behaviour of the network when introducing the new sensornode, was successfully validated and the conditions necessary to its usewere clearly presented.
Acknowledgment
Work supported by the Portuguese Foundation for Science andTechnology, FCT, PhD Grant SFRH/BD/61278/2009. Miranda was sup-ported by Portuguese funds through the CIDMA - Center for Researchand Development in Mathematics and Applications, and the PortugueseFoundation for Science and Technology.
References
Abreu, C., Ricardo, M., Mendes, P.M., 2014. Energy-aware routing for biomedical wirelesssensor networks. J. Netw. Comput. Appl., 40 (0), , 270–278.
Abreu, C., Miranda, F., Ricardo, M., Mendes, P.M., 2014. QoS-based management of bio-medical wireless sensor networks for patient monitoring. SpringerPlus, 3 (1), , 239.
Abreu, Carlos, Mendes, P.M., Miranda, F. (Eds.), 2014. Ch. Providing QoS in Wireless Sen-sor Networks: A System Overview. Nova Science Publishers, Inc, pp. 171–196.
Iffat Anjum, Nazia Alam, Md. Abdur Razzaque, Mohammad Mehedi Hassan, Atif Alamri,Traffic priority and load adaptive MAC protocol for QoS provisioning in body sensor net-works, Int. J. Distrib. Sens. Netw. 2013 (2013) 9.Carmen Domingo Mari 2012. An overview of the Internet of Things for people with dis-
abilities J. Netw. Comput. Appl. 35 (2), 584–596 (Simulation and Testbeds)CC1000, 2005. Single Chip Very Low Power RF Transceiver, Fbr.
CC2420, 2.4 GHz IEEE 802.15.4/ZigBee RF Transceiver, Oct. 2011.Chen Jaime Díaz Manuel Llopis Luis Rubio Bartolomé Troya José M. 2011. A survey
on quality of service support in wireless sensor and actor networks: requirementsand challenges in the context of critical infrastructure protection J. Netw. Comput.Appl. 34 (4), 1225–1239 (Advanced Topics in Cloud Computing)
Chen, Min, Gonzalez, Sergio, Vasilakos, Athanasios, Cao, Huasong, Leung, Victor C., 2011.Body area networks: a survey. Mob. Netw. Appl. 16 (2), 171–193.
Dunkels, A., Gronvall, B., Voigt, T., 2004. "Contiki - a lightweight and flexible operatingsystem for tiny networked sensors," in Local Computer Networks, 2004. 29th AnnualIEEE International Conference on, Nov, pp. 455–462.
Farooq Muhammad Omer Kunz Thomas 2014. BandEst: measurement-based availablebandwidth estimation and flow admission control algorithm for ad hoc IEEE 802.15.4-based wireless multimedia networks Int. J. Distrib. Sens. Netw. 2014 15
Gama O.S. 2011. A MAC Protocol for Quality of Service Provisioning in Adaptive Biomed-ical Wireless Sensor Networks (Ph.D. dissertation) University of Minho
Hadjidj Abdelkrim Souil Marion Bouabdallah Abdelmadjid Challal Yacine Owen Henry2013. Wireless sensor networks for rehabilitation applications: challenges and oppor-tunities J. Netw. Comput. Appl. 36 (1), 1–15
Ibrahim Orhan Lindh Thomas 2011. Measurement-based performance and admission con-trol in wireless sensor networks Int. J. Adv. Syst. Meas. 4 (1–2), 32–45
Ignacio Más Karlsson Gunnar 2007. Probe-based admission control for a differentiated-ser-vices internet Comput. Netw. 51 (13), 3902–3918
Ignacio Más Karlsson Gunnar 2008. A Model for Endpoint Admission Control Based onPacket Loss In: In: Das Amitabha et al. (Eds.), NETWORKING 2008 Ad Hoc and SensorNetworks, Wireless Networks, Next Generation Internet 4982 Springer Berlin Heidel-berg pp 506–517 http://dx.doi.org/10.1007/978-3-540-79549-0_44
Jacob Anil K. Jacob Lillykutty 2015. Energy efficient MAC For QoS traffic in wireless bodyarea network Int. J. Distrib. Sens. Netw. 2015 12
12

UNCO
RREC
TED
PROO
F
C. Abreu et al. Journal of Network and Computer Applications xxx (2017) xxx-xxx
Khan Zahoor Ali Sivakumar Shyamala Phillips William Robertson Bill 2014. ZEQoS: anew energy and QoS-aware routing protocol for communication of sensor devices inhealthcare system Int. J. Distrib. Sens. Netw. 2014 18
Ko, J., Gao, T., Terzis, A., 2009. Empirical Study of a Medical Sensor Application in anUrban Emergency Department, in Proceedings of the Fourth International Conferenceon Body Area Networks, ICST, Brussels, Belgium, Belgium, pp. 10:1--10:8.
Ko JeongGil et al., 2010. Wireless sensor networks for healthcare Proc. IEEE 98 (11)1947–1960
Ko JeongGil 2012. Designing A Low-power Mobile Sensing System For Wireless Health-care Applications (Ph.D. dissertation) Johns Hopkins University Baltimore, Maryland
Ko JeongGil Gao Tia Rothman R. Terzis A. 2010. Wireless sensing systems in clinical envi-ronments: improving the efficiency of the patient monitoring process Eng. Med. Biol.Mag. IEEE 29 (2) 103–109
Lai Chien-Chih Lee Ren-Guey Hsiao Chun-Chieh Liu Hsin-Sheng Chen Chun-Chang 2009.A H-QoS-demand personalized home physiological monitoring system over a wirelessmulti-hop relay network for mobile home healthcare applications J. Netw. Comput.Appl. 32 (6), 1229–1241
Lindh, T., Orhan, I., 2009. Performance monitoring and control in contention-based wire-less sensor networks, in Wireless Communication Systems, 2009. ISWCS 2009. 6th In-ternational Symposium on, sept, pp. 507–511.
Mir Mehedi Ahsan Pritom et al., 2015. A multiconstrained QoS aware MAC protocol forcluster-based cognitive radio sensor networks Int. J. Distrib. Sens. Netw. 13
Nouha Baccour, et al., 2012. Radio link quality estimation in wireless sensor networks: asurvey. ACM Trans. Sen. Netw. 8 (4).
Paola, Alessandra De, Re, Giuseppe Lo, Milazzo Fabrizio Ortolani Marco 2013. QoS-awarefault detection in wireless sensor networks. Int. J. Distrib. Sens. Netw., 2013, 12.
Pereira, V., Silva, J.S., Monteiro, E., 2012. A framework for Wireless Sensor Networks per-formance monitoring, in World of Wireless, Mobile and Multimedia Networks (WoW-MoM), 2012 IEEE International Symposium on a, Jun, pp. 1–7.
Polastre, J., Szewczyk, R., Culler, D., 2005. Telos: enabling ultra-low power wireless re-search. In: Proceedings of the 4th international symposium on Information processingin sensor networks, Piscataway, NJ, USA.
Rappapport, T.S., 2002. Wireless Communications: Principles and Practice, 2nd ed Pren-tice Hall.
Sun, T., Chen, L., Yang, G., Sanadidi, M.Y., Gerla, M., 2005. SenProbe: Path Capacity Es-timation in Wireless Sensor Networks, In: Proceedings of the 3rd International Work-shop on Measurement, Modelling, and Performance Analysis of Wireless Sensor Net-works.
Yang Yaling Kravets R. 2005. Contention-aware admission control for ad hoc networksMob. Comput. IEEE Trans. 4 (4), 363–377
Zamalloa M.Z. Krishnamachari Bhaskar 2007. An analysis of unreliability and asymmetryin low-power wireless links ACM Trans. Sen. Netw. 3 (2)
Zuniga, M., Krishnamachari, B., 2004. Analyzing the transitional region in low powerwireless links, in Sensor and Ad Hoc Communications and Networks, 2004. IEEESECON 2004. 2004 First Annual IEEE Communications Society Conference on, Oct,pp. 517–526.
13