smart grid report eversion
TRANSCRIPT
Smart Grid 2013 Global Impact Report
Research provided by:

2013 Global Impact Report | 3
Smart Grid Global Impact Report 2013

4 | 2013 Global Impact Report
Written by Dr Philip Lewis, CEO VaasaETT Research provided by VaasaETT
Designed in San Francisco, CA
Copyright © 2013 Ventyx, an ABB Company All rights reserved.
Your complimentary copy of the 2013 Smart Grid Global Impact Report provided courtesy of Ventyx.


6 | 2013 Global Impact Report
Utilities are under significant pressure to deliver more power – more reliably, efficiently and sustainably.
To meet the world’s future energy needs, utilities are under significant pressure to deliver more power, more reliably, efficiently and sustainably, while at the same time reducing and managing demand. Innovation in technologies like renewable and distributed generation, ultra-high voltage transmission and energy storage is starting to dramatically alter the way the grid operates –transforming consumers into generators and active demand participants.
This requires a major shift in customers’ understanding of energy supply and distribution and how to take control of their service and costs. For utilities, it requires complex forecasting, planning and control to manage existing networks and new technology. Equally important is the efficient integration of operational and information technology on a scale that has been difficult to achieve – until recently.
To support an empowered energy world, utilities are beginning to look seriously towards the role that smart technologies will play in transforming the grid. Grid operators have years of experience efficiently and effectively managing power grids. However, the most positive returns are gained when this expertise is combined with greater visibility across the source to socket spectrum.
The most successful smart grids of tomorrow will operate with unprecedented agility – adopting highly collaborative, responsive and efficient business models that unlock human potential while preserving the environment.
While the challenges are substantial, the foundations for a smarter grid are already here.
The smarter grid is here.
2013 Global Impact Report | 7


2013 Global Impact Report | 9
Benchmarking leading smart grid projects Experts have discussed theoretical smart grid maturity models for over a decade. But until now utilities and other stakeholders had no way to benchmark their results globally. Ventyx and ABB selected international energy think-tank VaasaETT to develop the Smart Grid Global Impact Report, the first-ever global research into smart grid projects and their outcomes. The report focuses on a common set of smart grid goals –or five pillars–which deliver returns against some of the industry’s biggest challenges.
These pillars are:
The Smart Grid Global Impact Report analysed 200 smart grid projects around the world and uncovers key findings. The report also includes criteria-based evaluation and in depth analysis of the 30 leading projects. The reports presents return-on-investment results, characteristics of successful smart grids and a ranking of selected projects. In addition, you will see best-practice case studies to help you learn from the world’s most innovative utilities.
We hope you find this research insightful and invite utilities to participate next year.
About the Report
Rick Nicholson VP, Transmission and Distribution Solutions, Ventyx
Gary Rackliffe VP, Smart Grids North America, ABB
Economic
Environmental Customer
Reliability Innovation

10 | 2013 Global Impact Report
We are excited to present the 2013 Smart Grid Global Impact Report – the first global view into the impact of smart grid. This report aims to help utilities benchmark their existing and planned smart grid projects and learn from the best practices used by leading utilities around the world. We look forward to providing a growing body of analysis as more utilities participate and share their exciting smart grid projects in each successive edition of the Smart Grid Global Impact Report.
2013 Smart Grid Global ImpactThe highest-ranked project: OG&E’s Positive Energy Smart Grid Project, USA. Oklahoma Gas & Electric (OG&E) is delivering well against all pillars of achievement for a brighter energy future. OG&E is enhancing the customer experience, actively reducing demand, reducing system losses and increasing security while at the same time reducing costs – all made possible by a clear overall vision of the role of smarter grid. Their innovative and comprehensive approach to intelligently monitoring their network put OG&E at the top of the projects analysed in the 2013 Smart Grid Global Impact Report.
The top six projects in 2013 span across four continents, making smart grid success a truly global phenomenon. These are:
• OG&E Positive Energy Smart Grid Project (US)
• Townsville Queensland Solar City (Australia)
• Smart Grid, Smart City (Australia)
• Leading utility (US)
• Yokohama Smart City Project (Japan)
• Búzios Smart City Project (Brazil)
The Five Pillars of ImpactThe report focuses on five pillars or goals based around delivering returns against some of the biggest challenges faced by smart grids.
InnovationInnovation is the most successful pillar across all regions. Today, innovation is focused on smart grid analytics – collecting data, integrating systems and data analysis to achieve visibility across the grid. When data sources are in place and key systems are integrated, we see more innovation in predictive forecasting and planning for optimization across the grid.
Customer Financial and energy savings represent the greatest overall customer impact – some projects have delivered savings per customer ranging from $306 to $504 per year. What’s more, the best projects also delivered significant non-financial benefits. The project costs for these top projects range from $88 and $433 per customer, although some projects cost much more.
The most successful smart grid projects are also the projects that deliver the greatest customer impact. Some utilities have become more cautious around customer engagement due to customer reactions and negative media coverage of smart metering deployments.
Because of this, successful utilities can achieve results with grid-side technology deployment without requiring active customer engagement. Perhaps most successful acceptance of smart metering will come when there are other major customer benefits or drivers that will change customer behavior. For example, faster responsiveness to outages, the purchase of an electric vehicle, or having more ’smart’ home appliances.
If utilities can build trust through grid-side improvements with minimal negative impact on customers, this will smooth the deployment of these technologies when they are sufficient-ly evolved and start to achieve broader mass-market uptake.
Executive Summary 2013

Executive Summary | 11
ReliabilityMore than 70% of smart grids surveyed achieved improvements in network reliability. These improvements are seen mainly in transmission losses, voltage quality and system interruptions.
The vast majority of these utilities indicate that they expect voltage quality, transmission losses and system interruptions to achieve up to 9% improvement. This is a significant achievement, given that this level of improvement typically occurs in grids that are already highly reliable.
In grids where the room for improvement is greater, some utilities report efficiency improvements that nearly reach 50%.
Environmental Most projects achieved diverse environmental benefits including renewable energy integration and emissions reductions. Renewable energy integration and emissions reductions are some of the most significant environmental benefits of smart grid projects and these benefits transcend the regions: the four best projects were located in four separate continents.
Analysis of the top 30 projects indicates strong environmental impact from changes in customer behavior, or at least changes in their consumption.
EconomicFor the 30 projects analysed, the total average spent on smart grid projects was $390 per customer. For projects without smart metering, the investment per customer was less than $200. For projects that included smart metering installations, the costs were approximately $400 per customer.
For many projects, return-on-investment (ROI) has not been the key priority during the feasibility or pilot phases of smart grid rollouts. However, many utilities now realize or estimate significant ROI and this trend is continuing to show positive growth.
James Braatvedt
Vice President, Solutions Marketing, Ventyx Smart Grid Global Impact Report founder
Philip LewisCEO, VaasaETT
Smart Grid Global Impact Report founder and author

12 | 2013 Global Impact Report

2013 Contributors
Thank you to all the report contributors for 2013, we welcome more utilities and industry experts to contribute in future editions of the report.
Steve AtkinsABB Smart Grids Industry Sector Initiative
Steve BaynesAnalyst, VaasaETT James BraatvedtVP Solutions Marketing, Ventyx
Karen BlackmoreConsultant and former IDC Energy Insights Analyst
Anna BogackaAnalyst, VaasaETT
Clinton DavisVP Distribution Solutions, Ventyx
Jochen KreuselHead of ABB’s Smart Grids Industry Sector Initiative
Rick NicholsonVP Transmission and Distribution Solutions, Ventyx
Gary RackliffeVP Smart Grid, ABB
Steve XuAnalyst, VaasaETT
Executive Summary | 13


2013 Global Impact Report | 15
Contents
ContentsResearch Methodology 14
Innovation 20
Customer Impact 26
Reliability Impact 34
Environmental Impact 38
Economic Impact 44
Overall Ratings 50

16 | 2013 Global Impact Report
Research Methodology
Research Methodology | 17
“ The Smart Grid Global Impact Report will map all major smart grid
projects on a global basis. The first annual report is focused on 200
leading smart grid projects, with deeper investigation of 30 of the
world’s leading projects serving 24 million customers in 16 countries
on five continents. Through interviews, questionnaires and primary and
secondary research, the Smart Grid Global Impact Report evaluates
smart grid projects against the five key pillars that, taken together,
represent the industry’s greatest challenges and highest goals. The
sponsors and researchers welcome nomination of smart grid projects
for study and inclusion in the 2014 Smart Grid Global Impact Report.”
-PhiliP lewis, CeO VaasaeTT and smarT Grid GlObal imPaCT rePOrT fOunder
18 | 2013 Global Impact Report
The Smart Grid Global Impact Report aims to map out all major smart grid projects, both recent and current, around the world. So far we have mapped 200 significant projects and continue to increase our coverage.
For the 2013 edition of Smart Grid Global Impact Report, we focused on 30 of the world’s leading smart grid projects based around the five smart grid pillars. In future editions of Smart Grid Global Impact Report, we welcome nominations from projects around the world to be included in the 2014 ranking.
Cumulatively, the 30 shortlisted projects represent 24 million customers in 16 countries and five continents. While 11 of the projects are in Europe, only 1% of the customers covered by the projects are in this region. Most are in North America and Asia, reflecting the overwhelm-ingly larger scale of projects in those regions.
The projects range from less than 50 customers to 10 million. Of the 30 projects, seven have less than 1,000 customers, while five have more than one million customers. This spread of customers reflects the general geographical dispersion of customers involved in smart grid projects around the world.
Approach to ResearchThe Smart Grid Global Impact Report applies a simple approach to evaluating the total impact of smart grid projects.
The report focuses on five pillars – a common set of goals which deliver returns against some of the industry’s biggest challenges.
These pillars are:
• Innovation
• Customer
• Reliability
• Environmental
• Economic
Through interviews, questionnaires and additional research, we investigated smart grid projects in terms of both their outcome and how they achieved it. The Smart Grid Global Impact Report does not assume what needs to go into delivering a successful smart grid project. There is more than one way to achieve success, but common rules of success present valuable guidelines to those wishing to learn from others.
Due to the sensitivity of some data collected from projects, interviews and questionnaire responses are kept anonymous unless project owners specify otherwise. Most data is therefore presented in the form of relative or absolute ratings and rankings, keeping exact numbers hidden while revealing the significance of the data. For the same data privacy consider-ations, only some of the projects ranked are named at the request of the project owners.
For each of the pillars and the overall rankings, smart grid components have been weighted in accordance with their importance as stated by the industry, customers, authorities and the interests of the general public.
Estimated data from projects is weighted in favor of firm results delivered. A partial rating is also applied where projects which are still in implementation can state these objectives in quantifiable terms and have a clear approach to achieving these.
The Smart Grid Global Impact Report is constantly evolving its methodology to more accurately represent the picture of smart grid return on investment as the needs of the global energy market increase.
What is a smart grid?Utilities need to transform their operations to deliver more power, more reliably, more sustainably – balancing long-term investments into huge and often aging infrastructure, with the need to flexibly accommodate new demands from stakeholders - all while optimiz-ing limited budgets and keeping power
Research Methodology

Research Methodology | 19
delivery cost-effective. This in turn requires complex forecasting, planning and control to manage the existing network and new capital projects. Utility technology needs to go through a step-change and smart grids are the foundations that will support the empowered energy world of tomorrow.
A definition of smart grid The modernization of electricity networks through the application of innovative and intelligent products, services and technologies, in order to provide greater monitoring, automa-tion, control, co-ordination and inclusion of the transmission, distribution, generation (includ-ing distributed generation) and the demand side, for the purpose of increased energy and cost efficiency, sustainability, energy security as well as the benefit and empowerment of customers and society.
The Scope of Smart GridA clear driver of the shape and trend of the smart grid and its achievements can be found in the components that smart grid projects
incorporate, and the importance which projects place on those components.
Smart Grid Components: A smart grid is comprised of an increasingly extensive array of functionalities, capabilities and achievements. Some of the key compo-nents contained within those projects studied for the Smart Grid Global Impact Report included control, automation, protection, sensing, monitoring, demand response management and energy efficiency, and supporting infrastructure:
Control, Automation, and Protection • FLISR (Fault Location, Isolation and Service
Restoration)
• DLR (Dynamic Line Rating) allowing the increase of available transfer capability of transmission circuits
• Advanced Relays
• Advanced Voltage Management (e.g. VVO (Volt/Var optimization): Implementation of FLISR
• VVO enables users to improve the efficiency and reliability of distribution systems, reducing demand and environmental impact
• Power Factor Correction
• Fuse Savers
• Advanced SCADA
• Dynamic Rating
• Load Transfer and Line Loading Analyses
Demand Response Management and Energy Efficiency
• Dynamic, Critical Peak Rebate and advanced Time of Use pricing
• HEMS (Home Energy Management Systems) / Smart Home / Home Automation
• Consumption Feedback (e.g. In Home Displays)
• Advanced Frequency Control of Residential and Commercial Appliances
Up to 1,000
From 1,000 to 100,000
From 100,000 to 1,000,000
Over 1,000,000
Projects by Number of Customers
5Projects 7
Projects
6Projects
12 Projects
69%
30%
1%
North America
Asia
Europe
Oceania
Latin and South America
24 Million Customers
Project Customers by Region

20 | 2013 Global Impact Report
Additional Supporting Infrastructure • Wireless and other Advanced
Communications
• Electric Vehicles and Electric Vehicle Charging
• Distributed Generation
• RAPS (Remote Area Power Supplies)
• Advanced Field Crew Management
• Energy Storage
• Cyber Security and Data Protection
Sensing and Monitoring • Advanced network status monitoring: what
is connected to it: its capacity and the load that is being placed on it; its balance and stability; weaknesses and failures (including outages)
• Smart Meters Many projects defined as ‘smart grid’ are actually focused on smart meters. True smart grid projects are deploying a much broader mix of components and in the leading 30 smart grid projects analysed, grid-side technology that insulates the customer from significant impact - such as network intelligence and control - tends to dominate.
Seven components are identified as leading components: these include sensing, monitoring automation and control, as well as energy efficiency, demand response, and smart meters. These can be broadly categorized into two major objectives:
• Better real-time visibility into the grid and its assets, with a view to being more responsive, and automating this response
• Working towards a more energy efficient future where we can better respond to supply and demand, and conserve energy
“The analysis suggests that, beyond the initial focus on smart metering, most current smart grid projects are focused on grid sensing, monitoring, control and automation technologies, which will create large volumes and varieties of real-time and near real-time data. Utilities must plan now for how they will turn this data into actionable insights which address business challenges such as asset reliability, outage response and the integration of distributed and renewable energy resources.” -Rick Nicholson
0
5
10
15
20
25
30
Important
Very Important
Importance of Smart Grid Components
FIELD
CREW
MGM
T.
WORK O
RDER
NON-
TECHNIC
AL LOSS
ES
CYBER S
ECURIT
Y
STORAGE
ELECTR
IC V
EHIC
LES (
EV)
NETW
ORK P
ROTE
CTION
OUTA
GE MANAGEM
ENT /
SYST
EM R
ESTO
RE
SMART H
OME /
HOME A
UTOMATI
ON
REDUCE O
PERATI
ONAL C
OST
IN HO
ME D
ISPL
AYS
PEAK C
LIPP
ING
SOLA
R PANEL
ENERGY E
FFIC
IENCY
NETW
ORK C
ONTR
OL
AUTOMATI
ON
DEMAND
RESPO
NSE
SMART M
ETER
S / A
MI /
AMR
SENSING
MONIT
ORIN
G
Smart Grid Components

Research Methodology | 21
North America
24%
62%
7% 7%
Asia
27%
52%
11%
10%
Oceania
35%
50%
12%
3%
Customer-Demand Grid Supply Other
Europe
10%
10%
53%
27%
Importance of Smart Grid Components By Region
Six components in particular seem to bear less importance in the minds of project managers These include work order and field crew management, non-technical losses, storage, electric vehicles and cyber security.
• It is suggested by some respondents that cyber security in particular is an expectation of all components and not always a separate appliance
• It is expected that many utilities place a lower importance on work order and field crew management with their current enterprise systems in place – it is possible another wave of investment will arise due to the closer linking of software with the real-time sensing and monitoring technology now becoming available via advanced asset health solutions
• Electric vehicles are expected to have an impact on the grid, but are still in limited deployment worldwide
• Non-technical losses may be ranked lower in more mature smart grid markets but in growing economies, reduced energy theft for instance can be one advantage of investing in a smarter grid
Most projects analysed indicate almost all of the components that they contain are ranked as important. There is a realization that smart
grid is a web of inter-dependencies. This is represented by the broad mix of components being deployed by the 30 projects analysed.
Global trends:Smart Grid projects are surprisingly similar across regions. Grid side technology compo-nents are the key focus -regardless of the region, but the importance of customer and demand components is also very powerful, especially so in Oceania, where customer and energy cost-reduction issues are key drivers of smart grid efforts.
“We see differences around the globe with North America investing more in distribution grid management solutions, Europe investing more in the grid to enable interconnection of renewables, and Asia investing in transmission capacity and distribution grid modernization. In Oceania, we see investments increased on the demand side with a reduction in the supply side versus the other regions.” -Gary Rackliffe

22 | 2013 Global Impact Report
Innovation
“ Tomorrow’s power systems are expected to cover an increasing
demand for electricity in an affordable, sustainable and reliable way.
New elements like highly distributed generation or a much closer
interaction between consumers and generators will contribute, but
require innovative solutions across traditional industry borders.”
- JOChen Kreusel, head Of abb’s smarT Grids indusTry seCTOr iniTiaTiVe
Innovation | 23

24 | 2013 Global Impact Report
Most Innovative ProjectsInnovation is a core component of the smarter grid as both hardware and software technology advances rapidly and utilities look at different approaches to deploying technology to solve their specific grid challenges.
The best projects tend to deploy innovative solutions across a broad mix of components, perhaps due to one of the core challenges with the grids of yesterday; the disconnect between different components of the grid, a lack of visibility across core functional silos, and a lack of timely information about actual conditions of asset and energy flow in the grid.
• Sensing, monitoring and control: Possibly due to the stage of deployment of many smart grid projects, or the fast-paced development of these technologies, sensing, monitoring and control is still categorized as the most innovative. Gathering of real-time information is a core requirement for the future grid, which will incorporate both real-time sensor data as well as big data across other systems and from the market to provide better information for decision making.
• Integration is also another top-ranked category as utilities try to address silos of information which still exist across many functional business units and technologies. Many utilities still have a broad mix of technology and software across to manage
their everyday operations. Most utilities are still trying to address this themselves, but more recently, companies like Ventyx and ABB are integrating hardware and software across the lifecycle to address this challenge.
• Business analytics is another top area of innovation – this data analysis is the first step toward more predictive forecasting and planning once the data sources are in place and key systems are integrated. These foundations will no doubt extend to innovation in asset management as utilities move from implementation to operation of the smarter grid.
Innovation
0
4
8
12
Innovation Areas
Number of Projects
Innovative Very Innovative
Mobility Planning Analysing Forecasting Asset Management
Integration Sensing/Monitoring/
Control
Level of Innovation by Area
Innovation Case 1: Forecasting for intermittent renewable generation integration As part of the Pacific Northwest Smart Grid Demonstration Project, one the largest in the U.S., 3TIER provides wind energy production forecasts for an hour, day and week ahead for the majority of the wind assets in the Pacific Northwest. Together with load and conventional generation forecasts from other project participants, 3TIER’s wind energy information helps generate the transactive control signal, a new energy management system that uses economic incentives to optimally allocate resources and engage demand, leading to better integration of renewable energy.

Innovation | 25
Some projects view innovativeness as risky, preferring instead to utilize established solutions. Interestingly, these projects tend to rank lower based on the smart grid pillars.
For other projects, innovative customer engagement is seen as a valuable asset management tool as utilities rely on customers to inform them of asset-related issues until new sensing technology is online.
Global TrendsInnovativeness is far from consistent across regions. While North America typically leads in this respect, Asia scored higher for mobility and similarly to North America for integration.
Europe scored highly for sensing, monitoring and control, and relatively highly for analysing and forecasting, but poorly for asset manage-ment, mobility and planning.
Oceania performed relatively modestly throughout, though its best performance related to sensing, monitoring and control, and its worst performance concerned mobility, in which it recorded the lowest rating of any region for any innovativeness dimension.
Sensing, monitoring and control was the most consistently well performed across regions. All regions performed moderately or poorly for mobility. Latin and South America was omitted from the regional analysis due to an insufficient number of cases.
0
0.5
1
1.5
2
2.5
3
Mobility Planning Analysing Forecasting Asset Management
Integration Sensing/ Monitoring/
Control
Innovation
(Scale 0-4)
Asia Oceania Europe North America
Level of Innovation by Region

Innovation Case 2: Sensing through feeder automationElectrical power restoration after storms can take hours or days. Feeders, automated with microprocessor based relays and automated feeder switches, provide information that when integrated with a Fault Location, Isolation and Service Restoration (FLISR) application can go a long way toward improving the power restoration process. Improved monitoring of the distribution system can better identify areas experiencing a power outage, whereas feeder automation enables a rapid response capable of minimizing, or potentially avoiding, the impact of the outage thus leading to improved system reliability. Automated switches and controls, together with sensors and advanced software, allow the grid to “self-heal,” significantly reducing power restoration time and minimizing customer impacts.
CenterPoint Energy utilizes automation on feeders to reduce the impact of outages. Utilizing a Distribution Management System (DMS), system controllers analyze, information collected from microprocessor based substation relays and automated distribution feeder switches to remotely operate the distribution grid and route repair crews in response to abnormal operating conditions. An advanced metering infrastructure providing premise-level outage and restoration notification to an OMS is utilized in conjunction with outage information from SCADA and customer calls to dispatch service crews to complete repair orders.

1. Leading projects deploy innovation across many elements of their projects because they understand that modernization of one area exposes other areas for improvement. Projects which avoided innovation due to perceived risk tended to rank lower overall.
2. Today, innovation is focusing on smart grid analytics – collecting data, integrating systems and data analysis to get better visibility across the grid. These are laying a necessary foundation for a smarter grid.
3. Once the data sources are in place and key systems are integrated, there is more innovation in predictive forecasting and planning for optimization across the grid.
Top 3 Innovation Impacts
Innovation | 25
“ Innovation is a core component of the smarter grid as both hardware and software technology advances rapidly and utilities look at different approaches to deploying technology to solve their specific grid challenges.”

Customer Impact

Customer Impact | 29
“ Utilities need customers in order to make sales of energy. Building a
solid relationship with customers will enable utilities to help them wisely
use energy, learn how their consumption choices affect their bill and
the world around them, and prepare them for outages. When utilities
can help their customers engage in and fully realize these benefits, then
utilities will also realize benefits. Customers who are actively engaged
with the utility will most likely stay with the utility. Utilities need to
include the customer impact in every smart grid project.”
- Karen blaCKmOre, COnsulTanT and fOrmer idC enerGy insiGhTs analysT
30 | 2013 Global Impact Report
Customer Impact from Smart GridFrom a customer perspective, smart grids promise many benefits including:
• Savings from lower electricity distribution and retail prices, resulting from the efficiencies obtained from a smart grid by the distribution and retail companies
• Reduced duration and frequency of power outages, and more proactive communication when disaster does strike
• Ability to become more energy self-sufficient with technologies such as renewable energy and energy storage
• Benefits from a host of other convenience and comfort-related services such as home automation and electric vehicles
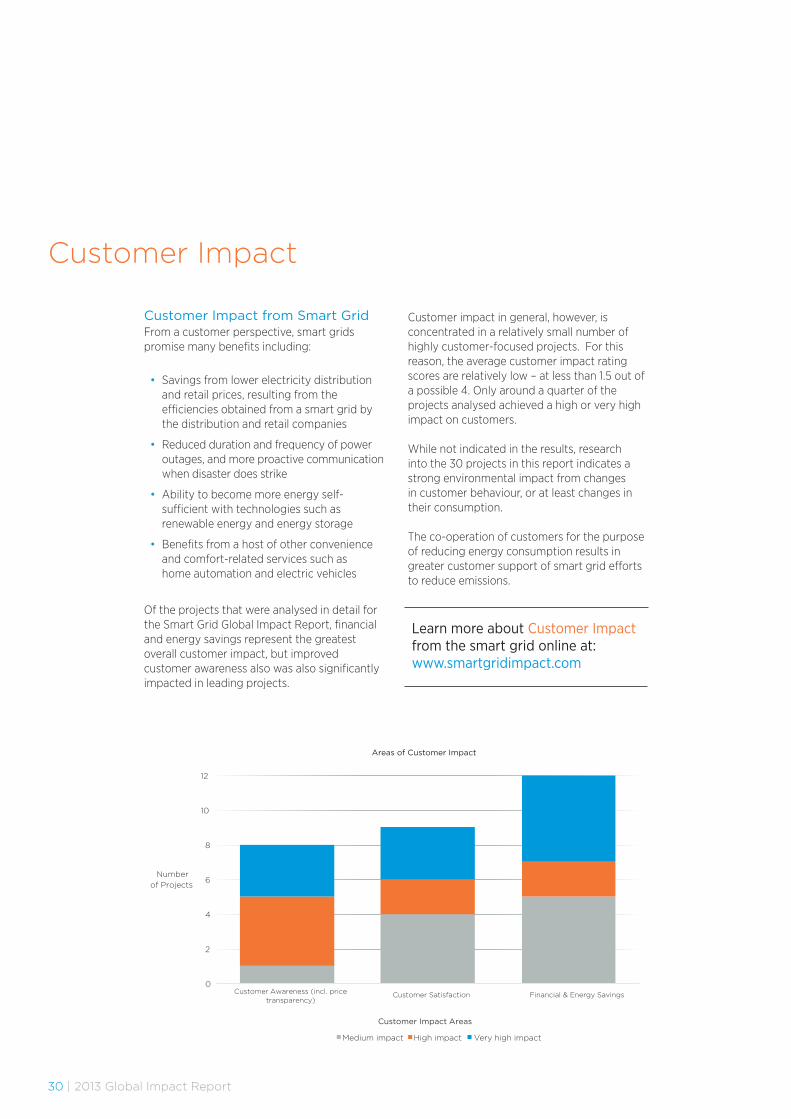
Of the projects that were analysed in detail for the Smart Grid Global Impact Report, financial and energy savings represent the greatest overall customer impact, but improved customer awareness also was also significantly impacted in leading projects.
Customer impact in general, however, is concentrated in a relatively small number of highly customer-focused projects. For this reason, the average customer impact rating scores are relatively low – at less than 1.5 out of a possible 4. Only around a quarter of the projects analysed achieved a high or very high impact on customers.
While not indicated in the results, research into the 30 projects in this report indicates a strong environmental impact from changes in customer behaviour, or at least changes in their consumption.
The co-operation of customers for the purpose of reducing energy consumption results in greater customer support of smart grid efforts to reduce emissions.
Customer Impact
0
2
4
6
8
10
12
Number
of Projects
Customer Impact Areas
Medium impact High impact Very high impact
Customer Awareness (incl. price transparency)
Customer Satisfaction Financial & Energy Savings
Areas of Customer Impact
Learn more about Customer Impact from the smart grid online at: www.smartgridimpact.com
Customer Impact | 31
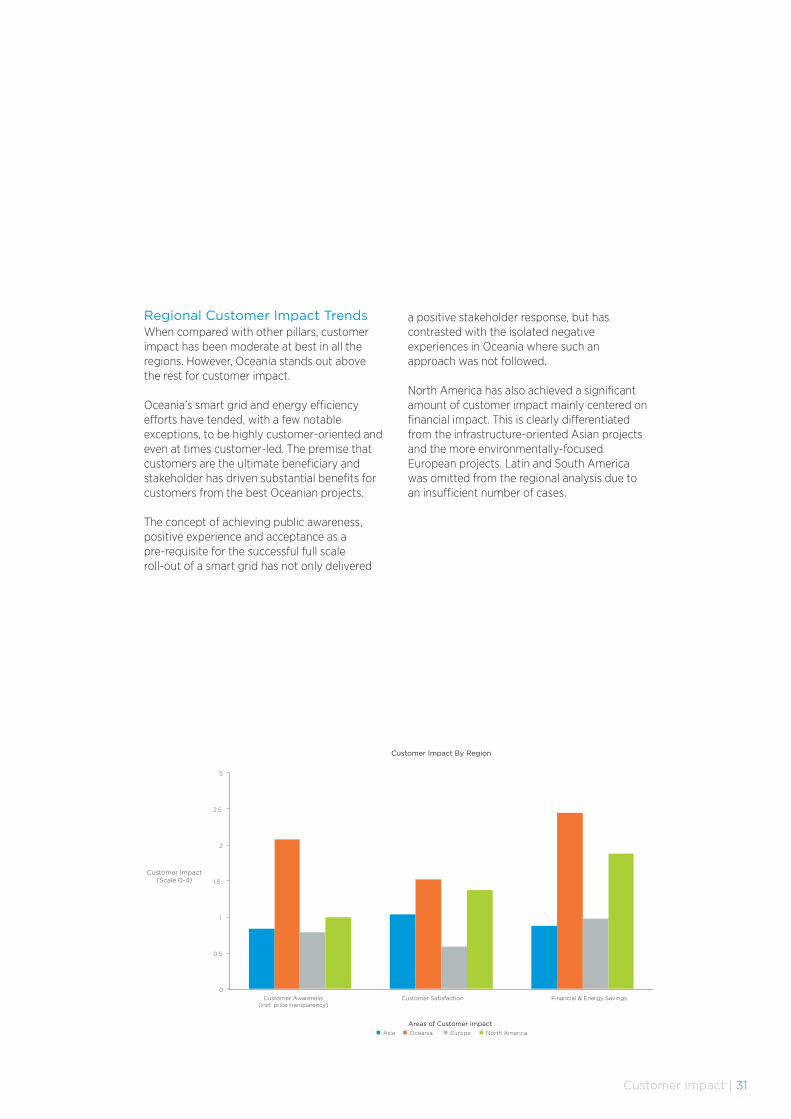
Regional Customer Impact TrendsWhen compared with other pillars, customer impact has been moderate at best in all the regions. However, Oceania stands out above the rest for customer impact.
Oceania’s smart grid and energy efficiency efforts have tended, with a few notable exceptions, to be highly customer-oriented and even at times customer-led. The premise that customers are the ultimate beneficiary and stakeholder has driven substantial benefits for customers from the best Oceanian projects.
The concept of achieving public awareness, positive experience and acceptance as a pre-requisite for the successful full scale roll-out of a smart grid has not only delivered
a positive stakeholder response, but has contrasted with the isolated negative experiences in Oceania where such an approach was not followed.
North America has also achieved a significant amount of customer impact mainly centered on financial impact. This is clearly differentiated from the infrastructure-oriented Asian projects and the more environmentally-focused European projects. Latin and South America was omitted from the regional analysis due to an insufficient number of cases.
0
0.5
1
1.5
2
2.5
3
Asia Oceania Europe North America
Customer Awareness (incl. price transparency)
Customer Satisfaction Financial & Energy Savings
Customer Impact By Region
Areas of Customer Impact
Customer Impact(Scale 0-4)
32 | 2013 Global Impact Report
Engaging the CustomerAs far as the customer is concerned, smart grid technology is merely a means to an end. Energy efficiency, demand response, the uptake of electric vehicles, and all the other benefits of smart grid that will require acceptance, interest, and participation of the customer, are very heavily dependent upon a staged approach to communication whereby the customer is taken through a journey of ever increasing awareness, knowledge, trust, and involvement.
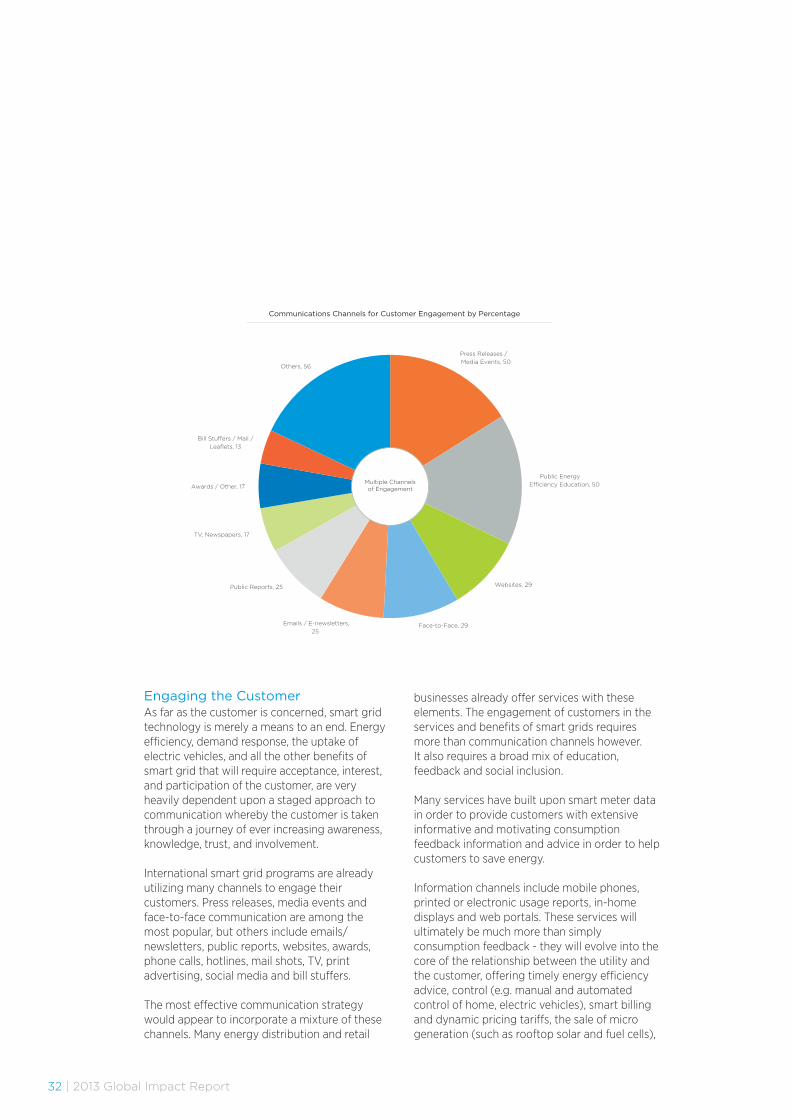
International smart grid programs are already utilizing many channels to engage their customers. Press releases, media events and face-to-face communication are among the most popular, but others include emails/newsletters, public reports, websites, awards, phone calls, hotlines, mail shots, TV, print advertising, social media and bill stuffers.
The most effective communication strategy would appear to incorporate a mixture of these channels. Many energy distribution and retail
businesses already offer services with these elements. The engagement of customers in the services and benefits of smart grids requires more than communication channels however. It also requires a broad mix of education, feedback and social inclusion.
Many services have built upon smart meter data in order to provide customers with extensive informative and motivating consumption feedback information and advice in order to help customers to save energy.
Information channels include mobile phones, printed or electronic usage reports, in-home displays and web portals. These services will ultimately be much more than simply consumption feedback - they will evolve into the core of the relationship between the utility and the customer, offering timely energy efficiency advice, control (e.g. manual and automated control of home, electric vehicles), smart billing and dynamic pricing tariffs, the sale of micro generation (such as rooftop solar and fuel cells),
Press Releases /
Media Events, 50
Public Energy
Efficiency Education, 50
Websites, 29
Face-to-Face, 29 Emails / E-newsletters,
25
Public Reports, 25
TV, Newspapers, 17
Awards / Other, 17
Bill Stuffers / Mail /
Leaflets, 13
Others, 56
Multiple Channels of Engagement
Communications Channels for Customer Engagement by Percentage

Customer Impact | 33
the ability to switch energy source (choose which type of energy you would like at any time), security and monitoring services and much more.
The attractiveness of such offerings to customers should not be underestimated. Customer satisfaction levels are typically in the 70-90% range, uptake levels for free offerings such as consumption feedback services are typically in the region of 10-40% and opt-out levels for consumption feedback are typically no more than a few percent.
Some utilities have become more cautious around customer engagement due to customer reactions and negative media coverage of some smart metering deployments around the world. Results can be achieved with grid-side technology deployment which does not require active customer engagements.
Perhaps the best acceptance of smart metering will come at a time when there are other major benefits or drivers for the customer to change their behaviour, such as the desire for more responsiveness to outages as we face an increasing number of extreme weather events, the purchase of an electric vehicle, or having more ’smart’ enabled appliances in homes. If utilities can build trust through grid-side improvements with minimal negative impact on customers, this will smooth the deployment of these technologies when they are sufficiently evolved and start to achieve broader mass-market uptake.
1. The most successful smart grid projects overall are typically also the projects that deliver the greatest customer impact. In fact, the six best projects in the Smart Grid Global Impact Report rankings overall (for all pillars) were among the best for customer impact.
2. It would appear that projects which focus heavily on the benefits for the customer are also more concerned with a broad ecology of customer-focused benefits from the smart grid. In doing so, they create other smart grid synergies such as: greater stakeholder support and funding; reduced opposition to smart meters; customer demand response; and, energy efficiency behavior to comple-ment smart grid efforts aimed at environmental benefits. In particular, there is a very strong correlation between customer impact and environmental impact.
3. The smart grid projects with the greatest impact have built in a strong customer focus from the very beginning of the planning process.
Top 3 Customer Impacts

34 | 2013 Global Impact Report
Case Project: CEM Smart Grid ProjectDescriptionCompanhia de Electricidade de Macao – CEM, S.A. (CEM) is a public utility company with the sole concession to transmit, distribute, and sell high, medium and low voltage of electricity in Macao. Besides, CEM owns an installed generation capacity of 472MW.
The predominant generation technologies deployed are low speed diesel generators (CCA) and combined cycle gas turbines (CCB) which make up 58% and 29% of total capacity installed and generated as much as 98% and 2% of total electricity production in 2012, respectively.
Implementing a Smart Grid in Macao will be a long and challenging process that involves system automation, network monitoring and customer interaction. However, as a result of a cost-benefit analysis focused on the potential of rolling out Smart Grid, CEM identified key areas to improve its operations.
It wanted to improve: the efficiency with which the organization responded to power outage and reduce average interruption duration; its customer service by providing more specific and timely support to customers during outages and power interruptions; and, the efficiency by which facilities were designed and constructed. This included testing how the communication network works with existing infrastructure and building the foundation for not only traditional domains such as grid control and optimization, but also the emerging and innovative domains like Customer-side Application, DER (Distributed Energy Resource) and renewable energy integration, and EV (Electric Vehicle) integration.
Why is it Special?CEM is in search of the most appropriate Smart Grid technologies that can be implemented in Macao, due to the growing power quality and cost-saving needs from the customers as well as the need for building consensus within the organization. Despite these challenges, CEM is currently taking steps to develop a smarter grid to deliver a host of compelling benefits to the end customers. As such, CEM Macao is focusing on its company vision ”to be seen as one of the best energy suppliers in Asia” by being one of the Smart Grid pioneers in Asia, looking for customer and community based solutions.
CEM identified several goals for improving its system design, operations and customer service. An important conclusion, for example, was to upgrade and construct a robust and reliable communication infrastructure as the backbone of a centralized management system to monitor and control the power grid. All substations are fully automated with centralised Supervisory Control and Data Acquisition (SCADA) systems as well as on-site Remote Terminal Units (RTU).
TakeawaysThe overarching goals have provided a stepped framework for various improvement projects, such as the Unified Communication Strategy Project, symbolizing the importance of Smart Grid projects for achieving milestones and continuous improvements.

2013 Global Impact Report | 35
Quick FactsCategory: Smart GridLocation: Macao, ChinaBudget: USD 30 million Size: 230,000 end-customersForeseeable customer benefits: • Increased customer satisfaction • Improved customer energy
savings, ability to introduce dynamic pricing scheme
• Improved outage and restoration management, capability to deploy transportation electrification, and environmental protection

The smarter grid is here.

The smarter grid is here.

Reliability Impact
Reliability Impact | 39
“ Reliability is a major driver behind smart grid investments as
utilities and grid operators strive to improve grid performance.
Storm response, replacement of aging infrastructure, maintaining
grid capacity and managing distribution feeder voltages are
some of the reliability aspects that utilities must address. Most of
the outages that customers experience are caused by an event at
the distribution level of the grid. Storm response and other
distribution outage costs can be a significant expense for
utilities and for customers. At this level of the grid, technology
deployments – such as smart meters, communications, distribution
automation, and IT systems – can mitigate the impact of these
outages for both the utility and customers.”
- Gary raCKliffe, VP, smarT Grids nOrTh ameriCa, abb

40 | 2013 Global Impact Report
System reliability continues to be a challenge for many utilities, and one which can most significantly impact customer perception, or at worst, result in regulatory action and fines if minimum standards cannot be met.
The greatest focus and success concerning reliability relates to reducing the impact of system interruptions. In developing markets though, voltage quality, transmission losses and system interruptions have at least equal importance and success.
More than 70% of the projects surveyed enhanced reliability through smart grids. What’s more, most projects that focus on reliability improve all three elements, namely transmission losses, voltage quality and system interruptions.
The vast majority of projects have or expect to improve up to 9% on their reliability elements. Typically, this level of improvement is in grids that are already highly reliable and resilient, and thus is a hugely significant achievement. In grids where the room for improvement is greater, the stated improvement increases to up to nearly 50%.
Regional Reliability Impact TrendsWhen it comes to reliability, it is Asia leading the results. The ground-up, big investment, comprehensive approach to grid capability is at the heart of Asia’s success. It is also because in some cases, Asia has started from a lower point in terms of reliability and resilience, allowing larger improvements.
The other regions are quite similar to each other in terms of voltage quality and transmission losses. However, North America stands out for its system interruptions achievements. Latin and South America was omitted from the regional analysis due to an insufficient number of cases.
Reliability Impact
Number of Projects
Voltage Quality Transmission Loss
Areas of Reliability
System Interruptions
Up to 9% improvement Between 10-19% improvement Between 20-49% improvement
0
5
10
15
20
25
30
Average Reliability Impact
“The vast majority of projects have or expect to improve up to 9% on their reliability elements. Typically, this level of improvement is in grids that are already highly reliable and resilient, and thus is a hugely significant achievement.”

Reliability Impact | 41
Voltage Quality Transmission Losses System Interruptions
Reliability Impact
(Scale 0-4)
Asia Oceania Europe North America
Areas of Reliability
0
0.2
0.4
0.6
0.8
1
1.2
1.4
1.6
1.8
Reliability Impact by Region
1. More than 70% of the projects surveyed enhanced reliability through smart grid. What’s more, most projects that focus on them improved all three reliability elements, namely transmission losses, voltage quality and system interruptions.
2. The seamless integration of operational technology (OT) and Information technology (IT) facilitates additional synergies from smart grid technologies, enables substantial prioritization and streamlining of smart grid technology component implementation, and assists in the avoidance of unnecessary or premature replacement or maintenance of smart grid infrastructure.
3. Projects need to have realistic expectations. It is far more difficult to increase the reliability of a network that is already relatively strong in this respect. Relatively small improvements can be a major achievement for some networks, achieving step-by-step cost-efficiencies.
Top 3 Reliability Impacts

42 | 2013 Global Impact Report
Case Project: CenterPoint Energy Smart GridDescriptionHouston-based CenterPoint Energy delivers power to 2.2 million customers in the Houston metropolitan area. The CenterPoint Energy smart grid project includes the installation of a fully integrated advanced metering system and joint web portal access, as well as advanced monitoring and distribution automation equipment. The objective of the project is to build a more resilient system through smart grid technology to improve power reliability and reduce restoration times.
Since 2012, CenterPoint Energy has leveraged the outage notification capabilities of the advanced meters to reduce localization time for fuse-level outages. In fact, in the first several months since activating meter-initiated power off notifications (PONs), the average time to dispatch appropriate restoration resources to fuse-level outages using PONs has been a little over six minutes, compared to over 14 minutes for fuse-level outage cases created by relying on customer phone calls. CenterPoint Energy’s smart grid will be “self-healing,” which in the event of major outages will enable it to restore as much power as possible automatically, then diagnose and map the damage to the system as a whole, resulting in faster system restoration.
Why is it Special?The “self-healing” smart grid is a pioneering approach that minimizes the impacts of power outages on system reliability performance and improves customer satisfaction. The smart grid is an integrated system that is composed of the Advanced Metering System, substation and distribution automation, telecom systems supporting both smart meters and the
intelligent grid, and all of the back-office computer systems and interfaces that enable all these systems to communicate and work together seamlessly.
As a result of this fully integrated approach, CenterPoint Energy will be able to identify and locate power outages as they occur, and dispatch the right crew with the right skills and equipment to resolve the issue. Additionally, the system will notify affected consumers that the outage has been identified and provide an estimated time of restoration.
For circuit-level outages, CenterPoint Energy will use the intelligent grid’s “self-healing” capability to switch around the fault to restore power to the maximum number of consumers. As a result, where the automated switches have been used to restore circuit-level outages, CenterPoint Energy has seen significant improvement in the service restoration process, with many affected customers experiencing an outage of just a few minutes rather than at least half an hour.
TakeawaysSmart grid network intelligence and smart meters can greatly facilitate the reduction of outage duration and improve the customer experience.

2013 Global Impact Report | 43
Quick FactsCategory: Smart GridLocation: Texas, USABudget: $639,187,435 (Federal Share: $200,000,000)Duration: 2012-2014Achievements so far: • 21% improvement of outage
response • 1.2 million outage minutes were
avoided in 21 outages • 70% improvement of customer
experience
EnvironmentalImpact

Environmental Impact | 45
“ The International Energy Agency notes that low-carbon electricity
and energy efficiency are at the core of a sustainable energy system
and charts a path for how emissions per kilowatt-hour can be reduced
by 80% by 2050. Smart grid projects with a focus on incorporating
renewables and increasing energy efficiency can make a significant
contribution to meeting these targets. Understanding what types of
projects are most successful in targeting emissions while generating
positive economic returns will be useful to others that follow.”
- sTeVe aTKins, abb smarT Grids indusTry seCTOr iniTiaTiVe

46 | 2013 Global Impact Report
Renewable energy integration and emissions reductions are arguably the major environmen-tal beneficiaries of smart grids, and these benefits transcend the regions: the four best projects for this pillar were located across four continents. While each of the 30 projects achieved some impact across all five environ-mental elements, most focus on renewable energy integration and emissions reductions. Only a few projects delivered, or expect to deliver, substantial achievement broadly across all the environmental elements.
Overall, demand response initiatives like consumption shifting and reduction received surprisingly low rankings in the research, despite their potential to deliver environmental and customer impact. The reason for this is in part the complexity of customer behaviour and demand-side management in general, which requires in-depth understanding of the customer – something that many utilities are not yet highly prepared for.
One other reason could be because utilities may associate demand response with capacity deferral to be able to address peaks on very hot or cold days but not strongly identify this with environmental benefits. A stronger environmental impact may come as utilities start to leverage demand response to integrate renewables, either to adjust load to meet excesses, meet shortfalls of supply, or to provide control power.
Consumption shifting and reduction may also not be fully enabled by market, regulatory and financial support mechanisms, limiting the ability to achieve impact in terms of customer engagement. Despite this challenge, some projects have progressed greatly in terms of the behaviour-based environmental elements, and with clear interest in demand side measures shown by most projects, it is inevitable that an increase in the impact of such measures is imminent.
Regional Environmental TrendsDifferent regions emphasise slightly different aspects of environmental impact. Asia marginally leads for emissions reductions, while North America leads renewable energy integration and consumption shifting. Australia arguably leads consumption reductions and environmental awareness improvements, though the USA has so far done these more cost-effectively.
Europe lags behind the other regions at present, but its innovativeness and commit-ment to research and experimentation may well pay off in the near future. Latin America was omitted from the regional analysis due to an insufficient number of cases.
Environmental Impact
0
5
10
15
20
25
30
Consumption Shifting Consumption Reductions
Areas of Environmental Impact
Medium impact High impact Very high impact
Environmental Awareness Improvement
Emissions Reductions Renewable Energy Integration
Environmental Impact by Area
Number of Projects

Environmental Impact | 47
1. Integration of renewable energy is the primary focus of many smart grid projects from an environmental perspective – this is perhaps due to the near-term challenge of this integration and the need to invest in the systems which will support this.
2. Customer engagement and environmental impact are partners. While a large amount of renewable energy integration and energy loss reduction can be attributed to activities unrelated to customers, the majority of environmental improvement is the result of, or supported by, customer involvement. Customers must be treated as a central component of a smart grid environmental strategy. While not indicated in the results, research into the 30 projects in this report indicates statistically a strong environmental impact from customer-focused smart grid projects resulting from changes in customer behaviour, or at least changes in their consumption.
3. Because of the relationship between environmental impact and customer behaviour, there is typically a long lead time before the results of environmental endeavors take effect. Perseverance and commitment are therefore a pre-requisite of environmental impact.
0
0.5
1
1.5
2
2.5
Asia Oceania Europe North America
Consumption Shifting Consumption
Reductions
Environmental
Awareness Improvement
Emissions Reductions Renewable Energy
Integration
Environmental Impact
(Scale 0-4)
Environmental Impact by Region
Areas of Environmental Impact
Top 3 Environmental Impacts

48 | 2013 Global Impact Report
Case Project: Townsville Queensland Solar CityDescriptionThe Townsville Queensland Solar City project is a showcase of future sustainable living in Australia. It is a part of the Australian Govern-ment’s Solar Cities program, which aims to trial new, sustainable models for electricity supply. Ergon Energy leads the project consortium, which also includes Townsville City Council, along with funding from the Queensland Government. The Magnetic Island Solar Suburb is a flagship project initiative undertaken by Ergon Energy with the aim of reducing ‘peak demand’ and electricity usage, reducing greenhouse gas emissions, saving customers money and deferring investment in augmenting the network.
Why is it Special?The program succeeds in reducing ‘peak demand’ and electricity usage, reducing greenhouse gas emissions, saving customers money and deferring investment in augmenting the network. Its key to success was using the combination of existing social marketing strategies to motivate sustainable behaviour change by customers.
Lifestyle transformation to a more energy efficient one together with the ability to make your home more energy efficient resulted in higher than expected energy savings and reductions of greenhouse gas emissions.
The behavioural research was undertaken at the stage of planning the project in order to investigate how customers see the barriers and benefits of energy efficiency. It was the first time a combination of community-based social marketing (Dr D Mackenzie-Mohr) and thematic communication (Professor Sam Ham) has been used.
TakeawaysSmart grids should treat demand, supply and network side initiatives and triplets. Customer behaviour augmented smart initiatives co-ordinated with intermittent renewable distributed generation can lead to major reductions in pressure on networks, as well as significant energy savings and greenhouse emissions reductions.

Quick FactsCategory: Smart CityLocation: Queensland, AustraliaBudget: AU $30 millionDuration: 2007 – 2013Targets: • Reduce peak demand by 27%
compared to business as usual predictions (Achieved 46% reduction)
• Reduce electricity consumption by 25% from BAU (Achieved 46% reduction)
• Reduce greenhouse gases by 50,000t (Achieved reduction of 54,000t to June 2012).

Economic Impact

Economic Impact | 51
“ Customers are in transition to become more energy self-sufficient
with new technologies like photo-voltaic and energy storage. Over
time, this changes the economic paradigm for central energy supply.
Bloomberg Businessweek claims that the power grid is “doomed
to obsolescence.” However, the research in the Smart Grid Global
Impact Report suggests smart, innovative utilities become the glue
that pull all these generation and consumption points together and
become more relevant than ever.” - ClinTOn daVis, VP, disTribuTiOn sOluTiOns, VenTyx

52 | 2013 Global Impact Report
The Cost of a Smarter GridOf the 30 projects analysed in-depth for the Smart Grid Global Impact Report, investment costs ranged from a few million USD up to nearly five billion. Altogether, the 30 projects represented an overall investment of USD 9.5bn over their immediate project investment.
With regards to smart grid costs, we evaluated a number of key metrics:
• Technology components – this varied from project to project but overall, most of the leading projects deployed a broad range of technology components
• Objectives - projects do not always have the objective of saving money or even being cost-effective – more than 70% of projects neither calculated ROI, nor aimed to reduce operational costs
• Scale - substantial fixed costs mean that there are higher cost-efficiencies associated with larger programs – all other variables held constant. The six most successful projects are 50% more cost-effective than the average project in the top 30
• Population density - varying between network regions, this affects the cost-per-customer and changes the way projects are implemented. . Because many smart grid projects to date have been pilots or initial
launches often with ‘beta’ technology and little or no prior experience, they are considered somewhat inefficient. This is set to change as hinted already by some of the most cost-effective projects. For example, the average investment per customer in the two top North American projects equals to $225, which is 42% lower than the investment per customer in the average project from the top 30
• Time frame – projects with a longer-term vision tend to offer greater scope for cost recovery and financial return creation. Realising the benefits from smart grid investments takes strategy - a short-term perspective may lead to short-term benefits.
For the 30 projects analysed, the total spent on smart grid projects, when averaged out per customer was $390. The investment per customer was under $200 for projects without smart metering, while approximately $400 for projects with smart meters installed.
Return on Investment:Economic return on investment (ROI) is becoming a key commercial, public and political issue for smart grid projects and plans around the world. It is simply not enough to promise benefits for society. If the smart grid is going to deliver results – if it is going to
Economic Impact
Economic Impact (Scale 0-4)
Projects
ROI Rating Operating Cost Rating
1 2 3 4 5 6 7 8 9 10 11 12 13 14 15 16 17 18 19 20 21 22 23 24 25 26 27 28 29 30
0.00
0.50
1.00
1.50
2.50
3.50
4.50
2.00
3.00
4.00
5.00
Economic Impact by Project

Economic Impact | 53
win approval from customers and politicians who have become frustrated by energy price rises – it must ultimately pay its own way. Clear evidence of the potential for a positive economic business case will be essential.
In this report, we focus on the financial cost benefit relating to project costs versus savings and any resulting additional direct revenues. We have not taken into account the broader economic business case that would include, for instance, the financial benefits for customers resulting from energy savings or demand response or the benefits for economies resulting from the development of the smart grid industry or reduced costs associated with environmental damage or damage mitigation. We focus only on the immediate financial business case of the project itself, which is what energy customers and the general public are most concerned with.
Financial ROI has often not been the key priority, or any priority. Finding the best technical or behavioural solutions has typically been the name of the game. However, it would appear that we are now entering a new holistic, grid focused era and finally achieving positive financial results. Many projects have now realized or estimated positive financial ROI.
Regional Economic Impact TrendsEconomic Impact is the pillar where the variance between regions is most noticeable. Whereas Asian projects on average promise the greatest benefits for the industry, Australian projects deliver the greatest benefit for customers. North American projects are mixed ranging from highly successful to rather cost-inefficient. European projects have tended to view smart grid projects more as investments, or pilots in nature - as such they have generally focused less on economic efficiencies. This is something that is set to change in the near future as European smart grids mature into larger scale commercial implementations. Latin and South America was omitted from the regional analysis due to an insufficient number of cases.
Economic Impact by Region
0
0.1
0.2
0.3
0.4
0.5
0.6
0.7
0.8
0.9
ROI Rating Operating Cost Rating
Economic
Impact
(Scale 0-4)
Areas of Economic Impact
Asia Oceania Europe North America
8
5
15
2
Up to USD 10m
From USD 10m to 100m
From USD 100m to 1bn
Over USD 1bn
Number of Projects by Level of Investment
Projects
Projects
Projects
Projects


Economic Impact | 55
1. The financial benefits are real. Customers are finally benefiting from smart grid, but only where a clear customer journey is identified. The best projects have delivered significant benefits of between $304 and $506 per customer over the initial scope of the project. Overall, done right, smart grid can actually save money – the image of smart grid as a cost are changing.
2. Projects with only economic goals deliver less positive economic results than those with broader objectives. Projects without clear economic goals and without a clear strategy to track and maximise cost-effectiveness rarely achieve a positive economic outcome.
3. Economically focused projects should not be conservative about innovation, or see it as a risk. Innovation should not be engaged in for the sake of innovation, but is an important driver of positive economic returns.
“ Economic return on investment (ROI) is becoming a
key commercial, public and political issue for smart
grid projects and plans around the world.”
Top 3 Economic Impacts

Overall Ratings

Overall Rating | 57
“ The most successful smart grids of tomorrow will operate with
unprecedented agility – adopting highly collaborative, responsive
and efficient business models that unlock human potential while
preserving the environment. The first-annual Global Smart Grid
Impact Report highlights leading projects in the world and starts
to uncover their insights and learnings as we work together as an
industry toward our smarter energy future.” - James braaTVedT, VP, sOluTiOns marKeTinG, VenTyx

58 | 2013 Global Impact Report
2013 Overall RatingsDespite smarter grids still being evolutionary in terms of approach and technology, some smart grid projects stand out in terms of their overall achievement. In 2013, OG&E’s Positive Energy Smart Grid is ranked the best overall project, but a continuum of successful projects around the world has now emerged.
Most projects display clearly focused strengths, few projects are generically strong or weak, but the best six projects received top scores for nearly all pillars. They were quite simply the best at almost everything. Typically, the best programs have a more holistic approach to smart grids. This is not simply a case of the methodology favoring projects that achieve benefits across all smart grid pillars. Rather, projects which take a broader view capitalize on the interdependencies and synergies between the many activities and functionalities of smart grid. For instance, reduced pressure
on a network achieved through demand response will facilitate improved reliability. Meanwhile, improvements in reliability can enhance customer and public involvement in smart grids, including demand response programs. The full extent of inter-dependencies is not yet known, but likely to be a major source of future increases in return on investment.
Top Six ProjectsThe Smart Grid Global Impact Report research methodology allowed for utilities that didn’t wish to be named to remain anonymous. We hope that in future more utilities will wish to participate in this project as a way to celebrate their success as some of the leading projects in the world and share their insights and learnings – both in terms of what to focus on, and what to avoid as we work together as an industry toward a smarter energy future.
Overall Ratings
0.00
0.50
1.00
1.50
2.00
2.50
Rating
Projects
Europe
North America
Oceania
Asia
Latin and South America
OG&E Positive Energy Grid
(USA)
Smart Grid, Smart City (Australia)
Townsville Queensland Solar City (Australia)
Leading Utility (USA)
Búzios Smart City Project (Brazil)
Yokohama Smart City Project (Japan)
Top 30 Overall Project Rankings By Region

Overall Ratings | 59
Environmental Impact
Customer Impact
Reliability Impact
Economic Impact
Innovation
Top Six Project Ratings By Pillar (detailed results left anonymous)
Project No.1
Project No.2
Project No.3
Project No.4
Project No.5
Project No.6
(Projects are not in the order of ranking)
“ Typically, the best programs have a more holistic approach to smart grids. This
is not simply a case of the methodology favoring projects that achieve benefits
across all smart grid pillars. Rather, projects which take a broader view capital-
ize on the interdependencies and synergies between the many activities and
functionalities of smart grid.”

60 | 2013 Global Impact Report
0.0
200.0
400.0
600.0
800.0
1000.0
1200.0
0.00 0.50 1.00 1.50 2.00 2.50
Cost Intensive
Europe North America Asia Oceania Latin & South America
Angle Indicates Cost Effectiveness
Cost Effective
OG&E Positive Smart Grid
Investment(USD Million)
Averaged Overall Rating
Investment vs Project Rating
Cost Efficiency vs. ReturnsAs indicated below there are some fairly significant differences in the cost of smart grid projects, largely since some were pilots and others were implementations. This is especially true also in terms of geographical variation.
In fact, while 95% of total investment from our list of top 30 smart grid projects was for projects located in North America and Asia, only 50% of projects were actually based in these regions. It is important to note, however, that purely smart meter projects were omitted from this analysis, and therefore the investment from Europe would have been proportionally much greater if these had been included, we hope to include more smart grid projects from Europe in the future editions of the report as more broad-scale projects emerge from the region.
Cost per-customer can vary greatly depending on the focus of the project. What is clear is that you do not have to spend the most to be the best.
Success by geographyAll continents appear to display success in different pillars:
• Oceania has achieved the greatest custom-er impact.
• Europe’s impact is mainly in innovation and environment but it has achieved the least economically – perhaps this focus on cutting-edge innovation and a focus on feasibility studies are yet to fully realize benefits and we will see this change in the future. European projects, while not economically beneficial at least yet, are nevertheless relatively cost-effective.
• North America is relatively comprehensive in results, represented in strongly integrated business cases incorporating upgraded systems. North America also ranks well for innovation. While some North American projects are among the most highly cost-effective, others are also very expen-sive. Perhaps the disparate nature of these results has been impacted by federal funding initiatives, or just the sheer number of smart grid projects in the region.

Overall Ratings | 61
• Oceania and Asia have had the greatest economic impact.
When considering aggregated results across all regions, there is still a skew towards innovation, with economic impact still the least successful pillar. It is hoped that this will change as more projects move from feasibility to maturity.
However, the rapid pace of technological change is unlikely to slow with significant developments in renewable generation, electric vehicles and storage just a few examples of technology which will continue to evolve and have a dramatic impact on the grid. Utilities need to focus on building a platform capable of supporting the broad range of components being deployed, as well as one capable of incorporating innovation and change.
To be flexible, a baseline platform for smart grids will need to be capable of incorporating both hardware and software technology, as well as being built on a strong foundation of forecasting and analytics to properly take advantage of the technology being deployed.
Companies like ABB and Ventyx have a broad range of hardware and software which is one potential strategy for utilities looking for a platform to support future smart grid programs.
Innovation is statistically correlated to economic impact. The more innovative a project, as long as it is focused on a broad array of smart grid elements and benefits, the more cost-effective the outcome will tend to be. The most success-ful smart grid projects, therefore, tend to be both innovative and economically successful.
The main reason for valuing innovation so greatly is that without it, cost-effective solutions for the challenges facing electricity grids are unlikely to be found. Not typically known as innovation companies, utilities need to begin organizational transformations to comprehensively change their approach to a flexible, responsive and innovative culture.
Environmental impact
Customer Impact
Reliability ImpactFinancial Impact
Innovativeness North America
Latin and South America
Europe
Asia
Oceania
Average Pillar Ratings by Region

62 | 2013 Global Impact Report
8In
tellig
ent
Inte
rco
nen
cte
d
Innovative
Inclusive
Inte
ntio
nal
Itera
tive
International
Invested

Overall Ratings | 63
1. Invested: The top 30 smart grid projects in the world currently account for nearly USD 10bn in investment. However, the most successful projects do not necessarily spend the most. What matters most is developing integrated systems to implement complete end-to-end business models.
2. Intelligent: To get real-time grid visibility, utilities rate sensing and monitoring as their first and second most important smart grid project components. The key to success is unlocking the wealth of insight in this data by applying intelligent and predictive analytics.
3. Interconnected: Integration is the second highest area for innovation in smart grid projects (preceded only by the sensing and monitoring technolo-gy). The connectivity between Opera-tional Technology (OT) and Information Technology (IT) is a key area of focus as utilities try to extract more insight from the wealth of data.
4. Innovative: Some projects avoid innovation due to perceived risk, and these projects tend to rank lower. The best projects deploy innovative solutions across a broad mix of components. Utilities need a platform capable of supporting the broad range of components being deployed, as well as one capable of incorporating innovation and change with flexibility.
5. Inclusive: Typically the best programs have 36% more components in their
smart grid project. Smart grids cannot succeed if developed through isolated ad-hoc projects in the absence of a clear sense of direction.
6. Intentional: While the smart grid concept gains maturity, only projects with clear economic and consumer goals at the outset can achieve strong results. Successful projects have solid objectives-based management and a strategy framework that enables decisions that lead to better results.
7. Iterative: While smart meters are a key component of the overall smarter grid, some successful projects obtain results by focusing on grid-side projects which do not require significant direct customer engagement. This inevitably builds trust with customers and paves the way for success with smart meter rollouts and customer programs when smart homes and electric vehicles drive consumer engagement.
8. International: The top six projects in 2013 span four continents, making smart grids a truly global phenomenon. Regionally, many of the objectives are the same, however Oceania has achieved the most customer impact; North America is comprehensive but ranks well for innovation; Europe has been focused on innovation and environment; and with regards to economic impact, Oceania and Asia are in the lead.
The 8 ‘I’s’ for Intelligent Grids

64 | 2013 Global Impact Report
Case Project: Top Ranked Project OG&E Positive Energy Smart GridDescriptionOG&E’s Positive Energy ® Smart Grid Program covers a 30,000 square mile service area in Oklahoma and western Arkansas. It includes Smart Meters/AMI, a “SmartHours” dynamic pricing campaign and Volt-Var optimization technology equipped circuits. All customers have access to the “myOGEpower” web portal to review their energy consumption, and have the option of enrolling in dynamic pricing and receiving a free programmable communicating thermostat. The project’s business objectives include enhancing customer relationships by providing them with tools and information to manage their energy more wisely, peak demand reduction through dynamic price response and Volt-Var optimization, operation-al cost savings, and improved reliability. Reduction of peak demand will contribute to the deferral of additional fossil fuel power plant construction and associated operating costs ($250-300m NPV avoided cost).
Why is it Special?The OG&E program is an innovative and ambitious project using ABB’s Network Manager DMS. It is the first DMS to deploy ABB’s new Volt-Var optimization system, which together improve distribution system visibility, provide better accuracy and granularity of data, allow for better forecasting and integration of more real-time data than ever before. The SmartHours dynamic pricing campaign is recognized in the industry as a leader in terms of scale and impact for a smart grid enabled price response program. Some of the benefits envisioned upon full project completion in 2017 include: reducing demand
by 223 MW through dynamic pricing and 75 MW through Volt-Var optimization; reducing annual meter operating costs by $15 million; and reducing SAIDI and SAIFI by 30%. OG&E has a target of enrolling 160,000 customers in its “SmartHours” dynamic pricing program (Approx. 77,000 enrolled through August 2013). The 54,000 customers participating in the demand response program at the end of 2012 reduced system demand by 67 MW and each saved $179 on average during the four month summer period. Major IT improvements have also been made in communication infrastructure, web services, system integration, and cyber security. OG&E’s Positive Energy ® Smart Grid Program was a primary factor in OG&E being selected to receive the prestigious EEI Edison Award in 2013.
Takeaways
• Customer satisfaction has increased as more meters were installed, providing greater access to more accurate data to manage consumption, with fewer billing errors
• Meter reading costs will decrease by about $15 million/year thanks to remote reading and remote disconnect/reconnect
• Marketing campaigns through TV, internet, and presentations have improved customer energy awareness
• The customer web portal provides energy savings advice and features information on the environmental impact of their electricity consumption, such as CO2 emissions

Quick FactsLocation: Oklahoma and western ArkansasSize: 825,000 smart meters installed serving approximately 800,000 customersCost: $357 million USD ($130 million USD from the DOE).Duration: 2010-2012 (3 year infrastructure buildout and DOE funding period), with additional SmartHours enrollments and Volt-Var expansion planned for 2013–2017, subject to regulatory approval.
66 | 2013 Global Impact Report
With its first-annual issue in 2013, the Smart Grid Global Impact Report reveals the strategies for success for 30 leading smart grid projects around the world. It presents detailed analysis on the characteristics of successful smart grids as well as best-practice case studies to help us learn from the most innovative utilities around the world.
The Smart Grid Global Impact Report is above all an effort to help maximize the benefits of smart grid for all stakeholders – society, the environment and the energy industry. All research and analysis as part of the Smart Grid Global Impact Research was conducted independently by VaasaETT Oy AB Ltd. The Smart Grid Global Impact Report is written by VaasaETT in collaboration with experts from Ventyx, ABB and a variety of leading contributors globally. Ventyx, An ABB company, commissioned the research and have sponsored your copy of this report to help further best practice globally.
Be Part of the Smart Grid Global Impact ReportIf your utility is running a smart grid project, share your insights and help us work together as an industry towards a smarter future by being a part of next year’s report. Utilities can participate in the research anonymously, or choose to have their project highlighted as an example and guide for your peers in the industry.
For more information and to take part visit: www.smartgridimpact.com
About the Smart Grid Global Impact Report

2013 Global Impact Report | 67
Dr Philip E. Lewis, CEO, VaasaETT Global Energy Think-Tank
Dr Lewis is a leading international expert in utility customer and smart energy related issues. With 16 years in the utilities industry, Dr Lewis has conducted research and strategic support in more than 50 countries in five continents for over 400 utilities and other market players.
Formerly head of Marketing Research and Analysis for the UK based retailing subsidiary of Amoco and (now) EDF, during the onset of competition in the British energy market, Dr Lewis has additionally worked extensively for a large number of governmental, regulatory, industry and leading NGO bodies around the World. Dr Lewis is also a director and board member of the European Smart Energy Demand Coalition (SEDC), has sat on the editorial board of the European ‘Energy Efficiency’ Journal published by Springer, is a reviewer for the International Journal of Energy Sector Management, and is a Faculty Member for the Diploma of Advanced Studies program in Renewable Energy Management at the University of St Gallen Executive School in Switzerland.
James Braatvedt, Vice President, Solutions Marketing, Ventyx
James Braatvedt is a specialist enterprise marketing professional focused on asset intensive industries. James held senior marketing positions at Peace Software, First Data, and Hansen Technologies prior to joining Ventyx in 2010. James has had articles and whitepapers published on a variety of topics including energy and mining, and holds a Bachelor of Management Studies from the University of Waikato. Today, James is responsible for the global marketing strategy of the Ventyx solutions for asset intensive industries.
About the research founders

68 | 2013 Global Impact Report
VaasaETTVaasaETT is a unique and world leading collaborative think-tank and consultancy that delivers best practice, data, analysis and expertise from around the world to the global energy and utilities industry. We help turn the world’s best knowledge into local strategies and solutions.
At the heart of our offering are a global knowledge sharing network of thousands of contacts in over 60 countries in six continents and a vast up-to-date and ever increasing store of global best practice, data and analysis. Our world-leading expertise includes: customer behaviour and psychol-ogy, customer lifetime value, smart energy issues and broader market issues.
VaasaETT is, among other things, the world’s leading source of benchmark information on smart grid, smart energy demand and demand response programs; a globally renowned expert of the dynamics of behavioural energy efficiency; and a founding member and manager of the European Smart Energy Demand Coalition (SEDC). VaasaETT is also the world’s only organization that has tracked customer behaviour data in every competitive electricity market globally since market opening; the world’s most comprehensive source of customer switching data and analysis; Europe’s best source of up-to-date retail energy price data; and a source of market tracking data on over 60 jurisdictions in six continents.
More information: www.vaasaett.com
Ventyx and ABB:At Ventyx, we pride ourselves on going to the ends of the earth to solve our customers’ biggest challenges. Trying to balance long-term investments in economic viability, capacity, customer satisfaction and a healthier grid overall is constantly challenged by the daily grind of managing workloads, responding to outages, and the ever-increasing pressure on operations and maintenance budgets. Energy companies need deep and broad visibility into the entire energy lifecycle to dynami-cally respond to the world’s changing energy needs whilst never losing sight of continual improvement.
When data is allowed to flow between the sensors in the field, the operational (OT) systems and the industrial enterprise information technology systems – it can be turned into actionable insights. With true visibility, utilities can make faster, better-informed decisions in both daily operations and long-term planning strategies.
Together with ABB, we have the broadest portfolio of solutions from source to socket. Our portfolio encompasses decades of experience in the energy industry, highly respected equipment and technology with market-leading software platforms. This position enables us to solve the challenges of today, and when backed by our significant passion for innovation, ensures a trusted platform of choice for the future utility.
With this passion for smarter grids as a backdrop, when we saw a need in the market to share best practices on the characteristics of what makes a high-return smart grid project, we set about an initiative to research this opportunity and are proud to have selected VaasaETT to conduct this research.
More information: www.ventyx.com and www.abb.com
About VaasaETT and Ventyx


70 | 2013 Global Impact Report
Interact with the smarter grid at: www.smartgridimpact.com


The smarter grid is here.