smart grid to balance renewable energies - contributing ... · pdf fileindeed, variable...
TRANSCRIPT
SMART GRID FOR BALANCING RENEWABLE ENERGIES ‐ CONTRIBUTING DISTRIBUTED ENERGY RESOURCES
BY:
DAVID BEAUVAIS AND ALEXANDRE PRIEUR
CANMETENERGY, VARENNES RESEARCH CENTER
AND
FRANÇOIS BOUFFARD
MCGILL UNIVERSITY
MARCH 2012

“SMART GRID TO BALANCE RENEWABLE ENERGIES –
CONTRIBUTING DISTRIBUTED ENERGY RESOURCES”
PREPARED BY:
DAVID BEAUVAIS AND ALEXANDRE PRIEUR
CANMETENERGY, VARENNES RESEARCH CENTRE
AND
FRANÇOIS BOUFFARD
MC GILL UNIVERSITY
MARCH 2012

EXECUTIVE SUMMARY
The electricity markets are making a number of adjustments in order to integrate renewable energies.
Indeed, variable production creates certain integration problems, which require increased levels of
operating reserves. Furthermore, it is critical that these reserves have dynamic characteristics, which
can support and counter generation variability. While major power grids have countered capacity
problems with increased production, there are other emerging approaches to grid management. Use of
load management, distributed generation or storage provides support for networks coping with energy
surplus but capacity deficits.
The current study investigated various resources, focused on networks or customers, which would be
capable of offsetting fluctuations in renewable energies or supply reserve on the markets. Air
conditioning, water and air heating are applications that lend well to management, due to the thermal
inertia inherent to these loads. The development of the smart grid, and adding communication in
particular, encourages development of this potential. With the progressive addition of demand‐side
management technologies, smart household appliances, distributed generation and energy storage, the
distribution grids will be the hub for future energy exchange. A major trend related to smart grid
development supports deployment of distributed energy resources to reduce grid stress and potentially
promote the use of micro grids in cities. Furthermore, the smart grid is an integral part of more
intelligent systems aiming, among other things, to improve urban environments (smart city) and road
transport (smart transportation).
Developing business models favourable to deployment of distributed energy resources would require
significant changes in the power industry structure and regulation. A change of paradigms towards more
decentralized solutions is attractive in many respects. However, there is an important political aspect
that requires support from a number of stakeholders, industry players, traditional industry,
governmental and non‐governmental agencies and consumers.
Technical report – 2012‐177 (RP‐TEC) 411‐ FLEXIN ‐ v ‐ March 30, 2012
CITATION
D. Beauvais, A. Prieur, F. Bouffard, « Smart Grid for balancing renewable energies – Contributing
Distributed Energy Resources », 2012‐177 (RP‐TEC) 411‐FLEXIN, 65 pages.
NOTE
This document is distributed for informational purposes only. It does not necessarily reflect the views of
the Government of Canada nor constitute an endorsement of any commercial product or person. The
Government of Canada and its ministers, agents, employees, servants or agents make no
representations or warranties as to the accuracy or completeness of the information contained in this
report.
ACKNOWLEDGEMENTS
A number of sources provided information or advice during the creation and adaptation of this
document. CanmetENERGY wishes to thank the following for their help:
Alain Moreau, Laboratoire des Technologies de l’Énergie (LTE), Hydro‐Québec
David Elzinga, International Energy Agency
Gavin Hume, Enbala
Geza Joos, McGill University
Helen Whittaker, British Columbia Hydro (BC Hydro)
Julie Bossé, CanmetENERGIE, Natural Resources Canada
Liuchen Chang, University of New Brunswick
Lisa Dignard, CanmetÉNERGIE, Natural Resources Canada
Marc Potvin, Breton Banville et Associés (BBA)
Michel Losier, New Brunswick Power (PowerShift Project)
Pierre Fitzgerald and Régis Hourdouillie, Ericsson
Pierre‐Olivier Pineau, Hautes Études Commerciales, Montréal
Seul Ki Kim, Korea Electrotechnology Research Institute
Simon Ayoub and Philippe Mabilleau, Université de Sherbrooke
Sophie Pelland, CanmetENERGIE, Natural Resources Canada
Technical report – 2012‐177 (RP‐TEC) 411‐ FLEXIN ‐ vi ‐ March 30, 2012
TABLE OF CONTENTS
1 Introduction ......................................................................................................................................... 1
2 Smart grid and distributed energy resources presentation................................................................. 3
2.1 Smart Grid support to DER integration ....................................................................................... 4
2.2 Renewables energies and network flexibility.............................................................................. 5
2.3 DER Aggregation.......................................................................................................................... 8
2.4 Benefits of distributed energy resources .................................................................................... 9
3 Technical and scientific review ..........................................................................................................14
3.1 Residential – Air conditioning....................................................................................................14
3.2 Residential – Household appliances..........................................................................................16
3.3 Residential‐Water heating.........................................................................................................17
3.4 Residential – Thermal storage...................................................................................................23
3.5 Residential – Electric heating ....................................................................................................24
3.6 Commercial − Centralized HVAC opera on...............................................................................25
3.7 Commercial − Emergency generators .......................................................................................26
3.8 Municipal − Cogenera on and urban hea ng systems.............................................................26
3.9 Municipal – Water pumping stations ........................................................................................27
3.10 Transportation – Electric vehicles .............................................................................................29
3.11 Other loads ................................................................................................................................30
4 The role of markets in the integration of distributed energy resources ...........................................31
4.1 Planning production resources..................................................................................................31
4.2 Market structures and philosophies..........................................................................................31
4.3 Load aggregation .......................................................................................................................33
4.4 Integration challenges ...............................................................................................................34
4.4.1 Technical challenges .........................................................................................................35
4.4.2 Commercial challenges .....................................................................................................36
4.4.3 Social and cultural challenges...........................................................................................38
4.5 Success factors...........................................................................................................................39
4.5.1 Analysing the local context ...............................................................................................39
4.5.2 Aggregation in virtual power plants .................................................................................40
4.5.3 Micro grids: the final acheivement of the smart grid .......................................................42
5 Summary ............................................................................................................................................44
6 Conclusion ..........................................................................................................................................46
7 Appendix 1 – Network ancillary services ...........................................................................................47
8 References..........................................................................................................................................50
Technical report – 2012‐177 (RP‐TEC) 411‐ FLEXIN ‐ vii ‐ March 30, 2012
Technical report – 2012‐177 (RP‐TEC) 411‐ FLEXIN ‐ viii ‐ March 30, 2012
FIGURES
Figure 1: Overview of flexibility and resource needs [1] .............................................................................. 7
Figure 2: Integration of distributed energy resources, CanmetÉNERGIE, Varennes .................................... 9
Figure 3 : Block diagram of aggregated load control system for electric water heaters............................18
Figure 4: Balancing wind generation with water heaters...........................................................................20
Figure 5: Diversified profile of water heater power demand during load‐shedding (180 litre tank) .........22
Figure 6: Diversified profile of electricity demand by water heater with periods of load‐shedding (270
litres tank) ...................................................................................................................................................22
Figure 7: Balancing wind generation with electrical thermal systems .......................................................24
Figure 8: Ecogrid Project (Denmark) – Potential balancing resources .......................................................27
Figure 9: ENBALA – Regulation supply........................................................................................................28
Figure 10: Virtual Power Plants...................................................................................................................41
Figure 11: Vision smart home/smart grid in Ontario 2011 [83] .................................................................42
Figure 12: Spinning reserve of power plant and link to primary, secondary and tertiary reserves [85]....48
Figure 13: The spinning reserve of a power plant and its link with the primary, secondary and tertiary
reserves [84] ..............................................................................................................................................49
TABLES
Table 1 : Network services provided by DER and the goals.......................................................................... 5
Table 2: Simulated results of water heater load control for supplying ancillary grid services...................18
Table 3: Average power variation by water heater over six‐hour period ..................................................21
Table 4 : Power System ancillary services...................................................................................................47
Technical report – 2012‐177 (RP‐TEC) 411‐ FLEXIN ‐ 1 ‐ March 30, 2012
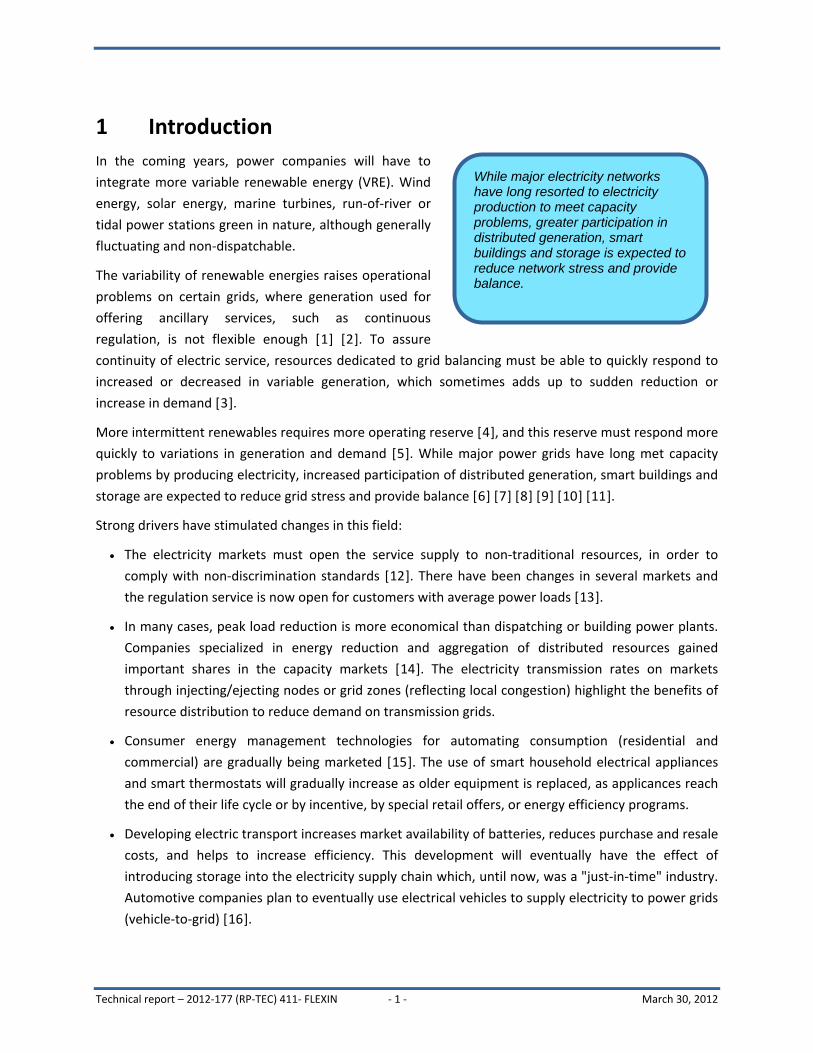
1 Introduction
In the coming years, power companies will have to
integrate more variable renewable energy (VRE). Wind
energy, solar energy, marine turbines, run‐of‐river or
tidal power stations green in nature, although generally
fluctuating and non‐dispatchable.
The variability of renewable energies raises operational
problems on certain grids, where generation used for
offering ancillary services, such as continuous
regulation, is not flexible enough [1] [2]. To assure
continuity of electric service, resources dedicated to grid balancing must be able to quickly respond to
increased or decreased in variable generation, which sometimes adds up to sudden reduction or
increase in demand [3].
More intermittent renewables requires more operating reserve [4], and this reserve must respond more
quickly to variations in generation and demand [5]. While major power grids have long met capacity
problems by producing electricity, increased participation of distributed generation, smart buildings and
storage are expected to reduce grid stress and provide balance [6] [7] [8] [9] [10] [11].
Strong drivers have stimulated changes in this field:
The electricity markets must open the service supply to non‐traditional resources, in order to
comply with non‐discrimination standards [12]. There have been changes in several markets and
the regulation service is now open for customers with average power loads [13].
In many cases, peak load reduction is more economical than dispatching or building power plants.
Companies specialized in energy reduction and aggregation of distributed resources gained
important shares in the capacity markets [14]. The electricity transmission rates on markets
through injecting/ejecting nodes or grid zones (reflecting local congestion) highlight the benefits of
resource distribution to reduce demand on transmission grids.
Consumer energy management technologies for automating consumption (residential and
commercial) are gradually being marketed [15]. The use of smart household electrical appliances
and smart thermostats will gradually increase as older equipment is replaced, as applicances reach
the end of their life cycle or by incentive, by special retail offers, or energy efficiency programs.
Developing electric transport increases market availability of batteries, reduces purchase and resale
costs, and helps to increase efficiency. This development will eventually have the effect of
introducing storage into the electricity supply chain which, until now, was a "just‐in‐time" industry.
Automotive companies plan to eventually use electrical vehicles to supply electricity to power grids
(vehicle‐to‐grid) [16].
While major electricity networks have long resorted to electricity production to meet capacity problems, greater participation in distributed generation, smart buildings and storage is expected to reduce network stress and provide balance.

Technical report – 2012‐177 (RP‐TEC) 411‐ FLEXIN ‐ 2 ‐ March 30, 2012
The development of smart electricity networks (smart grids) connects the customer with operators,
markets and energy service companies [17]. An "Energy internet" is under development to decarbonise
the grid, but also to improve its performance and reliability [18] [19] [20] [21] [22] [23].
This document will focus on the contribution of distributed energy resources (DER), including demand‐
side management (demand response), decentralized storage and production in order to balance the grid
and renewable energies. The generic terms “balancing” or “regulation” are used throughout the
document to facilitate reading. Appendix 1, at the end of this document, provides further details and
clarifies the concepts and services related to ancillary services used to balance the network.
In the first section, we present technical concepts, followed by a technical and scientific review of
notable demonstration projects and studies in the field. The last section focuses on issues related to DER
commercialization and adaptation of electricity markets.

Technical report – 2012‐177 (RP‐TEC) 411‐ FLEXIN ‐ 3 ‐ March 30, 2012
2 Smart grid and distributed energy resources presentation
The modernization of electricity grids toward a smart grid is being developed to improve reliability [24],
facilitate integration of renewable energies and electric vehicles, and improve power consumption
management. With the development of smart grid, more
distributed energy resources (DER) can be deployed, such as
batteries, decentralized production and technologies for
increasing customer demand‐side management.
The terms "distributed energy resources", "flexible loads" or
"flexible resources" will be used in this study. By distributed
or decentralized, we mean an equipment (load, production or
storage) connected to a distribution feeder or located on the
client side. By flexible, we mean the possibility that these
equipment are temporarily dedicated to directly1 supporting grid operation (by control) or indirectly (by
automation based on price or curtailement signal). The term “flexible load" refers specifically to an
equipment on the client side and managed by an operator or energy management system.
Here are some technologies which can be used for advanced management:
Electric water heaters, heat pumps, baseboard heaters and radiant floors;
Smart household electrical appliances;
Dual energy heating systems;
Combined cycle power plants and heating systems;
Air conditioning and ventilation systems;
Interior and exterior lighting;
Distributed generation (generating sets, fuel cells, run‐of river power plants, solar energy and wind
energy);
Storage by stationary batteries (one or several units in parallel) or mobile (battery‐driven vehicles);
and
Thermal storage of cold (ice floe or cold water) and heat (central and wall).
Some of the technologies presented here are underrepresented on the grid (e.g. stationary batteries
and electric vehicles) while others are already deployed on a large scale (e.g. electric water heaters, air‐
conditioning and heat pumps), but not intelligently joined to the grid.2
1 In a recent study by the US Department of Energy National Energy Technology Laboratory [10], the expression "demand dispatch" describes the use of the flexible loads in the operation of power grids. Demand dispatch translates the idea that in contrast to generation dispatch, currently used on the grid, load blocks would be programmed, following centralized scheduling or a bid, to absorb or release power. In Europe, the term "Pilotage de charge”(in French) is also used.
With the development of the smart grid, more distributed energy resources (DER) are deployed such as batteries, decentralized production and technologies for expanded customer demand-side management.

Technical report – 2012‐177 (RP‐TEC) 411‐ FLEXIN ‐ 4 ‐ March 30, 2012
Some low‐power technologies are more widespread in businesses and residences and are more
available. Other higher‐capacity equipment has limited availability during the year. Certain technologies
lend themselves to consumption management (start delay or shifting consumption), while the others
follow stricter operation schedules or, in other cases, it may be very inconvenient for users.
This grouping is slightly limited, since acting or not acting on normal equipment function depends just as
much on user preferences, incentives provided and the costs of smart integration, as on the technical
challenges. At various levels, information technologies can play a crucial leading role in aggregating
these resources and allowing their participation in integrated planning or market dynamics. Access to
these resources to support power grids implies the availability of a reliable, fast and secure
communications network.
2.1 Smart Grid support to DER integration
The use of electric or thermal storage, distributed generation or demand‐side management has been
extensively addressed in recent years [25] [26] [27] [28]. Numerous power companies already use
interruptible and standby loads for clients, to reduce network peak demands or supply emergency
reserve [29] [30].With the development of smart grids, the aim is
to automate the management, to use these resources for
providing markets with quick demand reduction, but also with
quick increases during surplus of energy production. Better load
management is anticipated, but essentially, smart grids enable
DER to provide ancillary services, a market so far reserved for
power plants. For example, maintaining network frequency could
eventually be carried out, in large proportion, by closely managing
demand [31] [32].
Flexible loads, distributed generation or storage can now provide a number of services. While
penetration is still limited, power markets now accept that non‐traditional resources are part of ancillary
services, such as regulation3 [33]. In these markets, a large industry or small resources aggregated
together could compete directly with power producers. To keep track of those programs, the ISO / RTO
Council maintains an inventory of existing demand‐side management programs in North America [13] in
which services are offered to wholesale electricity markets. As part of the information provided,
demand‐side management programs are classified by type of service (energy, regulation, reserve and
capacity). We note, however, that this list is only about wholesale market programs and does not
include programs launched by electricity distribution utilities or retailers to directly manage peak
customer demand or to provide emergency services during outages.
2 By "smart integration", we suggest that there should be information sharing between equipment, grid operator, the utility or
a company specialized in demand‐side management. 3 See Appendix 1 for more details on different ancillary services’ definitions and descriptions.
Essentially, smart grids enable DER to provide ancillary services, a market so far reserved for power plants
Technical report – 2012‐177 (RP‐TEC) 411‐ FLEXIN ‐ 5 ‐ March 30, 2012
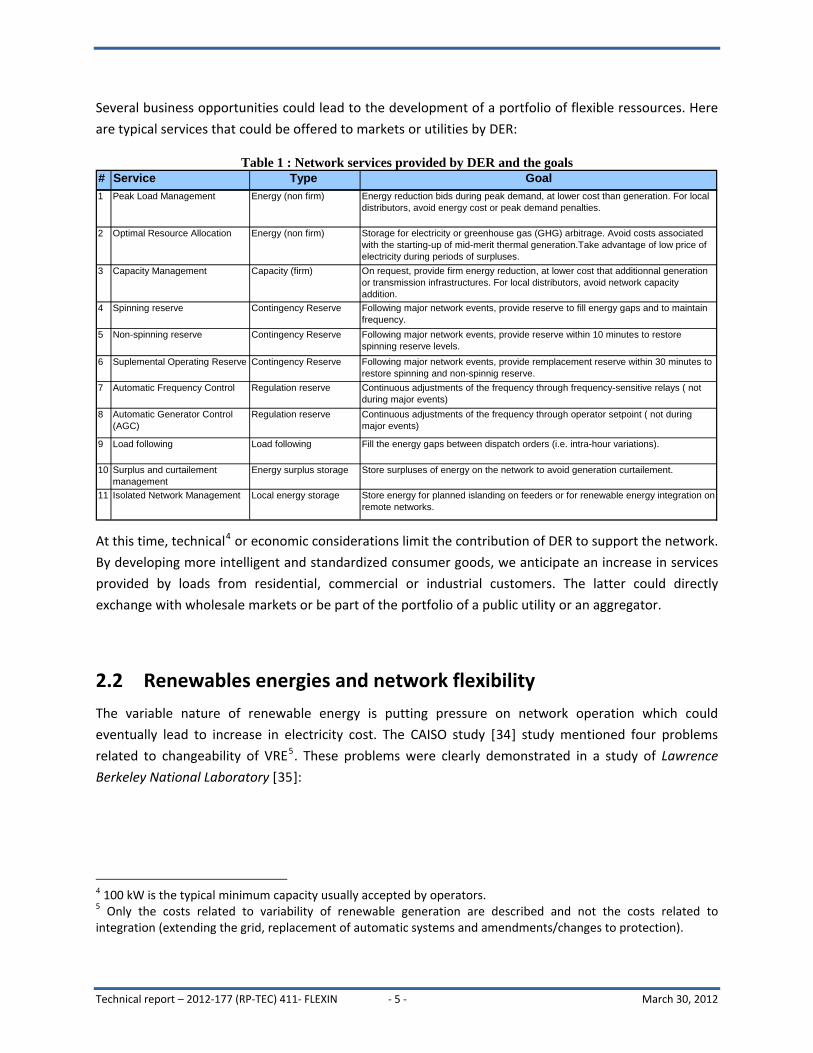
Several business opportunities could lead to the development of a portfolio of flexible ressources. Here
are typical services that could be offered to markets or utilities by DER:
Table 1 : Network services provided by DER and the goals # Service Type Goal
1 Peak Load Management Energy (non firm) Energy reduction bids during peak demand, at lower cost than generation. For local distributors, avoid energy cost or peak demand penalties.
2 Optimal Resource Allocation Energy (non firm) Storage for electricity or greenhouse gas (GHG) arbitrage. Avoid costs associated with the starting-up of mid-merit thermal generation.Take advantage of low price of electricity during periods of surpluses.
3 Capacity Management Capacity (firm) On request, provide firm energy reduction, at lower cost that additionnal generation or transmission infrastructures. For local distributors, avoid network capacity addition.
4 Spinning reserve Contingency Reserve Following major network events, provide reserve to fill energy gaps and to maintain frequency.
5 Non-spinning reserve Contingency Reserve Following major network events, provide reserve within 10 minutes to restore spinning reserve levels.
6 Suplemental Operating Reserve Contingency Reserve Following major network events, provide remplacement reserve within 30 minutes to restore spinning and non-spinnig reserve.
7 Automatic Frequency Control Regulation reserve Continuous adjustments of the frequency through frequency-sensitive relays ( not during major events)
8 Automatic Generator Control (AGC)
Regulation reserve Continuous adjustments of the frequency through operator setpoint ( not during major events)
9 Load following Load following Fill the energy gaps between dispatch orders (i.e. intra-hour variations).
10 Surplus and curtailement management
Energy surplus storage Store surpluses of energy on the network to avoid generation curtailement.
11 Isolated Network Management Local energy storage Store energy for planned islanding on feeders or for renewable energy integration on remote networks.
At this time, technical4 or economic considerations limit the contribution of DER to support the network.
By developing more intelligent and standardized consumer goods, we anticipate an increase in services
provided by loads from residential, commercial or industrial customers. The latter could directly
exchange with wholesale markets or be part of the portfolio of a public utility or an aggregator.
2.2 Renewables energies and network flexibility
The variable nature of renewable energy is putting pressure on network operation which could
eventually lead to increase in electricity cost. The CAISO study [34] study mentioned four problems
related to changeability of VRE5. These problems were clearly demonstrated in a study of Lawrence
Berkeley National Laboratory [35]:
4 100 kW is the typical minimum capacity usually accepted by operators. 5 Only the costs related to variability of renewable generation are described and not the costs related to integration (extending the grid, replacement of automatic systems and amendments/changes to protection).
Technical report – 2012‐177 (RP‐TEC) 411‐ FLEXIN ‐ 6 ‐ March 30, 2012
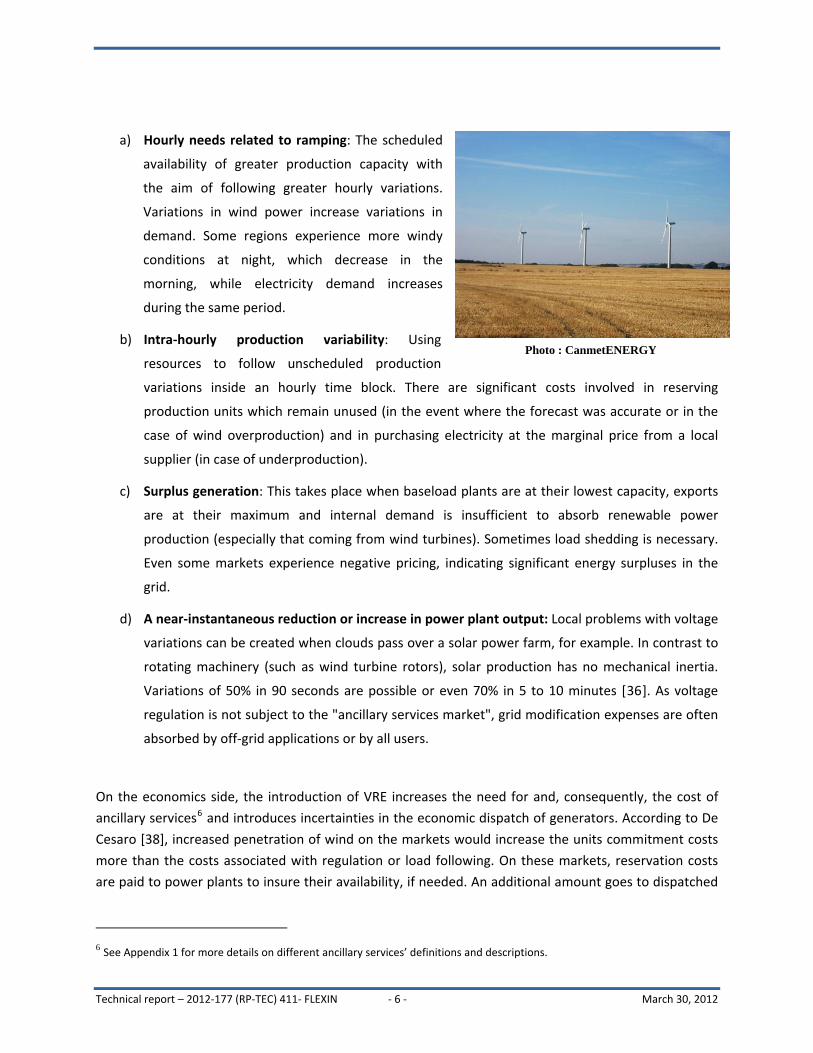
a) Hourly needs related to ramping: The scheduled
availability of greater production capacity with
the aim of following greater hourly variations.
Variations in wind power increase variations in
demand. Some regions experience more windy
conditions at night, which decrease in the
morning, while electricity demand increases
during the same period.
b) Intra‐hourly production variability: Using
resources to follow unscheduled production
variations inside an hourly time block. There are significant costs involved in reserving
production units which remain unused (in the event where the forecast was accurate or in the
case of wind overproduction) and in purchasing electricity at the marginal price from a local
supplier (in case of underproduction).
c) Surplus generation: This takes place when baseload plants are at their lowest capacity, exports
are at their maximum and internal demand is insufficient to absorb renewable power
production (especially that coming from wind turbines). Sometimes load shedding is necessary.
Even some markets experience negative pricing, indicating significant energy surpluses in the
grid.
d) A near‐instantaneous reduction or increase in power plant output: Local problems with voltage
variations can be created when clouds pass over a solar power farm, for example. In contrast to
rotating machinery (such as wind turbine rotors), solar production has no mechanical inertia.
Variations of 50% in 90 seconds are possible or even 70% in 5 to 10 minutes [36]. As voltage
regulation is not subject to the "ancillary services market", grid modification expenses are often
absorbed by off‐grid applications or by all users.
On the economics side, the introduction of VRE increases the need for and, consequently, the cost of
ancillary services6 and introduces incertainties in the economic dispatch of generators. According to De
Cesaro [38], increased penetration of wind on the markets would increase the units commitment costs
more than the costs associated with regulation or load following. On these markets, reservation costs
are paid to power plants to insure their availability, if needed. An additional amount goes to dispatched
6 See Appendix 1 for more details on different ancillary services’ definitions and descriptions.
Photo : CanmetENERGY
power plants. The cost is often high, as it is frequently determined by the marginal cost of electricity on
the real‐time market, reflecting actual start‐up costs of the last available economical power plant. On
transmission networks, these additional wind energy costs are sometimes absorbed by all grid users or
wind farm owners. If no market exists, grid operators with an available cyclable generating fleet may
require payments for balancing services. For distributors offering this service, the amount required takes
into account opportunity costs associated with maintaining a captive load reserve for balancing.
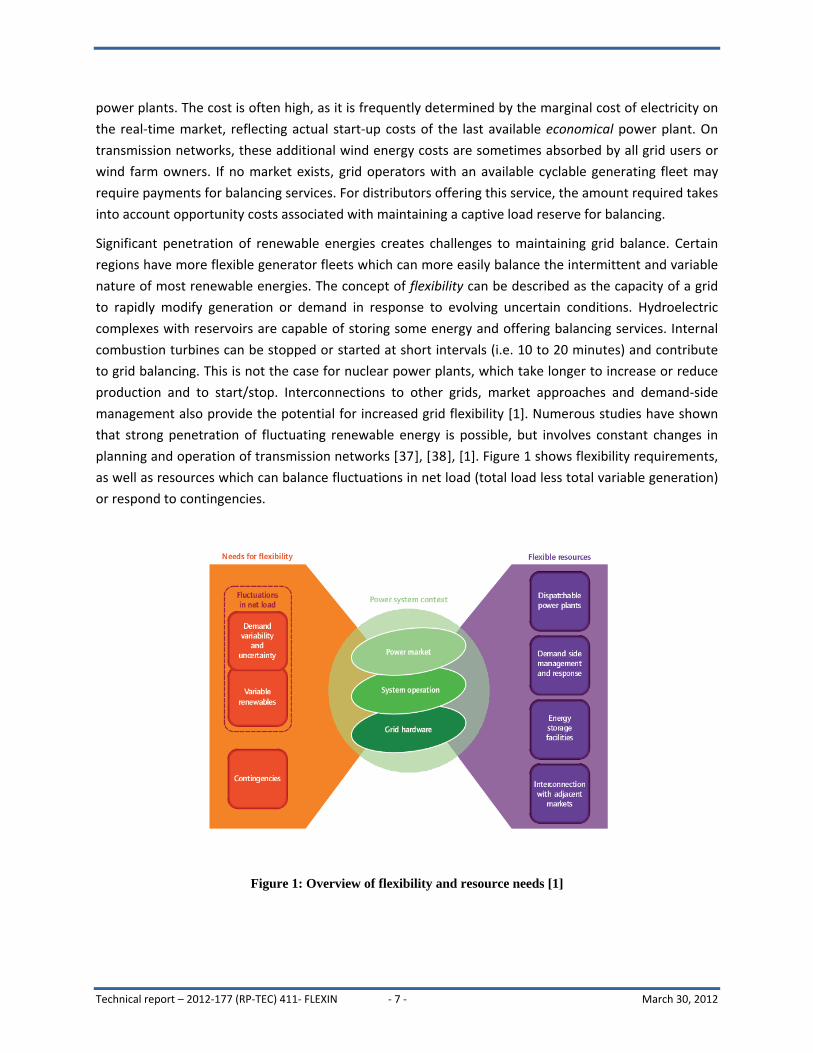
Significant penetration of renewable energies creates challenges to maintaining grid balance. Certain
regions have more flexible generator fleets which can more easily balance the intermittent and variable
nature of most renewable energies. The concept of flexibility can be described as the capacity of a grid
to rapidly modify generation or demand in response to evolving uncertain conditions. Hydroelectric
complexes with reservoirs are capable of storing some energy and offering balancing services. Internal
combustion turbines can be stopped or started at short intervals (i.e. 10 to 20 minutes) and contribute
to grid balancing. This is not the case for nuclear power plants, which take longer to increase or reduce
production and to start/stop. Interconnections to other grids, market approaches and demand‐side
management also provide the potential for increased grid flexibility [1]. Numerous studies have shown
that strong penetration of fluctuating renewable energy is possible, but involves constant changes in
planning and operation of transmission networks [37], [38], [1]. Figure 1 shows flexibility requirements,
as well as resources which can balance fluctuations in net load (total load less total variable generation)
or respond to contingencies.
Figure 1: Overview of flexibility and resource needs [1]
Technical report – 2012‐177 (RP‐TEC) 411‐ FLEXIN ‐ 7 ‐ March 30, 2012

Technical report – 2012‐177 (RP‐TEC) 411‐ FLEXIN ‐ 8 ‐ March 30, 2012
As seen in this illustration, DER such as demand‐side management, storage, as well as certain types of
distributed generators can contribute to increased grid flexibility. However, using DER to support the
networks would require addressing small load aggregation, small generation, storage and their
integration on the grid and on the markets.
2.3 DER Aggregation
Integration of DER poses a number of challenges. Technically,
distributed resources have less power, are numerous and their
behaviour is variable and not completely characterized. For
operators so far, these resources have been mainly invisible and
unmanageable. Integrating these resources into electricity
markets creates other challenges. Markets require a certain
volume, minimal power with appropriate telemetry, which are
not widespread on the distribution network or on the client side.
To fill this need, a new actor is introduced on electricity markets: the aggregator7. This type of business
offers energy services to network operators or public utilities by using the flexible loads or generators
located on commercial or industrial premises. For the moment, this market is relatively closed to the
residential sector or to small commercials. Moreover, network services to be offered by the later are
limited or inexistent in many regions.
Considering the current trend in the industry, which appears to be encouraging energy management
technology deployments in buildings, on the one hand, and, on the other hand, the greater market
openness, those businesses should likely play a greater role in the future. A futurist vision of the load
aggregation business justifies the growing interest of research for virtual power plant and microgrids
paradigms. As seen in Figure 2:
A virtual power plant aims to integrate a set of distributed resources to supply energy and/or
ancillary services to the grid. When taken individually, these low‐power resources have limited
impact. Together, however, these distributed resources can provide energy and services
comparable to power plants. The physical location of these resources is not a determining factor, as
it is with a microgrid (see below), where voltage and frequency regulation are tightly coupled to the
microgrid topology and physical location of resources.
The resources distributed in a microgrid insure electric service (partial or total) during main grid
breakdowns. The resources must be nearby, connected to the same power station or distribution
line. The microgrid controller must substitute itself for the main grid operator to maintain the
frequency and voltage during scheduled and inadvertent islanding.
7 Sometime called Curtailement Service Providers (CSP)
Using distributed resources to support the transmission or distribution networks would require addressing small load aggregation, small generation, storage and their integration on the grid and on the markets.

Figure 2: Integration of distributed energy resources, CanmetENERGY, Varennes
2.4 Benefits of distributed energy resources
Depending on the smart grid technologies deployed in a microgrid or used in a virtual power plant, the
use of these resources can reduce energy consumption, peak demand and other needs for associated
with network balancing. These new approaches of integrating distributed resources would maintain
continuous supply, meet economic and environmental considerations, and improve energy security for
communities. Here are some examples of applications of distributed energy resources integrated into
electricity grids. Demonstration project examples are drawn from Canadian projects in the field.
Reducing peak load
Grid use during the year depends mostly on customer consumption characteristics. The grid is used at its
full capacity only a hundred of hours per year. Increasing peak load requires more generation,
transmission and distribution capacity and induces additional operation and maintenance costs. This
increase also requires increased contingency and balancing reserves to mitigate losses on transmission
and distribution grids during peak load.
Shifts in consumption, use of thermal storage or batteries as well as firm and decentralized electricity
generation can reduce grid stress and avoid costs associated with power increase on the whole supply
Technical report – 2012‐177 (RP‐TEC) 411‐ FLEXIN ‐ 9 ‐ March 30, 2012

chain. They also allow supply, transmission and distribution companies to postpone investments in
increased capacity. For residential, commercial or industrial customers, peak load reduction reduces
their electricity bill if an incentive supports demand modulation in time (e.g. time‐of‐use tariffs, peak
demand charge, real‐time rates, critical period pricing, etc.). Automated demand management, fed by
market prices, can help coordinate load reduction for customers and on the grid [39]. On the markets,
capacity thus generated or self‐generated in distribution can be sold on capacity markets, by electric
utilities or other companies specialized in peak management, i.e. aggregators.
Avoid commissioning costly or polluting power plants
Sometimes, it is necessary to commission power plants to supply electricity for short periods or to meet
demand fluctuations. These plants can be more expensive to operate than power plants offering
baseload production. They are often fed by fossil fuels, such as diesel, fuel oil or natural gas. Certain coal
plants are also used for a few hours per year. Load management can help avoid greenhouse gas
emissions linked to commissioning peak‐load generating stations [40].
Increase reserves to facilitate integration of intermittent renewables
Several major power grids do not have enough "flexible resources" to offset significant capacity
fluctuations in wind generation or other types of variable generation. Several operators are considering
available flexible loads and storage resources, in order to increase the supply of reserve resources to be
allocated to follow variable generation or act on contingencies. It is the subject of several demonstration
projects, like the ongoing project PowerShift Atlantic in the Maritime Provinces.
Technical report – 2012‐177 (RP‐TEC) 411‐ FLEXIN ‐ 10 ‐ March 30, 2012
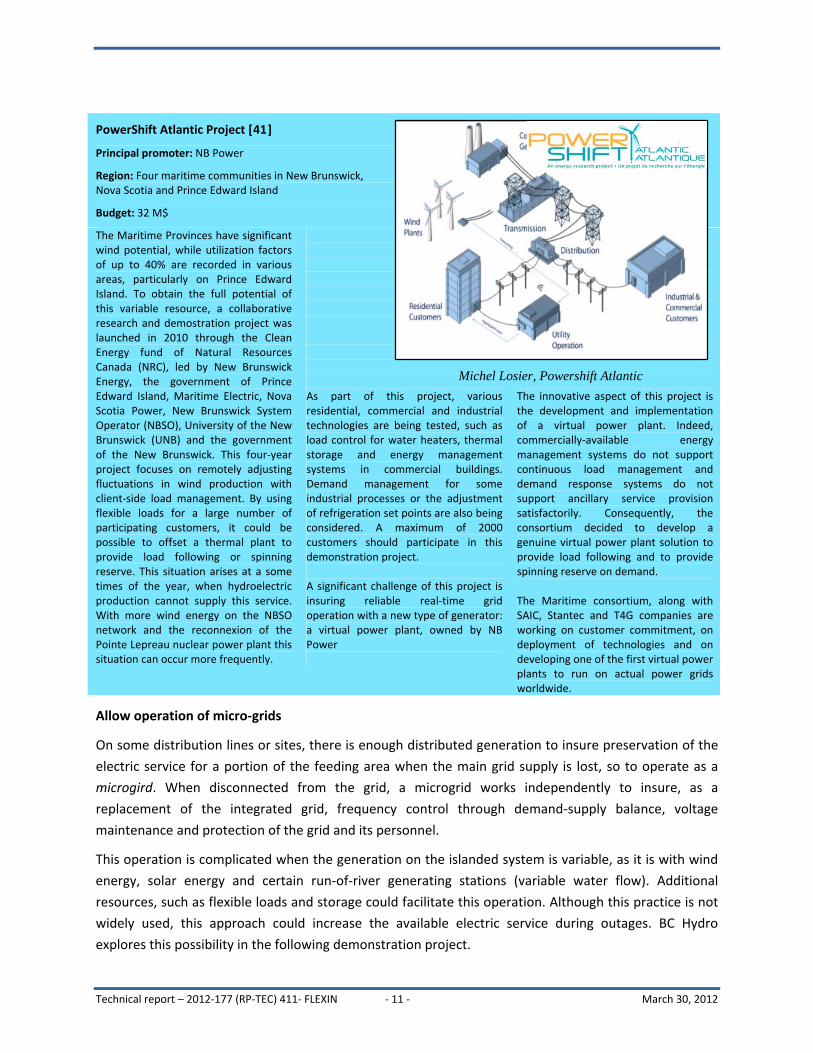
PowerShift Atlantic Project [41]
Principal promoter: NB Power
Region: Four maritime communities in New Brunswick, Nova Scotia and Prince Edward Island
Budget: 32 M$
The Maritime Provinces have significant wind potential, while utilization factors of up to 40% are recorded in various areas, particularly on Prince Edward Island. To obtain the full potential of this variable resource, a collaborative research and demostration project was launched in 2010 through the Clean Energy fund of Natural Resources Canada (NRC), led by New Brunswick Energy, the government of Prince Edward Island, Maritime Electric, Nova Scotia Power, New Brunswick System Operator (NBSO), University of the New Brunswick (UNB) and the government of the New Brunswick. This four‐year project focuses on remotely adjusting fluctuations in wind production with client‐side load management. By using flexible loads for a large number of participating customers, it could be possible to offset a thermal plant to provide load following or spinning reserve. This situation arises at a some times of the year, when hydroelectric production cannot supply this service. With more wind energy on the NBSO network and the reconnexion of the Pointe Lepreau nuclear power plant this situation can occur more frequently.
As part of this project, various residential, commercial and industrial technologies are being tested, such as load control for water heaters, thermal storage and energy management systems in commercial buildings. Demand management for some industrial processes or the adjustment of refrigeration set points are also being considered. A maximum of 2000 customers should participate in this demonstration project. A significant challenge of this project is insuring reliable real‐time grid operation with a new type of generator: a virtual power plant, owned by NB Power
The innovative aspect of this project is the development and implementation of a virtual power plant. Indeed, commercially‐available energy management systems do not support continuous load management and demand response systems do not support ancillary service provision satisfactorily. Consequently, the consortium decided to develop a genuine virtual power plant solution to provide load following and to provide spinning reserve on demand. The Maritime consortium, along with SAIC, Stantec and T4G companies are working on customer commitment, on deployment of technologies and on developing one of the first virtual power plants to run on actual power grids worldwide.
Michel Losier, Powershift Atlantic
Allow operation of micro‐grids
On some distribution lines or sites, there is enough distributed generation to insure preservation of the
electric service for a portion of the feeding area when the main grid supply is lost, so to operate as a
microgird. When disconnected from the grid, a microgrid works independently to insure, as a
replacement of the integrated grid, frequency control through demand‐supply balance, voltage
maintenance and protection of the grid and its personnel.
This operation is complicated when the generation on the islanded system is variable, as it is with wind
energy, solar energy and certain run‐of‐river generating stations (variable water flow). Additional
resources, such as flexible loads and storage could facilitate this operation. Although this practice is not
widely used, this approach could increase the available electric service during outages. BC Hydro
explores this possibility in the following demonstration project.
Technical report – 2012‐177 (RP‐TEC) 411‐ FLEXIN ‐ 11 ‐ March 30, 2012
Technical report – 2012‐177 (RP‐TEC) 411‐ FLEXIN ‐ 12 ‐ March 30, 2012
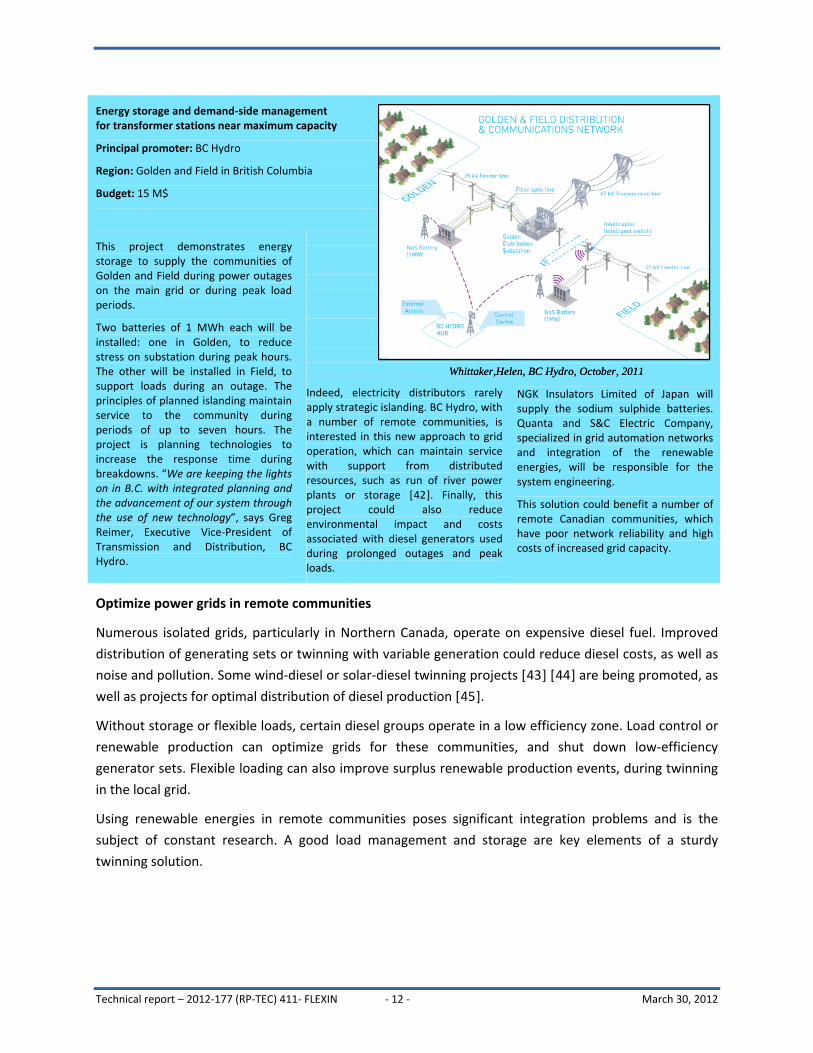
Energy storage and demand‐side management for transformer stations near maximum capacity
Principal promoter: BC Hydro
Region: Golden and Field in British Columbia
Budget: 15 M$
This project demonstrates energy storage to supply the communities of Golden and Field during power outages on the main grid or during peak load periods.
Two batteries of 1 MWh each will be installed: one in Golden, to reduce stress on substation during peak hours. The other will be installed in Field, to support loads during an outage. The principles of planned islanding maintain service to the community during periods of up to seven hours. The project is planning technologies to increase the response time during breakdowns. “We are keeping the lights on in B.C. with integrated planning and the advancement of our system through the use of new technology”, says Greg Reimer, Executive Vice‐President of Transmission and Distribution, BC Hydro.
Indeed, electricity distributors rarely apply strategic islanding. BC Hydro, with a number of remote communities, is interested in this new approach to grid operation, which can maintain service with support from distributed resources, such as run of river power plants or storage [42]. Finally, this project could also reduce environmental impact and costs associated with diesel generators used during prolonged outages and peak loads.
NGK Insulators Limited of Japan will supply the sodium sulphide batteries. Quanta and S&C Electric Company, specialized in grid automation networks and integration of the renewable energies, will be responsible for the system engineering.
This solution could benefit a number of remote Canadian communities, which have poor network reliability and high costs of increased grid capacity.
Optimize power grids in remote communities
Numerous isolated grids, particularly in Northern Canada, operate on expensive diesel fuel. Improved
distribution of generating sets or twinning with variable generation could reduce diesel costs, as well as
noise and pollution. Some wind‐diesel or solar‐diesel twinning projects [43] [44] are being promoted, as
well as projects for optimal distribution of diesel production [45].
Without storage or flexible loads, certain diesel groups operate in a low efficiency zone. Load control or
renewable production can optimize grids for these communities, and shut down low‐efficiency
generator sets. Flexible loading can also improve surplus renewable production events, during twinning
in the local grid.
Using renewable energies in remote communities poses significant integration problems and is the
subject of constant research. A good load management and storage are key elements of a sturdy
twinning solution.
Whittaker,Helen, BC Hydro, October, 2011Whittaker,Helen, BC Hydro, October, 2011
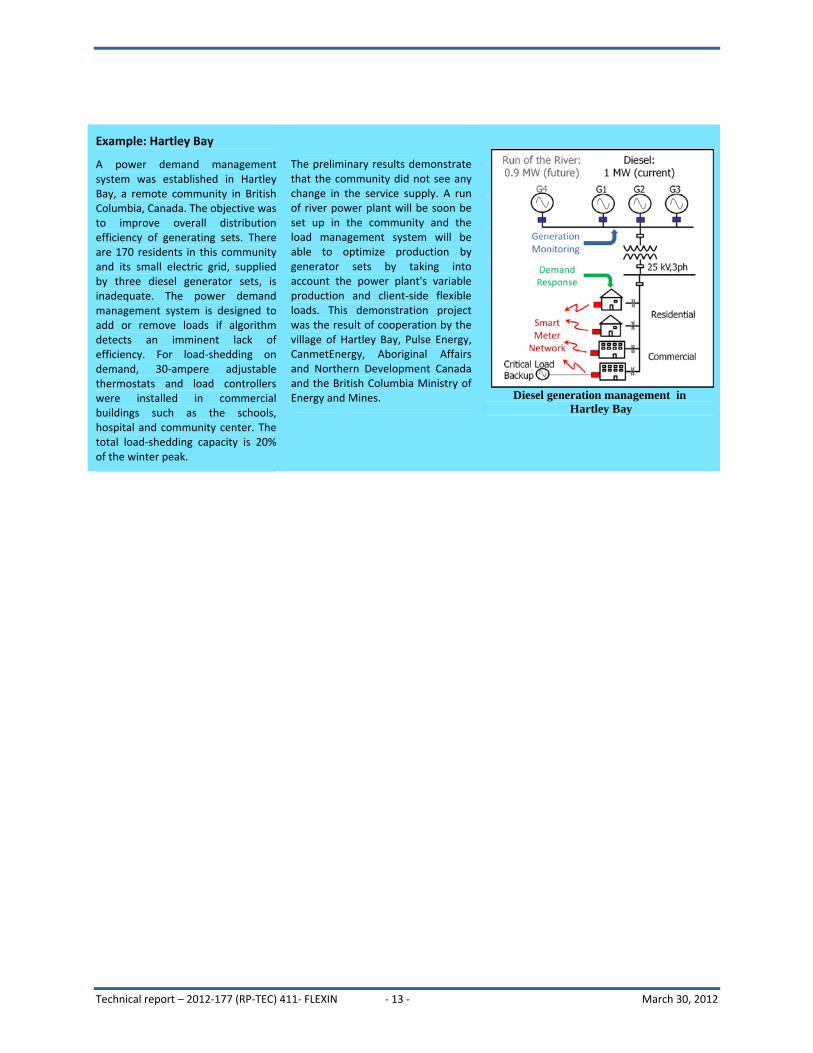
Example: Hartley Bay
A power demand management system was established in Hartley Bay, a remote community in British Columbia, Canada. The objective was to improve overall distribution efficiency of generating sets. There are 170 residents in this community and its small electric grid, supplied by three diesel generator sets, is inadequate. The power demand management system is designed to add or remove loads if algorithm detects an imminent lack of efficiency. For load‐shedding on demand, 30‐ampere adjustable thermostats and load controllers were installed in commercial buildings such as the schools, hospital and community center. The total load‐shedding capacity is 20% of the winter peak.
The preliminary results demonstrate that the community did not see any change in the service supply. A run of river power plant will be soon be set up in the community and the load management system will be able to optimize production by generator sets by taking into account the power plant's variable production and client‐side flexible loads. This demonstration project was the result of cooperation by the village of Hartley Bay, Pulse Energy, CanmetEnergy, Aboriginal Affairs and Northern Development Canada and the British Columbia Ministry of Energy and Mines.
Diesel generation management in
Hartley Bay
Technical report – 2012‐177 (RP‐TEC) 411‐ FLEXIN ‐ 13 ‐ March 30, 2012
Technical report – 2012‐177 (RP‐TEC) 411‐ FLEXIN ‐ 14 ‐ March 30, 2012
3 Technical and scientific review
By presenting studies and results of demonstration projects, this section aims at highlighting the range
of non‐traditional, i.e. non‐central generation‐based, technologies which can be used to assist with
balancing renewable energies. Sixteen (16) studies and projects aiming at supplying different services to
the grid are summarized. The technologies are in the residential, commercial, municipal and
transportation sectors. These examples are gathered around load types and more information about the
publication/demonstration title, a summary, and the services provided8 are presented.
3.1 Residential – Air conditioning
#1 – Title: D. S. Callaway, “Tapping the Energy Storage Potential in Electric Loads to Deliver Load
Following and Regulation, with Application to Wind Energy” [46]
Network service: Automatic Generation Control (AGC) and Load Following
Callaway (2009), shows that a population of thermostatically controlled loads (TCL) can be managed to
serve as virtual storage to follow generation variability in renewable electricity generators or variation in
demand from other loads. Although some TCL are capable of continuously modulating demand for
heating or air‐conditioning demand, they normally have a single setting (set point) which activates the
equipment to maintain a temperature range (deadband).
This article focuses on how small thermostat set point manipulations can turn on and off only the TCL
nearing the upper or lower limits of thermostat deadbands. This approach would regulate power, with
minimal deviation between the original thermostat set points, avoiding conflicts with customer comfort.
While monitoring the status of thermostats (temperature and power demand) for an entire load
population, the method presented in this article is based on the fact that, although it would be
challenging to track the status (i.e. temperature and power demand) of every load in a population
subject to control, it is possible to accurately estimate the probability that each load in the population is
in a given state.
The method proposed was tested by simulating thermal building properties and their AC needs as well
as data from a wind power plant. The 1‐minute actual wind power data was collected by the National
Renewable Energy Laboratory and result from a large wind power plant near Lake Benton, Minnesota.
(138 wind turbines of 750 kW each). Average thermal properties from other scientific articles were used
to simulate 60,000 loads.
These simulations showed that major changes in demand can be achieved without significantly changing
the TCL set points. Consequently, regulation service can be provided to offset supply or demand changes
without compromising the end‐use function of the loads subject to control.
8 See Appendix 1 for more details on the differents ancillary services
In the simulation, every thermostatically controlled load (60,000 in total) supplied the energy and power
equivalent to 0.5 kWh and 0.75 kW storage units.
In the case study, approximately each MW of wind power required a 3.4 MW to balance in order to
reduce error between the forecast and actual demand to its minimum. During the simulations, the
maximum deviation of the temperature set point never exceeded 0.1°, suggesting that this type of
management would not compromise customer comfort.
Other conclusions:
The magnitude of load population response to a small change in thermostat set point is a function
solely of the size of the set point change and the width of the thermostat deadbands of the
population under control. Smaller thermostat deadbands provide larger responses to set point
changes.
Load populations with more heterogeneity (diverse load profiles) are better candidates for this
control method. It is in direct contrast to previous direct load control studies, which have been
forced to consider homogeneous load groups.
Load populations with lower thermal capacity are better candidates for this control method, when
the need to increase and reduce consumption is equally important (regulation service).
#2 – Title: J. H. Eto, Lawrence Berkeley National Laboratory, “Demand Response Spinning Reserve
Demonstration – Phase 2 Findings from the Summer of 2008” [47]
Network Service: Spinning Reserve
This study by Lawrence Berkeley National Laboratory (2009) and previous works [48] shows that using
air‐conditioning load control as rotating reserve, instead of peak management programs, can triple load
reduction. We suggest that the full air‐conditioning load can be completely interrupted during a major
grid event.
Although air conditioners are not available to supply rotating reserve year round, their availability highly
correlates to grid demands and the cost of contingency reserve. In fact, the costs of energy and ancillary
services increase when air conditioning demand increases.
This study shows a close correlation between errors in short term energy demand and the contingency
reserve: when air conditioning loads increase, so does the need for available reserve, showing a major
advantage in using air conditioners to supply contingency reserve. If the current demand forecast is in
error and underestimates the current load, the grid operator must commission additional power plants
to handle the load. By using air‐conditioners instead of generation to provide reserve, generation can be
saved for electricity supply rather than for providing ancillary services.
Several ways demand management programs can manage air‐conditioners. They can be interrupted (or
cycled) for several minutes by controlling their supply. A contactor can interrupt the compressor; the
compressor motor uses about 80 to 90% of the air conditioner's total power [49].
Technical report – 2012‐177 (RP‐TEC) 411‐ FLEXIN ‐ 15 ‐ March 30, 2012
3.2 Residential – Household appliances
#3 –Title: Intelligent Energy Europe, “Smart Domestic Appliances in Sustainable Energy
Systems (Smart-A)” [50]
Network Service: Surplus and curtailement management
The study by Intelligent Energy Europe (2009) estimated the potential contribution of smart household
electrical appliances to balancing European electricity grids. The study included the following appliances:
air conditioners, circulation pumps for heating, dishwashers, thermal accumulators, freezers,
refrigerators, ovens, stoves, dryers, electric water heaters and washing machines.
First, the study compiled information on the hourly use profile and operating procedures of these
devices through Europe, using studies and available data. According to the average daily profile,
electricity demand at minimum load is, at most, between 200 and 850 W. The contribution of electric
heating, used occasionally or only in certain regions is not presented, even though this equipment uses
considerable power.
Afterward, the equipment was sorted by two management approaches: change in start‐up time (smart
timing of appliance cycles) and temporary interruption (interruptions of appliance cycles). In the first
case, the user sets both the start‐up time and the latest time at which the operation must be finished.
Washer and dryer use can be postponed by 3 to 6 hours, dishwashers from 3 to 8 hours, and
refrigerators/freezers from 15 to 30 minutes and other appliances from 15 minutes to one hour.
In the second case, for some electrical appliances, the cycle can be temporarily interrupted for a certain
length of time and under certain conditions. However, this is not suitable for all appliances. Washing
machines could be interrupted for 15 minutes, dryers for 30 minutes, dishwashers for 15 minutes,
refrigerator / freezer for 15 minutes and other appliances for 5 minutes.
Every appliance was qualitatively evaluated with four criteria: appliance power (specific load during
operation), availability (availability), flexibility of load to be shifted (shifting flexibility) and customer
acceptance (convenience for consumers).
These results were applied according to a grouping of five European regions, consisting of countries
exchanging electricity generation and balancing service between them. A "flexible" capacity was
estimated between 100 kW and 150 kW for 1000 residential customers (100 W to 150 W per customer).
Results: Demand‐side management options in the residential sector can reduce wind production load‐
shedding by 50% during periods of reduced power demand. Furthermore, using these appliances could
reduce fossil fuel demand for European grids by 4.5% [50].
It is worth noting that peak load management, with automatic timers installed on water heaters, is
already widespread in Europe. This reduces the balancing potential of wind power:
Technical report – 2012‐177 (RP‐TEC) 411‐ FLEXIN ‐ 16 ‐ March 30, 2012

Technical report – 2012‐177 (RP‐TEC) 411‐ FLEXIN ‐ 17 ‐ March 30, 2012
“As a result of this assessment, it is no surprise that the most interesting options for load management,
electric storage heating and water heaters are those appliances which are already exploited for load
management, typically based on a static night tariff operation.”[50]
The conclusions from the Smart‐A study regarding other equipment:
Customers accept the idea of delaying use of dishwashers for long periods. However, these
appliances are not widely available;
Cold‐generating appliances, such as refrigerators and freezers, can be fully automated. However,
these are low‐energy appliances and their use can only be delayed by a few minutes;
Washing machines and dryers are interesting options, but require more user interaction. The
dryer's heating element be more useful in emergency situations, such as load‐shedding to restore
grid stability;
Stovetops are not suitable for this type of load management;
Air conditioners and circulation pumps are not suitable for this type of management.9
3.3 Residential‐Water heating
#4 – Title: L. Paull, H. Li & L. Chang, “A Novel Domestic Electric Water Heater Model for a Multi‐
objective Demand‐side Management Program” [51]
Network Service: Load Following and Spinning Reserve
The study by Paull et al. (2010) is part of the Project
PowerShift Atlantic project [41]. Researchers at University of
New Brunswick (UNB) developed a platform for aggregation
and management of electric water heaters in order to supply
ancillary services.
Because of their thermal storage capacity, water heaters have
the capacity for up‐regulation or down‐regulation when
integrated with a virtual power plant. The aggregated water heater loads are distributed to supply
ancillary services or reduce peak load with no effect on the customer consumption profile. The thermal
status of every water heater is estimated using available data from smart electricity meters or other
ensors.
s
9 In the context of the study (surplus management)
Photo CanmetENERGY
Technical report – 2012‐177 (RP‐TEC) 411‐ FLEXIN ‐ 18 ‐ March 30, 2012
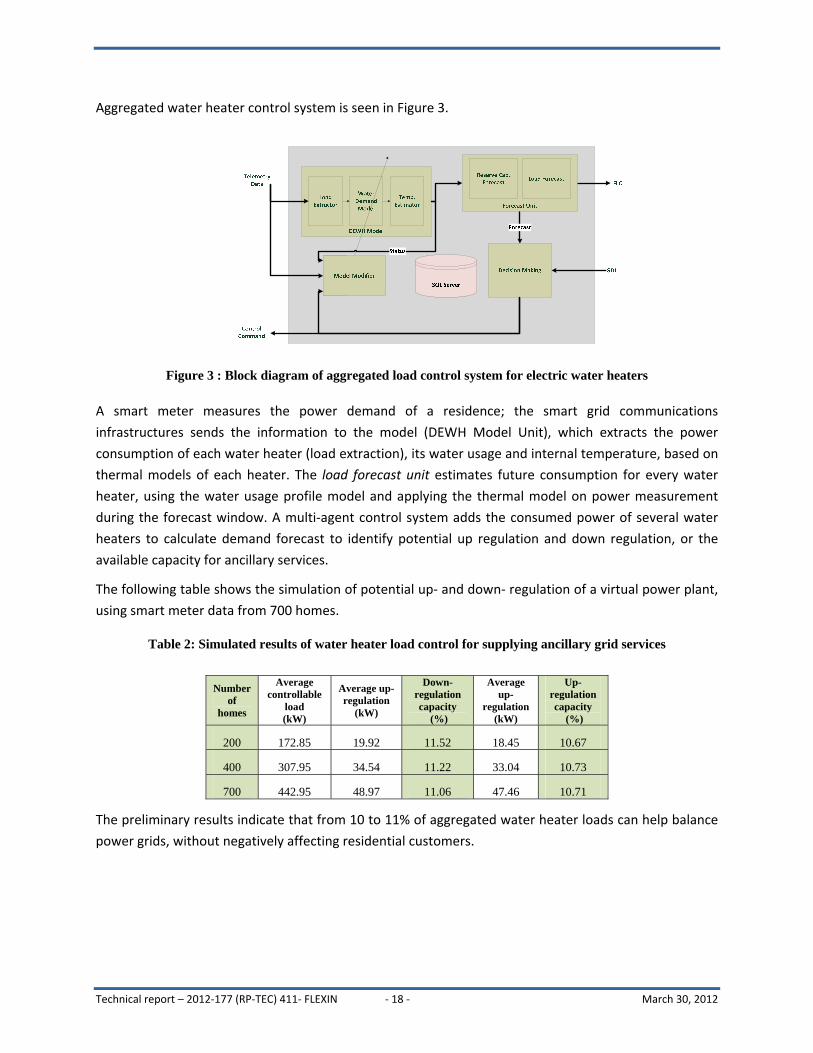
Aggregated water heater control system is seen in Figure 3.
o identify potential up regulation and down regulation, or the
of potential up‐ and down‐ regulation of a virtual power plant,
using sm
Table 2: Simulated results of water heater load co l for suppl ancilla grid services
Figure 3 : Block diagram of aggregated load control system for electric water heaters
A smart meter measures the power demand of a residence; the smart grid communications
infrastructures sends the information to the model (DEWH Model Unit), which extracts the power
consumption of each water heater (load extraction), its water usage and internal temperature, based on
thermal models of each heater. The load forecast unit estimates future consumption for every water
heater, using the water usage profile model and applying the thermal model on power measurement
during the forecast window. A multi‐agent control system adds the consumed power of several water
heaters to calculate demand forecast t
available capacity for ancillary services.
The following table shows the simulation
art meter data from 700 homes.
ntro ying ry
Number of
h
Average controllable
Average up-regulation
omes load (kW)
(kW)
Down-regulation capacity
(%)
Average up-
regulation (kW)
Up-regulation capacity
(%)
200 172.85 19.92 11.52 18.45 10.67
400 307.95 34.54 11.22 33.04 10.73
700 442.95 48.97 11.06 47.46 10.71
The preliminary results indicate that from 10 to 11% of aggregated water heater loads can help balance
ower grids, without negatively affecting residential customers.
p
#5 – Title: J. Kondoh, N. Lu & D. J. Hammerstrom, “An Evaluation of the Water Heater Load Potential
for Providing Regulation Service” [52].
Network Service: Automatic Generation Control (AGC)
Kondoh et al. (2011) estimated the potential of using water heaters to supply regulation service to
power grids. In this study, the authors characterized the thermal behaviour of a typical water heater, the
water usage profile and monitoring of a typical control population. With this model, they developed a
direct control for the bottom element of the heater (which has two heating elements), not the entire
heater. According to this algorithm, each water heater receives a set point every minute.
The conclusion of this study is that, according to the proposed approach, approximately 33,000 water
heaters are needed to provide a 2‐MW regulation service 24 hours a day. However, if water heaters only
provide regulation from 6:00 to 24:00, approximately 20,000 will be needed.
#6 – Title: P. Steffes, “Grid‐Interactive Renewable Water Heating Analysis of the Economic and
Environmental Value” [53].
Network Service: Optimal Resource Allocation
An analysis by the Steffes Company (2010) shows the environmental and economic value of using water
heaters to balance renewable energies.
The authors used wind generation and market data to analyze balancing needs and determine the
potential for load usage. They compared the consumption curves for interactive water heaters with
market price data.
In this study, a 105‐gallon water heater (approximately 400 litres) represents the equivalent of a 26 kWh
battery (about the quantity of energy accumulated in warm water). The analysis concludes that it is
possible to reduce the operating cost of a water heater by 50% using electricity only off‐peak and only
when there is wind production. According to this hypothesis, 25% of the energy consumed for heating
water would be simultaneous with wind generation could come exclusively from wind generation.
#7 – Title: M.‐A. Moffet, F. Sirois and D. Beauvais, École Polytechnique de Montréal et
CanmetÉNERGIE, « Études de cas: Équilibrage de la production éolienne à l’aide d’accumulateurs
thermiques et de chauffe‐eau électriques » "Balancing wind generation with thermal storage and
electric water heaters" [54]
Network Service: Optimal Resource Allocation
Moffet et al. (2012) present a case for using electric water heaters and thermal storage to balance wind
generation. The case study specifically targets use of these resources in order to provide balancing for
time horizons of six hours. The chosen time horizon offsets balancing problems issuing from daily cycles,
Technical report – 2012‐177 (RP‐TEC) 411‐ FLEXIN ‐ 19 ‐ March 30, 2012
or costs associated with optimal allocation of generation resources (unit commitment) and the
environmental problems related to using intermediate power plants for only several hours.
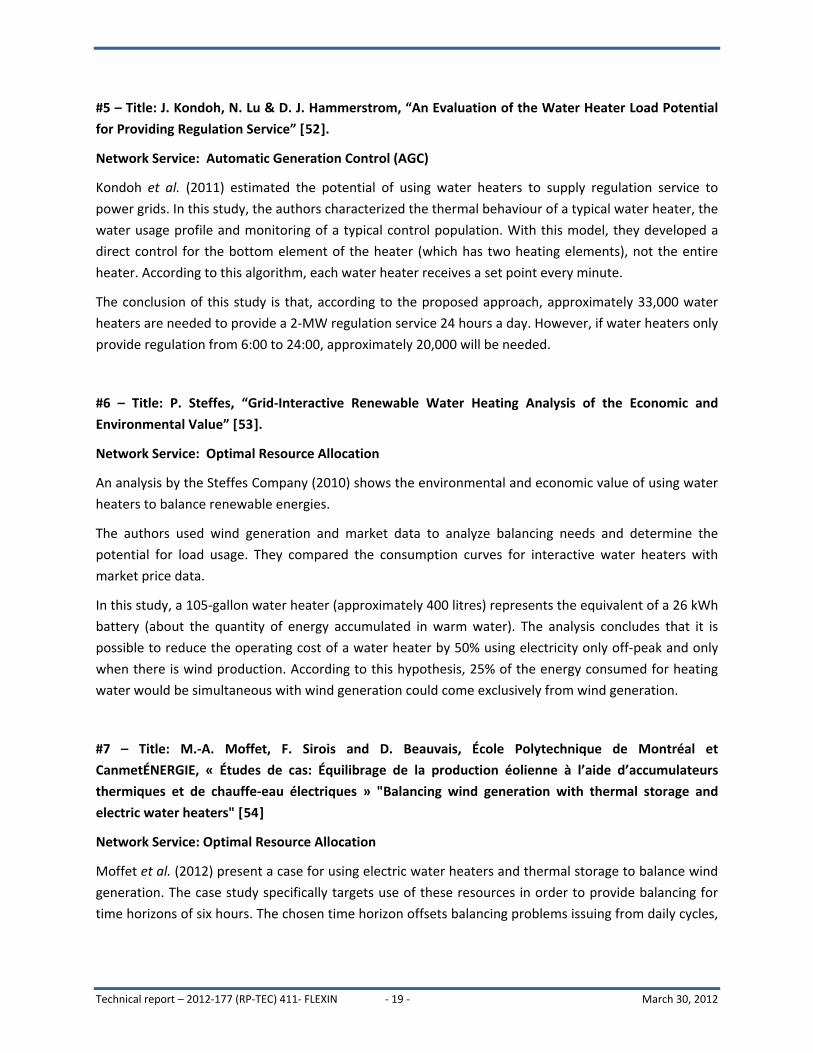
The study applied current wind generation data from Ontario’s Independent Electricity System Operator
(IESO) website, using data from a one‐week period, during which a noticeable increase and decrease in
wind generation was recorded. It applies a moving average of six hours (three hours on either side of
each datum) to these data to smooth the curve and keep only the long‐term fluctuations. The behaviour
of 20,000 water heaters was generated by a water heater model available in the literature [55] with a
single 4500 W element and a single uniform temperature zone. Water drawing was determined by a
Markov chain from [55]. The temperature was monitored within a 55 to 65°C range, which represents
storage equal to 3.2 kWh (energy accumulated in the total volume of water for a difference of 10°C).
The power variations of the water heaters follow the curve of the wind production presented in
Figure 4.
40 60 80 100 120 140 160-4
-2
0
2
4
Puis
sance
(M
W)
Impact du contrôle sur la charge
Impact du contrôle avec moyenne de mobile de 6 heures
40 60 80 100 120 140 1600
50
100
150
Temps (heure)
Puis
san
ce (M
W)
Production éolienne mesurée
Production avec moyenne mobile de 6 heures
Figure 4: Balancing wind generation with water heaters
In the studied scenario, the 20 hours drop in wind generation and the associated 3 MW load drop
suggested that each water heater provided 150 W of balancing during that period. During that event,
the storage capacity of each electric water heater was well used, using 1.5 kWh of a theoretical value of
1.6 kWh (half of 3.2 kWh). Table 3 sets out the balancing need filled by the water heaters over the 6
days:
Technical report – 2012‐177 (RP‐TEC) 411‐ FLEXIN ‐ 20 ‐ March 30, 2012

Table 3: Average power variation by water heater over six-hour period Power variation by water heater (W) < ‐150
‐150 to ‐
100
‐100 to ‐
50 ‐50 to 0 0 to 50 50 to100 100 to 150 >150
Percentage of time 1.2% 6.0% 17.7% 34.4% 22.4% 10.0% 5.6% 2.7%
During 56.8% of the time blocks for this period, water heaters provided up to 50 W of positive or
negative balancing. They provided from 50 W to 100 W 27.7% of the time, 100 W to 150 W 11.6% of the
time, and finally, over 150 W of balancing 3.9% of the time
#8 – Title: A. Moreau, Institut de Recherche d’Hydro‐Québec/Hydro Quebec Research Institute,
“Control Strategy for Domestic Water Heaters during Peak Periods and its Impact on the Demand for
Electricity” [56]
Network Service: Peak load Management
This study by the Hydro‐Québec Research Institute (2011) presents a control strategy for water heaters
that reduces load pickup. More specifically, the author suggests integrating a control algorithm into
water heaters, which can be used to directly control or program water heaters (timer). That minimizes
the pick‐up demand when heating elements are reactivated at the end of a load‐shifting period and
ensures, in all cases, the client's hot water supply. The study is based on a simulation model of a water
heater that was experimentally validated and takes into account the diversity of the population's hot
water withdrawal profile. More specifically, the data of 8,167 real water withdrawal profiles of several
clients were input into the simulation model in order to evaluate the performance of water heaters
under different operating conditions. The results give profile diversified by water heaters, such as seen
by the network.
The findings of this study are:
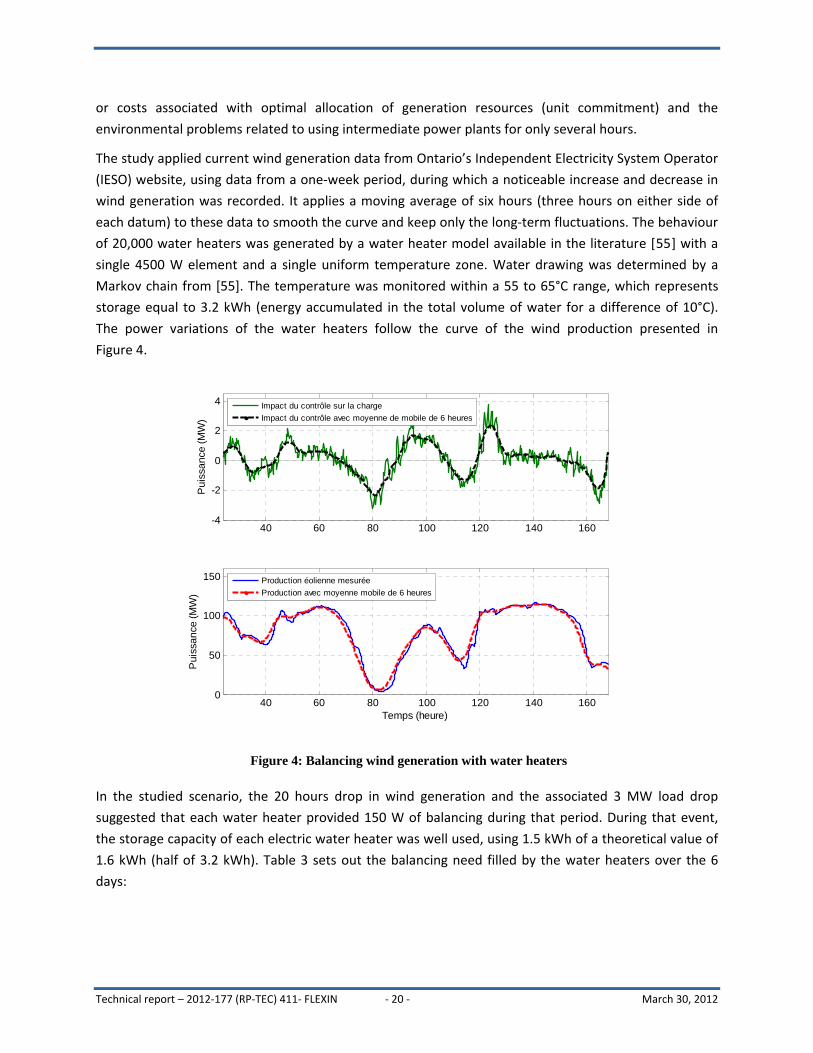
• The electricity demand of a 270‐litre water heater (60 gallons) can be almost totally wiped out
during the morning (6:00 am‐10:00 am) and evening (4:00 pm‐9:00 pm) peak loads. On the other
hand, because of their smaller tanks, deletion is less important for 180‐litre water heaters (40
gallons imp), because their electric elements must activate more frequently to maintain a water
temperature higher than 50°C. However, in spite of this, the reduction remains significant, as seen
in Figures 5 and 6.
• If the demand pick‐up is not controlled after load shifting periods, the demand is significant and is
approximately equal to the nominal power of the water heaters. A new set point can be created if a
large number of water heaters are left to their own devices.
• Phased reactivation can significantly reduce pickup demand after load‐shedding periods. The more
the resumption is phased over a long period, the lower the pickup demand will be. For example,
phasing the reactivation within two hours (as in Scenario 2) halves the non‐phased pickup demand.
Technical report – 2012‐177 (RP‐TEC) 411‐ FLEXIN ‐ 21 ‐ March 30, 2012
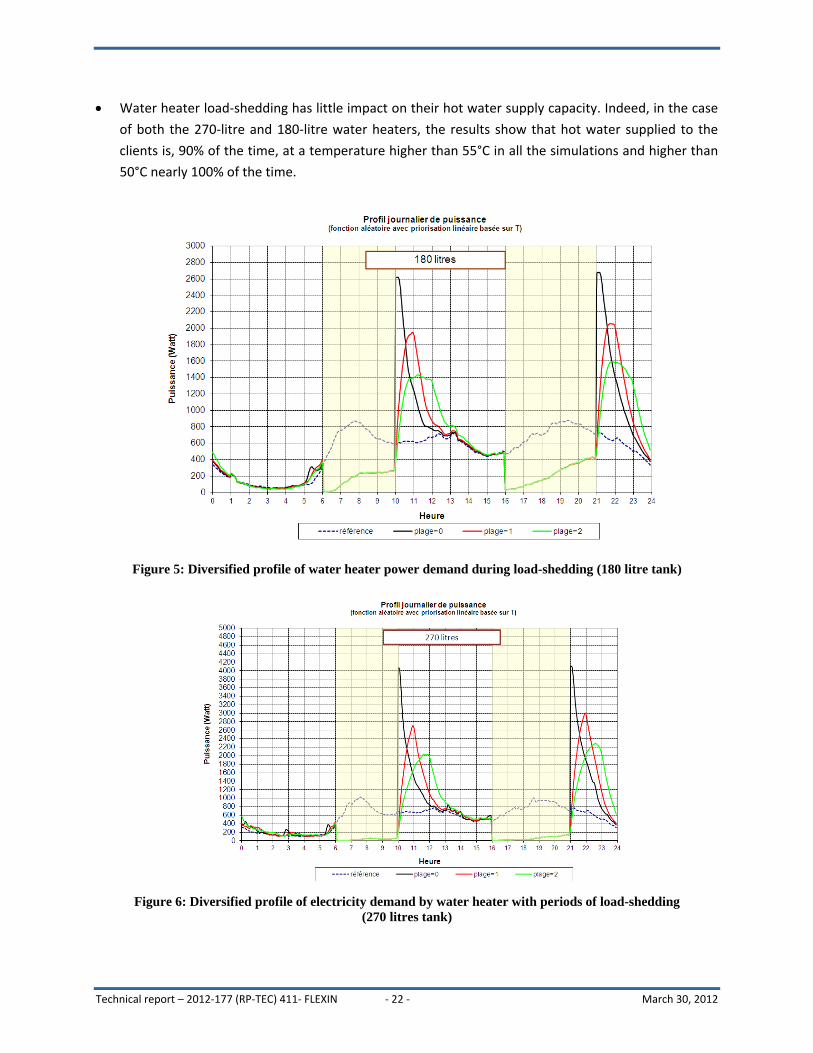
Water heater load‐shedding has little impact on their hot water supply capacity. Indeed, in the case
of both the 270‐litre and 180‐litre water heaters, the results show that hot water supplied to the
clients is, 90% of the time, at a temperature higher than 55°C in all the simulations and higher than
50°C nearly 100% of the time.
Figure 5: Diversified profile of water heater power demand during load-shedding (180 litre tank)
Figure 6: Diversified profile of electricity demand by water heater with periods of load-shedding
(270 litres tank)
Technical report – 2012‐177 (RP‐TEC) 411‐ FLEXIN ‐ 22 ‐ March 30, 2012
Phasing the reactivation of the electric elements has the effect of significantly accentuating the potential
peak load reduction by delaying the occurrence of a new peak, due to reactivation of water heaters at
the same time. Based on Quebec's power grid demand scale and according to the methodology of this
study, phased reactivation of water heaters over two hours can nearly triple potential peak load
reduction, compared to an uncontrolled reactivation. Indeed, the peak load reduction potential is
approximately 600 MW with a reactivation phased within a period of two hours, whereas it is 225 MW
for an uncontrolled reactivation.
3.4 Residential – Thermal storage
#9 – Title: L. Hughes, “Meeting Residential Space Heating Demand with Wind Generated Electricity”
[57]
Network service: Isolated Network Management
The study of Hughes (2010) evaluated potential for using wind generated electricity to heat homes,
using Electric Thermal Storage (ETS) thermal storage systems developed by Steffes.
The results showed that feeding ETS with wind generation could meet the heating needs of 500 homes.
It also shows that ETS capacity (120 kWh, 180 kWh or 240 kWh) only affects the heating portion
provided by generation (which can reach up to 99.5%).
The study took place in North Cape, Prince Edward Island, with an established capacity of 5.15 MW, and
an annual wind power capacity factor of 38.6%.
# 10 – Title: M.‐A. Moffet, F. Sirois et D. Beauvais, École Polytechnique de Montréal and
CanmetÉNERGIE, « Études de cas: Équilibrage de la production éolienne à l’aide d’accumulateurs
thermiques et de chauffe‐eau électriques /Case studies: Balancing wind production with thermal
storage and electric water heaters » [58]
Network Service: Optimal Resource Allocation
A second case study, from Moffet et al. (2012), evaluated the potential for balancing production with
ETS stored in homes. This study used the wind generation curves used in the water‐heater case study
(#7, above), and used the Steffes thermal storage unit with 180 kWh capacity and 28.8 kW maximal
output. The ambient temperature data was taken from Environment Canada and the building envelope
parameters were from a typical home in the Maritime region [59].
The case looked at load control of 500 ETS, in a context where 10,000 out of 20,000 homes used electric
heating. Thermal storage heated 500 of the electrically heated homes.
Technical report – 2012‐177 (RP‐TEC) 411‐ FLEXIN ‐ 23 ‐ March 30, 2012

Figure 7: Balancing wind generation with electrical thermal systems
Figure 7 shows that during a 24 MW drop in wind generation, the ETS reduced the load from 0.9 MW, or
1.8 kW average per ETS.
3.5 Residential – Electric heating
#11 ‐ Title: M. Togeby, EA Energys, “Intelligent Energy Systems ‐ A White Paper with Danish
Perspectives” [60] C. Kofod & M. Togeby, (2004), “Demand Response Offered by Households with
Direct Electric Heating. Demand Response in Energy Markets” [61], Risø National Laboratory for
Sustainable Energy, “Risø Energy Report 8: The Intelligent Energy System Infrastructure for the
Future” [62]
Network Services: Peak Load Management
The studies of Togeby (2010), Kofod et al. (2004) and Risø National Laboratory for Sustainable Energy
(2009) show the results of various initiatives aimed at balancing wind generation.
Various approaches are being tested in Denmark for electric heating as a source for grid balancing. An
economic approach was tested as part of a 19‐month demonstration project, involving 46 electrically‐
heated homes. A control system in every home used electricity prices to adjust consumption on an
hourly basis.
For a 0°C exterior temperature, when prices were low, demand increased by 0.2 kW per home. When
prices were higher, demand dropped by 0.25 kW. When a number of high prices appeared online, the
effect was reduced. The consumption profile would follow the electricity price profile, which varied by
about 5% compared with the average price.
Technical report – 2012‐177 (RP‐TEC) 411‐ FLEXIN ‐ 24 ‐ March 30, 2012
Technical report – 2012‐177 (RP‐TEC) 411‐ FLEXIN ‐ 25 ‐ March 30, 2012
Further to this project, the effect on power was lower than anticipated. In the document, we see that
use of a single thermostat could explain the smaller variations.
During the demonstration project, heating interruptions of up to three hours caused only minor comfort
issues [61] in normally insulated homes.
The potential for demand‐side management from electric heating is estimated at more than 500 MW.
The peak for the Danish Grid in 2009 was 6,300 MW, with potential peak reduction evaluated at 8%. For
400,000 electric heating subscribers, this represents a potential of about 1.2 kW per subscription.
In Denmark, it is estimated that using 100,000 heat pumps could release 200 MW of additional capacity
or 2 kW per home.
The study shows that heat pumps used for radiant floors have significant thermal inertia, due to the
concrete and ceramic floor covering. They can be deactivated for longer periods without inconvenience
or discomfort. The thermal inertia of the hydronic system used for heated floors has an advantage
compared to direct electrical heating, as that equipment has little or no thermal inertia.
3.6 Commercial − Centralized HVAC opera on
#12 – Title: PG&E Participating Load Pilot 3 and S. Kiliccote, P. Sporborg, I. Sheik, E. Huffaker, & M.A.
Piette, Lawrence Berkeley National Laboratory, “Integrating Renewable Resources in California and
the Role of Automated Demand Response” [63]
Network services: Peak Load Management, Non‐spinning reserve and Load Following
The Lawrence Berkeley National Laboratory report (2010) shows the results of the Participating Load
Pilot 3 (PLP) project. This demonstration project involved Pacific Gas and Electric (PGE), the California
Independent System Operator (CAISO) and three commercial facilities10. The three businesses
participated in the electricity market by submitting their real‐time demand reduction bid based on the
market price. The data was used later in the real‐time electricity market.
This project tested the OpenADR protocol on the electricity market. CAISO’s Automated Dispatch
System (ADS) was linked to the buildings through a Demand Response Automated Server. The OpenADR
protocol, an information exchange model to communicate Demand Response events, delivered signals
to the facilities' energy management and control systems and met their peak demand during bidding11.
By using Client Logic, The Integrated Relay (CLIR) box4 meant that Demand Response strategies could be
initiated without human intervention at each facility. The device communicates price and reliability
signals to each building's Energy Management and Control System (EMCS).
According to the authors, this experimental project showed that flexible load response time could be
the same as generators (less than 10 minutes). The CAISO report pointed two major advantages:
10 An (IKEA) store, a government office building (Contra Costa County) and a bakery (Svenhard’s Swedish Bakery). 11 According to the authors, the same infrastructure is being used for PG&E's price‐based Auto‐DR programs, such as Automated Peak Day Pricing and Demand Bidding programs.
1‐ Customers with Auto‐DR capability can automatically respond to pre‐defined instructions
from the ISO and curtail loads, requiring no human intervention.
2‐ A real‐time feedback mechanism would fine‐tune load‐shedding, so that flexible loads could
closely follow ISO dispatch instructions from the grid operator.
The flexible resources used in this project reached an average ramp of 0.25 MW / min and the response
time is established at 47 seconds.
Another project, the Integrating Renewable Resources (IRR) pilot project was a collaborative effort
between PG&E, the LBNL PIER Demand Response Research Center (DRRC) and CAISO. It aimed to
address the challenges and opportunities of integrating over 6,000 MW of variable generation resources
in California. The primary objective was to determine the feasibility of demand‐side storage capabilities:
thermal mass, process mass, ice and cold‐water storage, in a dynamic demand management strategy for
air‐conditioning in buildings. The strategy aims to provide load following and ramping products that the
CAISO will need to manage the grid under a 33% Renewable Portfolio Standard.
The pilot used research previously conducted by the DRRC using Open Automated Demand Response
(OpenADR) in commercial and industrial facilities and providing non‐spinning reserves to the CAISO. The
project launched in 2011.
3.7 Commercial − Emergency generators
#13 – Title: Flemming Birck Pedersen, Energinet.dk, “Demand Response Progress in Scandinavia”
Network Service: Regulation with Automatic Generator Control (AGC)
A study by Energinet.dk (the transmission system operator) in Denmark shows the outcome of a
demonstration project in the eastern portion of the Elkraft Transmission System between 2004 and
2007. The project used emergency and flexible load generators, such as pumps, to provide regulation
service on power grids. A regulation power of 33 MW was tested on 30 participating customers. The
study concluded that generators used for this service could be initialized within one minute. The
Generators had 100 kW to 1 MW typical output.
3.8 Municipal − Cogenera on and urban hea ng systems
#14 – Title: Energinet.dk, “EcoGrid.dk Phase 1 ‐ WP4: New Measures for Integration of Large Scale
Renewable Energy” [9]
Network Services: Regulation with Automatic Generator Control (AGC), Load Following and Surplus
and curtailement management
Various measures are being studied within the Danish EcoGrid project to attain 50% wind power
penetration before 2050. The Energinet.dk report (2007) includes a review of usable technologies,
improvements for grid operation and potential markets. In 2009, 54 MW of electric boillers were
included in the balancing market, which provided down‐regulation service (down regulation) [60]. The
Technical report – 2012‐177 (RP‐TEC) 411‐ FLEXIN ‐ 26 ‐ March 30, 2012
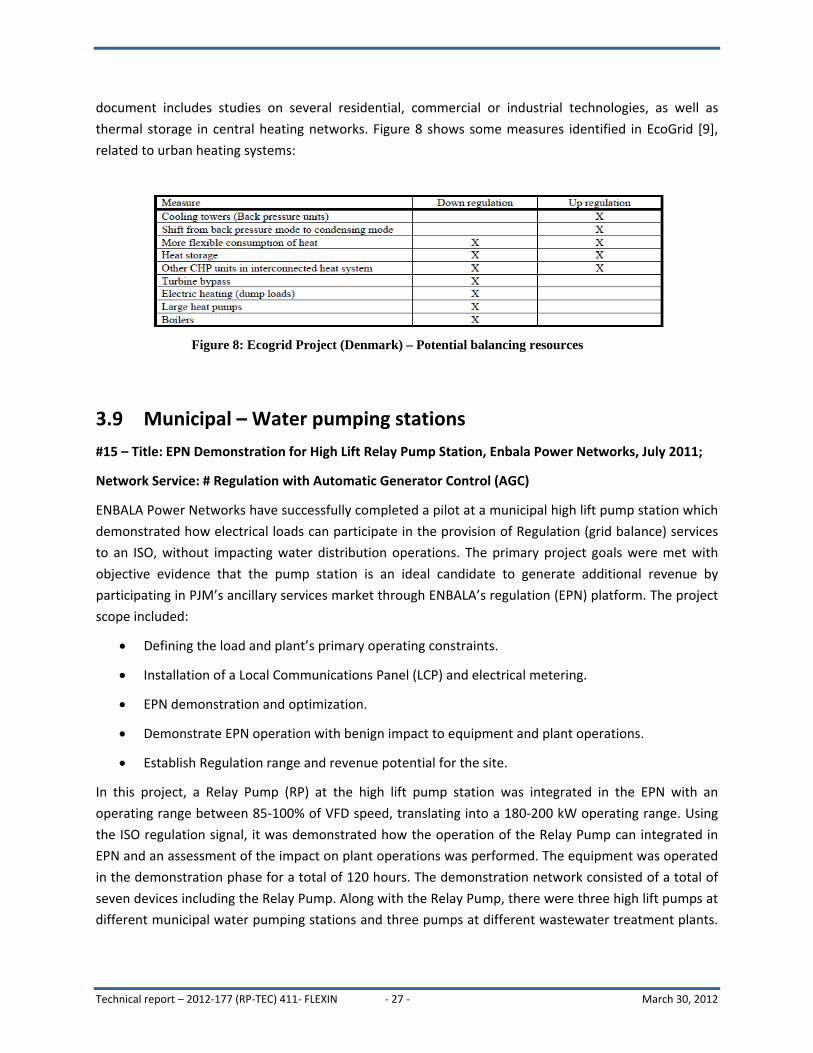
document includes studies on several residential, commercial or industrial technologies, as well as
thermal storage in central heating networks. Figure 8 shows some measures identified in EcoGrid [9],
related to urban heating systems:
Figure 8: Ecogrid Project (Denmark) – Potential balancing resources
3.9 Municipal – Water pumping stations
#15 – Title: EPN Demonstration for High Lift Relay Pump Station, Enbala Power Networks, July 2011;
Network Service: # Regulation with Automatic Generator Control (AGC)
ENBALA Power Networks have successfully completed a pilot at a municipal high lift pump station which
demonstrated how electrical loads can participate in the provision of Regulation (grid balance) services
to an ISO, without impacting water distribution operations. The primary project goals were met with
objective evidence that the pump station is an ideal candidate to generate additional revenue by
participating in PJM’s ancillary services market through ENBALA’s regulation (EPN) platform. The project
scope included:
Defining the load and plant’s primary operating constraints.
Installation of a Local Communications Panel (LCP) and electrical metering.
EPN demonstration and optimization.
Demonstrate EPN operation with benign impact to equipment and plant operations.
Establish Regulation range and revenue potential for the site.
In this project, a Relay Pump (RP) at the high lift pump station was integrated in the EPN with an
operating range between 85‐100% of VFD speed, translating into a 180‐200 kW operating range. Using
the ISO regulation signal, it was demonstrated how the operation of the Relay Pump can integrated in
EPN and an assessment of the impact on plant operations was performed. The equipment was operated
in the demonstration phase for a total of 120 hours. The demonstration network consisted of a total of
seven devices including the Relay Pump. Along with the Relay Pump, there were three high lift pumps at
different municipal water pumping stations and three pumps at different wastewater treatment plants.
Technical report – 2012‐177 (RP‐TEC) 411‐ FLEXIN ‐ 27 ‐ March 30, 2012
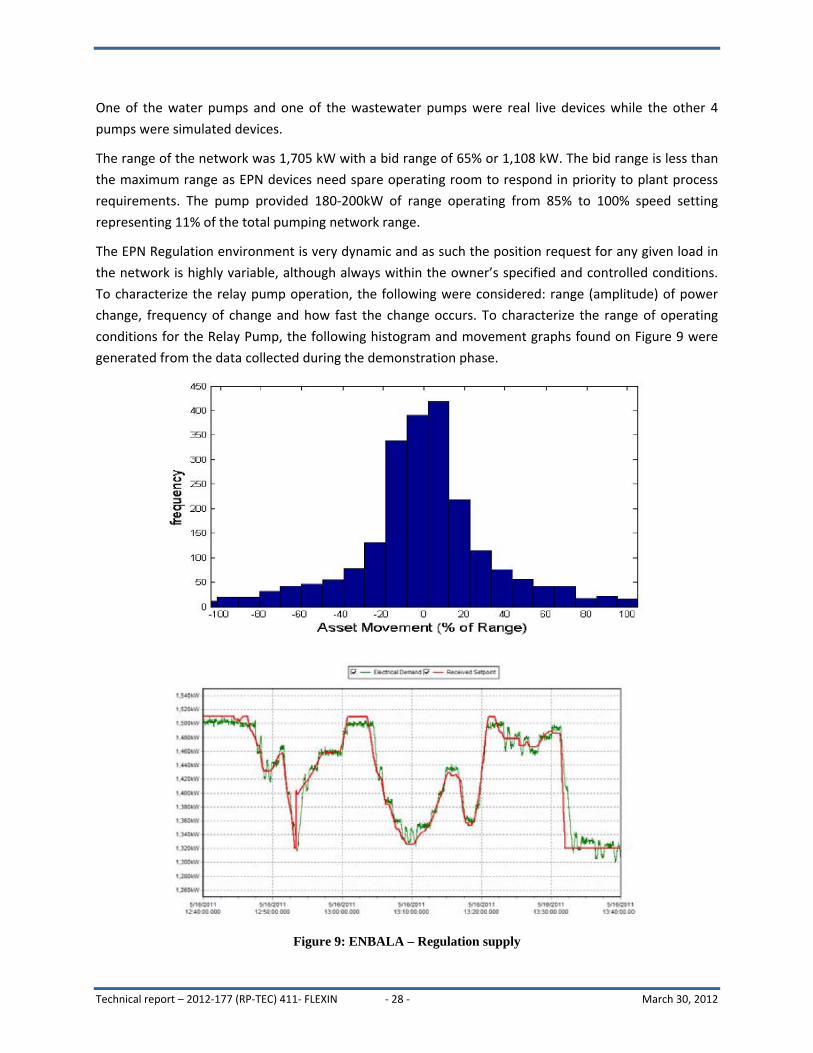
One of the water pumps and one of the wastewater pumps were real live devices while the other 4
pumps were simulated devices.
The range of the network was 1,705 kW with a bid range of 65% or 1,108 kW. The bid range is less than
the maximum range as EPN devices need spare operating room to respond in priority to plant process
requirements. The pump provided 180‐200kW of range operating from 85% to 100% speed setting
representing 11% of the total pumping network range.
The EPN Regulation environment is very dynamic and as such the position request for any given load in
the network is highly variable, although always within the owner’s specified and controlled conditions.
To characterize the relay pump operation, the following were considered: range (amplitude) of power
change, frequency of change and how fast the change occurs. To characterize the range of operating
conditions for the Relay Pump, the following histogram and movement graphs found on Figure 9 were
generated from the data collected during the demonstration phase.
Figure 9: ENBALA – Regulation supply
Technical report – 2012‐177 (RP‐TEC) 411‐ FLEXIN ‐ 28 ‐ March 30, 2012
Data from the plant recorded in the LCP for electricity demand and water flow was used to compare
energy efficiency (kWh/Mgal.) for water pumping when the Relay Pump was on EPN control vs when the
Relay Pump was off EPN control. The results of the comparison indicated that there was a ‐0.2% change
in energy needed for pumping when the Relay Pump was on EPN control compared to when it was off
EPN control, verifying that the regulation process does not negatively impact pumping efficiency.
A regulation range of 180–200 kW was consistently available. Based on the ISO’s projections for
regulation prices, the network configuration used for testing, the performance of the RP during the
demonstration and 200 kW of projected range, one can estimate the EPN revenue potential for at this
site to be $13,000 per year.
3.10 Transportation – Electric vehicles
#16 – Title: F. Tuffner & M. Kintner‐Meyer, Pacific Northwest National Laboratory, “Using Electric
Vehicles to Meet Balancing Requirements Associated with Wind Power” [64]
Network Service: Regulation with Automatic Generator Control (AGC)
Tuffner et al. (2011) features the potential of using electric vehicles to balance wind generation. The
context was the Northwest Power Pool (NWPP), with a potential additional wind capacity of 10 GW
(from 3.3 GW in 2008 to 14.4 GW in 2019). According to the methodology defined in Kintner‐Meyer et
al. 2010 [65], the authors predicted an additional balancing need of about 1.85 GW (3.7 GW in total).
To reproduce the mobility of cars, the authors used data from the 2003 National Household Travel
Survey (NHTS) (U.S. Dept. of Transportation). These surveys included measurements on the average
availability of automobiles, power needs based on distance, as well as parking time at work or home,
departure and arrival times and vehicle occupancy, to establish refill/discharge scenarios. In this study,
the authors used two types of electric vehicles: The first was a PHEV‐33‐based plug‐in hybrid electric
vehicle expected to go approximately 33 miles before requiring a recharge. The second vehicle utilized
was a PHEV‐110, expected to travel 110 miles before a recharge or alternative energy source.
The authors simulated two different strategies: Smart recharge without discharge to the grid (V2G Half),
and smart discharge (V2G Full). The study concluded the emerging electric vehicle fleet (PHEV‐33) can
significantly contribute to grid balancing services. In V2G Half, modulating the refill of 13% of vehicle
fleet (2,100,000), can fully balance wind production. V2G full reached the same results with 30 to 35%
fewer vehicles.
The study showed how the number of cars needed for balancing depends largely on available charging
stations at work or in public places, but only up to a point. The authors mention that about 10% of
public charging stations can achieve 80% of improvement.
Technical report – 2012‐177 (RP‐TEC) 411‐ FLEXIN ‐ 29 ‐ March 30, 2012
The authors presented a potential case that where vehicles were available 24/7, performing V2GFull,
type 2 recharge service. This is identical to the simulated stationary energy storage system, dedicated to
balancing services. This case would use a total number of about 560,000 vehicles but the authors did not
illustrate the impact on the transmission and distribution grids.
3.11 Other loads
Other studies in the field concerned other load types (lighting [66], refrigerators, freezers and
geothermal pumps [67]) to determine their potential for peak demand‐reduction or optimization
strategies. With rapid developments in the field, other studies demonstrating the potential for using
these loads for grid balance could soon be published. The potential in the industrial field has not been
assessed because of the diverse processes involved, even though, in this sector, potential is contained
and thus easier to identify. Since there is a significant capacity for load‐shedding in this sector, we can
deduce that there is also technical potential for balancing.
These numerous studies, pilot projects and other reports [68] demonstrate the technical feasibility of
distributed resources in balancing power grids. Section 4 will continue with issues related to integration
of these resources, with a closer look at electricity markets.
Technical report – 2012‐177 (RP‐TEC) 411‐ FLEXIN ‐ 30 ‐ March 30, 2012

Technical report – 2012‐177 (RP‐TEC) 411‐ FLEXIN ‐ 31 ‐ March 30, 2012
4 The role of markets in the integration of distributed energy resources
This section complements the technical review presented by approaching topics related to markets,
regulation, business and societal environments surrounding the integration of DER. A short introduction
on generation planning and market structures is presented at the beginning of this section, followed by
information on aggregation, integration challenges and factors for commercially successful DER
deployments.
4.1 Planning production resources
The dynamics of power grid operation are characterized by the need for balancing generation and real‐
time demand. This fundamental technical characteristic of power grids is heightened because large scale
power storage is technically difficult and costly. On a typical day, a number of power generation
technologies respond to power demand. The various technologies must come into play based on
fluctuating demand and operating costs. These daily technological cycles create dramatic variations12 in
the marginal cost of a kilowatt‐hour of energy over the same day (from very low at night to very high at
the peak).
Power plants are optimally dispatched in order to supply various commodities, mainly energy, as well as
various ancillary services including regulation and spinning or non‐spinning reserve. The limits of
network congestion and power plant output, such as start‐up and switch‐off lead times (minutes), and
ramping capacity (MW/minute) are considered in the economic allocation of power plants. The
responsibility for economic dispatch can be assigned to a central organization (a vertically integrated
enterprise), to a system/grid operator or market operator. The grid operator's role varies between
countries and regions, especially its involvement in market operation13.
4.2 Market structures and philosophies
A reason for developing electricity markets is to aid the incorporation of more participants, including
small distributed resources. This would minimize major capital costs related to building new power
plants [69]. The number of different electricity market structures and philosophies is as vast as the
number of markets. However, there are two major approaches, one North American and the other
European.
12 This daily volatility has no equivalent in the world of finance, for example, and it cannot be compared to the volatility of gasoline prices which have weekly cyclical components, but where the relative amplitude of variations is still much smaller than with electricity. 13 The book Power System Restructuring and Deregulation [69], p. 179, mentions three types of ISO: MicroISO, MiniISO and MaxiISO. These are not enough to account for the variations in the industry.

North American approach
In the North American approach, the independent system operator (ISO) holds the control over the
market and the transmission network. The ISO is a crucial market actor responsible for operating the
'day‐ahead' market. The day‐ahead market considers, in an integrated manner, technical characteristics
of generating plants and the effect of the transmission network and needs for ancillary services.
The role of this market is to anticipate real time process in order to set revenue and costs for producers
and resellers, instead of waiting for real time operation where prices, vulnerable to demand fluctuations
or equipment breakdown, are only known after the fact (ex‐post). This particular version of a futures
market is purely financial and does not involve any parties in supplying or delivering the next day's
energy supply. This market also allows players currently involved in pre‐established bilateral
transactions to secure transmission capacity necessary to implement physically their transaction in real
time. As a by‐product, the ISO provides marginal electricity prices at each network node; these prices
are used to obtain total compensation for producers and payment for resellers. If offers to supply and
bids to consume are maintained until gate closure, the market becomes physical and short‐term delivery
is planned (i.e. for the next hour). With a day‐ahead market, players have a more precise picture of the
purchase and sale price of electricity before consumption (ex ante) and can tailor their bids and offers as
a result.
The ISO also runs a real‐time market (which is physical, unlike the day‐ahead market). The real‐time
market involves energy deliveries and load extraction reflecting the dispatch pattern established at gate
closure. It thus includes centrally‐based market settled deliveries as well as bilateral transactions which
have reserved grid access. In the real‐time market, the ISO, while maintaining an overview of its grid,
ensures that the generation dispatch is such that it balances demand by using the operating reserve
capacity (i.e. ancillary services) from the most economical power plants. When there is excessive need
for regulation, new dispatches (i.e. set point changes) can be set within the hour. After the fact (ex post)
marginal prices for each node are calculated for billing. These nodal prices reflect the marginal costs of
congestion and losses associated with the physical implementation of the market outcomes. It should be
noted that the volume of energy traded in the real‐time market is generally small when compared with
that of the bilateral and day‐ahead markets—often real‐time markets are called “adjustment” markets.
The European approach
Unlike the North American approach, European transmission grid operators play no part in the market
until producers and retailers have to provide their position, reflecting the aggregation of numerous
bilateral contracts, sometime before real‐time delivery. Unlike North American ISOs, European grid
operators do not operate formal day‐ahead markets wherein network and complex generation
technology constraints are represented. In fact, European operators manage a balancing resources
market followed by a real‐time market, where gaps between the production and load are eliminated by
dispatching balancing resources and previously acquired ancillary services. The gaps between positions
and telemetry are adjusted through prices which reward (penalize) the gaps that contribute in reducing
Technical report – 2012‐177 (RP‐TEC) 411‐ FLEXIN ‐ 32 ‐ March 30, 2012
(increasing) the overall gap in the power grid. In Europe, unlike North America where the market
considers the effects of the transmission gri, transmission network congestion is managed with
balancing resources. Moreover, in European markets, congestion costs are socialized unilike in North
America where congestion is settled through nodal prices.
Distinctions and opening to DER
These two approaches involve the conduct of a real‐time/balancing market. These two approaches
include the supply of ancillary services to maintain frequency and voltage, which may be procured
competitively. However, a major distinction of the American approach is the two‐phased market
solution (two settlement system), enabled by running succesvively a managed day ahead market and
then the real‐time market. This solution allows for more accurate optimization and lesser risk because
more elaborate generation models are used and because it incorporates the effects of the grid.
However, this comes at the price of much higher complexity and less market transparency.
In the North American approach, electricity prices are set a posteriori (ex post), by accounting for
congestion and grid losses at zones or nodes. In the European approach, these technical parameters are
dealt with on an ad hoc basis and the associated grid costs attributed to them are socialized after the
fact.
In terms of distributed energy resources, the North American approach has the virtue of:
Allowing modifications in electricity demand or production before operation of the real‐time market. Flexible demand and storage can be thus optimized based on projected electricity costs;
Promoting decentralized solutions for reducing congestion, as price signals are provided to reflect nodal or zonal congestion; and,
Promoting distributed generation, because injecting power at a point in the transmission network and consumption at another creates losses that add to generation costs.
Another dimension of the electricity markets is its handling of congestion related costs. The North
American approach includes financial instruments (financial transmission rights), which allow for system
actors to hedge against the cost impacts of congestion on their activites, while the European approach
includes these in the cost of the transmission service. In that case, actors cannot do much to avoid those
charges.
4.3 Load aggregation
The essential element of commercial success for demand‐side management involves load aggregations.
Aggregation acts as a lever, creating a critical mass which i) supplies demand‐side management volumes
of interest to markets and ii) smooths load uncertainty and the variability of its flexibility in time. The
role of an “aggregator" arose from the need for commercially significant demand response volumes and
Technical report – 2012‐177 (RP‐TEC) 411‐ FLEXIN ‐ 33 ‐ March 30, 2012
Technical report – 2012‐177 (RP‐TEC) 411‐ FLEXIN ‐ 34 ‐ March 30, 2012
to limit the risk associated with delivering demand management resources. We can add that aggregators
act as brokers who provide consumers access to energy and other ancillary services markets. To secure
revenues and leverage investments in demnd response technologies, aggregators often participates in
capacity auctions, like the the Reliability Pricing Model (RPM)14 in PJM [14]. Those markets tend to
organise the long term planning of resources in a region to avoid future congestion.
Aggregation seems to be the wave of the future for demand‐side management, and there are already
several flexible load aggregation companies. The Australian corporation Energy Response Pty Ltd.
(Acquired by EnerNOC in July 2011) has established itself by aggregating interruptible loads for large
Australian consumers. In September 2010, CPower Inc., with load aggregation services established in
several North American states and provinces, was recently bought by Constellation Energy. Demand‐
side management is now an integral part of their services.
On the European side, a large majority of public utilities and small companies are active in this area15.
For example, GDF Suez (major group) and Flextricity (SME) have been operating as aggregators in Great
Britain as aggregators already for five years.
4.4 Integration challenges
As mentioned earlier, the bulk integration of DER, particularly demand‐side response, requires
ajustements to system and market operation rules. First, these resources introduce many more players
and pose technical challenges to integration. Secondly, these resources appear diffusely on the grid,
making it difficult to tell one from the other without monitoring equipment for each. Thirdly, due to
their small size, these players will not generally have any or enough access to major market structures;
hence, new market rules and the definition of new services are necessary to facilitate market access.
14 http://www.pjm.com/markets‐and‐operations/rpm.aspx 15 For Great Britain : www.nationalgrid.com/uk/Electricity/Balancing/demandside/aggregators/
Sample market integration projects A challenge to integrating distributed energy resources lies in the adaptation of rules and philosophies to market design. We begin to see proposals appearing in the scientific literature where the contributions of the demand in ancillary services markets are explicitly recognized. Certain publications argue in favour of effects related to recovery of curtailed energy within market mechanisms. This indicates that in time, we can help create real flexibility markets of flexibility where demand will compete directly with other resources [70] [71] [72]. European projects ADDRESS (www.addressfp7.org) and FENIX (www.fenix‐project.org) developed the concept of load aggregation and flexibilities. FENIX concentrated on large‐scale consumers (institutions and industries) in the context of virtual power plants. ADDRESS leaned toward aggregation for smaller commercial and residential consumers. ADDRESS is distinguished mainly by efforts in developing operational methods and concepts of aggregation for small consumers. The results of the European ADDRESS project go as far as suggesting three basic flexibility products [73] which could potentially lead to emergence of more liquid markets instead of a multitude of small low volume niche markets, which prevent them from standing out. The project is currently in its final test phase at three European sites (In France [Brittany], Spain [Castellon] and Italy [Carpinone]). The Intelligent Energy System [60] project, implemented as part of the EcoGrid initiative in Denmark, aim at developing new market operations to integrate a large number of small distributed resources to supply grid regulation. The project proposed the strategy of maintaining the current markets (day‐ahead, hour‐ahead), but to allow smaller, flexible loads to participate in the regulation market by sending unidirectional signals. The PowerShift Atlantic project in Canada [41], Consolidated Edison's EPRI project in Illinois [74] and the Olympic Peninsula project in the state of Washington are North American demonstration projects involving the integration of markets and virtual power plants into an electricity market [75].
Obviously, new services are not developed in isolation. The local context, the regulation and the
technical environment of the power industry shape the mechanisms and philosophies that do or do not
promote these services. The implementation of demand‐side response programs and distributed
storage presents a number of commercial, technical and sociocultural challenges. Here are a few of
them, along with some of their corresponding success factors.
4.4.1 Technical challenges
Distributed nature of the resource: Consumers are scattered through the network and are generally
difficult to characterize individually. It is thus difficult to evaluate potential of aggregated resources
without a smoothing “mass effect” where the variability of each individual load is masked the variability
of other loads. This problem is magnified where network constraints would limit the number of
consumers able to take on the challenge.
Payback effect: As mentioned above, the great majority of loads and energy storage systems can delay
(loads) or anticipate energy consumption (storage). As part of demand shifting, the operator must
anticipate reactivation of the released energy without creating additional grid stress. Furthermore,
Technical report – 2012‐177 (RP‐TEC) 411‐ FLEXIN ‐ 35 ‐ March 30, 2012

these resources are not pure substitutes for generation capacity (that is, purely negative demand).
Given the losses associated with delay and anticipation of consumption, the total quantity of energy
ultimately consumed can potentially increase. The idea, however, is increased energy demand is
produced by resources which are cheaper and/or less polluting.
Need for adapted measurement: Given the distributed character of this resource, it is imperative to
establish infrastructure and demand measurement protocols which can (i) help establish the demand‐
side contribution to network management at different scales and (ii) allow the correct and adequate
remuneration for participating consumers.
Measuring and benchmarking An important factor in the flexibility concept in power systems is the idea that flexibility is defined from an initial position. If we want to reward consumption modifications related to consumer action (automatic or not), following a distributor, reseller or aggregator signal, it must be determined if this change is due to consumer flexibility and is not just coincidental. Furthermore, we also must determine the scale of the modification. The method usually applied to do so uses a reference consumption curve for every consumer or type of consumer (baseline). The use of basiline consumption curves is widespread but remains controversial, because consumers can cheat by overconsuming during benchmarking periods. These curves are suitable for large‐scale consumers, given that it is easier to anticipate their consumption according to simple data (e.g. weather reports, day of the week, season). It is more difficult with smaller consumers because of the inherent complexity and costs, as well as consumption variables within a family unit. Development of alternative solutions for benchmarking should be promoted, to improve flexibility evaluation and remuneration. The ADDRESS project (www.addressfp7.org), applies the solution of consumption tiers referenced to the nil consumption; these indicate to customers whether they would benefit from increasing or decreasing consumption. Finally, the development of real‐time rates renders benchmarking (and aggregation in general) useless. Indeed, according to this incentive, the end customer replaces the aggregator to benefit from low electricity market prices and manage risks associated with higher prices. This type of pricing is currently available only for large‐scale consumers.
The need to predict load behaviour: It is important for the operator to anticipate the power demands of
participating loads and to characterize them in order to predict their dynamic performance in time.
Ultimately, for transmission network or distribution network operators, knowledge of loads and
associated models will establish a decision‐making tool for optimized management. For that purpose,
advanced versions of energy management systems, using neural networks, for example, are developed
to characterize loads coming from various aggregators.
4.4.2 Commercial challenges
The need to satisfy requirements of existing markets: In many cases, such as ancillary services markets,
there are pre‐existing technical constraints, which discriminate against the use of small‐scale resources.
The most convincing example is the necessity of supplying capacity blocks over a certain minimum (i.e. 1
Technical report – 2012‐177 (RP‐TEC) 411‐ FLEXIN ‐ 36 ‐ March 30, 2012

MW) in tendering processes. Most traditional generating resources have little difficulty meeting these
minimums, but they can cause problems for distributed resources. Therefore, there is a choice between
adapting existing market structures or opening up to aggregation. These two means are used often.
Minimal blocks The majority of electricity and ancillary service markets have lower volume limits. In 2008, Ofgem, however, the electricity market regulator for Great Britain, mandated the transmission network operator for England and Wales (National Grid plc) to reduce minimal volume for services in the primary reserve market (frequency response) from 10 to 3 MW [76] [77]. This would allow the use of resources from aggregated loads.
Monpoly regulation: Vertically‐integrated utility companies hold a monopolistic position in several
regions and countries. These firms can resist to the entry of new players on the market supplying
energy, regulation, reserves or capacity. The absence of appropriate economic regulation can also be a
hurdle to interested companies. Without incentive mechanisms, several public utilities regulated
through cost of service regulation have an economic incentive to increase grid capacity rather investing
in alternative solutions, which are usually less capital intensive. The organizational relationships existing
between divisions in a vertically‐integrated company can also be an obstacle, especially if the operation
of one (i.e. distribution) impacts negatively the expansion plans of another (transmission and
generation).
The emergence of perverse effects: In a deregulated industry, actions of a player using demand‐side
response can inconvenience other network players. The best example is the creation of portfolio
imbalances for resellers following third‐party (i.e. aggregator) load changing instructions. Another
perverse effect could lead energy resellers to manipulate demand so it affects wholesale prices to the
benefit of certain producers, and the detriment of consumers [78].
Legal implications In an industrial context with diverse competing market players, the emergence demand‐side response can negatively affect some players. The most famous case of this type was the complaint d’Électricité de France (EDF) (their commercial retail branch) filed with the French electricity industry regulator, the Commission de régulation de l’énergie (CRE), against Voltalis. Voltalis operated as a flexibility aggregator for small consumers, reselling to RTE (transmission system operator) as a load‐shedding service, or spare capacity. The motive for EDF's complaint was based on the following: Actions by Voltalis' on its share of EDF's retail consumers caused an imbalance in EDF’s portfolio, resulting in penalties on the balancing market for EDF. Initially, the CRE ruled in favour of EDF in 2009, forcing Voltalis to compensate EDF for consumption changes resulting from its actions. This decision was reversed by the Council of State in 2011 [79]. This example shows how demand‐side response contributes to change the power industry. It is clear that that in‐depth analysis is needed to understand all the implications of demand‐side response. This case highlights a legal gap regarding energy property rights, which change over time by storage and demand management. A number of questions exist, but mainly: does the aggregator own the energy consumed that he postponed or scheduled? The issue is even more delicate when a grid operator is responsible for aggregation, because the operator would de facto be taking a stand in the market, which, in a European context, would be almost impossible.
Technical report – 2012‐177 (RP‐TEC) 411‐ FLEXIN ‐ 37 ‐ March 30, 2012

Promoting demand‐side management and appropriate incentives: The supply of ancillary services by
demand‐side response requires that its value is larger than the amount of incentives and payments to
participating consumers. Where a large number of consumers can contribute to the flexibility supply on
a network scale, this can contribute to marginalize one consumer's contribution and considerably limit
rewards. If a risk premium is applied on top of the projected value of the accumulated rewards, the
potential financial gain to the consumer is often limited and must be supplemented by a subsidy
mechanism operating outside the market.
Equipment purchase costs to support flexibility: It is undeniable that harnessing load flexibility goes
hand in hand with a number of enabling technologies (e.g. smart household electrical appliances,
sophisticated temperature controls, communication equipment, etc.). Potential consumer rewards are
relatively small, so the player who wants to provide in demand‐side response must generally cover the
equipment costs. Equipment purchase costs for demand‐side response technologies can be greatly
reduced by gradually deploying electrical equipment with embedded "smart" features and gradually
replacing consumer's obsolete electrical equipment.
4.4.3 Social and cultural challenges
Consumer acceptance of demand‐side management: It can be difficult to convince consumers to install
equipment adapting their consumption habits and business practices for a relatively low return, as
individual economic incentives may not be quite limited. A focus on moral and environmental values, for
both businesses and individuals, can contribute to demand response success with certain segments of
the clientele. Furthermore, the public is frequently opposed to installation of certain technologies (such
as smart meters) or setting rate schedules which send price signals to incentivize demand‐side
management (e.g. time‐of‐use pricing).
Respect for privacy and personal information: Demand‐side management relies on information sharing.
This can be seen as infringing on privacy and confidential information of consumers.
Potential incentives and advantages As previously mentioned, when an entity such as an aggregator supplies any ancillary service, it can involve a large number of participating consumers. The value of this service at the system level must eventually be transferred to the consumer (minus a certain margin for aggregator). We can imagine that the potential reward for consumers is small as the effort is diluted among all responsive consumers. Therefore, in the meantime, with available flexible network resources, it may be difficult to establish demand‐side response and render it commercially viable. In fact, to develop distributed energy resources, energy policies must promote the intangible benefits, by appealing to the public's sense of morals and environmental consciousness, as well as those of institutions and businesses [80]. If companies have a dominant position in countries where climate change is top priority, there is a proactive trend toward promoting brand names and the company's social consciousness (green credentials). In Great Britain, many major retail chains (e.g. Tesco, Sainsbury's and Marks and Spencer) launched programs for streamlining energy consumption, some chains connecting the thermal mass of their stores (as storage medium) with wind production.
Technical report – 2012‐177 (RP‐TEC) 411‐ FLEXIN ‐ 38 ‐ March 30, 2012

4.5 Success factors
The general environment of the power industry in a region (e.g. availability of hydroelectric power or
other type of cyclable generation, an open market or the magnitude of electricity prices) greatly affects
viewpoints on demand‐side response, storage and other emerging products and services related
provided with aggregation. The following section will present several success factors associated with
commercial exploitation of DER.
4.5.1 Analysing the local context
To evaluate conditions for success, the ADDRESS project highlights elements favourable or unfavourable
to demand‐side management [81]. The project was based on four European scenarios, which analyzed
local conditions related to developing intermittent renewable energies, load types and balancing needs.
It identified the following characteristics:
The geography of the scenario location. The geographical aspect refers to the climate and both average and extreme temperature conditions;
The characteristics and density of customers in the area where the scenario develops;
The existing power industry infrastructure (i.e. technological mix of the generating system in the market and the regulatory context) at the place and at the time as the scenario develops;
The technological context (i.e. mainly the customer practices and technologies connected to the network) at the place and at the time as the scenario develops.
In general, a scenario showed good potential for success when more flexibility was necessary in the
region (i.e. to accommodate intermittent renewables) and if flexible loads were available among
consumers.
Here are the results for the four ADDRESS scenarios:
1. The Southern City scenario showed the greatest potential for the following reasons:
There is a clear need for flexibility sources affordable to industry players. This is because a high proportion of intermittent renewables is connected to the transmission network. They have created a constant increase in demand for ancillary services and balancing capacity.
The potential flexibility based on load is attractive because:
o The significant density of clients,
o The lion's share of the load is flexible (air conditioning), and
o The emergence of electric vehicles toward the end of the scenario's horizon.
Technical report – 2012‐177 (RP‐TEC) 411‐ FLEXIN ‐ 39 ‐ March 30, 2012

2. The Southern countryside scenario has good success potential because:
It has an increased need for flexibility because of the gradual disappearance of the capacity margins in the generating system;
On the other hand, the potential for load use in this scenario is low, because of low consumer density and highly seasonal agricultural load.
3. The Scandinavian Suburb has the lowest potential for success:
Flexibility supply is sufficient on a national level because of hydroelectric production capacity and numerous international interconnections;
Consumer flexibility has little initial potential, given the average population density and little flexible power usage. As there are very few heat pumps, heating is mainly supplied by urban heating systems and local burning of fossil fuels.
4. Finally, the Multi Unit community in a Temperate Zone had interesting characteristics, which could insure successful use of load flexibility:
There is a growing need for flexibility on a national scale, given the number of new and sizeable renewable generating facilities. Furthermore, it is accepted that producers use the potential for load suppression to respond to requirements for supplying standby capacity;
There is great supply potential due to high customer concentration and use of electric heating and air‐ conditioning.
4.5.2 Aggregation in virtual power plants
Virtual power plants (VPP) can have a significant impact in the
future, because they constitute the logical result of the
demand response market. VPP could aggregate a large
number of resources to provide more services than just peak
demand reduction. As presented in Figure 6, a virtual power
plant may include emergency generators, smart appliances (in
homes, businesses and industries), smart buildings and
storage. These resources may be located on the same feeder or situated at different electrical locations
and may all provide energy, capacity or balancing in the same market.
Virtual power plants (VPP) can have a significant impact in the future, because they constitute the logical result of the demand response market.
Technical report – 2012‐177 (RP‐TEC) 411‐ FLEXIN ‐ 40 ‐ March 30, 2012
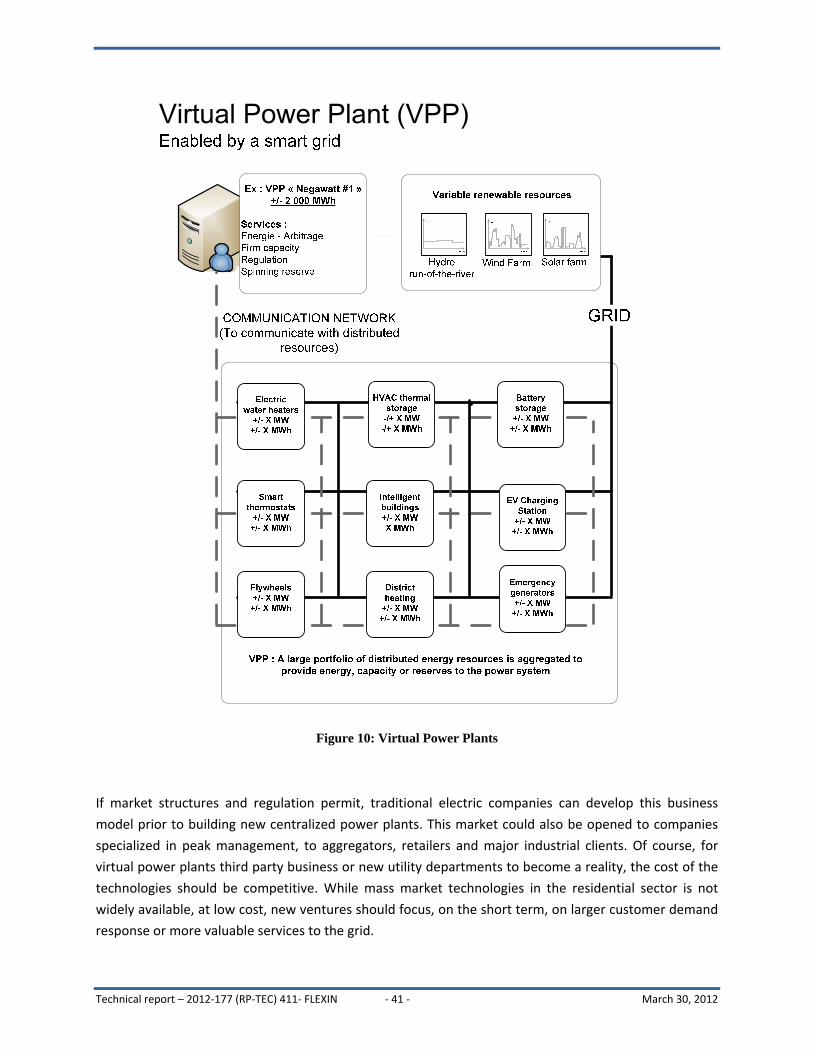
Figure 10: Virtual Power Plants
If market structures and regulation permit, traditional electric companies can develop this business
model prior to building new centralized power plants. This market could also be opened to companies
specialized in peak management, to aggregators, retailers and major industrial clients. Of course, for
virtual power plants third party business or new utility departments to become a reality, the cost of the
technologies should be competitive. While mass market technologies in the residential sector is not
widely available, at low cost, new ventures should focus, on the short term, on larger customer demand
response or more valuable services to the grid.
Technical report – 2012‐177 (RP‐TEC) 411‐ FLEXIN ‐ 41 ‐ March 30, 2012
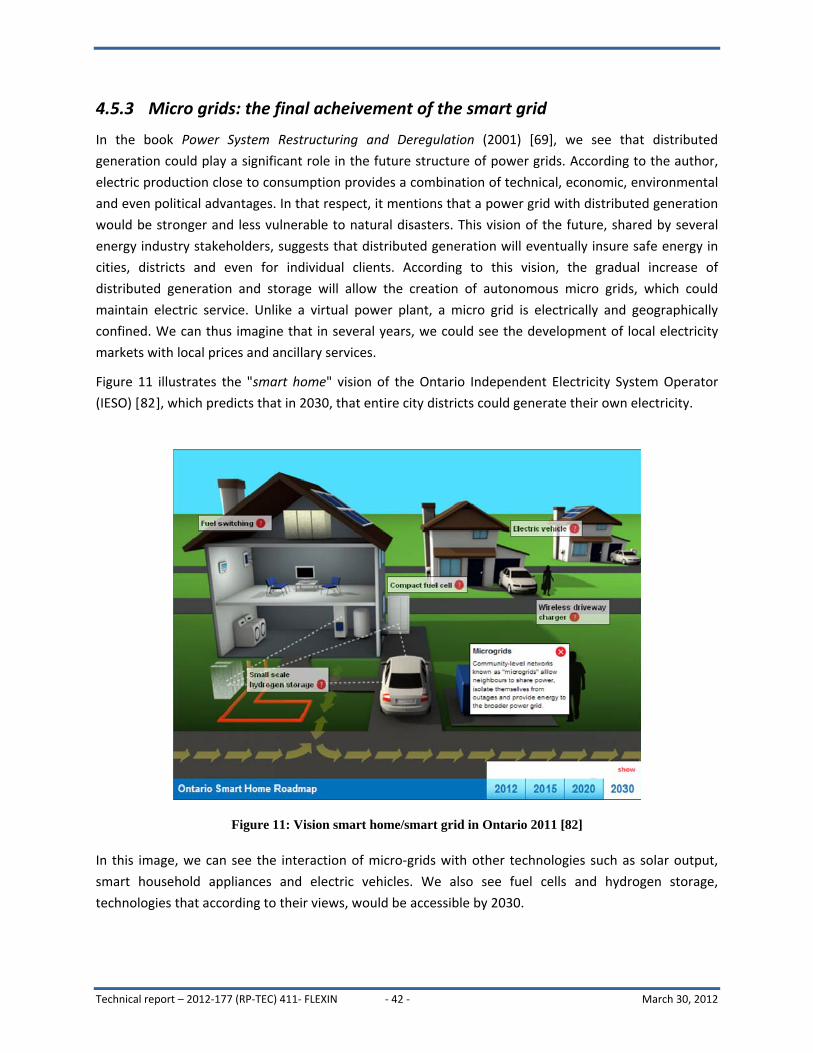
4.5.3 Micro grids: the final acheivement of the smart grid
In the book Power System Restructuring and Deregulation (2001) [69], we see that distributed
generation could play a significant role in the future structure of power grids. According to the author,
electric production close to consumption provides a combination of technical, economic, environmental
and even political advantages. In that respect, it mentions that a power grid with distributed generation
would be stronger and less vulnerable to natural disasters. This vision of the future, shared by several
energy industry stakeholders, suggests that distributed generation will eventually insure safe energy in
cities, districts and even for individual clients. According to this vision, the gradual increase of
distributed generation and storage will allow the creation of autonomous micro grids, which could
maintain electric service. Unlike a virtual power plant, a micro grid is electrically and geographically
confined. We can thus imagine that in several years, we could see the development of local electricity
markets with local prices and ancillary services.
Figure 11 illustrates the "smart home" vision of the Ontario Independent Electricity System Operator
(IESO) [82], which predicts that in 2030, that entire city districts could generate their own electricity.
Figure 11: Vision smart home/smart grid in Ontario 2011 [82]
In this image, we can see the interaction of micro‐grids with other technologies such as solar output,
smart household appliances and electric vehicles. We also see fuel cells and hydrogen storage,
technologies that according to their views, would be accessible by 2030.
Technical report – 2012‐177 (RP‐TEC) 411‐ FLEXIN ‐ 42 ‐ March 30, 2012

Technical report – 2012‐177 (RP‐TEC) 411‐ FLEXIN ‐ 43 ‐ March 30, 2012
Although the proportion of renewable energy on the distribution network remains low, distributed
generation capacity increases yearly in several markets. Electricity storage is in the beginning phase on
the grids, but the number of units should increase with numerous feed‐in tariff programs and
deployment of electric vehicles.
Developing this vision involves integrating distributed resources into urban planning study16 scenarios,
such as need for water, electricity, heating, air‐conditioning and transportation. By considering targeted
programs in certain overloaded districts and zones, it is possible to compensate for the higher costs of
these resources by avoiding upstream infrastructure costs. Such changes can begin now and be
staggered over a long period. However, they require that mechanisms (markets and regulations) be in
place so that decentralized solutions are promoted in the same way as centralized resources.
16 Refering to the “smart city” concept
5 Summary
The discussions presented in previous sections show the technical potential and socio‐economic aspects
regarding integration of distributed energy resources. The demonstration projects and technical studies
conducted thus far show that there is a significant potential for available flexible loads.
In summary:
Thermostat controlled loads are highly flexible. To some extent, setpoints can be changed without affecting the consumer/user. Air‐conditioning, smart water heating or ambient air conditionning can benefit from the thermal inertia of the reservoir or the building.
Dual‐energy or multi‐energy systems add flexibility to power grids, supplying both load‐shedding and storage capacity. In the context of a smart grid, these resources could be managed dynamically, supplying load‐shedding at peak demand from the operating reserve.
Urban heating systems with combined electricity and heat are one of the ways to make cities more
energy secure and to reduce electric grid stress. Based on local resources, these facilities can
integrate various primary energy sources, and these systems can simultaneously absorb surplus
power to produce the heating or self‐generate when needed. In the same vein, water pumping
apprears to be flexible enough to provide regulation service.
Electric vehicles are making their market appearance. Using smart recharge follows the availability
of local capacity and the grid power. It would automatically disconnect when detecting grid
disruption. Future developments could allow electric vehicles to discharge into the grid, but this will
depend on the evolution of this new industry and its technology..
Emergency generation units in the commercial or industrial sector can temporarily contribute to
emergency power supply or reduce peak power. Smart management of these facilities could
prioritize lower‐polluting generators (e.g. natural gas) over initializing less economic and more
polluting power plants (e.g . fuel oil), when ohter flexible resources are exhausted.
Smart homes and buildings using renewable energy, geothermal heat pumps and smart appliances to reduce grid stress. The deployment of energy management systems can change the load model for buildings and residences. Their optimum network integration will have to consider the occupants primarily, and later, ask them to participate in supplying energy for their community.
These resources, integrated into several aggregators or virtual power plants, could avoid capacity costs
and begin the transition to a grid comprised of several interconnected micro‐networks. To achieve this
level of distributed resources in communities, protocols, equipment and practices must be standardized.
The development of the smart grid answers a number of technical challenges, such as measurement,
individual resource management or data integration. Beyond the technical problems, this development
brings its share of economic, social and commercial concerns. Changes to existing industry, markets and
regulatory structures is likely and necessary:
Technical report – 2012‐177 (RP‐TEC) 411‐ FLEXIN ‐ 44 ‐ March 30, 2012
The introduction of distributed resources can initiate major changes in the industry. While new
technologies and new players appear, traditional industry, which holds a monopoly on solutions
to grid problems, may have an incentive to maintain market inertia. Several companies,
emergent or traditional, are called upon to contribute to this development. An opening to
changes seems to be a prerequisite among all industry participants.
Changes to industry structures and market rules are needed to broaden the range of energy
services. The opening to aggregation of smaller loads, distributed generation and storage seems
to be a strong trend, as well as new and innovative pricing regimes offered by electricity
resellers.
In terms of economic regulation, it must be noted that the economic regulation within the
electricity network businesses, i.e. transmission and distribution, (cost of service regulation),
most widespread in North America favours investing in grid assets rather than investments on
customers’s assets. Statutory changes may be necessary to incite public utilities to invest in
customers and communities, rather than in their grid.
Finally, the local context should influence strongly how smart grid programs are deployed. In fact,
commercial success of development of distributed energy resources will depend simultaneously on a
greater need for flexibility (high penetration of variable production or need for emergency supply) and
the local availability of balancing resources among consumers, small producers and storage operators.
This will determine the value of their service and the amounts shared between participants. Beyond the
economic considerations, there must be consumer acceptance as well as measures ensuring the
confidentiality and privacy of all actors, especially consumers. To that end, it would be necessary to have
a stronger value proposition and the assurance of information security to obtain customer commitment.
Technical report – 2012‐177 (RP‐TEC) 411‐ FLEXIN ‐ 45 ‐ March 30, 2012

6 Conclusion
The development of smart grids and improved information technologies are bound to facilitate
communications and data management with a large number of players in the electricity business. A
number of distributed resources should be then in a postion to assist with balancing renewable energies
or provide other ancillary services. By observing the scope of new and older technologies and the
possibilities in adapting the markets, it seems that demand‐side response, storage and distributed
generation are destined to succeed. In the medium term, with the increase of distributed generation
and available storage in battery‐driven vehicles, the dynamics of electricity networks and the industry
can be completely transformed as more resources will be available to support the operation of markets
or supply emergency energy during breakdowns.
Nowadays, power generation, transmission and distribution assets have depreciated for decades and
sometimes up to 100 years. By accepting the idea that costs of distributed generation, storage or
demand‐side management will continue to decrease, it would be wise to consider these new resources
in electricity supply plans and to design systems capable of managing these distributed resources.
Developing the full potential of demand‐side response is the starting point of several jurisdictions. In the
United States, the potential for demand response is estimated at 15% of the value of the grid's power
peak, from 90 to 140 GW. To harness this potential, aggregation has to be allowed on wholesale
markets and technologies need to be standardized so customers can have recourse to automated
demand management opportunities. With peak reduction as the main current achievable outcome of
demand response, peak power reduction can make network expansion projects useless. Hence, public
utilities should develop aggregation businesses as competitive complements to electric grid assets
management.
The development of these resources represents a significant business opportunity for many companies
and in some cases, an opportunity for customers to curb the effect of increasing electricity prices. As
careful investors, traditional public utilities have to recognize the scope of changes to come [22] and to
ensure that they are key figures in this new industry. However, new business cannot emerge without
structural or regulatory changes in that industry sector. Openness to changes by key figures in the
sector, governments and customers especially, is essential to the emergence of a modern, green and
competitive power industry, aligned on the 21st century economy.
Technical report – 2012‐177 (RP‐TEC) 411‐ FLEXIN ‐ 46 ‐ March 30, 2012

7 Appendix 1 – Network ancillary services
Ancillary services fulfill several network management functions aimed at power and voltage regulation
and restoration of network service after a major outage [83]. These services are procured by the
transmission operator from mostly generation assets sometimes through annual or short‐term markets
(spot).
To maintain continuous electricity service and standard frequency, electricity demand and generation
must be equal. Each grid must comply with a minimal reserve level, a value that differs according to grid
characteristics and criteria of current regional reliability. The following table presents ancillary services
involved in keeping the balance of active power consumed and generated, their goal and an
approximate response time. Please note that various terminologies may be used for ancillary services
[84].
Table 4 : Power System ancillary services Services Goal Category Response time
Spinning reserve 3 seconds Non-spinning reserve 10 to 30 minutesSupplementary reserve 30 to 60 minutes
0-3 seconds
3 seconds
Load Following Between 3 seconds and 10 minutes
Fill the energy gaps between dispatch orders (i.e. intra-hour variations).
Contingency Reserve
Regulation Reserve
Load following
Secondary control - Automatic Generator Control (AGC)
Primary control - Automatic frequency control
Continuously stabilize the frequency (no major event)
Stabilize the frequency during major events (i.e. loss of circuit or generation)
Essentially, the contingency reserve quickly resolves exceptional events, such as the loss of network and
generation equipment. This reserve should stabilize the frequency and fill the energy gaps when a
generator falls offline or during any other major event. Depending of the contingency reserve category,
spinning, non‐spinning of supplementary, this type of reserve should sometime be very quick at
responding (spinning) or available following a call from the system operator within several minutes
(non‐spinning and supplementary). Primary control reserve is deployed initially through automatic
action of generator governor control (primary control). The spinning reserve is used to contribute to
resetting the frequency to its nominal value (secondary control), and, finally, spinning reserve can
contribute to replace lost generation and replenich primary and secondary control reserves in the longer
term (tertiary control). As lead times needed to call in non‐spinning and supplementary reserves, these
generally can only contribute to tertiary control, which is based on transmission operator manual
actions.
Technical report – 2012‐177 (RP‐TEC) 411‐ FLEXIN ‐ 47 ‐ March 30, 2012
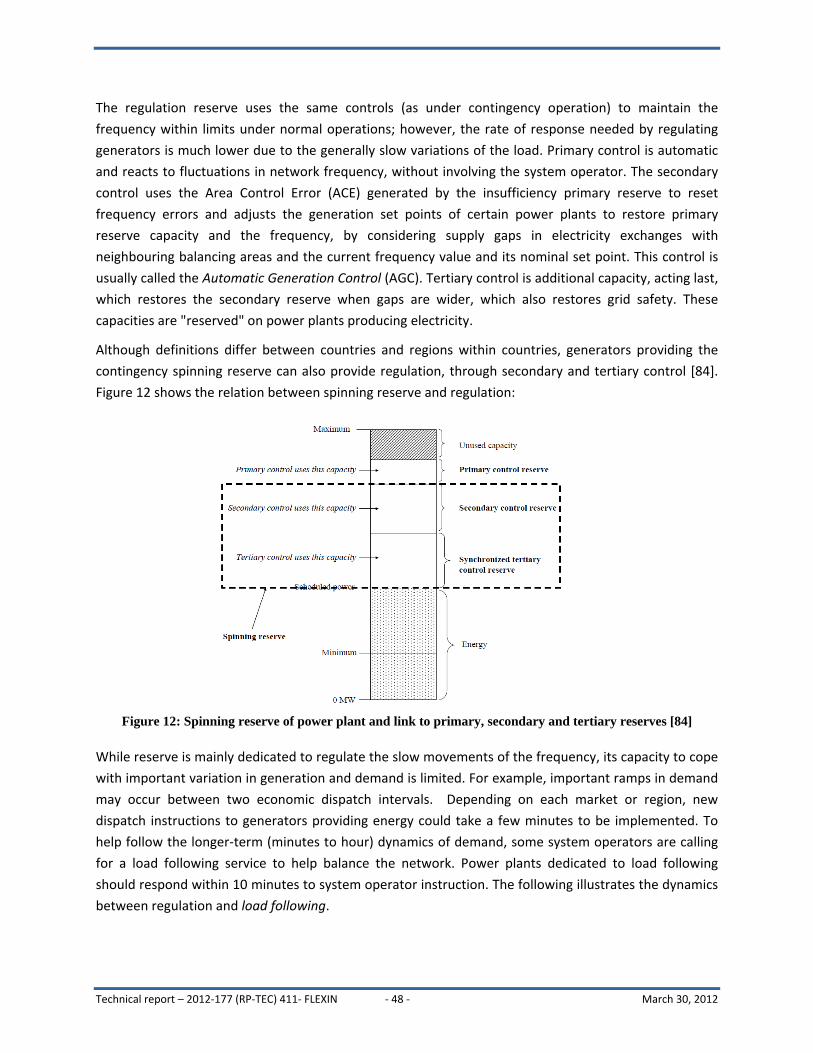
The regulation reserve uses the same controls (as under contingency operation) to maintain the
frequency within limits under normal operations; however, the rate of response needed by regulating
generators is much lower due to the generally slow variations of the load. Primary control is automatic
and reacts to fluctuations in network frequency, without involving the system operator. The secondary
control uses the Area Control Error (ACE) generated by the insufficiency primary reserve to reset
frequency errors and adjusts the generation set points of certain power plants to restore primary
reserve capacity and the frequency, by considering supply gaps in electricity exchanges with
neighbouring balancing areas and the current frequency value and its nominal set point. This control is
usually called the Automatic Generation Control (AGC). Tertiary control is additional capacity, acting last,
which restores the secondary reserve when gaps are wider, which also restores grid safety. These
capacities are "reserved" on power plants producing electricity.
Although definitions differ between countries and regions within countries, generators providing the
contingency spinning reserve can also provide regulation, through secondary and tertiary control [84].
Figure 12 shows the relation between spinning reserve and regulation:
Figure 12: Spinning reserve of power plant and link to primary, secondary and tertiary reserves [84]
While reserve is mainly dedicated to regulate the slow movements of the frequency, its capacity to cope
with important variation in generation and demand is limited. For example, important ramps in demand
may occur between two economic dispatch intervals. Depending on each market or region, new
dispatch instructions to generators providing energy could take a few minutes to be implemented. To
help follow the longer‐term (minutes to hour) dynamics of demand, some system operators are calling
for a load following service to help balance the network. Power plants dedicated to load following
should respond within 10 minutes to system operator instruction. The following illustrates the dynamics
between regulation and load following.
Technical report – 2012‐177 (RP‐TEC) 411‐ FLEXIN ‐ 48 ‐ March 30, 2012
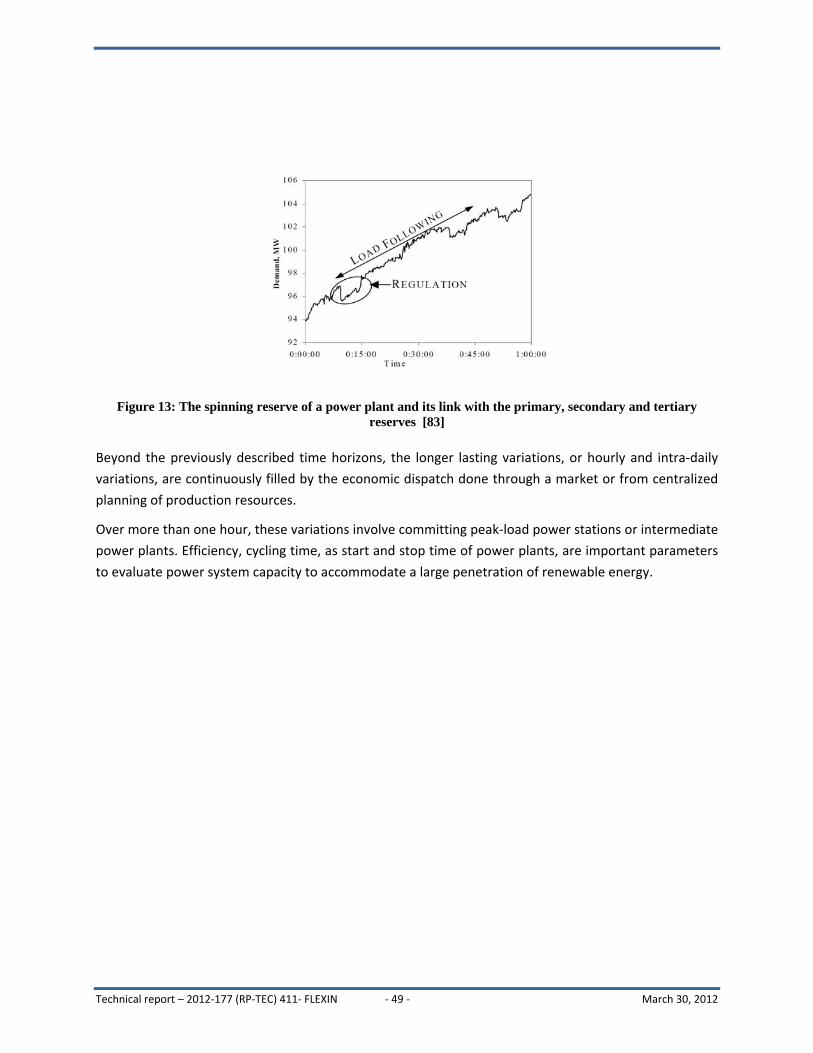
Figure 13: The spinning reserve of a power plant and its link with the primary, secondary and tertiary reserves [83]
Beyond the previously described time horizons, the longer lasting variations, or hourly and intra‐daily
variations, are continuously filled by the economic dispatch done through a market or from centralized
planning of production resources.
Over more than one hour, these variations involve committing peak‐load power stations or intermediate
power plants. Efficiency, cycling time, as start and stop time of power plants, are important parameters
to evaluate power system capacity to accommodate a large penetration of renewable energy.
Technical report – 2012‐177 (RP‐TEC) 411‐ FLEXIN ‐ 49 ‐ March 30, 2012
Technical report – 2012‐177 (RP‐TEC) 411‐ FLEXIN ‐ 50 ‐ March 30, 2012
8 References
[1] International Energy Agency, “Harnessing Variable Renewables − A Guide to the Balancing
Challenge”, 200 pp., ISBN 978‐92‐64‐11138‐7;
[2] Dominguez, T., Red Electrica de Espagna, “System Operation: Challenges for Wind Generation
Integration”, Dirección de Operación, September 2009;
[3] Hirst, E. and J. Hild, “Integrating Large Amount of Wind Energy with a Small Electric‐power
System”, April 2004;
[4] North American Electric Reliability Council (NERC), “Reliability Impact of Climate Change
Initiatives ‐ Technology Assessment and Scenario Development”, July 2010;
[5] Murphy, P., President and CEO, Independent Electric System Operator in Ontario, “Presentation to
the Stakeholder Advisory Committee”, March 2, 2011;
[6] Pillai, J.R., K. Heussen and P.A. Østergaard, “Comparative Analysis of Hourly and Dynamic Power
Balancing Models for Validating Future Energy Scenarios”, Elsevier, 2011, pp. 3233‐3243;
[7] European Technology Platform, “Smart Grids − Strategic Deployment Document for Europe’s
Electricity Networks of the Future”, April 2010;
[8] Windolf, M., “Flexible Electricity Demand in the Consumer Market”, 2009;
[9] Energinet.dk “EcoGrid.dk Phase 1 − WP4: New Measures for Integra on of Large Scale Renewable
Energy”, PSO R&D‐contract project, no. 2007‐1‐7816, 2007;
[10] United States Department of Energy, “Demand Dispatch − Intelligent Demand for a More Efficient
Grid”, prepared by National Energy Technology Laboratory, DOE/NETL‐ DE‐FE0004001, August 10,
2011;
[11] Singer, J. et al., Independent Electricity System Operator, “Enabling Tomorrow’s Electricity
System − Report of the Ontario Smart Grid Forum”;
[12] FERC Order No. 890 “Preventing Undue Discrimination and Preference in Transmission Service”,
72 Fed. Reg.12,266, March 15, 2007;
[13] IRC – ISO/RTO Council “North American Wholesale Electricity Demand Response Program
Comparison”, 2011, http://www.isorto.org;
[14] Sotkiewicz, P.M., Chief Economist, Markets, PJM Interconnexion, “Demand Response
Opportunities in PJM’s Markets”, PowerPoint presentation, April 2011;
[15] Lui, T. J., W. Stirling and H.O. Marcy, “Get Smart”, IEEE Power and Energy Magazine, June 2010,
pp. 66‐78;
Technical report – 2012‐177 (RP‐TEC) 411‐ FLEXIN ‐ 51 ‐ March 30, 2012
[16] Nissan Motor Co., Ltd., “Nissan Unveils New Power Supply System Through Nissan LEAF”, August
2, 2011, http://www.nissan‐global.com/EN/NEWS/2011/_STORY/110802‐01‐e.html;
[17] U.S. Department of Commerce, “NIST Framework and Roadmap for Smart Grid Interoperability
Standards − Release 1.0”, Office of the Na onal Coordinator for Smart Grid Interoperability,
January 2010;
[18] International Energy Agency, “Smart Grid Technology Roadmap”, 2011;
[19] Fox‐Penner, P., “Smart Power – Climate Change, the Smart Grid, and the Future of Electric
Utilities”, Island Press, 2010;
[20] IBM, “Switching Perspectives – Creating New Business Models for a Changing World of Energy”,
March 2010;
[21] McKinsey&Company, “McKinsey on Smart Grid”, Summer 2010;
[22] Berst, J., “The First Push”, Electric Perspectives,May/June 2010;
[23] Ipakchi, A. and F. Albuyeh, “Grid of the Future − Are We Ready to Transi on to a Smart Grid?”,
IEEE Power & Energy Magazine, March/April 2009, pp. 1540‐1552;
[24] Kueck, J., B.J. Kirby, M.R. Ally, et C.K. Rice, “Using Air Conditioning Load Response for Spinning
Reserve”, Energy and Transportation Science Division, Oak Ridge National Laboratory, ORNL/TM‐
2008/227, February 2009;
[25] Ericson, T., "Direct Load Control of Residential Water Heaters", Energy Policy, Elsevier, 2009, pp.
3502‐3512;
[26] Fowler Energy Company, “Demand Response Pilot Project Final Report”, created for the Center for
Commercialization of Electric Technologies, Austin, TX, March 2009;
[27] Faruqui, A. and S. Sergici, "Household Response to Dynamic Pricing of Electricity: a Survey of the
Experimental Evidence", January 10, 2009,
http://papers.ssrn.com/sol3/papers.cfm?abstract_id=1134132;
[28] Federal Energy Regulatory Commission, “A National Assessment of Demand Response Potential,”
juin 2009, http://www.ferc.gov/industries/electric/indus‐act/demand‐response/dr‐potential.asp;
[29] Faruqui, A., “Lessons from Demand Response: Trials and Potential Savings for the EU”, PowerPoint
presentation to Naval & Military Club, London, United Kingdom, October 2009;
[30] Newsham, G., B.J. Birt, and I. Rowlands, “A Comparison of Four Methods to Evaluate the Effect of
a Utility Residential Air‐conditioner Load Control Program on Peak Electricity Use”, Elsevier Energy
policy, August 2011;
[31] Molina‐Garcia, A., F. Bouffard, and D.S. Kirschen, “Decentralized Demand‐Side Contribution to
Primary Frequency Control”, IEEE Trans. Power Syst., vol. 26, no. 1, 2011;
Technical report – 2012‐177 (RP‐TEC) 411‐ FLEXIN ‐ 52 ‐ March 30, 2012
[32] DTU, Center for Elteknologi, “Demand as Frequency Controlled Reserve − Implementa on and
Practical Demonstration”, 2009‐12. Partners: Ea Energy Analyses, Vestfrost, Danfoss, Østkraft;
[33] New England FERC Filing on Non‐generation Sources of AGC, http://www.iso‐
ne.com/regulatory/ferc/filings/2008/aug/er08‐54‐000_001_8‐5‐08_reg_non‐gen_resrces.pdf;
[34] CAISO, “Operational Requirements and Generation Fleet Capability at 20% RPS”, August 31, 2010,
http://www.caiso.com/2804/2804d036401f0.pdf;
[35] Kiliccote, S., M.A. Piette, and J.H. Dudley, “Open Automated Demand Response for Small
Commercial Buildings”, Lawrence Berkeley National Laboratory, E. Koch, D. Hennage, Akuacom,
July 2009;
[36] NERC, “Accommodating High Levels of Variable Generation” Princeton, NJ, 2009;
[37] De Cesaro, J., K. Porter, and M. Milligan, "Wind Energy and Power System Operations: A Review of
Wind Integration Studies to Date", The Electricity Journal, Elsevier, December 2009, vol. 22, no.
10, pp. 34‐43;
[38] Loutan, C. and D. Hawkins, “Integration of Renewable Resources: Transmission and Operating
Issues and Recommendations for Integrating Rewewable Resources on the California ISO‐
Controlled Grid”. Fulsom, CA, CAISO, 2007;
[39] Stylianou, M., “Natural Resources Project Demonstrating: Automated Demand Response and
Readiness to Connect to the Smart Grid”, Natural Resources Canada, CanmetÉNERGIE à Varennes,
2011;
[40] Chardon, A., O. Almén, P.E. Lewis, J. Stromback, and B. Château, “Demand Response: a Decisive
Breakthrough for Europe. How Europe Could Save Gigawatts, Billions of Euros and Millions of Tons
of CO²”, CapGemini, 2008;
[41] PowerShift Atlantic, http://www.powershiftatlantic.com;
[42] Peralta, J., BC Hydro, “Planned Islanding and Energy Storage at BC Hydro”, presented at 4th
International Conference on Integration of Renewable and Distributed Energy Resources,
Albuquerque, December 2010;
[43] Pelland, S., D. Turcotte, G. Colgate, and A. Swingler, “Nemiah Valley Photovoltaic‐Diesel Mini‐Grid:
System Performance and Fuel Saving Based on One Year of Monitored Data”, IEEE Transactions on
Sustainable Energy, vol. 3, no. 1, 2012, pp. 167‐175;
[44] Katiraei, F. and C. Abbey, “Diesel Plant Sizing and Performance Analysis of a Remote Wind‐Diesel
Microgrid”, Power Engineering Society General Meeting, 24‐28 June 2007, IEEE , doi:
10.1109/PES.2007.386275, pp. 1‐8;

Technical report – 2012‐177 (RP‐TEC) 411‐ FLEXIN ‐ 53 ‐ March 30, 2012
[45] El‐Fouly, T. and S. Wong, CanmetENERGY, M. Wrinch, Pulse Energy Inc. « Gestion de l’appel de
puissance dans les communautés éloignées – Défis de mise en œuvre et résultats préliminaires
pour le village de Hartley Bay » , numéro CTEC 2011‐120, 2011;
[46] Callaway, D.S., “Tapping the Energy Storage Potential in Electric Loads to Deliver Load Following
and Regulation, with Application to Wind Energy”, Elsevier, Energy Conversion and Management
50, 2009, pp. 1389‐1400;
[47] Eto, J. H., Lawrence Berkeley National Laboratory, “Demand Response Spinning Reserve
Demonstration – Phase 2 Findings from the Summer of 2008”, prepared for Energy Systems
Integration ‐ Public Interest Energy Research Program ‐ California Energy Commission, April 2009;
[48] Kirby, B., “Spinning Reserve from Responsive Loads”, ORNL/TM 2003/19, Oak Ridge National
Laboratory, Oak Ridge TN, March 2003;
[49] Bain, J., D. L. O’Neal, M.A. Davis, and A. G. Rodriguez, “The Effect of Hardware Configuration on
the Performance of Residential Air Conditioning Systems at High Outdoor Ambient Temperatures,
EPRI TR‐106543, 1995;
[50] Intelligent Energy Europe, “Smart Domestic Appliances in Sustainable Energy Systems (Smart‐A)”,
IEE program (contract no. EIE/06/185/SI2.447477), November 2009;
[51] Paull, L., H. Li, and L. Chang, “A Novel Domestic Electric Water Heater Model for a Multi‐objective
Demand Side Management Program”, University of New Brunswick, Elsevier ‐ Electric Power
Systems Research 80, June 2010, pp. 1446‐1451;
[52] Kondoh, J., N. Lu, and D.J. Hammerstrom, "An Evaluation of the Water Heater Load Potential for
Providing Regulation Service", Power Systems, IEEE Transactions, vol. 26, no. 3, August 2011, pp.
1309‐1316;
[53] Steffes, P., “Grid‐interactive Renewable Water Heating Analysis of the Economic and
Environnemental Value”, Steffes Corporation white paper, 2010;
[54] Moffet, M.‐A., F. Sirois, and D. Beauvais, École Polytechnique de Montréal and CanmetÉNERGIE,
“Études de cas: L’équilibrage de la production éolienne à l’aide d’accumulateurs thermiques et de
chauffe‐eau électriques”, March 30, 2012;
[55] Laurent, J.C., G. Desaulniers, R. P. Malhamé, et F. Soumis, "A Column Generation Method for
Optimal Load Management via Control of Electric Water Heaters", IEEE Transactions on Power
Systems, vol. 10, no. 3, August 1995, pp. 1389‐1400;
[56] Moreau, A., “Control Strategy for Domestic Water Heaters during Peak Periods and its Impact on
the Demand for Electricity”, Energy Procedia 12, 2011, pp. 1074‐1082;
[57] L. Hughes, “Meeting Residential Space Heating Demand with Wind Generated Electricity”;

Technical report – 2012‐177 (RP‐TEC) 411‐ FLEXIN ‐ 54 ‐ March 30, 2012
[58] Moffet, M.‐A., F. Sirois, and D. Beauvais, École Polytechnique de Montréal et CanmetÉNERGIE,
“Études de cas: L’équilibrage de la production éolienne à l’aide d’accumulateurs thermiques et de
chauffe‐eau électriques”, July 12, 2011;
[59] Swan, L. G., V. I. Ugursal, and I. Beausoleil‐Morrison, “Canadian Housing Stock Database for
Building Energy Simulation”, 5th IBSA conference, May 21‐22, 2008, Québec;
[60] Togeby, M., EA Energys, “Intelligent Energy Systems ‐ A White Paper with Danish Perspectives”,
Danemark, May 2010;
[61] Kofod, C. et M. Togeby, “Demand Response Offered by Households with Direct Electric Heating.
Demand Response in Energy Markets”, conference minutes, Nordic Energy Research, November
26, 2004, Oslo: Nordic Energy Research;
[62] Risø National Laboratory for Sustainable Energy, “Risø Energy Report 8: The Intelligent Energy
System Infrastructure for the Future”, Technical University of Denmark, 2009;
[63] Kiliccote, S., P. Sporborg, I. Sheik, E. Huffaker, and M.A. Piette, Lawrence Berkeley National
Laboratory, “Integrating Renewable Resources in California and the Role of Automated Demand
Response”, 2010;
[64] F. Tuffner & M. Kintner‐Meyer, Pacific Northwest National Laboratory, “Using Electric Vehicles to
Meet Balancing Requirements Associated with Wind Power”, June 2011;
[65] Kintner‐Meyer, M. C.W., P. Balducci, C. Jin, T. Nguyen, M. Elizondo, V. Viswanathan, X. Guo, and F.
Tuffner, “Energy Storage for Power Systems Applications: A Regional Assessment for the
Northwest Power Pool (NWPP),” PNNL‐19300, Pacific Northwest National Laboratory, Richland,
WA, April 2010.
[66] Porter, J., “Lighting California’s Future: Integration of Lighting Controls with Utility Demand
Response Signals”, California Energy Commission, PIER Building End‐Use Energy Efficiency
Program. CEC‐500‐2011‐012, 2011;
[67] Masuta, T., A. Yokoyama et Y. Tada, « Modeling of a Number of Heat Pump Water Heaters as
Control Equipment for Load Frequency Control in Power Systems », IEEE trans;
[68] Heffner, G., K. Kintner‐Meyer, “Loads Providing Ancillary Services: Review of International
Experience”, Lawrence Berkeley National Laboratory, Environmental Energy Technologies Division,
mai 2007
[69] Loi Lei Lai, “Power System restructuring and Deregulation – Trading, Performance and Information
Technology”, City University, London, UK, 2001;
[70] Nguyen, D. T., M. Negnevitsky and M. De Groot, ”Pool‐based Demand Response Exchange—
Concept and Modeling”, IEEE Trans. Power Syst., vol. 26, no. 3, 2011, pp. 1677‐1685;
Technical report – 2012‐177 (RP‐TEC) 411‐ FLEXIN ‐ 55 ‐ March 30, 2012
[71] Wang, J., N. Encinas Redondo and F.D. Galiana, “Demand‐side Reserve Offers in Joint
Energy/Reserve Electricity Markets”, IEEE Trans. Power Syst., vol. 18, no. 4, 2003, pp. 1300‐1306;
[72] Karangelos, E. and F. Bouffard, “Towards Full Integration of Demand‐side Resources in Joint
Forward Energy/Reserve Electricity Markets”, IEEE Trans. Power Syst., vol. 27, no. 1, 2012, pp.
280‐289;
[73] Belhomme, R., M. Sebastian, A. Diop, M. Entem, F. Bouffard, G. Valtorta et al., “ADDRESS
Technical and Commercial Architecture”, livrable D1.1, ADDRESS Project, Brussels, Belgium:
European Commission, 2009.
[74] Wakefield, M., Program Manager, EPRI, “Customer Application Pilot Overview”,
http://www.smartgrid.epri.com/doc/15_ComEd%20Customer%20Application%20Pilot.pdf, June
9, 2010;
[75] Pacific Northwest National Laboratory, “Pacific Northwest National Laboratory Unveils
GridWiseTM Initiative to Test New Electric Grid Technologies”,
http://www.pnnl.gov/news/release.aspx?id=118;
[76] Ofgem, “Demand Side Response”, http://www.ofgem.gov.uk/Sustainability/Documents1/
DSR%20150710.pdf, 2010;
[77] National Grid plc., “Turn Down Your Power, Turn Up Your Profit”, http://www.nationalgrid.com/
NR/rdonlyres/306C5B80‐3AF1‐480A‐AA74‐A480D7399634/28078/Demand_side_leaflet.pdf, 2008;
[78] Prüggler, N., W. Prüggler and F. Wirl, “Storage and Demand Side Management as Power
Generator’s trategic Instruments to Influence Demand and Prices”, Energy, vol. 36, no. 11,
November 2011, ISSN 0360‐5442, 10.1016/j.energy.2011.09.048, pp. 6308‐6317;
[79] La tribune.fr, « Effacement diffus: Voltalis remporte une victoire devant le Conseil d’État », May
2011, http://www.latribune.fr/green‐business/l‐actualite/20110509trib000620333/effacement‐
diffus‐voltalis‐remporte‐une‐victoire‐devant‐le‐conseil‐d‐etat.html;
[80] Cass, N., G. Walker et P. Devine‐Wright, “Good Neighbours, Public Relations and Bribes: the
Politics and Perceptions of Community Benefit Provision in Renewable Energy Development in the
UK”, J Environ Pol Plan, vol. 12, no. 3, 2010, pp. 255‐275;
[81] Bouffard, F., F. González‐Longatt, C.‐L. Su, J. Jimeno, I. Laresgoiti, C. Noce, and M. Russo,
“Application of the ADDRESS Conceptual Architecture in Four Specific Scenarios”, livrable D1.2,
ADDRESS project. Brussels, Belgium: European Commission, 2010;
[82] Independent System Operator, “Modernizing Ontario’s Electricity System: Next Steps − Second
Report of the Ontario Smart Grid Forum”, May 2011, Image from web site:
http://www.ieso.ca/smarthomeroadmap/;

Technical report – 2012‐177 (RP‐TEC) 411‐ FLEXIN ‐ 56 ‐ March 30, 2012
[83] I. O. S. Subcommittee, “Reference Document − Interconnected Opera ons Services 1st ed.”, North
American Electric Reliability Council, Princeton, NJ, March 2002;
[84] Rebours, Y. and D. Kirschen, The University of Manchester, “What is Spinning Reserve? ”, October
2005.