smart meter 2020 vision - mlgw · smart meter 2020 vision ... • improved air quality through...
TRANSCRIPT

Smart Meter 2020 VisionNew Options for Customers
to Save Money, Time and Energy
MLGW Committee Meeting5/7/2013

2
Smart Meter Adoption Rates among TVA Distributors
• More than 37 million smart meters have been installed in the U.S.• TVA distributors with smart meter deployments:
– Chattanooga 170,000 smart meters, 100% of total meters– Gibson County Electric 35,000, 100% of total meters– Clarksville 31,000+, 100% of total meters– Bolivar Energy Authority 11,000+, 100% of total meters– Volunteer 112,000 meters, 99% of total meters– North Georgia 99,000 meters, 99% of total meters– Nashville 30,000 smart meters, 8% of total meters– Knoxville 6,000 smart meters– Huntsville preparing for summer deployment
• MLGW 1,200 smart meters, 0.2% of total meters

3
MLGW’s Journey to Smart Meters
• 10+ years of researching advanced meter technology, applicability to MLGW operations and customer benefits
• 1,000-meter Smart Grid Demo, 2010-12• 2013 originally proposed budget included 6,000
additional smart meters• City Council’s vision directed MLGW to revise
the budget by expanding from 6,000 to 60,000 meters in 2013

4
BENEFIT: Outage Management and System Monitoring
• Minimize or eliminate outage hotline contract (~$250,000 annually)
• Expedite utility outage awareness and troubleshooting
• Reduce service restoration times• Increase customer satisfaction through fewer
and shorter outages• Increase operational knowledge of MLGW
electric, gas and water systems

5
BENEFIT: Labor and Transportation
• Meter Reading stats– 12.3 million reads annually (E,G,W)– 92 Meter Readers– Average 24 vacancies per year; 26% annual attrition rate
• 150-200 net positions could be cut through full-scale smart meter deployment due to improved operating efficiencies and reduced service requests– Positions throughout Customer Care division, primarily Meter
Reading and Field Operations– Reduction will be achieved through attrition, not layoffs– Associated vehicle, maintenance and fuel savings– Some new positions would be created

6
BENEFIT: Safety
• Meter Readers– Drive 500,000+ miles per year– 55 Meter Reader injuries in 2012
• Vicious dog attacks (14)• Spider, bee and insect bites (10)• Slips, trips & falls (24)• Miscellaneous injuries (7)
– Risk exposure to crime, hostility and severe weather

7
BENEFIT: Billing
• Reduce estimated reads/bills (~3%)– Meter access issues (locked gates, bad dogs)– Manpower (light duty, turnover, vacation)– Extreme weather (temps >100º or <32º)
• Reduce meter reading errors (<1%)
• Reduce billing inquiries and mistrust• Identify and reduce utility theft
– 11,000 resolved diversion cases

8
BENEFIT: Time-of-Use Rate Option
• Completely voluntary• Provides financial incentive for customers to monitor and adjust electricity use during “on‐peak” hours
• On‐Peak: Dec‐Mar, weekdays, 4am‐10amJun‐Sept, weekdays, 12pm‐8pm
• Off‐Peak: All other hours, including every weekend; every day in April, May October and November; plus weekday observances of six designated holidays
• 87% of hours in the year are off‐peak• Impact on electricity cost depends on customer’s willingness to modify use (conservation, energy efficiency and load shifting)

9
BENEFIT: Customer Awareness
• Average Annual Household Electric Use in Tennessee is 38% higher than national
• MLGW customer average is 32% higher• Viewing daily, hourly and even 15-minute data
enables customers to better identify when and how home uses electricity
• Water leak alerts, consumption alerts and bill-to-date alerts provide added awareness

101010
Learn About Your Electricity Use in My Account at www.mlgw.com
ABOVE: Highest weekday use (74 kWh) occurred on 4/16
RIGHT: This shows 4/16 electricity use in 15-minute periods
View shows a customer on standard electric rate, with blue bars reflecting use.

111111
Learn About Your Electricity Use in My Account at www.mlgw.com
ABOVE: Highest weekday usage (35 kWh) occurred on 8/2, when average temperature was 88°
RIGHT: This shows 8/2 electricity use in 15-minute periods
View shows a customer on optional TOU Rate, with red bars indicating on-peak use and green bars representing off-peak use

12
BENEFIT: Customer Savings Opportunities:Reduce Energy and Water Usage
• Conservation—an action that results in the use of less energy or water– Adjusting thermostat, closing exterior doors, turning off lights in
empty room, taking shorter showers• Energy Efficiency—a purchase of a more energy-
efficient item to replace a less efficient item– Replacing HVAC, installing attic insulation, using CFL or LED
lights, replacing refrigerator (but only if you discard the old one!), repairing leaky faucet
• Voluntary Load Shifting—an action that delays the hour in which energy is used– In Summer: running dishwasher at 8:00pm instead of 7:00pm,
drying clothes at 10:00am instead of 3:00pm, running pool pump overnight instead of during day

13
BENEFIT: Customer Savings Opportunities: Lower Service Fees
Analog or Digital Meter
Smart Meter
Customer Savings
New Service Connection, same day $54.00 $25.21 $28.79
New Service Connection, next day $44.00 $25.21 $18.79
Non-payment reconnect $25.00 $11.44 $13.56
Reconnect with exception $25.00 $20.44 $4.56
Additional deposits, per reconnect, beginning with second occurrence
$50.00 $0 $50.00 per occurrence
Special Trip Meter Reading Charge, monthly
$9.13 $0 $9.13 per month

14
BENEFIT: Community Impacts: Environmental
• Water leak detection alerts customers to problems before they may be noticeable, preserving water resources
• Improved air quality through reduced utility vehicle emissions and reduced power generation
• Avoided emissions from electricity use reductions equivalent to removing 59,000 to 89,000 vehicles from the road

1515
Potential Avoided Emissions (Smart Grid Demo Results Extrapolated to All
Residential Customers)
Calculated using EPA’s web calculators and 360,000 residential customers
Study Group
Avoided kWh, Total
Residential Customers
Carbon Dioxide (CO2) Lbs per Year
Sulfur Dioxide (SO2) Lbs per Year
Nitrogen Oxides (NOx)
Lbs per Year
Equivalent to # Passenger Vehicles
Removed from Road
All Smart Meter 403,794,897 577,343,423 1,368,959 433,645 59,354
Standard Rate, Smart Meter 392,011,849 564,927,435 1,339,519 424,320 57,622
Time of Use Rate, Smart Meter 608,410,913 875,327,125 2,075,518 657,462 89,430

16
BENEFIT: Community Impacts:Helping Impoverished Customers
• 27% poverty rate in Memphis (2012 U of M study)
• Smart meters– Reduce connect and re-connect fees
• Potential savings: $1M to $2.1M annually– Provide opportunity to track usage and better control
utility cost• Smart meters with pre-pay service option (similar to
cellphone offerings)– Eliminate and reduce fees
• Potential savings: $5.3M to $10.6M– Eliminate need for deposit
• Potential one-time impact: $3.7M to $7.5M

171717
BENEFIT: Community Impacts: Job Creation
• Economic Impact Study (Younger Associates, May 2010)– $10 million in utility savings among customers would
create 152 jobs through increased discretionary spending in community
• Smart Meter Demo results:– $30 million in potential annual utility savings– 456 new jobs

18
Upcoming Resolutions
• Elster contract, $10.15 million• Aclara change order, $100,750• Voluntary Time-of-Use Rate

19
Elster Contract
• $10.15 million maximum value– Smart meters– Telecommunications– Meter data management system– Pre-pay system

20
Elster Warranties/Equipment Life
• Elster products have solid warranties and performance– 24-month meter warranties– 20-year battery life– 25 to 30-year expected equipment life for
electric and gas meters; 15-year life for water meters

21
60,000-meter Installation
• Approximately 24,000 households will receive smart meters– ~24,000 electric meters– ~20,000 gas meters– ~15,000 water meters
• Customers may opt-out and decline smart meter

22
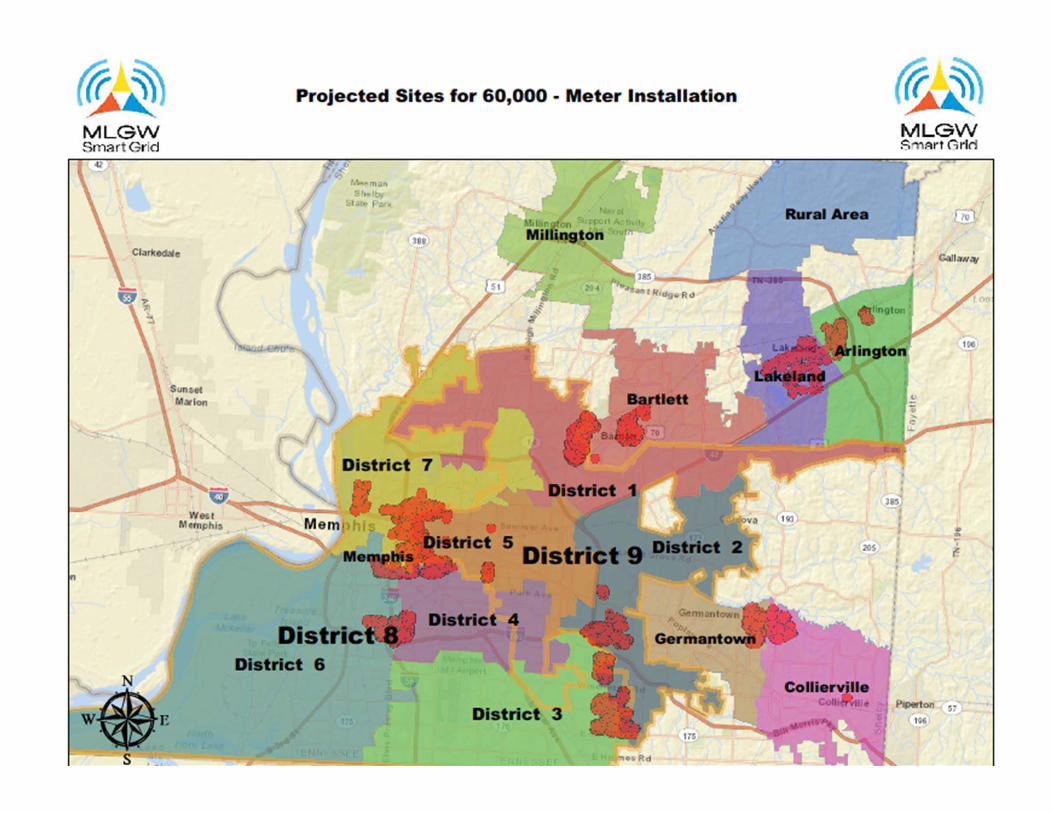
60,000-meter Locations
• 80% in City, 20% in County• Locations in each Council district• Capitalizing on existing MLGW
infrastructure• Clustered by meter reading routes,
eliminating 3 to 6 routes per billing cycle, daily
23

24
Aclara Contract Change Order
• Provider of web-based energy and bill analysis tools within My Account
• Adds email alert options– Weekly bill-to-date – Monthly threshold exceeded (based on
customer-selected electric, gas and water usage or dollar amounts)

25
Voluntary Time-of-Use Rate
• Optional for any customer with electric smart meter
• Effective 10/1/2013• Replaces existing TOU pilot rate, which
expires 9/30/2013• Item requires Council to convene as a
rate-making body

Smart MeterMyths & Realities
26

27
0.0001
0.01
1
1
1
0.005
0.02
5
10
42
‐ 10 20 30 40 50
SmartMeters
WiFi
MicrowaveOven
Cellphone
Walkie‐Talkie
Radio‐Frequency Exposure Levels from Smart Meters*In Milli‐Watts/Centimeter2
High RangeLow Range
* Select Information from Richard Tell Associates , Inc
Myth: Smart Meters Emit Dangerous RF
• Every day, people use and keep near to them many devices that utilize radio frequency (RF) waves, including microwave ovens, cellular telephones and wireless home networks.
• The Federal Communications Commission (FCC) sets RF limits and requires that all radio communicating devices be tested to ensure that they meet federal standards .
• Smart meters emit less radio frequency energy than many other commonly‐used wireless devices which, like smart meters, are safe and FCC‐approved.
• Learn more at www.mlgw.com/smartgrid Exposure from Elster smart meter selected by MLGW if
operating in constant communication mode (100% duty cycle). Normal smart meter duty cycle is near 1%, so actual exposure is far less than value shown.

28
Myth: Smart Meters Cause Fires
• Smart meters do not cause fires– As determined by Fire Marshal/Fire Department officials from
around the world, including in Florida, Maryland, California, Canada and Australia
– MLGW has had 0 fires from smart meters during demo and 0 fires from other electric meters
• Conditions in the customer-owned electric meter socket and wiring within the home can cause fires– Meter socket and electric wiring are installed by builder’s
electrical contractor at time of construction and are property of building owner
– MLGW will fund the repair or replacement of problematic meter sockets during smart meter installation

29
Meter Socket is Point of MLGW Service Delivery
Weatherhead to Socket: Customer property
Overhead Electric Service Lines: MLGW property
Electric Meter Socket: Customer property
Electric Meter: MLGW property

30
Inside an Electric Meter Socket

31
Myth: TOU Rate Forces Customers to Do Laundry at 2:00am
• Time-of-Use (TOU) electric rate is optional• TOU rate gives customer the option of
paying less for electricity use during off-peak periods (when electricity demand and generation costs are lower) and more for electricity use during on-peak periods (when demand and costs are higher)
• 87% of hours in a year are off-peak

32
MLGW Customer Interest in Smart Meter Benefits
• 2009-2010 survey of new service opportunities– Internet – Community events – MLGW Community Offices
• 2,737 respondents, 95% confidence +/- 5
• All ZIP Codes represented


34
What Customers Said They Want
• 95% want MLGW to be notified automatically when power is out
• 91% want their MLGW bill to be based on actual readings, not estimates
• 88% want to know their bill amount as it grows during the month—with 22% interested in checking daily
• 86% want MLGW to make capital investments to improve system monitoring and control, which would reduce power outages
• 66% indicated they would be willing to consider reducing electricity use at certain times of day, while another 26% indicated they might
• …and these desired benefits/services can only be achieved by installing smart meters

35
What Demo Customers Said• With a few simple changes, we made a significant reduction in our consumption. Stephen T• Smart Meter offers an effective way to change homeowner's behavior by providing timely
feedback on actual energy usage. For those interested in becoming involved in managing energy usage, this is a smart approach. Roosevelt A
• Saved a lot of money learning when to use appliances, LED usage and ceiling fan usage during summer and winter…It was actually fun to learn how to save. Brad & Carolyn D
• I think everyone should have a smart meter and the ability to look at their home’s energy graphs online. David B
• We love the SmartMeter and the data it provides. It has become a challenge in our house to reduce the energy consumption.The Time-of-Use rates are also a great benefit. David K
• Electricity is invisible, the meter helped me understand something I couldn't see. Iva D• I learned how to monitor my energy resources more efficiently. Esther W• I really liked the program. It was informative and beneficial to me. I welcome any
opportunity to learn about my energy consumption and ways to reduce it. Anthony D• I like this project. It has made me a better informed consumer. Pamela F• It has changed the way we use power. Andrew I• This project opened eyes and was very meaningful in that it caused me to look at energy
usage, availability, conservation and technology in so many new and exciting ways. Tim F

MLGW’s Business Practice is Standard Service, with Options to Opt-Out
STANDARD1. Printed bill 2. Bill for actual
monthly usage 3. Cycle billing4. Pay by mail/office5. Pay bill in full6. Smart meter
OPT-OUT OPTION1. eBilling2. Budget Billing3. Net Pay4. AutoPay5. Potential payment
arrangements6. Non-smart meter
36

Evolution of Technology• Horse and buggy to car• Typewriter to computer to tablet• Operators to rotary phone to push button to smart phone• Bank teller to ATM to mobile banking from smart phone• Wooden cabinet TV to big screen to watching on smart
phone• Film camera to digital camera to smart phone• Candle to light bulb• Analog meter to digital meter to smart meter is just
another technological advancement
37

Smart Meters Deliver New Options for Customers
to Save Money, Time and Energy
38