smart metering –what now?€¦ · · 2018-03-14smart metering –what now? howard a. scott,...
TRANSCRIPT

October 19 – 21, 2009, Sao Paulo, BRAZIL
Smart Metering – What Now?
Howard A. Scott, Ph.D. Managing Director Cognyst Advisors
USA
October 19 – 21, 2009Transamerica Hotel, Sao Paulo,BRAZIL
COGNYST ADVISORSTechnology for the Utility Industry
October 19 – 21, 2009, Sao Paulo, BRAZIL
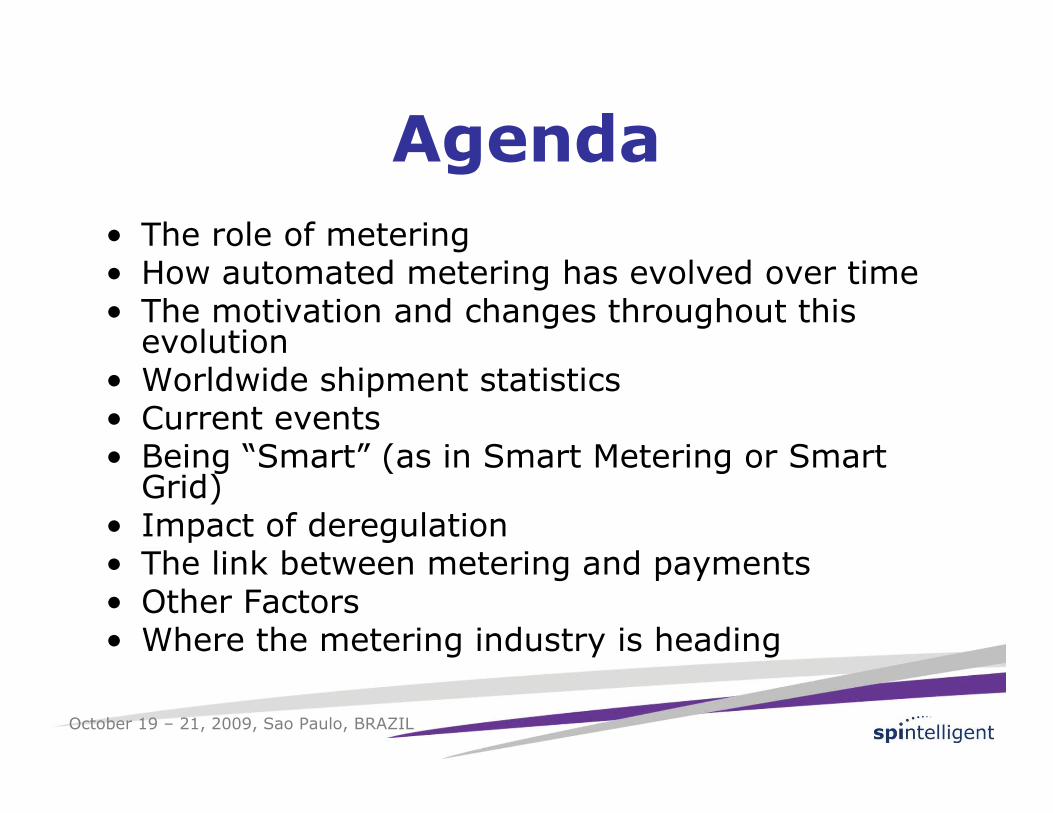
Agenda
• The role of metering• How automated metering has evolved over time• The motivation and changes throughout this evolution
• Worldwide shipment statistics• Current events• Being “Smart” (as in Smart Metering or Smart Grid)
• Impact of deregulation• The link between metering and payments• Other Factors• Where the metering industry is heading

October 19 – 21, 2009, Sao Paulo, BRAZIL
Types of Meter Discussed• This talk addresses electric, gas, water and heat
metering• It also discusses related topics, such as prepay
metering, deregulation, etc.• Because most of the recent activity emanates
from the electric utility industry, electric metering is more often addressed
• In most instances, there are water, gas and heat versions of the examples given for electric

October 19 – 21, 2009, Sao Paulo, BRAZIL
Introduction• The utility industry worldwide is now going through
its greatest change since the late 1800’s• Suddenly, electric utilities want a “Smart” Grid• Leaders who were trained to be “conservative” are
now being asked to make bold changes• Government funding is available (at different levels)
for many of these projects in many countries• Worldwide financial crisis and stimulus initiatives
are changing our marketplace• Country-to-country differences gradually
disappearing

October 19 – 21, 2009, Sao Paulo, BRAZIL
Role of Metering
• Society sets rules for utilities; meters help implement them• The meter is the point where the technology of the utility
begins to provide services to consumers• All metering products & services relate to people; we must
not forget the roles & needs of people as we plan services• Metering is closely linked to payments; there are many
different approaches to both metering and payments• Technology will evolve over time; we must allow for
innovation• Money is not unlimited; we must balance benefits with
costs, risks and the availability of funds

October 19 – 21, 2009, Sao Paulo, BRAZIL
Society’s Objectives
• Build a modern utility infrastructure• Connect infrastructure to homes, businesses• Cover costs; ensure profit where permitted• Equitably spread the costs of running the utility• Evolve to meet society’s changing needs (a
key driver for Smart Metering, Smart Grid …)

October 19 – 21, 2009, Sao Paulo, BRAZIL
People &Their Problems
• If projects fail, it is usually the result of utilities not dealing with staff needs, or government concerns or the needs of their customers
• Projects rarely fail because the equipment fails; the worst problems occur when project staffs are poorly managed or senior management is not committed to the project
• Therefore, we must remember to focus on the people issues

October 19 – 21, 2009, Sao Paulo, BRAZIL
How Automated Metering has Evolved over Time
• Generation 1: Metering originally created to help utilities bill for services. Advanced Metering started by replacing manual reading with a remote reading system
• Generation 2: Added functionality to AMR systems. Introduce prepay and submetering systems
• Generation 3: Upgraded AMR to AMI – Collected/stored many meter reads
• Generation 4: Smart Metering – Use metering as operations and planning tool; start to integrate prepay and AMR
• Generation 5: Smart Grid – Jointly manage metering & grid • Generation 6: Smart Utility – Dynamic decision-making

October 19 – 21, 2009, Sao Paulo, BRAZIL
Generation 1 MotivationMetering originally created to help utilities bill for
services. Advanced Metering starts by replacing manual reading with a remote reading system
• Provide an equitable basis for bills• Lack of access to meters• Resolve meter reading errors• Safety for meter reader• Document how much (electric, gas, water, heat,
sewage, etc.) each customer is using

October 19 – 21, 2009, Sao Paulo, BRAZIL
Generation 1 ChangesReplace or retrofit existing meters to introduce AMR
communications
• The first time some meters replaced for reason other than failure or accuracy; many are still retrofit; expected meter life approximately 20+ years
• Communication is typically one-way to utility; a few systems support a wake-up signal
• Basic meter data collection system is installed• Cost justification is primarily staff reduction• Meter technology primarily electromechanical

October 19 – 21, 2009, Sao Paulo, BRAZIL
Generation 2 MotivationAdd functionality to AMR systems; Introduce prepay and
submetering systems
Generation 1 plus:• Understand how much is unaccounted (usually due to
inefficiencies, built-in losses or theft) • Resolve payment problems• Identify unknown customer• Collect and display historic usage information

October 19 – 21, 2009, Sao Paulo, BRAZIL
Generation 2 ChangesEnhance meter functionality, accuracy and
communications
Generation 1 plus:• Some utilities replace electromechanical meters with
digital meters (lifetime of meters and meter system shrinks to approximately 15 years)
• Communication is primarily one-way• Meter data collection systems enhanced, but still basic• Utilities become willing to consider some “soft costs” in
business case

October 19 – 21, 2009, Sao Paulo, BRAZIL
Generation 3 MotivationUpgrade AMR to AMI – Collect/store many meter reads
Generation 2 plus:• Collect massive amounts of usage data; store data in
Meter Data Management (MDM) system• Scattered pre-Smart Meter functionality• Vendor-specific solutions• Support time-differentiated rates

October 19 – 21, 2009, Sao Paulo, BRAZIL
Generation 3 ChangesUpgrade AMR to AMI – Collect massive amounts of data
Generation 2 plus:• New digital meters installed in almost all instances; meter
lifetime shrinks to approximately 10 years• Data communications embedded in meters; many vendors
cross-license the technology• Some vendors build basic front-end systems, but bulk of
data in Meter Data Management (MDM) system• For electric meters, two-way comm. widely used• Reprogrammable meters & remote disconnects common• Business cases include “soft costs”

October 19 – 21, 2009, Sao Paulo, BRAZIL
Generation 4 MotivationThe future: Smart Metering – Use metering as an operations
and planning tool; start to integrate prepay and AMR
Generation 3 plus:• Frequent meter reads (possibly many times per hour)• Net-metering (measure flow to and from customer)• Remotely re-programmable meter• Remote disconnect (ensures safety of utility’s workers)• Standards-based interfaces; less vendor-specific features• Integrate metering with other utility operations systems• Meter-driven applications (DR, outage management …)• etc.

October 19 – 21, 2009, Sao Paulo, BRAZIL
Generation 4 ChangesSmart Metering – Significantly increase meter
functionality; begin to integrate utility software systems
Generation 3 plus:• Total replacement of meter population being
considered (meter lifetime shrinks to below 10 years)• All features on previous slide• Drives the integration of all utility operations systems• Utility cost/consumption display devices in home• Staff retraining increasingly important

October 19 – 21, 2009, Sao Paulo, BRAZIL
Generation 5 MotivationSmart Grid – Jointly manage metering & grid (future)
Generation 4 plus:• Combine metering, other data and grid sensors
(including SCADA) to jointly manage utility operations• Integrate workforce management tools with operations• Integrate planning tools for grid and metering• Use these tools to manage growth, repair, maintenance
and service quality• Dynamically address outages and other utility events• Deliver more information to utility and customer

October 19 – 21, 2009, Sao Paulo, BRAZIL
Generation 5 ChangesSmart Grid – Jointly manage metering & grid (future)
Generation 4 plus:• Smart Metering a prerequisite; lifetime of meter no
longer an issue• Cost to replace whole grid too high; sensors and comm.
added to existing grid electronics to control costs; massive grid replacements begin
• Consumers install equipment to generate/store power• Requires major re-design of software systems• Significant amount of staff retraining

October 19 – 21, 2009, Sao Paulo, BRAZIL
Generation 6 MotivationSmart Utility – Dynamic decision-making (future)
Generation 5 plus:• Add data mining tools to integrated operations• Build a common operations system that dynamically
tracks system performance, engineering projects, inventory and expenditures, workforce, etc.
• Build dynamic decision-making system based on existing operations rules that automatically recommends moment-by-moment operation of the entire utility

October 19 – 21, 2009, Sao Paulo, BRAZIL
Generation 6 ChangesSmart Utility – Dynamic decision-making (future)
Generation 5 plus:• Customer service now the key priority• Requires major new software systems• Utilities must undergo significant reorganizations;
deregulation common worldwide• Meters can support prepay or postpay, at customer’s
request• Utility staffs shrink; on-going staff retraining

October 19 – 21, 2009, Sao Paulo, BRAZIL
Other Factors that Affect Metering
• Deregulation• Payments• Technology does not make a utility “smart,”
systems do• People problems• Paying for all these changes• Aggregation of vendors

October 19 – 21, 2009, Sao Paulo, BRAZIL
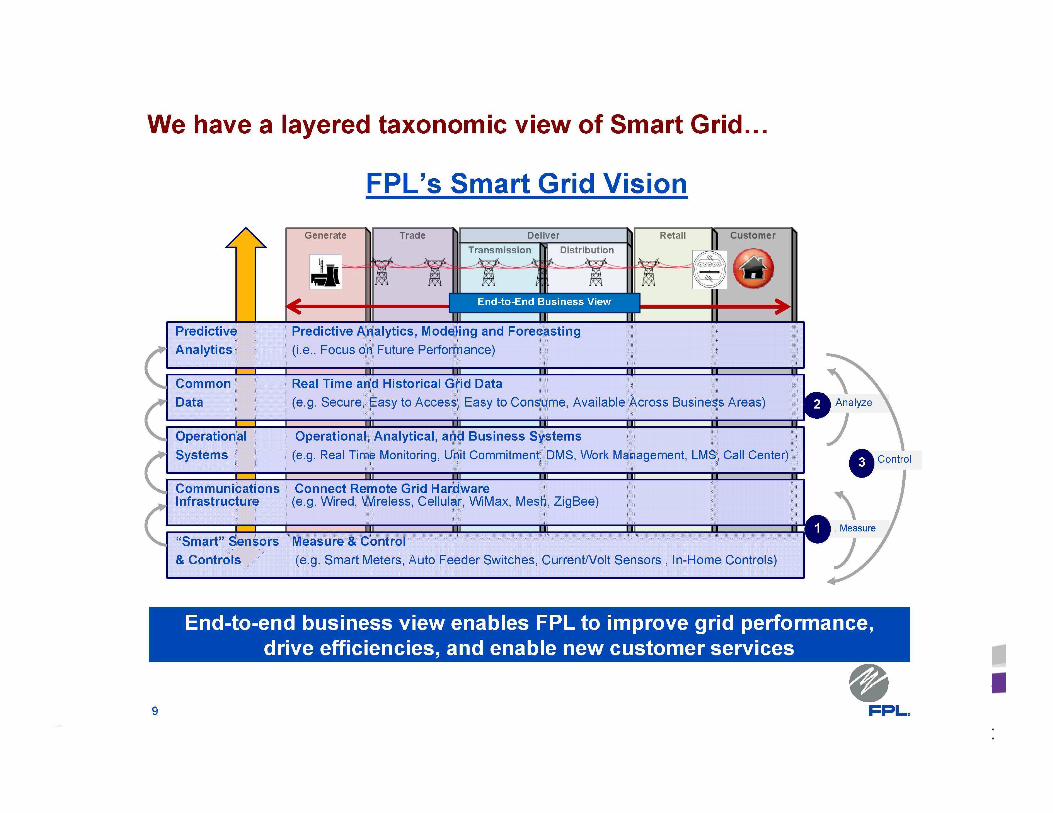
A Real-World Example
• Slides provided by FPL in March 2009• FPL has been progressive in integrating its
operations systems• Though utility is U.S.-based, it’s lessons are
applicable worldwide

October 19 – 21, 2009, Sao Paulo, BRAZIL

October 19 – 21, 2009, Sao Paulo, BRAZIL

October 19 – 21, 2009, Sao Paulo, BRAZIL

October 19 – 21, 2009, Sao Paulo, BRAZIL
October 19 – 21, 2009, Sao Paulo, BRAZIL

October 19 – 21, 2009, Sao Paulo, BRAZIL

October 19 – 21, 2009, Sao Paulo, BRAZIL

October 19 – 21, 2009, Sao Paulo, BRAZIL

October 19 – 21, 2009, Sao Paulo, BRAZIL

October 19 – 21, 2009, Sao Paulo, BRAZIL

October 19 – 21, 2009, Sao Paulo, BRAZIL
AMR Worldwide Statistics

October 19 – 21, 2009, Sao Paulo, BRAZIL
AMR Units Are Worldwideas of 1 January 2008
Source: The Scott Report: Worldwide Deployments of Automated Metering Devices
Region # Cumulative % Cumulative # Projects % Projects North America 120,756,669 66.3% 12,085 89.3% Europe 46,055,966 25.3% 883 6.5% Asia 13,463,739 7.4% 228 1.7% Central & South America 980,045 0.5% 147 1.1% Middle East 375,532 0.2% 51 0.4% Australia/NZ 173,548 0.1% 78 0.6% Misc. 158,899 0.1% 11 0.1% Africa 105,358 0.1% 53 0.4%
Total: 182,069,756 100.0% 13,536 100.0%

October 19 – 21, 2009, Sao Paulo, BRAZIL
The U.S. as an Example• The AMR market started in the U.S., the AMI
and Smart Meter markets had their first major successes there, and the best statistics showing market growth are from the U.S.
• Over the next 5 years, the U.S. will maintain its lead, and then gradually cede it to Europe and China
• Smart Metering will first have large deployments in the U.S.
• Therefore, we often use the U.S. as an example

October 19 – 21, 2009, Sao Paulo, BRAZIL
NA Shipments of AMR/AMI Units(as of 1 January 2009)
Meter Type # AMR UnitsMarket Share
Annual Shipments
# AMR Projects
Electric 68,845,601 48.3% 9,498,236 3,455Gas 39,220,233 27.5% 5,976,741 777Water 34,311,793 24.1% 5,673,098 7,806Misc. 42,163 0.0% 0 47
Total: 142,419,790 100.0% 21,148,076 12,085
Source: The Scott Report: Worldwide Deployments of Automated Metering Devices

October 19 – 21, 2009, Sao Paulo, BRAZIL
Inconsistent Growth Worldwide
Source: The Scott Report: Worldwide Deployments of Automated Metering Devices
Region 2007 2006 2005 2004 2003
North America 18,335,814 16,994,422 13,602,637 10,874,418 11,678,752 Asia 5,565,845 3,749,559 30,416 130,418 87,062 Europe 4,191,715 3,661,636 9,744,787 9,373,480 8,594,934 Central & South America 333,202 406,773 32,526 44,638 6,658 Middle East 75,087 8,573 5,669 13,375 0 Australia/NZ 30,020 32,959 5,887 3,268 1,305 Africa 23,222 15,503 30 1,000 7,450
Miscellaneous 0 0 78,621 0 -3,207
Total: 28,554,905 24,869,425 23,500,573 20,440,597 20,372,954

October 19 – 21, 2009, Sao Paulo, BRAZIL
Shipments by Type of Meter
Source: The Scott Report: Worldwide Deployments of Automated Metering Devices
Region # Units Shipped # Projects Worldwide 182,069,756 13,536 North America 120,756,669 12,085 Rest of World 61,313,087 1,451 Electric 102,714,528 4,341 Gas 35,272,966 831 Water 43,411,518 8,226 Heat 586,059 42 Miscellaneous 84,685 96

October 19 – 21, 2009, Sao Paulo, BRAZIL
Worldwide Growth
0
5,000,000
10,000,000
15,000,000
20,000,000
25,000,000
30,000,000
35,000,000
1997 1998 1999 2000 2001 2002 2003 2004 2005 2006 2007
Un
its S
hip
ped
Total Annual Shipments - Worldwide
0
2,000,000
4,000,000
6,000,000
8,000,000
10,000,000
12,000,000
14,000,000
16,000,000
1997 1998 1999 2000 2001 2002 2003 2004 2005 2006 2007
Uni
tsS
hipp
ed
Total Annual Shipments - Electric
0
2,000,000
4,000,000
6,000,000
8,000,000
10,000,000
1997 1998 1999 2000 2001 2002 2003 2004 2005 2006 2007
Uni
ts S
hipp
ed
Total Annual Shipments - Water
0
1,000,000
2,000,000
3,000,000
4,000,000
5,000,000
6,000,000
7,000,000
1998 1999 2000 2001 2002 2003 2004 2005 2006 2007
Un
its S
hipp
ed
Total Annual Shipments - Gas
Source: The Scott Report: Worldwide Deployments of Automated Metering Devices

October 19 – 21, 2009, Sao Paulo, BRAZIL
North American AMR/AMI Market
Total Annual Shipments (CAGR 14.4%)
0
4,000,000
8,000,000
12,000,000
16,000,000
20,000,000
24,000,000
1997
1998
1999
2000
2001
2002
2003
2004
2005
2006
2007
2008
Uni
ts S
hipp
ed
Total Annual Shipments - Electric (CAGR 16.2%)
0
2,000,000
4,000,000
6,000,000
8,000,000
10,000,000
1997
1998
1999
2000
2001
2002
2003
2004
2005
2006
2007
2008
Uni
ts S
hipp
ed
Total Annual Shipments - Gas (CAGR 10.2%)
0
1,000,000
2,000,000
3,000,000
4,000,000
5,000,000
6,000,000
1997
1998
1999
2000
2001
2002
2003
2004
2005
2006
2007
2008
Uni
ts S
hipp
ed
Total Annual Shipments - Water (CAGR 17.5%)
0
1,000,000
2,000,000
3,000,000
4,000,000
5,000,000
6,000,000
1997
1998
1999
2000
2001
2002
2003
2004
2005
2006
2007
2008
Uni
ts S
hipp
ed

October 19 – 21, 2009, Sao Paulo, BRAZIL
Annual Electric Smart Meter Deployments
0
2,000,000
4,000,000
6,000,000
8,000,000
10,000,000
Un
its D
ep
loye
d

October 19 – 21, 2009, Sao Paulo, BRAZIL
Ratio Electric Smart Meter to AMR
0.0%
10.0%
20.0%
30.0%
40.0%
50.0%
60.0%
70.0%
80.0%
Rat
io o
f Shi
pmen
ts

October 19 – 21, 2009, Sao Paulo, BRAZIL
Rapid Evolution to Smart Meters• Three years ago, Smart Meters didn’t exist• Today, they dominate the market in North America• This evolution will rapidly spread around the world• Key impacts of this change:
– Existing meters cannot be modified to become Smart– Replacement of most electric meters worldwide is
likely– The market for recycled meters will quickly disappear
• A new history is emerging: happening now in North America and emerging elsewhere

October 19 – 21, 2009, Sao Paulo, BRAZIL
Fixed/Mobile in North Amer.
Source: The Scott Report: AMR Deployments in North America
All Utilities
0.0%
20.0%
40.0%
60.0%
80.0%
100.0%
1997 1998 1999 2000 2001 2002 2003 2004 2005 2006 2007 2008
Year
Mobile
Fixed
Electric Utilities
0.0%
20.0%
40.0%
60.0%
80.0%
100.0%
1997 1998 1999 2000 2001 2002 2003 2004 2005 2006 2007 2008
Year
Mobile
Fixed
Gas Utilities
0.0%
20.0%
40.0%
60.0%
80.0%
100.0%
1997 1998 1999 2000 2001 2002 2003 2004 2005 2006 2007 2008
Year
Mobile
Fixed
Water Utilities
0.0%
20.0%
40.0%
60.0%
80.0%
100.0%
1997 1998 1999 2000 2001 2002 2003 2004 2005 2006 2007 2008
Year
Mobile
Fixed

October 19 – 21, 2009, Sao Paulo, BRAZIL
Shipments by Communication Type as of 1 January 2008
Source: The Scott Report: Worldwide Deployments of Automated Metering Devices
Region Total RF PLC Worldwide 182,069,756 113,977,498 54,528,090
North America 120,756,669 100,878,335 16,613,338
Rest of World 61,313,087 13,099,163 37,914,752
Africa 105,358 17,697 40,584
Asia 13,463,739 366,461 8,731,102
Australia/NZ 173,548 100,088 1,383
Central/So.Amer. 980,045 375,692 548,978
Europe 46,055,966 12,046,530 28,463,765
Middle East 374,532 130,417 32,319
Misc. 158,899 62,278 96,621

October 19 – 21, 2009, Sao Paulo, BRAZIL
AMR Market is Dominated By a Few Large Vendors
Source: The Scott Report: International Deployments of Automated Metering Devices
0
20,000,000
40,000,000
60,000,000
80,000,000
100,000,000
120,000,000
140,000,000
160,000,000127 Others
Elster
Neptune
Sensus
Hydrometer
Hunt
Badger
DCSI
CellNet
Echelon
Itron0
5,000,000
10,000,000
15,000,000
20,000,000
25,000,000
30,000,000
35,000,000
40,000,000
45,000,000
50,000,00081 Others
ADD GROUP Ltd.
Matsushita, Toshiba
SAPPEL
Itron
Forture Technologies
Keli General Electric
Nanjing Sanneng
Elektromed
Hydrometer
Echelon
Worldwide Outside North America

October 19 – 21, 2009, Sao Paulo, BRAZIL
AMR Market Has Changed Slowly Over the Years
Source: The Scott Report: AMR Deployments in North America
0
5,000,000
10,000,000
15,000,000
20,000,000
25,000,000
1997
1998
1999
2000
2001
2002
2003
2004
2005
2006
2007
2008
2009
49 OthersCannonDatamaticMaster MeterTrilliantNeptuneBadgerElsterLandis+GyrSilver Spring NtwksSensusAclaraItron

October 19 – 21, 2009, Sao Paulo, BRAZIL
Latest AMR Shipments (Overall)
Source: The Scott Report: International Deployments of Automated Metering Devices
Utility Type 2Q09 1Q09 Annual '09 Annual '08 Annual '07 Annual '06 Annual '05Electric 3,286,121 2,888,582 12,349,404 9,413,148 7,345,375 8,594,920 7,010,186Gas 1,438,575 1,334,874 5,546,897 6,412,099 5,603,570 4,308,640 2,843,432Water 1,261,679 1,423,168 5,339,885 5,682,583 5,386,934 4,090,912 3,827,926Misc 0 0 0 0 0 0 0
Totals: 5,986,375 5,646,624 23,236,186 21,507,830 18,335,879 16,994,472 13,681,544
Utility Type 2Q09 Cum 1Q09 Cum Cumul. '09 Cumul. '08 Cumul. '07 Cumul. '06 Cumul. '05Electric 75,024,312 71,738,192 81,199,014 68,849,610 59,436,462 52,091,087 43,496,167Gas 41,993,682 40,555,107 44,767,130 39,220,233 32,808,134 27,204,564 22,895,924Water 36,996,641 35,734,961 39,651,678 34,311,793 28,629,210 23,242,276 19,151,364Misc 42,163 42,163 42,163 42,163 42,163 42,163 42,163
Totals: 154,056,797 148,070,423 165,659,985 142,423,799 120,915,969 102,580,090 85,585,618

October 19 – 21, 2009, Sao Paulo, BRAZIL
Latest AMR Shipments (Vendor)
Source: The Scott Report: International Deployments of Automated Metering Devices
Vendor 2Q09 1Q09 Annual '09 Annual '08 Annual '07 Annual '06 Annual '05Itron 1,273,608 1,256,737 5,060,690 7,113,574 6,683,705 8,101,083 6,784,383Aclara 966,121 945,314 3,822,870 3,648,529 2,512,398 1,584,766 1,491,248Sensus 936,503 836,774 3,546,554 2,248,979 1,203,374 844,965 969,199Silver Spring Ntwks 845,402 570,000 2,830,804 256,600 53,600 0 500Landis+Gyr 537,766 513,898 2,103,328 1,849,360 2,479,835 2,853,392 1,720,113Elster 419,294 367,491 1,543,760 1,530,033 1,385,390 857,316 366,329Badger 252,027 328,181 1,160,416 1,180,435 1,019,865 955,656 889,462Neptune 280,909 296,922 1,155,662 1,553,157 1,372,656 1,001,765 819,011Trilliant 166,119 166,119 664,476 578,002 296,201 28,454 5,320Master Meter 129,445 129,445 517,780 609,532 565,060 394,757 306,624Datamatic 128,439 128,439 513,754 513,754 513,754 181,637 203,454Cannon 42,098 94,030 272,256 386,835 241,049 167,719 72,261SmartSynch 1,717 6,347 16,128 11,331 8,862 2,986 31,079First Point Energy 3,470 3,470 13,880 13,880 0 0 13,885muNet 1,639 1,639 6,556 6,556 0 6,621 5,432Eka Systems 902 902 3,608 3,608 65 50 286Metretek 816 816 3,264 3,264 0 3,255 2,572Reactel 100 100 400 400 0 0 0Current Technology 0 0 0 0 0 0 10041 Others 0 0 0 0 65 10,050 286
Totals: 5,986,375 5,646,624 23,236,186 21,507,830 18,335,879 16,994,472 13,681,544

October 19 – 21, 2009, Sao Paulo, BRAZIL
Latest AMR Shipments (Arch.)
Source: The Scott Report: International Deployments of Automated Metering Devices
Architecture 2Q09 1Q09 Annual '09 Annual '08 Annual '07 Annual '06 Annual '05Itron 1,361,067 1,350,832 5,423,798 7,624,038 7,087,775 8,556,677 7,428,878Sensus - Flexnet 865,229 700,818 3,102,284 1,654,360 480,998 97,791 81,326Silver Spring Ntwks 845,402 570,000 2,830,804 256,600 53,600 0 500Hexagram 629,599 621,361 2,501,920 2,031,909 761,612 231,042 182,625TWACS 355,144 348,767 1,407,822 1,703,055 1,800,436 1,375,237 1,329,685EnergyAxis 326,051 276,766 1,205,634 989,618 911,217 556,027 0Neptune - RF 260,958 271,030 1,063,976 1,472,950 1,341,001 997,519 814,708Orion 194,957 269,023 927,960 926,610 764,714 622,219 464,647CellNet 234,815 157,601 784,832 1,082,361 1,339,616 1,354,831 884,909Trilliant - Wireless 165,669 165,669 662,676 577,102 258,333 26,853 4,052Master Meter - 3G 129,445 129,445 517,780 609,532 565,060 394,757 306,624Datamatic 128,439 128,439 513,754 513,754 513,754 181,637 203,454Hunt TS2 134,811 119,020 507,662 317,545 437,565 494,155 279,128CellNet - AMI 71,840 172,160 488,000 161,088 0 0 0Sensus - RF 79,958 139,498 438,912 532,387 663,328 700,476 659,336Cannon 42,098 94,030 272,256 386,835 241,049 167,719 72,261Airpoint 71,518 43,815 230,666 216,670 530,591 736,610 188,081AMCO/Elster (Trace) 49,742 43,563 186,610 254,823 263,641 130,595 208,409Hunt TS1 24,995 23,332 96,654 116,645 160,730 297,823 465,143Badger - Galaxy 4,210 6,197 20,814 26,731 2,046 2,084 47SmartSynch 1,717 6,347 16,128 11,331 8,862 2,986 31,079First Point Energy 3,470 3,470 13,880 13,880 0 0 8,685muNet 1,639 1,639 6,556 6,556 0 6,621 5,432Neptune - 450 1,521 1,454 5,950 11,979 0 0 0Eka Systems 902 902 3,608 3,608 65 50 286Metretek 816 816 3,264 3,264 0 3,255 2,572Trilliant - Telephone 450 450 1,800 900 37,868 1,601 1,268Reactel 100 100 400 400 0 0 0Sensus - Telephone 0 1 2 55 93 82 568Badger - Telephone 0 0 0 0 1 1,235 1,880First Point/Mozart 0 0 0 0 0 0 5,200Neptune - Telephone 0 0 0 0 0 0 23Current Technology 0 0 0 0 0 0 100Sensus - Fixnet -187 79 -216 1,244 491 -11 8,03548 Others 0 0 0 0 111,433 54,601 42,603
Totals: 5,986,375 5,646,624 23,236,186 21,507,830 18,335,879 16,994,472 13,681,544

October 19 – 21, 2009, Sao Paulo, BRAZIL
Electric AMR Market
Source: The Scott Report: AMR Deployments in North America
0
2,000,000
4,000,000
6,000,000
8,000,000
10,000,000
12,000,000
14,000,000
1997
1998
1999
2000
2001
2002
2003
2004
2005
2006
2007
2008
2009
40 OthersFirst Point EnergymuNetSmartSynchDatamaticCannonTrilliantSilver Spring NtwksElsterSensusAclaraLandis+GyrItron

October 19 – 21, 2009, Sao Paulo, BRAZIL
Total AMR Shipments by Vendor182+ Million Installed as of January ‘08
Itron
Echelon
Landis+Gyr
Aclara
Misc.
Hydrometer
Badger
Elster
Neptune
SensusElektromed
Master Meter Datamatic
Source: The Scott Report: Worldwide Deployments of Automated Metering Devices
October 19 – 21, 2009, Sao Paulo, BRAZIL
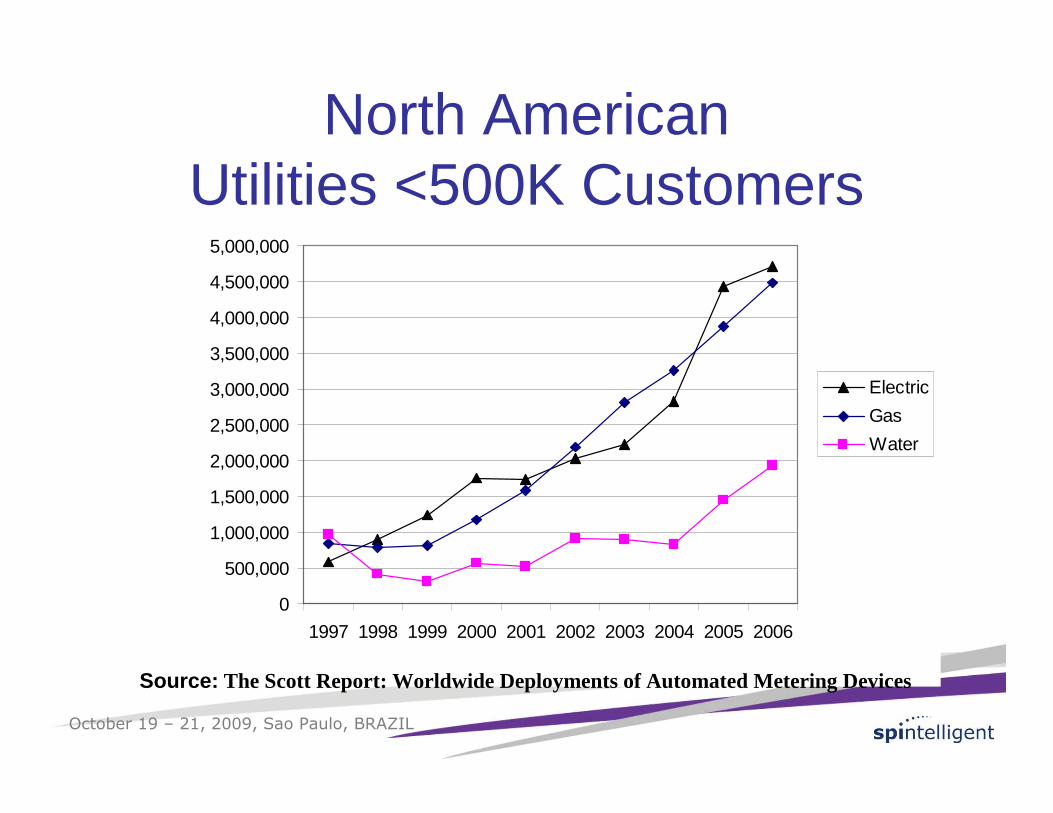
North AmericanUtilities <500K Customers
0
500,000
1,000,000
1,500,000
2,000,000
2,500,000
3,000,000
3,500,000
4,000,000
4,500,000
5,000,000
1997 1998 1999 2000 2001 2002 2003 2004 2005 2006
Electric
Gas
Water
Source: The Scott Report: Worldwide Deployments of Automated Metering Devices

October 19 – 21, 2009, Sao Paulo, BRAZIL
� Overall : 14.7% (’97 – ’09)� Electric utilities : 17.6% (’97 – ’09)� Gas utilities : 9.6% (’97 – ’09)� Water utilities : 16.3% (’97 – ’09)� Investor owned : 7.4% (’97 – ’07)� Publicly owned : 17.4% (’97 – ’07)� Cooperatives : 41.8% (’97 – ’07)� RF : 15.4% (’97 – ’07)� PLC : 23.2% (’97 – ’07)� Telephone: (--21.7%) (’97 – ’07)
Compound Annual Growth ’97–‘09

October 19 – 21, 2009, Sao Paulo, BRAZIL
Penetration Driving Gas & Water Shipments; Irrelevant for Electric• At the end of 2008, 68.4% of all customers in
U.S. have AMR on at least 1 meter• The growth of this penetration has ranged from
5% to 7% per year• With the advent of electric Smart Metering, AMR
penetration will be irrelevant for electrics, but Smart meter penetration will become a factor
• Once electric Smart Metering become significant (over 50% in an area), it will become a driver for water and gas AMR to become Smart
Source: The Scott Report: Insights on AMR Deployments

October 19 – 21, 2009, Sao Paulo, BRAZIL
Smart Metering vs. AMR Conclusions
• Smart Metering is growing on the success established by AMI
• Electric Smart Metering is growing so fast that little of the non-Smart Meter market will survive
• Vendors must get Smart Metering right the first time. The risks here are much higher than previous technologies because the market is growing so rapidly.

October 19 – 21, 2009, Sao Paulo, BRAZIL
Electric Meter Saturation in U.S.
• At expected deployment rates, all of U.S. will be fully served with Smart electric Meters in 6 – 7 years
• Expected lifetime of meters is 10 years• So U.S. market will go into hiatus for 3 – 4 years• Only largest international meter companies will
survive thus downturn, and continue developing their products for the next generation

October 19 – 21, 2009, Sao Paulo, BRAZIL
Topics Discussed• What is happening politically• What Smart Metering offers• The role of deregulation and prepayment• What is happening in the U.S. and Europe• The likely outcome of these efforts
Though this talk addresses electric, gas, water and heat metering, the focus is on electric metering because Smart Grid is a major political goal

October 19 – 21, 2009, Sao Paulo, BRAZIL
Current Events• Petroleum prices peaked in early July 2008; by mid-
October 2008 they were 50% of peak• DJIA’s 2008 peak was in late April; by early March
2009 they were almost 50% of peak• After Obama’s election in November 2008 he
committed to Stimulus with Smart Metering as part of the solution
• Most European leaders agreed to reforms, refused to follow Obama’s Stimulus, but committed to Smart Metering (late April 2009)

October 19 – 21, 2009, Sao Paulo, BRAZIL
American Recovery and Reinvestment Act of 2009
• Electricity Delivery and Energy Reliability: “$4.5 Billion …expenses necessary for electricity delivery and energy reliability … to include demand response equipment, enhance security and reliability of the energy infrastructure, energy storage research, development, demonstration and deployment, and facilitate recovery from disruptions to the energy supply …”
• “… establish and maintain a smart grid information clearinghouse…”
• “… utilize open protocols and standards …”• “The Secretary shall, 'within 60 days after the enactment of …
establish procedures by which applicants can obtain grants of not more than one-half of their documented costs”

October 19 – 21, 2009, Sao Paulo, BRAZIL
Obama Transition Team’sRequest to Me
• Determine:– How many Smart Meters could be produced in
existing plants– If meter vendors could produce 30 M Smart Meters
per year (if given 12 months to ramp-up)– Smart Meter Definition:
• Net metering, time stamp of usage, open standards, remote disconnect, downloadable code
– If product could be built in U.S.– The total cost of doing this (my answer: $18 B plus
at leads as much $ in system integration)

October 19 – 21, 2009, Sao Paulo, BRAZIL
Changes to my Recommendation
• Took my $18 B and required 50 – 50 match by utilities (cuts my number to $9 B)
• Took my 4 year analysis and assumed 2 years of funding (cuts my number to $4.5 B)
• Inserted words “Smart Grid” for “Smart Meter”• Requires “Open Protocols and Standards … if
available and appropriate”

October 19 – 21, 2009, Sao Paulo, BRAZIL
How Will Money be Spent?• DOE has not finalized its answer
– Appointed NIST to announce standards
• Some obvious decisions were not applied:– The goal was to create jobs quickly, but they announced
that projects could run to 2015– “Shovel ready” projects should have had priority, but too
much focus on “demonstration projects,” research and technology
• State regulators should have taken the lead, but seem reluctant to drive the process
• The outcome is far from clear

October 19 – 21, 2009, Sao Paulo, BRAZIL
How Will $ Impact Utility Decisions?
• Utilities always develop a business case that must have attractive financials
• Stimulus $ will offset the amount of money that the utility must invest
• The funding requires matching $ from utility, and will be no better than 50 – 50
• Utility must be able to find its share of the funding
• For utilities that get Stimulus funding, almost all such projects will be cost-effective

October 19 – 21, 2009, Sao Paulo, BRAZIL
Impact of Obama Stimulus Package
• Gas and water AMR deployments will follow historic patterns and probably accelerate after worldwide financial crisis eases
• Electric deployments will restart from zero:– Almost all deployed electric meters are not Smart
Meters, so they must be replaced to support Smart Grid– Because metering is a prerequisite for the Smart Grid,
expect the whole U.S. to be served within 5 – 7 years– Large IOUs are probably best prepared to implement
Smart Grid so smaller utilities will install it later• So many smaller utilities will not get funding, that a
second funding round for them is likely

October 19 – 21, 2009, Sao Paulo, BRAZIL
Current Events• U.S. initiatives:
– President Obama says his Stimulus Package will add 40 million Smart Meters
– U.S. Congress changes focus to Smart Grid; delays by Department of Energy as it insists on standards
• European Union’s 20-20-20 mandates: – By 2020 reduce greenhouse gases by 20% below
1990 levels, improve energy efficiency by 20% and increase the % of renewable energy by 20%.
– European Union mandates that 80% of electric meters must have Smart Meters by 2020; 100% by 2022; no deadlines for gas
• China announces plans to install 200 million Smart Meters in next 3 – 5 years

October 19 – 21, 2009, Sao Paulo, BRAZIL
U.S. Metering Market• Except for deregulation, entire market is very
consistent• As of 1 January 2009, ~132 million advanced
meters deployed (~44% meter penetration)– ~62 M electric (~42% electric meter penetration)– ~38 M gas (~55% gas meter penetration)– ~32 M water (~35% water meter penetration)
• ~ 5% Smart Meter penetration of electric meters
• If Smart Meters are mandated, then entire market will shift to Smart Meters except for 5% that’s already Smart

October 19 – 21, 2009, Sao Paulo, BRAZIL
European Metering Market• Fragmented market
– Nordic countries– Baltic countries– Central Europe– Southern Europe– Eastern Europe– U.K.
• As of 1 January 2008, ~31 million advanced electric meters deployed (~10% meter penetration)
• ~9% Smart Meter penetration (electric)• Smart Meters (electric) are mandated by 2022 for 100%
of customers

October 19 – 21, 2009, Sao Paulo, BRAZIL
European Activity by Country• Full compulsory smart electricity meter roll out:
– Italy – electric by 2011 and gas by 2013– Sweden – electric to finish in 2009– Spain – full rollout by 2018– Portugal – electric by 2015 (not law yet)– UK – electric and gas by 2020
• Partial policies:– Denmark and Finland – electricity & gas– Norway, Estonia, Portugal and Turkey – electric
• Studying what to do:– Austria, Belgium, Cyprus, Denmark, Finland, France, Hungary,
Ireland, Netherlands, Northern Ireland (also gas smart meters), Norway, and Spain (gas meters)

October 19 – 21, 2009, Sao Paulo, BRAZIL
Lessons from Historic Shipment Data
• Historical data can give insights on future growth, but not the rate of future growth
• If Smart Metering is mandated (as in Europe and parts of China), all older meters will be replaced, irrespective of their age– Reason: Smart Meters permit energy to flow from customer
to grid. Meters must measure this flow and also contain disconnects to protect utility workers
• Without mandates, AMR grew by 14+% annually; with mandates growth will take a different shape – rapid growth in Year 1 followed by relatively flat thereafter

October 19 – 21, 2009, Sao Paulo, BRAZIL
Being “Smart”• Systems do not become “Smart” by having smart
endpoints• They become “Smart” by having software systems
that help them act smart• Yes, it is important to have highly capable
endpoints, but without the right systems they are hardly more capable than dumb endpoints

October 19 – 21, 2009, Sao Paulo, BRAZIL
“Smart” Attributes• Smart systems methodically compare data from meters and
sensors against predetermined settings• More advanced systems perform “data mining,” which looks
for patterns in the data• Smart systems couple metering system data with other
system data such as Customer Information System (CIS), Geographic Information System (GIS), Outage Management System (OMS), Meter Data Management (MDM) system, Help Desk support system, Workforce Management system, Billing System, Inventory Management System, engineering systems, etc.
• “Smart” utility systems are networked together• For most Smart Metering projects in the U.S., 55-60% of all
project costs are for software upgrades

October 19 – 21, 2009, Sao Paulo, BRAZIL
Smart Metering• Provides detailed information on what is being
consumed/delivered on a quasi-real-time basis– Supports in-home displays
• Provides the data for consumers and utilities to make smart energy choices
• Improves utility operations by (for example):– Identifying where energy is being consumed– Helping to localize outages– Highlighting areas with possible energy theft
• Helps customers deliver energy to grid• Eliminates the need to change meters when services or
features are modified (such as time-of-use)• Provides a pathway to the Smart Grid

October 19 – 21, 2009, Sao Paulo, BRAZIL
Smart Metering Functions• Active/Reactive energy• Net-metering• Tariffs• Remote disconnect• Load profile• Prepayment• Import/export capability• Supervision and
recording• Synchronization• 2-way communications
• Tamper/fraud detection• Provide information to
consumer• Remote transactions• Remote software
upgrade• Interoperability between
different meter models and different types of meters (e.g., gas, water, heat)
• HAN functionality
May apply to electric, gas, water or heat meters

October 19 – 21, 2009, Sao Paulo, BRAZIL
What Makes a Grid “Smart”?• A grid is “Smart” when it can dynamically change its performance
based on insightful operating information• Though existing grids make some dynamic decisions, they usually
require human intervention• “Smart” grids will make real-time data-driven decisions• But very few utilities have fully integrated operations systems; they
must evolve to access more robust data • The only available data are meter measurements and limited status
indicators• Key operational data such as weather, equipment operating
temperatures, etc. are rarely reported and are not embedded intointegrated operation systems
• Thus, true Smart Grids do not exist anywhere

October 19 – 21, 2009, Sao Paulo, BRAZIL
Controlling Consumption• Controlling consumption a key motivation for Smart Grid• Requires the ability to communicate between the grid
and the customer’s premises (in both directions)• This assumes that devices will be placed in the
customer’s premises that can react to outside stimuli:– A display that indicates consumption– Disconnect devices on domestic equipment– Possibly a HAN (Home Area Network)
• Many in-home devices will require total replacement, e.g.– Hot water heaters– Furnaces– White goods (clothes washers, dryers, dishwashers, refrigerators
• The cost for domestic changes exceeds utility costs !!!

October 19 – 21, 2009, Sao Paulo, BRAZIL
The Role of the Consumer• Before Smart Metering, the utility generated the
energy and the consumer used it – there was little opportunity for the consumer to do much else
• With Smart Metering, the consumer’s role changes:– Can generate energy that is consumed on-site or delivered
to the grid – via solar panels, wind generators, etc.– Can decide when to use energy – price signals report
when power is expensive, and can avoid usage at peak times
• Some countries treat the consumer like a small generator, even if they only avoid usage

October 19 – 21, 2009, Sao Paulo, BRAZIL
What Will Likely Happen?• The U.S. will probably deploy 40+ million Smart
Meters in next 5 years• Europe will mostly start after the U.S., but achieve
many more deployments by 2015• China will deploy 200 million Smart Meters over next
5 years and will be the first to learn how to operate massive electric utility networks
• Smaller first-world economies like Australia, New Zealand, Canada will also deploy early
• Smart Grids will be deployed in major cities in other countries with strong economies, such as Brazil, South Africa, Indonesia, etc.

October 19 – 21, 2009, Sao Paulo, BRAZIL
Automated Metering• Smart Metering is the only mature part of Smart Grid industry
and is required for a Smart Grid• Since ‘97, electric AMR shipments in U.S. have grown by
17.6% CAGR• Since ‘97, electric AMR penetration in U.S. climbed from 7%
to 46%• It makes no sense to accurately read an inaccurate meter, so
AMR growth has driven sales of new meters (few new electric meters don’t have AMR)
• Thus, Automated Metering was thriving, even before Smart Metering
Definition: Automated Metering = any form of remote meter reading including AMR, AMI, Smart Metering, Prepayment metering, submetering
October 19 – 21, 2009, Sao Paulo, BRAZIL
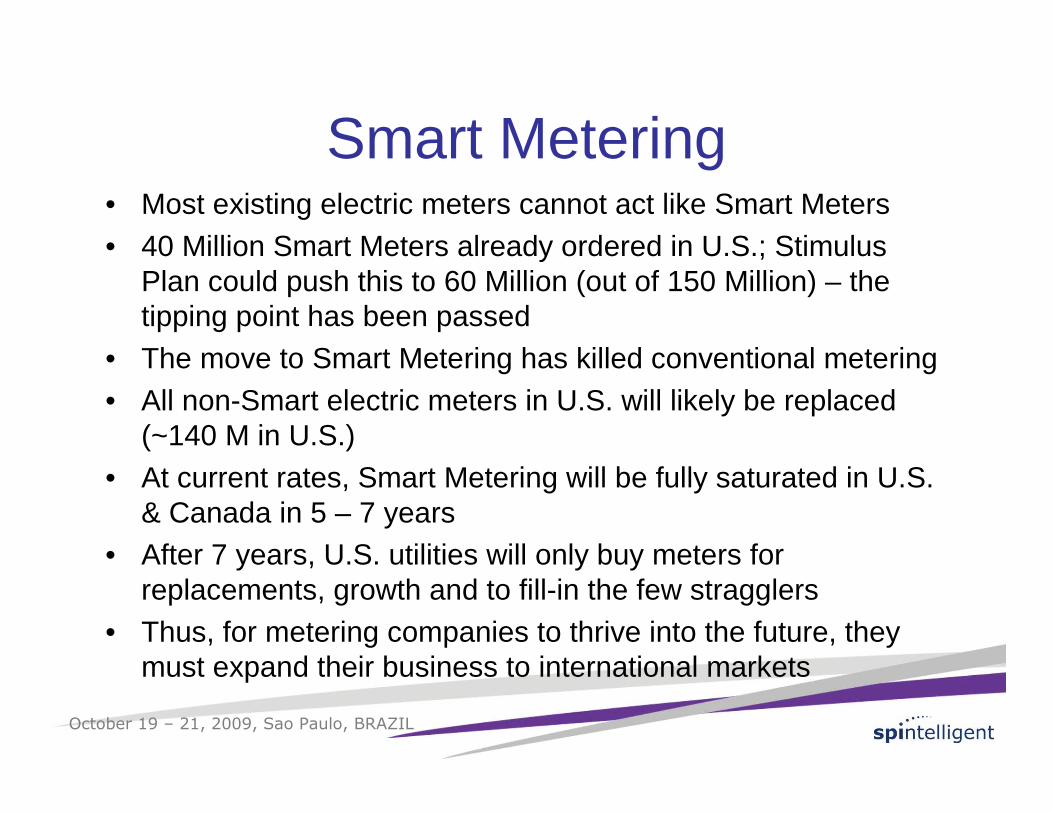
Smart Metering• Most existing electric meters cannot act like Smart Meters• 40 Million Smart Meters already ordered in U.S.; Stimulus
Plan could push this to 60 Million (out of 150 Million) – the tipping point has been passed
• The move to Smart Metering has killed conventional metering • All non-Smart electric meters in U.S. will likely be replaced
(~140 M in U.S.)• At current rates, Smart Metering will be fully saturated in U.S.
& Canada in 5 – 7 years• After 7 years, U.S. utilities will only buy meters for
replacements, growth and to fill-in the few stragglers• Thus, for metering companies to thrive into the future, they
must expand their business to international markets

October 19 – 21, 2009, Sao Paulo, BRAZIL
Other Factors that Affect Metering
• Deregulation• Payments• Technology does not make a utility “smart,”
systems do• People problems• Paying for all these changes• Aggregation of vendors

October 19 – 21, 2009, Sao Paulo, BRAZIL
The Challenge of Deregulation• Deregulation complicates possible solutions• In deregulated markets, customer can buy power from
retailers instead of a regulated utility. Power is delivered over the same grid to customer.
• It is more prevalent in Europe than in U.S., but exists in both marketplaces
• Grid company, customers, governments want Smart Metering, but have differing willingness-to-pay
• Unresolved questions (such as):– Who owns the meter?– Change the meter when change supplier?

October 19 – 21, 2009, Sao Paulo, BRAZIL
The Link BetweenMetering and Payments
• Historically, the reason to meter usage is to determine how much money each user should pay
• In many developing countries >20% of all energy generated is unpaid; >50% unpaid has occurred
• This is often called “energy theft,” but calling it “theft”may over-simplify the problem
• In many of these countries, poor people are cause of most non-payment, but wealthy people also don’t pay
• Poor people often don’t pay because they cannot afford to do so; with wealthy people, it’s just theft

October 19 – 21, 2009, Sao Paulo, BRAZIL
Utilities Face a Dual Challenge• Metering• Payments (A problem for many poor customers)
– Meters typically report what was used – provide little information to plan usage
– Poor people often have problems getting to a utility office or other locations to make payments
– Many poor countries have terrible postal systems– Many customers come from subsistence backgrounds
with no tradition of making payments– Many poor customers barely have enough money to
live, and often cannot afford the utility bill– Almost all poor people are “unbanked”

October 19 – 21, 2009, Sao Paulo, BRAZIL
Examples of Electric Power Theft
South America Africa

October 19 – 21, 2009, Sao Paulo, BRAZIL
How Do Poor People Pay for Services?
• 80% of the world is “poor” – most of mankind • Poor people often have problems getting to a utility office
or other locations to make payments• Many poor countries have terrible postal systems• Many poor customers come from subsistence
backgrounds with no tradition of managing money• Many poor customers barely have enough money to live,
and often cannot afford the utility bill• Almost all poor people are “unbanked”• Economists now view “unbanked” a huge new market• A “Payments” industry is emerging; it will help utilities
collect money and help users manage their money better

October 19 – 21, 2009, Sao Paulo, BRAZIL
Prepayment/Postpayment• Prepayment permits customers to pay for services
before they use them• Postpayment permits customers to pay for services after
they use them• Prepayment meters usually track money spent or KWH
consumed; rarely provide meter reading• Postpayment meters provide meter readings but don’t
permit customers to plan future usage• Many countries offer prepayment services to help users
manage their money better• Smart Meters have the potential to do both forms of
metering simultaneously, but the challenge of payments must still be resolved

October 19 – 21, 2009, Sao Paulo, BRAZIL
People & Their Problems
• If projects fail, it is usually the result of utilities not dealing with staff needs, or government concerns or the needs of their customers
• Projects rarely fail because the equipment fails; the worst problems occur when project staffs are poorly managed or senior management is not committed to the project
• Therefore, we must remember to focus on the people issues

October 19 – 21, 2009, Sao Paulo, BRAZIL
Project Management• For projects with several hundred thousands (or more)
meters, the greatest challenge is project management• Consider the challenge of sending crews to do daily installs.
Giving them the right equipment, the right instructions and verifying their work is a staggering challenge.
• Large, highly automated staging depots will be needed to support installation crews.
• Each installer will need highly automated handheld support tools to ensure that each install is correct and all related data is correctly recorded.
• In the U.S., this has been the most important feature of a successful meter automation project – a world-class project management system.

October 19 – 21, 2009, Sao Paulo, BRAZIL
Paying for Future Changes• Moving to Smart Metering automatically implies that
the utility will forever operate differently:– Smart Metering capabilities will gradually evolve; equipment
placed today may have to be replaced in 5-10 years– As all operating systems get integrated, they will operate
slightly differently. Also, new features will be introduced. Anyone employee using these systems will need retraining whenever a change is made.
– Utilities will operate more efficiently with Smart Metering, butnew jobs will also be created.
• Replacement equipment, retraining and new jobs all cost money on an ongoing basis. Though special funding may be provided to install the Smart Meters, funds may not be provided for these new items.

October 19 – 21, 2009, Sao Paulo, BRAZIL
Where is the Metering Industry Heading?
• Acquisitions• Aggregation• Other factors• My crystal ball• What’s next?
October 19 – 21, 2009, Sao Paulo, BRAZIL
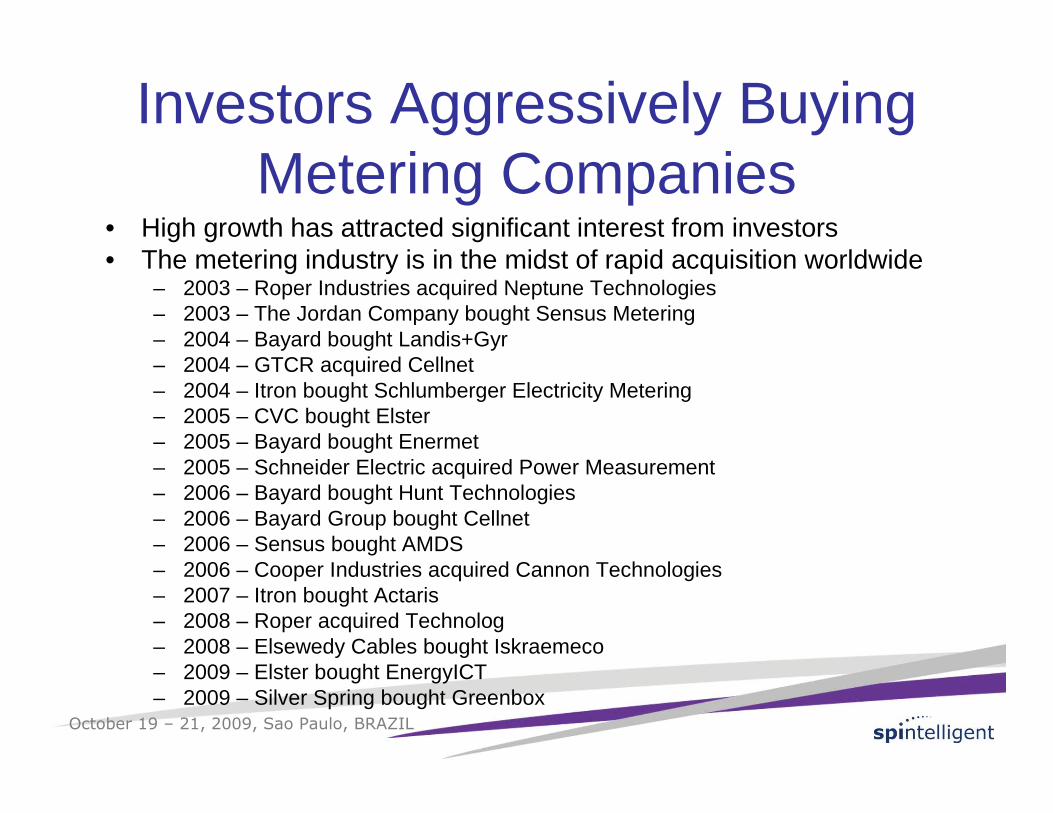
Investors Aggressively Buying Metering Companies
• High growth has attracted significant interest from investors• The metering industry is in the midst of rapid acquisition worldwide
– 2003 – Roper Industries acquired Neptune Technologies – 2003 – The Jordan Company bought Sensus Metering – 2004 – Bayard bought Landis+Gyr– 2004 – GTCR acquired Cellnet– 2004 – Itron bought Schlumberger Electricity Metering– 2005 – CVC bought Elster – 2005 – Bayard bought Enermet– 2005 – Schneider Electric acquired Power Measurement– 2006 – Bayard bought Hunt Technologies– 2006 – Bayard Group bought Cellnet– 2006 – Sensus bought AMDS– 2006 – Cooper Industries acquired Cannon Technologies– 2007 – Itron bought Actaris– 2008 – Roper acquired Technolog– 2008 – Elsewedy Cables bought Iskraemeco– 2009 – Elster bought EnergyICT– 2009 – Silver Spring bought Greenbox

October 19 – 21, 2009, Sao Paulo, BRAZIL
Aggregation of Vendors• The metering industry outside Asia has already
been through a period of aggregation. Outside Asia there are now fewer than 10 major metering vendors.

October 19 – 21, 2009, Sao Paulo, BRAZIL
Impact of These “Other” Factors• Smart Metering focus on more than just metering• It requires significant software support and continual
retraining• It has the ability to address historical payment issues,
but only if the utility focuses on them• It requires careful project planning, including the
impact that Smart Metering has on customers and staff
• It initiates more than short-term changes; new work is created that requires staffing and on-going expenses
• It alters how utilities operate and what vendors they use

October 19 – 21, 2009, Sao Paulo, BRAZIL
My Crystal Ball• Huge near-term growth in Smart Meter market is inevitable
(could be 30% or more for next few years); Smart Grid will follow• Then U.S. metering market goes flat; after 7 years U.S. metering
market falls; Smart Grid business gradually grows long-term• European metering market has huge growth (like in the U.S.) 4 –
5 years from now• Like U.S., Europe metering market goes flat approaching 2020;
drops after that• Most major cities in developing world will deploy Smart Metering
and then Smart Grid• Overall Metering Market Trend: Ragged long-term shape with
periods of steep growth followed by flat years; little chance for dips over next 15 – 20 years
• Overall Smart Grid Market Trend: Smooth market growth trailing Metering Market
October 19 – 21, 2009, Sao Paulo, BRAZIL
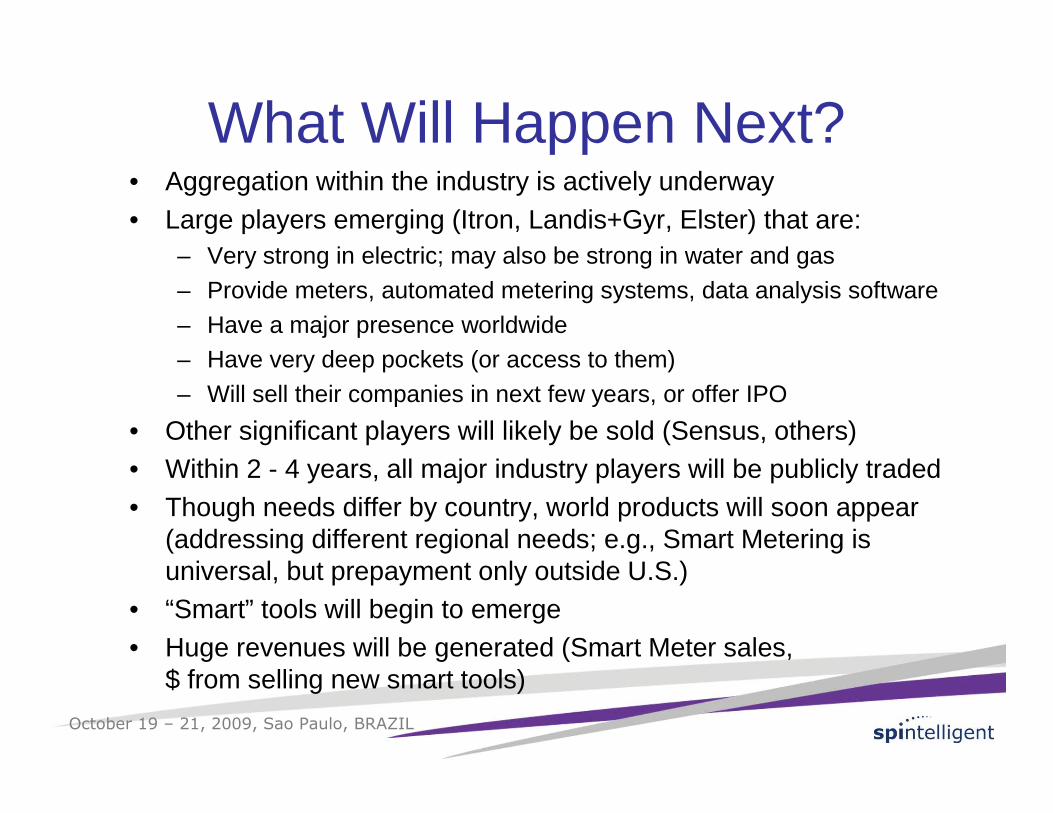
What Will Happen Next?• Aggregation within the industry is actively underway• Large players emerging (Itron, Landis+Gyr, Elster) that are:
– Very strong in electric; may also be strong in water and gas
– Provide meters, automated metering systems, data analysis software
– Have a major presence worldwide– Have very deep pockets (or access to them)
– Will sell their companies in next few years, or offer IPO
• Other significant players will likely be sold (Sensus, others)• Within 2 - 4 years, all major industry players will be publicly traded• Though needs differ by country, world products will soon appear
(addressing different regional needs; e.g., Smart Metering is universal, but prepayment only outside U.S.)
• “Smart” tools will begin to emerge• Huge revenues will be generated (Smart Meter sales,
$ from selling new smart tools)

October 19 – 21, 2009, Sao Paulo, BRAZIL
How Can I Be So Confident About My Claims?
• For the past few years, I made predictions like this and then they all happened several months later –someone must be listening!
• Continued growth is guaranteed for at least the next four years– 40 million Smart Meters already ordered; EDF will happen no later than
2 years from now– Huge companies (Google, IBM, Intel, Cisco, etc.) already hyping the
Smart Grid business– All the hype has to generate some new business
• 68% of all U.S. households have AMR on at least one of their meters. Customers can now see service differences between utilities, and they like AMR!! Smart Grid will encourage customer participation – will put more pressure on water, gas
• Even a major recession did not stop this!

October 19 – 21, 2009, Sao Paulo, BRAZIL
Questions?
Howard A. Scott, Ph.D.
Phone: +1-973-696-5793
Fax: +1-973-696-4832