smart multi-channel attribution modeling
TRANSCRIPT

Beyond the Last Click: Smart Multi-Channel Attribution Modeling
Crispin SheridanSenior Director, Global Search, SAP
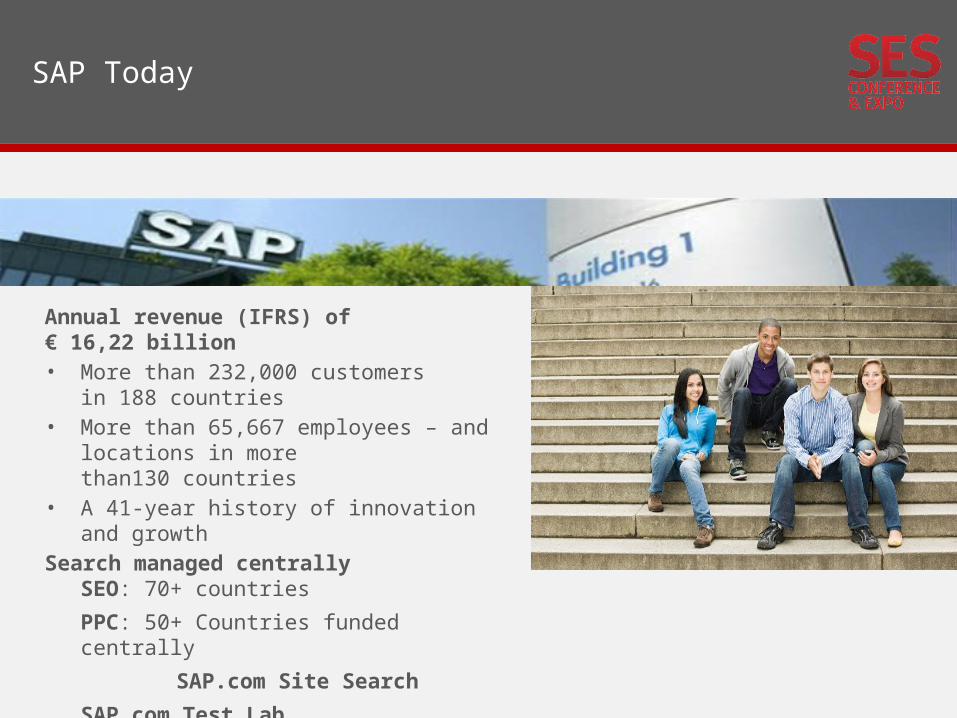
SAP Today
Annual revenue (IFRS) of € 16,22 billion• More than 232,000 customers
in 188 countries• More than 65,667 employees – and
locations in more than130 countries• A 41-year history of innovation and
growthSearch managed centrally
SEO: 70+ countries
PPC: 50+ Countries funded centrally
SAP.com Site Search
SAP.com Test Lab
500,000 pages, Search Team: 12 + 5 Agencies
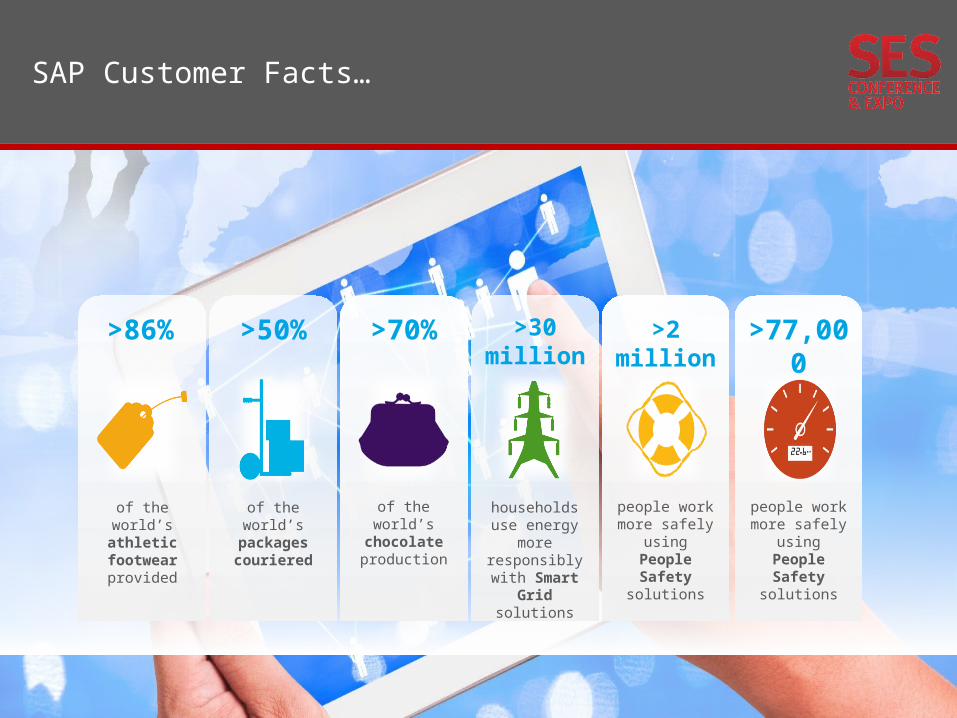
>86%
of the world’s athletic
footwear provided
>50%
of the world’s
packages couriered
>70%
of the world’s
chocolate production
>30 million
households use energy
more responsibly with Smart
Grid solutions
>77,000
people work more safely
using People Safety
solutions
>2 million
people work more safely
using People Safety
solutions
SAP Customer Facts…
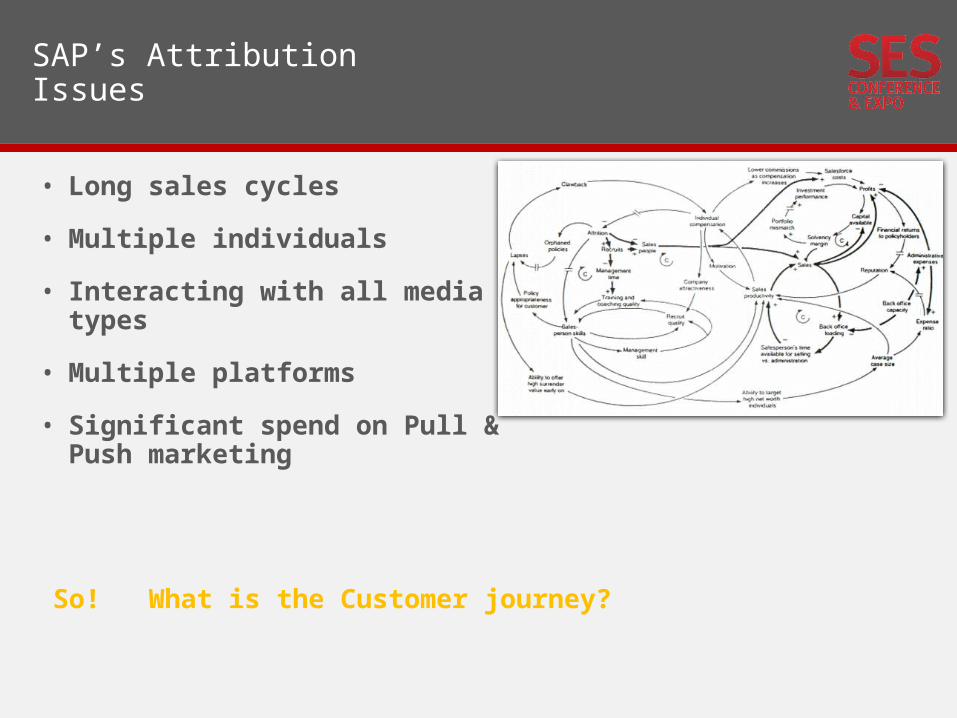
SAP’s Attribution Issues
• Long sales cycles
• Multiple individuals
• Interacting with all media types
• Multiple platforms
• Significant spend on Pull & Push marketing
So! What is the Customer journey?
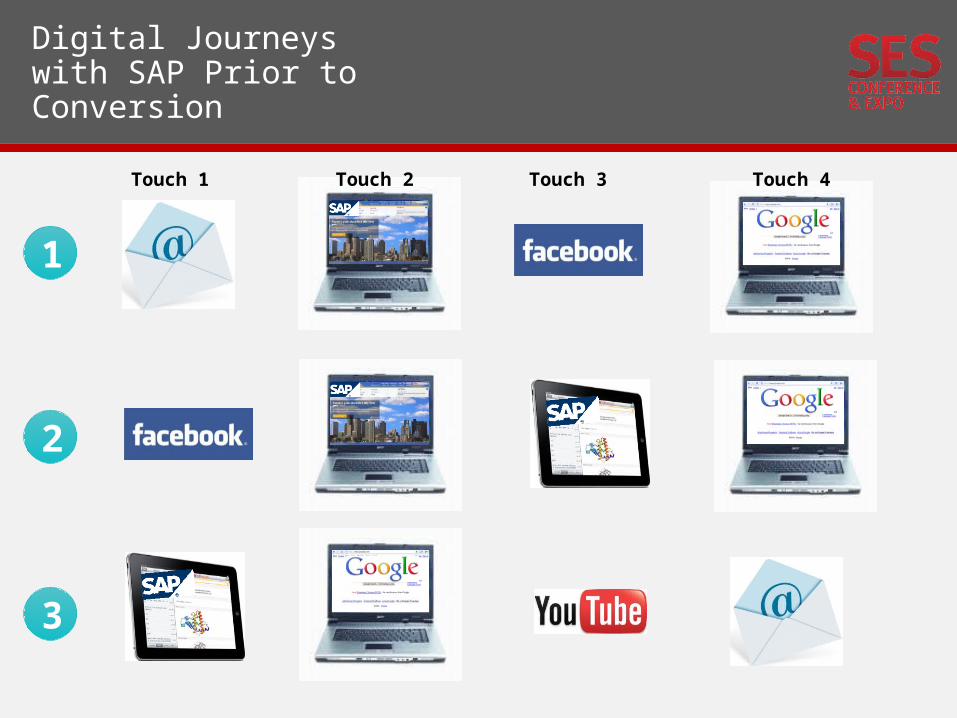
Digital Journeys with SAP Prior to Conversion
1
2
3
Touch 1 Touch 2 Touch 3 Touch 4
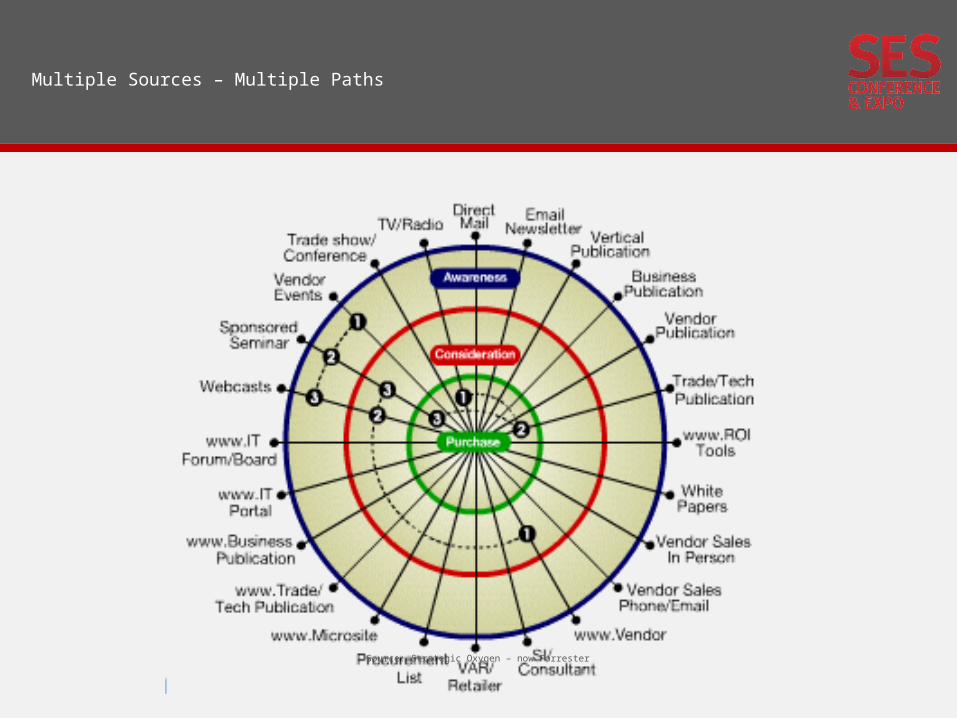
Multiple Sources – Multiple Paths
Source: Strategic Oxygen – now Forrester
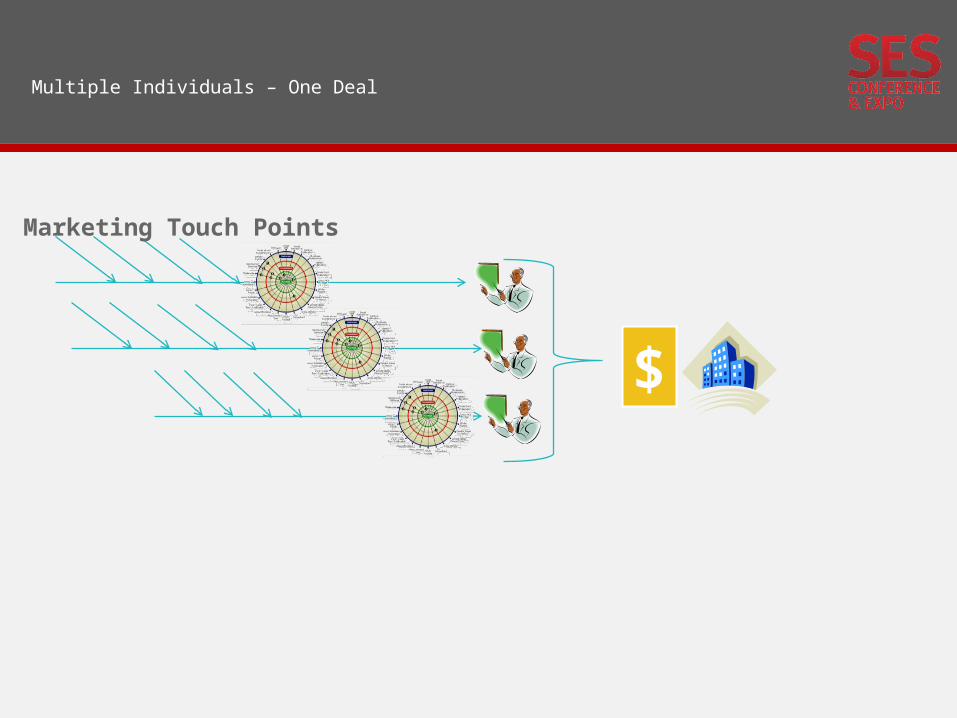
Multiple Individuals – One Deal
$
Marketing Touch Points
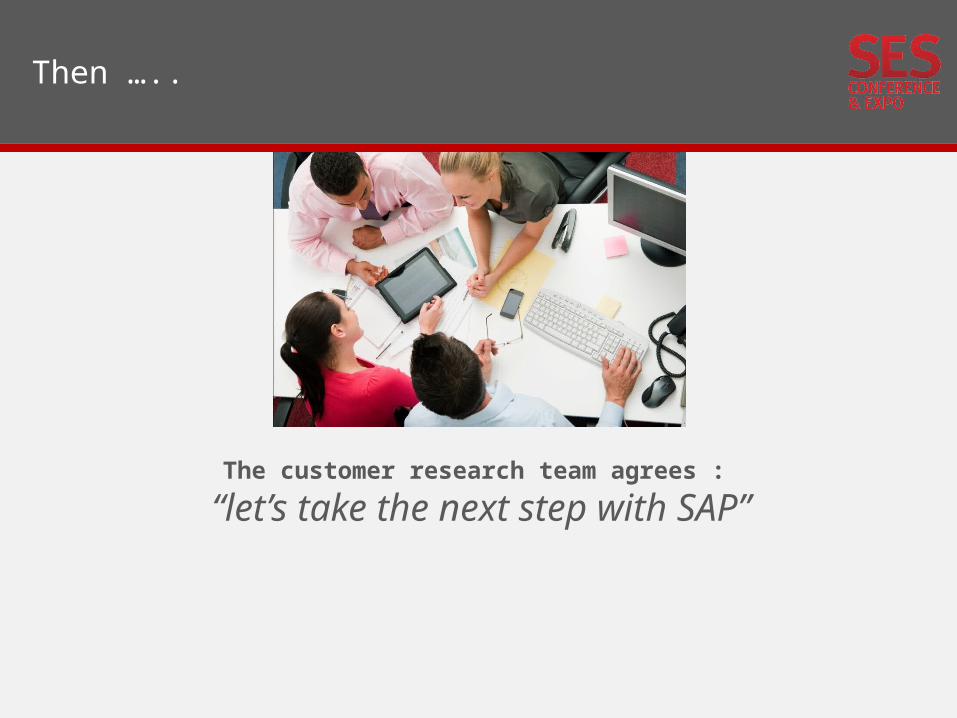
Then …..
The customer research team agrees :
“let’s take the next step with SAP”
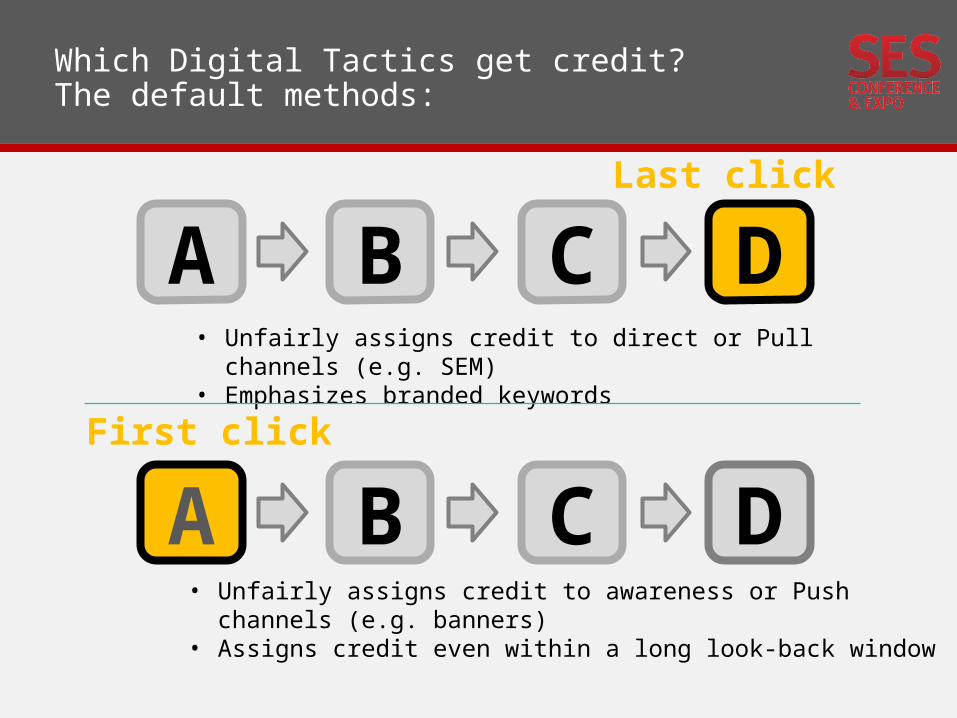
Which Digital Tactics get credit? The default methods:
Last click
• Unfairly assigns credit to direct or Pull channels (e.g. SEM)
• Emphasizes branded keywords
• Unfairly assigns credit to awareness or Push channels (e.g. banners)
• Assigns credit even within a long look-back window
DCBA
DCBA First click
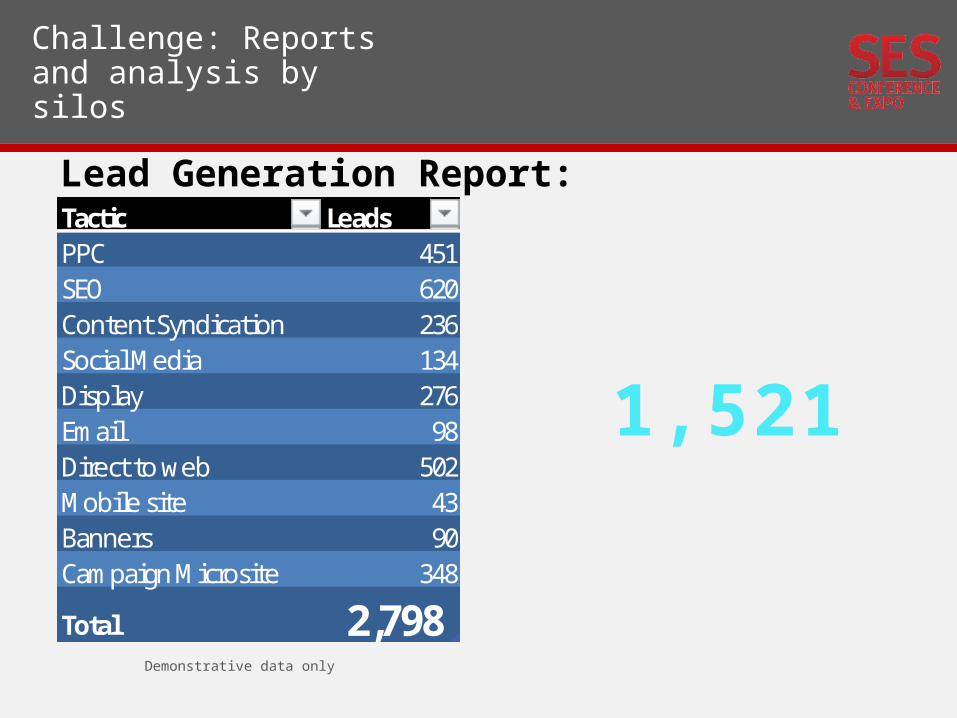
Challenge: Reports and analysis by silos
Lead Generation Report: Tactic LeadsPPC 451SEO 620Content Syndication 236Social Media 134Display 276Email 98Direct to web 502Mobile site 43Banners 90Campaign Microsite 348
Total 2,798
1,521
Demonstrative data only
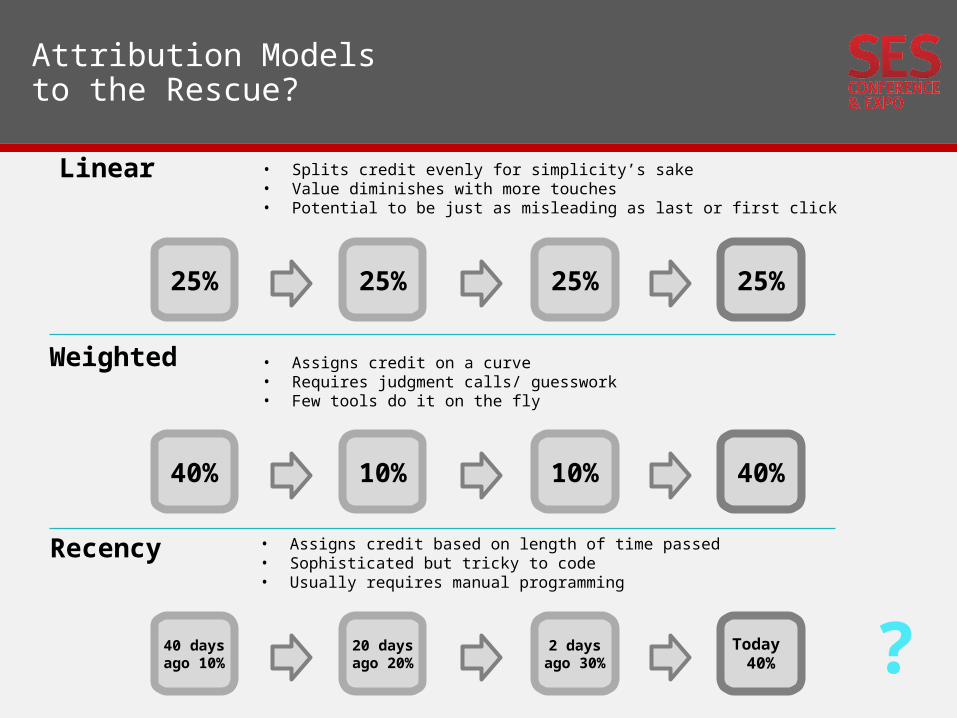
Attribution Models to the Rescue?
Linear • Splits credit evenly for simplicity’s sake• Value diminishes with more touches• Potential to be just as misleading as last or first click
25%25%25%25%
?
• Assigns credit on a curve• Requires judgment calls/ guesswork• Few tools do it on the fly
40%10%10%40%
Weighted
• Assigns credit based on length of time passed• Sophisticated but tricky to code• Usually requires manual programming
Today 40%
2 daysago 30%
20 daysago 20%
40 daysago 10%
Recency
So, Right Attribution Model, but what else?
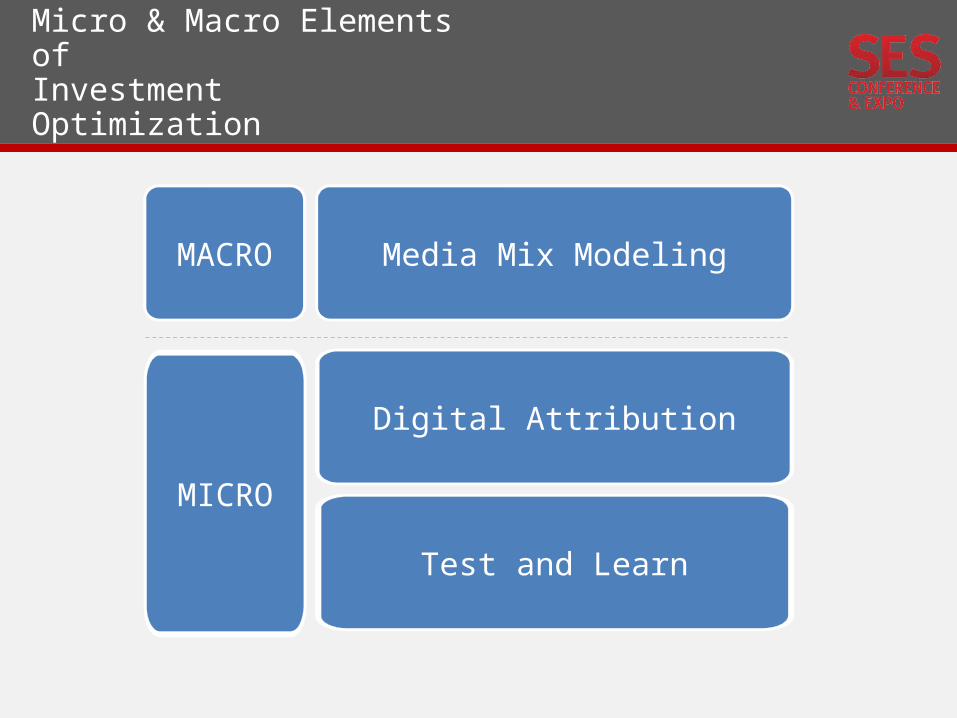
Micro & Macro Elements of Investment Optimization
MACRO Media Mix Modeling
MICRO
Digital Attribution
Test and Learn
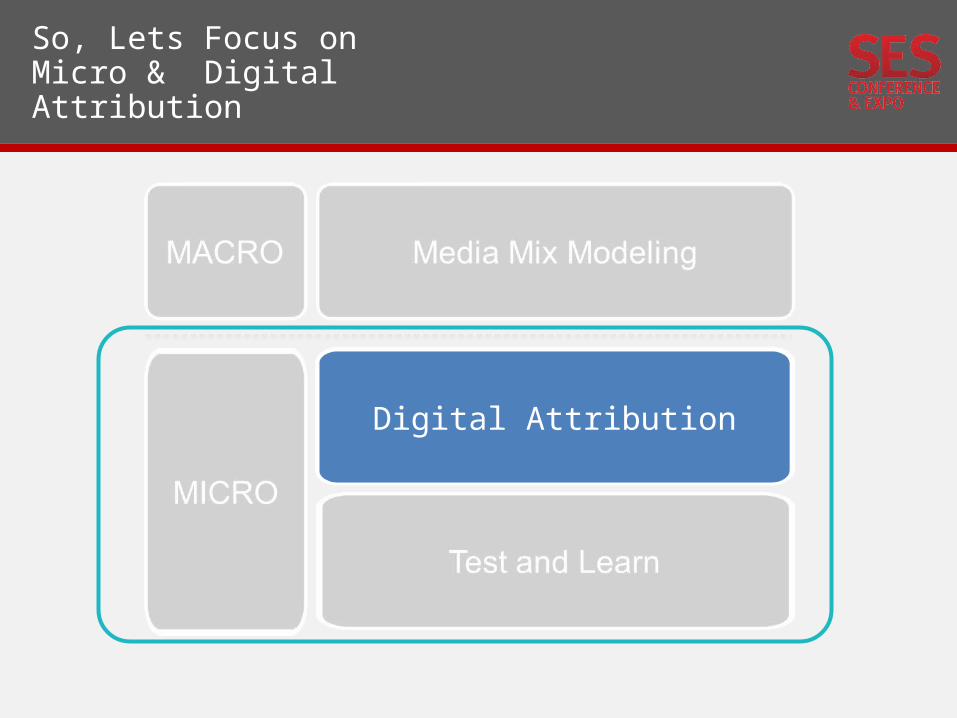
So, Lets Focus on Micro & Digital Attribution
Digital Attribution
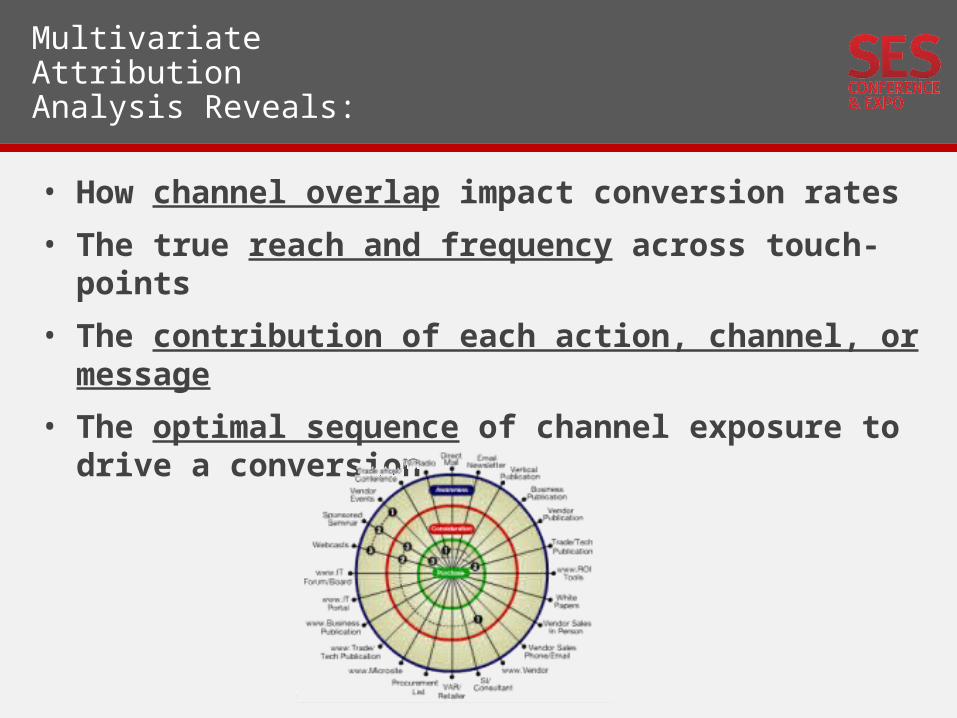
Multivariate Attribution Analysis Reveals:
• How channel overlap impact conversion rates
• The true reach and frequency across touch-points
• The contribution of each action, channel, or message
• The optimal sequence of channel exposure to drive a conversion
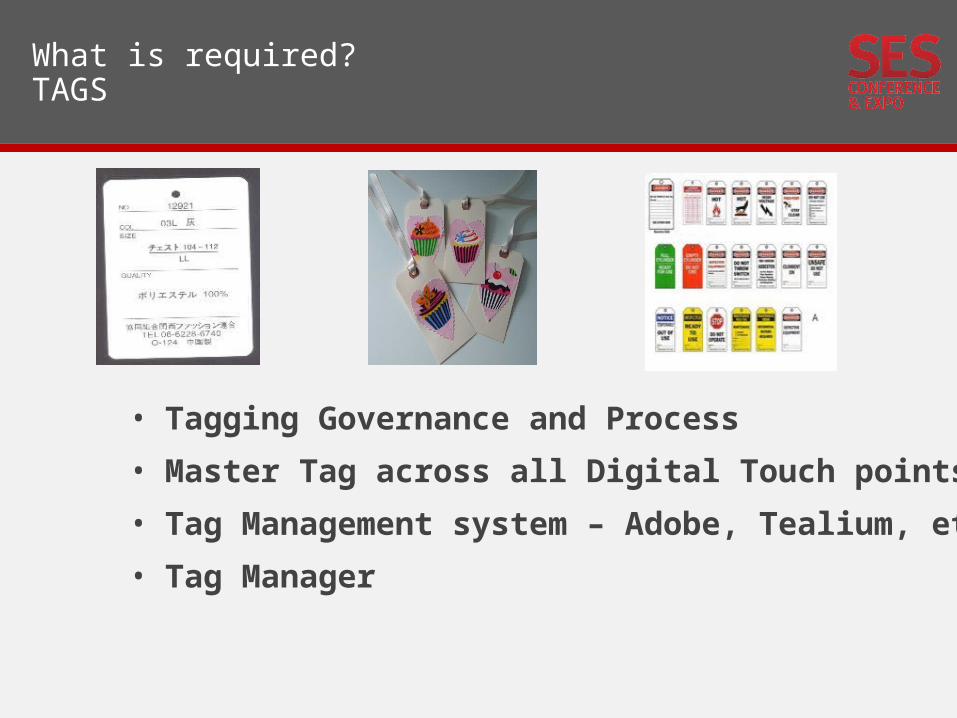
What is required? TAGS
• Tagging Governance and Process
• Master Tag across all Digital Touch points
• Tag Management system – Adobe, Tealium, etc.
• Tag Manager
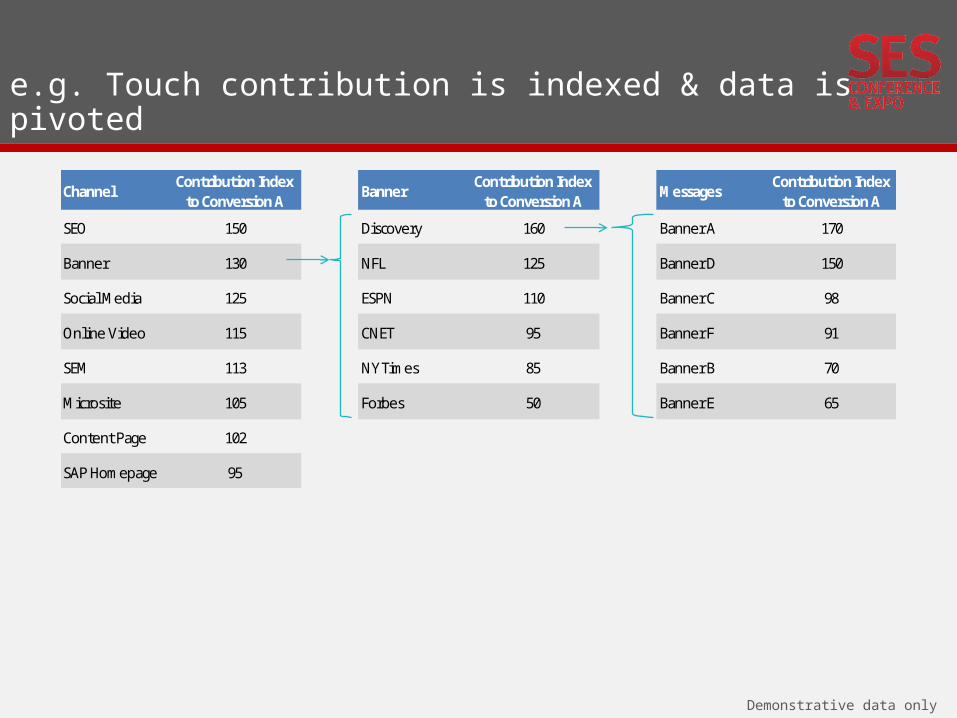
ChannelContribution Index
to Conversion ABanner
Contribution Index to Conversion A
MessagesContribution Index
to Conversion A
SEO 150 Discovery 160 Banner A 170
Banner 130 NFL 125 Banner D 150
Social Media 125 ESPN 110 Banner C 98
Online Video 115 CNET 95 Banner F 91
SEM 113 NY Times 85 Banner B 70
Microsite 105 Forbes 50 Banner E 65
Content Page 102
SAP Homepage 95
e.g. Touch contribution is indexed & data is pivoted
Demonstrative data only
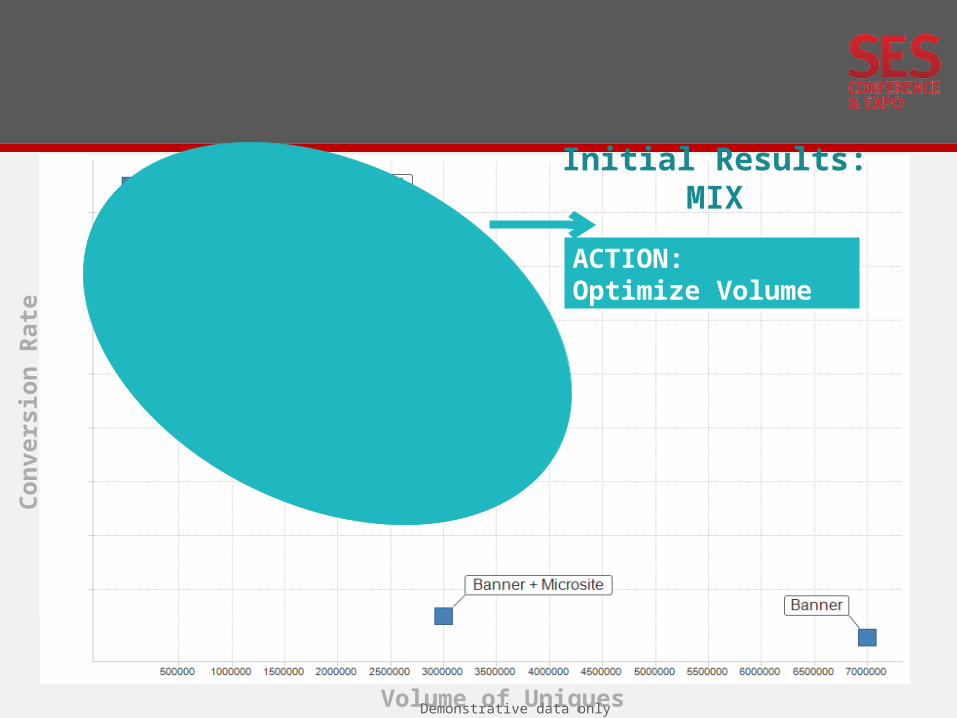
Volume of Uniques
Con
vers
ion
Rate
ACTION: Optimize Volume
Initial Results: MIX
Demonstrative data only
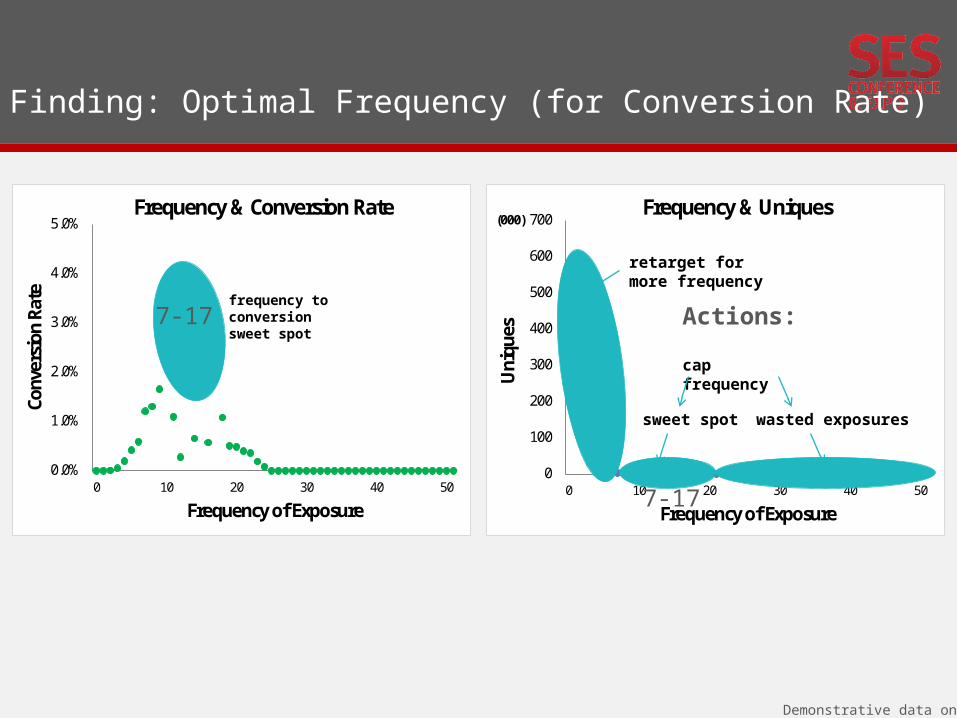
0
100
200
300
400
500
600
700
0 10 20 30 40 50U
niqu
es
(000)
Frequency of Exposure
Frequency & Uniques
7-170.0%
1.0%
2.0%
3.0%
4.0%
5.0%
0 10 20 30 40 50
Conv
ersi
on R
ate
Frequency of Exposure
Frequency & Conversion Rate
Finding: Optimal Frequency (for Conversion Rate)
frequency to conversion sweet spot
Demonstrative data only
7-17
retarget for more frequency
sweet spot wasted exposures
cap frequency
Actions:
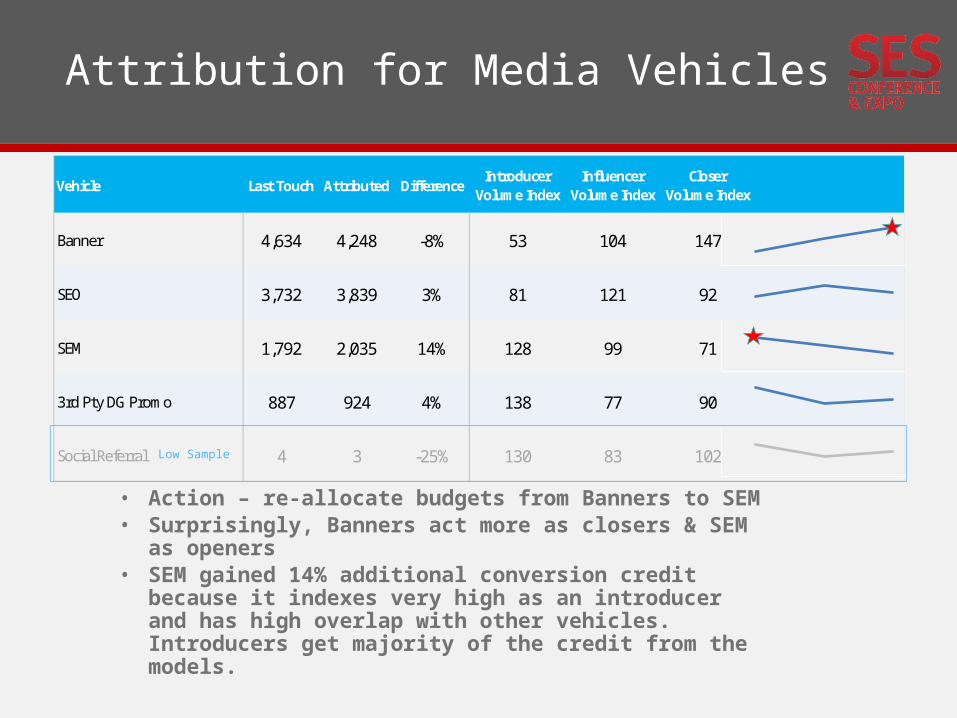
Vehicle Last Touch Attributed DifferenceIntroducer
Volume IndexInfluencer
Volume IndexCloser
Volume Index
Banner 4,634 4,248 -8% 53 104 147
SEO 3,732 3,839 3% 81 121 92
SEM 1,792 2,035 14% 128 99 71
3rd Pty DG Promo 887 924 4% 138 77 90
Social Referral 4 3 -25% 130 83 102
Attribution for Media Vehicles
• Action – re-allocate budgets from Banners to SEM • Surprisingly, Banners act more as closers & SEM as
openers• SEM gained 14% additional conversion credit
because it indexes very high as an introducer and has high overlap with other vehicles. Introducers get majority of the credit from the models.
Low Sample
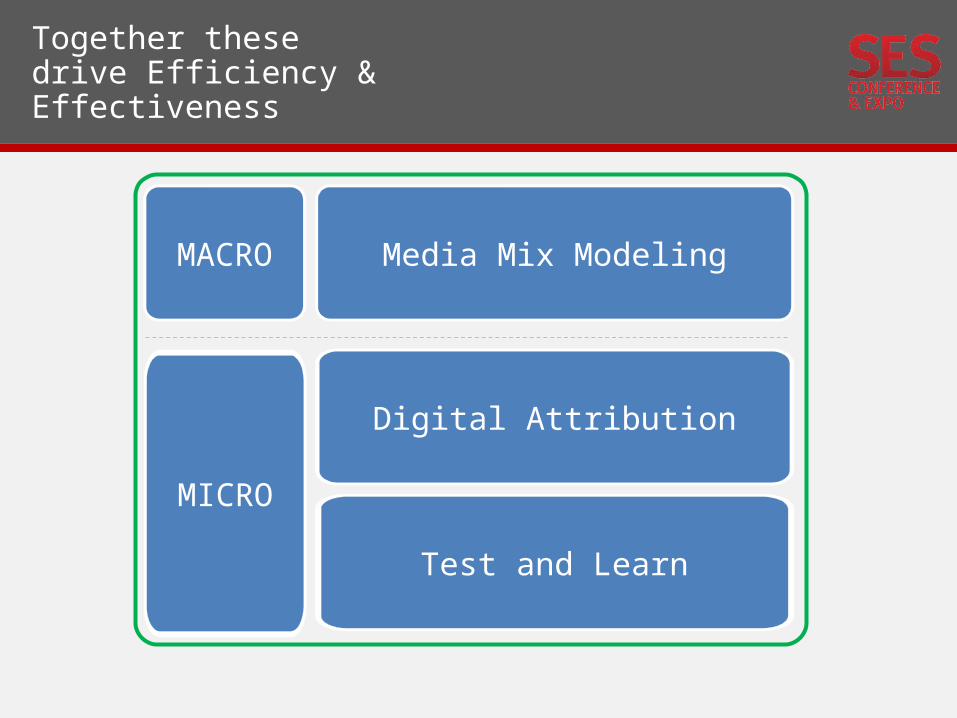
Together these drive Efficiency & Effectiveness
MACRO Media Mix Modeling
MICRO
Digital Attribution
Test and Learn
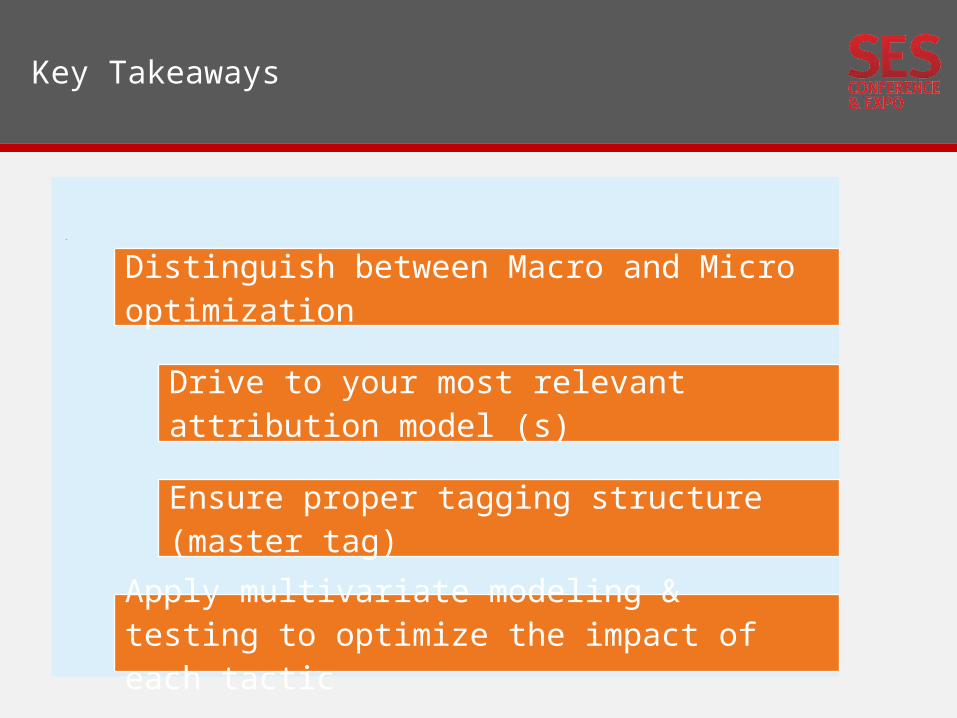
Key Takeaways
Distinguish between Macro and Micro optimization
Drive to your most relevant attribution model (s)
Ensure proper tagging structure (master tag)
Apply multivariate modeling & testing to optimize the impact of each tactic
Thank you Crispin Sheridan Senior Director, Global Search, SAP