smart transportation: what is smart about it and … · smart transportation: what is smart about...
TRANSCRIPT

Smart Transportation: What is smart about it and how might it impact you?
MICHAEL KINTNER-MEYERPacific Northwest National Laboratory
Richland, WA
November 2017PNNL-SA-129098

November 1, 20172
PNNL – FY2016 at a Glance
$920.4M in R&D expenditures
4,400 scientists, engineers and non-technical staff
104 U.S. & foreign patents granted
2 FLC Awards, 2 R&D 100 Awards
1,058 peer-reviewed publications
Mission-driven collaborations
with government, academia
and industry
Among DOE’s top-performing
labs; a premier chemistry,
environmental sciences and
data analytics laboratory

Mobility is Foundational to Modern Economies
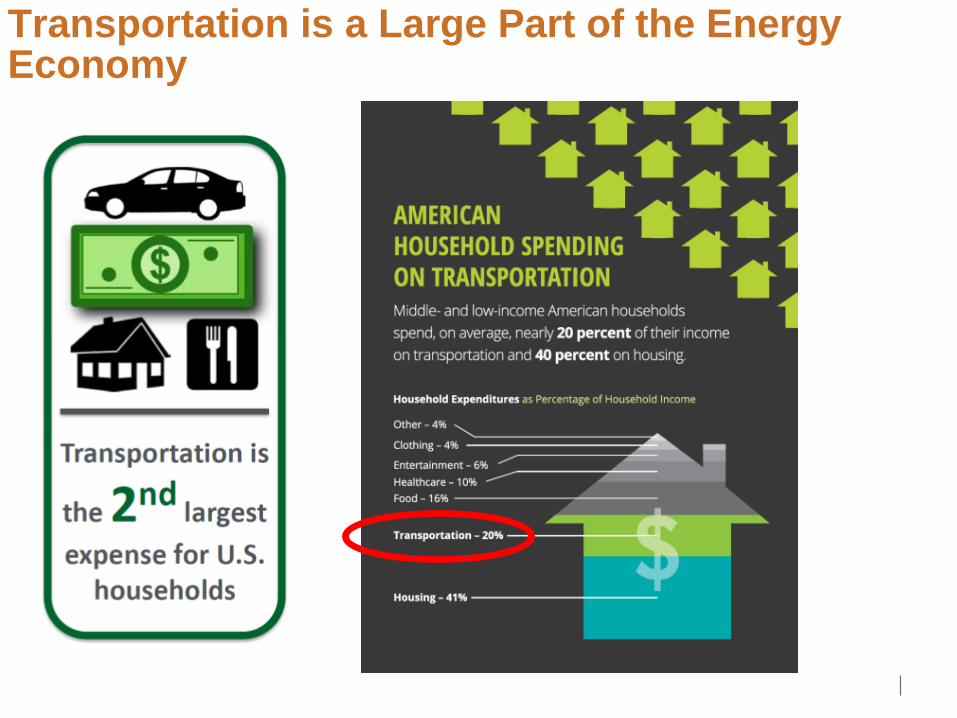
Transportation is a Large Part of the Energy Economy
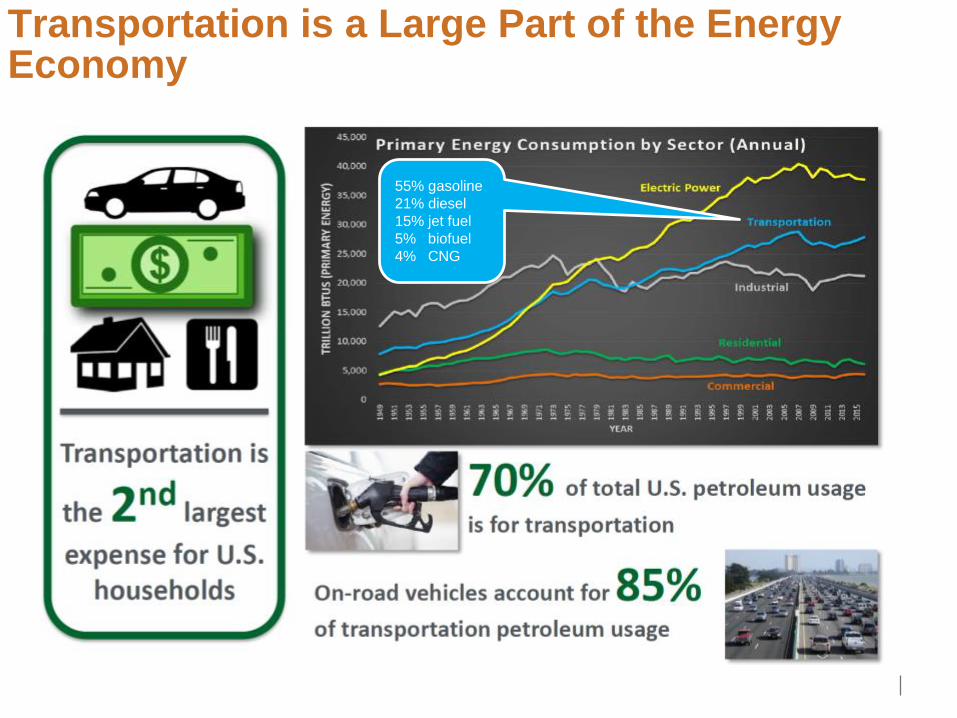
Transportation is a Large Part of the Energy Economy
55% gasoline
21% diesel
15% jet fuel
5% biofuel
4% CNG

Trends Shaping Mobility - PopulationU.S. Population growth
uneven:
- Urban and suburban will
increase
- Rural will decrease

Trends Shaping Mobility – Increasing Demand

Trends Shaping Mobility – Policy
Erosion of
revenues from
gasoline tax
Source: WA- State Transportation Commission
New
approaches:
Road Use
Charge

Trends Shaping Mobility – Technology
Source: Ericsson Technology Review, #1, 2016

Trends Shaping Mobility – Technology

Trends Shaping Mobility – Population/Demographics
Source: U.S. DOT. Beyond Traffic 2045.
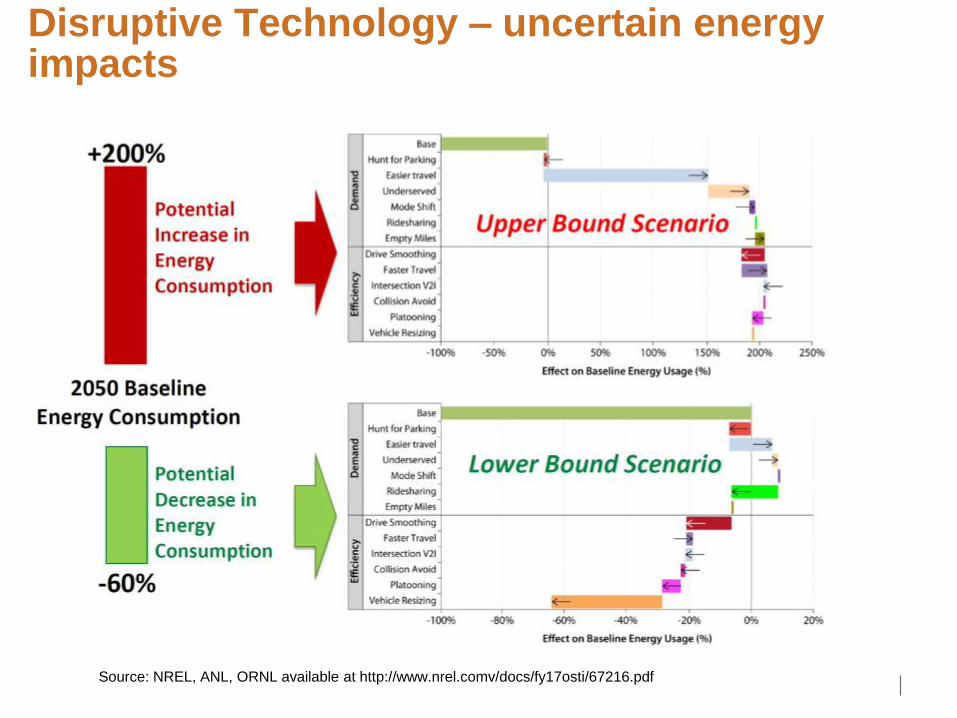
Disruptive Technology – uncertain energy impacts
Source: NREL, ANL, ORNL available at http://www.nrel.comv/docs/fy17osti/67216.pdf

What are the Key Drivers Toward Smart Transportation
Reduction of fatalities/accidents
Managing congestions
Environmental constraints
GHG mitigation
Cleaner air
Fuels security
13
Regulatory Perspective
Cost reductionLong-haul trucking
Last-mile delivery
New business modelsRide-sharing
Transportation as a service
Market Forces and
Compelling Business
perspective
Source: US DOT

Total US Traffic Fatalities
Source: NHTSA, 2015
Additional 90% reduction
With autonomous cars
By mid-century
Source: McKinsey, June 2015
Of all accidents 94% were cause by human failure
At total loss of $836B per year

Managing Congestion
15
Roadway
Expansion
Multimodal
Transportation
Pricing
Reforms
Smart
Growth
Traffic
Demand and
Routing
Management

Managing Congestion
16
Old paradigm
Roadway
Expansion
Multimodal
Transportation
Pricing
Reforms
Smart
Growth
Traffic
Demand and
Routing
Management
Congestion
impacts
Reduces short-run
congestion, but
diminishing
efficacy due to
newly generated
demand
(build and they will
come)
Reduces but often
does not eliminate
congestion
Can
significantly
reduce
congestion
May increase
local
congestion
intensity, but
reduces
regional
congestion
Can reduce
congestion
delays,
however, could
require large
infrastructure
investments

Managing Congestion
17
Roadway
Expansion
Multimodal
Transportation
Pricing
Reforms
Smart
Growth
Traffic
Demand and
Routing
Management
Congestion
impacts
Reduces short-run
congestion, but
diminishing
efficacy due to
newly generated
demand
Reduces but often
does not eliminate
congestion
(Requires shift in
human behavior)
Can
significantly
reduce
congestion
May increase
local
congestion
intensity, but
reduces
regional
congestion
Can reduce
congestion
delays,
however, could
require large
infrastructure
investments
Source: Stanley consultants
Source: door2door.io
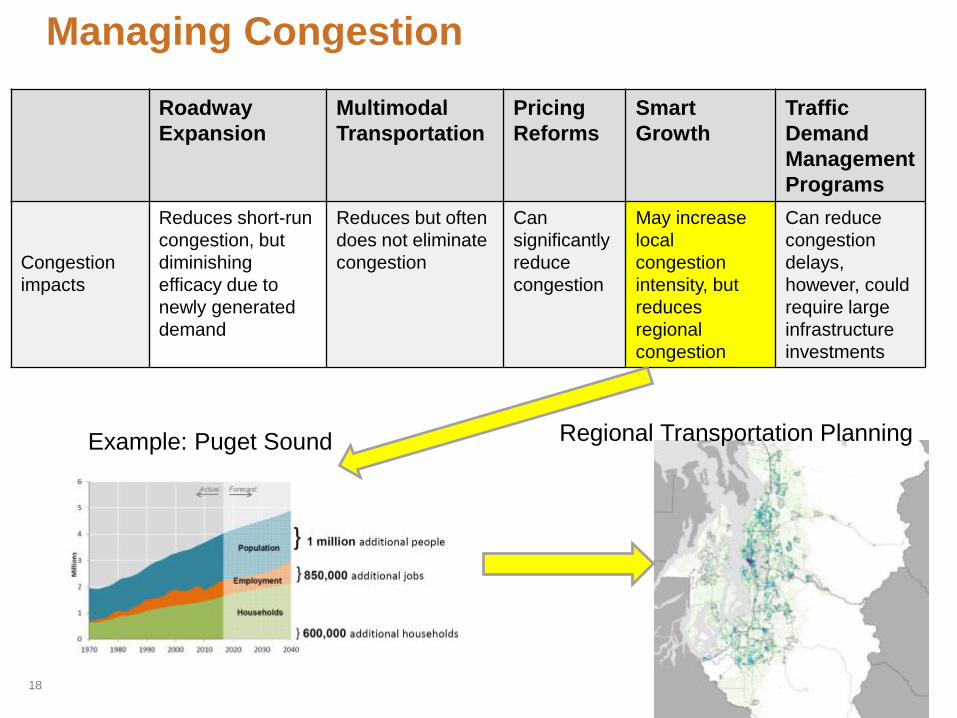
Managing Congestion
18
Roadway
Expansion
Multimodal
Transportation
Pricing
Reforms
Smart
Growth
Traffic
Demand
Management
Programs
Congestion
impacts
Reduces short-run
congestion, but
diminishing
efficacy due to
newly generated
demand
Reduces but often
does not eliminate
congestion
Can
significantly
reduce
congestion
May increase
local
congestion
intensity, but
reduces
regional
congestion
Can reduce
congestion
delays,
however, could
require large
infrastructure
investments
Example: Puget Sound Regional Transportation Planning

Managing Congestion
19
Roadway
Expansion
Multimodal
Transportation
Pricing
Reforms
Smart
Growth
Traffic
Demand and
Routing
Management
Congestion
impacts
Reduces short-run
congestion, but
diminishing
efficacy due to
newly generated
demand
Reduces but often
does not eliminate
congestion
Can
significantly
reduce
congestion
May increase
local
congestion
intensity, but
reduces
regional
congestion
Can reduce
congestion
delays,
however, could
require large
infrastructure
investments
• Central signal systems
• Transit signal priority
• Ramp metering
• Active traffic management

GHG Emissions Reductions
20
176 states, provinces, regions, cities and nations have signed or endorsed the Under2 MOU
California
Connecticut
Massachusetts
Minnesota
New Hampshire
New York State
Oregon
Rhode Island
Vermont
Washington (May 2015)
10 U.S. States
Austin, TX
LA
NYC
Oakland, CA
Portland, OR
Sacramento
SF
Seattle
8 U.S. Cities
Source: www.under2mou.org

WA State: Deep Decarbonization Pathways
21Source: Deep Decarbonization Pathways Analysis for WA State, Evolved Energy Research, Dec. 2016
WA-State current law (RCW
70.235.040) : existing limits
(below 1990 levels)
25% by 2035
50% by 2050
Deep Decarbonization Pathway

Sectoral Contribution to GHG Emissions
22
Source: Deep Decarbonization Pathways Analysis for WA State, Evolved Energy Research, Dec. 2016
WA State GHG reduction strategy must address
foremost Transportation!!

Final Energy Demand
23
Decarbonization pathways result in significantly lower consumption throughenergy efficiency improvementsANDelectrification of transportation
Source: Deep Decarbonization Pathways Analysis for WA State, Evolved Energy Research, Dec. 2016
Electricity
Natural gas
Jet fuel
Diesel fuel
Gasoline
Steam

Electricity Generation
24Source: Deep Decarbonization Pathways Analysis for WA State, Evolved Energy Research, Dec. 2016
hydro
wind
nuclear
coal
solar
geothermal
natural gas
wind
hydro
nuclear
natural gascoal
Decarbonization pathways requiresDeep electrification- primarily transportation (on-road)- space heating- industrial processes
Added Capacity of:• Wind• Solar• Geothermal

Clean Air Regulation (International Perspective)
25
Announcements:
• Britain: banning sales of gasoline and diesel cars (2040)
• France: ending sales of gasoline and diesel vehicles (2040)
• India: all vehicles sold must by electric (2030)
• Norway: clear government target: all cars and vans must
be zero-emission by 2025
Court rules that Stuttgart
must ban diesel engines
from city centre

Compelling Business Cases: Autonomous Vehicles
Cost Reduction for Long-Haul Trucking
Estimated ROI: 3 years
Benefits:
Higher fuel efficiency and lower maintenance due to optimized truck operations
Driver satisfaction: drivers don’t have to work for long periods
Improved safety
First manifestations of AV: truck platooning
Market introduction: mid-2020s
Transportation-as-a-service (TaaS)
New business models by accessing fleets without owning vehicles
Uber, Lyft, Didi, GETT, Hailo, Addison Lee, Ola Cabs, Meru, BlaBla Car, Mytaxi, Grab Taxi, Kako Taxi, Hailo, Sidecar, Flywheel, VIA, Curs, Ingogo, Chaffeur-Prive, Lecab, Easy, Careem26
Source: Iveco autonomous vehicle concept
Source: Mercedes-Benz

Definitions of Autonomous Driving Capabilities
27
Modified: SAE J3016 Taxonomy and Definitions or Terms Related
to On-Road Motor Vehicle Automated Driving Systems
Tesla Autopilot: Level 2

What Technology to Expect in the Automotive Showrooms?
GM: in 2016 bought start-up company Cruise Automation ($586 M) and developed R&D center. Also acquired 9% of Lyft. No timeline
Ford: announced to have Level 4 vehicle by 2021. Announced to buy Argo AI for $1B.
Honda: announced to offer vehicle for self-driving on highways in 2020. Showcasing for the 2020 Summer Olympics. In discussion with Waymo.
Toyota: most skeptical companies. Catching up with peers. Investing $1 B.
BMW:
Collaborating with Intel
Level 4 and 5 by 2021
Tesla: Autopilot (level 2): in 2017
28

What Technology to Expect in the Automotive Showrooms? (continued)
Renault/Nissan:
Working with Microsoft
Announced to provide self-driving vehicle by 2020 for urban environments
Likely by 2025 truly driverless vehicle
Volvo:
Self-driving on highways by 2021
Joint venture with Uber ($300M)
Will take over full liability for self-driving vehicles to boost customer confidence
Hyundai:
Self-driving on highway 2020 and in urban environments by 2030
Investing $1.7B
Daimler (Mercedes-Benz):
Collaborating with Bosch
Deal with Uber
Announced level 4 and 5 at the beginning of 2020s
Fiat-Chrysler:Teamed with Waymo
Expects self-driving within 5 years29

How are we doing in Washington State?
30
Source: WSDOT: WA Plug-in electric vehicle update through June 2017

How are we doing in Chelan County?
31

How to Charge the Vehicle at Home?
32
Charging inside: 240V (Level 2)
With 240V: 1-3 hours charging
Charging outside: 120V (Level 1)
With 120V: 8-12 hours charging
Level 1 Level 2

Fast Charging in 15 Minutes using DC electricity
33
DC plug
DC connection
(Level 3)
240V (AC)
(Level 2)
DC connection
(Level 3)
240V (AC)
(Level 2)

Do We Need a Cord for Charging
34
Wireless Charging Inductive energy transfer
Dynamic wireless charging

EV Charging Infrastructure
35
Source: https://www.plugshare.com/

EV Trip-Tick: Richland to UW, Seattle (228 miles)
36
To Prosser: 29 mi
To Yakima: 50 mi
To Ellensburg: 36 mi
To Cle Elum: 25 mi
To Snoqualmie Pass: 32 mi
To North Bend: 24 mi
To UW: 32 mi

37
Five Reasons for Considering Buying an Electric Vehicle
5. EV’s lowest total cost of ownership today
4.
3.
2.
1.

Total Cost of Ownership
38
Available at: http://media.oregonlive.com/environment_impact/other/PIkes%20exec%20summ%20alt%20fuel%20vehicles%208.27.12.pdf

5. EV’s lowest total cost of ownership today
4. Excellent performance
3.
2.
1.
39
Five Reasons for Considering Buying an Electric Vehicle

Performance: Electric motor generates maximum torque at lowest speeds
40
Electric motor Internal combustion engine
Tesla Roadster

5. EV’s lowest total cost of ownership today
4. Excellent performance
3. It is good for the environment
2.
1.
41
Five Reasons for Considering Buying an Electric Vehicle

No Emissions from Well-to-Wheel Perspective
42
No tailpipe emissions (PM, NOx, HC, CO)
Clean HydropowerNo generation emissions
Clean Well-to-Wheel for Chelan County

5. EV’s lowest total cost of ownership today
4. Excellent performance
3. It is good for the environment
2. It is good for the grid
1.
43
Fife Reasons for Considering Buying an Electric Vehicle

Electric Vehicles Can Provide Balancing Servicesfor Integration of Wind Energy
Single day of additional balancing
requirements for 10 GW of
additional wind in NWPP.
44
0 1 2 3 4 5 6 7 8 9 10 11 12 13 14 15 16 17 18 19 20 21 22 23 24-1500
-1000
-500
0
500
1000
1500
Max. charging (3.6 kW = 240V*15A)
Max. discharging (-3.6 kW)
ch
arg
ing
dis
cha
rgin
g
Max. charging (3.6 kW)
dis
cha
rgin
gch
arg
ing
Never discharge !
V2GFull
V2GHalf
New Balancing
Requirements
Solution Options

5. EV’s lowest total cost of ownership today
4. Excellent performance
3. It is good for the environment
2. It is good for the grid
1. It is “cool” technology, it will be part of the future
45
Five Reasons for Considering Buying an Electric Vehicle

“Cool” Technology…. An essential part of tomorrow’s transportation technology
46

Final thoughts
47
The best way to predict the future is to create it
Abraham Lincoln and Peter Drucker

Backup Slides
48

Decarbonized Pipeline Gas
49Source: Deep Decarbonization Pathways Analysis for WA State, Evolved Energy Research, Dec. 2016

Final Energy Demand
50
All decarbonization pathways show:• lower final energy• Increased electricity consumptions
Source: Deep Decarbonization Pathways Analysis for WA State, Evolved Energy Research, Dec. 2016

Electricity Generation
51Source: Deep Decarbonization Pathways Analysis for WA State, Evolved Energy Research, Dec. 2016
hydro
wind
nuclearcoal
solargeothermal wave

Tesla Charging Network
52
Source: Tesla Motors, 2015
Kennewick
Fred Meyer

Tesla Motors: World-Wide Charging Network
53
Source: Tesla Motors, 2016

How “Self-Driving” vehicles work?
54
Source: On the Road to fully self-driving. Waymo Safety Report, September 2017
Where Am I?

How “Self-Driving” vehicles work?
55
Source: On the Road to fully self-driving. Waymo Safety Report, September 2017
What is around me?

How “Self-Driving” vehicles work?
56
Source: On the Road to fully self-driving. Waymo Safety Report, September 2017
What will happen next?

How “Self-Driving” vehicles work?
57
Source: On the Road to fully self-driving. Waymo Safety Report, September 2017
What should I do?