smarter2030 full report status 2015-06-07 v04
TRANSCRIPT

#SMARTer2030 ICT Solutions for 21st Century Challenges

Copyright © GeSI 2015. All rights reserved. – #SMARTer2030 – ICT Solutions for 21st Century Challenges – 2
Gold Sponsors
• BT
• Deutsche Telekom
• Fujitsu
• Microsoft
• Verizon
Silver Sponsors
• AT&T
• Samsung
Bronze Sponsors
• Swisscom
• Telenor
Major conclusions independently reviewed by
• John A. “Skip” Laitner, Economic and Human Dimensions Research Associates, and President, the Association for Environmental Studies and Sciences
• Mike Berners-Lee, Director, Small World Consulting
Acknowledgements: The Global e-Sustainability Initiative and Accenture Strategy thank the many experts engaged throughout the duration of this effort for generously providing their time, insights, and feedback to strengthen the quality of this report. A full list of SMARTer2030 team members is listed in the appendix.
The following materials were prepared exclusively for the Global e-Sustainability Initiative by Accenture Strategy (Division of Accenture plc.). Neither the Global e-Sustainability Initiative nor Accenture Strategy makes any representations or warranties to any third party with respect to the information contained in this report. While reasonable steps have been taken to ensure that the information in this report is correct, neither the Global e-Sustainability Initiative nor Accenture Strategy give any warranty or make any representation as to its accuracy and accept any liability for any errors or omissions. The study should not be used or relied upon by anyone without independent investigation and analysis and neither the Global e-Sustainability Initiative nor Accenture Strategy assumes any liability for any such use or reliance by third parties.
Any trademarks and other service marks contained in this document are the property of respective owners and may not be used without their prior written permission.
Contact information Global e-Sustainability Initiative (GeSI) c/o Scotland House Rond Point Schuman 6 B-1040 Brussels Belgium Tel: +32 2 282 84 42 Fax: +32 2 282 84 14 General enquiries: [email protected] Press enquiries: [email protected]

Copyright © GeSI 2015. All rights reserved. – #SMARTer2030 – ICT Solutions for 21st Century Challenges – 3
About GeSI
The Global e-Sustainability Initiative (GeSI) is a strategic partnership of Information and Communication Technology (ICT) companies and organizations committed to creating and promoting technologies and practices to foster economic, environmental and social sustainability. Formed in 2001, GeSI’s vision is a sustainable world through responsible, ICT-enabled transformation. GeSI fosters global and open cooper-ation, informs the public of its members’ activities to improve their sustainability performance, and promotes innovative technologies for sustainable development. GeSI’s membership includes over 30 of the world’s leading ICT companies; the organization also collaborates with a range of international stakeholders com-mitted to ICT sustainability objectives. These partnerships include the United Nations Environment Pro-gram (UNEP), the United Nations Framework Convention on Climate Change (UNFCCC), the International Telecommunications Union (ITU), and the World Business Council for Sustainable Development (WBCSD). Such collaborations help shape GeSI’s global vision on evolution of the ICT sector, and how it can best meet the challenges of sustainable development. For more information, see www.gesi.org.
About Accenture
Accenture plc. (,,Accenture’’) is a global management consulting, technology services and outsourcing company, with more than 323,000 people serving clients in more than 120 countries. Combining unparal-leled experience, comprehensive capabilities across all industries and business functions, and extensive research on the world’s most successful companies, Accenture collaborates with clients to help them be-come high-performance businesses and governments. The company generated net revenues of US$30.0 billion for the fiscal year ended August 31, 2014. Its home page is www.accenture.com.
About Accenture Strategy
Accenture Strategy operates at the intersection of business and technology. We bring together our capa-bilities in business, technology, operations and functional strategy to help our clients envision and execute industry-specific strategies that support enterprise wide transformation. Our focus on issues related to dig-ital disruption, competitiveness, global operating models, talent and leadership help drive both efficiencies and growth. For more information, follow @AccentureStrat or visit www.accenture.com/strategy

Copyright © GeSI 2015. All rights reserved. – #SMARTer2030 – ICT Solutions for 21st Century Challenges – 4
Foreword by GeSI
Almost a decade ago, leading representatives of the global Information and Communications Technology (ICT) sector founded the Global e-Sustainability Initiative (GeSI). GeSI is focused on researching and addressing climate change, and developing ideas to realize human potential and usher in an era of innovation and low-carbon growth. We seek to promote shared prosperity in the developing and developed world through economic growth, whilst ensuring that we protect the interests of the planet and cut our emissions to sustainable levels. Our vision is to create a sustainable world through responsible, ICT-enabled transformation.
2015 is a crucial year for global climate policy. Political leaders will gather in Paris to decide how to address the current, alarming trends facing our environ-ment. Many people think that the solution will require difficult trade-offs. We be-lieve, though, that if policymakers, businesses, and consumers can embrace ICT transformation, not only will we be in a better position to usher in a low-carbon future, but we may also realize important economic and social objectives. This is our goal and the motivation behind this new report.
#SMARTer2030: ICT Solutions for 21st Century Challenges is the third report in our continuing series on this important topic and builds on our understanding of how interdependent we are across countries, in-dustries, and cultures. Our findings show an ICT-enabled world of 2030 that is cleaner, healthier and more prosperous, with greater opportunities for individuals everywhere .
This new report is based on in-depth modeling, unprecedented in its range, into the potential for ICT to disrupt business as usual and to reshape radically the way we live, as well as reducing the impact that continuous economic growth has on the environment. It shows how ICT can help break the link between economic development and resource depletion, with emissions savings close to ten times those generated by the ICT sector itself.
ICT is a central pillar in the response to climate change. This report identifies even more possibilities for environmental and economic savings, but also goes further. Until now, there has always been a strong correlation between economic growth and increased energy consumption. Now we find that ICT can finally decouple economic growth from emissions growth. Not only are we seeing potential gains beyond the baseline we extrapolated just a few years ago, if current trends continue we are also likely to realize even more gains than we can predict today.
Clearly, ICT transformation can change people’s lives for the better. The future of global development should be driven by connectivity and the spread of ideas, information, and innovation. Unfortunately, too many people still lack internet and telecommunications access but the ICT sector is committed to ex-panding access so that by 2030, 2.5 billion more people have access to mobile health, distance learning, and the full array of benefits that connectivity can provide.
I am proud to introduce this new research, identifying the environmental, economic, and social promise of ICT in the world of 2030. The #SMARTer2030 report represents a commitment from our industry to enable a better, healthier and sustainable future for all. We are committed to doing what we can to advance this transformation in partnership with our customers, governments, civil society, and citizens everywhere.
I do hope you will find this report useful. Be part of the #SMARTer2030 story. Join us and take action.
Luis Neves
GeSI Chairman
Luis Neves
Chairman, GeSI
Copyright © GeSI 2015. All rights reserved. – #SMARTer2030 – ICT Solutions for 21st Century Challenges – 5
Foreword by UNFCCC
Combating climate change was once seen as a sacrifice, an inevitable trade-off between environmental goals and economic performance — the SMARTer2030 report and a legion of new and emerging analysis across multiple sectors un-derlines that this is no longer the case.
The smart and innovative transitions required to dramatically reduce green-house gas emissions and to decouple growth and development from environ-mental degradation are rapidly being understood as keys for unlocking a health-ier, more prosperous, exciting and fairer world.
SMARTer2030 comes some six months before the crucial United Nations Cli-mate Convention Conference in Paris in 2015. The long-term outcome of the new agreement requires a peaking of global emissions in ten years’ time, and a dramatic bending of the emissions curve thereafter.
In the second half of the century the world needs to have restored the balance of planet earth such that what little emissions are left are easily and safely ab-sorbed by natural systems such as forests: some term this climate neutrality.
This is not about de-industrialization but rather about a transition to clean, high-tech economies that oper-ate at ever accelerating levels of efficiency and ever diminishing levels of pollution and natural resource degradation.
This third GeSI SMART report underlines the pivotal role of Information and Communication Technology (ICT) in enabling the achievement of these aims, while opening up a whole raft of new opportunities for people in all countries, from access to new kinds of educational opportunities to improved access to healthcare, from an increased quality of life to the creation of 21st century businesses.
These are among the many reasons why the UNFCCC is proud and delighted to partner with the Global e-Sustainability Initiative (GeSI) as a key partner of our Momentum for Change initiative. We welcome the SMARTer2030 report as another step on the effort to raise awareness of the tremendous potential of ICT solutions in facilitating and enabling innovation and positive change. SMARTer2030 is a narrative and the transformative contribution of ICT about a better future and better living for all.
Christiana Figueres,
Executive Secretary, UN Framework Convention on Climate Change (UNFCCC)
Christiana Figueres
Executive Secre-tary UNFCCC

Copyright © GeSI 2015. All rights reserved. – #SMARTer2030 – ICT Solutions for 21st Century Challenges – 6
Foreword by Accenture
By the end of this year, the world will likely have made significant political progress not just in combatting climate change, but in committing to the new Sustainable Development Goals that will tackle the world’s biggest challenges. It is worth ac-knowledging the way in which business has become much more central to these issues in recent years. No longer a follower of the climate debate, business is now leading it. Two factors explain this change:
First, companies have begun to recognize that sustainable practices are not simply a matter of adhering to rules on climate stewardship or managing risk and reputa-tion, but that, designed and led well, they can be a major source of growth and innovation.
Second, the proliferation and maturity of digital technologies in the last decade has created business models that are not only changing customer experiences and con-sumption habits, but doing so in inherently resource efficient ways.
In short, enterprises are putting sustainability and technology at the heart of their business strategies. Ac-centure Strategy sees this powerful combination – if harnessed effectively – shifting sustainable business from a long phase of pilots and peripheral efforts to a new era of large scale transformations in production, sourcing, servicing and consuming. We estimate that ICT technologies could generate $6 trillion in addi-tional revenues and $5 trillion in cost savings in 2030, representing enormous opportunities for countries to improve their comparative advantage and for companies to boost their competitive advantage.
Technologies such as analytics, advanced robotics, Smart Grids and mobile are no longer merely enablers of doing business, but drivers of market disruption and creation. Only five years ago it would have seemed unbelievable that some of the world’s most powerful companies could include a hotelier, AirBnB, which doesn’t own a single hotel or a global transportation business, Uber, without a single car in its fleet. Both are driving more efficient use of our global stock of buildings and vehicles.
Today, digital technologies behind these successes have the potential to bring E-Health and E-Learning to billions of currently unconnected people, while boosting agricultural productivity. In all, we expect 2.5 billion people to be connected by these innovations by 2030, helping to create attractive and competitive new markets that are built on foundations of greater environmental and social sustainability. Mature economies are also benefiting from greater energy efficiency, smarter services and the Industrial Internet of Things.
The promise is real, but to make it a reality, governments and business leaders need to take bolder steps to encourage more widespread adoption. Regulations, standards, policies and governance structures need to adapt at the pace of technology. Digital customer experiences need to be tailored to different population groups. New technologies also require careful management of some downsides: the rise cybercrime, the impact on jobs and the potential of a widening digital divide.
Despite these challenges, the business case for digitally-driven sustainable investments is clear. Now it needs the momentum that only businesses, governments and consumers can create together.
I hope you enjoy reading the report and that it provides an evidence-base for the debate and collaboration required to deliver the tantalizing prize on offer.
Peter Lacy
Managing Director, Sustainability Services, Accenture Strategy
Peter Lacy Managing Director Accenture Strategy

Copyright © GeSI 2015. All rights reserved. – #SMARTer2030 – ICT Solutions for 21st Century Challenges – 7
Contents
Foreword by GeSI 4
Foreword by UNFCCC 5
Foreword by Accenture 6
1 Executive Summary: ICT Solutions for 21 st Century Challenges 8
2 A triple win: ICT will deliver significant environmental, social and economic benefits 15
2.1 Introduction 15
2.2 Environment – Decreasing emissions and resource consumption whilst allowing for growth 17
2.3 Economic – ICT is good for business, creating new revenue opportunities and reducing costs 22
2.4 Social – Boosting incomes, cutting costs and improving lives 25
3 Connected world: Eight sectors will profit most 29
3.1 Health – The doctor in your pocket 29
3.2 Learning – Education on your terms 34
3.3 Building – Smarter homes, smarter offices 38
3.4 Food – Produce more and waste less 42
3.5 Mobility – Reaching your destination, not a dead end 46
3.6 Energy – Integrating renewables into the grid 51
3.7 Work and business - The impacts of E-business on working, banking & shopping 56
3.8 Manufacturing – Resource efficient and customer centric 60
4 Countries across all income levels can benefit from ICT solutions 64
4.1 Australia 64
4.2 Brazil 67
4.3 Canada 70
4.4 China 73
4.5 Germany 76
4.6 India 80
4.7 Kenya 83
4.8 United Kingdom 86
4.9 United States 89
5 Call to action: There are three stakeholder groups which are the most critical in accelerating ICT adoption 92
5.1 Policy makers 92
5.2 Business 94
5.3 Consumers 97
6 Appendix 99
6.1 Acknowledgements 99
6.2 Table of Figures 100
6.3 List of case studies in the report 102
6.4 Methodology overview 103
6.5 Approach to modelling 104
6.6 Glossary 133

Copyright © GeSI 2015. All rights reserved. – #SMARTer2030 – ICT Solutions for 21st Century Challenges – 8
1 Executive Summary: ICT Solutions for 21 st Century Challenges
Overview Since 2008, the Global e-Sustainability Initiative has been researching the role Information and Commu-nications Technology (ICT) can play in cutting global CO2e emissions and promoting a more sustainable society. This is our third report in that effort and it is based on detailed modeling that, for the first time, also quantifies the far-reaching social and economic benefits of ICT. The findings are profound. As ICT has become faster, cheaper and more accessible globally, our report highlights its potential to generate powerful environmental, economic and social benefits beyond what we envisioned as recently as two years ago. Our findings show an ICT-enabled world that is cleaner, healthier and more prosper-ous, with greater opportunities for individuals everywhere. Our major findings are as follows: • ICT can enable a 20% reduction of global CO 2e emissions by 2030, holding emissions at 2015
levels. This means we can potentially avoid the tradeoff between economic prosperity and environ-mental protection.
• ICT emissions as a percentage of global emissions will decrease over time. Our research shows the ICT sector’s emissions “footprint” is expected to decrease to 1.97% of global emissions by 2030, compared to 2.3% in 2020, which our previous report predicted. Furthermore, the emissions avoided through the use of ICT are nearly ten times greater than the emissions generated by deploying it.
• ICT offers significant environmental benefits in addition to reducing carbon emissions. The
most substantial benefits identified by this study include increasing agricultural crop yields by 30%, saving over 300 trillion liters of water and saving 25 billion barrels of oil per year.
• An assessment of eight economic sectors – mobility & logistics, manufacturing, food, buildings,
energy, work & business, health and learning – shows that ICT could generate over $11 trillion in economic benefits per year by 2030, the equivalent of China’s expected annual GDP in 2015.
• ICT will connect 2.5 billion extra people to the “knowledge economy” by 2030, giving 1.6 billion
more people access to healthcare and half a billion more people access to E-Learning tools. • Worldwide growth of the digital economy continues to accelerate, providing the scale neces-
sary to drive greater connectivity and new, disruptive business models. And, as opposed to the old production-line economy, individuals are firmly at the center of this process.
In our view, three stakeholder groups hold the key to accelerating the widespread adoption of ICT solutions: policymakers, business leaders and consumers. We have developed recommendations for action for each in the final section of the report.
What follows is a summary of each of these major findings and recommendations for realizing the full po-tential of ICT.

Copyright © GeSI 2015. All rights reserved. – #SMARTer2030 – ICT Solutions for 21st Century Challenges – 9
ICT has the potential to enable a 20% reduction of global CO 2e emissions by 2030, holding emis-sions at 2015 levels. In 2014, the Intergovernmental Panel on Climate Change (IPCC) published a report presenting the culmi-nation of its research into the causes of climate change and its impact on the global ecosystem. The re-port found that if greenhouse gas emissions continued at their current rate, the world would significantly miss its target of holding global average temperature increases to less than 2°C. The IPCC concluded that a “business as usual” scenario would see temperature increases of between 2.6 and 4.8oC by the end of the century – an unhealthy scenario for our planet and quality of life. The seemingly intractable problem, though, is that the global economy has so far failed to decouple eco-nomic growth from emissions growth. The historical trend holds that for every 1% increase in global GDP, CO2e emissions have risen by approximately 0.5%1 and resource intensity by 0.4%2.The world seems caught in a bind, having to choose between economic prosperity and environmental protection. We have found that by rolling out identified ICT solutions across the global economy, total global emis-sions of CO2e could be cut by 12Gt by 2030, promoting a path to sustainable growth. Figure 1 illustrates the contribution to global emissions mitigation of the main sectors we have examined in this report. The total emissions mitigation enabled by ICT alone would be enough to hold emissions at their current level.3 Figure 1: CO2e abatement potential by sector (2030)
1 Period from 1975 to 2010 considered. Accenture analysis based on data from WRI and World Bank GDP data, http://data.worldbank.org/
2 Period from 1975 to 2010 considered. Accenture analysis based on data from SERI and Dittrich, M. (2014). Global Material Flow Database. 2014 version and World Bank GDP data, http://data.worldbank.org/
3The 12.1 Gt CO2e reduction in 2030 enabled by ICT includes 1.8 Gt CO2e abatement from integration of renewable energy production into the grid. In its business as usual emissions forecast IPCC expects emissions to rise by 11.1 Gt by 2030. This rise already considers the CO2e abatement from renewable energy. Therefore, the additional ICT-enabled CO2e reduction against the IPCC emissions forecast for 2030 is 10.3 Gt CO2e (based on a total of 12.1 Gt CO2e minus 1.8 Gt CO2e from renewable.)
1 Mobility solutions consider ICT-enabled improvements to private and commercial mobility and additionally consider the reduced need to travel from various sectors, including health, learning, commerce, etc.
Source: WRI, IPCC, World Bank, GeSI, Accenture analysis & CO2 models
Buildings ICT-enabled savings
2.0
Manu-facturing
EnergyAgriculture
2.0
3.6
1.8
2.7
12.1
Mobility1

Copyright © GeSI 2015. All rights reserved. – #SMARTer2030 – ICT Solutions for 21st Century Challenges – 10
ICT emissions as a percentage of global emissions will decrease over time. In our 2008 report, SMART2020, we estimated that the ICT sector’s emissions would reach 1.43Gt CO2e by 2020, which would represent 2.7% of global emissions. Five years later, our SMARTer2020 report re-vised that forecast down to 1.27Gt, representing 2.3% of global emissions. The revised estimates were based on actual energy efficiencies realized between 2008 and 2012 as well as on updated data. In this study, we predict a further decrease, with ICT’s own footprint expected to reach 1.25Gt CO2e in 2030, or 1.97% of global emissions. Furthermore, our modeling shows that the 12Gt CO2e avoided through the use of ICT solutions is nearly 10 times higher than ICT’s expected footprint in 2030. Our research shows that the decrease in the ICT sector’s footprint is due to a range of investments com-panies in the sector have been making to reduce their emissions and to the expected improvements in the efficiency of ICT devices. Figure 2: ICT benefits factor in 2020 and 2030 (Gt CO2e)
ICT offers significant environmental benefits in add ition to reducing carbon emissions. ICT also offers other significant additional environmental benefits like spurring higher agricultural yields and reducing the consumption of scarce resources. By 2030, the most substantial additional environmen-tal benefits identified by this study include: • Increasing agricultural crop yields by 30%, or close to 900kg per hectare per year;
• Saving over 300 trillion liters of water per year, mostly from smarter agricultural practices; and
• Saving 25 billion barrels of oil per year.
ICT-enabled
ICT-footprint 1.43
1.25
1.27 7.2x
9.7x
ICT-footprint
ICT-enabled 9.10
ICT-footprint
ICT-enabled 12.08
7.80
5.5x
SMARTer2030
Source: Source: WRI, IPCC, GeSI, SMARTer2020, Accenture analysis & CO2 models
SMARTer2020
(2012 report)
SMART2020
(2008 report)
Copyright © GeSI 2015. All rights reserved. – #SMARTer2030 – ICT Solutions for 21st Century Challenges – 11
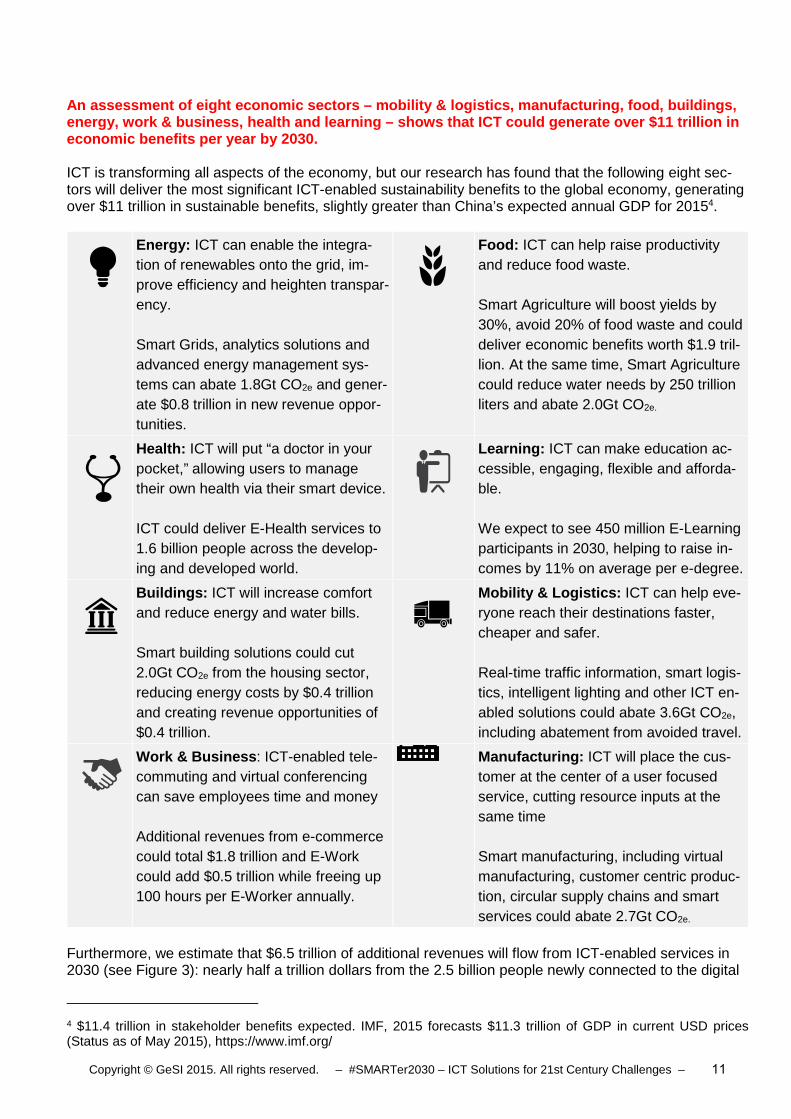
An assessment of eight economic sectors – mobility & logistics, manufacturing, food, buildings, energy, work & business, health and learning – shows that ICT could generate over $11 trillion in economic benefits per year by 2030. ICT is transforming all aspects of the economy, but our research has found that the following eight sec-tors will deliver the most significant ICT-enabled sustainability benefits to the global economy, generating over $11 trillion in sustainable benefits, slightly greater than China’s expected annual GDP for 20154.
Energy: ICT can enable the integra-tion of renewables onto the grid, im-prove efficiency and heighten transpar-ency. Smart Grids, analytics solutions and advanced energy management sys-tems can abate 1.8Gt CO2e and gener-ate $0.8 trillion in new revenue oppor-tunities.
Food: ICT can help raise productivity and reduce food waste. Smart Agriculture will boost yields by 30%, avoid 20% of food waste and could deliver economic benefits worth $1.9 tril-lion. At the same time, Smart Agriculture could reduce water needs by 250 trillion liters and abate 2.0Gt CO2e.
Health: ICT will put “a doctor in your pocket,” allowing users to manage their own health via their smart device. ICT could deliver E-Health services to 1.6 billion people across the develop-ing and developed world.
Learning: ICT can make education ac-cessible, engaging, flexible and afforda-ble. We expect to see 450 million E-Learning participants in 2030, helping to raise in-comes by 11% on average per e-degree.
Buildings: ICT will increase comfort and reduce energy and water bills. Smart building solutions could cut 2.0Gt CO2e from the housing sector, reducing energy costs by $0.4 trillion and creating revenue opportunities of $0.4 trillion.
Mobility & Logistics: ICT can help eve-ryone reach their destinations faster, cheaper and safer. Real-time traffic information, smart logis-tics, intelligent lighting and other ICT en-abled solutions could abate 3.6Gt CO2e, including abatement from avoided travel.
Work & Business : ICT-enabled tele-commuting and virtual conferencing can save employees time and money Additional revenues from e-commerce could total $1.8 trillion and E-Work could add $0.5 trillion while freeing up 100 hours per E-Worker annually.
Manufacturing: ICT will place the cus-tomer at the center of a user focused service, cutting resource inputs at the same time Smart manufacturing, including virtual manufacturing, customer centric produc-tion, circular supply chains and smart services could abate 2.7Gt CO2e.
Furthermore, we estimate that $6.5 trillion of additional revenues will flow from ICT-enabled services in 2030 (see Figure 3): nearly half a trillion dollars from the 2.5 billion people newly connected to the digital
4 $11.4 trillion in stakeholder benefits expected. IMF, 2015 forecasts $11.3 trillion of GDP in current USD prices (Status as of May 2015), https://www.imf.org/

Copyright © GeSI 2015. All rights reserved. – #SMARTer2030 – ICT Solutions for 21st Century Challenges – 12
economy, plus $1.6 trillion from other ICT-services. ICT-enabled services from other sectors will contrib-ute an additional $4.5 trillion, revenues from increased agricultural yields, expanded e-commerce offer-ings, smart energy solutions and more. Figure 3: ICT-enabled revenue opportunities (2030)
ICT could also cut total economic costs across the sectors by $4.9 trillion: $1.2 trillion from reduced elec-tricity expenditure, $1.1 trillion from reduced fuel expenditure and $2.6 trillion from various other opportu-nities including savings on tuition, real estate and water. Figure 4: ICT-enabled cost saving opportunities (2030)
ICT will connect 2.5 billion additional people to the “knowledge economy” by 2030. The ICT-enabled economy of 2030 will not only be cleaner and more prosperous, but will support a better quality of life. We believe ICT has the power to transform lives and to put the individual at the heart of the new knowledge economy. Our modeling finds that an additional 2.5 billion people will be connected to ICT by 2030. Global ICT ac-cess could bring E-Healthcare solutions to 1.6 billion people across the world and help half-a-billion peo-ple gain access to quality, affordable education through E-Learning. We believe E-Learning solutions alone have the potential to raise incomes by 11% on average per e-degree, creating more than $0.5 tril-lion in additional annual income by 2030. Overall, the benefits ICT can deliver at a personal level are threefold: reduced costs, higher incomes and greater convenience. These benefits are particularly meaningful to disadvantaged or remote communities where ICT could help pensioners with limited mobility to access healthcare at home via E-Health solu-tions, or provide a smallholder farmer in rural Kenya with access to global crop, weather and market data, boosting his or her income, raising yield and cutting resource-use and associated emissions.
0.40.2 0.2
E-Work
0.5
Energy
0.80.8 0.0
E-Commerce
1.8
1.20.6
Agriculture
1.9
1.80.1
Total2030
6.5
New connections
0.42.0
4.5
0.70.5 0.2
Buildings Other sectors
StakeholdersICT sector
Source: WRI, IPCC, Gartner, FAO, GeSI, Accenture analysis & CO2 models
1.1
Fuel
4.9
2.6
Electricity
1.2
Total savings2030
Other (e.g., tuition, water)

Copyright © GeSI 2015. All rights reserved. – #SMARTer2030 – ICT Solutions for 21st Century Challenges – 13
Similarly, our research shows that E-Working solutions can boost the productivity of tele-Workers in all parts of the world, giving them back an average of 100 hours a year to spend with their friends and family (250 billion hours across the global economy in total). Worldwide growth of the digital economy continues to accelerate, providing the scale necessary to drive greater connectivity and new, disruptive business models. Since our last report, SMARTer2020 published in 2012, several major developments have converged to create a genuine prospect for the digital economy to take-off: • User Centricity: One of the major differences between the new, digital, economy and the old is the
role and power of the customer as an individual. No longer at the end of an impersonal production line, users are now at the center of the process, able to direct and co-create services according to their specific needs, for example via personalized medicine and diagnostics for health conditions, or the customization of a new garment. We illustrate what this means in practice for each of the eight sectors later in the report.
• Number of Connected Devices: In 2015, “digital connectivity” has fundamentally changed. Internet access and smart phone ownership are at much higher levels and the number of connected devices is expected to grow to 100 billion by 20305.
• New Business Models: The business case for ICT-enabled business models is now stronger than ever. That wasn’t as clear at the time of our last report. Digital disruptors like Uber and AirBnB have grown into multi-billion dollar businesses and 61% of c-suite executives interviewed by Accenture emphasized the revenue opportunities presented by digital investments6.
• Finally, as the technology-fluent millennial generation grows more affluent and demands more flexi-bility from the goods and services its members buy, opportunities abound for organizations to re-spond in ever more innovative ways.
Recommendations This new research demonstrates that ICT has the potential to create a more hopeful and prosperous fu-ture, putting the citizen at the heart of a sustainable, digital economy. In our view, three stakeholder groups hold the key to accelerating the widespread adoption of ICT solu-tions: policymakers, business leaders and consumers. We have developed recommendations for action for each in the final section of the report. Policymakers • Set and enforce global and national emissions targets and recognize ICT solutions as a core tool to
securing continued economic growth under these constraints.
• Incentivize investments in infrastructure geared to connecting the unconnected and enable more peo-ple, across all income segments, to gain access to ICT.
• Establish a fair, balanced and consistent regulatory approach to ICT that promotes innovation and investment, protects intellectual property rights and ensures consumer privacy and security.
Business Leaders • Drive investments in ICT uptake and cooperate with others in your sector.
5 International Energy Agency, More Data Less Energy, 2014
6 Accenture, CEO Briefing 2015, From Productivity to Outcomes, 2015

Copyright © GeSI 2015. All rights reserved. – #SMARTer2030 – ICT Solutions for 21st Century Challenges – 14
• Explore ICT-enabled revenue and cost-saving opportunities and set bold sustainability targets to har-ness opportunities and prepare for tighter emissions regulation.
Consumers • Get ready to “think digital” and be willing to try innovative ways of going about work and life.
• Use ICT to tailor services to your specific needs, whether that be in education, healthcare, mobility or commerce.
• Use your buying power to encourage the businesses and public services that are rolling out sustaina-ble ICT-enabled services to do more.
Please note: As with any research program looking to produce a viable forecast for a 15-year horizon, our modeling is open to uncertainties and contingencies. We have tried to make our assumptions and the technical and policy requirements on which they rest as clear as possible (please see the appendix for further information) but we are fully aware that our scenarios remain only one of a broad range of possi-ble trajectories.

Copyright © GeSI 2015. All rights reserved. – #SMARTer2030 – ICT Solutions for 21st Century Challenges – 15
2 A triple win: ICT will deliver significant environmental, social and eco-nomic benefits
2.1 Introduction
This report is the third of GeSI’s in-depth analyses, since 2008, into the role ICT can play in helping to meet one of the global economy’s most pressing challenges: sustaining economic growth while protecting the planet. In order to achieve that, it is essential that we cut the historical link between every unit of additional global GDP and the greenhouse gas emissions (CO2e) we emit in the process, economy wide. So far, this has proved elusive.
In 2008, our report, SMART2020: Enabling the Low Carbon Economy in the Information Age, showed that applying ICT solutions to a range of sectors could cut global CO2e emissions by up to 15% and save close to $900 billion by 20207.
In 2012, our next report, SMARTer2020: the Role of ICT in Driving a Sustainable Future, demonstrated how the increased use of technologies like video conferencing and smart building management could cut projected 2020 emissions by 16.5%, adding up to a total emissions reduction of 9.1Gt CO2e and to $1.9 trillion in energy and fuel savings. This was equivalent to more than seven times the ICT sector’s emissions in the same period.
The core argument of this report, now looking to 2030, is that ICT can allow us to continue to grow eco-nomically while holding emissions at 2015 levels and generating numerous social benefits. By taking the IPCC’s own (2014) “business as usual” scenario as a base (in which it predicts global emissions will rise by 11Gt by 2030) we find that ICT-enabled solutions rolled out over the same period can enable emissions savings of 10Gt CO2e. When you add to this the 2Gt of abatement that the IPCC includes in its model (due to its expectation of more ICT-enabled renewable energy on grids) this brings us to a total abatement potential of 12Gt – or a 20% cut in global emissions by 2030, effectively decoupling economic growth from emissions growth.
And part of this has been made possible by the falling emissions footprint of the ICT industry itself. SMARTer2020 predicted that ICT emissions would rise to 1.27Gt CO2e in 2020, equal to 2.3% of global emissions in 2020. Our research shows that ICT’s footprint could fall to 1.97% of global emissions by 2030, due to a range of investments companies in the sector have been making to reduce their footprint and to the expected increase in the efficiency of end-user-devices.
But this report goes further than purely modeling the environmental potential of ICT between now and 2030. In fact it is the first of its kind to examine the potential economic and social benefits as well as the environ-mental benefits that ICT can bring people all over the world – in developed and developing counties alike. This is what we call “the triple win” and the remainder of this chapter looks at the environmental, the social and the economic benefits in turn.
The Digital revolution
Propelled by much greater access to broadband internet across the world and by the falling costs of smart phones and end-user devices generally, we are witnessing nothing short of a revolution in the growth of new, disruptive business models. The pace of change is noticeable even since our last report in 2012. A decade ago, few would have guessed that a technology firm would be able to become the largest hotelier in the world within seven years without building a single hotel or guesthouse. Or that a technology start-up could use a single smartphone application to build a $40 billion taxi business in six years without owning one car.
And these trends are now extending out to the traditional public sector: healthcare, education and transport, bringing huge opportunities in the way we interact with service providers and with each other. This is set to accelerate.
7 SMART2020, published 2008, provided the following figures (in 2008 values): €553 billion ($872.3 billion) in energy and fuel saved. http://www.smart2020.org/publications/

Copyright © GeSI 2015. All rights reserved. – #SMARTer2030 – ICT Solutions for 21st Century Challenges – 16
New generation
At the same time, as an increasingly affluent generation of consumers and citizens around the world be-comes fluent with digital technology, even able to co-create their own solutions, it is becoming evident that ICT can improve lives and empower citizens, from megacities to some of the most remote locations on earth.
ICT brings wider economic and social benefits
As we show in this report, ICT-solutions can help businesses around the world to continue to grow without putting our environment at risk. Of course, there are policy mechanisms needed and we discuss what role policymakers need to play later in the report, along with the actions businesses and consumers themselves need to take.
But the good news is that ICT can do much more than generate revenue, cut costs and reduce emissions. In the third part of our analysis, we show that ICT-enabled solutions can also vastly improve the lives of people all over the world, from people living in some of the most remote rural villages in East Africa, to telecommuters living in an affluent metropolis.
By connecting the unconnected to the new economy, ICT can also contribute to addressing human devel-opment challenges like extreme poverty and a lack of access to essential services like healthcare, educa-tion and banking. With smartphones and broadband connections becoming ubiquitous, more and more people will gain access to such services, effectively raising their health outcomes and their income poten-tial.
At GeSI, we are struck not only by the potential revenue gains across all sectors adopting ICT but, as importantly, by the variety of ways in which ICT can help meet specific development challenges and im-prove people’s quality of life. ICT will be a key technology to support the new sustainable development agenda, by creating new opportunities and connecting the unconnected.
Importantly, SMARTer2030 represents a roadmap for GeSI’s member companies. Of course, the rate of adoption of the potential benefits we set out here depends on a range of factors, including the degree to which policymakers and consumers engage with the scale of transformation and drive through the changes needed. But it will also depend, to a large extent, on the degree to which businesses recognize and harness the opportunities we highlight. What we can say with certainty, though, is that through their own recent practice, GeSI’s member companies have demonstrated that the possibilities our research has modeled are far from pie in the sky. They are at hand today.
The structure of this report
We begin, in this chapter, by setting out the headline benefits that ICT can make across each of the metrics we have examined: environment, society and economy. We explain how ICT can help decrease emissions and lower resource-use across the global economy as a whole. We then look at how the solutions we have profiled can help boost household incomes, cuts costs and improve the quality of people’s lives in a range of different situations across the world. Lastly, we look at the general economic opportunities ICT-enabled solutions can bring to raise revenue and cut costs for business and other organizations.
In Chapter Three we break our findings down into the eight sectors we examined for this report and, again, describe how specific ICT solutions can improve environmental, social and economic outcomes across the sectors. The sectors we profile are: healthcare, education, building, agriculture, mobility, energy, e-busi-ness and smart manufacturing.
In Chapter Four we break down our analyses by geography, presenting findings on the environmental, social and economic benefits ICT can bring to meet specific challenges in nine countries, of very varying incomes and social profiles. The countries we examine are: Australia, Brazil, Canada, China, Germany, India, Kenya, the United Kingdom and the USA.
Finally, in Chapter Five, we examine the role of three key stakeholder groups in speeding up the ICT revolution and the roll-out of the solutions we have profiled: policymakers, businesses and consumers. In each case we make specific recommendations for action.
Copyright © GeSI 2015. All rights reserved. – #SMARTer2030 – ICT Solutions for 21st Century Challenges – 17
The report is illustrated throughout with relevant case studies of ICT solutions in action and there is a list of all the case studies, figures and graphs we present, as well as a breakdown of the methodology used, in the appendix.
2.2 Environment – Decreasing emissions and resource consumption whilst allowing for
growth
Global abatement potential
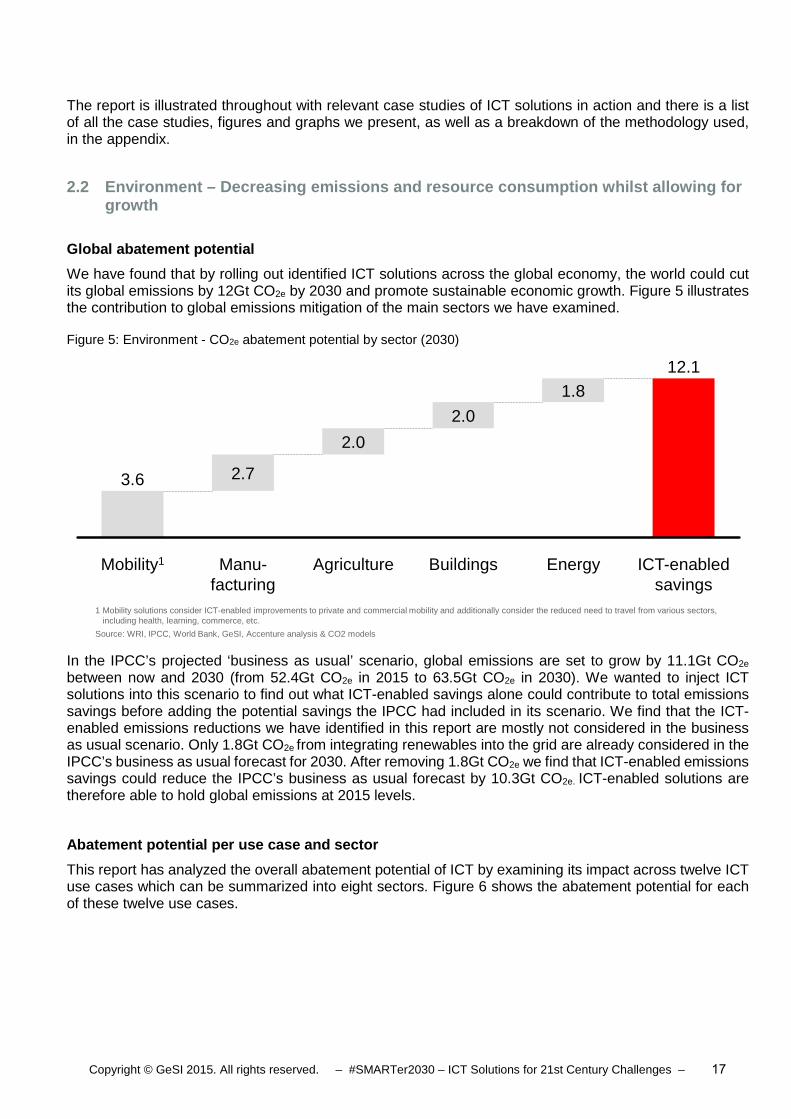
We have found that by rolling out identified ICT solutions across the global economy, the world could cut its global emissions by 12Gt CO2e by 2030 and promote sustainable economic growth. Figure 5 illustrates the contribution to global emissions mitigation of the main sectors we have examined.
Figure 5: Environment - CO2e abatement potential by sector (2030)
In the IPCC’s projected ‘business as usual’ scenario, global emissions are set to grow by 11.1Gt CO2e between now and 2030 (from 52.4Gt CO2e in 2015 to 63.5Gt CO2e in 2030). We wanted to inject ICT solutions into this scenario to find out what ICT-enabled savings alone could contribute to total emissions savings before adding the potential savings the IPCC had included in its scenario. We find that the ICT-enabled emissions reductions we have identified in this report are mostly not considered in the business as usual scenario. Only 1.8Gt CO2e from integrating renewables into the grid are already considered in the IPCC’s business as usual forecast for 2030. After removing 1.8Gt CO2e we find that ICT-enabled emissions savings could reduce the IPCC’s business as usual forecast by 10.3Gt CO2e. ICT-enabled solutions are therefore able to hold global emissions at 2015 levels.
Abatement potential per use case and sector
This report has analyzed the overall abatement potential of ICT by examining its impact across twelve ICT use cases which can be summarized into eight sectors. Figure 6 shows the abatement potential for each of these twelve use cases.
1 Mobility solutions consider ICT-enabled improvements to private and commercial mobility and additionally consider the reduced need to travel from various sectors, including health, learning, commerce, etc.
Source: WRI, IPCC, World Bank, GeSI, Accenture analysis & CO2 models
Buildings ICT-enabled savings
2.0
Manu-facturing
EnergyAgriculture
2.0
3.6
1.8
2.7
12.1
Mobility1

Copyright © GeSI 2015. All rights reserved. – #SMARTer2030 – ICT Solutions for 21st Century Challenges – 18
Figure 6: Environment - CO2e abatement potential by use case (2030)
As shown, our analysis finds that ICT is likely to have the biggest impact through Smart Manufacturing, Smart Agriculture, Smart Buildings and Smart Energy technology. By combining Smart Logistics, traffic control & optimization and connected private transportation, mobility becomes the largest area of potential impact. As the major impact from e-services is also mobility-related we have added this to mobility as well. The sector by sector chapters later in this report provide further details.
ICT solutions can help cut 9.7 times more CO 2e than they emit
Our analysis shows that ICT realizes a benefit 9.7 times higher than its own CO2e emissions and decreases its own footprint over time to 1.97% by 2030 compared to 2.3% of global emissions expected in our last report for 2020.
SMART2020, published in 2008, estimated the ICT sector footprint to reach 1.43Gt CO2e by 2020, equal to 2.7% of expected global emissions. Only five years later, SMARTer2020, revisited this estimate and decreased the forecast to 1.27Gt CO2e by 2020, equal to 2.3% of global emissions. These revised esti-mates were based on actual energy efficiencies realized between 2008 and 2012 and based on updated data for 2020. In our latest report, SMARTer2030, we estimate that the sectors’ emissions could be even lower, reaching 1.25Gt CO2e in 2030 or 1.97% of global emissions. Our estimate considers actual trends towards greater energy efficiency but also the existing commitments of leading operators to increase en-ergy efficiency. Other studies consider various scenarios, including scenarios with significantly higher en-ergy demand from ICT8.
A rapid increase in the adoption of devices like tablets and smartphones, as well as services like cloud computing, broadband networks and data centers, will result in additional emissions from ICT. Holding down the ICT-sector’s own emissions as the number of devices increases is important and can be helped by, for example, switching from large hardware like PCs and printers to smaller and more efficient devices like tablets and smartphones and by bearing down on emissions from data centers. The switch to smaller
8Andrae ASG, Edler T. On Global Electricity Usage of Communication Technology: Trends to 2030. Challenges. 2015; 6(1):117-157. URL: http://www.mdpi.com/2078-1547/6/1/117

Copyright © GeSI 2015. All rights reserved. – #SMARTer2030 – ICT Solutions for 21st Century Challenges – 19
and more energy efficient end-user devices is particularly important, as nearly half the sector’s emissions, in the scope of this analysis, comes from “end-user-devices”, rather than from networks or data centers (see figure below).
Figure 7: Environment - ICT emissions footprint (2030)
Comparing ICT’s own footprint of 1.25Gt CO2e in 2030 with the 12Gt CO2e of emissions avoided through the use of ICT solutions demonstrates that ICT delivers a benefit 9.7 times higher. In other words, for each ton of CO2e used to power ICT, users can on average realize almost 10 tons of CO2e savings in 2030. In our previous report, SMARTer2020, we found that ICT could cut CO2e by 9.1Gt in 2020 and create an enablement factor of 7.2. Our first report, SMART2020, published in 2008, had estimated the enablement factor of ICT at 5.5 times ICT’s own footprint (see Figure 8).
Our preliminary analysis of ICT’s enablement factor in 2015 leads us to conclude that the ICT sector cur-rently abates roughly 1.5 times that of its own emissions.
*Accenture has included, where feasible, scope 1 (direct), scope 2 (indirect from consumption of energy), and scope 3 emissions (all others related). Baseline fixed at 63.5 GtCO2eq
ICT emissions*
A. End-user devices
B. Data Centers C. Networks
(Smart) Phones
Tablets
PCs
3D printers
Others
0.59GtCO2e
0.36GtCO2e
Servers
Data
Computing units
(47,2% of total) (28,8% of total)
0.30GtCO2e
(24.0% of total)
Wireless
Home
Enterprise
Data Transport
1.25GtCO2e(1.97% of total baseline)*
Copyright © GeSI 2015. All rights reserved. – #SMARTer2030 – ICT Solutions for 21st Century Challenges – 20
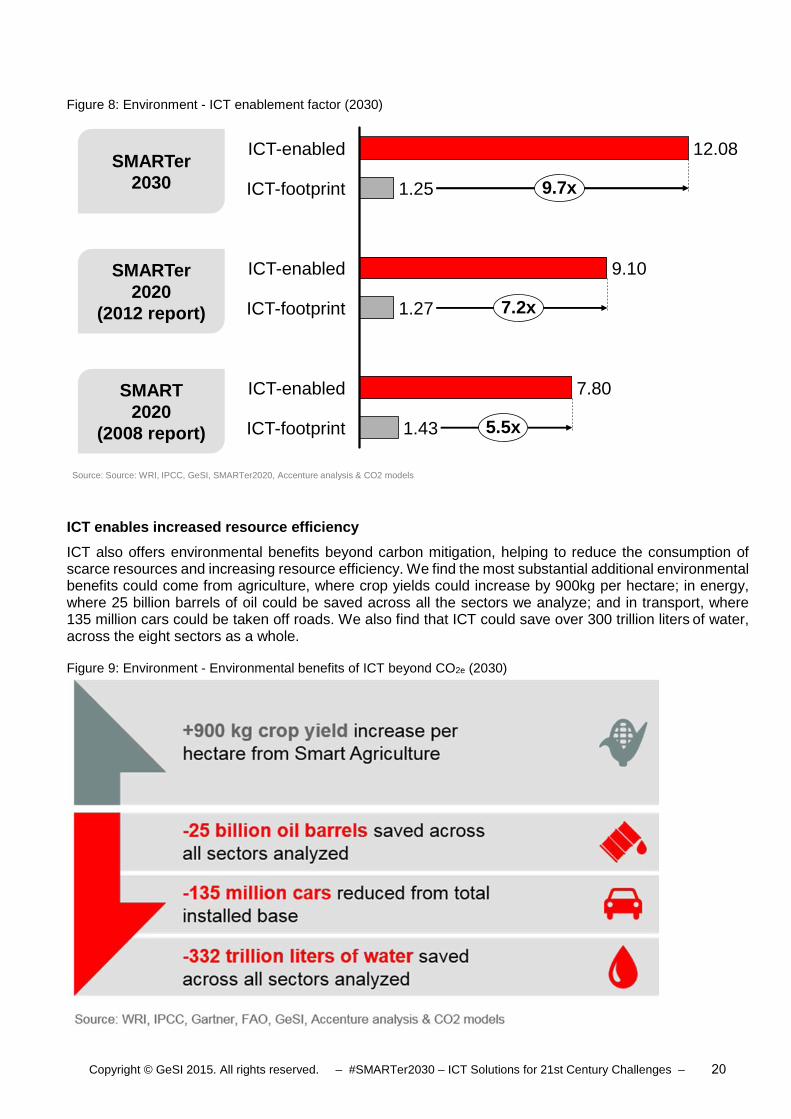
Figure 8: Environment - ICT enablement factor (2030)
ICT enables increased resource efficiency
ICT also offers environmental benefits beyond carbon mitigation, helping to reduce the consumption of scarce resources and increasing resource efficiency. We find the most substantial additional environmental benefits could come from agriculture, where crop yields could increase by 900kg per hectare; in energy, where 25 billion barrels of oil could be saved across all the sectors we analyze; and in transport, where 135 million cars could be taken off roads. We also find that ICT could save over 300 trillion liters of water, across the eight sectors as a whole.
Figure 9: Environment - Environmental benefits of ICT beyond CO2e (2030)
ICT-enabled
ICT-footprint 1.43
1.25
1.27 7.2x
9.7x
ICT-footprint
ICT-enabled 9.10
ICT-footprint
ICT-enabled 12.08
7.80
5.5x
SMARTer2030
Source: Source: WRI, IPCC, GeSI, SMARTer2020, Accenture analysis & CO2 models
SMARTer2020
(2012 report)
SMART2020
(2008 report)

Copyright © GeSI 2015. All rights reserved. – #SMARTer2030 – ICT Solutions for 21st Century Challenges – 21
Solutions to electronic waste
One of the by-products of increased ICT adoption, of course, is electronic waste, so the industry, along with municipal and national governments, needs to develop solutions to encourage the reuse, resale, sal-vage, recycling or, at the very least, safe disposal of used electronics. In developing countries especially, the illegal processing of e-waste can cause serious health and environmental problems. But in developed countries too, it can present significant risks to workers and communities. Great care must be taken to avoid unsafe exposure in recycling operations and the leaking of materials such as heavy metals from landfills.
Not only does e-waste form a health risk to people and the environment, it is also a significant waste of increasingly valuable resources. Finding more “circular solutions” like reusing, refurbishing, or recycling e-waste is critical to ensuring the reliable and affordable sourcing of materials and to reducing supply chain volatility. Encouragingly, what some call circular business models are flourishing, enabled in many cases by ICT. We profile some of these below.
Case examples of ICT solutions with environmental benefits
Connected Car – Solutions for Sustainability Improving the efficiency of traffic, mobility and private transportation is one of the main ways in which major issues such as CO2 emissions and air pollution can be reduced. Deutsche Telekom developed a Con-nected Car Solutions Suite for Original Equipment Manufacturers (OEMs) that can enable people to drive their cars more efficiently and sustainably. Your ‘Connected Car’ can combine a range of smart driving solutions including: Eco-drive, a coaching system for optimizing driver behavior; Car2x, a real-time guiding system to anticipate the traffic environment; E-Call, an automatic emergency contact system; and Live Traffic, a real-time information system on traffic jams and alternative routes.
These Connected Car solutions provide significant sustainability benefits, not only environmental, but also social and economic. For drivers it can reduce annual CO2 emissions by 15.9% per car, save €237 per year from reduced fuel consumption and 23 hours per year through reduced time in traffic. For the auto-motive industry, Connected Car solutions helps OEMs contribute to CO2 emissions reduction targets and helps improve reputation as well as market position and sales. In terms of societal benefits, 16% of all domestic traffic-related CO2 emissions could be avoided, equal to 2% of all domestic CO2 emissions. Fur-thermore, reduced congestion and traffic jams through ICT-enabled safer and smarter driving would reduce asthma-related sickness days and as well as road accidents.
HydroPoint – Shutting down water waste through the Internet of Things
HydroPoint is a leading 360° smart water management solution targeting the area of greatest waste in urban water use: landscape irrigation. Garden or landscape irrigation in homes and commercial buildings is most often still irrigated manually or by controlled timers, without much regard for how much water is actually needed at that point in time. HydroPoint developed WeatherTRAK, a system that uses a machine-to-machine solution connecting the irrigation controller and sensors to a cloud-based platform for analyzing climate and determining water needs. Each site is individually monitored and controlled to determine the exact amount of water needed at that patch of the garden or landscape at that point in time.
By providing the wireless network, customized network access and a self-service management platform, AT&T supported HydroPoint in reducing water waste and saving money for all HydroPoint subscribers. As a result of using this ICT-enabled water management solution HydroPoint customers were able to save more than 15 billion gallons of water, hundreds of thousands of man hours, 62 million kWh of energy and achieve $137 million in cost savings in 2014 alone.

Copyright © GeSI 2015. All rights reserved. – #SMARTer2030 – ICT Solutions for 21st Century Challenges – 22
2.3 Economic – ICT is good for business, creating new revenue opportunities and re-ducing costs
By 2030, 75% of the global population will be connected via smart devices and broadband internet, provid-ing growth opportunities not only in the ICT sector itself, but in a wide range of other sectors too.9 By connecting 2.5 billion extra people, ICT is good for business, creating new revenue opportunities and gen-erating significant cross-sector cost savings.
The digital revolution is changing the way people think about living, working, shopping, traveling and eating. Innovative new business models are disrupting existing businesses, delivering exponential growth with asset-light business structures. Significant growth opportunities are created by companies like Airbnb and Uber, using only technology to build their businesses without owning any of the physical assets found in traditional models. As digital density increases through rapid smartphone penetration, new business mod-els unimaginable a decade ago have the potential to transform our lives and to drive strong growth oppor-tunities across the different sectors. ICT’s capacity to disrupt the status quo and to transform business as we know it remains unprecedented.
Figure 10: Economic – Global economic benefits of ICT-enabled solutions (2030)
Eight sectors will benefit most from ICT
Overall, ICT could generate $11.4 trillion in sustainable economic benefits annually, comprising $6.5 trillion in revenues and $4.9 trillion in cost saving opportunities.
We estimate that $2 trillion of these new revenues are generated by the ICT sector itself and $4.5 trillion are enabled by ICT across the eight sectors analyzed. We expect that the estimated $2 trillion in ICT sec-tor revenues will be made up of $0.4 trillion from connecting 2.5 billion additional people to the knowledge economy and $1.6 trillion from ICT services delivered to the eight sectors analyzed, including e-com-merce, E-Work solutions, etc. The other $4.5 trillion will come from ICT-enabled services such as Smart Agriculture solutions, additional e-commerce revenues, Smart Energy solutions, etc.
9 European Internet Foundation: The Digital World in 2030, p10
1US. Dollars in ICT revenues from connecting the unconnected
2US. Dollars revenues realized by the ICT sector across the twelve use cases analyzed
3
US. Dollars in additional revenues for use case specific stakeholders (global figure from the 12 use cases)
US. Dollars in cost savings* for use case specific stakeholders (global figure from the 12 use cases)
US. Dollars in sustainable economic benefits realized by other sectors leveraging ICT (leading to total of $11.4 trillion USD in economic benefits when adding the $2 trillion USD realized by the ICT sector)
0.4 Tr
1.6 Tr
4.5 Tr
4.9 Tr
9.4 Tr
* Global result includes costs savings coming from translating to US $ the fuel, energy, water and paper savings in the applicable Use Cases

Copyright © GeSI 2015. All rights reserved. – #SMARTer2030 – ICT Solutions for 21st Century Challenges – 23
Figure 11: Economic – ICT-enabled revenue opportunities across sectors (2030)
Creating cost savings
ICT will also help save close to $5 trillion of costs across the global economy, made up of $1.2 trillion from reduced electricity expenditure, $1.1 trillion from reduced fuel expenditure, and another $2.6 trillion from other savings including on tuition, water, paper, and food waste.
Figure 12: Economic –ICT-enabled cost saving opportunities (2030)
Return on investment
ICT-enabled solutions also provide profitable investment opportunities, as investing in ICT can generate significant value for money. For our report, we have analyzed investment opportunities across four sectors in more detail to better understand the dual return: financial return and sustainability benefits achieved.
Based on actual Accenture projects delivered to improve performance by installing smart solutions across buildings, manufacturing, agriculture and logistics we have summarized typical investment and sustaina-bility results in the figure below.
0.40.2 0.2
E-Work
0.5
Energy
0.80.8 0.0
E-Commerce
1.8
1.20.6
Agriculture
1.9
1.80.1
Total2030
6.5
New connections
0.42.0
4.5
0.70.5 0.2
Building Other sectors
StakeholdersICT sector
Source: WRI, IPCC, Gartner, FAO, GeSI, Accenture analysis & CO2 models
1.1
Fuel
4.9
2.6
Electricity
1.2
Total savings2030
Other (e.g., tuition, water)

Copyright © GeSI 2015. All rights reserved. – #SMARTer2030 – ICT Solutions for 21st Century Challenges – 24
Figure 13: Economic - Return on investment: Case examples
For example, building one vehicle assembly plant with smart manufacturing solutions can produce a net present value (NPV) of $1-1.1 million by 2030 with an initial investment of $254k. Breakeven levels can be obtained within one to two years and the average annual electricity saving generated from this investment is projected to be between $180k and $190k. The resulting CO2e abatement in tons per dollar invested is 1 ton per $420 invested.
Case examples of ICT solutions with economic benefits
Networkfleet – Improving accountability and controlling costs
Public transportation departments face a number of challenges overseeing the management of massive fleets with limited funds while answering to both elected officials and state taxpayers.
By employing Verizon’s GPS-driven Networkfleet solution across 2,500 Arkansas State Highway and Transportation Department (AHTD) vehicles, AHTD was able to improve accountability and achieve cost savings. By reducing unnecessary idle time and miles driven, AHTD saved nearly $500,000 in bulk fuel expenses in the first year. In addition, reduced maintenance costs and other operational efficiencies added to the total savings. Moreover, better tracking abilities enable the department to operate more proactively, allowing dispatchers to direct dump trucks, snowplows, and other vehicles to emergency situations faster.
Automationsystems forSmart Buildings
Monitoring and forecastingsystems for Smart Agriculture
Monitoring and smart production system for Smart Manufacturing
Monitoring and routeoptimizing systems for Smart Logistic companies
Net Present Value of implementation costs + obtained savings in energy consumption
USD525k –USD575k
USD1.20Mn –USD1.40Mn
USD1.0Mn –USD1.1Mn
USD800k –USD850k
Initial investment and installation costs estimation
USD250k USD465k USD254k USD290k
Break even obtained from the model (project starting to give benefits)
2 - 3 years 3 - 4 years 1 - 2 years 2 - 3 years
Maximum yearly enabled revenues / savings
USD160k -USD170k
USD230k –USD255k
USD180k -USD190k
USD155k –USD165k
CO2e abatement per USD invested
1 ton per 750 USD invested
1 ton per 420 USD invested
1 ton per 250 USD invested
1 ton per 360 USD invested
Source: Accenture case analysis (sanitized project results)

Copyright © GeSI 2015. All rights reserved. – #SMARTer2030 – ICT Solutions for 21st Century Challenges – 25
Surrey Police – Enhancing safety and efficiency while saving money Surrey Police has delivered substantial savings in the running of their ICT services. However, due to di-minishing returns Surrey Police was challenged to deliver more efficiency savings whilst the demands for new technology continued to drive end-user demand ever higher. The ICT challenge was to deliver current hosting services more cheaply without compromising on security.
A “platform as a service” developed by BT allowed Surrey Police to create a new, secure and virtual plat-form in BT’s secure cloud. This highly secure cloud-based solution encompassing 24x7 proactive service monitoring and round the clock protective monitoring allowed the police force to enhance their operational efficiency while generating cost savings.
2.4 Social – Boosting incomes, cutting costs and improving lives
Connecting the Unconnected – how ICT can benefit society
Although extreme poverty (people living on less than $1.25 a day) has decreased from 52% in 1981 to 17% today, we need to go further as we progress towards a projected global population of 8.3 billion people in 2030.
The good news is that ICT can provide a rapidly growing population with access to essential services like healthcare, education and banking in a way that is affordable to even the lowest income groups. As ex-treme poverty decreases, and smart devices become cheaper, ICT becomes increasingly affordable to people in both the developed and developing world. Our research estimates that, by 2030, ICT could con-nect 2.5 billion currently unconnected people via smart devices, providing access to services with huge potential to improve their lives. ICT access in the developing world is growing fast, with around 80% of the 2.5 billion additional connections by 2030 projected to come from emerging and developing countries. By 2030, ICT could provide access to E-Health services for 1.6 billion people, engage almost 450 million E-Learning participants and save 254 billion hours across different industries (see Figure below).
Figure 14: Social – Social benefits of ICT-enabled solutions (2030)
For consumers, ICT can enable three basic types of benefits: First, provide access to improved services for increased convenience, participation, etc. Second, provide access to e-services that allow consumers to reduce their expenditure and third, provide access to e-services that allow consumers to increase their income. The figure below highlights the biggest benefit for each sector analyzed. For example, the most significant benefit E-Health can deliver is increased convenience whereas the biggest benefit of E-Learning is the opportunity to increase earnings potential and open up new job opportunities for a person with an e-degree.

Copyright © GeSI 2015. All rights reserved. – #SMARTer2030 – ICT Solutions for 21st Century Challenges – 26
Figure 15: Social – Social benefits across sectors
ICT can help to raise income opportunities
ICT solutions can drive income opportunities for people across the world, in particular, we find, through E-Learning and Smart Agriculture.
Increased access to innovative and affordable E-Learning opportunities, accessible remotely, can increase education and literacy levels and generate an additional income of $0.6 trillion, according to our research. Incomes could rise by 11% on average for those who participate in E-Learning degrees, which could be obtainable, by 2030, in even the most remote places in the world.
At the same time, Smart Agriculture can boost the incomes of farmers by increasing land or crop yield and reducing resource inputs. As real-time data analysis of soil and livestock, fertilizer, nutrition and wholesale market prices rolls out across the developing as well as the developed world, farmers will be able to pro-duce more and waste less. By generating an average yield increase of 897kg per hectare of land, ICT can help farmers increase their average annual income by $300.
ICT also has great potential to reduce food waste across the supply chain by making food chains more transparent and providing real-time information on individual products. Less food waste in distribution, transportation and the consumption phase means more food to market, potentially better nutritional out-comes and reduced emissions due to avoided waste.
Additionally – and critically for human development – ICT can improve financial inclusion and drive entre-preneurship through making banking more accessible.10
ICT can help to cut costs
ICT can help to make essential services more affordable. In particular, health and education are two areas where ICT can cut costs and thereby make access more affordable. For example, a study on the wider socio-economic impact of mobile health found significant cost saving opportunities, including the potential
Copyright © GeSI 2015. All rights reserved. – #SMARTer2030 – ICT Solutions for 21st Century Challenges – 27
of mobile health to reduce overall elderly care expenditure by 25% and to cut 50 to 60% of the costs related to hospital nights and re-hospitalizations for patients with chronic conditions.11
For E-Learning, our modeling shows that typical tuition could be reduced by $1100 per year across a sample of E-Learning offerings, compared to traditional campus-based courses.
ICT can increase convenience and wellbeing
The developments that ICT offers in the transport and mobility sector can bring significant benefits in terms of convenience and well-being. Through optimizing traffic flows, influencing driver behavior, encouraging car or ride sharing and smart logistics solutions, ICT helps people and products move from A to B in the most efficient, clean and safe way. Through E-Work alone, telecommuters can save 100 hours annually. And across all sectors analyzed for this report ICT can help save 250 billion hours allowing people to have additional time at their disposal.
Beyond efficiency gains, ICT can deliver improved wellbeing and participation. For example, our research finds that, by 2030, an additional 1.6 billion people across the globe could benefit from E-Health solutions.
The social benefits of ICT across different development phases
ICT solutions can have a variety of impacts depending on the wealth of the country. In developing coun-tries, poverty and a lack of access to energy, education and healthcare are important issues that ICT can help address.
With megacities on the rise, especially in China and India, urban conditions, infrastructure limitations, and insufficient and expensive housing all form growing challenges. ICT can contribute to addressing them by optimizing traffic flows and urban mobility, providing the efficient transport of goods, reducing air pollution in urban areas and lowering both the footprint and the operational costs of real estate. A further challenge in emerging countries is ensuring sufficient access to food and fresh water. ICT-enabled Smart Agriculture, smart buildings, smart manufacturing and energy solutions can all help increase productivity while reducing inputs.
In developed countries, on the other hand, social participation is generally quite high, with most people already having access to basic services. In these countries, quality, time-efficiency, comfort and conven-ience are the key aspects to improving quality of life. ICT can contribute to this across a range of sectors.
Case examples of ICT solutions with social benefits
Connecting communities around the world BT is using ICT and expertise to connect communities around the world to the internet. Worldwide, around 4 billion people are currently unconnected to the internet, of whom more than 90% live in the de-veloping world. Being connected to the internet allows people to increase their social participation and enhance their livelihoods through access to key services such as education, healthcare or social con-tacts and communities. Using the BT infrastructure, skills and expertise, BT aims to connect people worldwide and provide them with access to the societal benefits of ICT. For example, through its Connecting Africa program, BT has connected 20 locations in nine African countries to the internet via satellites. The Connecting Africa Med-ical Centre program is using ICT to help seven SOS Children’s Villages’ medical centers improve healthcare provision to around 100,000 people. The plans are to connect six remaining centers by the end of 2015. By connecting the unconnected and leveraging their skills and knowledge of how to get the most out of technology, BT is able to help provide essential services that could save lives.
10 The Socio-Economic Impact of Mobile Financial Services, Telenor Group, 2011
11 The Socio-Economic Impact of Mobile Health, Telenor, 2012

Copyright © GeSI 2015. All rights reserved. – #SMARTer2030 – ICT Solutions for 21st Century Challenges – 28
Emergency.lu - Revolutionizing disaster -response communications throu gh Aid When natural disasters occur, poor communications infrastructure is one of the biggest challenges facing emergency relief agencies. Aid organizations can dispatch field teams within hours, but without reliable mobile and Internet services, aid workers struggle to share situation reports and ensure that food, medi-cines, surgical teams, and search teams get where they are needed most. If local networks are down, precious hours are lost, and search missions are negatively affected.
The Government of Luxembourg created a satellite-based telecommunication platform that can be set up in any disaster zone within 24 hours. The hub provides high-quality internet connectivity, voice over IP, tracking and tracing applications, mapping services, and low-bandwidth versions of two Microsoft tools—Skype and Lync—which aid workers can download onsite. The service has transformed disaster-response communications, helping aid agencies from around the world begin rescue and relief operations.

Copyright © GeSI 2015. All rights reserved. – #SMARTer2030 – ICT Solutions for 21st Century Challenges – 29
3 Connected world: Eight sectors will profit most
In this chapter, we introduce the eight sectors we have profiled and the specific ICT-enabled use-cases within them. We show how each use-case can bring environmental, social and economic benefits and we explain how. As noted in the introduction, the ICT use-cases we have analyzed in our modeling can be summarized into the following eight sectors: health, learning, buildings, food, mobility, energy, e-business and manufacturing. In what follows, we look at each sector individually.
3.1 Health – The doctor in your pocket
Emergence of E-Health – The Context
In the past decade, emerging and developed economies alike have undergone rapid demographic change, with the rise of a new middle class in developing countries perhaps the most striking development. While a rising global middle class has formed the fastest growing income segment, the fastest growing age cohort has been – in many countries – citizens above the age of 65.12 These changes are accompanied by a range of healthcare challenges, including “lifestyle diseases” like obesity and diabetes to conditions asso-ciated with old-age, like dementia and arthritis.
Given these trends, access to quality healthcare is becoming increasingly important for developing and developed countries. While developing economies require reliable and affordable healthcare services, de-veloped markets need ways of controlling rising healthcare costs, for example by increasing efficiency across health and social care services.
Alongside changes in demographics and disposable incomes, we can also see behavioral shifts taking root, from a growing awareness of the need to maintain healthy lifestyles to a steadily rising willingness (among both individuals and governments) to invest in preventative care. But this doesn’t make the twin challenges facing the global healthcare sector any less formidable.
We believe addressing these challenges will require a paradigm shift in the healthcare sector. An effective healthcare regime must:
• Strengthen preventative healthcare
• Enhance early diagnostics capabilities for prevalent diseases
• Aim to increase life expectancy and enhance quality of life
• Reduce costs at all stages by using limited resources more efficiently
• Empower people with the knowledge and tools to understand and manage their own health
Despite rising health awareness, most emerging econo mies have been struggling with a lack of access to quality healthcare.
The good news is that progress towards these objectives can be achieved by injecting cutting edge ICT into conventional healthcare practices, through E-Health.
12 http://www.pewglobal.org/2014/01/30/global-population/

Copyright © GeSI 2015. All rights reserved. – #SMARTer2030 – ICT Solutions for 21st Century Challenges – 30
What is E-Health?
E-Health seeks to facilitate a seamless flow of information across different stakeholders (such as healthcare professionals, patients etc.) through the efficient use of technology.
Importantly, it seeks to do this in a commercially viable and scalable way. Cutting edge E-Health solutions share the following characteristics:
• Efficient monitoring and distribution of information for professionals and consumers, especially through the use of smart devices (e.g. wearable health-monitoring watches or mobile phones) con-nected to the internet
• Improved public health services through improved access to continuing education, training and a wealth of relevant data and in-the-field support for health workers
• Informed and empowered patients , enabled to manage their own health through on-demand ac-cess to health analysis and information about trends and treatments relevant to their specific condi-tions
E-Health is about transforming conventional healthca re systems with the help of ICT to make them more reliable, accessible and inclusive while making processes more efficient.
More generally, E-Health solutions provide a platform for information dissemination, interaction and collab-oration among institutions, professionals, health providers and patients.
Future of E-Health
The E-Health industry is expected to grow rapidly through a significant infusion of disruptive technologies, bringing about a fundamental shift in the delivery model for healthcare by 2030. These technologies are poised to transform the role of patient engagement from being ‘dependent’ on a professional’s knowledge and expertise, to being more ‘self-directed’, with the ability to manage one’s own health.
Figure 16: Health- Future of E-Health: Technology vision for 2030

Copyright © GeSI 2015. All rights reserved. – #SMARTer2030 – ICT Solutions for 21st Century Challenges – 31
By 2030, E-Health is expected to transform a patient ’s role from being ‘dependent’ to being ‘self-directed’.
The patient’s perspective – a doctor in your pocket
With the increase in processing power and the advent of wearable technology, smart devices will play an essential role in the healthcare sector. Devices like smart phones or smart-watches, combined with health-oriented applications and biosensors will be able to monitor health conditions (keeping both users/patients as well as doctors informed in real time), make insightful recommendations and even permit the remote diagnosis of diseases. This will allow patients to better understand and manage their own health.
From patients’ perspective, E-Health will consist of three key shifts – (i) anytime, anywhere; (ii) nothing about me without me; (iii) access to care for all.
The resulting increases in the availability of data in the healthcare sector will also help scale solutions faster and make them available in regions where conventional systems cannot be efficiently established. For example, it is difficult to set-up a hospital facility in a remote African village but much easier to set-up a video-conferencing clinic, enabling patients to be consulted remotely.
Furthermore, the costs of DNA and pathogen sequencing are expected to drop significantly by 2030, al-lowing more and more patients to have their DNA or pathogens sequenced. This, combined with access to a large database securely storing the data, will enable doctors to use data analytics to arrive quickly at precise diagnoses and to tailor treatments accordingly.
The combination of these disruptive technologies: wearable tech, big data analytics and DNA and/or path-ogen sequencing is expected to revolutionize the healthcare industry by improving preventive care, access to healthcare, early diagnosis and by enabling fully personalized treatment plans.
The healthcare providers’ perspectives - value-based personalized medicine
In addition to revolutionizing the availability of healthcare services for patients, E-Health will significantly benefit healthcare providers as well (such as doctors, hospitals, pharmacology firms and health insurers). Access to bespoke data will generate the greatest impact for healthcare providers.
Indispensable features of E-Health when viewed from their point of view include:
1. Access to data
• Access to electronic health records, standardized data metrics and indicators
• Access to worldwide databases and big data analytics via Artificial Intelligence (supercomputers, e.g. IBM’s Watson)
• Increased cost and time efficiency through implementation of smart administration for patient and data management
•
From the perspective of healthcare providers/payers, E-Health will bring three key benefits – (i) access to data; (ii) personalized medicine; (iii) value-based reimbursement.
2. Personalized medicine
• Remote patient-doctor interaction, allowing for personalized consultations despite long-distances between the parties
• Access to a patient’s real-time health data, providing immediate insights and personalized, auto-mated and remote diagnostic capabilities
• Advanced technologies like gene therapy and genome engineering, allowing doctors to provide tai-lored treatments

Copyright © GeSI 2015. All rights reserved. – #SMARTer2030 – ICT Solutions for 21st Century Challenges – 32
3. Outcome-oriented reimbursements
• Reimbursements of healthcare providers shifting from fees for health services to a model focused on health-outcomes
• New players entering the health insurance market offering incentives for preventative behavior
• Transformation in the role of patients and physicians resulting in “consumer driven health”
The benefits of E-Health
We have quantified the CO2e abatement potential of E-Health by analyzing the effects of four key technol-ogies:
• Remote Diagnostics – which involves using web-connected devices to capture and communicate health-related data amongst stakeholders.
• Videoconferencing , which makes communication between service seekers and providers seamless.
• Date storage in electronic form which makes information portable and secure.
• Augmented Reality, which provides assistance during surgery and can help improve medical train-ing, among other things.
The resulting emissions abatement effects of ICT are mainly from reduced travel and decreased use of physical healthcare facilities, leading to 0.007Gt CO2e in the UK alone. Data extrapolated from GDP, pop-ulation and healthcare access data suggest that the global figure could be as high as 0.205Gt CO2e.
However, the sustainability benefits of an ICT-enabled healthcare sector are not limited to emissions abate-ment alone, they also include further economic and social benefits, as shown below.
$66 billion of cost savings: Taking 2030 as an example, E-Health has the potential to save over $66 billion by freeing up space, with 271.4 million square meters of urban space released for alternative use.
Improved health services for 1.6 billion people: By 2030, ICT enhanced health services will be available to 1.6 billion people.
E-Health is a clear example of a widespread positive gain powered by ICT. There is potential to reduce emissions and generate much higher rates of access to healthcare.
The diagrams below explain in more detail the types of benefits that E-Health services can help provide across the environment, the economy and society, resulting from reduced travel and reduced space re-quirements.

Copyright © GeSI 2015. All rights reserved. – #SMARTer2030 – ICT Solutions for 21st Century Challenges – 33
Figure 17: Health - Benefits from E-Health
A study commissioned by Telenor on the wider socio-economic impact of mobile health found more far-reaching cost saving opportunities, including the potential of mobile health to reduce overall elderly care expenditure by 25% and to cut 50 to 60% of the costs related to hospital nights and re-hospitalizations for patients with chronic conditions.13
Humber NHS Foundation Trust go es mobile and spend more time with patients A mobile solution for NHS Foundation Trusts, contracted from BT, transforms patient care and the working lives of clinicians, while at the same time saving the Trust money. The mobile solution uses an innovative software from Belfast company, TotalMobile, to give healthcare professionals on the move access to real-time information where and when they need it. The mobile healthcare technology enables staff at the Trust to provide a range of mental health, commu-nity, learning disability, and addiction services. Via the mobile solution, the staff are able to access patient records, view schedules and appointments and update notes while on their rounds, using a mobile device of their choice, such as a tablet or smartphone. The new mobile solution ensures that clinicians have the most up to date information at their fingertips whether in the office, on the go or at the patient’s home. It streamlines the Trust’s existing processes, reducing the need to return to base, saving time, paper and money, and allowing more time to be spent on patient care.
13 The Socio-Economic Impact of Mobile Health, Telenor, 2012

Copyright © GeSI 2015. All rights reserved. – #SMARTer2030 – ICT Solutions for 21st Century Challenges – 34
HipLink consolidate s critical health information in a highly secure manner Hospitals are committed to providing the best clinical care to patients with complicated health conditions. The ability to focus on direct patient care, while reducing alarm fatigue and protecting patients’ personal health information is critical to clinicians. Improving communications between hospital and clinic locations can increase efficiency and support centralized medical functions, which is central to quality patient care. HipLink® presented by AT&T mobilizes a new bedside monitoring system, allowing clinicians to quickly respond to critical alerts they receive on their smartphones. Security for these devices is enhanced through AirWatch from AT&T, a mobile device management solution. An AT&T Virtual Private Network seamlessly connects hospital’s locations, allowing for a cost effective means to offer centralized support for billing and pharmacy services. An AT&T Network-Based Firewall service helps to protect the security of patient infor-mation.
3.2 Learning – Education on your terms
Emergence of E-Learning – The Context
With the size of the global middle class predicted to reach nearly five billion people by 203014, the demand for access to affordable education will continue to increase. Better access to education and learning is essential in lifting people out of poverty, providing income opportunities and improving their quality of life. However, many people in developing countries, especially those living in remote areas, do not yet have access to education and are missing out on the opportunity to improve their lives. In addition, the rising costs of university and college education both in developing and developed countries are barriers to better education.
Education should become increasingly accessible and affordable in order to raise earning poten-tial and quality of life for people globally.
While access to education is a challenge in the developing world, a second trend in the educational sector emerges in both developed and developing countries. Learners are increasingly looking to expand the boundaries of the education system, demanding new learning experiences that are at once affordable, flexible and engaging. The generation born in the age of technology (the “millennials”) especially welcomes online learning platforms as a substitute for, as well as an addition to, traditional teaching methods.
With global education spending expected to reach $107 billion in 201515, E-Learning – the digitalization of learning – is gaining ground as an important way to overcome educational barriers and to open up an array of learning opportunities across the globe. An increasing number of learners can access educational con-tent and join Massive Open Online Courses (MOOCs) from any location in the world, at any time.
Given these trends, the race is on to see how ICT can best be harnessed to improve peoples’ access to education in an economically, socially and environmentally sustainable way.
14 http://www.reuters.com/middle-class-infographic
15 Global Industry Analysts (2015), Global Outlook on the Distance Learning Industry

Copyright © GeSI 2015. All rights reserved. – #SMARTer2030 – ICT Solutions for 21st Century Challenges – 35
What is E-Learning?
E-Learning is learning conducted via smart devices and broadband internet. E-Learning solutions such as open community platforms, instructional games (“gamification”) and virtual reality, have the potential to create personalized learning ecosystems that are affordable, engaging and sustainable.
E-Learning enabled through ICT can be used to augment traditional learning in schools or companies and it can promote lifelong learning for a huge range of people in sectors from healthcare to agriculture. As smartphones and mobile broadband become increasingly ubiquitous, ICT-enabled education is opening up vistas undreamed of even ten years ago, transforming life-chances in the process.
Future of E-Learning
The future of E-Learning will be collaborative across institutions, breaking down the barriers in our current system. Education will become a lifelong journey in which learning is personalized to specific needs and it will be genuinely captivating.
The future of E-Learning for students .
ICT has the potential to transform the definition of knowledge delivery from “static classroom” to “anytime anywhere” through remote access from any connected smart device. Several tools and applications like videoconferencing, Massive Open Online Courses (MOOC) and E-Learning apps can all facilitate remote learning.
In the future, learning will be more fluid and colla borative, it will be fully personalized, location-independent, and available at any time provided in a way that triggers engagement and creativity.
Not only will learning become more mobile and location-independent, we will also see people determining the content and direction of their own education. The self-directed character of online learning offers stu-dents the ability to combine content across institutions and education stages. For example, high school, university and job training no longer need to be separated but could be integrated into one self-directed lifelong learning process which you control from your smart device.
As programming, computing and computer science become increasingly important it is critical that young people learn not only to consume technology by using a phone or a computer, but also to become creators of technology themselves. ICT is itself leading the way here through various new platforms and techniques that enable people to learn how to code and to understand the principles behind the digital revolution.

Copyright © GeSI 2015. All rights reserved. – #SMARTer2030 – ICT Solutions for 21st Century Challenges – 36
Figure 18: Learning – Future of E-Learning: Technology Vision for 2030
The future of E-Learning for providers
Teachers will also benefit hugely from the increased roll out of E-Learning tools and applications. Access to digital materials will enable teachers to create more effective learning methods, deliver remote classes, extend their teaching beyond the classroom, collaborate with other instructors and provide more appealing ways of communicating and delivering information.
There will also be more sophisticated ways of tailoring content to students’ needs. Advanced data on a person’s preferences, progress or activities could help teachers better understand learning gaps, while smart portfolio assessment could collect and manage all data on a student’s learning progress, acquired skills and competencies and enable teachers to assess them more accurately.
Likewise, virtual communication platforms could stimulate cross-disciplinary and inter-institutional research across borders and even languages.
The benefits of E-Learning
Our research shows that by reducing the need to travel to physical locations, E-Learning could mitigate 0.1Gt CO2e per year globally. The US, China and India represent 85% of the total abatement potential of E-Learning, mainly due to their population size and the huge distances students need to travel to get to class. To achieve its potential, however, significant infrastructure enhancements and technology innova-tions are required in providing global access to high-speed broadband (over 50 Mbit/s) and to smart de-vices.
In addition, the sustainability benefits of E-Learning go well beyond emissions abatement. They also in-clude further environmental, economic and social benefits, as shown below.

Copyright © GeSI 2015. All rights reserved. – #SMARTer2030 – ICT Solutions for 21st Century Challenges – 37
91 million tons of paper saved: By 2030, replacing hard copies of study materials with electronic books has the potential to save over 91 million tons of paper.
5 billion liters of fuel saved: Reducing the need to travel to education facilities could save 5 billion liters of fuel.
$1.2 billion of total savings potential: By 2030, E-Learning is expected to lead to $1,181 billion in cost savings due to a decrease in expenditure per student. For example, corporate learning through Massive Open Online Courses (MOOC) could save businesses at least 50% in costs compared to conventional instructor-based training.16 Further savings come from reduced fuel usage for traveling to and from training sites ($5.4 billion in fuel savings) and from the reduction of paper use ($24 billion of savings on paper) .
450 million potential E-Learning participants: Our analysis has found that E-Learning advancement can offer learning opportunities to almost half a billion students undertaking their education on virtual learning platforms.
Figure 19: Learning – The Benefits of E-Learning
Skype in the Classroom – inspiring the next generation of global citizens Microsoft’s Skype in the Classroom is a free global community connecting students, guest speakers and more than 100,000 teachers from 235 different countries in 66 different languages. The program offers a shared learning experience by bringing a world of new ideas into the classroom, helping students discover new cultures, languages and concepts, all remotely. Through this program teachers are able to inspire the next generation of global citizens with innovative learning experiences through online collaboration, games, guest speakers and a fantastic game called Mystery Skype.
With Skype in the Classroom, teachers can offer blended learning by adding interactive and digital com-ponents to their classroom teaching. They can provide computer science education and bring it to life by talking to tech professionals via Skype, or inspire literacy and design by scheduling authors, illustrators, publishers or entrepreneurs to talk to their class over Skype. Student learning no longer has to be limited 16 Towards Maturity (2014), In-Focus: Lessons from MOOCs for Corporate Learning
Copyright © GeSI 2015. All rights reserved. – #SMARTer2030 – ICT Solutions for 21st Century Challenges – 38
by physical, economic or cultural boundaries. By providing access to a wealth of global content and re-sources, Skype in the Classroom is a strong example of how ICT-enabled solutions can help enhance quality of life by providing creative learning opportunities and experiences at low costs.
3.3 Building – Smarter homes, smarter offices
Smart Buildings– The Context
As urban populations grow rapidly, the demand for additional housing and commercial real estate is on the rise. However, the construction and operation of buildings remains highly resource and energy intensive, with buildings accounting for around 40% of global energy consumption17.
The effects of increased urbanization need to be managed carefully from an environmental as well as a social and economic perspective, so that ICT-enabled smart building solutions can quickly gain ground as enablers of buildings that are energy and resource efficient.
Alongside constructing new ICT-enabled Smart Buildings to meet the demand of the growing urban popu-lation, another key challenge will be to optimize the efficiency of existing buildings. Many economies in both the developing and developed world still have a very long way to go to retrofit ageing housing stock and commercial property to improve energy efficiency.
What are Smart Buildings?
Smart Buildings can be described as a confluence between architecture, urban planning and ICT. The principle components of Smart Buildings are automation systems, sensors, integration into Smart Grids via smart meters, energy use analytics, forecasting and the better detection of faults through the use of moni-toring technologies. For instance, data collected via smart meters and other smart home solutions can be communicated to users via their smart device, allowing users to monitor their energy use, control building functions such as lighting, cooling or heating, and detect faults or abnormalities early – all remotely. These solutions could be applied to large commercial and industrial complexes or smaller homes and condomin-iums, helping to drive the more efficient use of resources and energy.
17 Accenture Study on Smart Building Solutions http://www.accenture.com/SiteCollectionDocuments/PDF/Accenture-Smart-Build-ing-Solutions-Brochure.pdf.

Copyright © GeSI 2015. All rights reserved. – #SMARTer2030 – ICT Solutions for 21st Century Challenges – 39
The Future of Smart Buildings
By 2030, we expect Smart Building solutions to provide domestic and commercial users with better “insight and control” and an enhanced living and working experience whilst saving resources, energy, time and money. We look at each of these benefits below.
Insight and Control
ICT-enabled solutions combined with user-friendly consumer interfaces like apps and dashboards will be able to enhance peoples’ awareness of their energy and resource consumption. These apps can be ac-cessed remotely via smart devices and allow people to respond to changes or problems even if they are miles away. Besides using data analytics for predictive maintenance, real-time monitoring technology can also send notifications to the user’s smart device when an appliance or light is left on or when something is broken or needs replacing.
The available data can also be used by urban planners, utilities companies and architects to understand changing demand patterns and respond better, reducing costs to the consumer.
At the same time, Smart Building solutions open up significant cost cutting opportunities for companies. For example, Microsoft evaluated smart building applications from three vendors across 13 buildings within the company’s main 118-building campus. The technology firm’s experience so far demonstrates that a smart building solution can be established with an upfront investment of under 10% of annual energy ex-penditure, with an expected payback period of fewer than two years. By collecting and analyzing millions of data points every day, the company has been able to embark on multiple improvements that are reshap-ing the way its buildings are managed and is reducing its energy consumption by 15-30%.18
Resource Efficiency
Smart building solutions will enable energy and resource savings both in existing buildings as well as newly constructed buildings. Automated building heating, cooling, ventilation and lighting control systems are already gaining ground, based on motion and light sensors, turning lighting off when there is enough day-light, or turning heating off when no one is around. It is also becoming possible for people to integrate their personal calendars into the system to enable it to adjust to their specific schedules automatically. In addi-tion, smart technologies will also offer users full integration with the local smart grid, which permits on-site generation of renewable energy and the selling of energy back into the grid.
18 Accenture (2011), Energy-Smart Buildings

Copyright © GeSI 2015. All rights reserved. – #SMARTer2030 – ICT Solutions for 21st Century Challenges – 40
Figure 20: Buildings - Future of Smart Buildings: Technology Vision for 2030
The benefits of Smart Buildings
We have quantified the global emissions abatement potential from Smart Buildings and, according to our analysis, the global emissions abatement potential from Smart Buildings comes in at approximately 2.0Gt, or 17% of the total potential of the eight sectors we have examined. The US and China are the countries with the highest abatement potential from Smart Building Solutions followed by Germany and the UK.
Besides the emissions abatement potential, there are other benefits from Smart Building solutions, including:
• 5 billion MWh of energy saved
• 300 billion liters of water saved
• $360 billion of cost savings
Improved quality of life: Smart Buildings could vastly improve people’s quality of life by tailoring their homes to their needs, saving them money and freeing up time spent on repairs.
The diagram below depicts the types of benefits that Smart Building Solutions can help accrue across environment, economy and society.
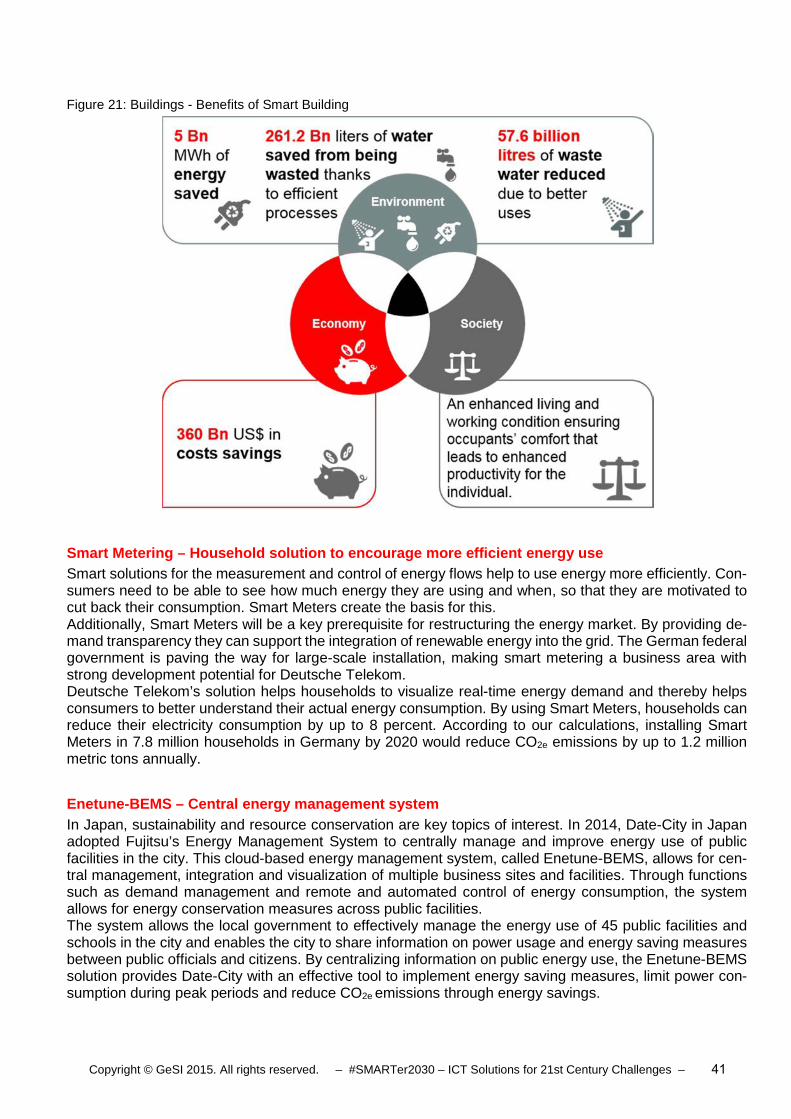
Copyright © GeSI 2015. All rights reserved. – #SMARTer2030 – ICT Solutions for 21st Century Challenges – 41
Figure 21: Buildings - Benefits of Smart Building
Smart Metering – Household solution to encourage more efficient energy use Smart solutions for the measurement and control of energy flows help to use energy more efficiently. Con-sumers need to be able to see how much energy they are using and when, so that they are motivated to cut back their consumption. Smart Meters create the basis for this. Additionally, Smart Meters will be a key prerequisite for restructuring the energy market. By providing de-mand transparency they can support the integration of renewable energy into the grid. The German federal government is paving the way for large-scale installation, making smart metering a business area with strong development potential for Deutsche Telekom. Deutsche Telekom’s solution helps households to visualize real-time energy demand and thereby helps consumers to better understand their actual energy consumption. By using Smart Meters, households can reduce their electricity consumption by up to 8 percent. According to our calculations, installing Smart Meters in 7.8 million households in Germany by 2020 would reduce CO2e emissions by up to 1.2 million metric tons annually.
Enetune -BEMS – Central energy management system In Japan, sustainability and resource conservation are key topics of interest. In 2014, Date-City in Japan adopted Fujitsu’s Energy Management System to centrally manage and improve energy use of public facilities in the city. This cloud-based energy management system, called Enetune-BEMS, allows for cen-tral management, integration and visualization of multiple business sites and facilities. Through functions such as demand management and remote and automated control of energy consumption, the system allows for energy conservation measures across public facilities. The system allows the local government to effectively manage the energy use of 45 public facilities and schools in the city and enables the city to share information on power usage and energy saving measures between public officials and citizens. By centralizing information on public energy use, the Enetune-BEMS solution provides Date-City with an effective tool to implement energy saving measures, limit power con-sumption during peak periods and reduce CO2e emissions through energy savings.
Copyright © GeSI 2015. All rights reserved. – #SMARTer2030 – ICT Solutions for 21st Century Challenges – 42
3.4 Food – Produce more and waste less
Emergence of Smart Agriculture – The Context
By 2030, around 8.3 billion people will require water, food and shelter, placing increasing strains on a finite amount of land, fresh water reserves, and other natural resources. While modern agricultural methods increase crop yield, they often harm land, biodiversity and local water sources. In addition to this, the agri-industry is responsible for a large proportion of global emissions.
Our key challenge is to feed a growing population fr om a limited amount of land, water and other resources while reducing negative environmental impacts and food waste.
Exacerbating these challenges is the fact that over one third of all food produced worldwide is wasted, either during production and distribution, or after sale. Food waste does not only cost us $750 billion a year, it also reduces the amount of food available to people worldwide.
To further complicate the picture, increasing occurrences of climate change-related extreme weather events have the potential to cause severe shocks to global food production, creating a growing need for resilient and environmentally responsible agriculture, as the World Bank has outlined in its path-breaking report “Turn Down the Heat”.
In dealing with these challenges, ICT has a very important role to play. Use of technologies like satellite imaging, geographic mapping, sensor-based technologies and advanced data analytics could lead to prac-tices that are more productive, sustainable and precise. Some of these technologies are already transform-ing the agricultural sector while others, when scaled up, have the potential to truly revolutionize how our food is grown, distributed and consumed.
What is Smart Agriculture?
Smart Agriculture is about making farming more efficient, through techniques like geographic mapping, sensors, machine to machine connectivity, data analytics and smart information platforms. Feeding more people while wasting fewer resources requires traditional agricultural methods to become more intelligent, productive and sustainable using ICT.
Smart Agriculture means using disruptive ICT solutio ns to make food production more efficient by increasing crop yield, reducing waste and easing access to markets.
While many Smart Agriculture technologies are game changing, not all are available at commercial scale yet. According to research by Accenture for Vodafone’s Connected Agriculture report in 201219, most Smart Agriculture applications are currently only partly implemented, if at all, and mainly in developed countries by large farms. The vast majority of smallholders are yet to gain access to these technologies. However, we expect that in a decade’s time, these and many other technologies will penetrate deeper into global food supply chains.

Copyright © GeSI 2015. All rights reserved. – #SMARTer2030 – ICT Solutions for 21st Century Challenges – 43
Future of Smart Agriculture
What we need, to facilitate global Smart Agriculture, is comprehensive access to high-speed internet and to affordable smart devices. Although not available everywhere today, these technologies are expected to be near ubiquitous by 2030.
ICT will allow farmers to increase resource efficien cy, productivity and resilience and will help re-duce food waste along the supply chain.
While these technologies are basic requirements, Figure 22 lists disruptive technologies in four key areas that will drive transformation, from enhancing productivity and resource efficiency, to building shock resili-ence and reducing global food waste.
Figure 22: Food – Future of Smart Agriculture: Technology Vision for 2030

Copyright © GeSI 2015. All rights reserved. – #SMARTer2030 – ICT Solutions for 21st Century Challenges – 44
Precision agriculture
Precision agriculture technologies help farmers to ascertain the exact amount of water, fertilizer, or other input that is needed for specific crops or patches of land at any point in time. This is enabled through Machine-to-Machine connections, sensors and satellites, and strengthened further through the genomic sequencing of plants and seeds.
Data and information management
Advanced analytics on weather data and real-time information platforms will be indispensable in informing farmers of potential weather changes or threats, and can raise early alarm signals of environmental shocks. Real-time information communicated to them through dashboards on their smart device can enable farmers to respond and build resilience by proactively managing detailed weather information.
Automated farm management
Advanced farm management technology, meanwhile, brings us closer to almost fully automated farm man-agement and the optimization of processes from back-office administration, to automated adjustments in irrigation and fertilizer. The automation of conventional farm management enhances productivity, as it frees up more time and increases resource efficiency through better response rates to incoming data.
Reducing food waste
ICT is also having a major impact on the ability of farmers, consumers and buyers alike to trace the food they buy and sell. To optimize processes and reduce food waste at all stages, tracking and tracing systems (like RFID and GPS) allow for remote and real-time tracking of food as it is produced, stored and trans-ported. In developing countries, digital markets and real-time information will help farmers to match demand with supply and – thereby – to reduce food waste at its source. By 2030, all food products could be individ-ually tagged, allowing for customized expiration dates based on real-time information on a single product’s location, freshness, and source.
Sustainability Impacts of Smart Agriculture
By increasing resource and energy efficiency across applications, Smart Agriculture technologies and prac-tices show strong potential in terms of emissions abatement. By 2030, we estimate the amount of CO2e that could be avoided through Smart Agriculture at 2.0Gt CO2e per year. This is composed mainly from energy savings and the more efficient use of water and fertilizers.
Smart Agriculture also provides significant economic and social benefits, mainly through additional revenue opportunities and cost savings. For example:
• Smart Agriculture solutions could generate almost $2 billion of additional revenues to companies across the sector and increase the average annual income of farmers by $300 by 2030.
• Cost savings through reduced water usage could also amount up to $110 billion by 2030.
The diagram below depicts the types of benefits that Smart Agriculture practices can help accrue across environment, economy and society.
ICT-enabled agricultural practices provide a variety of environmental, social and economic bene-fits, ranging from resource efficiency to resilient systems and increased food security.

Copyright © GeSI 2015. All rights reserved. – #SMARTer2030 – ICT Solutions for 21st Century Challenges – 45
Figure 23: Food - Benefits of Smart Agriculture
Farm Cloud Computing - Transforming farming by exploiting ICT Aeon Agri Create is an ‘ICT Farming’ enterprise, created in partnership with Fujitsu, managing 15 farms covering over 200 locations across Japan. Aeon Agri Create was established with the aim to apply ICT to develop and share farming expertise so that people without much farming experience could deliver results. The Aeon farms use Fujitsu’s Akisa Cloud Computing service as the basis of their daily farm operation and monitoring. Workers are supplied with smart devices from which they can check operations, monitor crops, or check pesticide or fertilizer use while also keeping track of operational costs. Through GPS technology the collected data can be connected to a specific farm and a specific patch of land within the farm, allowing workers to detect and record abnormalities, insect damages, pests or diseases. Farming plans, crop yield forecasts, observations, harvest data and other relevant information is integrated into a central database, used to analyze and improve productivity. For example, collected data on the Japanese mustard spinach plant suggested that crop yields per hectare could be improved by up to 33% through optimal harvesting time and applying the right amount of sunlight and heat. This applied use of farm-generated data helps the company to support strategic crop planting, optimize production, and reduce the required energy and resources. In fact, time savings of up to 80% can be achieved using the cloud computing service. Moreover, as the data generated is sharable, Aeon Agri Create aims to extend its application of ICT farming to 3000 subcontracted farmers, forging win-win relationships with its partners.
Robust Agriculture – Achieving resilience through ICT Recent years have shown an increase in climate-change related extreme weather events with negative impacts on sectors such as agriculture. Developing agricultural farms and practices that are resilient to these events is essential in feeding a growing population. ICT-enabled solutions can significantly contrib-ute to developing such resilience by allowing for timely response to changes in climate and weather con-ditions. Fujitsu’s Akisai Food and Agriculture Cloud solution is a good example of a data-driven solution that can support farmers by making the farming environment and production processes more visible through ICT. The solution uses sensors and cloud technology to measure and control the environment in fields and in greenhouses. In Japan, Fujitsu has built a fully enclosed factory for growing plants using the Akisai cloud solution. Through data-driven knowledge and insights, the solution allows for seasonal crops to be grown year

Copyright © GeSI 2015. All rights reserved. – #SMARTer2030 – ICT Solutions for 21st Century Challenges – 46
round, growing of vegetables without chemicals or pesticides, and contributing to a more stable and effi-cient farm environment that is not at the mercy of nature. By aggregating, analyzing and using diverse data from farms worldwide, ICT solutions such as Fujitsu’s Akisai, can help resolve global-scale food shortages and improve efficiency and resilience in the agricultural sector.
3.5 Mobility – Reaching your destination, not a dead end
Smart Mobility and Logistics – The Context
Transportation and logistics are vital drivers of economic activity in developed and emerging markets alike, but existing infrastructure is increasingly proving to be insufficient to cater to the growing demand for the transportation of people, goods and materials.
By 2030, there will be about 2 billion vehicles on t he road and a need for an additional 15 billion km of paved roads.
Across the globe today, there are one billion vehicles on the road. As a result of globalization and of a rapidly rising middle class this number is expected to double by 2035. To support growth of this kind, we would need roughly 15 million km of extra roads20. This means, more vehicles, more roads, more miles traveled – resulting in additional congestion, fuel consumption, pollution and emissions. Likewise, rail ca-pacity is going to rise. By 2030, about 100,000 kilometers of additional rail track will be needed20.
Although growth in mobility is desirable, it may lead to negative environmental or social consequences if done in an irresponsible way. At the moment, global logistics operations are highly fragmented and ineffi-cient, with unused or redundant capacity across supply chains. These inefficiencies are expected to worsen as the number of people and products transported increases, resulting in significant waste of fuel, energy and materials. Therefore, businesses are looking for ways to improve efficiency across entire logistics chains.
There are opportunities to create a mobility and logistics sector that is much more sustainable. Enhanced connectivity through ICT could significantly increase efficiency while reducing congestion, emissions, and resource consumption. Innovative technologies like electric vehicles and driverless transportation could make personal mobility more sustainable and efficient. In addition, intermodal transportation and vehicle sharing could help reduce congestion and miles traveled. Through the Internet of Things, any product, vehicle or load unit can be connected to another, creating a system that enables products to be transported in the safest and most efficient way.
Smart Mobility means the use of ICT to reduce the ne ed for travel or, where unavoidable, reduce its impact. Smart Mobility can apply to both people and freight.
20 IEA Report on Global Land Transport Infrastructure Requirements (2013): https://www.iea.org/publications/freepublica-tions/publication/TransportInfrastructureInsights_FINAL_WEB.pdf
Copyright © GeSI 2015. All rights reserved. – #SMARTer2030 – ICT Solutions for 21st Century Challenges – 47
What is Smart Mobility and Logistics?
Smart Mobility and Logistics fall into three categories: Connected Private Transportation, Traffic Control and Optimization and Smart Logistics. Each of the three areas have separate applications, but all three can help make transport more sustainable and efficient.
Traffic Control & Optimization is facilitated through connected smart sensors, location-based applica-tions and intelligent infrastructure, all working together to make traffic, driving and parking more efficient.
Connected Private Transportation means connecting people and vehicles that have similar origins or destinations. For example, smartphone enabled car-sharing or car-pool platforms can help travelers meet each other at designated spots to travel together.
Smart Logistics is about connecting vehicles, products and load units, thereby improving route and load optimization and reducing the amount of waste in the system.
Smarter transportation is important because of the e mbedded convenience, reliability and effi-ciency it brings to travel and logistics
The Future of Smart Mobility and Logistics
Smart Mobility and Logistics Solutions will be an important part of the solution to global mobility challenges. The ICT solutions that will optimize private mobility, traffic control and logistics, for example, are also likely to have a disruptive effect on the industry, challenging incumbents to change their ways while new actors play a growing role.
According to Gartner and Accenture Strategy research, the role of disruptive ICT in transportation will ma-ture in about a decade. While the common use of less advanced technologies like location sensing is likely to become commercially viable by 2017, complex solutions like public telematics, connected infrastructure and connected or driverless vehicles may take a decade before becoming widely available. More specifi-cally, we foresee the following developments in the three main categories of Smart Mobility and Logistics:
Connected Private Transportation
ICT-enabled car and ride sharing will allow for much better utilization of the existing fleet of cars, lowering overall fuel consumption and emissions. Car sharing can also reduce the need for vehicle ownership, providing additional benefits like saving time and money.
‘Driverless vehicles’, where all vehicle driving functions are taken care of by an onboard computer, are also likely to significantly impact private transport, disrupting the personal transport industry in the process. Furthermore, drivers and passengers are likely to have increasing access to connected services in their vehicles – enabling enhanced communication, navigation and entertainment capabilities, and contributing to individual safety as well as to traffic control and route optimization (see below).
Traffic Control & Optimization
ICT solutions can significantly support the controlling and optimization of traffic. They can contribute to safety and convenience through, for example, collision alarm and lane-keeping-systems, but also connect private vehicles to smart roads, lights and traffic control systems.
Connectivity between cars, roads, lights and control systems allows for the gathering of real-time infor-mation on traffic conditions. Traffic control and optimization platforms can use this data to generate insights for drivers, such as the optimal driving speed to avoid congestion, the best route to avoid a traffic jam or the nearest available parking spot. Improved information, prediction and planning will allow for more effi-cient driving, routing and parking, leading to fewer accidents and, of course, a reduction in congestion and emissions.
Smart Logistics
ICT-enabled solutions like advanced data analytics, telematics and sensor technology allow logistics com-panies to increase both the flexibility and the efficiency of road, air, train and marine freight by connecting the dispatching office with entire fleets, individual vehicles, roads, load units or even specific products.

Copyright © GeSI 2015. All rights reserved. – #SMARTer2030 – ICT Solutions for 21st Century Challenges – 48
Tools like fleet management and route optimization systems can increase operational efficiency and plan-ning while reducing costly redundancies, empty runs, outages, accidents, or damage to goods. Connected devices can also support the tracking and monitoring of items’ location and status, even allowing for flexible and individual rerouting during a particular journey.
Figure 24 summarizes the potential of ICT to lead to a faster and greener logistics sector.
Figure 24: Mobility - Future of Smart Mobility and Logistics: Technology Vision for 2030

Copyright © GeSI 2015. All rights reserved. – #SMARTer2030 – ICT Solutions for 21st Century Challenges – 49
Sustainability Impacts of Smart Mobility and Logistics
The transition to smart, sustainable mobility brings a number of sustainability benefits. Efficient public and intermodal transport systems save commuters’ time, generate economic benefits, and reduce emissions. For example, Mexico City is estimated to recover $141 million in economic productivity from just one of six lines of its Metrobús BRT system.21
Our research shows that the emissions savings from the three use cases analyzed, comprising Connected Private Transportation, Traffic Control & Optimization and Smart Logistics could abate 2.6Gt CO2e, repre-senting 21.5% of total ICT-enabled abatement potential by 2030. Furthermore, if we consider the reduced need to travel arising from changing practices across other sectors such as health, learning, work and commerce we can add another 1.0Gt CO2e emissions reduction from the mobility sector.22
The US, China and India are the countries with the highest abatement potential for traffic control & optimi-zation, with China accounting for almost 50% of the abatement potential for Smart Logistics.
ICT-enabled mobility solutions provide significant benefits, as illustrated here:
750 billion liters of fuel savings: 236 billion liters of fuel could be saved in 2030 through traffic control and optimization, and 220 billion liters of fuel through connected private transportation. By 2030, smart logistics solutions could generate savings of 267 billion liters of fuel and 3.8 billion kg of wood.
$1 trillion of avoided costs: In economic terms, traffic control and optimization could translate into $409 billion of avoided costs and connected private transport to around $611 billion of avoided costs. Various smart logistics processes and methods could also add an additional value of around $174 billion by 2030 to the economy as a whole.
Around 42 billion hours saved in 2030: Efficient traffic management solutions and high quality navigation systems could save around 42 billion hours by 2030. As a result of car sharing, 135 million cars could be taken of the road by 2030. And for society at large, the various Smart Logistics solutions we have modelled could significantly reduce negative externalities like noise, traffic congestion, and health and safety risks, leading to a safer, cleaner and more peaceful urban environment.
21 World Resource Institute (2015), Who Needs Cars? Smart Mobility Can Make Cities Sustainable
22 In our report we have highlighted the emission reduction where they first occur, e.g., the reduced emissions from fewer trips to healthcare facilities are covered in the report chapter on health.

Copyright © GeSI 2015. All rights reserved. – #SMARTer2030 – ICT Solutions for 21st Century Challenges – 50
Figure 25: Mobility - Benefits of Smart Mobility and Logistics
Networkfleet – BLS puts the brakes on rising fleet management costs with Networkfleet BLS Trucking, one of the largest independent delivery services companies in the Midwestern US, was struggling with rising fuel expenses, vehicle theft, outages and logistical inefficiencies. In order to address these challenges, BLS adopted Verizon’s Networkfleet, a wireless fleet management system that merges diagnostic monitoring with GPS-based automatic vehicle location technologies. The system provided BLS with an effective way of tracking and monitoring every single vehicle in their fleet and collecting information on location, idle time, odd-hour usage and fuel consumption.
By making the entire fleet visible and more transparent, Networkfleet helped BLS save an estimated $188,000 in fuel costs during the first year by eliminating unauthorized usage and unnecessary idle time. In addition, it enabled the company to perform predictive maintenance, reduce breakdowns and repair costs, prevent theft, and protect drivers from wrongful claims.
CityNext - A strong transit system for a livable and sustainable city More than 50% of the world’s population now lives in urban areas and this share is expected to grow. Traffic congestion already is a major challenge and as urban populations increase, this problem is set to get worse. Public transport systems are key in addressing this challenge and help to reduce urban air pollution and CO2 emissions. Cities increasingly rely on public transportation systems to help citizens and visitors to get where they need to go. Working with Microsoft, city-owned bus operator Helsingin Bus-siliikenne Oy (HelB) in Helsinki, Finland, expanded its data warehouse solution to collect and analyze data from bus sensors to reduce fuel consumption, improve driver performance and make bus rides smoother and safer. The installed bus sensors generated more than 4 million lines of data every day, reporting on fuel usage, acceleration, speed, engine temperature, brake performance and GPD location for each driver, route and vehicle. The ICT-enabled system combined data across all of the operator’s 400 buses. Careful analysis of bus data helped HelB to reduce its fuel consumption across its entire fleet by 5%, helping the city reduce its carbon footprint. In addition, using this public transport data solution, companies can monitor driving behavior and incidents and can share this information with drivers in order to improve comfort and safety of them and their passengers. In the case of HelB, driver satisfaction was increased by

Copyright © GeSI 2015. All rights reserved. – #SMARTer2030 – ICT Solutions for 21st Century Challenges – 51
7%. The solution also allowed the company to monitor mechanical conditions, identify issues and problems and even allows for predictive maintenance of vehicles.
Smart Parking – Innovative parking space optimization pilot project Together with partner BT and the Open University, Milton Keynes Council in the UK decided to accelerate its development into a smart city by initiating a pilot project aimed at citywide parking space optimization. Hosted by BT, the established Milton Keynes Data Hub collects and analyzes parking sensor data sent to receivers on lampposts via innovative wireless technologies. As one of the fastest growing cities in the UK, Milton Keynes is now able to expand within local infrastructure constraints by identifying free parking spaces and sending information to roadside displays and smartphone apps to guide vehicles towards them. In addition to real-time information on parking availability, the sensors also provide data on average park-ing duration, allowing the city to adjust parking restrictions and better meet customer needs. At any point in time there are about 7000 free parking spaces available, but without smart parking guiding people to them, at least 12, 000 more spaces will be needed by 2020. Fully deploying this ICT-enabled smart park-ing solution could provide capital savings of least £105 million to this city alone. In addition to economic benefits, the solution also contributes to 50% less traffic congestion and reduced fuel use and vehicle emissions.
3.6 Energy – Integrating renewables into the grid
Smart Energy – The Context
The energy sector is currently undergoing fundamental changes that are driven by a variety of trends. Firstly, conventional energy sources are contributing significantly to climate change through emissions. As a result, companies are under pressure to find more efficient and alternative ways to generate reliable energy and to bring down associated emissions.
The energy sector needs to realign its business mode l from being production-centric to service-oriented. Forward looking utility companies are focusing on innovation.
Secondly, new energy sources are disrupting the business models of conventional utilities. Micro grids and energy storage solutions are gradually reducing the need for transmission and distribution. Although, these solutions are yet not commercially viable in all markets and locations, they are forcing utility companies to rethink and realign their business models. What is more, conventional Transmission and Distribution (T&D) networks are plagued with ageing or insufficient infrastructure and disparity between supply and demand.
Lastly, the traditional T&D based approach has not always proven to be sufficient in providing reliable energy, especially in developing countries. In fact, 1.3 billion people across the globe still do not have access to electricity at all23, keeping the issue of energy access, security and reliability high on the agenda of developing as well as developed countries.
The good news is that ICT-enabled technologies can help to create a global energy system that is resilient, reliable and secure. ICT is a key driver behind improving energy efficiency in grids and accelerating the decarbonization of the energy sector. In fact, 92% of utilities executives believe that advanced data ana-lytics will have the greatest impact on their business up to 201924.
23 World Energy Outlook 2014, http://www.worldenergyoutlook.org/resources/energydevelopment/energyaccessdatabase/.
24 Accenture’s Digitally Enabled Grid Program, 2014 http://www.accenture.com/us-en/Pages/insight-trends-toward-digital-grid-value-analytics-infographic.aspx
Copyright © GeSI 2015. All rights reserved. – #SMARTer2030 – ICT Solutions for 21st Century Challenges – 52
What is the Smart Energy?
Smart Grids are able to establish a better balance between energy demand and energy supply. In the future, Smart Grids will be able to run themselves by collecting data with smart metering devices, conduct-ing advanced data analytics, and acting on a continuous stream of data and information from all assets in the grid connected to each other via the cloud.
Making grids smarter means balancing energy supply t o existing demand, integrating renewables and enhancing grid efficiency.
Besides managing demand dynamically and allowing for improved load management, ICT-enabled solu-tions can better integrate renewables into the grid. Smart Grids are much better at coping with intermittent and distributed energy than current grid networks which often waste excess electricity on the system or fail to balance demand to meet supply shocks – leading to brownouts.
On top of all of this, Smart Grids can help to enhance grid efficiency through streamlined operations and the constant monitoring of assets resulting in fewer losses during transmission, storage and distribution.
While there are numerous benefits to be derived from Smart Grids, they will come online gradually. Tech-nologies like meter data management, intelligent electronic devices (like fridges and other white goods), advanced metering infrastructure will become scalable in about five years. Technologies like advanced distribution management, demand response management, energy storage, micro grids and home energy management are likely to become commercially scalable in about a decade.25
It will take between 5 to 10 years for smarter grids to become fully integrated at scale.
Future of Smart Energy
Smart Grid technologies have the potential to create a global energy system that is resilient, reliable and secure. With demand response technologies able to reduce peak loads and exponential improvements in energy storage technologies, ICT is a key driver behind improving energy efficiency in the grid and accel-erating the decarbonization of the energy sector.
Advanced analytics and big data solutions play an im portant role in interpreting data and create real-time system insights to support decision-making.
The future of Smart Energy for providers
From a provider’s perspective, features of Smart Grid solutions include:
1. Distributed and variable power generation • Distribution grid management and sensor technologies allow for variable and renewable energy
generation and distribution by improving asset management and optimizing distribution control
• Automated information on and control over supply (generation) and demand facilitates distributed generation
• Quickly developing battery technologies and uptake of electric vehicles could facilitate variable gen-eration and distribution through energy storage
2. Real-time response to demand changes, predictive analytics and forecasting
• Advanced analytic tools including descriptive analytics and visualization, predictive analytics, opti-mization, simulation, and application-specific solutions, contribute to better matching of supply and demand and optimizing load management
• Smart metering and intelligent substations allow for the collection of vast amounts of data as input for improving grid operations
25 Gartner Hype Cycle for Smart Grid , Accenture Digital

Copyright © GeSI 2015. All rights reserved. – #SMARTer2030 – ICT Solutions for 21st Century Challenges – 53
• The Internet of Things and Machine-to-Machine technology through the deployment of intelligent sensors and energy management technologies are key enablers for utilities’ transformation to infor-mation-centric digital businesses
• Demand response technologies allow for real-time system response to changes in demand, and help flatten out the demand curve and reduce system load
3. Reliable infrastructure resilient to changes • Asset Performance Management helps utilities better predict equipment failure
• IT/OT convergence improves reliability, renewable integration and environmental stewardship
• Interconnection with other operating systems allows for direct trading between regions, enhancing resiliency to peak loads or shortages across borders
• Advanced analytics used to predict demand, renewable generation, weather, wind etc. allows for a more reliable and resilient energy system
The future of Smart Energy for “prosumers”
The conventional energy model has operated since its inception with consumers at one end and energy generators at the other. By 2030 we estimate that this model will change and that “prosumers”, i.e. con-sumers who are also producers of electricity, will become common features of the new, smart, energy landscape. The key will be to ensure that all these micro-generators have proper access to the grid.
Mobile technologies allow prosumers “Access and Insight” into locally generated energy, thereby enabling them to make informed decisions about energy production and consumption. ICT-enabled micro-grids al-low households, neighborhoods, and even towns and cities to share energy production and consumption capacity, generate local energy and become self-sufficient. Machine-to-machine communication and gen-eral connectivity in the system creates a two-way flow of information, connecting all components, assets and other hardware in the system. This allows for the development of an efficient, decentralized grid - a Smart Grid.
However, the success of Smart Grids depends on the development of well-defined ICT solutions, such as the capabilities of advanced analytics and big data solutions to interpret data and create real-time system insights to support decision making. Furthermore, technologies that allow for variable and decentralized energy generation, storage and distribution need to be further advanced.

Copyright © GeSI 2015. All rights reserved. – #SMARTer2030 – ICT Solutions for 21st Century Challenges – 54
Figure 26: Energy - Future of Smart Energy: Technology Vision for 2030
Sustainability Impacts of Smart Energy
Our analysis shows that global emissions abatement from Smart Energy represents 1.8Gt CO2e or 15% of the total abatement potential contributed by the eight sectors in this report. Additionally, 1.6Gt CO2e can be cut from the energy sector due to decrease in energy production. However, this potential has been consid-ered in those sectors that realize the reduce energy through improved demand and supply matching (75% Smart Building and 25% Smart Manufacturing)
The US and China represent almost three quarters of the total abatement potential, mainly due to their size and the size of their current energy footprint.
From a sustainability perspective, an ICT-enabled Sm art Energy can bring huge environmental benefits, saving up to 6.3 billion MWh of energy.
If rolled out comprehensively, Smart Grids could significantly heighten the sustainability of our electricity networks, cutting costs and creating new revenues. As outlined below:
6.3 billion MWh of energy savings: According to our modeling, energy production could be reduced by 20% - a saving of 6.3 billion MWh - as a result simply of better demand management and the integration of renewables into a more flexible system. The energy lost during distribution could be reduced by 5% owing to improved grid efficiency.
700,000 km saved grid: ICT-enabled Smart Grids are expected to make energy generation and distribu-tion more cost-effective, avoiding the need to lay over 700,000 km worth of grid.

Copyright © GeSI 2015. All rights reserved. – #SMARTer2030 – ICT Solutions for 21st Century Challenges – 55
$810 billion of additional revenues: The evolution of Smart Grids could create $2.1 billion in additional revenues for the ICT sector and $811.3 billion in revenues for renewable energy companies.
Universal access to energy: There are numerous social benefits associated with the smart grid, espe-cially in developing countries. These include, for instance, universal affordable access to energy as well as heightened energy security. It is also likely that Smart Grids could lead to higher levels of social cohesion as communities cooperate on new energy solutions.
As with so many of the solutions we have outlined in this report, ICT also has the power to vastly empower the consumer by placing him or her at the center of their own energy system, rather than the end of it, as a distant end-user in a clunking machine. We also foresee huge cost savings to individual households from transparency and from greater and more obvious incentives to become energy efficient.
The diagram below depicts the types of benefits that Smart Grids can help accrue across environment, economy and society.
Figure 27: Energy - Benefits from Smart Grid
eSmart Systems – Making cloud technologies the brain of the modern smart grid Microsoft eSmart Systems is a cloud-based automated energy management system that employs sensors, Smart Meters and software to forecast consumption, reduce outages, and monitor assets to improve en-ergy efficiency. There is a wealth of data available to utility companies on the energy grid, but the challenge is to make sense of this data and turn it into actionable information. eSmart Systems provides a central way of bringing this information together and enables energy companies to deal with complex challenges such as balancing peak loads and supply and demand, as well integrating renewable energy sources and technologies into the grid. Managing data and information and upgrading the grid to better balance peak loads is highly costly. eSmart Systems provides a cloud-based and cost effective way of using data to optimize existing grids for energy efficiency, allow for predictive maintenance to reduce outage and continuous monitoring of all assets. This solutions helps energy companies save time, money, and energy and reduces CO2 emissions associated with these energy savings. eSmart Systems is aimed at utility companies looking to improve efficiency. All that is needed to start running the brains of the smart grid is an internet connection.
Copyright © GeSI 2015. All rights reserved. – #SMARTer2030 – ICT Solutions for 21st Century Challenges – 56
Smart grid - An electricity grid that thinks for itself Improving the efficiency of existing electricity grids is essential in providing reliable power to a growing population, especially in countries like China with a rapidly growing middle class. As a quickly developing economy, China has started to prioritize clean energy and CO2 emissions reduction by developing an energy system that is efficient, reliable and environmentally responsible. To address the challenges of our time, next-generation power networks need to facilitate distributed and renewable energy sources, be highly automated and exploit the Internet of Things. In line of this aim, China Southern Power Grid, providing electricity to 230 million people, has partnered with Huawei in piloting a smart grid empowered by wireless broadband. As the first 4G TD-LTE enabled smart distribution network, it features automatic distribution and measurement, as well as video surveil-lance of the distribution network and emergency communication. This ICT-enabled smart grid does not only enable energy savings and reduced emissions, but also saved China Southern Power Grid around 5% in costs compared to their previous solution. Moreover, this next-generation grid solution increases power supply reliability and lays the foundation for smart homes.
3.7 Work and business - The impacts of E-business on working, banking & shopping
The Context – ICT is reshaping individuals’ work, ba nking and consumption practices
ICT solutions have already started to revolutionize the way people work, do business and shop. This will only gain in momentum as more people come online.
In retail, more transactions are now occurring online and retail e-commerce sales worldwide reached $1.2 trillion in 2013. A growth rate of nearly 20%, with the majority of growth coming from emerging markets26.
The banking sector has also been an early adopter of online technology and the associated services are now nearing maturity. However, around 2.5 billion people around the world still go without a bank account27 and the financial inclusion of such a large group remains a key challenge for mainstream banking.
By 2030, ICT solutions will transform the way in whi ch individuals manage their shopping, bank-ing and work activities. Mainstream transactions will be increasingly virtual and more and more people will use ICT to undertake them.
More generally, many organizations are preparing to transform the way their workplaces are run. Early adopters have set up teleworking for employees, giving them the freedom to work from a remote location while helping the employer save on the costs of office space.
The conventional way of doing business involves high-street or out-of-town shopping, banks opening branches and employees commuting to work in the rush hour. This is a high cost, high emission and in-creasingly time-wasting set up.
26 Source: eMarketer (2014)
27 http://edition.cnn.com/2014/11/06/opinion/banking-the-unbanked-mobile-money/

Copyright © GeSI 2015. All rights reserved. – #SMARTer2030 – ICT Solutions for 21st Century Challenges – 57
What is E-Business?
Simply put, E-Business is conventional business undertaken on virtual platforms instead of in-person.
For example, in retail, e-commerce means online shopping through secure, cashless, gateways.
In the financial sector, e-banking means providing banking products and services through electronic de-livery channels like the internet or mobile banking, including the use of mobile money.
E-Business, in simple words, is the sale of products or services using internet as a platform and computerized devices as points of sale.
For organizations, E-Work, also known as telework, is the use of cloud-based platforms, connections and smart devices to facilitate and speed up daily office work between co-workers in different locations.
Figure 28: E-Business – Future of E-Work, e-commerce and e-banking: Technology vision for 2030
The use of technology for transforming conventional business practices will help decouple growth from resource consumption.
The Future of E-Business
It is likely that the full, global, roll-out of E-Business at scale will take another decade. However, according to Gartner and Accenture, technologies like mobile commerce, e-invoicing and e-payments could reach global commercial scale in 2017. Nevertheless, it could take until 2025 before every workplace in the world is fully digitally enabled.
By 2030, ICT solutions will enable white-collar work ers to work from any-where, anytime and on any device.
Below, we describe more specifically the main developments anticipated in the three main dimensions of e-business.

Copyright © GeSI 2015. All rights reserved. – #SMARTer2030 – ICT Solutions for 21st Century Challenges – 58
E-commerce
Integrated multichannel infrastructure: ICT solutions will enable retailers to build integrated infrastruc-tures that deliver a seamless, more sustainable, customer-centric shopping experience across multiple channels.
New online shopping features will include, for example, customizable designs, virtual sizing for clothes as well as virtual shopping assistants that will be able to make recommendations based on previous pur-chases.
Retail 3D printing: The 3D printing of bespoke items will allow immediate access to goods in all markets. In fact, it might even be developing countries that see the fastest growth of 3-D printing.
Delivery on demand: As internet coverage and smartphone penetration increase, more and more cus-tomers across the world will use mobile apps to buy goods and services. And Delivery on demand will only be aided by the smart logistics solutions detailed in the chapter ‘Smart Mobility and Logistics’.
According to Accenture, E-commerce transactions are likely to increase by 50% by 2030.
E-Banking
Online/mobile banking: Online banking and banking through smart devices will mean the inclusion of millions of additional people in the financial system, providing previously unbanked citizens with the bene-fits of modern consumer finance. Simple as well as elaborate banking services will make it easier for the formerly excluded to obtain a credit-history, providing the basis for large service providers (operating to higher quality standards) to replace the kind of non-mainstream lenders that have so far dominated devel-oping markets and which tend to offer very high-interest loans. In this way, ICT can help more people borrow at sensible rates with all the economic and social benefits this brings.
By 2030, digital banking and retail business models will deliver more sustainable, customer-cen-tric, cross-channel shopping experiences.
Digital wallet (“mobile money”): Electronic payment systems will eventually make cash redundant, in-creasing individual security and, quite possibly, reducing fraud. Money transfer systems via mobile phones such as M-Pesa (Vodafone Money Transfer) already enable millions of people to send and receive money (person-to-person transactions) and make bill payments (consumer-to-business transactions) without hav-ing a bank account. Users need only a mobile phone, not a bank account.
E-Work
E-Work offers to significantly improve people’s quality of life, reducing stress and allowing a more flexible work-life balance. Instrumental technologies here include:
Telework (“mobile workplace”): The advance of collaboration tools is already permitting teleworkers to work remotely from anywhere. Telework can also help previously marginalized workers like those with disabilities or those with caring duties to take part in the economy in a way that makes the best of their abilities. Likewise, for employers, online collaboration tools allow them to hire workers with the best skills, independent of their location.
Virtual business meetings: Virtual meetings, leveraging videoconferencing and augmented reality tech-nology, are increasingly able to replicate the benefits of physical meetings, saving time and emissions from transport

Copyright © GeSI 2015. All rights reserved. – #SMARTer2030 – ICT Solutions for 21st Century Challenges – 59
The Sustainability Impacts of E-Business
The E-Business solutions we have discussed in this chapter make up 6% (0.6Gt CO2e) of the total abate-ment potential contributed by the eight sectors covered. This includes:
Savings of around 165 billion liters of fuel
Savings of 388,854 tons of paper
105 billion hours of time saved
Figure 29: E-Business - Benefits of E-Business
Dynamic Workplace – A virtual workplace solution Provided by Deutsche Telekom (DT), Dynamic Workplace is a user-friendly cloud-based workplace allow-ing access to virtually any application through a simple web browser. The solution is compatible with any type of device such as notebooks, tablets and smartphones, and is delivered in a secure fashion from a private cloud. Using Dynamic Workplace allows any employee to access all the files, applications and software that they need to work at their convenience from home, a coffee shop, an office abroad or any other environment. The solution is offered on a simple user interface across all devices and provides a self-service portal with integrated workflows. For a typical company, DT’s Dynamic Workplace solution helps employees reduce time spent on commut-ing to work by on average 56 hours a year. In addition, the solution helps every employee to save over €250 per year due to reduced commuting. For companies, Dynamic Workplace offers significant benefits in terms of emissions reduction, employee cost savings and higher employer attractiveness. In fact, per year a company employing around 35,000 people can save 16,000 tons of CO2e emissions through re-duced travel and achieve €15 million in cost savings through reduced idle time and sick days.

Copyright © GeSI 2015. All rights reserved. – #SMARTer2030 – ICT Solutions for 21st Century Challenges – 60
3.8 Manufacturing – Resource efficient and customer centric
Smart Manufacturing – The Context
Recent technological developments in the scope of the Internet of Things and Machine-to-Machine con-nectivity have been described as a “Fourth Industrial Revolution”. This is by no means an exaggeration.
By 2030, the 4 th industrial revolution, also known as the ‘Industrial Internet of Things’ will trans-form traditional factories into high performance, fully optimized plants.
This revolution, is enabled by Cyber-Physical Systems, also known as “Industry 4.0” or as “The Industrial Internet of Things (IOT). The IOT is made up of a combination devices connected to each other via the cloud, in the context of manufacturing this would be a combination of Smart Machines, Smart Materials and Smart Products, all of which are interconnected and generate continuous data that is collected, pro-cessed and analyzed in a central location. Making optimal use of this generated data can help traditional factories increase in productivity, quality, and production flexibility, while reducing their environmental foot-print, energy and other resource usage.
Although the benefits of ICT powered manufacturing are widely accepted, the most recent technological developments are far from mainstream. A recent Accenture survey in this area showed that a little over a third of companies currently apply automation technology. This points to the current low rate of ICT adop-tion among manufacturers. Several technological barriers must be overcome before a truly smart manu-facturing operation can be realized.
When organizations manage to overcome these barriers, ICT powered Smart Manufacturing can enable innovations like virtual manufacturing, customer-centric production, 3D printing and virtual production net-works, and circular supply chains for resource efficiency to become commonplace.
What is Smart Manufacturing?
Smart Manufacturing is the application of advanced communications systems to conventional manufactur-ing processes, making them more flexible, efficient and responsive. There is a range of options available to manufacturers to radically overhaul their current model by making it much more responsive to individual customer needs on the one hand and resource efficient on the other. Making our manufacturing “smart” effectively transforms factories from traditional cost centers into high-performance plants, fully optimized in their use of direct material inputs as well as their use of energy and water.
Smart Manufacturing can be defined as “the intensifi ed application of advanced intelligence sys-tems” that create a fully digital value chain.
Gartner and Accenture Strategy research suggests a timeline of 5 to 10 years for Smart Manufacturing to become fully integrated across operations and industries. Data analytics and cloud computing, on the other hand, are already commercialized.
More complex applications, like 3D printing, drones and robotics and augmented reality devices, could take more than a decade to become commercially viable to all.

Copyright © GeSI 2015. All rights reserved. – #SMARTer2030 – ICT Solutions for 21st Century Challenges – 61
Future of Smart Manufacturing
Smart devices have the potential to transform how factories operate, how sites are managed, how vehicles are maintained and operated, and much more. As industrial devices become more intelligent and con-nected, they produce huge amounts of data that can be collected and used to generate new business ideas and drive new, digital value chains.28
Smart Manufacturing comprises multiple key disruptiv e technologies, enhancing operational ex-cellence, resource efficiency and time to market.
The future of manufacturing will see a central role for ICT enabled factories that are self-organized, flexible, decentralized and highly connected.
Figure 30: Manufacturing - Future of Smart Manufacturing: Technology Vision for 2030
Virtual Manufacturing
By 2030, we envision the potential roll-out of what some have called virtual manufacturing in which ele-ments of the following capabilities become commercially viable at scale.
CPS-optimized production processes: Smart factory “units” will be able to determine and identify their own fields of activity, configuration options and production conditions as well as being able to communicate independently with other units.
Self-organizing and self-maintaining factories: Smart machines will be able to detect when they are faulty, switch production lines and repair themselves without any downtime.
28 Digital Factory (2014), 4.0 The digital industry: a case study for an industrial revolution

Copyright © GeSI 2015. All rights reserved. – #SMARTer2030 – ICT Solutions for 21st Century Challenges – 62
Flexible factories and products: Fully ICT-enabled factories will have dynamic production lines, through which products can move autonomously through the CPS-enabled workstations based on customer needs. This will allow for fast and efficient customized production processes and could even enable virtual pro-duction networks, where businesses can send their product design to any factory across the globe and have their product 3D printed or produced instantly.
Customer Centric Production
Smart manufacturing lends a further boost to the empowerment of the customer to affordably tailor mass produced items to specific needs. It also allows wholesale customers to monitor and track all stages of their order in real-time, enabling them to better optimize their own supply chain planning and requirements.
Circular Supply Chain
Smart manufacturing can also contribute to the roll-out and viability of circular business models by allowing products and components to be tagged, tracked and traced throughout their entire lifecycle. In a circular model, products are returned to the factory at end-of-life to be re-manufactured, repaired or refurbished, creating significant resource savings. This enables companies to reduce their input costs, manage supply chain risks and become more competitive in their sectors29.
Smart Services
Already today, we are witnessing a shift towards service offerings even in product-focused sectors like manufacturing. Offering products as services can open up new market segments, generate revenue op-portunities and create competitive advantage.
Our research predicts that by 2030 we will see the development of cross-sector ecosystems of services with up and downstream integration, where products can be produced on-demand at any place or time, facilitating immediate responses to changes in market conditions.
Sustainability Impacts of Smart Manufacturing
Smart Manufacturing contributes 22% (2.7Gt CO2e) of the total emissions abatement potential of the eight sectors covered in this report, with the aim of creating a total abatement potential of 12.08 Gt CO2e by 2030. In addition, smart manufacturing solutions have the potential to create energy savings of 4.2 billion MWh and save 81 billion liters of water through more efficient production processes.
The global emissions abatement potential from Smart Manufacturing equals 22% of the total con-tribution from the eight sectors.
Smart manufacturing solutions also create significant economic benefits. We estimate that the introduction of automated and self-maintained smart processes will lead to industry cost savings of $349 billion.
Smart Manufacturing helps improve production costs a nd quality, while minimizing environmen-tal impact, natural resource use, and energy consumption.
29 Accenture (2014), Circular Advantage - Innovative Business Models and Technologies to Create Value in a World without Limits to Growth

Copyright © GeSI 2015. All rights reserved. – #SMARTer2030 – ICT Solutions for 21st Century Challenges – 63
Figure 31: Manufacturing - Benefits of Smart Manufacturing
FJVPS – Avoiding emissions in manufacturing through digital prototyping The Fujitsu Virtual Product Simulator (FJVPS) is an advanced manufacturing industry solution that allows manufacturing companies to create virtual prototypes of their products, machines or other items instead of having to physically manufacture them. The FJVPS provides a simple design operation using 3D-CAD data that even people inexperienced with the technology can use to design their own prototypes, detect faults and improve design quality in the very early stages of product design. The Virtual Product Simulator realizes benefits such as quality improvement by detecting 50-80% of design errors, shortening the development period and associated costs by 50%, and reducing necessary man-hours by 30-40%. Furthermore, replacing face-to-face with online meetings, and reducing resources used for prototyping, achieves a reduction in CO2e emissions of 30%. Allowing companies to virtually test their design without physical manufacturing drives significant savings in terms of time, money, resources and emissions.
Smart inverters – Enabling solar power plants Solar energy is one of the most promising renewable energy sources to date. Solar cells and panels used to generate this energy are produced in Photovoltaic (PV) plants. Inverters are the core of every PV plant, converting direct current generated through PV modules into energy usable in the grid. In addition, invert-ers control and monitor the plant and grid to ensure optimum safety. Chinese ICT company Huawei devel-oped a smart PV solution at a 7.8MW solar park in Germany using smart string inverters rather than tradi-tional inverters. These smart inverters are connected via a 4G LTE wireless network, have a smart and readable battery and offer remote monitoring capabilities allowing for better data analysis and a higher power ratio. Using ICT-enabled inverters allows site owners to have greater control and monitoring of their plant through data collection and analysis, while the price of smart string inverters is lower than that of traditional ones. In addition, this technology improves solar power generation performance in difficult weather conditions such as extreme heat, continuous rain and even in salt mist conditions. Applying this ICT-enabled solution generated the PV plant in Germany a 5% higher yield and a 50% better maintenance efficiency. Smart inverters provide a strong example of how combining advanced hardware and technology with ICT-enabled solutions can enable further integration of renewable energy into the grid.

Copyright © GeSI 2015. All rights reserved. – #SMARTer2030 – ICT Solutions for 21st Century Challenges – 64
4 Countries across all income levels can benefit from ICT solutions
In this chapter, we break down our analysis by geography, presenting findings on the environmental, social and economic benefits ICT can bring to meet specific challenges in nine countries, of varying incomes and social profiles. The countries we examine are: Australia, Brazil, Canada, China, Germany, India, Kenya, the United Kingdom and the USA. We have chosen this range of countries for their variety of economic development but also for the range of differing, specific challenges ICT can help them overcome.
4.1 Australia
Current Context
Australia’s GDP grew by over 2% in 2013, bringing the overall size of its economy in at over $867 billion.30 The country has maintained stable economic growth for over two decades and managed to avoid the worst of the economic downturn. The services sector is an important growth engine, contributing 57% to the country’s total economic output31.
In the area of sustainability and well-being, Australia faces a number of challenges, as highlighted by the government’s Sustainable Australia report of 201332.
Perhaps some of the most pressing sustainability challenges for Australia are: securing reliable food sup-plies in a country increasingly prone to drought; inequality of access to education and, therefore, unequal educational outcomes; responding to the budgetary pressures brought on by an ageing population and, fourthly, the increased need for better transport and logistics solutions.
Our research finds that – coupled to smart healthcare – the most effective ICT-enabled solutions to meet the challenges Australia faces come in the form of Smart Agriculture, Smart Energy and Smart Manufac-turing.
Australia is growing, but its growth is not evenly distributed. There are differences between the opportuni-ties available to residents of urban areas and those available to residents in regional or rural areas. There are also disparities in uptake of education varying across different income groups. Only 74% of young people in low-income areas have completed a basic vocational qualification compared to around 94% in the higher income groups.
By 2030, the number of Australians aged 65 and over is expected to have increased by 84% from 2015. And this ageing population is expected to result in increased social welfare and healthcare expenses. By 2047, government health costs could be close to 10% of GDP33, compared to 6% today. So finding inno-vative ways to keep healthcare services accessible, affordable and scalable is essential for Australia.
Additionally, although Australia is a large country, there is pressure to feed its growing population. In 2011, 53% of Australia’s land was used for agricultural purposes, but only 12% of this was used for crops, with the remaining being used for grazing34.
The government has established Food Innovation Australia Limited, an “Industry Innovation Precinct for Food”, geared to making the sector more strategic and commercially focused.
30 The World Bank: http://data.worldbank.org/indicator/NY.GDP.MKTP.KD
31 Reserve Bank of Australia, Australian Economy Snapshot, 2015, http://www.rba.gov.au/snapshots/economy-snap-shot/pdf/australian-economy-snapshot.pdf?accessed=2015-05-20-00-59-47 32 Sustainable Australia Report, 2013: Conversations With The Future
33 Australian Government Productivity Commission Research Paper (2013). http://www.pc.gov.au/research/completed/ageing-australia/ageing-australia.pdf 34 Australian Bureau of Statistics (2011-2012). http://www.abs.gov.au/ausstats/[email protected]/Latestproducts/4630.0Main%20Fea-tures32011-12?opendocument&tabname=Summary&prodno=4630.0&issue=2011-12&num=&view=

Copyright © GeSI 2015. All rights reserved. – #SMARTer2030 – ICT Solutions for 21st Century Challenges – 65
Figure 32: Australia - Sustainability priorities for Australia
Only 74% of young people in low-income areas have completed a basic vocational qualification compared to around 94% in the higher income groups.
The ageing Australian population will exert significant budgetary pressures on the government in relation to old age pensions, health services and care facilities.
In 2011, the agriculture sector was the largest single consumer of water, accounting for 55% of Australia’s water consumption.
With Australia’s population expected to grow to a little under 30 million people by 203035, the size of the country’s cities is expected to increase. This could lead Aus-tralia’s mobility and congestion issues to worsen, requiring significant investments in additional transport and infrastructure.
The equitable distribution of knowledge and wealth, better access to healthcare for seniors and more efficient food value chains are important sustainability issues for Australia.
What ICT could do for Australia by 2030
ICT-enabled solutions can play an important role in addressing Australia’s most pressing sustainability challenges. Australia already has a very high mobile phone and smart phone penetration rate (135% and 90% respectively in 2014).36 For Australia, ICT can help equalize access to services by, for example, mak-ing healthcare accessible to all, and helping produce food more productively and sustainably.
In Australia, ICT can help bring equality to the del ivery of services, make healthcare accessible to all, and help produce food sustainably.
Another key issue for Australia is delivering equal education and learning opportunities to different popula-tions and income groups. E-Learning, which is the deployment of computerized devices in educational and learning environments, can address this issue. Using broadband internet and smart devices, engaging and personalized learning materials can be made available to every student in Australia.
Our analysis suggests that in Australia alone, by 2030, more than 415,000 E-Learning degrees could be obtained every year, even in the most remote parts of Australia. Indeed, through E-Learning, education departments and universities could together save as much as $9 billion a year.
ICT can also help support the country’s healthcare system. Using technologies like wearables, smart de-vices and making use of remote diagnostics, providers and practitioners alike can engage patients re-motely, on-demand, thereby saving time and resources. We estimate that, by 2030, an additional seven million people can be benefit from E-Health, including a growing elderly population who would be able to communicate with their doctors from the comfort of their own homes.
35 Australian Government Productivity Commission Research Paper (2013). http://www.pc.gov.au/research/com-pleted/ageing-australia/ageing-australia.pdf
36 Australia - Mobile Communications - Statistics and Forecasts - See more at: http://www.budde.com.au/Research/Australia-Mobile-Communications-Statistics-and-Forecasts.html#execsummary

Copyright © GeSI 2015. All rights reserved. – #SMARTer2030 – ICT Solutions for 21st Century Challenges – 66
ICT also has an important role to play in making food and agriculture more efficient and sustainable. By using advanced data management techniques like sensor-based field equipment, data analytics and infor-mation and communication platforms, the yield per hectare of land can be increased by over 700kg per year by 2030. Similarly, water use can be brought down by nearly 650 billion liters each year by 2030 as a result of more data-driven and precise agricultural practices.
In the area of mobility, ICT-enabled solutions such as traffic optimization, connected private transportation and smart transport and logistics could help reduce Australia’s congestion issues, reduce CO2e emissions associated with travel, and facilitate better mobility to a growing urban population.
Australia can potentially abate about 0.19 Gt of emi ssions by integrating ICT into across different sectors.
In total, ICT-enabled solutions across different sectors in Australia can could cut as much as 0.19 Gt CO2e by 2030. Smart Agriculture, Smart Energy and Smart Manufacturing solutions represent about 75% of the total potential saving.
Figure 33: Australia - Total CO2e Abatement Potential of ICT across sectors
In addition to the environmental benefits, ICT can also provide other social and economic benefits to Aus-tralia. For example, e-commerce solutions in a range of sectors could save over 250 million liters of fuel through avoided shopping trips and almost $9 billion could be saved by reducing the need for office infra-structure. In addition, smart building solutions could help reduce household water consumption by 650 million liters through smart metering and the Internet of Things.

Copyright © GeSI 2015. All rights reserved. – #SMARTer2030 – ICT Solutions for 21st Century Challenges – 67
Figure 34: Australia - ICT can play a significant role in reducing different sector's sustainability impacts
4.2 Brazil
Current Context
With a growth rate of 2.5%37 in 2013, Brazil has experienced lower growth rates in recent but remains one of the biggest economic development stories in the world, helped by the fact that it is the sixth most popu-lous country in the world38. It is also the world’s fifth largest internet user39 and the eighth largest consumer of energy.
The sustainability issues facing Brazil center on it s energy, traffic congestion and deforestation activities.
Because of its sheer scale, Brazil faces significant sustainability challenges. Although the share of renew-ables (including hydro) in Brazil’s energy mix is very high (77% in 201340) certain regions still suffer black-outs during peak hours, which became acute during the early months of 201541. These were caused by two main factors: a lack of rainfall in a country heavily reliant on hydro-electric power and poor and unreli-able grid connectivity. Added to these supply-side challenges is the fact that demand in Brazil continues to grow.
37 World Bank (2013), GDP Growth Rate
38 Maps of World (2014), Most Populated Countries in the World
39 Internet Live Stats (2014), List of Countries by Internet Usage
40 Enerdata (2013), Global Energy Statistical Yearbook 2014
41 Bloomberg (2015), Brazil Real Leads Global Gains as Tax Increases Fuel Optimism

Copyright © GeSI 2015. All rights reserved. – #SMARTer2030 – ICT Solutions for 21st Century Challenges – 68
There are significant logistics challenges too. According to the World Bank, with 8.5 million motorized ve-hicles and 100-kilometer-long traffic jams, São Paulo is the sixth most congested city in the world.42 Like many others facing this problem, the city is looking for ways to shift rapid motorization onto a more sus-tainable path.
In summary, the sustainability issues Brazil is facing center on its energy use, traffic congestion problems and deforestation activities. Our research shows that the ICT solutions most likely to address these chal-lenges are a combination of Smart Agriculture, Smart Energy and Smart Manufacturing solutions.
Figure 35 gives a glimpse of some key sustainability priorities for Brazil.
Figure 35: Brazil - Sustainability priorities for Brazil
Between 1990 and 2013, Brazil’s emissions increased by 189%.43 Statistics from the In-stitute of Health and Sustainability indicate that 4,655 people died as a result of air pollu-tion in São Paulo alone in 2011.
A shortage of rainfall is drying up Brazil's hydropower dams, leading to electricity short-ages. These supply shortages are exacerbated by increases in demand. In 2013, energy demand rose by over 5% and shows no signs of abating in the near future.44
The cities of Rio de Janeiro and São Paulo spent roughly $43 billion on traffic in 2013 alone. The loss amounts to about 8% of each metropolitan area’s GDP, and 2% of Bra-zil’s entire GDP.45
Because Brazil is home to the Amazon Rainforest and the basin it occupies, deforesta-tion has become a major cause for concern. Satellite data indicate a 190% surge in land clearance in Autumn 2014 compared with the same period last year.46
Connectivity is growing in Brazil with mobile penetration currently sitting at 135 mobile phones per 100 inhabitants.47
Mobile phone penetration in Brazil has already reach ed maturity levels, with a penetration of 135 mobile phones per 100 inhabitants.
• In 2014, 29% of Brazilians had access to a smart home, up from 26% in 201348. Smartphone penetra-tion rate is expected to soar to 42% by 2017.49
42 World Bank (2014), Changing Commuters’ Choices Helps São Paulo Reduce Traffic Congestion
43 JRC(2013), Trends in Global CO2 emissions
44 EconoMonitor (2014), Lights Out: Brazil’s Power Problem
45 EBC (Brazil Communication Company) (2014), Custo de congestionamentos no Rio e em São Paulo atinge R$ 98 bilhões
46 The Guardian (2014), Amazon deforestation picking up pace, satellite data reveals
47 World Bank (2013), Mobile Cellular Subscriptions
48 TechinBrazil (2014), Brazilian Smartphone penetration grows 11% YOY
49 The Statistics Portal (2015), Share of mobile phone users that use a smartphone in Brazil from 2011 to 2017

Copyright © GeSI 2015. All rights reserved. – #SMARTer2030 – ICT Solutions for 21st Century Challenges – 69
• In parallel, around 70 million mobile phone users had mobile internet access in 2014 and this is ex-pected to reach 114 million by 2018.50
The Brazilian IT and telecommunications market is currently predicted to grow by 5% and to generate $166 billion in 2015. According to IDC, Brazil was the fastest growing country for ICT in 2014.51
Frost & Sullivan estimate, meanwhile, the Brazilian cloud computing market should see a jump in market revenues from $328.8 million in 2013 to over $1 billion by 2017. Gartner corroborates this, finding that the highest growth rates for cloud computing services continue to come from emerging regions like Brazil and India52.
What ICT could do for Brazil by 2030
ICT can play an especially critical role in two core areas most relevant to Brazil: Smart Energy and Smart Mobility solutions.
Our analysis demonstrates that ICT is fundamental to reducing traffic congestion by improving communi-cations and urban planning infrastructure and by helping people reduce their travel by road.
For example, E-Work technologies like videoconferencing could save around 3 billion liters of fuel.
Through Smart Grids and Smart Metering, Brazilians will be better able to manage their energy require-ments, which could save them around 100 million MWh of electricity. At the same time, technologies like RFID and GPS will help farmers and the authorities alike tackle deforestation53.
In total, ICT-enabled solutions across the different sectors in Brazil could cut as much as 0.41Gt CO2e by 2030 with Smart Agriculture, Smart Energy and Smart Manufacturing accounting for more than 75% of the saving.
Figure 36: Brazil – Total CO2e Abatement Potential of ICT across sectors
50 The Statistics Portal (2015), Mobile phone internet users in Brazil from 2011 to 2018 (in millions)
51 EIN Newsdesk (2015), Brazilian ICT market to grow 5 percent in 2015
52 Gartner Newsroom (2013), Gartner Says Worldwide Public Cloud Services Market to Total $131 Billion
53 Resilience (2014), How Brazil Has Dramatically Reduced Tropical Deforestation

Copyright © GeSI 2015. All rights reserved. – #SMARTer2030 – ICT Solutions for 21st Century Challenges – 70
Figure 37: Brazil - ICT can play a significant role in reducing different sector's sustainability impacts
4.3 Canada
Current Context
Canada, with a GDP of more than $1.4 trillion per year and a population of 36 million54, maintains one of the cleanest electricity systems in the world, with 79% of its electricity coming from non-greenhouse gas emitting sources. Renewable energy like solar, wind, biomass and geothermal currently provides 18% of Canada’s total primary energy supply.55
Since 2008, the Government has committed over $580 million to Carbon Capture and Storage (CCS) tech-nology R&D, including to demonstration projects.
Our modeling shows that ICT too has an important role to play in helping Canada respond effectively to its sustainability priorities (see Figure 38). These center on reducing air pollution and traffic congestion and improving access to secure and reliable supplies of clean water.
A significant amount of Canada’s emissions can be attributed to the transportation sector, so Smart Mobility solutions will be key. However, of the total emissions savings from ICT we have modelled for Canada, Smart Energy, Smart Manufacturing and Smart Buildings represent about 70%.
Figure 38: Canada - Sustainability priorities for Canada
Between 1990 and 2013, Canada’s emissions increased by 23%. Industrial activities and home firewood burning emitted most of the particulate matter (TPM, PM10 and PM2.5) in 2012.56
54 Population Pyramids (2015), Population Pyramids of the World from 1950 to 2100
55 Canada COP 20 (2015), Facts on Canadian Energy Production, Efficiency, and Initiatives
56 Environment Canada (2014), 2012 Air Pollutant Emission Summaries and Historical Emission Trends.

Copyright © GeSI 2015. All rights reserved. – #SMARTer2030 – ICT Solutions for 21st Century Challenges – 71
According to the 2015 TomTom annual traffic index, one of the most accurate ba-rometers of traffic congestion in over 200 cities worldwide, the average time lost to traffic in Canada is almost 79 hours per year.57
Canada has approximately 7% of the world’s total renewable freshwater supply. But Canadians are among the highest water users per capita in the world.58 The average Canadian uses about 329 liters of water a day compared to the average resident of Munich, Germany, who uses about 100 liters a day.59
The good news is that mobile and smart phone uptake is high and growing in Canada, opening up further opportunities for citizen empowerment through ICT:
• Mobile phone penetration between 2010 and 2013 increased from 76 to 81 per 100 inhabitants.60
• Smartphones became the mobile device of choice in Canada in 2014. According to the recent report on smartphone penetration by e-marketer, 17.8 million Canadians, over half of the population, used a smartphone in 2014. More than 80% of 18- to 34-year-olds used smartphones in 2014, and by 2018, this is expected to reach 98%.61
• Canada ranks second in the world for hours spent online per person (at 33 hours per month on aver-age per person, 49% of which is attributed to mobile devises.62)
Between 2007 and 2013, ICT sector revenues in Canada increased by nearly 20% to $160 billion63. And Canada’s ICT sector currently represents 5% of its total GDP, accounting for 11.5% of all real GDP growth since 2002.64
In spite of its abundant renewable energy sources, Canada is still struggling with high overall emissions from sources such as transport and heating. Fortunately, there are a number of opportunities across nu-merous sectors where ICT can help Canada achieve sustainable growth.
What ICT could do for Canada by 2030
ICT can play a critical role in Canada in three areas in particular: smart energy, Smart Building sand Smart Mobility.
ICT enabled services have the potential to play a ke y role in achieving Canada’s top environmen-tal priorities.
Our research shows that ICT should be a fundamental part of the response to the challenges set out in the 2013-16 Federal Sustainable Development Strategy (FSDS), particularly with regard to addressing climate change and air pollution and maintaining water quality and availability.
57 Global News (2015), Vancouver remains the most traffic-congested city in Canada
58 Government of Canada (2014), Environment Canada, Water
59 Global News (2015), Canada must start linking water, energy issues: scientist
60 World Bank (2013), Mobile Cellular Subscriptions
61 E-marketer (2015), Over Half of Canada's Population to Use Smartphones in 2015
62 Huffington Post Canada (2014), Mobile Now 49% Of Internet Usage In Canada, comScore Says
63 Government of Canada (2014), Industry Canada, Information and Communications Technologies (ICT)
64Government of Canada (2014), Digital Canada 150, Growing the Information and Communications Technology Industry
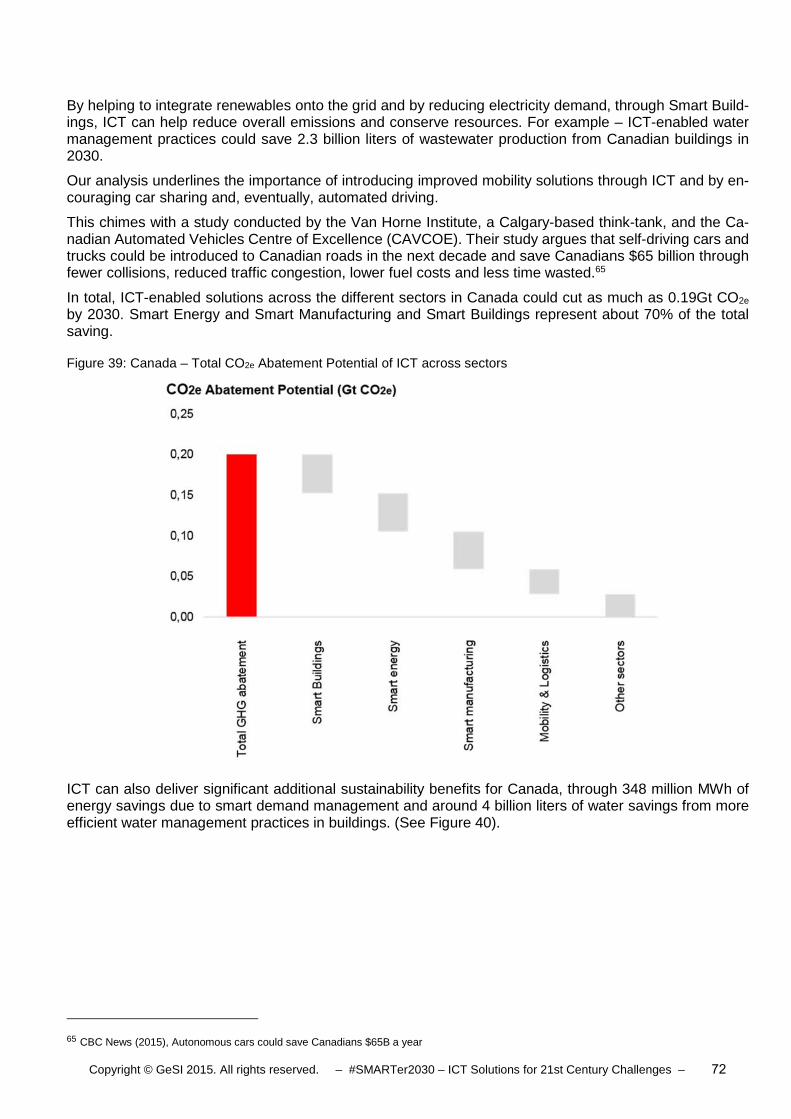
Copyright © GeSI 2015. All rights reserved. – #SMARTer2030 – ICT Solutions for 21st Century Challenges – 72
By helping to integrate renewables onto the grid and by reducing electricity demand, through Smart Build-ings, ICT can help reduce overall emissions and conserve resources. For example – ICT-enabled water management practices could save 2.3 billion liters of wastewater production from Canadian buildings in 2030.
Our analysis underlines the importance of introducing improved mobility solutions through ICT and by en-couraging car sharing and, eventually, automated driving.
This chimes with a study conducted by the Van Horne Institute, a Calgary-based think-tank, and the Ca-nadian Automated Vehicles Centre of Excellence (CAVCOE). Their study argues that self-driving cars and trucks could be introduced to Canadian roads in the next decade and save Canadians $65 billion through fewer collisions, reduced traffic congestion, lower fuel costs and less time wasted.65
In total, ICT-enabled solutions across the different sectors in Canada could cut as much as 0.19Gt CO2e by 2030. Smart Energy and Smart Manufacturing and Smart Buildings represent about 70% of the total saving.
Figure 39: Canada – Total CO2e Abatement Potential of ICT across sectors
ICT can also deliver significant additional sustainability benefits for Canada, through 348 million MWh of energy savings due to smart demand management and around 4 billion liters of water savings from more efficient water management practices in buildings. (See Figure 40).
65 CBC News (2015), Autonomous cars could save Canadians $65B a year

Copyright © GeSI 2015. All rights reserved. – #SMARTer2030 – ICT Solutions for 21st Century Challenges – 73
Figure 40: Canada - ICT can play a significant role in reducing different sector's sustainability impacts
4.4 China
Current Context
China has had a remarkable period of rapid growth in the last two decades and has the largest population of 1.36 billion and the second largest economy in the world with an annual GDP of $11.3 expected for 201566, a role which brings new powers and responsibilities.
As a consequence of its rapid growth, China’s environment has suffered. Among other problems, air pol-lution in China remains a major concern and China’s government has incorporated sustainable develop-ment into its national plan.
Just under half of the Chinese population lives in rural areas, of which, around 38% rely on agriculture as the main source of income and employment. However, the Chinese agricultural sector currently faces major environmental challenges. Use of fertilizers and pesticides are among the highest in the world and water scarcity negatively affects many parts of the country.67
As research by one of China’s leading universities indicates, on average, around 90 out of every 100,000 people living in China are at risk of dying prematurely due to long-term exposure to atmospheric pollutants, like fine dust pollution, which reached record levels in 201368. Beijing's annual bill for traffic congestion, meanwhile, comes in at a staggering 70 billion RMB ($11.3 billion)69.
Figure 41 gives a glimpse of some of the key sustainability issues that China faces. Overall, our work finds that Smart Mobility solutions and Smart Manufacturing solutions taken together could generate around half of the total emissions savings ICT can help China realize.
66 IMF, 2015 forecasts $11.3 trillion of GDP in current USD prices (Status as of May 2015), https://www.imf.org/
67 Guardian (2013), Global threat to food supply as water wells dry up, warns top environment expert
68 Greenpeace (2015), China’s ‘airmageddon’ could cause over 250,000 premature deaths
69 China Daily (2014), Traffic jams cost Beijing $11.3b a year

Copyright © GeSI 2015. All rights reserved. – #SMARTer2030 – ICT Solutions for 21st Century Challenges – 74
Air pollution and water challenges and food safety concerns are some of the most pressing chal-lenges arising from China’s rapid economic growth.
Figure 41: China - Sustainability priorities for China
Between 1990 and 2013, China’s CO2e emissions increased by 312%70. In 2013, smog choked China's northern city of Harbin, forcing schools and highways to close71. Only eight Chinese cities met the country's air quality standards in 2014.72
In 2012, 75% of China’s total electricity generation was coal generated. Wind and hydro-power accounted for 20%.73
Traffic congestion is a prominent problem in Beijing with car traffic increasing by 10% annually and roads being extended by only 2%. Statistics from Beijing’s De-partment of Transport showed that, in 2013, the capital's average daily commute came to one hour and 55 minutes, 25 minutes longer than in 2012.
China is having trouble feeding its 1.36 billion people and tastes and preferences are changing as the nation becomes wealthier, while domestic supplies dwindle. China imported 2.58 million tons of rice in 2014, up 13.6% from a year earlier.74
But our work shows that ICT can play a very important role in helping China grow sustainably.
The annual growth of mobile commerce applications like online shopping, mobile payments and mobile banking is higher than the growth rate of other mobile applications.
• Mobile phone penetration in China has grown impressively from 64.36 to 90.33 phones per 100 peo-ple between 2010 and 2013
• In 2014, 42% of the Chinese population used a smartphone, up from 38% in 2013. With the growth of ICT in the country, this rate is expected to reach 51% by 2018.75 In parallel, internet usage through mobile devices has grown by 11.4% since 2013.
China now has the highest number of internet (621 million) and mobile phone users (859 million) in the world. The number of internet users in China is more than double than that in the United States76, and China has three times more mobile phone users than the US and Russia77.
Despite its rapid growth, though, China still has the second largest number of people living in poverty in the world, with more than 82 million people living below the poverty line of less than $1 a day in 201478. So
70 JRC(2013), Trends in Global CO2 emission
71 BBC (2013), Northern China smog closes schools and airport in Harbin
72 CNN (2015), Cities that meet air standards in China: 8
73 The Shift Project Data Portal (2012), Breakdown of Electricity Generation by Energy Source
74 China Daily (2015), China's rice import rises on market factors: official
75 China Internet Watch (2015), China Smartphone Users to Exceed 700 Mln in 2018
76 Internet World Stats (2013), Top 20 countries with the highest number of internet users
77 Maps of World (2012), Top Ten Countries With Highest Ratio Of Mobile Phone Users
78 International Business Times (2014), China: More than 82 Million People Live Below Poverty Line

Copyright © GeSI 2015. All rights reserved. – #SMARTer2030 – ICT Solutions for 21st Century Challenges – 75
it is imperative that China pursues a sustainable development path that permits the continued lifting of its population out of poverty.
What ICT could do for China by 2030
The four areas where ICT has the biggest potential in China are: Smart Energy, Smart Manufacturing, Smart Agriculture and Smart Mobility solutions.
China’s increasingly urban and middle class population is driving a growing and changing demand for food. ICT can play an increasing role on farms and in the agricultural sector generally to make it more productive and sustainable. For example, we estimate that increased water efficiency brought on by smart water man-agement practices could save around 36 trillion liters of water in 2030. (See Figure 43)
China has the largest manufacturing industry in the world, so Smart Manufacturing, aimed specifically at promoting industry 4.0 technologies in the country under the new strategic program – “Made in China 2025” – is another important area where ICT is fundamental to transforming the Chinese economy.
Finally, China is rethinking its mobility sector by tilting more towards public transport and, therefore, intelli-gent infrastructure and better traffic management will be key in taking as many cars as possible (especially old ones) off Chinese roads by 2030.
Across the eight sectors analyzed we have identified a total CO2e abatement potential of 2.21 Gt CO2e for China by 2030, with smart manufacturing and Smart Mobility contributing more than 50% to that total (see Figure 42).
Figure 42: China – Total CO2e Abatement Potential of ICT across sectors

Copyright © GeSI 2015. All rights reserved. – #SMARTer2030 – ICT Solutions for 21st Century Challenges – 76
Figure 43: China - ICT can play a significant role in reducing different sector's sustainability impacts
ICT-enabled platforms will bring benefits across dif ferent industry sectors by becoming environ-mentally sustainable and economically viable.
4.5 Germany
Current Context
With a Gross Domestic Product of close to $4 trillion79 and a population of 81 million, Germany is the largest national market in the EU. It is also the largest economy in Europe and the fourth largest in the world.80 To maintain its leadership position in the world, there are several sustainability-related priorities it is aiming at.
German energy policy aims to reduce greenhouse gas e missions by 40% by 2020 and 80-95% by 2050. Renewable generation (at 31%) has now surpassed that of coal (26.1%).
In a major policy goal, Germany has committed to phasing out its nuclear generators by 202281 and its energy policy aims to reduce emissions by 40% by 2020 and 80-95% by 2050.82 At 31%, renewable energy generation surpassed that of coal (26.1%) in 2014. Wind energy produces 8.9% of total German energy
79 IMF (2014), GDP in current prices
80 Centre for Economics and Business Research (2014), World Economic League Table 2015
81 Renew Economy (2014), Germany looks to fast-track exit from coal, as well as nuclear
82 The Guardian (2012), German renewable energy drive brings emissions cuts success
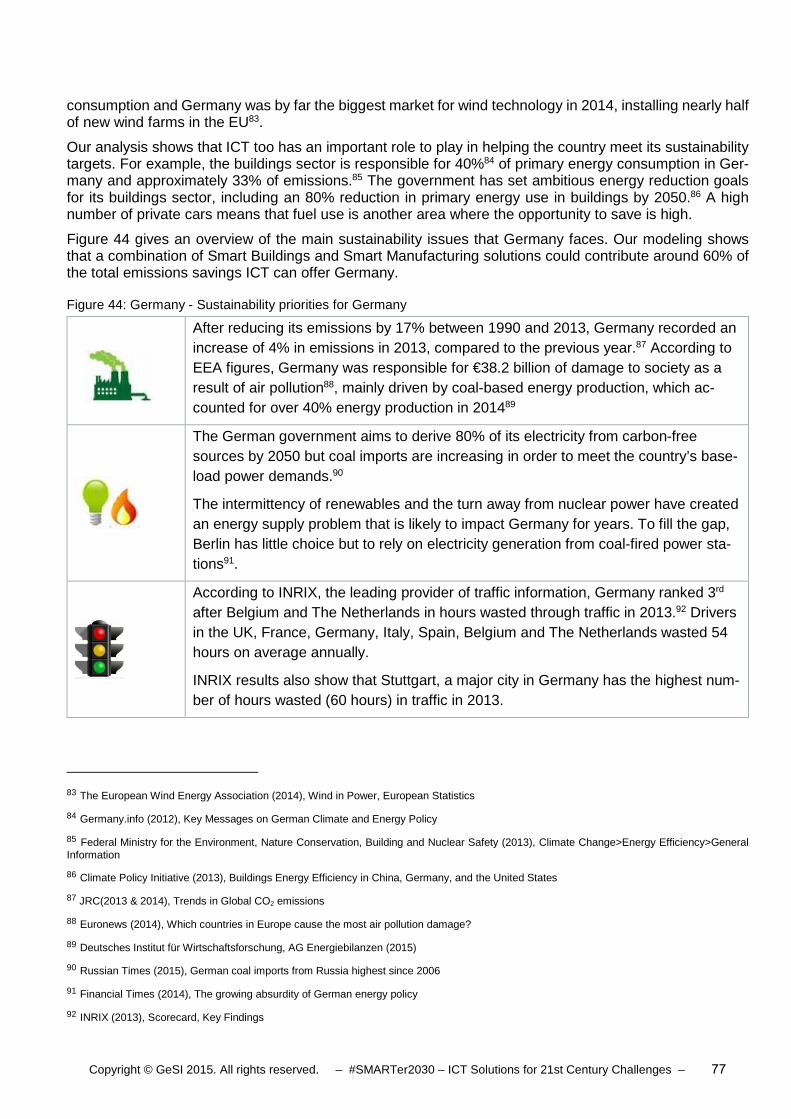
Copyright © GeSI 2015. All rights reserved. – #SMARTer2030 – ICT Solutions for 21st Century Challenges – 77
consumption and Germany was by far the biggest market for wind technology in 2014, installing nearly half of new wind farms in the EU83.
Our analysis shows that ICT too has an important role to play in helping the country meet its sustainability targets. For example, the buildings sector is responsible for 40%84 of primary energy consumption in Ger-many and approximately 33% of emissions.85 The government has set ambitious energy reduction goals for its buildings sector, including an 80% reduction in primary energy use in buildings by 2050.86 A high number of private cars means that fuel use is another area where the opportunity to save is high.
Figure 44 gives an overview of the main sustainability issues that Germany faces. Our modeling shows that a combination of Smart Buildings and Smart Manufacturing solutions could contribute around 60% of the total emissions savings ICT can offer Germany.
Figure 44: Germany - Sustainability priorities for Germany
After reducing its emissions by 17% between 1990 and 2013, Germany recorded an increase of 4% in emissions in 2013, compared to the previous year.87 According to EEA figures, Germany was responsible for €38.2 billion of damage to society as a result of air pollution88, mainly driven by coal-based energy production, which ac-counted for over 40% energy production in 201489
The German government aims to derive 80% of its electricity from carbon-free sources by 2050 but coal imports are increasing in order to meet the country’s base-load power demands.90
The intermittency of renewables and the turn away from nuclear power have created an energy supply problem that is likely to impact Germany for years. To fill the gap, Berlin has little choice but to rely on electricity generation from coal-fired power sta-tions91.
According to INRIX, the leading provider of traffic information, Germany ranked 3rd after Belgium and The Netherlands in hours wasted through traffic in 2013.92 Drivers in the UK, France, Germany, Italy, Spain, Belgium and The Netherlands wasted 54 hours on average annually.
INRIX results also show that Stuttgart, a major city in Germany has the highest num-ber of hours wasted (60 hours) in traffic in 2013.
83 The European Wind Energy Association (2014), Wind in Power, European Statistics
84 Germany.info (2012), Key Messages on German Climate and Energy Policy
85 Federal Ministry for the Environment, Nature Conservation, Building and Nuclear Safety (2013), Climate Change>Energy Efficiency>General Information 86 Climate Policy Initiative (2013), Buildings Energy Efficiency in China, Germany, and the United States
87 JRC(2013 & 2014), Trends in Global CO2 emissions
88 Euronews (2014), Which countries in Europe cause the most air pollution damage?
89 Deutsches Institut für Wirtschaftsforschung, AG Energiebilanzen (2015)
90 Russian Times (2015), German coal imports from Russia highest since 2006
91 Financial Times (2014), The growing absurdity of German energy policy
92 INRIX (2013), Scorecard, Key Findings

Copyright © GeSI 2015. All rights reserved. – #SMARTer2030 – ICT Solutions for 21st Century Challenges – 78
• In terms of mobile phone penetration, Germany has already reached the saturation point with 121 mobile phones per 100 people93
• Smart phones meanwhile are picking up fast with a 50% penetration rate in 2014, up from 41% in 2013. This is expected to reach 80% by 2017.94 In parallel, internet usage through mobile devices has grown to 54% from 40%.
According to a recent survey by the TNS, Infratest and ZEW institutes, some 843,000 people work in the digital sector in Germany.95 In addition, Germany is one of world’s leading exporters of hi-tech products.
While Germany is progressing quickly towards its goals, there are a number of opportunities across sectors where ICT can play even bigger role and help bring transformational solutions for sustainable growth.
What ICT could do for Germany by 2030
The sectors in which ICT could have the greatest impact in Germany are: Smart Energy, Smart Manufac-turing and Smart Mobility.
ICT enabled services have the potential to play a ke y role in achieving Germany’s goal of being a leader in sustainability.
Our analysis demonstrates that ICT is fundamental to realizing “Energiewende” (the energy transformation program), by enabling the full integration of renewables onto the smart grid.
Likewise, Smart Manufacturing could benefit an economy which retains such a strong manufacturing base and connecting Germany to the Internet of Things, or Industry 4.0, is an ICT-driven priority with massive growth potential.
Last but not least, German automotive Original Equipment Manufacturers (OEMs) are improving their mo-bility solutions through ICT by scaling up car sharing solutions and testing fully connected infrastructure with a view to rolling out automated driving.
Across the 8 sectors analyzed we have identified a total CO2e abatement potential of 0.29 Gt CO2e for Germany by 2030, with Smart Manufacturing and smart Building Representing more than 60% of this sav-ing.
93 World Bank (2013), Mobile Cellular Subscriptions
94 Statista (2012), Forecast: smartphone user penetration in Germany 2010-2017
95 The Business Magazine (2013), Digital Germany
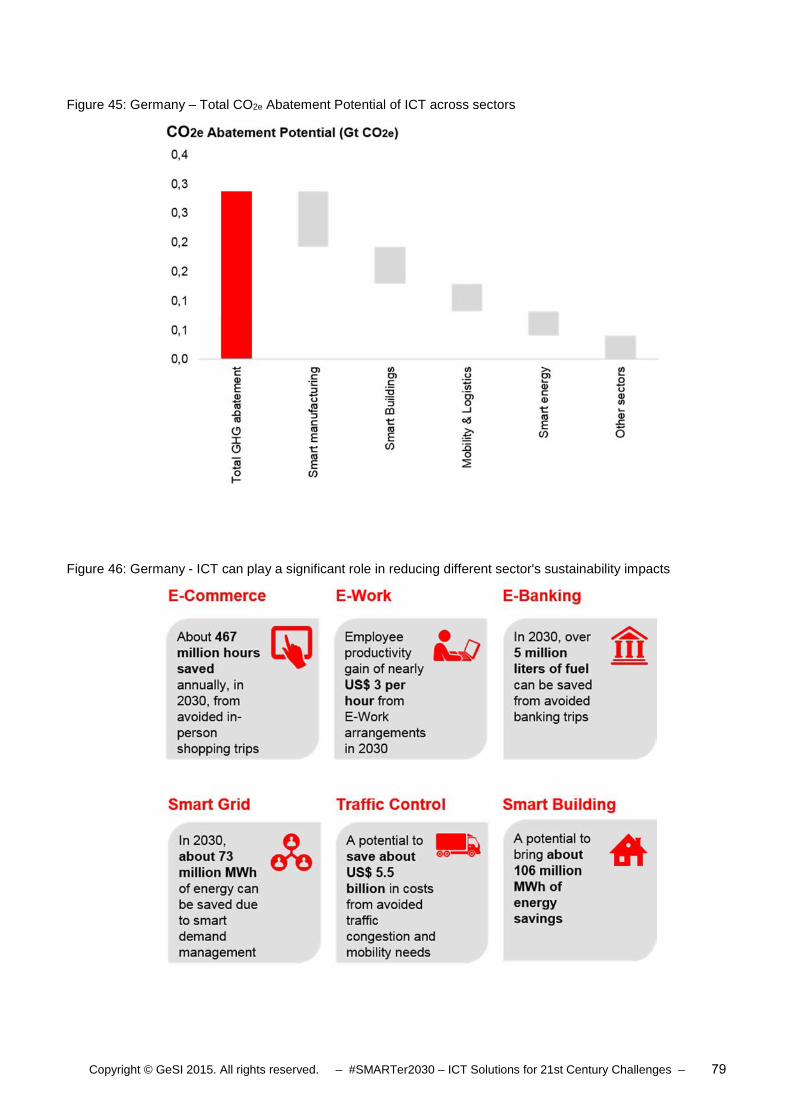
Copyright © GeSI 2015. All rights reserved. – #SMARTer2030 – ICT Solutions for 21st Century Challenges – 79
Figure 45: Germany – Total CO2e Abatement Potential of ICT across sectors
Figure 46: Germany - ICT can play a significant role in reducing different sector's sustainability impacts

Copyright © GeSI 2015. All rights reserved. – #SMARTer2030 – ICT Solutions for 21st Century Challenges – 80
4.6 India
Current Context
As the world’s second most populous country, India is under pressure on all development fronts: creating jobs, producing food, providing infrastructure and mobility, and generating sustainable economic growth to support its citizens. For a population of 1.25 billion and a current per capita GDP of around $1,500, the country needs to adopt the right growth models to do all of this at a massive scale.
From poverty to air quality, India has set ambitious goals to sustain a diverse and growing popu-lation.
Just to sustain its current GDP growth at roughly 5% per year will exert immense pressure on natural and human resources in India. Figure 47 gives an overview of the main sustainability issues that the country faces. Our research found that Smart Buildings and Smart Agriculture solutions offer the biggest potential ICT-enabled emissions savings to India.
Figure 47: India - Sustainability priorities for India
Resources in India are under severe pressure and resource demand will only increase with the population projected to reach 1.47 billion by 2030
Between 1990 and 2012, India’s emissions increased by 198%. This means a greater contribution to climate change96. The World Health Organization has identi-fied 13 Indian cities in the World’s top 50 polluted cities, including both Delhi and Mumbai.
India is the third largest energy consumer in the world, after China and the US, with energy demand still on the rise97. Shortages have led to significant blackouts in the last few years. Additionally, almost a quarter of all energy produced is lost in trans-mission and distribution98.
Infrastructure in India is limited while traffic in the six major Indian cities is growing at a rate four times faster than their populations99. Within 20 years, the average travel speed in major cities is expected to reduce from 17 - 26 km per hour to 6 - 8 km per hour100.
96JRC(2013), Trends in Global CO2 emissions
97Global Energy Statistical Yearbook 2014, Total Energy Consumption in 2013
98India Loses 23% of Power during T&D, Reveals Piyush Goyal: http://www.ibtimes.co.in/india-loses-23-power-during-td-reveals-piyush-goyal-604472 99International Journal of Enterprise Innovation Management Studies(2011), A study on the effective traffic management of roads to reduce road accidents in Tamil Nadu
100Urbanisation in India - 12th Plan (2012 - 2017), http://www.slideshare.net/PlanComIndia/urbanisation-in-india-12th-plan-2012-2017

Copyright © GeSI 2015. All rights reserved. – #SMARTer2030 – ICT Solutions for 21st Century Challenges – 81
Our research shows that ICT can play a very important role in helping India grow sustainably. Among other technologies, mobile connectivity and internet services have already started making significant inroads into the Indian consumer market:
• Nearly 78 out of 100 Indians have at least a basic mobile phone connection101.
• Smart phone penetration reached 13% in 2014 and is expected to reach 70% by 2030.
Progress is set to continue, with ICT expected to become increasingly integrated across sectors and in-dustries. In 2014 alone, India’s IT spend exceeded $71 billion, about 6% higher than forecasted102. This is creating huge potential for jobs growth, with the overall ICT workforce in India coming in at 2.5 million workers103, with around 400,000 ICT postgraduates joining every year104.
What ICT could do for India by 2030
Some of India’s current priorities include working towards job creation, raising literacy levels, providing access to healthcare, introducing more people to mainstream banking and addressing environmental prob-lems.
Providing education to a larger number of children can help raise literacy levels and reduce absolute pov-erty in the long term. E-Learning, the use of ICT in education, can make learning accessible at scale in an affordable way. For institutions, E-Learning could mean a saving of between $150-175 billion as physical resources are freed up for alternative uses. These savings can then be re-invested into the education system.
In India, nationwide access to quality and affordable healthcare and health-related information and educa-tion is still lagging behind. The national healthcare system is struggling with providing access to such ser-vices to a rapidly growing population. ICT, in particular mobile technology, has the potential of making healthcare services and related education accessible in even the most remote areas and affordable to even the lowest income groups. In this effort, it will be critical to expand mobile network coverage to remote rural areas and establish a facilitative policy framework that encourages private sector investment105
Financial inclusion is another key challenge facing India with 55% of the population left without access to formal financial services in 2011106. Currently, only 34% of existing banking services are ICT-enabled and assessable via smart devices. Our research indicates that if the Indian banking sector raised ICT adoption by a quarter between now and 2030, approximately 60-70% of all banking services could be delivered via smarter methods and reach more people. When banking becomes more accessible and more people have access to capital, this can help boost economic growth and quality of life. Indeed, inclusion into mainstream banking via e-banking will mean citizens receive quick and direct access to state-subsidies, capital to start a business, or the ability to send or receive money from abroad.107
Another key challenge in India is the deteriorating air quality, mostly due to road congestion. One of the easiest ways to reduce air pollution is a reduction in miles traveled by road and our research shows that e-Commerce solutions could save 0.07Gt of emissions in India by 2030 by reducing the need for people to travel to stores and shops. Likewise, with the proliferation of smart devices, about 10% of the target popu-lation could benefit from Traffic Control and Optimization platforms. Furthermore, with technologies like
101ASA & Associates LLP (2015), A brief report on Telecom Sector in India
102Gartner Report: http://articles.economictimes.indiatimes.com/2013-10-22/news/43288545_1_software-revenue-peter-sondergaard-gartner
103 KIG 2020 Report, released in 2013
104 Ministry of Human Resource Development, India 105 Mobile Health Report May (2012). http://www.telenor.com/wp-content/uploads/2012/05/BCG-Telenor-MobilE-Health-Report-May-20121.pdf
106 The Socio-Economic Impact of Mobile Financial Services (2011). http://www.telenor.com/wp-content/uploads/2012/03/The-Socio-Economic-Impact-of-Mobile-Financial-Services-BCG-Telenor-Group-2011.pdf 107 The Socio-Economic Impact of Mobile Financial Services (2011). http://www.telenor.com/wp-content/uploads/2012/03/The-Socio-Economic-Impact-of-Mobile-Financial-Services-BCG-Telenor-Group-2011.pdf

Copyright © GeSI 2015. All rights reserved. – #SMARTer2030 – ICT Solutions for 21st Century Challenges – 82
videoconferencing, around a third of all employees in India could be working remotely by 2030, resulting in fewer commutes.
ICT penetration will immensely benefit several indus try sectors by helping them become more ag-ile, responsive and efficient.
When it comes to energy distribution, Smart Grids can help India regulate its energy demand and supply. Today, only 3% of Indian buildings are equipped with smart technology. By 2030, roughly 20% of buildings will have smart metering infrastructure, allowing consumers and business alike to bring down emissions while saving on utility bills.
It is therefore clear that ICT can play a significant role in shaping sustainable growth in India, as the graphic below illustrates.
Figure 48: India – Total CO2e Abatement Potential of ICT across sectors

Copyright © GeSI 2015. All rights reserved. – #SMARTer2030 – ICT Solutions for 21st Century Challenges – 83
Figure 49: India - ICT can play a significant role in reducing different sector's sustainability impacts
4.7 Kenya
Current Context
After independence in 1963, Kenya promoted rapid economic growth through public investment, the rein-forcement of smallholder agricultural production, and incentives for foreign industrial investment.
Kenya's economy grew by 5.4% in 2014 and the economy is set on a path to even faster growth over the next few years108.
Since the dramatic currency depreciation and rapid inflation of 2011, the economy stabilized in 2012 and 2013 with inflation dropping to a single digit. Kenya is now emerging as one of Africa’s key growth centers, poised to become one of the fastest growing economies in East Africa, supported by lower energy costs and high levels of investment in infrastructure, agriculture and manufacturing.109
Agriculture remains the backbone of the Kenyan economy and is central to the Government’s development strategy. With only 8% of arable land and 75% of Kenya's workforce engaged in agriculture, Kenyan farm-ers face growing problems of soil erosion, deforestation, water pollution, and desertification.110
In addition to this, according to IBM’s fourth annual Commuter Pain survey in 2011, Nairobi was the world's fourth-most congested city in the world, far worse than any city in the US111. Kenya's government has estimated that traffic jams cost Nairobi around $600,000 per day in lost productivity and wasted fuel – adding up to $219 million every year.112 Perhaps unsurprisingly, given the importance of the rural economy
108 World Bank (2015), Kenya Overview
109 World Bank (2015), Kenya Emerging as One of East Africa’s Growth Centers
110 The US Government’s Global Hunger & Food Security Initiative (2013), Kenya Fact sheet
111 Forbes (2015), Fixing Traffic Congestion In Kenya: Twende
112 Bloomberg (2014), Traffic Costs Nairobi $570,000 a Day as No. 2 Africa Hub

Copyright © GeSI 2015. All rights reserved. – #SMARTer2030 – ICT Solutions for 21st Century Challenges – 84
to Kenya, our research found that Smart Agriculture solutions alone made up half the potential emissions savings Kenya stands to gain from ICT by 2030.
Annual sustainable yield from forest land in 2012 wa s 30 million m 3, but demand for wood prod-ucts stood at 37 million m 3.
Figure 50: Kenya - Sustainability priorities for Kenya
Nairobi’s population has increased from 350,000 in 1963 to 3.3 million today, with an estimated 700,000 vehicles at last count113 without a corresponding increase in the road network. Typical commute times for people in Nairobi range from 1 to 2 hours for distances of 10-15km.
The congestion problem is adding to numerous air pollution issues and researchers estimate that life expectancies for children in heavily polluted environments have little chance exceeding 50 years114.
The agricultural sector faces problems due to the over reliance on the land to support livelihoods among the largely rural Kenyan population. Annual sustainable yield from forest land in 2012 was 30 million m3. But demand stood at 37 million m3 meaning a deficit of 7 million m3 and leading to decreasing forest cover, fire-wood shortages, in-creased soil and water erosion, and land degradation.115
Over 70% of national energy demand in Kenya is met by wood fuel, and in the rural areas dependence on wood for cooking and lighting is 100%.116
• Kenya’s mobile phone penetration rate has increased impressively from 61 per 100 people in 2010 to 72 per 100 in 2013.117
• The Kenyan ICT sector is growing strongly. In 2012, the International Data Corporation predicted that Kenya’s ICT market would be worth $2 billion in 2015.118 The contribution of the sector to the Kenyan economy increased to 12.1% in 2013 from 8.9% in 2006.119
A major catalyst in the development and expansion of ICT solutions in Kenya has been the liberal-ization of the market, which began in 1999.
A major reason for the expansion of ICT in Kenya has been the liberalization of the market, which began in 1999 when the Kenya Post and Telecommunications Corporation was split into three entities: the Postal Corporation of Kenya, Telkom Kenya Ltd (later privatized) and the Communications Commission of Kenya – the industry regulator.120 The Kenyan government has cited universal access to ICT as a major objective of Vision 2030 – Kenya’s economic blueprint, aimed at propelling Kenya from a developing to a middle-income country in the next 15 years.
113 Bloomberg (2014), http://www.bloomberg.com/news/articles/2014-03-25/nairobi-traffic-loses-570-000-a-day-as-no-2-africa-hub
114 Nairobi News (2015), Air Pollution Now A Threat To Sex Life In Nairobi – Research
115 UNCED (2012), Sustainable Development in Kenya: Stocktaking in the run up to Rio+20
116 J.K. Githiomi, N. Oduor (2012), International Journal of Applied Science and Technology, Strategies for Sustainable Wood fuel Production in Kenya 117 World Bank (2013), Mobile Cellular Subscriptions
118 CIO (2012), IDC, Kenya’s ICT market will be worth $2 billion by 2015
119 IT Web Africa (2014), ICT contribution to Kenya’s GDP hit 12.1% in 2013
120 Ministry of Information Communications and Technology (2014), The Kenya National ICT Masterplan

Copyright © GeSI 2015. All rights reserved. – #SMARTer2030 – ICT Solutions for 21st Century Challenges – 85
Our research indicates that ICT can offer Kenya the opportunity to strengthen economically as well as to improve its productivity by raising the competitiveness of local businesses in a knowledge-based economy.
What ICT could do for Kenya by 2030
Our modeling shows two areas where ICT can benefit Kenya the most: Smart Agriculture and Smart Mo-bility solutions.
With ICT-enabled technological advancements, Kenya c an put in resolute efforts to achieve envi-ronmental sustainability and propel its economic development towards becoming a middle-in-come country in the next 15 years.
More than 40% of Kenya’s 2012 emissions came from transport and ICT can play a leading role in man-aging the emissions from the transport sector as well as reducing traffic congestion in cities like Nairobi through Smart Mobility and logistics solutions.
The government’s goal is for manufacturing to account for 20% of GDP by 2030, nearly twice today’s level. Smart manufacturing, therefore, is another important area where ICT is central to Kenya’s future.
Our findings complement the initiatives being undertaken by Kenya in moving towards climate-Smart Agri-culture and addressing a range of key development issues. ICT can play a significant role, for example, in joining the economic vison to the government’s Climate Change Action Plan (2013– 2017), in which agri-culture is highlighted as a sector with great potential for contributing to a range of development goals from food security, nutrition and poverty reduction to climate change. Agroforestry, conservation, the cultivation of drought tolerant crops, water harvesting and integrated soil fertility management can all increase the productivity from the agricultural sector and conserve natural resources at the same time. For example, owing to increased water efficiency as a result of water management practices, we estimate that around 266 billion liters of water will be saved in 2030. (See Figure 52)
Across the 8 sectors analyzed we have identified a total CO2e abatement potential of 0.025 GtCO2e for Kenya by 2030, with Smart Agriculture representing more than half the total (see Figure 51).
Figure 50: Kenya – Total CO2e Abatement Potential of ICT across sectors

Copyright © GeSI 2015. All rights reserved. – #SMARTer2030 – ICT Solutions for 21st Century Challenges – 86
Figure 51: Kenya - ICT can play a significant role in reducing different sector's sustainability impacts
4.8 United Kingdom
Current Context
The UK, the world’s fifth largest economy and the second largest in Europe, grew by 1.7% in 2013 and saw its per capita GDP rise to a little under $41,800121. While remaining a leading economy, the country is now also focused on well-being metrics, evaluating well-being across ten metrics122. Eight of these, directly or indirectly, depend upon environmental, social or economic sustainability.
Along with economic growth, the UK is also focusing on national well-being metrics.
Access to healthcare, for example, is a pressing issue for an ageing society like the UK’s and access to publically provided health services is difficult for older people, especially the 20% who face mobility chal-lenges. People over 65 years old visit a General Practitioner about seven times a year, so there is a need to make healthcare much more accessible.
From an environmental perspective, emissions have declined by about 20% between 1990 and 2013 and air quality in general has improved. Renewables’ share of electricity generation has also gone up. On the demand side, primary energy consumption in 2013 was the lowest in almost two decades123. However, the transport sector, with a 36% share of emissions, is still the largest consumer of energy in the UK and reducing this should be a priority. Between 1970 and 2012 the energy intensity of road-freight has in-creased by 23%.
From the March 2015 results of the National Well-Being Report it became apparent that some key focus areas like education and human capital have not progressed for 3 years. The number of secondary school students (16-year-olds generally) getting A* to C grades at GCSE exams has remained constant at 58%.
121 World Bank, http://data.worldbank.org/indicator/NY.GDP.PCAP.CD 122 Measuring National Well-being: Life in the UK, 2015: http://www.ons.gov.uk/ons/dcp171766_398059.pdf
123 Energy Consumption in the UK (2014), Department of Energy and Climate Change

Copyright © GeSI 2015. All rights reserved. – #SMARTer2030 – ICT Solutions for 21st Century Challenges – 87
Thus there could be good reason to make education more innovative, customized and available at scale for the labor market to make use of.
For the UK as a whole, our research found that Smart Manufacturing and Smart Buildings offer the UK the largest opportunities to cut its emissions through ICT.
Figure 52: UK - Sustainability priorities for United Kingdom
Making healthcare more accessible, affordable and scalable, especially for seniors and disabled people.
Of the total 53.4 million tons of oil equivalent in the transport sector, road transport has a 74% share. Reduction in total road trips could significantly help bring down the associated pollution and emissions.
Improving the way education is delivered, bringing it to a larger audience and up-skilling the workforce can help the UK increase the value of its human capital.
The UK’s priorities include more affordable access t o healthcare and education.
• In 2013, about 60% of all mobile phone connections in the UK took place via smart phones
• In the same year, almost half the UK population used a smart phone124
What ICT could do for the UK by 2030
We firmly believe that ICT can help the UK chart a path to citizen well-being. By 2030, about 54 million British citizens will be ICT enabled. Their new devices will help them gain access to innovative services in conventional sectors like retail shopping, banking and healthcare.
By 2030, about 54 million British citizens will be I CT enabled.
For instance, smart applications in healthcare can put patients in control of their own healthcare. The same systems can help older people in particular, as they can be accessed in a person’s home at low cost. We estimate that by using technology, almost 20 million British citizens will be able to access healthcare ser-vices through ICT, freeing up over six million m2 of real estate which could be used for commercial or residential purposes.
Like healthcare, Smarter Mobility solutions can help Britons commute less and transport their goods more efficiently. In logistics alone, making use of technology like smart routing and traffic optimization could lead to a saving of over 300 million liters of fuel a year, an annual saving of over $500 billion a year by 2030.
Likewise, in education, ICT-enabled courses, available through the internet, can help customize learning to suit students of all of ages and deliver it at the right pace. By 2030, we estimate that ICT-enabled edu-cation practices could be helping almost 1.5 million E-Learning secondary and higher education students every year in the UK. This could save over $10 billion in 2030 on student expenditure.
The UK could cut about 0.18Gt CO 2e by integrating ICT into its traditional business sectors.
Taken together, these innovations could lead to a huge reduction in UK emissions – as much as 0.18 Gt CO2e every year by 2030.
124 Statista www.statista.com
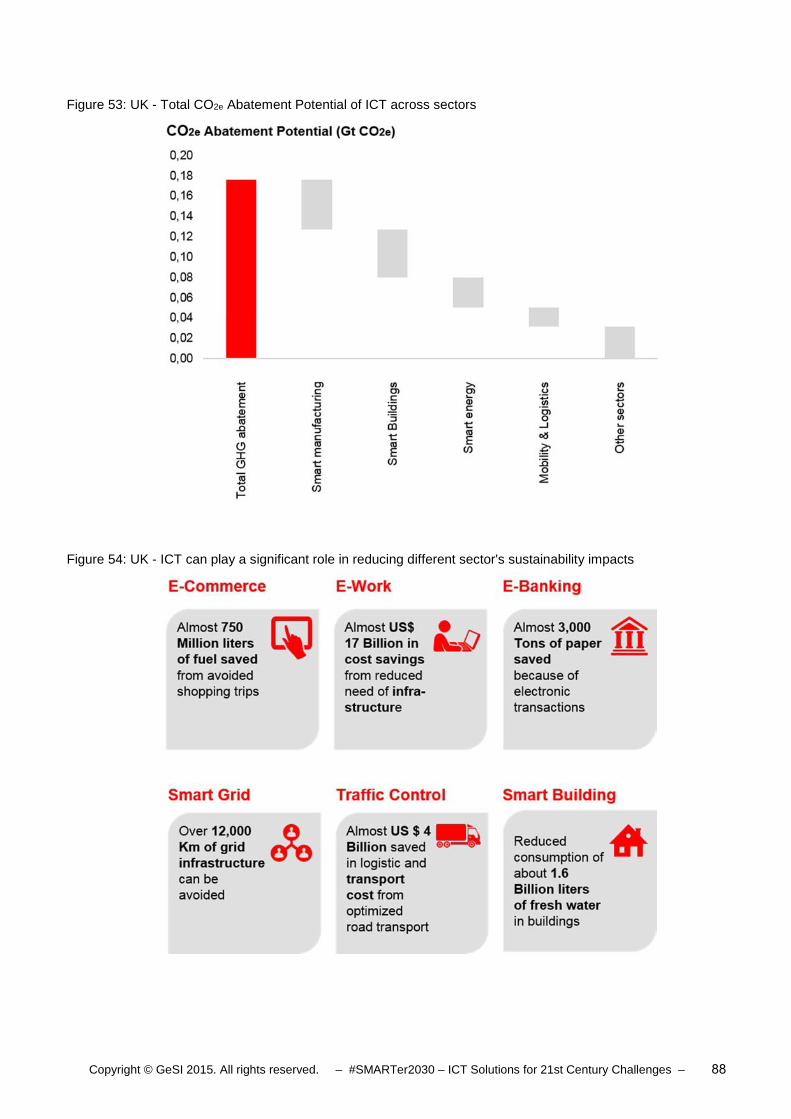
Copyright © GeSI 2015. All rights reserved. – #SMARTer2030 – ICT Solutions for 21st Century Challenges – 88
Figure 53: UK - Total CO2e Abatement Potential of ICT across sectors
Figure 54: UK - ICT can play a significant role in reducing different sector's sustainability impacts

Copyright © GeSI 2015. All rights reserved. – #SMARTer2030 – ICT Solutions for 21st Century Challenges – 89
4.9 United States
Current Context
The USA is the world’s largest economy clocking up an annual GDP of $18 trillion and an expected growth rate of 2.3% in 2015, one of the fastest growth rates in the developed world125.
Resource consumption in the US is generally proporti onate to its economic growth.
From a sustainability perspective, though, the problem with the US economy is that its growth appears to be almost directly proportional to resource intensity. Each time the country grows its economy, its resource-consumption and carbon emissions increase. So, although total emissions actually declined from 2007 to 2009, this was largely due to the drop in US economic production at that time.
Another challenge the US faces is reducing the resource impact of its industrial sector which currently contributes over a fifth of the country’s total emissions, coming third behind energy and transport. These three sectors combined make up almost 80% of US emissions.126
If resource consumption and economic growth are not decoupled in the US, then its economic prosperity will keep on exerting pressure on resources. As the world’s largest economy, what happens in the US, of course, has global implications. Overall, we find that Smart Manufacturing, Smart Energy, Smart Building and Smart Logistics offer the US the largest opportunities to cut its emissions through the use of ICT.
Figure 55: US - Sustainability priorities for United States
The US needs to decouple its growth from resource consumption. Trend analyses show that the country’s emissions have gone down every time the economy con-tracted – and vice versa. From 1990 to 2013, US emissions increased by about 6%.127
Vehicle Miles Traveled (VMT) need to be reduced. As recently as 2013, the total VMT in the US was close to 3 trillion miles, while VMT per capita reduced consistently for a decade to nearly 9400 miles.128
Emissions from US homes and businesses have generally been increasing since 1990. Most of these emissions are from HVAC and Lightning and they are set to in-crease as weather patterns appear to get harsher.
125 The Economist (May 2015)
126 USEPA Sources of GHG Emissions http://www.epa.gov/climatechange/ghgemissions/sources.html#ref2
127 Trends in Global CO2 emissions, 2014, http://edgar.jrc.ec.europa.eu/news_docs/jrc-2014-trends-in-global-co2-emissions-2014-report-93171.pdf
128 US State Smart Transport http://www.ssti.us/2014/02/vmt-drops-ninth-year-dots-taking-notice/

Copyright © GeSI 2015. All rights reserved. – #SMARTer2030 – ICT Solutions for 21st Century Challenges – 90
Figure 56: US - ICT can play a significant role in reducing different sector's sustainability impacts
ICT coverage and accessibility in the US is strong, with already very high internet and computing device penetration. In 2013, over 60% of internet connections took place via smartphone129. With such high pen-etration rates, the rapid adoption of smarter technologies at scale could really help the US save time and resources while reducing pollution.
What ICT could do for the US by 2030
In September 2013, President Obama launched the Advanced Manufacturing Partnership Steering Com-mittee 2.0 (AMP 2.0), a national, cross-sector initiative aimed at securing US leadership in smart manufac-turing technologies. The aim is to create high-tech jobs to drive international competitiveness.
Technology intervention in several business sectors has an abatement potential of almost 1.75 Gt emissions in the US.
By 2030, the uptake of advanced technology in manufacturing could help the US manufacturing industry in numerous ways. Higher productivity from smarter technologies could save between $1.5-2 billion and 600 million MWh.
Likewise, by 2030, ICT interventions in the logistics and transport sectors could help the US cut almost 0.2Gt of emissions a year. This can be done by deploying tools like Machine-to-Machine communication devices, traffic forecasting software, intelligent sensors and connected vehicles. Better management of road freight would also release at least 16 million m2 of warehouse space.
Personal mobility can be made more efficient and connected by technologies like car and ride sharing portals, real-time parking applications, traffic advisory displays and real time speed limits. The combined fuel saving potential of these applications is close to 17 billion liters – made possible by taking 10 million cars off US roads.
129 Neilsen http://www.nielsen.com/us/en/insights/news/2013/mobile-majority--u-s--smartphone-ownership-tops-60-.html
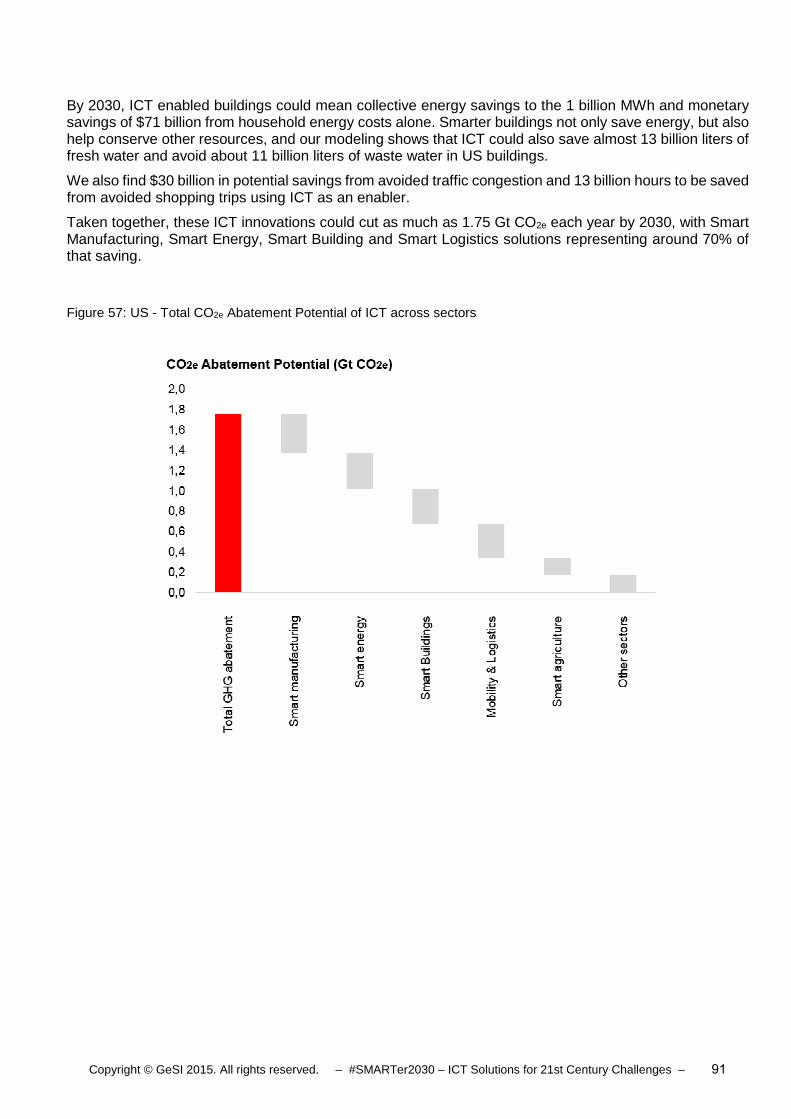
Copyright © GeSI 2015. All rights reserved. – #SMARTer2030 – ICT Solutions for 21st Century Challenges – 91
By 2030, ICT enabled buildings could mean collective energy savings to the 1 billion MWh and monetary savings of $71 billion from household energy costs alone. Smarter buildings not only save energy, but also help conserve other resources, and our modeling shows that ICT could also save almost 13 billion liters of fresh water and avoid about 11 billion liters of waste water in US buildings.
We also find $30 billion in potential savings from avoided traffic congestion and 13 billion hours to be saved from avoided shopping trips using ICT as an enabler.
Taken together, these ICT innovations could cut as much as 1.75 Gt CO2e each year by 2030, with Smart Manufacturing, Smart Energy, Smart Building and Smart Logistics solutions representing around 70% of that saving.
Figure 57: US - Total CO2e Abatement Potential of ICT across sectors

Copyright © GeSI 2015. All rights reserved. – #SMARTer2030 – ICT Solutions for 21st Century Challenges – 92
5 Call to action: There are three stakeholder groups which are the most critical in accelerating ICT adoption
In our final chapter, we examine the role of what we see as the three key stakeholder groups in speeding up the ICT revolution and the roll-out of the solutions we have described in the earlier chapters. As we have set out, the potential benefits of ICT are enormous, for business, for the environment and for society at large. But whether all of these benefits will be realized depends on collective action of key stakeholders going forward.
For us, the vital groups that will decide the rate and extent of ICT adoption, along with the realization of its benefits, are policy makers, business leaders and consumers. Leveraging ICT’s ability to contribute to meeting global sustainability challenges requires shared responsibility and collective action. The following section looks at each of these groups individually, specifying what they stand to gain from ICT, and how they can contribute to realizing its promise.
5.1 Policy makers
The case for policy makers
In 2012, GeSI's SMARTer2020 report showed how the increased use of ICT such as video conferencing and smart building management, could cut global emissions by nearly 17% compared to the 2020 forecast, amounting to $1.9 trillion in gross energy and fuel savings and a reduction of over 9Gt of CO2e. This was the equivalent of more than seven times the ICT sector’s emissions at the time.
In this new report we argue that the scene is set for ICT to be deployed to fully decouple economic growth from carbon intensity and resource use by 2030 and to deliver genuinely sustainable development in a range of sectors and countries across the world.
SMARTer2030 is also the first report of its kind to examine the impact that ICT can have on the economy, society and the environment. Among the many findings in this report, generated from new and comprehen-sive modelling, we have shown that the roll-out of ICT – in the sectors and countries we have examined – could save up to 25 billion barrels of oil, 332 trillion liters of water and 91 million tons of paper. We also see a viable future in which 1.6 billion people have access to ICT-enabled healthcare-services and half a billion have access to e-learning solutions.
Naturally, specific policy requirements to enable these benefits will vary by sector and it is important to take into account the differences between developing, emerging and developed markets. However, across all sectors and markets, there is a clear need for governments around the world to incentivize investments in key ICT infrastructure and to promote a fair, balanced and consistent regulatory approach to ICT that pro-motes innovation and investment, protects intellectual property rights and ensures consumer privacy and security.
Likewise, it is clear that in order to capitalize on the full sustainability potential of ICT, policymakers need to provide the right conditions to ensure that emissions savings from any specific ICT innovation do not lead to rebound effects within the macro-economy, as has been the case in the past.
This report has taken a holistic look at the potential of ICT to meet global development challenges and to enhance development in each of the three areas examined. In order to live up to ICT’s promise, it is es-sential that policymakers take a holistic approach too – and we therefore provide three overall recommen-dations for decision-makers around the world.
1. The need to set clear emissions targets based on levels of economic development
2014 saw global emissions stagnate for the first time ever, outside of economic slowdowns or recessions. This is welcome news, but with global growth expected to continue to pick up this year and beyond, and

Copyright © GeSI 2015. All rights reserved. – #SMARTer2030 – ICT Solutions for 21st Century Challenges – 93
with carbon intensity still too high, we could well expect to see global emissions grow by 2.5% next year130. There is therefore not much to indicate that the world is on course to avoid an average temperature rise of over 2 degrees by 2050, as the IPCC has warned.
Our report has shown that ICT can decouple economic growth from carbon intensity, but the evidence of the past underlines the need for a strong global target regime to keep emissions in check, to incentivize the decarbonization of economic growth and to provide certainty to investors.
We need to see emissions limits set across economies but we must also see detailed sector or technology specific targets (e.g. for fuel efficiency on new cars and buildings, for decarbonizing the energy and transport sectors and to decarbonize the ICT industry itself by 40%, even though its emissions pale by comparison to the amount of emissions savings ICT can unlock).
Importantly, we also need to see the roll-out of a rigorous enforcement and monitoring regime, and we look forward to policymakers defining this at the Paris COP21 meeting in December 2015.
Finally, in order to meet these ambitious goals, we want to see governments leveraging both public funds and private sector finance on investment in low carbon assets, introducing robust and carefully designed carbon pricing and eliminating fossil fuel subsidies.
2. The need to create incentives to invest in broadband infrastructure deployment
There is an overwhelming need to expand the scope of broadband connectivity across the developing world especially. Joined to this, is the imperative of widening access to affordable ICT, and for speeding up mobile penetration in the areas where it is still under 50%. In India, for example, there is a clear need and opportunity to expand broadband to hundreds of millions of people, as smart devices and smart-phones now proliferate among the population. We believe that universal service funds (USF) are a good way to do this.
In order to reap the benefits of e-learning, it is crucial that we step up the global connectivity of schools and libraries, both to increase digital literacy and to drive adoption rates. We also need to improve ICT education itself among young people, so they can contribute to this growing sector and co-create the services they will come to rely on. We also think there is a significant opportunity, and need, to increase the uptake of ICT solutions, and improve digital literacy, among women in the developing world.
To achieve all this, we believe it will become increasingly necessary to reduce the level of taxation on digital devices and even to consider the use of smart subsidies for low income households, to encourage ICT uptake at scale and to empower citizens.
Our overall recommendation is for ICT to form a key part of growth strategies around the world. With coor-dinated uptake at scale, driven by partnerships across borders and sectors, it is likely that many of the technologies discussed above could reach maturity faster than their predecessors. We encourage much further deployment of cross-sector R&D and welcome efforts by international institutions to spur further investment at all stages, but especially at the deployment stage for mature technologies at scale.
3. The need to adopt a fair, balanced and consistent regulatory approach to ICT services
In order to speed up the roll out of ICT globally, it’s essential that the market framework is set to ensure total confidence in the intellectual property regime and the licensing rights for abatement technology. We also believe that more needs to be done to harmonize certification schemes and share best practice as a matter of course.
Regulators need to work more closely with individual business sectors to define internationally recognized ethical and technical standards to ensure trustworthiness in ICT. Data accuracy and security are going to
130 According to PwC’s Low Carbon Economy Index , 2014

Copyright © GeSI 2015. All rights reserved. – #SMARTer2030 – ICT Solutions for 21st Century Challenges – 94
become watchwords of the new economy, especially with regard to e-health solutions and smart grids. So it is essential that further strides are made on cyber-security, data security and privacy.
All governments and institutions need to work to create a regulatory and political framework that firmly addresses current concerns with intellectual property rights protection, the prevalence of software piracy, the efficiency and independence of the judiciary and the efficiency of the law-making process.
Finally, more needs to be done to set up an intellectual properly regime that encourages collaboration on R&D across sectors and borders. We fully expect the number of cross-sector partnerships to rise as best practice is shared and ICT is rolled out at scale and at a faster rate than before. The right regulatory frame-works need to be in place to ensure that this happens as fast and as cost-effectively as possible.
Conclusion
Policymakers have a great opportunity to meet a number of global policy challenges through the enabling role of ICT. ICT can empower citizens, drive economic growth, transform key public services and help decarbonize both developed and developing economies. Governments need to ensure that ICT is deployed specifically in order to meet sustainability challenges as well as to reshape economies and improve quality of life. Our research and our collaboration with partners tells us that on the three issues we have highlighted, more work needs to be done to heighten confidence, simplify regulation across borders and re-commit to legally binding and ambitious sector-by-sector decarbonization targets. If this is coupled to a renewed drive to spur investment in broadband and reduce costs for smart tech then we are convinced that the promise of ICT will be met.
5.2 Business
The case for business
There is a major digital transformation taking place in the global economy, opening up huge opportunities for business growth. The most striking illustration of this is the recent and rapid growth in ICT enabled business models, with companies that are recognizing these early becoming some of the most innovative and successful of recent years.
Since the 2012 publication of SMARTer2020, we have witnessed the remarkable growth of tech-driven and asset-light companies like Uber and AirBnB, as well as the integration of smart solutions into people’s working lives, homes and public services. In both cases, as we have highlighted, the individual is empow-ered through ICT, receiving access to more detailed information that is relevant to their needs, delivered securely, affordably and flexibly. As digital density continues apace, these disruptive trends will be magni-fied. Naturally, some businesses will see this as a challenge and perhaps even as a threat. But we are convinced that the overall benefits to the economy and to business in general are enormous. And that is before we factor in the environmental and social benefits we have modelled.
Our headline figures – derived from thorough modelling and extrapolation we performed across countries and sectors – tell us that the global economy stands to gain $6.5 trillion in revenue from rolling out ICT-enabled solutions, while generating almost $5 trillion in cost savings. The ICT sector itself stands to gain $2 trillion in revenue by 2030, while additional revenue opportunities for other sector stakeholders are expected to amount up to $4.5 trillion.
The key for businesses then – of all sizes, in all parts of the world – is to make sure that they work within and across their sectors and with policymakers to realize this economic potential.
In essence, we believe businesses need to explore the following three priority areas:
1) Explore how ICT-enabled solutions can open up new sources of revenue and growth opportunities for your core business while delivering societal or environmental value
2) Explore the potential of sector-specific cost savings made possible by ICT-enabled solutions and, like-wise, be willing to collaborate and work within your sector and/or adjust your business model to realize them

Copyright © GeSI 2015. All rights reserved. – #SMARTer2030 – ICT Solutions for 21st Century Challenges – 95
3) Commit to bolder action on emissions mitigation within your own organization and explore ways ICT can help you to meet your targets
In what follows we return to our eight sectors, highlighting and emphasizing the commercial benefits ICT can bring to each.
ICT-enabled revenue opportunities and cost savings across sectors
In each of the eight sectors we have identified a huge potential for businesses to gain new revenue and avoid costs by systematically rolling-out practical ICT-enabled solutions.
Exhibit 59 shows our modelling of the revenues to be gained and costs avoided in each of the sectors we have analyzed. In other words, it shows the opportunity ICT can bring to business.
Exhibit 58: Call to Action Business - Potential revenue opportunities and cost savings across sectors
The healthcare sector stands to gain over $200 billion of revenue from rolling out E-Health solutions, while the ICT-sectors could generate $126 billion in additional revenue from wearable tech designed for the remote monitoring of patients and the managing individual health data. Likewise, efficiency gains through smarter logistics, better patient data, freeing up of clinician time and physical resources could save the sector $83 billion.
Our latest research finds that E-Learning could generate more than $0.4 trillion for educational institutions alone and $88 billion for the ICT sector through the sale of enabling E-Learning platforms and technologies. The potential cost savings to the education sector come from expected efficiency improvements, a reduc-tion in travel and the digitalization of learning materials and facilities – freeing up capacity, resources and

Copyright © GeSI 2015. All rights reserved. – #SMARTer2030 – ICT Solutions for 21st Century Challenges – 96
time. In addition, our modelling indicates a reduction in expenditure per pupil of over $2000. Overall growth in the sector is expected to rise almost exponentially as more students gain computer science degrees and access to affordable smart technology.
By 2030, we expect renewable energy companies to generate over $800 billion of revenue through smart energy solutions. ICT companies will also benefit, (with potential revenues of $2.1 billion) from the roll-out of smart grid sensors. The wider energy sector can also generate enormous cost savings through improved grid efficiency and by reducing system redundancy.
In the housing sector, our modeling shows that smart home installations could generate $185 billion of revenue for the energy sector, while revenue gains for ICT companies in providing home connectivity are even higher, at $274 billion. Buildings are still one of the biggest operational expenses for organizations so there are significant incentives to maximize the potential for ICT to reduce costs here. In fact, because of the current wastefulness of many buildings, this is the sector with expected cost savings higher than ex-pected revenues generated from the use of ICT, with potential energy savings of $360 billion annually.
Smart agriculture can increase agricultural productivity while reducing the amount of food wasted across different stages in the supply chain (one third of all food production at a current estimate). This could gen-erate $1.8 trillion of additional revenues for farmers across the world and around $53 billion in revenues from the sale of soil sensors by the ICT industry.
When it comes to mobility , the logistics sector could benefit from smart technologies to the tune of $174 billion. We have also modeled a scenario in which ICT could save businesses and individuals an annual $600 billion in costs associated with cars, including fuel consumption costs.
The trends summarized under e-business (e-commerce, e-work and e-banking) are already transform-ing work, commerce and banking. Workplaces are benefiting from smart collaboration and communication tools like voiceover IP, telecommuting, videoconferencing and augmented reality. By 2030, we expect the companies providing these services to be generating an annual revenue of $7.5 trillion, while saving their customers billions in travel costs.
Lastly, we expect smart manufacturing solutions to create additional revenues of $9.6 billion across all sectors, with the ICT industry expecting to reap revenues of $3 billion from smart industrial machinery.
Call to action: Lead on and encourage others towards bolder action
Business needs to lead by example and to ensure it does what it can under current systemic and compet-itive conditions. However, we recognize that individual businesses can only go so far in realizing the sub-stantial benefits set out in this report. To achieve the full potential ICT presents businesses, we believe cross-sector and multi-stakeholder collaboration will be key.
Businesses should engage with stakeholders within their sector and with policymakers and consumers. However, in our view, these cross-sector collaborations will only be successful if business itself leads by example; going further in order to drive progress. To this end, it is very important that businesses see themselves as part of the low carbon economy and set their own emissions and other environmental tar-gets.
As part of our research, we have surveyed a range of specific recommendations to businesses from a series of business coalitions131.
We therefore set out the following steps we believe businesses need to take to realize the full potential we have modeled in this report:
Emissions Targets:
• Set your own emissions reduction targets, take action to reduce your industry’s emissions in line with the 2 degree target and be transparent about your progress
131 The coalitions we have examined include We Mean Business, Partners of the Business and Climate Summit, and others

Copyright © GeSI 2015. All rights reserved. – #SMARTer2030 – ICT Solutions for 21st Century Challenges – 97
• Integrate internal carbon prices to affect investment decisions and prepare for regulated carbon pricing
Investment:
• Aim to accelerate low carbon investment by the private sector and work with policymakers to ensure that public investment is leveraged in the most effective way possible
• Take action and make investments to increase your energy efficiency and the energy efficiency of your staff
Innovation:
• Switch to 100% procurement of low-carbon electricity • Develop low carbon technology partnerships with other organizations to speed the deployment of
low carbon and breakthrough technologies
Collaboration:
• Collaborate within your sector to reduce emissions in your supply chains and – importantly – in the supply chains of your competitors
• Commit to responsible corporate engagement on climate policy and to aligning your public affairs and sustainability strategies
• Collaborate with peers on low carbon commodity sourcing standards to, for example, eliminate deforestation from their value chains
• Publicly advocate the importance of carbon pricing through policy mechanisms that take into ac-count country-specific conditions
• Engage consumers and provide them with products and services that continue to push the bound-aries of energy efficiency as well as other sustainability advantages
Monitoring and Reporting:
• Publish the carbon footprint of your portfolios and set clear targets to reduce it (with particular rele-vance to investors)
• Enhance existing internal mechanisms by which to improve transparency and accountability in mon-itoring climate ambition and action
5.3 Consumers
The case for consumers
The ICT-enabled technologies outlined in this report could genuinely transform people’s lives for the better. The world is on the brink of a digital revolution, disrupting the status quo at unprecedented scale and speed.
Across the world, we predict that over 2.5 billion additional people will be connected to broadband internet by 2030. A total of 1.6 billion people will have access to E-Healthcare solutions and close to half a billion people will study online through on-demand E-Learning courses. As the cost of smart technology drops, ever more people will be able to share in these benefits, with many of them coming from families which have never had access to quality healthcare or education.
The digital revolution will empower people in three main ways. First, ICT places citizens at the center of the new knowledge economy, providing them with the right tools and information to manage their own lives.
Secondly, ICT has the potential to provide people all over the world with access to essential services such as healthcare, education, banking and mobility. As extreme poverty (people living below $1.25/day) con-tinues to fall, down to 17% today from 52%in 1981, ICT becomes increasingly affordable to more people and, once connected, offers them a variety of opportunities to further boost their income, livelihoods and well-being.
Third, the ICT-enabled world of 2030 envisioned in our research, sees huge time saving opportunities through seamless mobility services, fewer traffic jams, better route planning, and a reduced need to travel

Copyright © GeSI 2015. All rights reserved. – #SMARTer2030 – ICT Solutions for 21st Century Challenges – 98
to work, shops, hospitals or other facilities. Connected traffic networks, improved public transport and the advent of driverless, electric vehicles are expected to contribute to a vastly improved, safer and more effi-cient urban space with significantly reduced pollution levels and faster emergency response times.
But citizens and consumers are not just passive recipients of this. In order to realize the economic, social and environmental benefits and opportunities offered by ICT, consumers have to take an active role. We have identified three main ways in which consumers can contribute to accelerating the adoption of ICT and realizing the associated benefits.
What consumers should do:-
Secure access : The most important thing consumers need is access to reliable broadband infrastructure and they should pressurize their local authorities and national governments to provide it. We have shown here that ICT-enabled devices that provide access to the e-services can save much more money than they cost (as much as four times in fact), but they need to be rolled out at scale. There are obviously huge benefits to governments of widening access to E-Health and E-Leaning opportunities, but citizens need to push for them
Choose digital : Consumer buying decisions and the sustainable use of products and services are im-portant levers to reaching mass adoption of those services. So we encourage consumers to use their pur-chasing power to choose e-services wherever possible. We have set out the huge personal benefits to households in terms of time and money saved from choosing e-services but, to speed up the process, the empowered consumer needs to continue to promote the brands and platforms which provide the best value
Think Digital : Finally, consumers should adopt a mind-set that recognizes the opportunities the digital economy can bring to them and their families. Consumers should be willing to get involved in the innovative approaches to education, healthcare, transport and work that we have laid out. Once consumers realize that they are in the driving seat of the digital economy, they will be better able to reap its benefits. Consum-ers that adopt innovative ICT solutions early can start accelerating this revolution by co-creating products and services themselves. We call this “becoming digital”.
In short, our message to consumers is simple: Be part of the SMARTer2030 story, join us and take action!
Copyright © GeSI 2015. All rights reserved. – #SMARTer2030 – ICT Solutions for 21st Century Challenges – 99
6 Appendix
6.1 Acknowledgements
The Global e-Sustainability Initiative and Accenture Strategy thank the many experts engaged throughout the duration of this effort for generously providing their time, insights, and feedback to strengthen the quality of this report.
SMARTer2030 team:
Alcatel-Lucent: Tom Okrasinski
AT&T: Tim Fleming; Amanda Moore
BT: Gabrielle Ginér; Steve Kelly; Steven Moore; Mark Shackleton; Siân Wynn-Jones
Deutsche Telekom: Andreas Kröhling; Luis Neves
Fujitsu: Hiroko Ioka; Andrew Lewis
Huawei: Anders Andrae; Francisco Da Silva;
ITU: Cristina Bueti; Paolo Gemma
KPN: Marga Blom; Hans de Vries
Microsoft: Helena Castren; Lori Harnick; Joan Krajewski; Michelle Lancaster
Nokia: Hans-Otto Scheck
Telenor: Jan Kristensen
Teliasonera: Dag Lundén; Henrik Weinestedt
Telstra: Caroline Baxter; Pauline Gregg
Verizon: Emily Bosland; Chris Lloyd
Accenture Strategy: Philipp Buddemeier; Lucas Cervera; Iñigo Elorza; Christian Hoffmann; Alexander Holst; Fermín Hurtado Martinez; Caterina Kausch; Justin Keeble; Thomas Krick; Christoph Löffler (Fjord Team); Andy Moore (Fjord Team); Jaime Moreno; Harry Morrison; Edward Robinson (writing support)
Collaborating Centre on Sustainable Consumption and Production (CSCP): Janpeter Beckmann; Yang Deng; Georgina Guillen-Hanson; Cheryl Hicks; Michael Kuhndt; Mariana Nicolau
GeSI: Danaé List; Chiara Venturini

Copyright © GeSI 2015. All rights reserved. – #SMARTer2030 – ICT Solutions for 21st Century Challenges – 100
6.2 Table of Figures Figure 1: CO2e abatement potential by sector (2030) 9
Figure 2: ICT benefits factor in 2020 and 2030 (Gt CO2e) 10
Figure 3: ICT-enabled revenue opportunities (2030) 12
Figure 4: ICT-enabled cost saving opportunities (2030) 12
Figure 5: Environment - CO2e abatement potential by sector (2030) 17
Figure 6: Environment - CO2e abatement potential by use case (2030) 18
Figure 7: Environment - ICT emissions footprint (2030) 19
Figure 8: Environment - ICT enablement factor (2030) 20
Figure 9: Environment - Environmental benefits of ICT beyond CO2e (2030) 20
Figure 10: Economic – Global economic benefits of ICT-enabled solutions (2030) 22
Figure 11: Economic – ICT-enabled revenue opportunities across sectors (2030) 23
Figure 12: Economic –ICT-enabled cost saving opportunities (2030) 23
Figure 13: Economic - Return on investment: Case examples 24
Figure 14: Social – Social benefits of ICT-enabled solutions (2030) 25
Figure 15: Social – Social benefits across sectors 26
Figure 16: Health- Future of E-Health: Technology vision for 2030 30
Figure 17: Health - Benefits from E-Health 33
Figure 18: Learning – Future of E-Learning: Technology Vision for 2030 36
Figure 19: Learning – The Benefits of E-Learning 37
Figure 20: Buildings - Future of Smart Buildings: Technology Vision for 2030 40
Figure 21: Buildings - Benefits of Smart Building 41
Figure 22: Food – Future of Smart Agriculture: Technology Vision for 2030 43
Figure 23: Food - Benefits of Smart Agriculture 45
Figure 24: Mobility - Future of Smart Mobility and Logistics: Technology Vision for 2030 48
Figure 25: Mobility - Benefits of Smart Mobility and Logistics 50
Figure 26: Energy - Future of Smart Energy: Technology Vision for 2030 54
Figure 27: Energy - Benefits from Smart Grid 55
Figure 28: E-Business – Future of E-Work, e-commerce and e-banking: Technology vision for 2030 57
Figure 29: E-Business - Benefits of E-Business 59
Figure 30: Manufacturing - Future of Smart Manufacturing: Technology Vision for 2030 61
Figure 31: Manufacturing - Benefits of Smart Manufacturing 63
Figure 32: Australia - Sustainability priorities for Australia 65
Figure 33: Australia - Total CO2e Abatement Potential of ICT across sectors 66
Figure 34: Australia - ICT can play a significant role in reducing different sector's sustainability impacts 67
Figure 35: Brazil - Sustainability priorities for Brazil 68
Figure 36: Brazil – Total CO2e Abatement Potential of ICT across sectors 69
Figure 37: Brazil - ICT can play a significant role in reducing different sector's sustainability impacts 70
Figure 38: Canada - Sustainability priorities for Canada 70
Figure 39: Canada – Total CO2e Abatement Potential of ICT across sectors 72
Figure 40: Canada - ICT can play a significant role in reducing different sector's sustainability impacts 73
Figure 41: China - Sustainability priorities for China 74
Figure 42: China – Total CO2e Abatement Potential of ICT across sectors 75
Figure 43: China - ICT can play a significant role in reducing different sector's sustainability impacts 76
Figure 44: Germany - Sustainability priorities for Germany 77
Figure 45: Germany – Total CO2e Abatement Potential of ICT across sectors 79
Figure 46: Germany - ICT can play a significant role in reducing different sector's sustainability impacts 79
Figure 47: India - Sustainability priorities for India 80
Figure 48: India – Total CO2e Abatement Potential of ICT across sectors 82
Figure 49: India - ICT can play a significant role in reducing different sector's sustainability impacts 83
Figure 50: Kenya – Total CO2e Abatement Potential of ICT across sectors 85
Figure 51: Kenya - ICT can play a significant role in reducing different sector's sustainability impacts 86
Figure 52: UK - Sustainability priorities for United Kingdom 87

Copyright © GeSI 2015. All rights reserved. – #SMARTer2030 – ICT Solutions for 21st Century Challenges – 101
Figure 53: UK - Total CO2e Abatement Potential of ICT across sectors 88
Figure 54: UK - ICT can play a significant role in reducing different sector's sustainability impacts 88
Figure 55: US - Sustainability priorities for United States 89
Figure 56: US - ICT can play a significant role in reducing different sector's sustainability impacts 90
Figure 57: US - Total CO2e Abatement Potential of ICT across sectors 91
Exhibit 58: Call to Action Business - Potential revenue opportunities and cost savings across sectors 95

Copyright © GeSI 2015. All rights reserved. – #SMARTer2030 – ICT Solutions for 21st Century Challenges – 102
6.3 List of case studies in the report
List of case studies provided in the report
Chapter Case study Company
2.2 Environment Connected Car Deutsche Telekom
Hydropoint AT&T
2.3 Economic Networkfleet Arkansas Verizon
Surrey Police BT
2.4 Social Connecting Communities BT
Emergency.lu Microsoft
3.1 Health Humber NHS Foundation BT
HipLink AT&T
3.2 Learning Skype in the Classroom Microsoft
3.3 Building Enetune-BEMS Fujitsu
Smart Metering Deutsche Telekom
3.4 Food Farm Cloud Computing Fujitsu
Robust Agriculture Fujitsu
3.5 Mobility
BLS Network Fleet Verizon
CityNext Microsoft
Smart Parking BT
3.6 Energy Smart Grid Huawei
eSmart Systems Microsoft
3.7 E-Business Dyanmic Workplace Deutsche Telekom
3.8 Manufacturing Smart inverters PV Huawei
FJVPS Fujitsu

Copyright © GeSI 2015. All rights reserved. – #SMARTer2030 – ICT Solutions for 21st Century Challenges – 103
6.4 Methodology overview
As with any research program looking to produce a viable forecast for a 15 year horizon, our modelling is open to uncertainties and contingencies. We have tried to make our assumptions and the technical and policy requirements on which they rest as clear as possible, both throughout the report and more specifi-cally in this appendix. However, we are fully aware that our scenarios remain only one of a broad range of possible trajectories.
Our modelling uses 3 main variables to produce our estimates, consisting of the input data used, the adop-tion rates expected and the sustainability impact, e.g. in terms of energy efficiency. Each of these main variables is exposed to uncertainties as illustrated below:
• Uncertainties regarding the input data used (e.g., population in 2030, CO2 intensity of electricity in 2030, number of households in 2030, GDP growth up to 2030, etc.)
• Uncertainties regarding the adoption rate of ICT (e.g., how many households will use smart meters and smart appliances in 2030)
• Uncertainties regarding the technology impact (e.g., what are the energy savings enabled by smart grid technologies, smart meters and smart appliances in 2030)
Each variable has a significant impact and together, these 3 main types of uncertainties create a broad range of possible outcomes. Therefore, we encourage caution in reviewing our estimates and emphasize that our estimates reflect just one possible scenario.
We have aimed to be as transparent as possible in explaining our steps, highlighting the challenges and exploring the prospects. We set out these steps throughout the report and also in this methodology appen-dix.
Unit considered to address greenhouse gas emissions abatement
The modelling approach for greenhouse gas abatement has been performed taking into account the cal-culation of equivalent carbon dioxide emissions (also addressed as CO2e). This unit considers, apart from CO2 emissions abatement, the reduction in the emissions of other gases that have a similar green-house effect (and that can be expressed in carbon dioxide equivalent units using a conversion factor), although the majority of the potential emissions abated are carbon dioxide emissions.
The main advantage of using CO2e to calculate the greenhouse gas abatement is the possibility of aggre-gating all the results, being able to express the total impact in one number.
CO2e baseline (Global & ICT)
• Global CO2e baseline o Accenture has included, where feasible, scope 1 (direct), scope 2 (indirect from consumption of
energy), and scope 3 emissions (all others related). Baseline fixed at 63.5 Gt CO2e o IPCC & WRI used as baseline sources
• ICT CO2e baseline
o ICTs included: End-user devices, data centers and networks � End-user devices: PCs, tablets, smartphones, mobiles, 3D printers � Excluded end-user devices: TVs and regular printers
o Other studies132 come up with different results, taking into account different assumptions in energy
consumption and data traffic. 132 Global Electricity Usage of Communication Technology: Trends to 2030

Copyright © GeSI 2015. All rights reserved. – #SMARTer2030 – ICT Solutions for 21st Century Challenges – 104
o How the majority of TVs are used today would not justify including TVs in the ICT emissions base-
line. However, the increase in convergence and the spread of internet enabled TVs increasingly allow TVs to play an enabling role
6.5 Approach to modelling
The Impact Modelling Team (IMT) started modelled ICT’s impact based on a set of twelve use cases (may appear as “UC” in following bullets). The twelve Use Cases considered are listed in Figure 1 of the appen-dix.
• The Use Cases are a combination of ICT technologies that, individually, do not necessarily enable any benefits (and they may not be commonly used alone), but combined can be used to obtain envi-ronmental, social and economic benefits o I.E.: a sensor itself may not enable benefits, but combined with specific software connecting it to
other sensors + management tools (hardware and software) may enable energy savings in buildings
o ICTs that have been considered in the modelling process include, among others: � Smart devices - IoT � M2M: Wi-Fi, 4G � Cloud and data repositories � GPS � Sensors � Management and forecasting software
A full understanding of the technologies included under each Use Case, and the stakeholders involved (either as impact drivers or impacted stakeholders) has been crucial to determine the possible impacts of each Use Case (determine which metrics to calculate in each Use Case and the impact that the Use Case has on them)
o IMT assures a MECE approach (mutually exclusive and collectively exhaustive) to each metric impacted: � All impacts considered are divided, if applicable, in different impact levers that together conform
the full impact on the metric � There is no overlapping between these levers
o Each UC was modelled for the 9 focus countries selected: USA, UK, China, India, Canada, Ger-
many, Brazil, Australia and Kenya , obtaining specific results for each country
o The results from the 9 focus countries were extrapolated to obtain global figures , as we calculated a global impact from these UCs. Extrapolation was done using: � A worldwide country grouping : 4 groups were defined, in which at least two of the focus coun-
tries were included in each group, accounting for similarities in macro criteria � Extrapolation of each Use Case : using use case ad-hoc criteria, a result for each of the four
groups was obtained, and these 4 results were summed up in order to obtain a global ad-hoc result

Copyright © GeSI 2015. All rights reserved. – #SMARTer2030 – ICT Solutions for 21st Century Challenges – 105
Appendix - Figure 1: Use case overview and list of extrapolation criteria used in each Use Case
o Modelling, general information
• A model with modeling results per focus country and the ability for global aggregation was cre-ated
– A model aggregating all Use Case results was developed, with general and Use Case specific elements
– One of the elements refers to Global aggregated cross-Use Case metric, reflecting the resulting amounts per Use Case and the % that supposes each Use Case, the resulting amount per coun-try and the % that supposes each country, and the Global abatement vs Global rest of the world (RoW) abatement
� Reallocation of the CO2e abatement between Use Cases is considered here as well
• One element was created for each Use Case and contains: GHG abatement and % that sup-poses each country, specific and cross metrics of the Use Case and the extrapolation of the 9 countries to the rest of the world
o An additional model was created for calculating the number of additional people connected by 2030 (Connecting the unconnected ):
• Reflects calculations on the additional ICT connections obtained by 2030 , and economic impacts of these. This file consists of three elements:
• "Connecting the unconnected", which calculates the amount of population (per country) that will have ICT access by 2030,
• "ICT revenues", which focuses on additional revenues to be made from new ICT connec-tions, and
• "Calculations – new connections", which shows step by step all assumptions made to reach final figures. To obtain the final number of connecting the unconnected people, we have calculated the average of the four approaches explained in the slides

Copyright © GeSI 2015. All rights reserved. – #SMARTer2030 – ICT Solutions for 21st Century Challenges – 106
o Specific Use Case models
• A model for each Use Case (UC) has been developed, with one element with global results, 9 tabs with focus country details, and 1 element with the extrapolation
• Each model explains how CO2e abatement figures and specific metrics for each of the countries were obtained, including the data, sources, assumptions, and calculations that support it. In some cases, to obtain the result of CO2e abatement and other metrics, one or more change levers could be used for the calculations of the metric impact
• In addition to CO2e abatement, other metrics were calculated (e.g. fuel saved or water saved). Specific metrics for each UC are identified and calculated for each focus country. Some of these metrics will be specific metrics for the UC, while others will be cross Use Case metrics, common in two or more Use Cases (and that will be aggregated in the global aggregation model). An overview of these metrics is provided in Figure 3.
o All Use Case models consisted of the following blocks :
• Part 1 � Lever
� Each change lever information is divided into 3 main categories: Impact areas: refer-ring to the areas that affect the selected metrics (specific for each UC, same for each country in the UC), Change levers: sub category of the previous refers to the direct impact source, and the Baseline and Impact Results: with future estimations by 2030 and potential emission abatement
• Part 2 � Input
� For each UC specific model (same structure for every country), a series of specific UC inputs obtained from IMT research and data received from the Technical Working Group (TWG) has been included
� Combining these inputs (multiplications in most cases) allowed us to obtain the base-line impacted. All models contain comments, sources used, assumptions made and other relevant aspects, such as extrapolation method used
• Part 3 � Impact and adoption rate
� Each UC specific model (same structure for every country), following the “Inputs”, has an input for impact column and an adoption rate column. Input for Impact points out the impact that the Use Case has on the metric analyzed (in %). This % is con-stant between countries, as it corresponds to the Use Case
� 3 adoption rates are shown (2015, 2030 and 2030 BAU+), representing the % of target audience of the use case in each case. Comments concerning assumptions and sources employed are included in each model. Two different adoption rate curves were used: one for OECD countries and another for those Non-OECD coun-tries. Moreover, a more optimistic scenario was calculated for each of the Use Cases (BAU+)

Copyright © GeSI 2015. All rights reserved. – #SMARTer2030 – ICT Solutions for 21st Century Challenges – 107
Appendix - Figure 2: Illustrative calculation tree for one Use Case and country
o Extrapolation model
• Grouping criteria
� All countries worldwide were categorized into 4 groups based on similarities based on 4 macro criteria: GDP per capita, CO2e per capita, number of internet users and energy use. At least 2 of the 9 SMARTer2030 focus countries were included in each of the groups
• Use Case specific extrapolation
� Final extrapolation for each UC has been done taking into account specific criteria related to each case
� The final results from the extrapolation criteria, show the percentages that the focus countries represent in each of the 4 country groups. The results obtained in the modelling exercise is extrapolated using these 4 groups and the weight of the focus countries in each group.
o Metrics, general information : apart from calculating CO2e abatement, the IMT has calculated:
– Global aggregated metrics: obtained adding results from two or more Use Cases – Use Case-specific metrics: specific metrics that are calculated only for one Use Case
An overview of these metrics is provided in Figure 3 of the appendix.

Copyright © GeSI 2015. All rights reserved. – #SMARTer2030 – ICT Solutions for 21st Century Challenges – 108
Appendix - Figure 3: Complete list of additional metrics calculated
� The approach followed for calculating each of the metrics has been either: – Top-down approach : only for connecting the unconnected and revenues from connect-
ing the unconnected – Bottom-up approach : rest of the metrics, calculated in Use Case excel models, from
country level to global level
Environmental metrics
Apart from CO2e abatement, the IMT has calculated the savings of other resources: fuel, energy, water, wood, paper and space . Moreover, some Use Cases additional specific results were obtained, such as the reduction of waste water from Smart Building. A list of the additional environmental benefits calculated is provided in Figure 4 of the appendix.

Copyright © GeSI 2015. All rights reserved. – #SMARTer2030 – ICT Solutions for 21st Century Challenges – 109
Appendix - Figure 4: List of additional environmental metrics calculated
o Oil barrels saved are calculated translating the fuel and energy saved and the energy pro-duced with renewable energy sources into oil barrels required for the production of those re-sources
Social metrics
IMT has also identified social benefits obtained due to growth in the use of ICT.
o Connecting the unconnected:
Four different approaches have been taken The final result is the average of all four approaches People connected as of 2015 estimated in 3.6 billion New connections between 2015 and 2030: 2.5 billion
o E-Learning participants : we have considered participants, not E-Learning degrees, as not all participants will finish their studies
o Hours saved , that may be used in other purposes

Copyright © GeSI 2015. All rights reserved. – #SMARTer2030 – ICT Solutions for 21st Century Challenges – 110
Appendix - Figure 5: List of social metrics calculated
Economic metrics
In addition to environmental and social benefits, ICT could also generate economic benefits. These benefits are divided into:
o ICT sector revenues:
� Revenues from connecting the unconnected , taking into account: • Annual device cost � Smartphone
• Annual expenditure on connection � ARPU
� Other benefits for the ICT sector : to avoid overlapping with connecting the unconnected rev-enues, only Use Case specific ICT revenues are taken into account
o Benefits for specific stakeholders : benefits enabled by the Use Cases related to stakeholders. These benefits can be either cost savings or additional revenues
o Average additional loading rate and average reduction of empty runs (both coming from Smart Logistics), are intermediate results, which led to final results
o Translation of environmental results into economic results , using current prices (2015) of fuel, energy, water and paper
A list of all economic metrics calculated is provided in Figure 6 of the appendix.

Copyright © GeSI 2015. All rights reserved. – #SMARTer2030 – ICT Solutions for 21st Century Challenges – 111
Appendix - Figure 6: List of economic metrics calculated
Double counting avoidance
Double counting of benefits and results has been avoided in all stages of the impact modelling work:
o In the CO 2e baseline (IPCC forecast for global emissions in 2030) : SMARTer2030 avoids double counting of ICT’s abatement opportunity with IPCC’s BAU emissions forecast by ana-lyzing the type of levers considered for the IPCC BAU forecast. Our analysis finds that IPCC has considered abatement from integrating solar and wind energy into the grid. SMARTer2030 has calculated the abatement from integrating wind and solar energy into the grid to amount to 1.8 Gt CO2e in 2030. When we express the total ICT-enabled abatement potential for 2030 we include the 1.8 Gt CO2e to comprehensively describe the full impact of ICT. However, when we express the contribution ICT can make to reduce emissions from IPCC’s BAU forecast we only consider those levers that come on top of IPCC has considered already. After removing the 1.8 Gt abatement from integrating solar and wind energy we find that ICT can reduce IPCCs BAU forecast by 10.3 Gt CO2e in 2030. As a result, ICT can roughly maintain CO2e at expected for 2030 at 2015 levels (IPCC expects an increase of 11.1 Gt and ICT can reduce this by 10.3 Gt)
o Between Use Cases - baseline : the results of the impact of one Use Case can have influence on designing the baseline for other Use Cases
� I.E.: total km set as baseline for the Traffic Control & Optimization and Connected Private Transportation Use Cases, taking into account previous reductions from E-Work, E-Learn-ing, E-Banking, E-Commerce and E-Health, avoiding double counting of abatement � 27% reduction in the total km travelled, which are not included in baseline calculations of some Use Cases
o Between Use Cases – addressable abatement : in some cases, for clarity purposes, the abatement obtained by one of the levers of a Use Case is addressed by another Use Case, integrating the abatement in the most relevant Use Case. To avoid double counting, this result has been always calculated only once.

Copyright © GeSI 2015. All rights reserved. – #SMARTer2030 – ICT Solutions for 21st Century Challenges – 112
� I.E.: the abatement obtained by the reduction of car manufacturing due to the Connected Private Transportation Use Case, has been reallocated under Smart Manufacturing, as this second Use Case aggregates all the abatement potential related to industrial manufacturing processes
o Please refer to the “Additional assumptions” point in each of the Use Cases methodo-logical description for more detail on avoiding overlap
Rebound Effect:
SMARTer2030 modeling team has reviewed the possible impact from rebound effect. The modeling team has made a preliminary assessment of the possible rebound effect based on two approaches: First, using use case-specific rebound data were available based on existing research (e.g., 27% for e-work). Second, using an average rebound effect considered appropriate by various research bodies (e.g., 10%). We have considered the following rebound effects:
� Potential rebound effect for E-Work: 27,4%133 � Potential rebound effect for Smart Logistics: 20%134 � Potential rebound effect for E-Health, E-commerce, E-Banking, E-Learning and Connected
Private Transportation: 7%135 � Potential rebound effect for Smart Agriculture, Smart Manufacturing, Smart Energy, Smart
Building and Traffic Control & optimization: 10%136 Overall, the result is a possible rebound effect of 1.4 Gt CO2e in 2030 (see figure below).
Appendix - Figure 7: Rebound effect per use case
133 http://www.diva-portal.org/smash/get/diva2:742058/FULLTEXT01.pdf
134 “The future impact of ICTs on environmental sustainability”, Institute for Prospective Technological Studies, in collaboration with the European Commission
135 “The future impact of ICTs on environmental sustainability”, Institute for Prospective Technological Studies, in collaboration with the European Commission
136 “Rebound Effect, real but not very large”,ACEEE and “Energy efficiency mandates have rebound effect”, Institute for Energy Research
Smart energy, smart logistics and smart manufacturing represent almost half of the rebound effect
Smart Manufacturing
20%
Smart Agriculture
15%
Smart Building
14%Smart Energy
13%
Smart Logistics
18%
Traffic Control6%
Connected Transp.3%
E-Work8%
E-Commerce2%
E-Health1%
E-Learning0% E-Banking
0%
GHG abatement potential
Rebound effectFinal GHG
abatement potential
Smart Manufacturing 2.44 Gt.2.71 Gt. 0.27 Gt.
Smart Agriculture 1.82 Gt.2.02 Gt. 0.20 Gt.
Smart Building 1.77 Gt.1.96 Gt. 0.20 Gt.
Smart Energy 1.63 Gt.1.81 Gt. 0.18 Gt.
Smart Logistics 1.01 Gt.1.26 Gt. 0.25Gt.
Traffic Control & Optm. 0.69 Gt.0.77 Gt. 0.08 Gt.
Connected Private Trans. 0.53 Gt.0.57 Gt. 0.04 Gt.
E-Work 0.29 Gt.0.40 Gt. 0.11 Gt.
E-Commerce 0.28 Gt.0.31 Gt. 0.02 Gt.
E-Health 0.19 Gt.0.20 Gt. 0.01 Gt.
E-Learning 0.07 Gt.0.07 Gt. 0.005 Gt.
E-Banking 0.003 Gt.0.003 Gt. 0.0002 Gt.
Rebound effect distribution
TOTAL ABATEMENT 10.71 Gt.12.08 Gt. 1.37 Gt.
Source: Accenture GHG models, NTNU, Institute of Prospective Technologies, ACEEE, IER

Copyright © GeSI 2015. All rights reserved. – #SMARTer2030 – ICT Solutions for 21st Century Challenges – 113
However, the rebound effect was not deducted from the total ICT-enabled potential for two reasons: First, the science behind rebound is generally tricky and a matter of debate. Second, neither SMART2020 nor SMARTer2020 calculated expected rebound effect
Topic 1: Health � E-Health
o Understanding : the main outcome from the E-Health Use Case is telepresence leading to a reduction in travel, use of healthcare facilities and associated CO2e abatement.
o Adoption rate : two adoption rate scenarios are considered, differentiating between OECD countries and non-OECD countries
� For OECD countries , according to Gartner Hype Cycle for telepresence, current adoption is 5%. In 2030, and in line with the information provided by this hype cycle, the adoption of E-Health could reach 75%
� For non-OECD countries , Gartner Hype Cycle for telepresence has been taken into ac-count too, but the expected adoption was reduced (5% in 2015, 65% in 2030). This is due to countries being less ready to implement all the necessary advances included in this Use Case (economic limitations and/or social readiness)
o Environmental results
CO2e abatement: • LEVER 1: Travel to healthcare facilities will be reduced, as doctors can remotely in-
teract with patients. Less travel means less fuel consumption from transportation, re-sulting in fewer CO2e emissions
• LEVER 2: As fewer people will go to healthcare facilities, less infrastructure will be required, reducing the number of healthcare facilities and the subsequent CO2e emis-sions of these facilities (mainly coming from specific electronic devices used for med-ical purposes, which are very energy intensive)
Lever Total abate-ment
Abatement distribution
(% of total abatement, may differ between
countries))
Maximum impact from 2030 technology
Fall in transport use
0.20 Gt CO2e 1.9%
37%
This impact comes from multiplying two assumptions:
1- US Government (likely to be representative of OECD
countries,http://www.healthit.gov/sites/de-
fault/files/oncdatabrief16.pdf) , 94% of hospitals and
healthcare facilities have certified EHRs
2- According to Accenture Analysis, 40% of attendances
correspond to outpatient attendances and simple que-
ries, which are attendances that can be replaced by
telepresence.

Copyright © GeSI 2015. All rights reserved. – #SMARTer2030 – ICT Solutions for 21st Century Challenges – 114
Less usage of healthcare fa-
cilities 98.1%
36%
This impact comes from multiplying two assumptions:
1- This calculation represents the reduction in number of
outpatient attendances from previous line (38%)
2- Assumption: if 33% fewer outpatient attendances are
made, 95% of the required space for those is not
needed. However 5% of surface will be common for
other usages. Expected impact is only applicable to those that adopt this Use Case
Adoption rate by 2030 in OECD countries: 75%
Adoption rate by 2030 in non-OECD countries: 65%
Space released : As fewer people will go to healthcare facilities, less infrastructure will be required, reducing the number of healthcare facilities, releasing these spaces for other purposes
Fuel saved : Transportation to healthcare facilities will be reduced, as doctors can attend to patients remotely, avoiding the need to travel. Less transportation means less fuel con-sumed by vehicles
o Economic results
N/A
o Social results
E-Health beneficiaries : E-Health beneficiaries are the number of people who will be using ICTs to obtain any (partial or total) health assistance
o Additional assumptions
Double counting avoided by removing the space saved from e-health facilities from the total square meters we are looking at in Smart building
Topic 2: Learning � E-Learning
o Understanding
The main outcome from the E-Learning Use Case is the potential reduction in transport use, as students/participants will attend classes online (from their houses or remote locations). Less transportation means less fuel consumption, which leads to less emissions.
Moreover, more people will have access to learning facilities due to E-Learning and learning participants as well as governments will have cost savings from delivering learning at a lower cost point. Additionally, paper will be saved due to use of E-Books.
o Adoption rate : two adoption rate scenarios are considered, differentiating OECD countries and non-OECD countries
For OECD countries , according to Gartner Hype Cycle for education, current adoption is 5%. In 2030, and in line with the information provided by this hype cycle, the adoption of E-Learning could 65%

Copyright © GeSI 2015. All rights reserved. – #SMARTer2030 – ICT Solutions for 21st Century Challenges – 115
For non-OECD countries , Gartner Hype Cycle for education has been taken into account too, but reducing the expected adoption (5% in 2015, 35% in 2030). This is due to countries being less ready to implement all the necessary advances included under this Use Case (economic limitations and/or social readiness)
o Environmental results
CO2e abatement • LEVER 1: Fall in transport use in secondary education
• LEVER 2: Fall in transport use in higher education
• LEVER 3: Fall in transport use company training
• In all cases, it’s a fall in transportation needed, as students/participants will attend classes online (from their houses or remote locations). Less transportation means less fuel consumption by vehicle, which leads to fewer CO2e emissions
Lever Total abatement
Abatement distribution
(% of total abatement, may differ between
countries)
Maximum impact from 2030 technology
Fall in transport use secondary
education
0.07 Gt CO2e
5.2%
30%
According to team analysis, those students who adopt E-Learning will travel 30% less, due to reducing the number of km traveled for learning purposes, since students will attend lessons re-motely. Attendance to learning centers for exams and possible tutorials is taken into account
Fall in transport use higher edu-
cation 34.8%
30%
According to team analysis, those students who adopt E-Learning will travel 30% less, due to reducing the number of km traveled for learning purposes, since students will attend lessons re-motely. Attendance to learning centers for exams and possible tutorials is taken into account
Fall in transport use company
training 60%
30%
According to team analysis, those students who adopt E-Learning will travel 30% less, due to reducing the number of km traveled for learning purposes, since students will attend lessons re-motely. Attendance to learning centers for exams and possible tutorials is taken into account
Expected impact is only applicable to those that adopt this Use Case
Adoption rate by 2030 in OECD countries: 65%
Adoption rate by 2030 in non-OECD countries: 35%
Paper saved : The use of electronic devices and online materials will help reducing the usage of paper
Fuel saved : This Use Case leads to a fall in transportation needed, as students/participants will attend classes online (from their houses or remote locations). Less transportation means less fuel consumed by vehicles
o Economic results

Copyright © GeSI 2015. All rights reserved. – #SMARTer2030 – ICT Solutions for 21st Century Challenges – 116
Cost savings : E-Learning participants will require a lower expense per student (enrolment and tuition fees are lower in online courses, as a result of being able to have more people attending the same class. These cost savings are realized by learning participants and/or government, but the share depends on the split of costs between private and public sector
o Social results
E-Learning participants: E-Learning will allow increased access to school/university, among others, to those who live in remote areas or far from the learning facilities
o Additional assumptions
N/A
Topic 3: Energy � Smart Energy
o Understanding
The main outcome from the Smart Energy Use Case is the potential reduction in energy pro-duction, due to energy management systems, the increase and integration of renewable energy to the grid and the improvement of the efficiency of the grid, avoiding loss of the energy already produced. All of these, can lead to associated CO2e emission abatement.
Moreover, energy and grid infrastructure can be saved as a result of energy management sys-tems.
o Adoption rate : two adoption rate scenarios are considered, differentiating between OECD countries and non-OECD countries.
For OECD countries , according to Gartner Hype Cycle for energy management systems, current adoption is 5%. In 2030, and in line with the information provided by this hype cycle, the adoption of E-Health could reach 30%
For non-OECD countries , Gartner Hype Cycle for energy management system has been taken into account too, but reducing the expected adoption (1% in 2015, 15% in 2030). This is due to countries being less ready to implement all the necessary advances included under this Use Case (economic limitations and/or social readiness)
o Environmental results
CO2e abatement
• LEVER 1: Reduction in energy production as a result of ICT-enabled and more effi-cient demand management, reducing the amount of energy that is wasted (because it won’t be used). Less energy produced leads to fewer CO2e emissions.
• LEVER 2: Renewable energy production, as the energy produced with these technol-ogies doesn’t have any direct related CO2e emissions
• LEVER 3: Reduction in transportation/distribution grid losses, which accounts for 6% of the energy transported. Energy will be more efficiently distributed between closer points

Copyright © GeSI 2015. All rights reserved. – #SMARTer2030 – ICT Solutions for 21st Century Challenges – 117
Lever Total abatement
Abatement distribution
(% of total abatement, may differ between
countries)
Maximum impact from 2030 technology
Decrease in en-ergy production
1.61 GT CO2e
42.4%
20%
According to team analysis, energy production can be reduced by 20%. This is possible due to ICT enabled capacities such as smart metering which will allow better demand management, re-ducing the gap between supply and demand. Additionally, less energy will be required thanks to changes in personal behavior and more efficient devices
Decrease in en-ergy lost
0.64%
5%
According to team analysis energy lost can be reduced by 5% due to new material that will provide superconductivity capacities and energy storage, reducing the energy lost during the distribu-tion among households and industries.
Expected impact is only applicable to those that adopt this Use Cas e
Adoption rate by 2030 in OECD countries: 30%
Adoption rate by 2030 in non-OECD countries: 15%
Additional lever: Increase in renewable energy share: +1.77 Gt CO 2e
Resulting from considering the growth of the share of renewable energies in the energy mix. As energy produced with from renewable sources doesn’t produce any emissions, the subsequent emissions that would have been produced by traditional energy sources are abated.
This impact is considered as the decarbonization from improved integration of renewable energies in the grid as a result of using ICT. According to IRENA (International Renewable Energy Agency), renewable energy share will achieve different % according to each country framework (i.e., 28% in AUS by 2030). Due to renewable energy production, emissions will be reduced in the same amount (24%) (http://www.irena.org/remap/REmap_Report_June_2014.pdf), taking into account where Smart Energy has been adopted.
Not all the abatement obtained by the inclusion of renewable energies in the energy mix is considered to be ICT related. Only where ICT is adopted, is where this integration to the energy mix is enhanced, and were this abatement is obtained
Energy saved : Less energy will be needed due to more efficient supply/demand manage-ment, reducing the existing gap between energy produced and energy demanded.
o Economic results
• Grid saved: As energy will be produced, allocated and distributed to the closest cit-ies/villages/provinces, the grid needed to transport this energy will be reduced
o Social results
N/A
o Additional assumptions
• First lever, decrease in energy production (1.57 Gt CO2e), has been reclassified among Smart Building and Smart Manufacturing, as mayor energy consuming sectors (75% and 25%, respectively)
• In the CO2e baseline (IPCC forecast for global emissions in 2030): SMARTer2030 avoids double counting of ICT’s abatement opportunity with IPCC’s BAU emissions forecast by analyzing the type of levers considered for the IPCC BAU forecast. Our analysis finds that IPCC has considered abatement from integrating solar and wind

Copyright © GeSI 2015. All rights reserved. – #SMARTer2030 – ICT Solutions for 21st Century Challenges – 118
energy into the grid. SMARTer2030 has calculated the abatement from integrating wind and solar energy into the grid to amount to 1.8 Gt CO2e in 2030. When we ex-press the total ICT-enabled abatement potential for 2030 we include the 1.8 Gt CO2e to comprehensively describe the full impact of ICT. However, when we express the contribution ICT can make to reduce emissions from IPCC’s BAU forecast we only consider those levers that come on top of IPCC has considered already. After remov-ing the 1.8 Gt abatement from integrating solar and wind energy we find that ICT can reduce IPCCs BAU forecast by 10.3 Gt CO2e in 2030. As a result, ICT can roughly maintain CO2e at expected for 2030 at 2015 levels (IPCC expects an increase of 11.1 Gt and ICT can reduce this by 10.3 Gt)
Topic 4: Food � Smart Agriculture
o Understanding
The main outcome from the Smart Agriculture Use Case is a potential reduction in CO2e emis-sions coming from these areas: energy related reduction and a better usage of resources (fer-mentation and manure management) and other sources, such as, rice cultivation and fertilizers use, leading to the subsequent CO2e abatement of associated emissions.
Moreover, the productivity of the farmer and crop yield will increase due to ICT-enabled preci-sion farming techniques. Additionally, water, energy and associated costs will be saved due to the use of smart sensors and data analytics.
o Adoption rate: two adoption rate scenarios are considered, differentiating between OECD countries and non-OECD countries
For OECD countries , according to the team’s analysis, current adoption is 30%. In 2030, and in line with the research done, the adoption of Smart Agriculture could reach 75%
For non-OECD countries , team analysis resulted in a reduction of the expected adoption (10% in 2015, 45% in 2030). This is due to countries being less ready to implement all the necessary advances included under this Use Case (economic limitations and/or social readiness)
o Environmental results
CO2e abatement • LEVER 1: Fall in energy use as a result of using sensors that enable the farmer to
have better control of machinery and the energy used in the farm
• LEVER 2: Resource efficiency in the usage of fertilizers, thanks to sensors that provide the farmer, via GPS, with better knowledge of the conditions for farming activity, re-ducing the application of fertilizers when not needed
• LEVER 3: Resource efficiency in enteric fermentation as farmers will be able to mon-itor livestock food available and diet, adapting it to appropriate products and quantities to meet animal's requirements while reducing emissions
• LEVER 4: Resource efficiency in manure management thanks to sensors that provide via GPS to the farmer better knowledge of the conditions for farming activity, letting the farmer dispose manure when not needed in an appropriate manner
• LEVER 5: Resource efficiency in rice cultivation as farmers will be able to control the concentration of methanotrophs (prokaryotes that are able to metabolize methane as their only source of carbon and energy) in the waterbed needed for rice cultivations, thanks to information from sensors deployed.

Copyright © GeSI 2015. All rights reserved. – #SMARTer2030 – ICT Solutions for 21st Century Challenges – 119
• LEVER 6: Food waste, as Smart Agriculture will enable a better production manage-ment and enhanced transparency within the supply chain, reducing the food that is lost and not consumed consequently reducing associated emissions.
Lever Total abatement
Abatement distribution
(% of total abatement, may differ between
countries)
Maximum impact from 2030 technology
Energy effi-ciency
2.02 Gt CO2e
14.6%
65%
According to team analysis, smart agriculture will provide a 65% reduction in the energy used in agriculture
Fertilizers used 6.3%
65%
According to team analysis, smart agriculture will provide a 65% reduction in the use of fertilizers due to better knowledge of soil conditions that sensors will provide via GPS to the farmer, reduc-ing unnecessary application of fertilizers.
Enteric fermen-tation
35.7%
65%
According to team analysis, smart agriculture will provide a 65% reduction in the emissions from enteric fermentation, as farmers will be able to monitor livestock food and diet, adapting it to ap-propriate products and quantities to meet animal's requirements while reducing emissions.
Manure man-agement
10.1%
50%
According to team analysis, smart agriculture will provide a 50% reduction in the emissions from manure mgmt., due to better knowledge of soil conditions that sensors will provide via GPS to the farmer, allowing the farmer to avoid unnecessary application of manure.
Rice cultivation 5.6%
40%
According to team analysis, smart agriculture will provide a 40% reduction in the emissions from rice cultivation, as farmers will be able to control the concentration of methanotrophs (prokaryotes that are able to metabolize methane as their only source of car-bon and energy) in the waterbed needed for rice cultivations, thanks to information from sensors deployed.
Food waste 27.7%
20%
1/3 of all the food produced globally is wasted, and the impact of ICT reducing this share has been taken into account.
The impact that Smart Agriculture will achieve in avoiding food waste is a reduction of 20%, due to better production manage-ment and connection and transparency within the supply chain. The abatement potential is in line with this food waste reduction, resulting in a 20% CO2e abatement potential where Smart Agri-culture is adopted
Expected impact is only applicable to those that adopt this Use Case
Adoption rate by 2030 in OECD countries: 75%
Adoption rate by 2030 in non-OECD countries: 45%

Copyright © GeSI 2015. All rights reserved. – #SMARTer2030 – ICT Solutions for 21st Century Challenges – 120
Energy saved 137: Less energy will be needed due to sensors that enable the farmer to have better machinery management and reduce the energy used in the farm
Water saved: Decrease in water usage as a result of humidity soil sensors that, via GPS, provide the farmer with information on land water requirements
o Economic results
Yield increase : Increased productivity of the land as a result of a better management of soil conditions, knowledge of the requirements to help maximize production and the control of pests and diseases
Cost savings: Decrease of water usage, thanks to humidity soil sensors that, via GPS, pro-vide the farmer with information on land water requirements
Employee productivity: Increased farmer productivity (income) due to better management of land activity and production
o Social results
N/A
o Additional assumptions
N/A
Topic 5: Building � Smart Building
o Understanding
The main outcome from the Smart Building Use Case is the potential reduction in energy use at building end-user level as a result of smart metering and intelligent energy management, leading to associated CO2e emissions and cost savings from reduced energy consumption.
Moreover, ICT can help reduce water consumption from buildings and reduce waste water generated.
o Adoption rate: two adoption rate scenarios are considered, differentiating between OECD countries and non-OECD countries
For OECD countries , according to Gartner Hype Cycle for smart metering infrastructure, and supported by Accenture SMEs interviewed, current adoption is 5%. In 2030, and in line with the information provided by this hype cycle, the adoption of smart building could reach 30%
For non-OECD countries , according to Gartner Hype Cycle for smart metering infrastructure, and supported by Accenture SMEs interviewed, the expected adoption is reduced (2.5% in 2015, 20% in 2030). This is due to countries being less ready to implement all the nec-essary advances included under this Use Case (economic limitations and/or social readi-ness)
o Environmental results
CO2e abatement
137 Energy saved considers savings in electricity and fuel, but as the majority of it is allocated under electricity, only MWh of energy savings are considered

Copyright © GeSI 2015. All rights reserved. – #SMARTer2030 – ICT Solutions for 21st Century Challenges – 121
• LEVER 1: Reduction in the energy consumption from households
• LEVER 2: Reduction in the energy consumption from commercial buildings
Lever Total abatement
Abatement distribution
(% of total abatement, may differ between
countries)
Maximum impact from 2030 technology
Reduction in the energy con-
sumption from households
0.78 Gt CO2e
52%
40%
Existing research (Accenture Analysis Study on Smart Building, http://www.accenture.com/SiteCollectionDocuments/PDF/Ac-centure-Smart-Building-Solutions-Brochure.pdf) estimates a maximum reduction of 40% of CO2e emissions from house-holds’ consumption and 45% from commercial building con-sumption as a result of better energy management, automatic default, building supervision & control and the implementation of operational guidelines
Reduction in the energy con-
sumption from commercial
building
48%
45%
Existing research (Accenture Analysis Study on Smart Building, http://www.accenture.com/SiteCollectionDocuments/PDF/Ac-centure-Smart-Building-Solutions-Brochure.pdf) estimates a maximum reduction of 40% of CO2e emissions from house-holds’ consumption and 45% from commercial building con-sumption as a result of better energy management, automatic default, building supervision & control and the implementation of operational guidelines
Expected impact is only applicable to those that adopt this Use Case
Adoption rate by 2030 in OECD countries: 30%
Adoption rate by 2030 in non-OECD countries: 20%
Waste water reduction: Waste water will be reduced in both, household and commercial buildings, due to automatic default detection diagnosis and other monitoring systems
Water saved: Water consumption will be reduced too, due to similar systems previously men-tioned (Automatic default systems etc.)
Energy saved: Reduction in the energy consumption from households, due to energy man-agement, automatic default detection diagnosis, building supervision & control and the im-plementation of operational guidelines
o Economic results
Cost savings: Buildings will experience a reduction in costs due to a decrease in the energy consumption (7% of total costs)
o Social results
N/A
o Additional assumptions
Part of the abatement from the Smart Energy Lever on energy production (supply-demand management) will be reclassified under Smart Building, as this is a major energy consum-ing sector, allocating 75% of the abatement calculated (+1.18 Gt CO2e)

Copyright © GeSI 2015. All rights reserved. – #SMARTer2030 – ICT Solutions for 21st Century Challenges – 122
Topic 6: Mobility & Logistics � Connected Private Transportation
o Understanding
The main outcome from the Connected Private Transportation Use Case comes from a reduc-tion in kms traveled by each car, fuel consumption and cars circulating, as a result of ride shar-ing, car sharing and the technologies such as GPS smart driving systems etc., leading to abate-ment of associated CO2e emissions.
o Adoption rate: two adoption rate scenarios are considered, differentiating between OECD countries and non-OECD countries
For OECD countries , according to Gartner Hype Cycle Smart driving systems, current adop-tion is 5%. In 2030, and in line with the information provided by this hype cycle, the adop-tion of E-Health could reach 50%
For non-OECD countries , Gartner Hype Cycle for Smart driving systems has been taken into account, reducing the expected adoption (5% in 2015, 40% in 2030). This is due to coun-tries being less ready to implement all the necessary advances included under this Use Case (economic limitations and/or social readiness)
o Environmental results
CO2e abatement • LEVER 1: Fall in transport use as a result of ride sharing. People use ride sharing
instead of driving separately with their own vehicle, reducing the total kilometers driven, spending less fuel globally, and therefore reducing related emissions
• LEVER 2: Fall in transport use as a result of car sharing. People use car sharing in-stead of driving with their own private vehicles, reducing the total cars circulating, spending less fuel globally, and therefore reducing related emissions
• LEVER 3: Car production will be reduced, as the usage of cars will decrease signifi-cantly due to car sharing and ride sharing
Lever Total abatement
Abatement distribution
(% of total abatement, may differ between
countries)
Maximum impact from 2030 technology
Ride sharing 0.77 Gt CO2e 78.4%
30%
People using ride sharing would reduce km traveled by 30%, ac-cording to team analysis. People use ride sharing instead of driv-ing with their own car and as a result, total kilometers driven are reduced and associated emissions are reduced too. This is pos-sible due to ICT enabled capacities such as ride sharing platforms and apps.
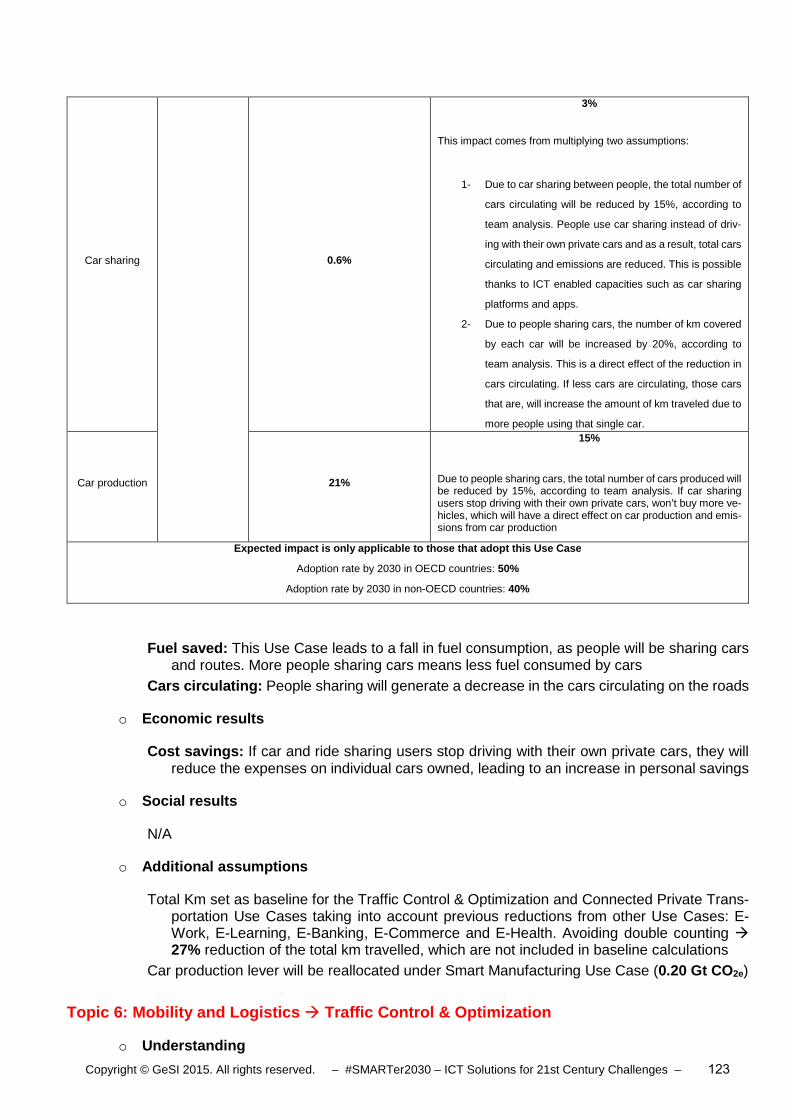
Copyright © GeSI 2015. All rights reserved. – #SMARTer2030 – ICT Solutions for 21st Century Challenges – 123
Car sharing 0.6%
3%
This impact comes from multiplying two assumptions:
1- Due to car sharing between people, the total number of
cars circulating will be reduced by 15%, according to
team analysis. People use car sharing instead of driv-
ing with their own private cars and as a result, total cars
circulating and emissions are reduced. This is possible
thanks to ICT enabled capacities such as car sharing
platforms and apps.
2- Due to people sharing cars, the number of km covered
by each car will be increased by 20%, according to
team analysis. This is a direct effect of the reduction in
cars circulating. If less cars are circulating, those cars
that are, will increase the amount of km traveled due to
more people using that single car.
Car production 21%
15%
Due to people sharing cars, the total number of cars produced will be reduced by 15%, according to team analysis. If car sharing users stop driving with their own private cars, won’t buy more ve-hicles, which will have a direct effect on car production and emis-sions from car production
Expected impact is only applicable to those that adopt this Use Case
Adoption rate by 2030 in OECD countries: 50%
Adoption rate by 2030 in non-OECD countries: 40%
Fuel saved: This Use Case leads to a fall in fuel consumption, as people will be sharing cars and routes. More people sharing cars means less fuel consumed by cars
Cars circulating: People sharing will generate a decrease in the cars circulating on the roads
o Economic results
Cost savings: If car and ride sharing users stop driving with their own private cars, they will reduce the expenses on individual cars owned, leading to an increase in personal savings
o Social results
N/A
o Additional assumptions
Total Km set as baseline for the Traffic Control & Optimization and Connected Private Trans-portation Use Cases taking into account previous reductions from other Use Cases: E-Work, E-Learning, E-Banking, E-Commerce and E-Health. Avoiding double counting � 27% reduction of the total km travelled, which are not included in baseline calculations
Car production lever will be reallocated under Smart Manufacturing Use Case (0.20 Gt CO2e)
Topic 6: Mobility and Logistics � Traffic Control & Optimization
o Understanding

Copyright © GeSI 2015. All rights reserved. – #SMARTer2030 – ICT Solutions for 21st Century Challenges – 124
The main outcome from the Traffic Control & Optimization Use Case is the potential reduction in transport, due to efficient routes, more efficient driving and increased public transport attrac-tiveness. All these impacts will lead to fewer CO2e emissions, less fuel consumed, lower costs and time saved as there will be fewer traffic jams due to ICT.
o Adoption rate : two adoption rate scenarios are considered, differentiating between OECD countries and non-OECD countries
In 2015, according to a Gartner study, 5% of target population are currently active users of traffic control and optimization platforms. For developing countries, it is estimated to be 20% of the adoption rate stated by Gartner (1%)
According to Gartner, a global adoption rate of 20% will be reached by 2020. Reaching a maximum of 45% in 2030 (used for OECD countries). For non-OECD countries, and due to economic limitations, adoption rate will reach a maximum 10%
o Environmental results
CO2e abatement
• LEVER 1: Efficiency of transport due to efficient routes, as it will reduce the distance travelled and fuel consumption, reducing the emissions due to GPS and Smart driving technologies
• LEVER 2: Efficiency of transport due to efficient vehicles, as it will reduce fuel con-sumed by cars thanks to Smart driving technologies
• LEVER 3: Efficiency of transport due to public transport attractiveness. Improvements in transparency in the public transport system will enable more people choosing this transportation method, reducing the kms made by private cars
Lever Total abate-ment
Abatement distribution
(% of total abatement, may differ between
countries)
Maximum impact from 2030 technology
Efficiency of transport
due to effi-cient routes
0.76 Gt CO2e
52%
7.5%
Impact obtained with the combination of two assumptions (25%*30%)
People using efficient routes would reduce distance travelled by 25%, according to team analysis. This is possible due to ICT en-abled capacities such as GPS, connected cars, fast parking plat-forms etc. which will reduce the distance travelled per trip
According to Virginia Transportation Research Council people using efficient routes due to smart traffic control and optimization would reduce fuel consumption by 30% (http://nacto.org/docs/usdg/quantifying_benefits_of_coordi-nated_actuated_traffic_signal_systems_park.pdf). This will pro-duce avoidance of traffic jams and the possibility of taking the fastest routes, generating a decrease on fuel consumption
Efficiency of transport
due to effi-cient vehi-
cles
23%
30%
According to ICBC people using efficient vehicles would reduce fuel consumption by 30% (http://www.icbc.com/driver-licens-ing/Documents/drive_commercial_veh_4.pdf). Efficient vehicles will have even lower consumption than other vehicles, reducing the emissions produced by them

Copyright © GeSI 2015. All rights reserved. – #SMARTer2030 – ICT Solutions for 21st Century Challenges – 125
Efficiency of transport
due to pub-lic transport attractive-
ness
25%
25%
People using public transport would reduce km made by private vehicles by 25% (an increase of people using public transport would not lead to more transportation offered). An improvement in traffic control & optimization due to ICT enabled capacities such as information LED screens, intelligent sensor etc. public transport will be more transparent and more people will choose that method of transport reducing the km made by private cars
Expected impact is only applicable to those that adopt this Use Case
Adoption rate by 2030 in OECD countries: 45%
Adoption rate by 2030 in non-OECD countries: 10%
Fuel saved: This Use Case leads to a fall in fuel consumption, as transporters use efficient cars and routes. More people using efficient cars and routes means less fuel consumption by cars
o Economic results
Cost savings : Efficiency in transport will allow a reduction in road expenditure due to Smart traffic control systems
o Social results
Time saved : Efficiency in transport will reduce traffic jams, reducing the time spend on the road
o Additional assumptions
Total Km set as baseline for the Traffic Control & Optimization and Connected Private Trans-portation Use Cases take into account previous reductions from other Use Cases: E-Work, E-Learning, E-Banking, E-Commerce and E-Health, avoiding double counting � 27% re-duction of the total km travelled, which are not included in baseline calculations
Topic 6: Mobility and Logistics � Smart Logistics
o Understanding
Smart Logistics consists of optimizing the freight industry, resulting in fewer km of transporta-tion and less fuel consumed, with a reduction in associated CO2e emissions. Additionally, costs, space and wood savings will be obtained. As intermediate results, logistic companies will in-crease the average loading rate and reduce the number of empty runs.
o Adoption rate : two adoption rate scenarios are considered, differentiating between OECD countries and non-OECD countries
For OECD countries , logistic companies have foreseen the benefits of becoming smart, lead-ing to and actual adoption rate of 50%. With a BAU scenario, adoption rate of smart logis-tics will reach 85% by 2030
For non-OECD countries , this adoption rate is 10% less due to local difficulties for logistic companies to follow global smart trends (40% adoption rate in 2015, 75% adoption rate in 2030)
o Environmental results
CO2e abatement

Copyright © GeSI 2015. All rights reserved. – #SMARTer2030 – ICT Solutions for 21st Century Challenges – 126
• LEVER 1: Fall in transport used as a result of a reduction in road freight due to route optimization, maximization of vehicle capacity, logistic sharing and eco drive
• LEVER 2: Fall in transport used as a result of a reduction of air freight due to maximi-zation of vehicle capacity and logistic sharing
• LEVER 3: Fall in transport used as a result of a reduction of maritime freight due to maximization of vehicle capacity and logistic sharing
• LEVER 4: Fall in transport used as a result of a reduction of train freight due to maxi-mization of vehicle capacity and logistic sharing
Lever Total abatement
Abatement distribution
(% of total abatement, may differ between
countries)
Maximum impact from 2030 technology
Road freight
1.26 Gt CO2e
96%
30%
Smart Logistics will result in a maximum 30% reduction of road freight (ton-km), due to reducing the number of logistic trips and therefore the total distance travelled, and the carbon intensity of transportation, while the total shipping weight is maintained. These capacities are enabled by route optimization, maximization of vehicle capacity, logistic sharing and eco drive.
Air freight 1.5%
20%
Smart Logistics will result in a maximum 20% reduction of air freight (ton-km), thanks to ICT enabled capacities such as the maximization of vehicle capacity and logistic sharing. These ca-pacities will enable a reduction in the number of trips made and the carbon intensity of transportation, therefore, the emissions re-lated to them
Maritime freight 0.7%
20%
Smart Logistics will result in a maximum 20% reduction of mari-time freight (ton-km) according to team analysis, thanks to ICT enabled capacities such as the maximization of vehicle capacity and logistic sharing. These capacities will enable a reduction in the number of trips made, the carbon intensity of transportation and the associated emissions
Train freight 1.8%
25%
Smart Logistics will result in a maximum 25% reduction of train freight (ton-km), thanks to ICT enabled capacities such as the maximization of vehicle capacity and logistic sharing. These ca-pacities will enable a reduction in the number of trips made, the carbon intensity of transportation and associated emissions
Expected impact is only applicable to those that adopt this Use Case
Adoption rate by 2030 in OECD countries: 85%
Adoption rate by 2030 in non-OECD countries: 75%
Fuel saved: Fuel saved as a result of a reduction in transportation, due to route optimization, maximization of vehicle capacity, logistic sharing and eco drive
Wood saved: Wood pallets saved due to logistic sharing and the reutilization of pallets be-tween companies

Copyright © GeSI 2015. All rights reserved. – #SMARTer2030 – ICT Solutions for 21st Century Challenges – 127
Space saved: A better managed logistic activity, where companies have control over the quantity and the time that goods are stored prior to reaching retailers / end of supply chain, will produce space savings
o Economic results
Cost savings: Due to the optimization of activities, logistic companies will be able to obtain cost savings from the implementation of Smart Logistics
Empty running: Empty runs decrease due to route optimization, maximization of vehicle ca-pacity and logistic sharing
Loading rate: Loading rate reduction will be related to the reduction of empty runs, leveraging on maximization of vehicle capacity and logistic sharing
o Social results
N/A
o Additional assumptions
N/A
Topic 7: Work & Business � E-Commerce
o Understanding
The main outcome from E-Commerce is a reduction of trips to shops, as people will be able to shop online in most of the common retailers. Transportation will be avoided, reducing the fuel consumption and associated CO2e emissions. Additionally, time will be saved as people will spend less time on the road.
o Adoption rate : multiple scenarios are considered
As 2015 adoption rate, and using Gartner as source study, 5% of target population are cur-rently active users of e-commerce platforms
For 2030, two scenarios are considered: for OECD countries, according to Gartner maximum adoption rate will be 90%. For non-OECD countries, adoption rate will reach a maximum of 50% due to difficulties in access to ICT
o Environmental results
CO2e abatement
• LEVER 1: Transportation to shopping malls will be reduced, as buyers will purchase online, avoiding the necessity of travel. Less transportation means less fuel consump-tion by transportation means, which leads to fewer CO2e emissions
Lever Total abatement
Abatem ent distribution
(% of total abatement, may differ between
countries)
Maximum impact from 2030 technology

Copyright © GeSI 2015. All rights reserved. – #SMARTer2030 – ICT Solutions for 21st Century Challenges – 128
Fall in transport used
0.42-0.12=
0.3 Gt CO2e
100%
50%
Fall in transport will be in line with growth in the share of E-Com-merce. E-commerce transactions will be increased by 50% by 2030, according to team analysis, due to ICT enabled capacities such as smart devices, digital wallets etc. Purchasers will substi-tute off-line shopping by e-commerce reducing the number of trips to shops and emissions produced by traveling.
Counter effect:: -27.6%
-27.6% of total abatement
A direct effect from additional logistics needed can be taken into account, addressing an additional 27.6% CO2e emissions (from the abatement obtained)
Expected impact is only applicable to those that adopt this Use Case
Adoption rate by 2030 in OECD countries: 90%
Adoption rate by 2030 in non-OECD countries: 50%
Fuel saved: This Use Case leads to a fall in transportation needed, as buyers will purchase online without the necessity of traveling, less transportation means less fuel consumed by vehicles
o Economic results
N/A
o Social results
Time saved: As a result of ICT enabled capacities, people will be able to buy online, avoiding the trip to the store and saving time on the road
o Additional assumptions
N/A
Topic 7: Work & Business � E-Banking
o Understanding
The main outcome from E-Banking is a reduction in transportation needed to do a bank trans-action. ICT will generate CO2e abatement, from reduced transportation and office use, as well as fuel usage reduction. Bank office renting cost and paper will be saved too, and the time invested in bank operations will also be impacted by the Use Case.
o Adoption rate : multiple scenarios are considered
As 2015 adoption rate, data comes from The Telegraph, based on a study about this topic. The % used may have been adapted adding a correction factor: http://www.tele-graph.co.uk/finance/personalfinance/bank-accounts/10604175/Do-banks-have-a-duty-to-keep-branches-open.html.
For 2030, two scenarios are considered: for OECD countries , the indicator comes from the Deutsche Bank research on Germany: 77%. For non-OECD countries , a correction factor of 17% has been added due to difficulties in access to ICTs: 60%
o Environmental results

Copyright © GeSI 2015. All rights reserved. – #SMARTer2030 – ICT Solutions for 21st Century Challenges – 129
CO2e abatement • LEVER 1: Fall in transport used, as a result of on-line banking services, which will
reduce the number of trips to the bank
• LEVER 2: Fall in CO2e emissions per bank employee. As a result of reducing the amount of customer visits to the bank, the emissions per bank employee will decrease
Lever Total abatement
Abatement distribution
(% of total abatement, may differ between
countries)
Maximum impact from 2030 technology
Fall in transport used
0.003 Gt CO2e
26%
50%
According to team analysis, the use of online banking reduces 1 out of 2 visit to bank branches
Fall in CO2e emissions per
bank employee 74%
60%
A reduction of a 50% in the number of trips to bank branches will cause a reduction of 50% in the number of employees at branches. Additionally, a +10% is accounted for employees in charge of general bank services
Expected impact is only applicable to those that adopt this Use Case
Adoption rate by 2030 in OECD countries: 77%
Adoption rate by 2030 in non-OECD countries: 60%
Fuel saved: This Use Case leads to a fall in transportation needed, as users will be attended to without the necessity of travel (from their houses or remote locations) to the bank. Less transportation means less fuel consumed by vehicles
Paper saved: Decrease in paper needed due to the elimination of physical documents and increase use of electronic ones
o Economic results
Cost savings: Fall in number of bank branches as a result of E-Banking, reducing the rent cost
o Social results
Time saved: Thanks to ICT enabled capacities, people will be able to be attended to wherever they are, whatever they need, avoiding the trip to the bank and saving time
o Additional assumptions
N/A
Topic 7: Work and business � E-Work
o Understanding
The main outcome from E-Work is a reduction in transportation needed for business purposes. Due to this, ICT will generate CO2e abatement and fuel usage reduction, as well as less office space needed (savings in the associated rent costs too). Moreover, time will be saved as em-ployees won’t need to go from their houses to the office.

Copyright © GeSI 2015. All rights reserved. – #SMARTer2030 – ICT Solutions for 21st Century Challenges – 130
o Adoption rate : two adoption rate scenarios are considered, differentiating between OECD countries and non-OECD countries
For OECD countries , according to Gartner Hype Cycle for digital workspaces, the current adoption is 5%. In 2030, and in line with the information provided by this hype cycle, the adoption of E-Work could reach 80%
For non-OECD countries , Gartner Hype Cycle for digital workspaces has been taken into account too, reducing the expected adoption (2% in 2015, 32% in 2030). This is due to countries being less ready to implement all the necessary advances included under this Use Case (economic limitations and/or social readiness)
o Environmental results
CO2e abatement • LEVER 1: Fall in transport used due to a reduction in commuting
• LEVER 2: Fall in business trips by car
• LEVER 3: Fall in business trips by plane
Lever Total abatement
Abatement distribution
(% of total abatement, may differ between
countries)
Maximum impact from 2030 technology
Fall in transport used due to re-duction of com-
muting
0.40 Gt CO2e
69%
53%
E-Work reduces daily vehicle travel by 53%due to telecommuting, according to The Information Technology & Innovation Founda-tion, in their report "Improving Quality of Life Through Telecom-muting" (which references Brad Allenby and Joseph Roitz, “Im-plementing the Knowledge Economy: The Theory and Practice of Telework,” Batten 19. Institute Working Paper, 2003 <www.tel-coa.org/id146.htm>. See also Edward E. Potter, “Telecommuting: The Future of Work, Corporate Culture, and American Society.” Journal of Labor Research 24.1 (Winter 2003): 73-84)
Fall in business trips by car
6%
80%
In line with commuting impact, E-Work will reduce a maximum of 80% of the total business trips made, either by car or by plane
Fall in business trips by plane
25%
80%
In line with commuting impact, E-Work will reduce a maximum of 80% of the total business trips made, either by car or by plane)
Expected impact is only applicable to those that adopt this Use Case
Adoption rate by 2030 in OECD countries: 80%
Adoption rate by 2030 in non-OECD countries: 32%
Fuel saved: This Use Case leads to a fall in transportation needed, as employees will work without the necessity of traveling (from their houses or remote locations). Less transporta-tion means less fuel consumed by vehicles
Space saved: Decrease in required infrastructure due to people working from home, which will reduce the office space needed

Copyright © GeSI 2015. All rights reserved. – #SMARTer2030 – ICT Solutions for 21st Century Challenges – 131
o Economic results
Cost savings: Decrease in required infrastructure due to people working from home, which will reduce the office rent expenses
Employee productivity: Increase in worker productivity due to a better working atmosphere and living quality
o Social results
Time saved : Thanks to ICT enabled capacities, people will be able to be work wherever they are, avoiding the trip to the office and saving time
o Additional assumptions
N/A
Topic 8: Manufacturing � Smart Manufacturing
o Understanding
The main outcome from the Smart Manufacturing Use Case is the potential reduction in indus-trial operating costs, as a result of reducing the energy used during industrial processes, opti-mizing the resources use due to process automation, for both, heating and cooling, and engine optimization. This reduction leads to an associated reduction in CO2e emissions and water use.
o Adoption rate : two adoption rate scenarios are considered, differentiating between OECD countries and non-OECD countries
For OECD countries , according to Gartner study, 10% of manufacturing centers/ production processes are currently intense users of technology (manufacturing centers/ production processes are currently intense users of technology). In 2030, and in line with the infor-mation provided by Gartner, the adoption rate will reach 75% in developed countries
For non-OECD countries , the expected adoption is lower (5% in 2015, 65% in 2030). This is due to countries being less ready to implement all the necessary advances included under this Use Case (economic limitations and/or social readiness)
o Environmental results
CO2e abatement • LEVER 1: Processes automation
• LEVER 2: Engine optimization
Lever Total abatement
Abatement distribution
(% of total abatement, may differ between
countries)
Maximum impact from 2030 technology
Processes au-tomation
2.12 Gt CO2e 71%
50%
Both heating, cooling and industrial and manufacturing processes where Smart Manufacturing techniques are applied will save a maximum of 50% emissions (This is an assumption made by Ac-centure based on conversations with manufacturing processes experts)

Copyright © GeSI 2015. All rights reserved. – #SMARTer2030 – ICT Solutions for 21st Century Challenges – 132
Engine optimi-zation
29%
40%
For motoring systems, engine systems where Smart Manufactur-ing techniques are applied will save a maximum of 40% emis-sions as they are less IT intensive than regular processes (This is an assumption made by Accenture based on conversations with manufacturing processes experts)
Expected impact is only applicable to those that adopt this Use Case
Adoption rate by 2030 in OECD countries: 75%
Adoption rate by 2030 in non-OECD countries: 65%
Energy saved: Fall in energy used due to more efficient manufacturing techniques that save energy in the production process
Water saved : Fall in water usage due to more efficient manufacturing techniques that save water in the production process
o Economic results
Cost savings: Increased productivity of manufacturing processes due to production effi-ciency, saving on operating costs
o Social results
N/A
o Additional assumptions
Part of the abatement from the Smart Energy Lever on energy production (supply-demand management) is reclassified under Smart Building, as this is a major energy consuming sector, allocating 25% of the abatement calculated (+0.39 Gt CO2e)
The abatement obtained from the car production lever in Connected Private Transportation Use Case will be reallocated to Smart manufacturing (+0.20 Gt CO2e)
Copyright © GeSI 2015. All rights reserved. – #SMARTer2030 – ICT Solutions for 21st Century Challenges – 133
6.6 Glossary
• Abatement potential: potential reduction that may be obtained under specific future circumstances • Advanced Analytics: grouping of analytic techniques used to predict future outcomes based on
predictive analytics, simulation and optimization • AMP 2.0: Advanced Manufacturing Partnership Steering Committee • Augmented reality: technology that offers a real-time view of one´s immediate surroundings al-
tered or enhanced by computer generated information • B2C: Business to Consumer • BAU: Business as usual • BAU+: optimistic BAU scenario • Broadband: high-speed data transmission • Carbon mitigation: actions to limit the magnitude and/or rate of long term climate change • Climate footprints: a measure of the full set of greenhouse gases of a defined population or activity • Cloud Computing: allows application software to be operated using internet-enabled devices • CO2e: unit used to express greenhouse gas emissions. It means carbon dioxide equivalent, which
helps to express and aggregate emissions from different greenhouse gases • Connected car: car with connectivity to a network, that also includes smart driving solutions to
maximize efficiency and sustainability • Data Analytics: the science of examining raw data with the purpose of drawing conclusions about
that information • Digital density: number of people and objects that are connected through information technologies • Digital Wallet: electronic payment systems • Disruptive technologies: technologies with a significant impact on existing players and value
chains with the ability to fundamentally change the currently prevailing competitive dynamic • E-degree: online degree that can be earned through the use of an internet connected computer,
rather than attending face-to-face classes • FJVPS: Fujitsu Virtual Product Simulator • FSDS: Federal Sustainable Development Strategy • GDP: Gross Domestic Product • GHG: Greenhouse gas. Any of the gases whose absorption of solar radiation is responsible for the
greenhouse effect, including carbon dioxide, methane, ozone and the fluorocarbons • GIS: Geographic Information System • GPS: Global Positioning System • Gt CO2e: Gigatons of carbon dioxide equivalents • Ha: Hectare • HVAC: Heating, Ventilation and Air Conditioning • ICT: Information and Communication Technologies • Intermodal transport: the use of more than one mode of transport for a journey • IoT: The Internet of Things • IPCC: Intergovernmental Panel on Climate Change • Km3: Cubic Kilometers • KWh: Kilo-watt-hour • L: Liters • M2: Square meters • M2M: Machine to Machine • MES: Manufacturing Execution System

Copyright © GeSI 2015. All rights reserved. – #SMARTer2030 – ICT Solutions for 21st Century Challenges – 134
• Micro grids: small-scale power grids that can operate independently or in conjunction with the area’s main electrical grid
• Mobile Money: electronic money that may be used to transfer funds between banks or accounts with a smartphone
• MOOC: Massive Open Online Course • MWh: Mega-watt-hour • NPV: Net Present Value • OECD: Organization for Economic Co-operation and Development • OEM: Original equipment manufacturer • PLM: Product Lifecycle Management • Prosumers: consumers who are also producers (e.g. of electricity) • PV: Photovoltaic plants • Rebound effect: the reduction in expected gains from new technologies that increase the efficiency
of resource use, because of behavioral or other systemic responses • Resource depletion: consumption of a resource faster than it can be replenished • Resource intensity: a measure of the amount of resources required per unit of economic activity.
Resources are typically measured in tons of domestic material consumption comprising all types of resources from fossil fuels to iron ore to biomaterials and economic activity is typically measured in Gross Domestic Product (GDP)
• RoW: rest of world • Shopping concierge: virtual shopping assistant able to make recommendations • SMART: Self-Monitoring Analysis and Reporting Technology • Smart device: electronic device capable of connecting with other devices or networks. This report
focuses on those containing mobile operating systems, known as smartphones • Smart meter: Internet-capable device that measures energy, water or natural gas consumption of
a building or home • Telecommuter: work arrangements in which employees do not physically communicate to a central
place of work • Telepresence: set of technologies which allow a person to feel as if they were present, to give the
appearance of being present, or to have an effect, thanks to technologies, at a place other than their true location
• tn: Metric ton • T&D: Transmission and Distribution • USF: Universal Services Funds • VMT: Vehicle Miles Traveled • Wastewater: water that has been used, e.g., for washing, flushing, or cleaning purposes, and con-
tains waste products, and can’t therefore be reused directly without treatment • WRI: World Resources Institute