smartestenergy: introduction to the electricity market
TRANSCRIPT

Trading Power
Introduction to the Electricity Market
Iain Robertson, Generation Sales Manager

Agenda
2
SmartestEnergy
What is a PPA?
Traded markets
The role of Elexon
SmartestEnergy
The UK’s leading purchaser of power from independent renewable generators and supplier of renewable electricity to large commercial and industrial organisations
Established as generation aggregator since 2001
Diverse portfolio
3GW contracted installed capacity
600 sites (>13% of GB independent embedded renewables)
Includes all commercial-scale renewable technologies
Strong balance sheet, backed by an international corporation
Annual turnover £1.2bn and profit after tax £13m
Wholly-owned subsidiary of Marubeni Corporation
170+ employees across offices in London, Ipswich & Glasgow
3

What is a PPA?
4

What is a Power Purchase Agreement?
Route to market contract between: Generator (the seller) and Purchaser of electricity (the buyer)
Defines the commercial terms, including: Pricing structures Key dates and schedule for delivery Obligations and penalties Payment terms Risk and termination provisions
The principal agreement that defines the revenue and credit quality of a generating project and is a key element of project finance

Construction Risk ROC PPAs For Project Finance, up to 15 years
FiT PPA For Feed-in Tariff generators
CfD PPA To dovetail with CfD contract
Short-term PPA Merchant, typically up to 3 years
FlexiPPA Typically for portfolios
Frameworks up to 7 years
“Linked Supply” Direct PPAs with end-users
PPAs for renewable generators
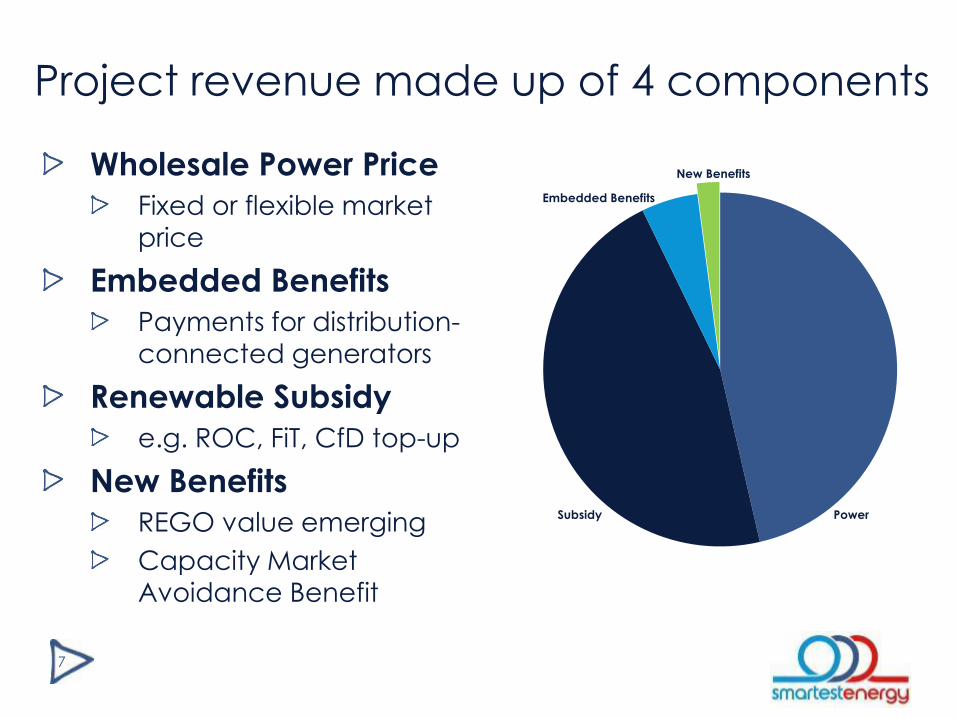
Project revenue made up of 4 components
7
Wholesale Power Price
Fixed or flexible market price
Embedded Benefits
Payments for distribution-
connected generators
Renewable Subsidy
e.g. ROC, FiT, CfD top-up
New Benefits
REGO value emerging
Capacity Market
Avoidance Benefit
New Benefits
Subsidy
Embedded Benefits
Power
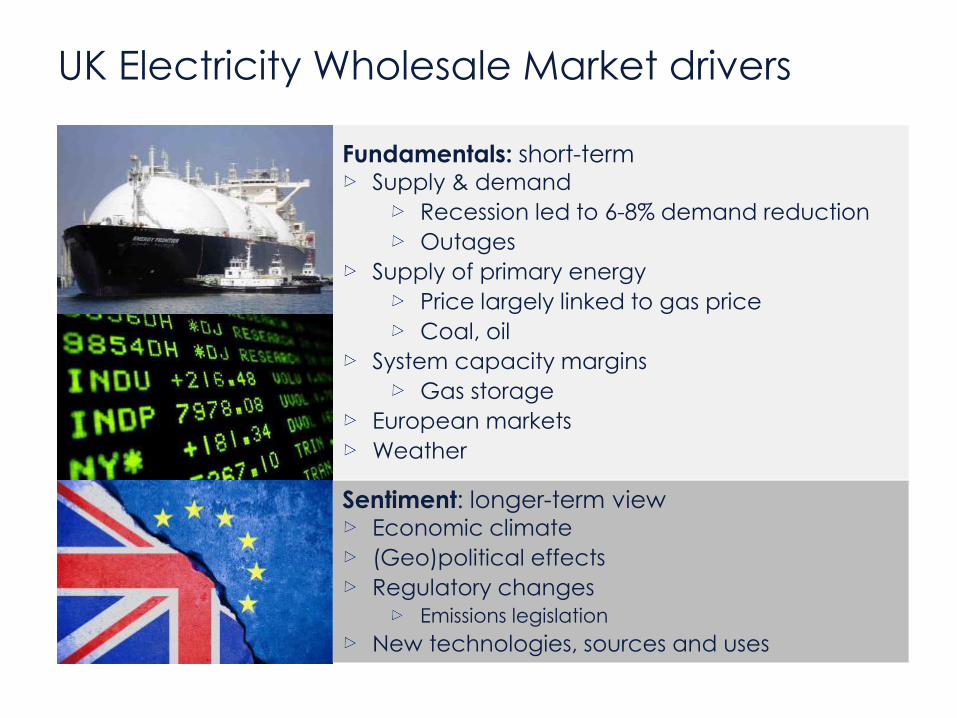
Fundamentals: short-term Supply & demand
Recession led to 6-8% demand reduction
Outages
Supply of primary energy
Price largely linked to gas price
Coal, oil
System capacity margins
Gas storage
European markets
Weather
UK Electricity Wholesale Market drivers
Sentiment: longer-term view Economic climate
(Geo)political effects
Regulatory changes
Emissions legislation
New technologies, sources and uses
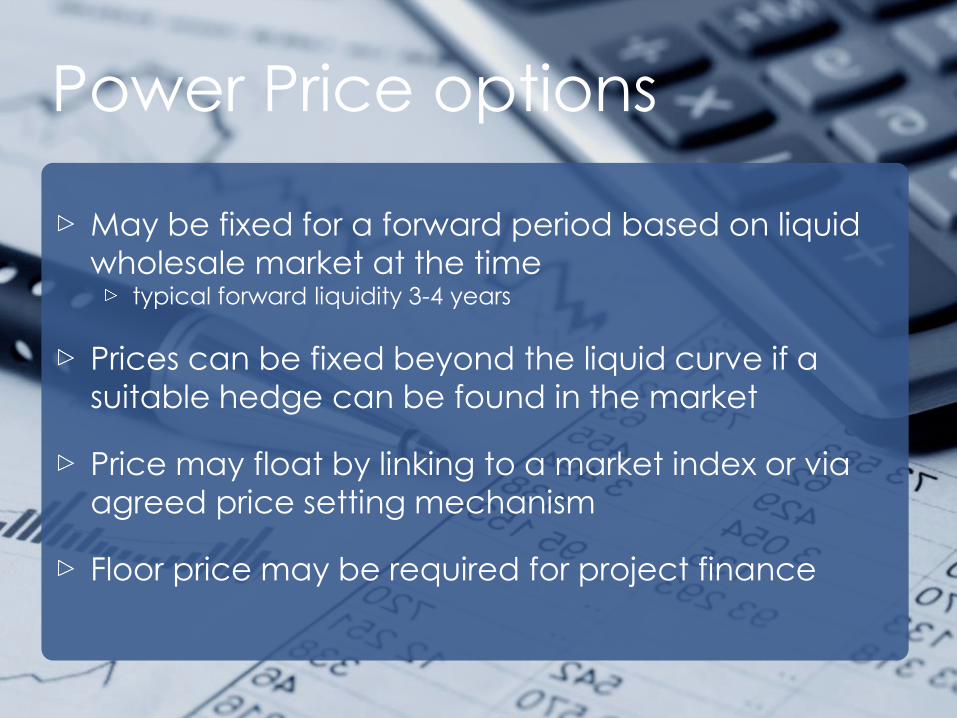
Power Price options
May be fixed for a forward period based on liquid
wholesale market at the time typical forward liquidity 3-4 years
Prices can be fixed beyond the liquid curve if a
suitable hedge can be found in the market
Price may float by linking to a market index or via
agreed price setting mechanism
Floor price may be required for project finance

Forward annual price
10

11
N2EX day-ahead price

PPA - Imbalance
Purchaser takes Volume Risk on the forecast versus delivered generation output
An imbalance charge is made, based on:
Nature of the supply
Historic data (if any)
Prevailing level of wholesale prices
Prevailing wholesale price volatility
Time between contract agreement and delivery
Purchaser’s experience of similar generation
Purchaser’s portfolio
Expected nature of prices in the imbalance mechanism
12

What are Embedded Benefits?
Costs to end users accrue as
benefits to embedded generation
as it is treated as ‘negative demand’ in settlements
Vary according to location and
connection voltage
Distribution and Transmission losses
Generation Distribution Use of
System (GDUoS)
Balancing Services Use of System
(BSUoS) charges
Residual Cashflow Reallocation
Charge (RCRC)
Capacity Market Avoidance Benefit
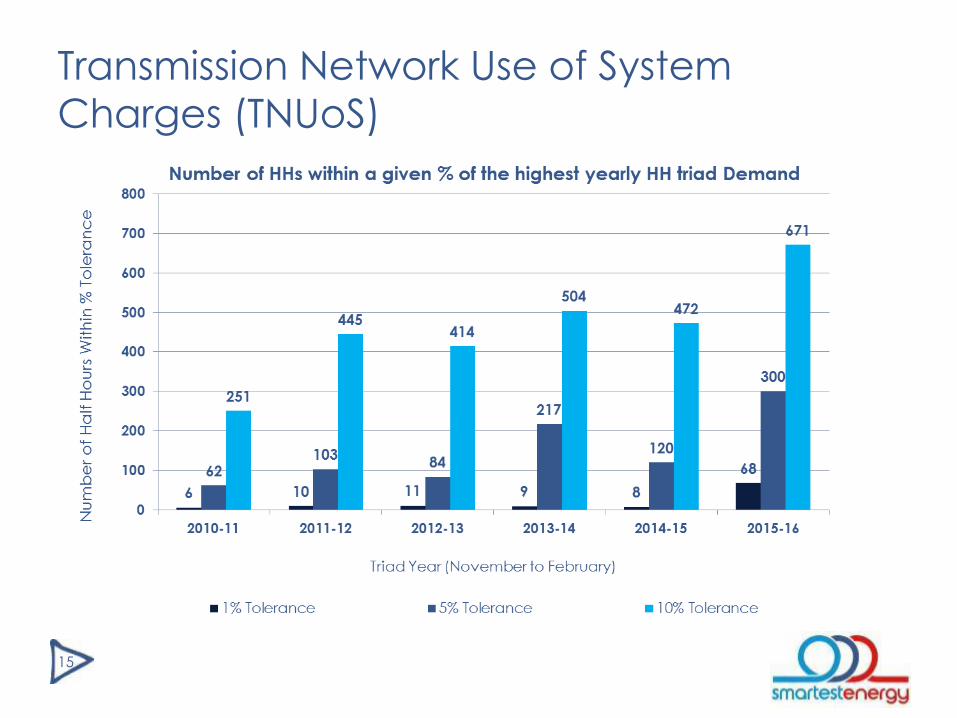
Transmission Network Use of System Charges (TNUoS)

Transmission Network Use of System
(TNUoS) – Triad benefit
14
2015/16 Final (£/kW)
2016/17 Final (£/kW)
2017/18 Current Forecast (£/kW)
1 Northern Scotland 23.47 40.97 29.73
2 Southern Scotland 26.79 40.24 30.45
3 Northern 32.62 42.93 38.16
4 North West 35.68 42.83 43.59
5 Yorkshire 36.29 42.49 44.13
6 N Wales & Mersey 35.62 42.68 44.50
7 East Midlands 39.07 44.72 47.01
8 Midlands 39.63 45.74 48.26
9 Eastern 41.18 46.54 49.02
10 South Wales 37.61 42.31 45.44
11 South East 43.74 49.20 51.83
12 London 46.24 51.87 54.37
13 Southern 44.79 50.08 52.83
14 South Western 43.98 48.58 51.43
Range 22.77 11.63 24.64
Transmission Network Use of System
Charges (TNUoS)
15
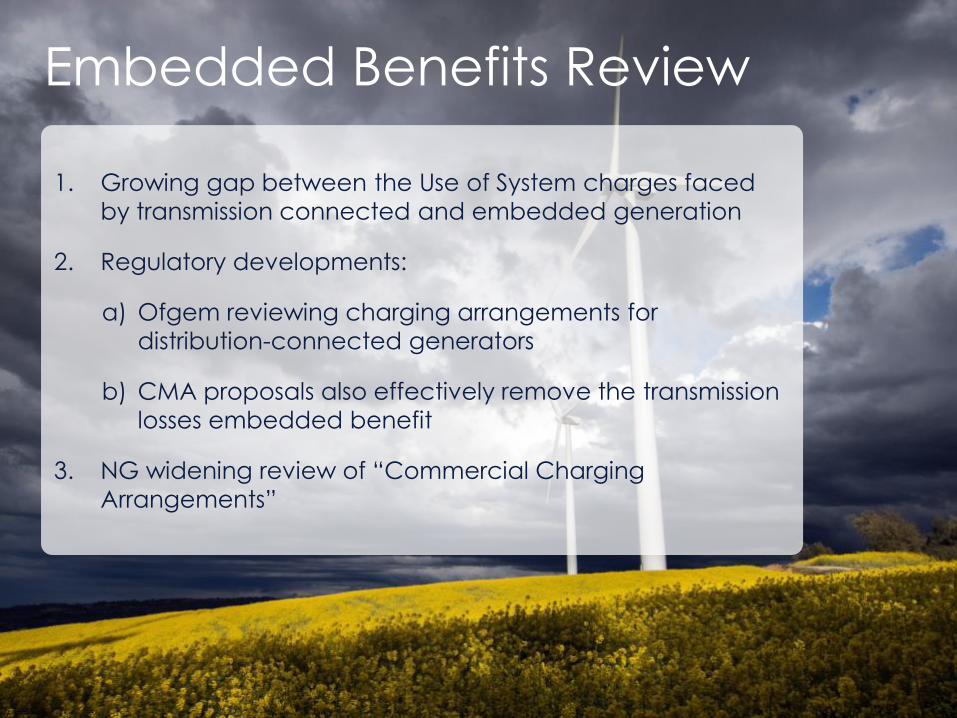
Embedded Benefits Review
1. Growing gap between the Use of System charges faced
by transmission connected and embedded generation
2. Regulatory developments:
a) Ofgem reviewing charging arrangements for
distribution-connected generators
b) CMA proposals also effectively remove the transmission
losses embedded benefit
3. NG widening review of “Commercial Charging
Arrangements”
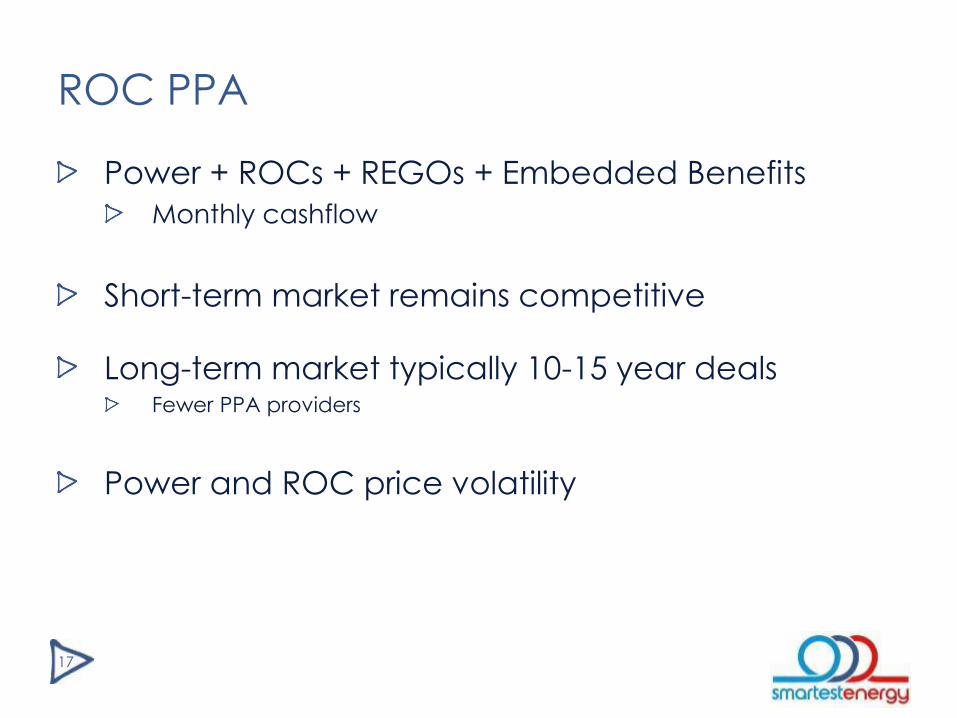
ROC PPA
Power + ROCs + REGOs + Embedded Benefits
Monthly cashflow
Short-term market remains competitive
Long-term market typically 10-15 year deals Fewer PPA providers
Power and ROC price volatility
17
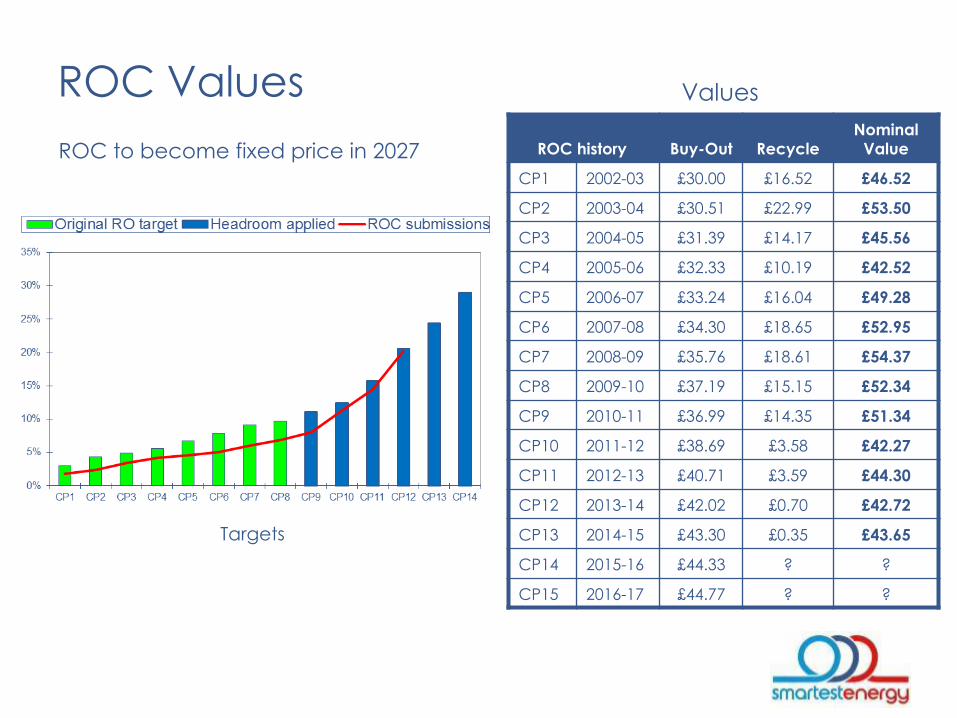
ROC Values
ROC history Buy-Out Recycle
Nominal
Value
CP1 2002-03 £30.00 £16.52 £46.52
CP2 2003-04 £30.51 £22.99 £53.50
CP3 2004-05 £31.39 £14.17 £45.56
CP4 2005-06 £32.33 £10.19 £42.52
CP5 2006-07 £33.24 £16.04 £49.28
CP6 2007-08 £34.30 £18.65 £52.95
CP7 2008-09 £35.76 £18.61 £54.37
CP8 2009-10 £37.19 £15.15 £52.34
CP9 2010-11 £36.99 £14.35 £51.34
CP10 2011-12 £38.69 £3.58 £42.27
CP11 2012-13 £40.71 £3.59 £44.30
CP12 2013-14 £42.02 £0.70 £42.72
CP13 2014-15 £43.30 £0.35 £43.65
CP14 2015-16 £44.33 ? ?
CP15 2016-17 £44.77 ? ?
Targets
Values
ROC to become fixed price in 2027

Nominal ROC value forecast
19
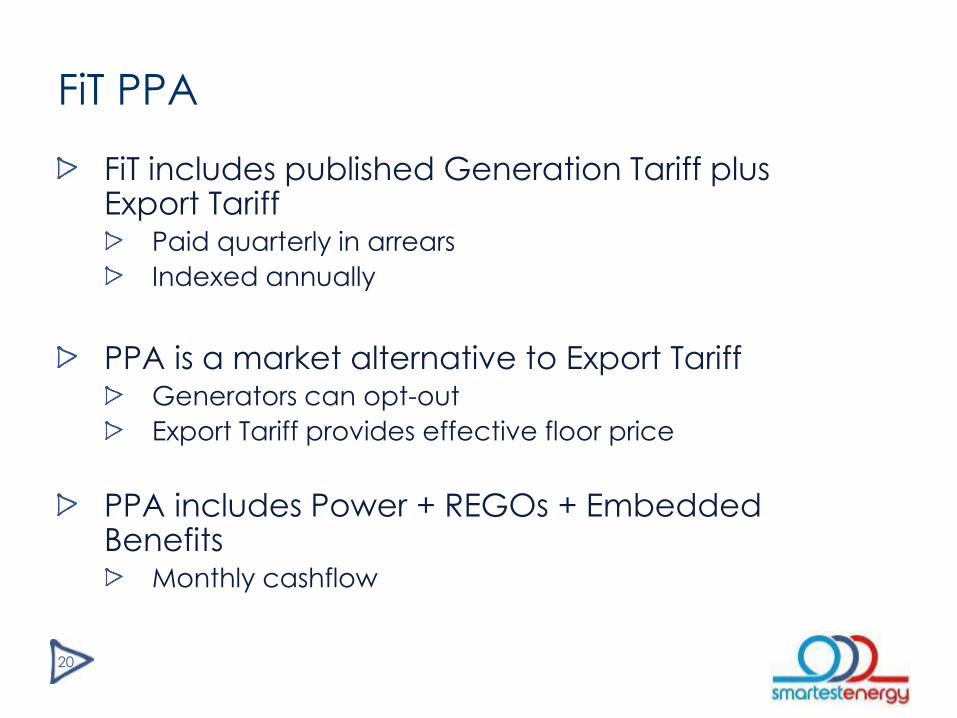
FiT PPA
FiT includes published Generation Tariff plus Export Tariff
Paid quarterly in arrears
Indexed annually
PPA is a market alternative to Export Tariff Generators can opt-out
Export Tariff provides effective floor price
PPA includes Power + REGOs + Embedded Benefits
Monthly cashflow
20

Small Scale FiT
21

22
How CfDs work
Low Carbon Contracts Company (LCCC) operate scheme
Difference payments from and to LCCC
Generators also need a PPA provider to sell their power (at
the Market Reference with discount)
Strike Price = Market Reference Price + Difference Payment

Key aspects of CfD P
ric
e
Generator pays back
Strike price
Generator receives Difference Payment
Market reference price
- day-ahead for intermittent
- season ahead for baseload
23
PPA standard model is a discount to MRP
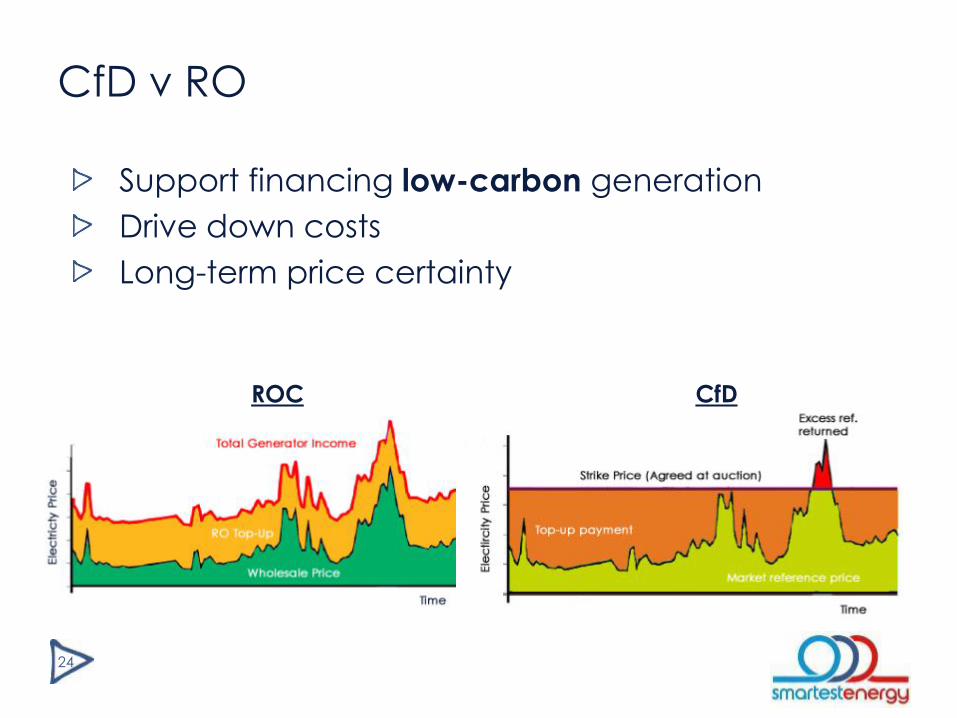
CfD v RO
24
ROC CfD
Support financing low-carbon generation
Drive down costs
Long-term price certainty

PPAs in a post-subsidy world
Market stabilisation CfD
Direct end-user PPAs
Generator agrees (long-term) price with Consumer Consumer must also be creditworthy
Supplier provides PPA to Generator Including Embedded Benefits
Power is sleeved through to Consumer’s supply
contract at agreed price PPA provider may or may not also be Consumer’s Supplier
Certainty for both parties
Great opportunity to bring together willing parties
CSR and PR opportunities

Trading Power

Wholesale electricity is traded mostly OTC via
brokers Voice and screen
Traders prefer interface
More flexible
Provides market intelligence
Encourages tighter prices
Highlights opportunities
Trades are anonymous, until after the trade
Other trading done via exchanges, on indices
UK trades up to 6 times consumption
Some other European markets more liquid
Wholesale market
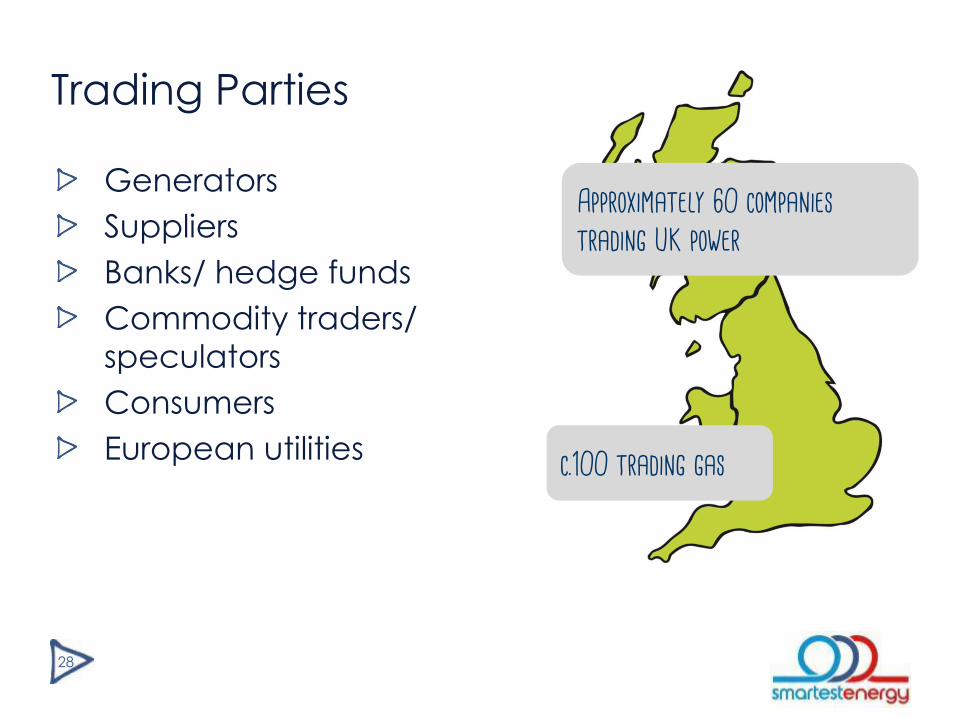
Trading Parties
Generators
Suppliers
Banks/ hedge funds
Commodity traders/
speculators
Consumers
European utilities
28
Approximately 60 companies
trading UK power
c.100 trading gas

Traded Periods
Forward Market Months, Quarters, Seasons, Annuals
Prompt Market Day-ahead, week-ahead
Spot Market Within-day
Up to gate closure
Can trade baseload or “shape” e.g. peak/ off-peak
29
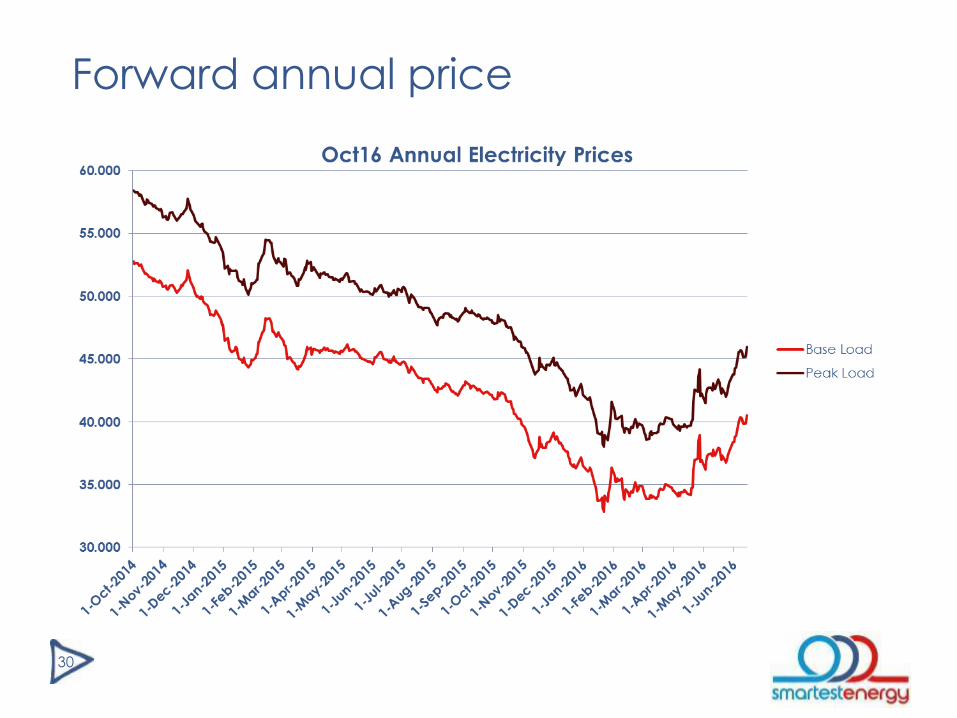
Forward annual price
30

Forward winter price
31
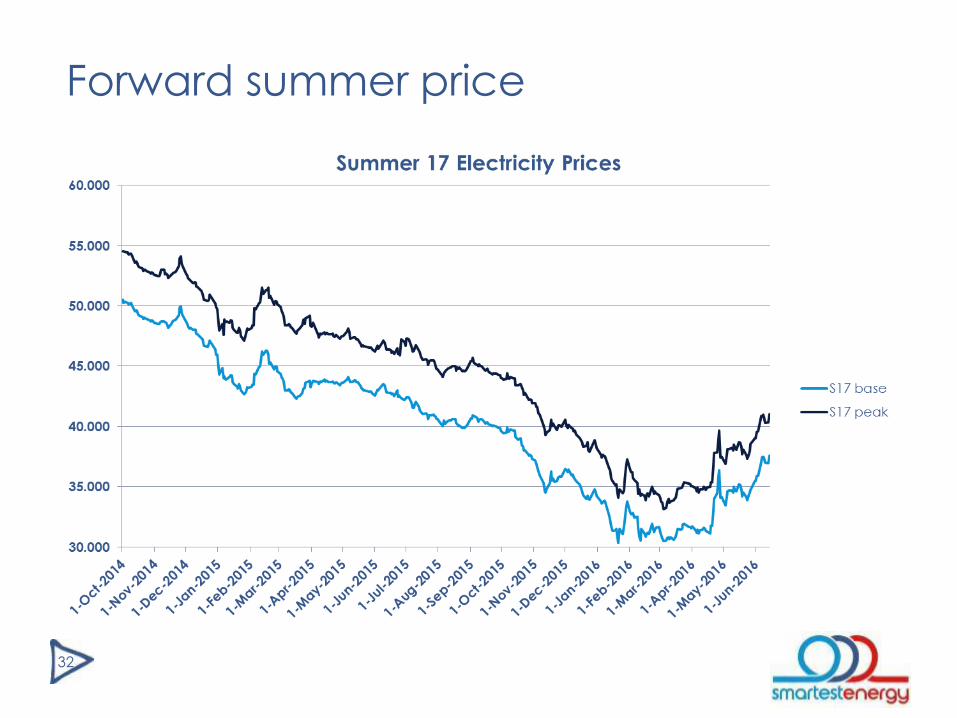
Forward summer price
32

Impact of Solar PV generation on intraday
wholesale price
33

The Role of Elexon

What does Elexon do?
Elexon monitor and validate payments made
between generators and suppliers (BSC Parties)
Compare how much electricity generators and
suppliers were contracted to produce or consume
with actual volumes
Calculate a price for the difference and transfer
funds accordingly
Elexon deliver the Balancing and Settlement Code
National Grid
Balance physical
generation and
demand
Elexon Settlement imbalance
for generators and suppliers
BSC Parties
Produce or use
energy

36
System Sell Price - Single Cash Out
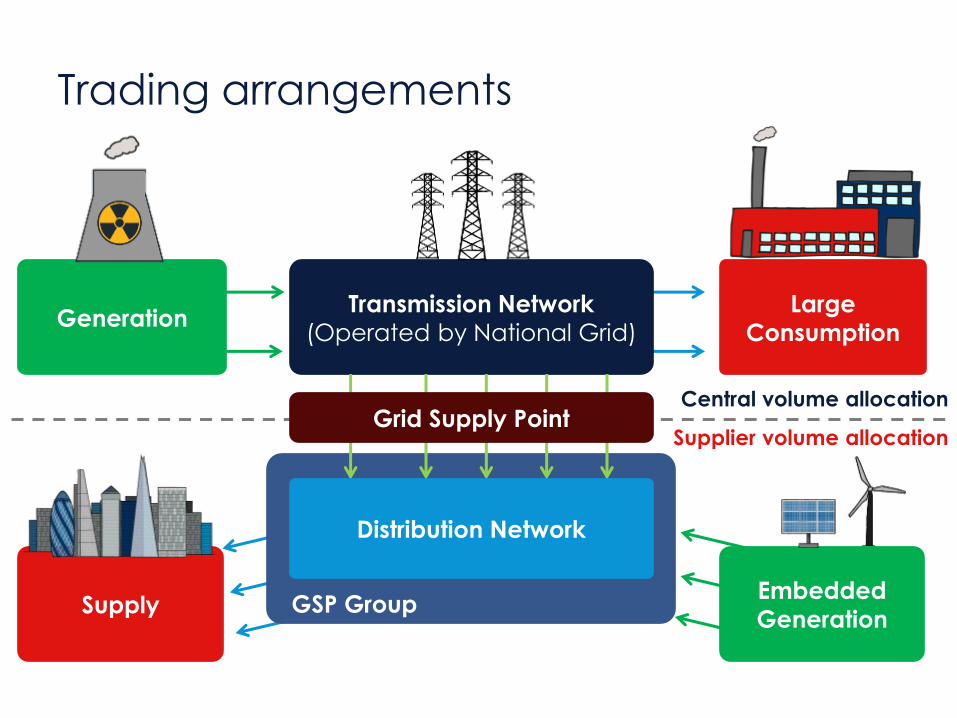
Trading arrangements
Transmission Network
(Operated by National Grid) Generation
Large
Consumption
Central volume allocation
Supplier volume allocation Grid Supply Point
Distribution Network
GSP Group Supply Embedded
Generation

How does Imbalance occur
38
Generators Suppliers Non-physical traders
May produce
more or less energy
than they have
sold contractually
May consume
(through customer
demand) more or
less energy than
they have
purchased
contractually
No generation to
sell, or demand to
satisfy – buys from
generators and
trades to suppliers
for profit
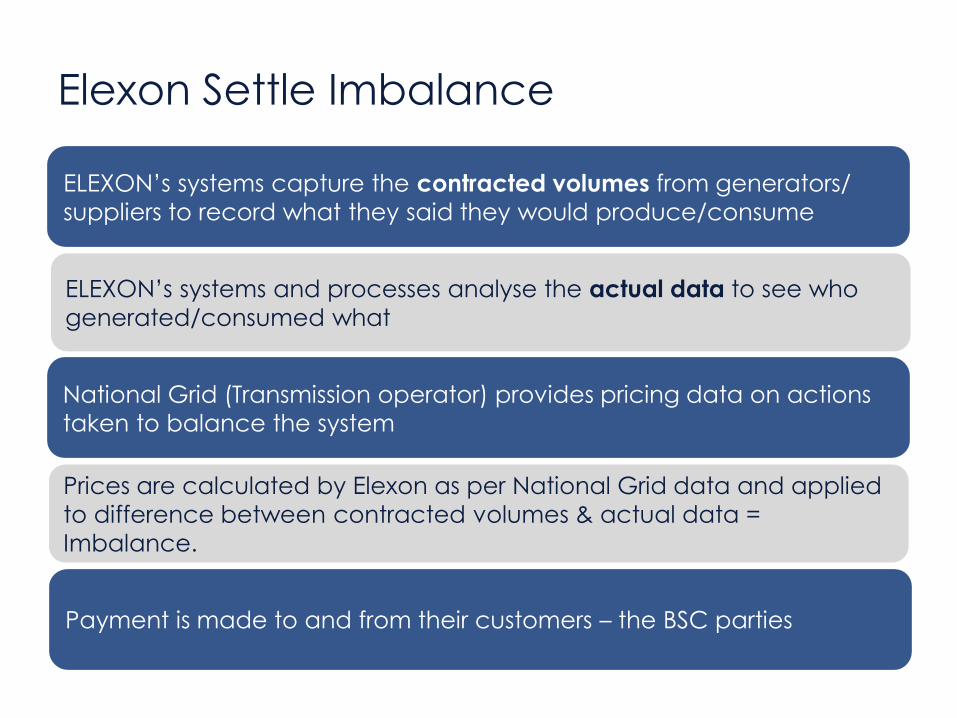
Elexon Settle Imbalance
ELEXON’s systems capture the contracted volumes from generators/
suppliers to record what they said they would produce/consume
ELEXON’s systems and processes analyse the actual data to see who
generated/consumed what
National Grid (Transmission operator) provides pricing data on actions
taken to balance the system
Prices are calculated by Elexon as per National Grid data and applied
to difference between contracted volumes & actual data =
Imbalance.
Payment is made to and from their customers – the BSC parties
Thank you for watching….
Follow us on Twitter @SmartestEnergy for upcoming events and our latest
blogs
> Follow us here
Follow our company LinkedIn page for updates and connect with our team
> Connect with us
Sign up for our weekly newsletter The Informer to keep up to date with latest
developments
Sign up here
Energy Entrepreneurs
Report 2016
Download our free report
Go to our blog to hear the latest
from all our experts
Visit the info hub on our website
www.smartestenergy.com