smartone telecommunications holdings … arising from or in reliance upon the whole or any part of...
TRANSCRIPT
- 1 -
Hong Kong Exchanges and Clearing Limited and The Stock Exchange of Hong Kong Limited take no responsibility for the contents of this document, make no representation as to its accuracy or completeness and expressly disclaim any liability whatsoever for any loss howsoever arising from or in reliance upon the whole or any part of the contents of this document.
SmarTone Telecommunications Holdings Limited (Incorporated in Bermuda with limited liability)
(Stock code: 315)
2014 / 2015 ANNUAL RESULTS ANNOUNCEMENT (All references to “$” are to the Hong Kong dollars)
Total revenue increased 41% to $18,659 million
Hong Kong customer numbers grew 4% to 1.96 million
EBITDA rose 14% to $2,932 million
EBIT improved 54% to $1,244 million
Net profit increased 74% to $935 million
Dividend payout ratio raised to 75%, proposed final dividend of $0.33 per
share
CHAIRMAN’S STATEMENT
I am pleased to report the results of the Group for the year ended 30 June 2015.
Financial Highlights
Group total revenue increased to $18,659 million, representing a 41% growth over
the previous year. Service revenue increased 3% on the previous year, with growth
in local service revenue partly offset by the continuous decline in roaming revenue.
Both revenue from handset sales and handset profit experienced strong growth
compared to the previous year. The improvement in revenue, together with stringent
cost control, contributed to a 14% growth in EBITDA to $2,932 million. Net profit
increased 74% to $935 million over the same period.

- 2 -
Dividend
With the completion of the 2100MHz spectrum auction in December 2014, the
uncertainty of renewing the spectrum was cleared. On the basis of strong group
operating cash flow and a healthy balance sheet, the Board raised the dividend
payout ratio to 75% of net profit. A final dividend of 33 cents per share is proposed,
making full year dividend at 60 cents per share, an increase of 94% compared to last
year. Shareholders have the option to receive new and fully paid shares in lieu of
cash under a scrip dividend scheme.
Business Review
Group service revenue rose 3% due to a combination of customer number growth
and continuous upgrade by customers to higher price-point plans. Recovering from
the low in second half FY14, group service revenue has been rising 3-4% for the past
two consecutive half-year periods, despite customers’ continual migration from
handset-bundled plans to SIM-only plans. Service revenue net of handset subsidy
amortisation rose 7% over the previous year, reflecting healthy growth in underlying
service revenue.
Hong Kong customer number grew 4% to 1.96 million, with the majority of the growth
coming from the 3G speed-capped plan. Postpaid ARPU stands at $294. Excluding
the dilution from the 3G speed-capped plan, postpaid ARPU rose 3% over the year.
Average postpaid churn improved from 1.0% to 0.9%.
In the year under review, the Company completed its refarm of the 900MHz spectrum
for 4G with full coverage of all MTR lines, providing additional capacity and further
improving in-building coverage. The rollout of 4G at 2,600MHz at selected high traffic
locations is well-underway, meeting customers’ demand for ever-increasing mobile
broadband usage. LTE-A on 900MHz and 1,800MHz has been enabled for over
75% of the network and pilot deployment has begun on tri-band carrier aggregation
to increase spectral efficiency. These improvements will further extend the
Company’s leadership in delivering superior mobile broadband experience.
The Company has continued to innovate and differentiate by focusing on real
customer needs. A number of leading new services, including services in the mobile
commerce space, had been launched this year. SmarTone will remain at the
forefront of the mobile-first world by continuing to develop purposeful services which
bring meaningful value to customers.
Prospects
Leveraging on its strong brand, superior network, outstanding customer care and
purposeful services, the Company will grow service revenue through continuing
monetisation of customers’ data usage. Stringent cost control will remain a key focus
to mitigate increasing cost pressure.

- 3 -
The Company will continue to exceed customers’ rising expectation for quality mobile
service though its expertise and focus on network and service platform optimisation.
Together with the implementation of 4G on additional spectrum and deployment of
LTE-A carrier aggregation, the Company will extend its lead in providing outstanding
mobile broadband experience.
The Hong Kong telecom market remains competitive. We experienced a steady
improvement in our core mobile service business in the year under review, which
provides the foundation for future growth. With a strong brand and a healthy financial
position, the Company is well-placed to capture industry opportunities and bring
value to both customers and shareholders in the long term.
Appreciation
During the period under review, Mr. Douglas Li resigned from his post as Executive
Director and Chief Executive Officer. I would like to thank Mr. Li for his valuable
contribution at SmarTone over the years. Mr. Cheung Wing-yui and Mr. Fung Yuk-
lun, Allen, both being Non-Executive Directors, have been appointed as Deputy
Chairmen of SmarTone. Mr. Chau Kam-kun, Stephen, has been appointed as
Interim CEO effective 1 September 2015. I would like to congratulate Mr. Cheung,
Mr. Fung and Mr. Chau on their new positions.
I would also like to take this opportunity to express my gratitude to our customers and
shareholders for their continuing support, my fellow directors for their guidance as
well as our staff for their dedication and hard work.
Kwok Ping-luen, Raymond
Chairman
Hong Kong, 1 September 2015

- 4 -
MANAGEMENT DISCUSSION AND ANALYSIS
Review of financial results
The Group’s revenue increased by 41% to $18,659 million (2013/14: $13,244
million), comprising a 67% increase in handset and accessory sales and a 3%
increase in service revenue. EBITDA rose by 14% to $2,932 million (2013/14:
$2,563 million). Profit attributable to equity holders of the Company increased by
74% to $935 million (2013/14: $537 million).
Revenues rose by $5,414 million or 41% to $18,659 million (2013/14: $13,244
million).
Service revenue rose by $142 million or 3% to $5,564 million (2013/14: $5,423
million), driven by higher local mobile service revenue, partly offset by lower
roaming service revenue.
Local mobile service revenue rose by 4% amidst revenue increase from the
growth in customer number and improvement in market environment, partly
offset by customers’ migration from handset-bundled plans to SIM-only plans.
Roaming revenue fell due to the impact of continuing global downward trend in
inter-operator tariffs as well as reduced voice and SMS roaming traffic amidst
cannibalisation by over-the-top applications. Roaming revenue made up of
15% of Group’s service revenue (2013/14: 16%).
Customers’ migration to SIM-only plans masked a stronger improvement in
underlying service revenue as there was a corresponding reduction in handset
subsidy amortisation. Group service revenue net of handset subsidy
amortisation rose by 7%.
The Group achieved a 4% year-on-year growth in its Hong Kong customer
base. Postpaid customers made up of 69% of Hong Kong mobile customer
base. Average mobile postpaid churn rate improved to 0.9% (2013/14: 1.0%).
Postpaid ARPU stands at $294, incorporating the dilutive effect of the uptake
of the lower-priced 3G speed-capped plan. Excluding 3G speed-capped plan
customers, postpaid ARPU rose by 3%.
Handset and accessory sales rose by $5,273 million or 67% to $13,095 million
(2013/14: $7,822 million). Both sales volume and average unit selling price
increased.
Cost of inventories sold rose by $4,965 million or 64% to $12,708 million (2013/14:
$7,743 million). Such increase was broadly in line with the increase in handset and
accessory sales.

- 5 -
Staff costs rose by $62 million or 9% to $741 million (2013/14: $679 million) mainly
amid higher bonus provision and annual salary increment. Excluding bonus
provision, staff costs rose by 3%.
Other operating expenses rose by $19 million or 1% to $2,279 million (2013/14:
$2,260 million). Higher network operating costs, sales and marketing expenses,
rental and utilities and general administrative expenses were partly offset by lower
cost of services provided.
Depreciation and loss on disposal increased by $55 million or 8% to $724 million
(2013/14: $670 million) arising from higher disposal loss for dismantled sites and
higher capital expenditure incurred in the past 2 years for the rollout of 4G LTE
network and general capacity enhancement.
Handset subsidy amortisation fell by $168 million or 18% to $774 million (2013/14:
$942 million) amid continuing customers’ migration from handset bundled plans to
SIM-only plans in the past 12 months.
Mobile licence fee amortisation rose by $46 million or 32% to $190 million (2013/14:
$144 million) due to the commencement of amortisation of licence fee for 2,600 MHz
spectrum since July 2014.
Finance income rose by $5 million to $62 million (2013/14: $57 million) amid higher
average balance of bank deposits, partly offset by a lower return on surplus cash.
Finance costs excluding exchange gain / (loss) fell by $2 million to $182 million
(2013/14: $184 million) driven by lower accretion expenses on mobile licence fee
liabilities, partly offset by higher handset instalment charges due to significantly
higher sales of a popular handset model and higher bank borrowings.
Exchange gain related to cash, bank deposits and borrowings amounted to $7 million
(2013/14: a loss of $18 million).
Income tax expense amounted to $195 million (2013/14: $131 million), reflecting an
effective tax rate of 17.3% (2013/14: 19.7%). High effective tax rate in FY13/14 was
driven by an income tax provision of $22 million recorded in prior year, in light of the
uncertainty of the tax deductibility of certain upfront payments for spectrum utilisation
fees. Excluding this tax provision, effective tax rate for 2013/14 would have been
16.4%.
Macau operations reported an operating profit of $1 million (2013/14: operating loss
of $17 million) amid higher handset profits.

- 6 -
Capital structure, liquidity and financial resources
During the year under review, the Group was financed by share capital, internally
generated funds and bank and other borrowings. As at 30 June 2015, the Group
recorded share capital of $106 million, total equity of $3,908 million and total
borrowings of $2,969 million.
The Group’s cash resources remained robust with cash and bank balances (including
pledged bank deposits and short-term bank deposits) of $4,145 million (30 June
2014: $3,165 million).
As at 30 June 2015, the Group had bank and other borrowings of $2,969 million (30
June 2014: $2,840 million) of which 81% were denominated in United States dollars
and were arranged on a fixed rate basis. Net cash, after deducting bank and other
borrowings, amounted to $1,176 million as at 30 June 2015 (30 June 2014: $324
million). Net cash to EBITDA was 40% as at 30 June 2015 (30 June 2014: 13%).
The Group had net cash generated from operating activities and interest received of
$2,947 million and $54 million respectively during the year ended 30 June 2015. The
Group’s major outflows of funds during the year were payments for tax reserve
certificate, additions of handset subsidies, purchase of fixed assets, mobile licence
fees and dividends.
The directors are of the opinion that the Group can fund its capital expenditures and
working capital requirements for the financial year ending 30 June 2016 with internal
cash resources and available banking facilities.
Treasury policy
The Group invests its surplus funds in accordance with a treasury policy approved
from time to time by the board of directors. Surplus funds are placed in bank
deposits. Bank deposits are predominantly maintained in Hong Kong dollars,
Renminbi and other currencies.
The Group is required to arrange for banks to issue performance bonds and letters of
credit on its behalf. The Group may partially or fully collateralise such instruments by
bank deposits to lower the issuance costs.
Charges on assets
As at 30 June 2015, certain bank deposits of the Group, in aggregate amount of $3
million (30 June 2014: $6 million), were pledged for securing guarantees issued by
the banks. In addition, certain Hong Kong dollar denominated bank borrowings were
secured by certain assets of the Group and the carrying amount of the pledged
assets amounted to $85 million as at 30 June 2015 (30 June 2014: $87 million).

- 7 -
Interest rate exposure
The Group is exposed to interest rate changes that affect bank borrowings
denominated in Hong Kong dollars which accounted for 19% of the Group’s total
borrowings at 30 June 2015. The remaining 81% of the Group’s borrowings are fixed
rates borrowings. Hence, the Group is well protected from any potential rising
interest rates in the next few years. The Group does not currently undertake any
interest rate hedging.
Functional currency and foreign exchange exposure
The functional currency of the Company is the Hong Kong dollar. The Group is
exposed to other currency movements, principally in terms of certain trade
receivables, bank deposits, available-for-sale financial assets, trade payables and
bank and other borrowings denominated in Renminbi and United States dollars. The
Group does not currently undertake any foreign exchange hedging.
Contingent liabilities
Performance bonds
Certain banks, on the Group’s behalf, had issued performance bonds to the
telecommunications authorities of Hong Kong and Macau in respect of obligations
under mobile licences issued by those authorities. The total amount outstanding as
at 30 June 2015 under these performance bonds was $444 million (30 June 2014:
$527 million).
During the year under review, a bank issued a standby letter of credit of
$1,306,800,000 to a subsidiary of the Company in favor of the Office of
Communications Authority (“OFCA”) regarding the acceptance of the offer of the right
of first refusal for the re-assignment of one of the spectrum. A bank also issued
another letter of credit of $980,400,000, being the final amount of spectrum utilisation
fees determined during the auction.

- 8 -
Employees and share option scheme
The Group had 2,121 full-time employees as at 30 June 2015 (30 June 2014: 2,137),
with the majority of them based in Hong Kong. Total staff costs were $741 million for
the year ended 30 June 2015 (2013/14: $679 million).
Employees receive a remuneration package consisting of basic salary, bonus and
other benefits. Bonus payments are discretionary and depend, inter-alia, on both the
Group’s performance and the individual employee’s performance. Benefits include
retirement schemes, medical and dental care insurance. Employees are provided
with both internal and external training appropriate to each individual’s requirements.
The Group has share option schemes under which the Company may grant options
to participants, including directors and employees, to subscribe for shares of the
Company. During the year under review, no new share options were granted;
8,574,000 share options were exercised; and 600,000 share options were cancelled
or lapsed. 23,168,500 (30 June 2014: 32,342,500) share options were outstanding
as at 30 June 2015.

- 9 -
RESULTS The Board of Directors of SmarTone Telecommunications Holdings Limited (the “Company”)
is pleased to present the consolidated profit and loss account and consolidated statement of
comprehensive income for the year ended 30 June 2015 and the consolidated balance sheet
as at 30 June 2015 of the Company and its subsidiaries (the “Group”), along with selected
explanatory notes.
Consolidated Profit and Loss Account
For the year ended 30 June 2015
Note 2015 2014
$000 $000
Service revenue 5,564,144 5,422,640
Handset and accessory sales 13,094,692 7,821,760
──────── ────────
Revenues 4 18,658,836 13,244,400
Cost of inventories sold (12,707,801) (7,742,690)
Staff costs (740,518) (678,893)
Other operating expenses (2,278,726) (2,260,005)
Depreciation, amortisation and loss/(gain) on
disposal 7 (1,687,954) (1,755,413)
──────── ────────
Operating profit 1,243,837 807,399
Finance income 5 61,621 57,086
Finance costs 6 (174,921) (201,887)
──────── ────────
Profit before income tax 7 1,130,537 662,598
Income tax expense 8 (195,318) (130,583)
──────── ────────
Profit after income tax 935,219 532,015
════════ ════════
Attributable to
Equity holders of the Company 935,379 537,110
Non-controlling interests (160) (5,095)
──────── ────────
935,219 532,015
════════ ════════
Earnings per share for profit attributable to the
equity holders of the Company during the year
(expressed in cents per share) 9
Basic 89.2 51.7
Diluted 89.1 51.6
════════ ════════
Dividends 10
Interim dividend paid 284,456 186,631
Final dividend proposed 349,449 135,979
──────── ────────
633,905 322,610
════════ ════════
- 10 -
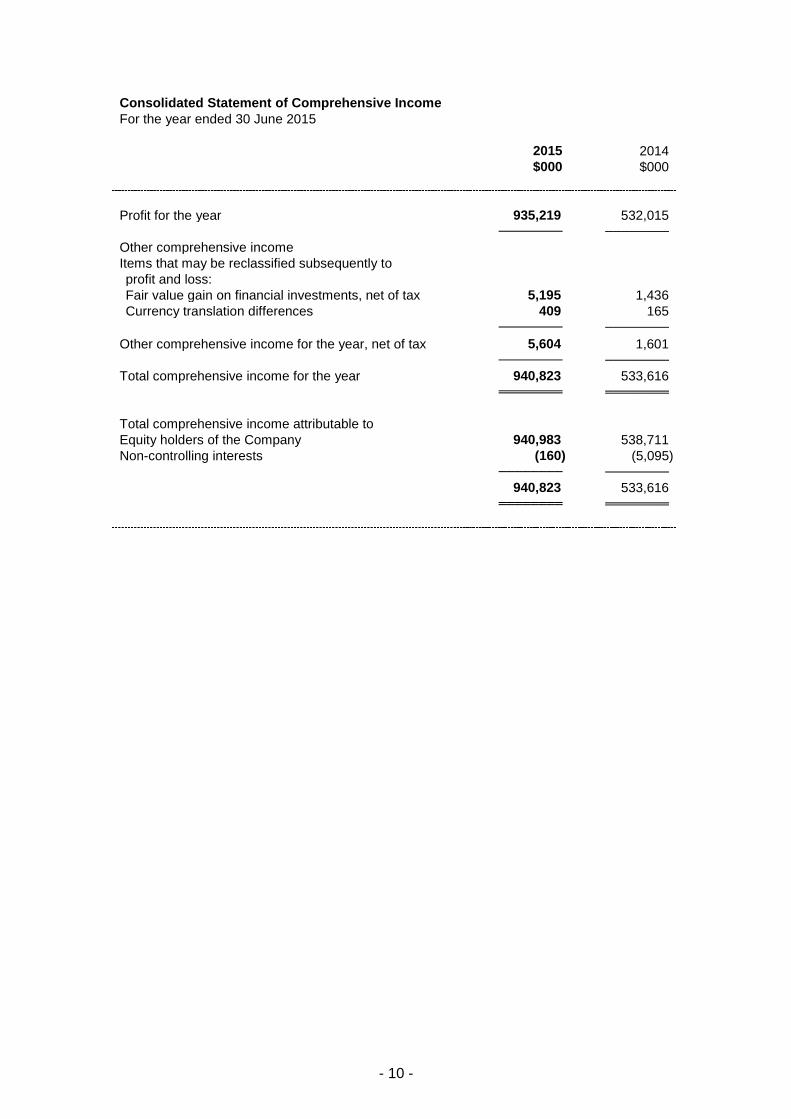
Consolidated Statement of Comprehensive Income
For the year ended 30 June 2015
2015 2014
$000 $000
Profit for the year 935,219 532,015
──────── ────────
Other comprehensive income
Items that may be reclassified subsequently to
profit and loss:
Fair value gain on financial investments, net of tax 5,195 1,436
Currency translation differences 409 165
──────── ────────
Other comprehensive income for the year, net of tax 5,604 1,601
──────── ────────
Total comprehensive income for the year 940,823 533,616
════════ ════════
Total comprehensive income attributable to
Equity holders of the Company 940,983 538,711
Non-controlling interests (160) (5,095)
──────── ────────
940,823 533,616
════════ ════════

- 11 -
Consolidated Balance Sheet
At 30 June 2015
Note 2015 2014 $000 $000
Non-current assets Leasehold land and land use rights 14,038 14,651 Fixed assets 3,340,063 3,396,056 Interest in an associate 3 3 Intangible assets 2,318,714 2,378,052 Deposits and prepayments 98,766 78,430 Deferred income tax assets 6,803 7,341 ──────── ──────── 5,778,387 5,874,533 ──────── ──────── Current assets Inventories 82,252 80,350 Financial investments 9,910 4,715 Trade receivables 11 332,495 435,749 Deposits and prepayments 169,049 179,168 Other receivables 44,801 52,746 Tax reserve certificate 252,362 - Pledged bank deposits 2,579 6,269 Short-term bank deposits 1,838,734 1,321,651 Cash and cash equivalents 2,303,783 1,836,773 ──────── ──────── 5,035,965 3,917,421 ──────── ──────── Current liabilities Trade payables 12 754,944 778,119 Other payables and accruals 863,191 859,250 Current income tax liabilities 543,525 343,065 Bank borrowings 124,351 100,901 Customer prepayments and deposits 556,482 488,338 Deferred income 253,222 192,319 Mobile licence fee liabilities 196,533 186,741 ──────── ──────── 3,292,248 2,948,733 ──────── ──────── Net current assets 1,743,717 968,688 ──────── ──────── Total assets less current liabilities 7,522,104 6,843,221 ──────── ──────── Non-current liabilities Customer prepayments and deposits 216,902 148,144 Asset retirement obligations 52,904 58,636 Bank and other borrowings 2,844,421 2,739,317 Mobile licence fee liabilities 365,922 502,192 Deferred income tax liabilities 134,002 145,402 ──────── ──────── 3,614,151 3,593,691 ──────── ──────── Net assets 3,907,953 3,249,530 ════════ ════════

- 12 -
Consolidated Balance Sheet
At 30 June 2015
2015 2014 $000 $000 Capital and reserves Share capital 105,668 104,599 Reserves 3,745,477 3,087,963 ──────── ──────── Total equity attributable to equity holders of the Company 3,851,145 3,192,562
Non-controlling interests 56,808 56,968 ──────── ──────── Total equity 3,907,953 3,249,530 ════════ ════════

- 13 -
Notes to the Consolidated Financial Statements
1 General information
SmarTone Telecommunications Holdings Limited (the "Company") and its subsidiaries
(together, the "Group") are principally engaged in the provision of telecommunications
services and the sale of handsets and accessories in Hong Kong and Macau.
The Company is a limited liability company incorporated in Bermuda. The address of
its head office and principal place of business is 31/F, Millennium City 2, 378 Kwun
Tong Road, Kwun Tong, Hong Kong.
The Company has its listing on The Stock Exchange of Hong Kong Limited.
These consolidated financial statements are presented in Hong Kong dollars, unless
otherwise stated. These consolidated financial statements have been approved for
issue by the Board of Directors on 1 September 2015.
2 Summary of significant accounting policies
The principal accounting policies applied in the preparation of these consolidated
financial statements have been consistently applied to all the years presented, unless
otherwise stated.
3 Basis of preparation
The consolidated financial statements of the Company have been prepared in
accordance with Hong Kong Financial Reporting Standards ("HKFRS"). The
consolidated financial statements have been prepared under the historical cost
convention, as modified by certain available-for-sale financial assets.
The consolidated financial statements are prepared in accordance with the applicable
requirements of the predecessor Companies Ordinance (Cap.32) for this financial year
and the comparative period.
The preparation of financial statements in conformity with HKFRS requires the use of
certain critical accounting estimates. It also requires management to exercise its
judgement in the process of applying the Group's accounting policies.
(a) Amendments to standards relevant to and adopted by the Group
The following amendments to standards are mandatory and relevant to the Group
for the financial year beginning on 1 July 2014.
Annual Improvements Project Annual Improvements 2010-2012 Cycle
2
Annual Improvements Project Annual Improvements 2011-2013 Cycle2
HKAS 32 (Amendments) Financial Instruments: Presentation –
Offsetting Financial Assets and
Financial Liabilities1
HKAS 36 (Amendments) Impairment of Assets: Recoverable Amount
Disclosures for Non-Financial Assets1
1
Effective for annual periods beginning on or after 1 January 2014. 2
Effective for annual periods beginning on or after 1 July 2014.
The adoption of the above amendments to standards has no significant impact on
these financial statements.

- 14 -
3 Basis of preparation (continued)
(b) New standards and amendments to standards have been issued but are not yet
effective and have not been early adopted by the Group
The following new standards and amendments to standards have been published
and are mandatory for the Group's accounting periods beginning on or after 1
July 2015 or later periods but which the Group has not early adopted.
Annual Improvements Project Annual Improvements 2012-2014 Cycle
1
HKAS 1 (Amendments) Disclosure Initiative1
HKAS 16 and HKAS 38 Clarification of Acceptable Methods of
(Amendments) Depreciation and Amortisation1
HKAS 16 and HKAS 41 Agriculture: Bearer Plants1
(Amendments)
HKAS 27 (Amendments) Equity Method in Separate Financial Statements1
HKFRS 9 Financial Instruments2
HKFRS 10 and HKAS 28 Investments in Associates and Joint Ventures
(Amendments) – Sale or Contribution of Assets between an
Investor and its Associate or Joint Venture1
HKFRS 10, HKFRS 12 and Investment Entities: Applying the Consolidation
HKAS 28 (Amendments) Exception1
HKFRS 11 (Amendments) Accounting for Acquisitions of Interests in Joint
Operation1
HKFRS 14 Regulatory Deferral Accounts1
HKFRS 15 Revenue from Contracts with Customers2
1 Effective for annual periods beginning on or after 1 January 2016.
2 Effective for annual periods beginning on or after 1 January 2018.
The Group is in the process of assessing the impact of these new standards and
amendments to standards and is not yet in a position to state whether they would
have a significant impact on the Group’s results of operation and financial
position.
In addition, the revised Rules Governing the Listing of Securities on the Stock
Exchange on disclosure of financial information with reference to the new Hong
Kong Companies Ordinance (Cap. 622) will come into operation as from the
Group’s first financial year ending on or after 30 June 2016. The Group is in the
process of making an assessment of expected impact of the changes. So far it
has concluded that the impact is unlikely to be significant and only the
presentation and disclosure of information in the consolidated financial
statements will be affected.

- 15 -
4 Segment reporting
The chief operating decision-maker (the “CODM”) has been identified as the Group’s
senior executive management. The CODM reviews the Group’s internal reporting in
order to assess performance and allocate resources. The CODM has determined the
operating segments based on these reports.
The CODM considers the business from a geographic perspective. The CODM
measures the performance of its segments based on earnings before interest, tax,
depreciation, amortisation and loss/gain on disposal (“EBITDA”) and operating profit.
An analysis of the Group’s segment information by geographical segment is set out as
follows:
(a) Segment results
For the year ended 30 June 2015
Hong Kong Macau Elimination Consolidated
$000 $000 $000 $000
Revenues 18,438,493 858,149 (637,806) 18,658,836
════════ ═══════ ═══════ ═════════
EBITDA 2,871,944 59,847 - 2,931,791
Depreciation,
amortisation and loss
on disposal (1,629,321) (58,987) 354 (1,687,954)
──────── ─────── ─────── ─────────
Operating profit 1,242,623 860 354 1,243,837
════════ ═══════ ═══════
Finance income 61,621
Finance costs (174,921)
────────
Profit before income tax 1,130,537
═════════
Other information
Additions to fixed assets 639,211 40,873 - 680,084
Additions to intangible
assets 909,383 14,471 - 923,854
Depreciation 661,855 43,852 (55) 705,652
Amortisation of
leasehold land and
land use rights 709 - - 709
Amortisation of
intangible assets 950,217 13,544 - 963,761
Loss on disposal of fixed
assets 16,776 1,591 (299) 18,068
Gain on disposal of
financial investments (236) - - (236)
Impairment loss of trade
receivables 13,431 89 - 13,520
Reversal of impairment
loss of inventories (6,069) (510) - (6,579)
════════ ═══════ ═══════ ═════════

- 16 -
4 Segment reporting (continued)
(a) Segment results (continued)
For the year ended 30 June 2014
Hong Kong Macau Elimination Consolidated
$000 $000 $000 $000
Revenues 13,031,625 753,628 (540,853) 13,244,400
════════ ═══════ ═══════ ════════
EBITDA 2,515,636 47,176 - 2,562,812
Depreciation,
amortisation and gain
on disposal (1,692,785) (63,716) 1,088 (1,755,413)
──────── ─────── ─────── ────────
Operating profit/(loss) 822,851 (16,540) 1,088 807,399
════════ ═══════ ═══════
Finance income 57,086
Finance costs (201,887)
────────
Profit before income tax 662,598
════════
Other information
Additions to fixed assets 899,264 36,160 - 935,424
Additions to intangible
assets 470,035 11,645 - 481,680
Depreciation 638,678 45,897 (104) 684,471
Amortisation of
leasehold land and
land use rights 706 - - 706
Amortisation of
intangible assets 1,068,299 17,599 - 1,085,898
(Gain)/loss on disposal
of fixed assets (14,704) 220 (984) (15,468)
Gain on disposal of
financial investments (194) - - (194)
Impairment loss of trade
receivables 14,531 183 - 14,714
Impairment loss of
inventories 3,991 157 - 4,148
════════ ═══════ ═══════ ════════
Sales between segments are carried out in accordance with terms mutually
agreed by the relevant parties.

- 17 -
4 Segment reporting (continued)
(b) Segment assets/(liabilities)
At 30 June 2015
Hong Kong Macau Unallocated Consolidated
$000 $000 $000 $000
Segment assets 10,184,261 361,013 269,078 10,814,352
════════ ═══════ ════════ ═════════
Segment liabilities (6,079,931) (148,941) (677,527) (6,906,399)
════════ ═══════ ════════ ═════════
At 30 June 2014
Hong Kong Macau Unallocated Consolidated
$000 $000 $000 $000
Segment assets 9,396,525 383,370 12,059 9,791,954
════════ ═══════ ════════ ═════════
Segment liabilities (5,893,369) (160,588) (488,467) (6,542,424)
════════ ═══════ ════════ ═════════
The total of non-current assets other than interest in an associate and deferred
income tax assets located in Hong Kong is $5,517,589,000 (2014:
$5,609,187,000), and the total of these non-current assets located in Macau is
$253,992,000 (2014: $258,002,000).
Unallocated assets consist of tax reserve certificate, interest in an associate,
financial investments and deferred income tax assets.
Unallocated liabilities consist of current income tax liabilities and deferred income
tax liabilities.
5 Finance income
2015 2014
$000 $000
Interest income from bank deposits 60,473 56,453
Accretion income 1,148 633
────── ──────
61,621 57,086
══════ ══════
Accretion income represents changes in the rental deposits due to passage of time
calculated by applying an effective interest rate method of allocation to the amount of
rental deposits at the beginning of the year.

- 18 -
6 Finance costs
2015 2014
$000 $000
Interest expense
Bank and other borrowings wholly repayable
within 5 years 9,103 8,988
Bank and other borrowings not wholly
repayable within 5 years 91,088 85,741
Bank charges for credit card instalment 13,192 6,949
Accretion expenses
Mobile licence fee liabilities 66,866 80,085
Asset retirement obligations 1,777 2,116
Net exchange (gain)/loss on financing
activities (7,105) 18,008
─────── ───────
174,921 201,887
═══════ ═══════
Accretion expenses represent changes in the mobile licence fee liabilities and asset
retirement obligations due to passage of time calculated by applying an effective
interest rate method of allocation to the amount of the liabilities at the beginning of the
year.
7 Profit before income tax
Profit before income tax is stated after charging and crediting the following:
2015 2014
$000 $000
Charging:
Cost of services provided 421,395 467,382
Operating lease rentals for land and buildings,
transmission sites and leased lines 1,017,197 987,197
Impairment loss of trade receivables (note 11) 13,520 14,714
Impairment loss of inventories - 4,148
Auditor’s remuneration
- Audit services 2,549 2,343
- Non-audit services 1,062 1,290
Net exchange loss - 25,120
Loss on disposal of fixed assets 18,068 -
Depreciation of fixed assets, leasehold land
and land use rights 706,361 685,177
Amortisation of handset subsidies 773,942 942,068
Amortisation of mobile licence fees 189,819 143,830
Crediting:
Gain on disposal of fixed assets - 15,468
Gain on disposal of financial investments 236 194
Net exchange gain 278 -
Reversal of impairment loss of inventories 6,579 -
══════ ══════

- 19 -
8 Income tax expense
Hong Kong profits tax has been provided at the rate of 16.5% (2014: 16.5%) on the
estimated assessable profit for the year. Income tax on overseas profits has been
calculated on the estimated assessable profit for the year at the tax rates prevailing in
the countries in which the Group operates.
(a) The amount of income tax expense recognised in the consolidated profit and loss
account represents:
2015 2014
$000 $000
Current income tax
Hong Kong profits tax 203,774 95,266
Overseas tax 2,388 1,529
(Over)/under-provision in prior years
Hong Kong profits tax (133) 249,169
Overseas tax 151 -
─────── ───────
206,180 345,964
Deferred income tax assets 538 208
Deferred income tax liabilities (11,400) 22,426
Over-provision in prior years
Deferred income tax
-
(238,015)
─────── ───────
Income tax expense 195,318 130,583
═══════ ═══════
(b) The tax on the Group’s profit before income tax differs from the theoretical
amount that would arise using the applicable tax rate of the home country of the
Group as follows:
2015 2014
$000 $000
Profit before income tax 1,130,537 662,598
═══════ ═══════
Notional tax on profit before income tax,
calculated at Hong Kong tax rate of 16.5%
(2014: 16.5%) 186,539 109,329
Effect of different tax rates in other countries 1,275 1,457
Expenses not deductible for tax purposes 131 3,134
Income not subject to tax (10,997) (9,179)
Under-provision in prior years 18 11,154
Tax loss not recognised 1,550 4,063
Temporary differences not recognised 16,802 10,625
──────── ───────
Income tax expense 195,318 130,583
═══════ ════════

- 20 -
9 Earnings per share
(a) Basic
Basic earnings per share is calculated by dividing the profit attributable to equity
holders of the Company by the weighted average number of ordinary shares in
issue.
2015 2014
Profit attributable to equity holders of the
Company ($000)
935,379
537,110
═══════════ ═══════════
Weighted average number of ordinary
shares in issue
1,049,218,107
1,039,783,051
═══════════ ═══════════
Basic earnings per share (cents per share) 89.2 51.7
═══════════ ═══════════
(b) Diluted
Diluted earnings per share is calculated by adjusting the weighted average
number of ordinary shares outstanding to assume conversion of all dilutive
potential ordinary shares. For dilutive share options, the number of shares that
would have been issued assuming the exercise of the share options less the
number of shares that could have been issued at fair value (determined as the
average market price per share for the year) for the same total proceeds is the
number of shares issued for no consideration. The resulting number of shares
issued for no consideration is included in the weighted average number of
ordinary shares as the denominator for calculating diluted earnings per share.
2015 2014
Profit attributable to equity holders of the
Company ($000)
935,379
537,110
═══════════ ═══════════
Weighted average number of ordinary
shares in issue
1,049,218,107
1,039,783,051
Adjustment for dilutive share options 509,833 128,996
─────────── ───────────
Weighted average number of ordinary
shares for diluted earnings per share
1,049,727,940
1,039,912,047
═══════════ ═══════════
Diluted earnings per share (cents per share) 89.1 51.6
═══════════ ═══════════

- 21 -
10 Dividends
2015 2014
$000 $000
Interim dividend, paid, of 27 cents
(2014: 18 cents) per share
284,456
186,631
Final dividend, proposed, of 33 cents
(2014: 13 cents) per share
349,449
135,979
─────── ───────
633,905 322,610
═══════ ════════
For the dividends attributable to the years ended 30 June 2015 and 2014, scrip
dividend elections were offered to shareholders.
At a meeting held on 1 September 2015, the directors proposed a final dividend of 33
cents per share. This proposed dividend is not reflected as a dividend payable in
these financial statements, but will be reflected as an appropriation of retained profits
for the year ending 30 June 2016.
The proposed final dividend is calculated based on the number of shares in issue at
the date of approval of these financial statements.
The aggregate amounts of the dividends paid and proposed during 2015 and 2014
have been disclosed in the consolidated profit and loss account in accordance with the
Hong Kong Companies Ordinance.
11 Trade receivables
The credit periods granted by the Group to its customers generally range from 15 days
to 45 days from the date of invoice. An ageing analysis of trade receivables, net of
provision, based on invoice date is as follows:
2015 2014
$000 $000
Current to 30 days 296,580 410,723
31 - 60 days 17,603 12,746
61 - 90 days 5,420 3,683
Over 90 days 12,892 8,597
─────── ───────
332,495 435,749
═══════ ═══════
There is no concentration of credit risk with respect to trade receivables, as the Group
has a large number of customers.
The Group has recognised a loss of $13,520,000 (2014: $14,714,000) for the
impairment of its trade receivables during the year ended 30 June 2015. The loss has
been included in “other operating expenses” in the consolidated profit and loss
account. Amounts charged to the allowance account are generally written off, when
there is no expectation of recovering additional cash.
- 22 -
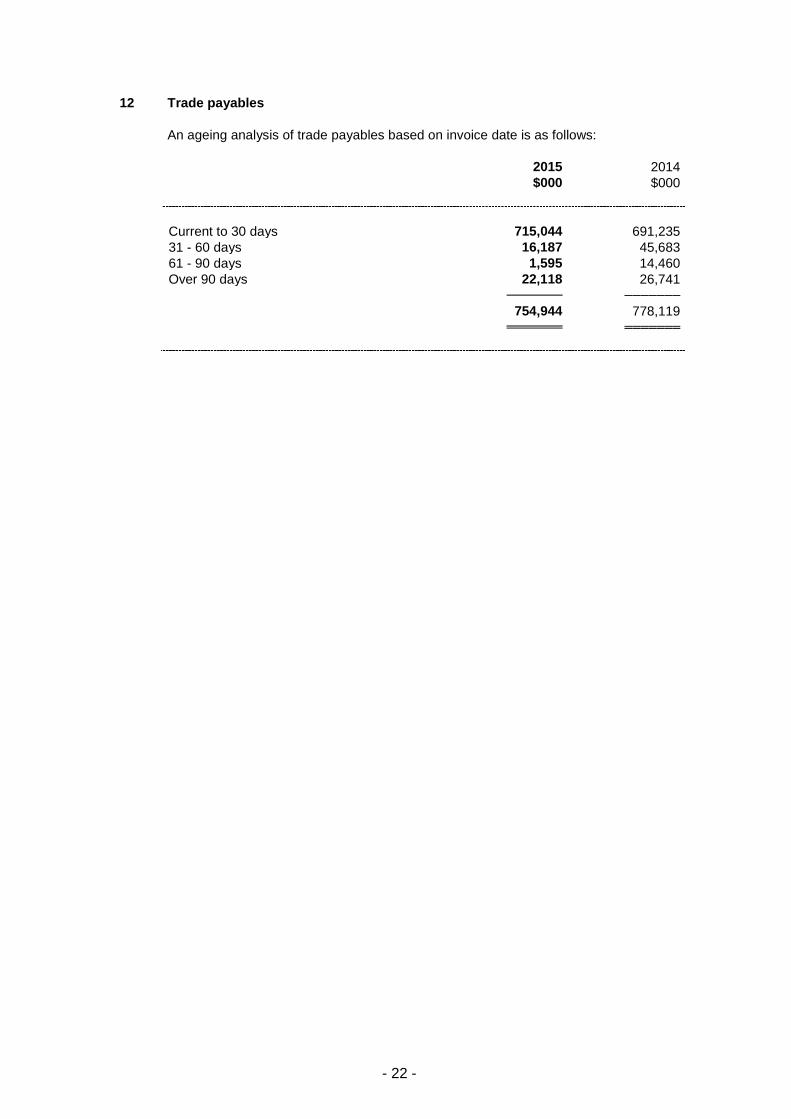
12 Trade payables
An ageing analysis of trade payables based on invoice date is as follows:
2015 2014
$000 $000
Current to 30 days 715,044 691,235
31 - 60 days 16,187 45,683
61 - 90 days 1,595 14,460
Over 90 days 22,118 26,741
─────── ───────
754,944 778,119
═══════ ═══════

- 23 -
DIVIDENDS
The Directors recommended the payment of a final dividend for the year ended 30
June 2015 of 33 cents per share (2013/14: 13 cents). The proposed final dividend,
together with the interim dividend of 27 cents per share paid by the Company during
the year (2013/14: 18 cents), makes a total dividend for the year of 60 cents per
share.
Subject to approval of the shareholders at the forthcoming Annual General Meeting,
the proposed final dividend will be payable in cash, with an option to receive new and
fully paid shares in lieu of cash under a scrip dividend scheme (the “Scrip Dividend
Scheme”). The Directors may, after having made enquiry regarding the legal
restrictions under the laws of the relevant place and the requirements of the relevant
regulatory body or stock exchange in relation to the Scrip Dividend Scheme, exclude
any shareholder outside Hong Kong from the Scrip Dividend Scheme provided that
the Directors consider such exclusion to be necessary or expedient on account either
of the legal restrictions under the laws of the relevant place or the requirements of the
relevant regulatory body or stock exchange in that place. Such shareholders will
receive the proposed final dividend in cash. A circular containing details of the Scrip
Dividend Scheme and the relevant election form are expected to be sent to
shareholders on or about Monday, 23 November 2015.
The Scrip Dividend Scheme is conditional upon the passing of the resolution relating
to the payment of the proposed final dividend at the forthcoming Annual General
Meeting and the Listing Committee of The Stock Exchange of Hong Kong Limited
granting the listing of and permission to deal in the new shares to be issued under
the Scrip Dividend Scheme.
The proposed final dividend will be distributed, and the share certificates issued
under the Scrip Dividend Scheme will be sent on or about Tuesday, 22 December
2015 to shareholders whose names appear on the Register of Members of the
Company on Thursday, 12 November 2015.
CLOSURE OF REGISTER OF MEMBERS
The Annual General Meeting of the Company is scheduled to be held on Wednesday,
4 November 2015. For determining the entitlement to attend and vote at the Annual
General Meeting, the Register of Members of the Company will be closed from
Monday, 2 November 2015 to Wednesday, 4 November 2015, both days inclusive,
during which period no transfer of shares will be effected. In order to be eligible to
attend and vote at the Annual General Meeting, all transfers accompanied by the
relevant share certificates must be lodged with the Company’s Share Registrar in
Hong Kong, Computershare Hong Kong Investor Services Limited at Shops 1712-
1716, 17th Floor, Hopewell Centre, 183 Queen’s Road East, Hong Kong for
registration no later than 4:30 p.m. on Friday, 30 October 2015.

- 24 -
The record date for entitlement to the proposed final dividend is Thursday, 12
November 2015. For determining the entitlement to the proposed final dividend, the
Register of Members of the Company will be closed for one day on Thursday, 12
November 2015 during which no transfer of shares will be effected. In order to
qualify for the proposed final dividend, all transfers accompanied by the relevant
share certificates must be lodged with the Company’s Share Registrar in Hong Kong,
Computershare Hong Kong Investor Services Limited (address as per above) for
registration no later than 4:30 p.m. on Wednesday, 11 November 2015.
PURCHASE, SALE OR REDEMPTION OF SHARES
At no time during the year ended 30 June 2015 was there any purchase, sale or
redemption by the Company, or any of its subsidiaries, of the Company’s shares.
REVIEW OF ANNUAL RESULTS BY AUDIT COMMITTEE
The Audit Committee of the Company has reviewed the financial statements as well
as the internal audit reports of the Group for the year ended 30 June 2015. The
Committee was satisfied that the accounting policies and methods of computation
adopted by the Group are appropriate and in line with the market participants in Hong
Kong. The Committee found no unusual items that were omitted from the financial
statements and was satisfied with the disclosures of data and explanations shown in
the financial statements. The Committee was also satisfied with the internal control
measures adopted by the Group.
The financial information disclosed above complies with the disclosure requirements
of Appendix 16 of the Rules Governing the Listing of Securities on The Stock
Exchange of Hong Kong Limited (the “Listing Rules”).
CORPORATE GOVERNANCE
The Company is committed to building and maintaining high standards of corporate
governance. Throughout the year ended 30 June 2015, the Company has applied
the principles and complied with the requirements set out in the Corporate
Governance Code and Corporate Governance Report (the “CG Code”) contained in
Appendix 14 of the Listing Rules, except for the following deviations:
Code Provision A.4.1 of the CG Code provides that non-executive directors should be
appointed for a specific term. Non-Executive Directors of the Company are not
appointed with specific term but they are required to retire from office by rotation and
are subject to re-election by shareholders at annual general meeting once every
three years in accordance with the Company’s Bye-laws. As such, no Director has a
term of appointment longer than three years.

- 25 -
Code Provision A.6.7 of the CG Code provides that independent non-executive
directors and other non-executive directors should attend general meetings and
develop a balanced understanding of the views of shareholders. Code Provision
E.1.2 of the CG Code also provides that the chairman of the board should attend the
annual general meeting. Mr. Kwok Ping-luen, Raymond, Non-Executive Director and
Chairman of the Board, and Mr. Yang Xiang-dong, Mr. Gan Fock-kin, Eric and Mrs. Ip
Yeung See-ming, Christine, Independent Non-Executive Directors, were unable to
attend the annual general meeting of the Company held on 4 November 2014 due to
overseas commitments or other prior engagements. The remaining eight
Independent Non-Executive Directors and Non-Executive Directors (representing
67% of all independent non-executive and non-executive members of the Board at
the time) attended the said meeting in person to listen to the views expressed by the
shareholders. Mr. Cheung Wing-yui, a Non-Executive Director of the Company, took
the chair of the said meeting pursuant to the Bye-laws of the Company.
The Board will continue to monitor and review the Company's corporate governance
practices to ensure compliance with the CG Code.
Full details of the report on corporate governance will be set out in the Company’s
2014/15 Annual Report.
By order of the Board
Mak Yau-hing, Alvin
Company Secretary
Hong Kong, 1 September 2015
As at the date of this announcement, the Executive Directors of the Company are Mr. Chau
Kam-kun, Stephen (Interim Chief Executive Officer) and Mr. CHAN Kai-lung, Patrick; Non-
Executive Directors are Mr. KWOK Ping-luen, Raymond (Chairman), Mr. CHEUNG Wing-yui
(Deputy Chairman), Mr. Fung Yuk-lun, Allen (Deputy Chairman), Mr. David Norman PRINCE,
Mr. SIU Hon-wah, Thomas, Mr. TSIM Wing-kit, Alfred and Mr. John Anthony MILLER;
Independent Non-Executive Directors are Dr. LI Ka-cheung, Eric, JP, Mr. NG Leung-sing, JP,
Mr. YANG Xiang-dong, Mr. GAN Fock-kin, Eric and Mrs. IP YEUNG See-ming, Christine.