smartphone market in india 2012 - public and private players
DESCRIPTION
Smartphone Market in IndiaTRANSCRIPT

Smartphone Market in India (Part V)
July 2012ISIEmergingMarketsPDF in-nmimsmum from 122.170.126.130 on 2013-01-27 06:38:05 EST. DownloadPDF.
Downloaded by in-nmimsmum from 122.170.126.130 at 2013-01-27 06:38:05 EST. ISI Emerging Markets. Unauthorized Distribution Prohibited.

2SMARTPHONE MARKET IN INDIA 2012.PPT
Executive Summary
Drivers:
Market
Drivers & Challenges
Market Trends
SmartphonePlayer Profile
Smartphone shipments in India is expected to reach 18.5 mn units by 2012, over double that of 2011 In the Q1 2012, smartphone segment in India achieved a quarterly growth of 6% despite of global decline of smartphone sales by 2%Amongst smartphone platforms in India, Android is the market leader followed by Symbian
Multi‐Core Processor
High Resolution Touch Screen Display
Smartphone on Contract
Rise of the Phablets
Challenges:
Major Players
Apple Inc. HTC Corporation Research in Motion
LG Electronics Nokia India Samsung India
Low Penetration in Suburban and Rural Areas
Security and Privacy Concern
Increase in Disposable Income and Changing Consumer Behaviour
Introduction and Availability of Next Generation Cellular Networks
Constant Reduction in Prices
ISIEmergingMarketsPDF in-nmimsmum from 122.170.126.130 on 2013-01-27 06:38:05 EST. DownloadPDF.
Downloaded by in-nmimsmum from 122.170.126.130 at 2013-01-27 06:38:05 EST. ISI Emerging Markets. Unauthorized Distribution Prohibited.

3SMARTPHONE MARKET IN INDIA 2012.PPT
•Introduction
•Smartphone Market Overview
•Drivers & Challenges
•Market Opportunities
•Market Trends
•Smartphone Player ProfilesSmartphone Price and Specifications
•Strategic Recommendations
•Appendix
ISIEmergingMarketsPDF in-nmimsmum from 122.170.126.130 on 2013-01-27 06:38:05 EST. DownloadPDF.
Downloaded by in-nmimsmum from 122.170.126.130 at 2013-01-27 06:38:05 EST. ISI Emerging Markets. Unauthorized Distribution Prohibited.

4SMARTPHONE MARKET IN INDIA 2012.PPT
Feature‐Price Trade‐Off Matrix for Smartphone Players in India
Price
Features
•Apple and HTC largely provide expensive premium products, while the former has no offering in the entry level smartphone segment, the latter has introduced few in recent times
• Some players, such as Samsung and Nokia, offer vast number of products belonging to multiple price segment and having variable features‐set, thus despite of having one of the highest priced and feature rich smartphones, they are positioned lower in the matrix
•Domestic players compromise on some features to offer smartphones at much lower cost than the established foreign companies
RIM
APPLEHTC
NOKIA
LG
SONY ERICSSON
SAMSUNG
SONY
LAVA
MICROMAX
MOTOROLA
Foreign Company
Domestic Company
ISIEmergingMarketsPDF in-nmimsmum from 122.170.126.130 on 2013-01-27 06:38:05 EST. DownloadPDF.
Downloaded by in-nmimsmum from 122.170.126.130 at 2013-01-27 06:38:05 EST. ISI Emerging Markets. Unauthorized Distribution Prohibited.

5SMARTPHONE MARKET IN INDIA 2012.PPT
Public: Foreign Company – Apple Inc. (1/3)
Key People
Products and Services
Company Information Offices and Centres – India
Corporate Address
19 Floor, Concorde Tower C,
UB City No 24 Vittal Mallya Road
Bangalore 560‐001
Tel No. 91‐80‐41409000
Fax No. NA
Website www.apple.com
Year of Incorporation 1976
Ticker Symbol AAPL
Stock Exchange NasdaqGS
Category Products/Services
Products
• Mobile Phone
• Tablet
• Desktop and Notebook PC
Name Designation
Arthur D. Levinson Chairman
Timothy D. Cook Chief Executive Officer
Jeffrey E. Williams Senior Vice President of Operations
Note: The list of products and services is not exhaustive
India Head Office
Bangalore
ISIEmergingMarketsPDF in-nmimsmum from 122.170.126.130 on 2013-01-27 06:38:05 EST. DownloadPDF.
Downloaded by in-nmimsmum from 122.170.126.130 at 2013-01-27 06:38:05 EST. ISI Emerging Markets. Unauthorized Distribution Prohibited.

6SMARTPHONE MARKET IN INDIA 2012.PPT
Public: Foreign Company – Apple Inc. (2/3)
Financial Snapshot Key Ratios
Financial Summary
• The company incurred a net profit of INR 1,280.3 bn in FY 2011, as compared to net profit of INR 633.1 bn in FY 2010
• The company reported total income of INR 5,377.5 bn in FY 2011, as compared to INR 2,960.9 bn in FY 2010
• The company earned an operating margin of 31.03 per cent in FY 2011, an increase of 2.98 percentage points over FY 2010
• The company reported debt to equity ratio of 0.52 in FY 2011, a decrease of 9.47 per cent over FY 2010
Key Financial Performance Indicators
Indicators Value (28/06/2012)Market Capitalization (INR bn) 30,248.3
Total Enterprise Value (INR mn) 28,970.5EPS (INR) 2,329.8PE Ratio (Absolute) 13.89
Improved Decline
Net Profit/LossTotal Income
5,377,484.3
2,079,087.01,772,685.2
0
2,000,000
4,000,000
6,000,000
0
500,000
1,000,000
1,500,000
RevenueINR mn
ProfitINR bn
20112010
2,960,916.5
20092008
Particulars y‐o‐y change (2011‐10)
2011 2010 2009 2008
Profitability RatiosOperating Margin 2.98 31.03% 28.05% 27.07% 21.83%
Net Margin 2.43 23.81% 21.38% 18.99% 16.04%
Profit Before Tax Margin 3.13 31.42% 28.29% 27.82% 23.46%
Return on Equity 4.51 33.83% 29.32% 26.03% 27.44%
Return on Capital Employed 4.47 38.22% 33.76% 32.62% 33.56%
Return on Working Capital 85.45 152.32% 66.87% 41.07% 32.82%
Return on Assets 3.64 22.28% 18.64% 17.34% 16.92%
Return on Fixed Assets 39.42 333.32% 293.90% 278.77% 249.25%
Cost RatiosOperating costs (% of Sales) ‐3.03 68.78% 71.81% 72.64% 77.79%
Administration costs (% of Sales)
‐1.44 7.02% 8.46% 9.67% 10.03%
Interest costs (% of Sales) NA NA NA NA NA
Liquidity RatiosCurrent Ratio ‐20.03% 1.61 2.01 2.74 2.64
Cash Ratio ‐24.95% 0.93 1.24 2.04 1.95
Leverage RatiosDebt to Equity Ratio ‐9.47% 0.52 0.57 0.50 0.62
Debt to Capital Ratio NA NA NA NA NA
Interest Coverage Ratio NA NA NA NA NA
Efficiency RatiosFixed Asset Turnover 1.75% 13.92 13.68 14.52 15.27
Asset Turnover 7.22% 0.93 0.87 0.90 1.04
Current Asset Turnover 53.75% 2.41 1.56 1.36 1.25
Working Capital Turnover 104.37% 6.36 3.11 2.14 2.01
Capital Employed Turnover 3.52% 1.41 1.36 1.36 1.68
ISIEmergingMarketsPDF in-nmimsmum from 122.170.126.130 on 2013-01-27 06:38:05 EST. DownloadPDF.
Downloaded by in-nmimsmum from 122.170.126.130 at 2013-01-27 06:38:05 EST. ISI Emerging Markets. Unauthorized Distribution Prohibited.

7SMARTPHONE MARKET IN INDIA 2012.PPT
Public: Foreign Company – Apple Inc. (3/3)
Key Business Segments Key Geographic Segments
Key Information
Description Details
Overview
• Apple Inc. designs, manufactures, and markets mobile communication and media devices, personal computers, and portable digital music players
• It also sells software, services, peripherals, networking solutions, and third‐party digital content and applications worldwide
• Apple Inc. operates in India via its subsidiary, Apple India Pvt. Ltd.
25% 28% 29% 26%
19% 13%13%7%7%5%6%5%5%
0%
50%
100%
2008
1,742,338
201120102009
5,346,418
15%
2,946,866
35%
21%16%
44% 44%
2,057,080
38%
0%
50%
100%
20112010
5,346,418
39%
2,946,866
52%
44%
2009
50%
12%2% 4%
46%
2,057,080
52%
Note: Business Segments and Geographic Segments are based on total revenues
Americas Europe Japan Asia Pacific Retail ChinaUnited States (U.S.) Other Countries
ISIEmergingMarketsPDF in-nmimsmum from 122.170.126.130 on 2013-01-27 06:38:05 EST. DownloadPDF.
Downloaded by in-nmimsmum from 122.170.126.130 at 2013-01-27 06:38:05 EST. ISI Emerging Markets. Unauthorized Distribution Prohibited.

8SMARTPHONE MARKET IN INDIA 2012.PPT
Public: Foreign Company – HTC Corporation (1/3)
Key People
Products and Services
Company Information Offices and Centres – India
Corporate Address 23 Xinghua Road, Taoyuan, Taiwan
Tel No. NA
Fax No. NA
Website www.htc.com
Year of Incorporation 1997
Ticker Symbol 2498
Stock Exchange TSEC
Category Products/Services
Product• Mobile Phone
• TabletName Designation
Peter Chou Chief Executive Officer
Matthew Vincent Costello Chief Operating Officer
Ajay Sharma Country Head of India
Note: The list of products and services is not exhaustive
India Head Office
ISIEmergingMarketsPDF in-nmimsmum from 122.170.126.130 on 2013-01-27 06:38:05 EST. DownloadPDF.
Downloaded by in-nmimsmum from 122.170.126.130 at 2013-01-27 06:38:05 EST. ISI Emerging Markets. Unauthorized Distribution Prohibited.

9SMARTPHONE MARKET IN INDIA 2012.PPT
Public: Foreign Company – HTC Corporation (2/3)
Financial Snapshot Key Ratios
Financial Summary
• The company incurred a net profit of INR 108.6 bn in FY 2011, ascompared to net profit of INR 60.5 bn in FY 2010
• The company reported total income of INR 820.7 bn in FY 2011, as compared to INR 427.8 bn in FY 2010
• The company earned an operating margin of 14.68 per cent in FY 2011, a decrease of 1.1 percentage points over FY 2010
• The company reported debt to equity ratio of 1.49 in FY 2011, a decrease of 4.03 per cent over FY 2010
Key Financial Performance Indicators
Indicators Value (28/06/2012)Market Capitalization (INR bn) 594.9
Total Enterprise Value (INR bn) 444.0EPS (INR) NAPE Ratio (Absolute) 6.26
Improved Decline
Net Profit/LossTotal Income
820,764.7
228,061.7
0
500,000
1,000,000
0
50,000
100,000
150,000
ProfitINR bn
RevenueINR bn
20112010
427,787.0
2009
210,922.2
2008
Particulars y‐o‐y change (2012‐11)
2011 2010 2009 2008
Profitability RatiosOperating Margin ‐1.10 14.68% 15.78% 16.93% 19.72%
Net Margin ‐0.91 13.23% 14.14% 15.55% 18.61%
Profit Before Tax Margin ‐0.83 15.25% 16.08% 17.46% 20.62%
Return on Equity 7.60 60.51% 52.91% 34.43% 47.18%
Return on Capital Employed 8.09 67.13% 59.05% 37.48% 49.96%
Return on Working Capital 75.43 150.07% 74.64% 44.18% 58.13%
Return on Assets 3.58 24.34% 20.77% 18.93% 24.74%
Return on Fixed Assets 28.31 319.77% 291.46% 227.97% 346.05%
Cost RatiosOperating costs (% of Sales) 1.06 85.23% 84.17% 82.96% 80.08%
Administration costs (% of Sales)
0.49 10.10% 9.61% 9.11% 7.41%
Interest costs (% of Sales) 0.01 0.01% 0.00% 0.00% 0.01%
Liquidity RatiosCurrent Ratio ‐12.79% 1.27 1.46 1.95 1.90
Cash Ratio ‐8.37% 0.60 0.65 1.21 1.18
Leverage RatiosDebt to Equity Ratio ‐4.03% 1.49 1.55 0.82 0.91
Debt to Capital Ratio NA NA NA NA NA
Interest Coverage Ratio ‐82.25% 2219.40 12502.34 11161.05 2901.67
Efficiency RatiosFixed Asset Turnover 16.94% 24.03 20.55 14.57 18.41
Asset Turnover 24.95% 1.83 1.46 1.21 1.32
Current Asset Turnover 45.65% 2.41 1.65 1.38 1.46
Working Capital Turnover 114.30% 11.28 5.26 2.82 3.09
Capital Employed Turnover 21.89% 4.55 3.73 2.20 2.51
ISIEmergingMarketsPDF in-nmimsmum from 122.170.126.130 on 2013-01-27 06:38:05 EST. DownloadPDF.
Downloaded by in-nmimsmum from 122.170.126.130 at 2013-01-27 06:38:05 EST. ISI Emerging Markets. Unauthorized Distribution Prohibited.

10SMARTPHONE MARKET IN INDIA 2012.PPT
Public: Foreign Company – HTC Corporation (3/3)
Key Business Segments Key Geographic Segments
Key Information
Description Details
Overview
•HTC Corporation, through its subsidiaries, engages in the design, development, manufacture, and sale of smart handheld devices such as smart phones and tablet PCs, in Taiwan and internationally
• It has strategic partnership with Beats Electronics LLC
• The company was formerly known as High Tech Computer Corporation and changed its name to HTC Corporation in June 2008
0%
50%
100%
2011
816,052
0%
50%
100%
2011
35,284
Note: Business Segments and Geographic Segments are based on total revenues
TaiwanThe Research, Design, Manufacture and Sales of Smart Hand
The company has been operational in this segment for
the last four years
The company has reported revenue in this single segment
for the last four years
ISIEmergingMarketsPDF in-nmimsmum from 122.170.126.130 on 2013-01-27 06:38:05 EST. DownloadPDF.
Downloaded by in-nmimsmum from 122.170.126.130 at 2013-01-27 06:38:05 EST. ISI Emerging Markets. Unauthorized Distribution Prohibited.

11SMARTPHONE MARKET IN INDIA 2012.PPT
Public: Foreign Company – Research in Motion Ltd. (1/3)
Key People
Products and Services
Company Information Offices and Centres – India
Corporate Address Mumbai, Maharashtra
Tel No. 519‐888‐7465
Fax No. 519‐888‐7884
Website www.rim.net
Year of Incorporation 1984
Ticker Symbol RIM
Stock Exchange TSX
Category Products/Services
Product• Mobile Phone
• Tablet Name Designation
Gerhard T Heins Chief Executive Officer
Michael Lazaridis Vice Chairman
John D Wetmore Director
Claudia B Kotchka Director
Note: The list of products and services is not exhaustive
Mumbai
India Head Office
ISIEmergingMarketsPDF in-nmimsmum from 122.170.126.130 on 2013-01-27 06:38:05 EST. DownloadPDF.
Downloaded by in-nmimsmum from 122.170.126.130 at 2013-01-27 06:38:05 EST. ISI Emerging Markets. Unauthorized Distribution Prohibited.

12SMARTPHONE MARKET IN INDIA 2012.PPT
Public: Foreign Company – Research in Motion Ltd. (2/3)
Financial Snapshot Key Ratios
Financial Summary
• The company incurred a net profit of INR 57.6 bn in FY 2012, as compared to net profit of INR 154.5 bn in FY 2011
• The company reported total income of INR 914.2 bn in FY 2012, as compared to INR 902.1 bn in FY 2011
• The company earned an operating margin of 10.67 per cent in FY 2012, a decrease of 12.6 percentage points over FY 2011
• The company reported debt to equity ratio of 0.36 in FY 2012, anincrease of 18.38 per cent over FY 2011
Key Financial Performance Indicators
Indicators Value (28/06/2012)Market Capitalization (INR bn) 272.1Total Enterprise Value (INR bn) NAEPS (INR) 126.1PE Ratio (Absolute) 4.11
Particulars y‐o‐y change (2012‐11)
2012 2011 2010 2009
Profitability RatiosOperating Margin ‐12.60 10.67% 23.28% 23.28% 24.43%
Net Margin ‐10.82 6.31% 17.13% 16.39% 16.99%
Profit Before Tax Margin ‐15.13 8.19% 23.32% 21.79% 25.13%
Return on Equity ‐26.64 11.52% 38.16% 32.32% 32.23%
Return on Capital Employed ‐31.10 19.05% 50.15% 44.89% 45.47%
Return on Working Capital ‐56.67 31.74% 88.41% 72.67% 69.44%
Return on Assets ‐18.02 8.48% 26.49% 24.08% 23.37%
Return on Fixed Assets ‐93.86 42.36% 136.22% 125.55% 141.84%
Cost RatiosOperating costs (% of Sales) 10.16 77.88% 67.72% 68.14% 75.40%
Administration costs (% of Sales)
1.59 13.65% 12.06% 12.17% 13.51%
Interest costs (% of Sales) N.A. 0.00% 0.00% 0.00% 0.00%
Liquidity RatiosCurrent Ratio 0.93% 2.08 2.06 2.39 2.29
Cash Ratio ‐16.19% 0.62 0.74 1.18 1.06
Leverage RatiosDebt to Equity Ratio ‐18.38% 0.36 0.44 0.34 0.38
Debt to Capital Ratio N.A. 0.00 0.00 0.00 0.00
Interest Coverage Ratio N.A. N.A. N.A. N.A. N.A.
Efficiency RatiosFixed Asset Turnover ‐15.62% 6.71 7.95 7.64 8.29
Asset Turnover ‐13.17% 1.34 1.55 1.47 1.37
Current Asset Turnover ‐1.72% 2.61 2.66 2.57 2.29
Working Capital Turnover ‐2.57% 5.03 5.16 4.42 4.06
Capital Employed Turnover ‐18.05% 1.83 2.23 1.97 1.88
Improved Decline
Net Profit/LossTotal Income
914.2902.1
688.6569.0
0
500
1000
0
50
100
150
200
INR bn INR bn
2012201120102009
ISIEmergingMarketsPDF in-nmimsmum from 122.170.126.130 on 2013-01-27 06:38:05 EST. DownloadPDF.
Downloaded by in-nmimsmum from 122.170.126.130 at 2013-01-27 06:38:05 EST. ISI Emerging Markets. Unauthorized Distribution Prohibited.

13SMARTPHONE MARKET IN INDIA 2012.PPT
Public: Foreign Company – Research in Motion Ltd. (3/3)
Key Business Segments Key Geographic Segments
Key Recent Developments
Description News
Overview
• Research In Motion Limited designs, manufactures, and markets wireless solutions for the mobile communications market worldwide under the ‘BlackBerry’ brand
•Offers platforms and solutions for access to information, including email, voice, instant messaging, short message service, Internet and Intranet‐based browsing, and multimedia content through developing integrated hardware, software, and services
Business Model • Sells its products through global wireless communications carriers and third party channel
0%
50%
100%
2012
100%
Research, Design, Manufacture and Sales of Wireless Communication
63% 58% 39% 10%
10%6%
23%7%
0%
50%
100%
20122011
23%
2010
8%564,929
2009
6%
27%
686,8667%
11%42%
901,787
60%
913,178
Note: Business Segments and Geographic Segments are based on total revenues
Has been operating in this segment for the last four
years
Canada
United States
United Kingdom
Other
ISIEmergingMarketsPDF in-nmimsmum from 122.170.126.130 on 2013-01-27 06:38:05 EST. DownloadPDF.
Downloaded by in-nmimsmum from 122.170.126.130 at 2013-01-27 06:38:05 EST. ISI Emerging Markets. Unauthorized Distribution Prohibited.

14SMARTPHONE MARKET IN INDIA 2012.PPT
Public: Foreign Company – Sony Corporation (1/3)
Key People
Products and Services
Company Information Offices and Centres – India
Corporate AddressA‐31 Mohan Co‐operative Industrial Estate, Mathura Road, New Delhi
Tel No. 91‐66‐006600
Fax No. 91‐26‐959141
Website www.sony.net
Year of Incorporation 1946
Ticker Symbol 6758
Stock Exchange TSE
Category Products/Services
Product
• Mobile Phone
• Tablet
• Notebook PC
• Consumer Electronics
Name Designation
Howard Stringer Chairman
Kazuo Hirai Chief Executive Officer
Ryoji Chubachi Vice Chairman
Note: The list of products and services is not exhaustive
India Head Office
New Delhi
ISIEmergingMarketsPDF in-nmimsmum from 122.170.126.130 on 2013-01-27 06:38:05 EST. DownloadPDF.
Downloaded by in-nmimsmum from 122.170.126.130 at 2013-01-27 06:38:05 EST. ISI Emerging Markets. Unauthorized Distribution Prohibited.
15SMARTPHONE MARKET IN INDIA 2012.PPT
Public: Foreign Company – Sony Corporation (2/3)
Financial Snapshot Key Ratios
Financial Summary
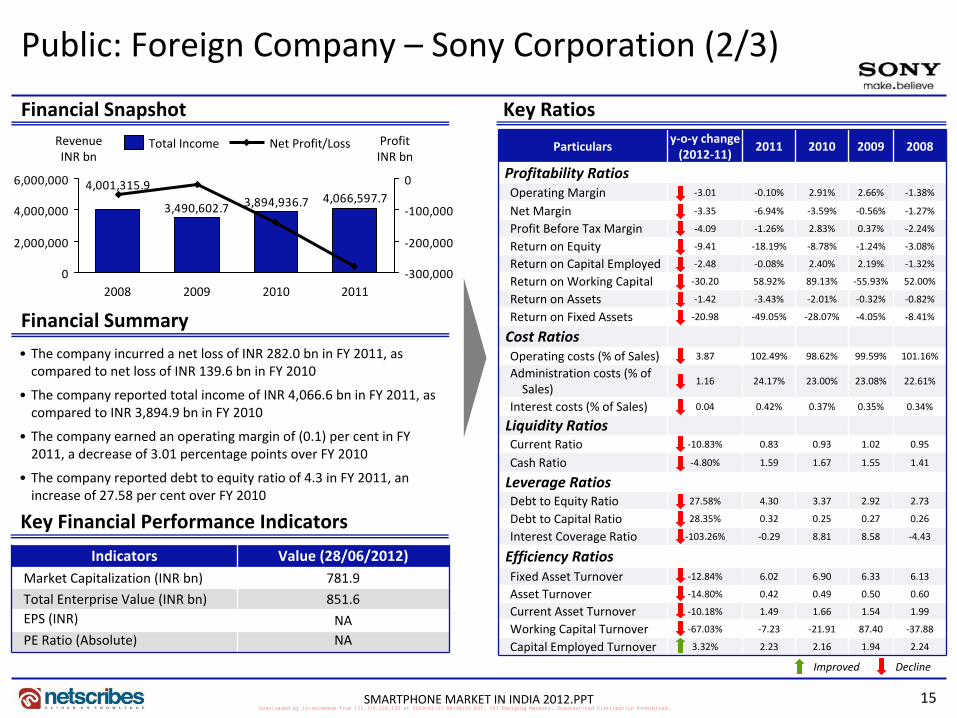
• The company incurred a net loss of INR 282.0 bn in FY 2011, as compared to net loss of INR 139.6 bn in FY 2010
• The company reported total income of INR 4,066.6 bn in FY 2011, as compared to INR 3,894.9 bn in FY 2010
• The company earned an operating margin of (0.1) per cent in FY 2011, a decrease of 3.01 percentage points over FY 2010
• The company reported debt to equity ratio of 4.3 in FY 2011, an increase of 27.58 per cent over FY 2010
Key Financial Performance Indicators
Indicators Value (28/06/2012)Market Capitalization (INR bn) 781.9
Total Enterprise Value (INR bn) 851.6EPS (INR) NAPE Ratio (Absolute) NA
Improved Decline
Net Profit/LossTotal Income
4,066,597.73,894,936.73,490,602.7
4,001,315.9
0
2,000,000
4,000,000
6,000,000
‐300,000
‐200,000
‐100,000
0
RevenueINR bn
ProfitINR bn
2011201020092008
Particulars y‐o‐y change (2012‐11)
2011 2010 2009 2008
Profitability RatiosOperating Margin ‐3.01 ‐0.10% 2.91% 2.66% ‐1.38%
Net Margin ‐3.35 ‐6.94% ‐3.59% ‐0.56% ‐1.27%
Profit Before Tax Margin ‐4.09 ‐1.26% 2.83% 0.37% ‐2.24%
Return on Equity ‐9.41 ‐18.19% ‐8.78% ‐1.24% ‐3.08%
Return on Capital Employed ‐2.48 ‐0.08% 2.40% 2.19% ‐1.32%
Return on Working Capital ‐30.20 58.92% 89.13% ‐55.93% 52.00%
Return on Assets ‐1.42 ‐3.43% ‐2.01% ‐0.32% ‐0.82%
Return on Fixed Assets ‐20.98 ‐49.05% ‐28.07% ‐4.05% ‐8.41%
Cost RatiosOperating costs (% of Sales) 3.87 102.49% 98.62% 99.59% 101.16%
Administration costs (% of Sales)
1.16 24.17% 23.00% 23.08% 22.61%
Interest costs (% of Sales) 0.04 0.42% 0.37% 0.35% 0.34%
Liquidity RatiosCurrent Ratio ‐10.83% 0.83 0.93 1.02 0.95
Cash Ratio ‐4.80% 1.59 1.67 1.55 1.41
Leverage RatiosDebt to Equity Ratio 27.58% 4.30 3.37 2.92 2.73
Debt to Capital Ratio 28.35% 0.32 0.25 0.27 0.26
Interest Coverage Ratio ‐103.26% ‐0.29 8.81 8.58 ‐4.43
Efficiency RatiosFixed Asset Turnover ‐12.84% 6.02 6.90 6.33 6.13
Asset Turnover ‐14.80% 0.42 0.49 0.50 0.60
Current Asset Turnover ‐10.18% 1.49 1.66 1.54 1.99
Working Capital Turnover ‐67.03% ‐7.23 ‐21.91 87.40 ‐37.88
Capital Employed Turnover 3.32% 2.23 2.16 1.94 2.24
ISIEmergingMarketsPDF in-nmimsmum from 122.170.126.130 on 2013-01-27 06:38:05 EST. DownloadPDF.
Downloaded by in-nmimsmum from 122.170.126.130 at 2013-01-27 06:38:05 EST. ISI Emerging Markets. Unauthorized Distribution Prohibited.

16SMARTPHONE MARKET IN INDIA 2012.PPT
Public: Foreign Company – Sony Corporation (3/3)
Key Business Segments Key Geographic Segments
Key Information
Description Details
Overview
• Sony Corporation designs, develops, manufactures, and sells electronic equipment, instruments, and devices for consumer, professional, and industrial markets worldwide
• Sony India Pvt. Ltd. operates as a subsidiary of Sony Electronics Asia Pacific Pte. Ltd. which is a part of Sony Corporation
• The company offers consumer products and devices, including televisions, video cameras, compact digital cameras and interchangeable single‐lens cameras
• Sony Ericsson Mobile Communications AB is a former joint venture of Sony Corporation and Telefonaktiebolaget LM Ericsson As of February 15, 2012, Sony Ericsson Mobile Communications AB operates as a subsidiary of Sony Corporation.
6%6%6%1%6%
6%7%
9%9%
0%
50%
100%
8%
48%
11%11%
3,734,147
50%
20%20%
4,130,259
45%
13%
19%
4,288,505
2009 2010 2011
22%
9% 10% 10%8%8%7%19%20%
0%
50%
100%
2009
23%
29%
10%
30%
21%
20112010
32%
11%
20%
12%
Note: Business Segments and Geographic Segments are based on total revenues
China
Europe
United States
Japan Asia‐Pacific
Other
Consumer Products & Services All OtherMusic
Sony Mobile
Financial ServicesProfessional, Device & Solutions
Pictures
ISIEmergingMarketsPDF in-nmimsmum from 122.170.126.130 on 2013-01-27 06:38:05 EST. DownloadPDF.
Downloaded by in-nmimsmum from 122.170.126.130 at 2013-01-27 06:38:05 EST. ISI Emerging Markets. Unauthorized Distribution Prohibited.

17SMARTPHONE MARKET IN INDIA 2012.PPT
Private: Domestic Company – LAVA International Ltd. (1/3)
Key People
Products and Services
Company Information Offices and Centres – India
India Head Office A‐56 Sector 64, Noida, Uttar Pradesh
Tel No. 91‐12‐04637333
Fax No. 91‐12‐04637240
Website www.lavamobiles.com
Year of Incorporation
2009
Name Designation
Sunil Bhalla Co‐Founder and Director
Hari Om Rai Co‐Founder and Director
Shailendra Nath Rai Co‐Founder and Director
India Head Office
Category Products/Services
Product • Mobile Phone
Noida
ISIEmergingMarketsPDF in-nmimsmum from 122.170.126.130 on 2013-01-27 06:38:05 EST. DownloadPDF.
Downloaded by in-nmimsmum from 122.170.126.130 at 2013-01-27 06:38:05 EST. ISI Emerging Markets. Unauthorized Distribution Prohibited.

18SMARTPHONE MARKET IN INDIA 2012.PPT
Financial Snapshot Key Ratios
Financial Summary
• Company incurred a net profit of INR 3 bn in FY 2011, as compared to net profit of INR 2.4 bn in FY 2010
• It reported total Income of INR 71.7 bn in FY 2011, as compared to INR 30.8 bn in FY 2010
• The company earned an operating margin of 6.58 per cent in FY 2011, a decrease of 6.15 percentage points over FY 2010
• The company reported debt to equity ratio of 0.18 in FY 2011, a decrease of 31.52 per cent over FY 2010
Particulars y‐o‐y change (2011‐10) 2011 2010
Profitability RatiosOperating Margin ‐6.15 6.58% 12.73%
Net Margin ‐3.74 4.19% 7.92%
Profit Before Tax Margin ‐6.31 6.35% 12.66%
Return on Equity NA NA NA
Return on Capital Employed NA NA NA
Return on Working Capital 0.01 0.00% ‐0.01%
Return on Assets NA NA NA
Return on Fixed Assets ‐0.02 0.00% 0.03%
Cost RatiosOperating costs (% of Sales) 6.16 93.40% 87.24%
Administration costs (% of Sales)
NA NA NA
Interest costs (% of Sales) 0.24 0.56% 0.31%
Liquidity RatiosCurrent Ratio 30.08% 1.27 0.97
Cash Ratio ‐0.54% 0.78 0.78
Leverage RatiosDebt to Equity Ratio ‐31.52% 0.18304796 0.27
Debt to Capital Ratio ‐26.65% 0.15 0.21
Interest Coverage Ratio ‐70.81% 11.84 40.57
Efficiency RatiosFixed Asset Turnover ‐69.95% 0.00 0.00
Asset Turnover 21.19% 0.00 0.00
Current Asset Turnover 78.24% 0.00 0.00
Working Capital Turnover ‐123.64% 0.00 0.00
Capital Employed Turnover 13.13% 0.00 0.00
Improved Decline
Profit / Loss
Total Income
71,724.3
30,791.4
0
20,000
40,000
60,000
80,000
0
500
1,000
1,500
2,000
2,500
3,000
3,500
ProfitINR mn
Total IncomeINR mn
20112010
Private: Domestic Company – LAVA International Ltd. (2/3)
ISIEmergingMarketsPDF in-nmimsmum from 122.170.126.130 on 2013-01-27 06:38:05 EST. DownloadPDF.
Downloaded by in-nmimsmum from 122.170.126.130 at 2013-01-27 06:38:05 EST. ISI Emerging Markets. Unauthorized Distribution Prohibited.

19SMARTPHONE MARKET IN INDIA 2012.PPT
Key Recent Developments
Description Details
Overview• LAVA International Ltd. designs and develops mobile phone sets
• It markets products through a network of dealers in India
Partners and Investors• The company offers dual SIM, GSM, and single SIM CDMA phones; GPRS/WAP speaker dual SIM phones, dual SIM GSM‐CDMA, and GSM‐GSM phones, and dual SIM camera phones
Private: Domestic Company – LAVA International Ltd. (3/3)
ISIEmergingMarketsPDF in-nmimsmum from 122.170.126.130 on 2013-01-27 06:38:05 EST. DownloadPDF.
Downloaded by in-nmimsmum from 122.170.126.130 at 2013-01-27 06:38:05 EST. ISI Emerging Markets. Unauthorized Distribution Prohibited.

20SMARTPHONE MARKET IN INDIA 2012.PPT
Private: Foreign Company – LG Electronics India Pvt. Ltd. (1/2)
Key People
Products and Services
Company Information
Corporate Address
Plot No 51, Surajpur Kasna Road,
Greater Noida ‐ 201306
Uttar Pradesh, India
Tel No. +91‐12‐0256 0960
Fax No. +91‐12‐0256 0956
Website www.lg.com
Year of Incorporation
2003
Name Designation
Sunil Managing Director
Y. V. Verma Chief Operating Officer
Sudhin Mathur Head of Mobile Handsets Unit
Offices and Centres – India
Greater Noida
Note: Product list is not exhaustive
Head Office
Category Products/Services
Product•Mobile Phone
•Consumer Electronics
ISIEmergingMarketsPDF in-nmimsmum from 122.170.126.130 on 2013-01-27 06:38:05 EST. DownloadPDF.
Downloaded by in-nmimsmum from 122.170.126.130 at 2013-01-27 06:38:05 EST. ISI Emerging Markets. Unauthorized Distribution Prohibited.

21SMARTPHONE MARKET IN INDIA 2012.PPT
Private: Foreign Company – LG Electronics India Pvt. Ltd. (2/2)Key Recent Developments
Description News
Overview
• LG Electronics India Pvt. Ltd. (LGEIL) operates as a subsidiary of LG Electronics Inc.
• LG Electronics Inc. engages in the manufacture and sale of consumer electronics, home appliances, computer products, and mobile phones worldwide
• The company was formerly known as GoldStar and changed its name to LG Electronics Inc. in 1995
Extended Product Portfolio
• The company offers TV/audio/video products, including liquid crystal display (LCD) televisions (TVs), plasma TVs, color TVs, home theatre system, music system, digital versatile disc players; mobile phones; and computer products comprising LCD monitors, projectors, notebooks, and optical media products
• It also provides home appliances consisting of refrigerators, washer dryer combos, washing machines, dish washer, micro wave oven, and vacuum cleaners; residential air conditioners, commercial air conditioners; and refrigerator compressors
ISIEmergingMarketsPDF in-nmimsmum from 122.170.126.130 on 2013-01-27 06:38:05 EST. DownloadPDF.
Downloaded by in-nmimsmum from 122.170.126.130 at 2013-01-27 06:38:05 EST. ISI Emerging Markets. Unauthorized Distribution Prohibited.

22SMARTPHONE MARKET IN INDIA 2012.PPT
Private: Domestic Company – Micromax Informatics Ltd. (1/3)
Key People
Products and Services
Company Information Offices and Centres – India
India Head OfficeMicromax House, 697 Udyog Vihar, Phase V, Gurgaon, Haryana
Tel No. 91‐12‐44009601
Fax No. 91‐12‐44009603
Website www.micromaxinfo.com
Year of Incorporation
1991
Name Designation
Rajesh Agarwal Managing Director
Deepak Mehrotra Chief Executive Officer
Sudhir Gaur National Sales Head
India Head Office
Category Products/Services
Product•Mobile Phone
•Tablet
Gurgaon
ISIEmergingMarketsPDF in-nmimsmum from 122.170.126.130 on 2013-01-27 06:38:05 EST. DownloadPDF.
Downloaded by in-nmimsmum from 122.170.126.130 at 2013-01-27 06:38:05 EST. ISI Emerging Markets. Unauthorized Distribution Prohibited.

23SMARTPHONE MARKET IN INDIA 2012.PPT
Financial Snapshot Key Ratios
Financial Summary
• Company incurred a net profit of INR 1.9 bn in FY 2011, as compared to net profit of INR 2 bn in FY 2010
• It reported total Income of INR 23.3 bn in FY 2011, as compared to INR 16 bn in FY 2010
• The company earned an operating margin of 84.42 per cent in FY 2011, a decrease of 2.17 percentage points over FY 2010
• The company reported debt to equity ratio of 0.08 in FY 2011, an increase of 704.32 per cent over FY 2010
Particulars y‐o‐y change (2011‐10)
2011 2010 2009 2008
Profitability RatiosOperating Margin ‐2.17 84.42% 86.59% 93.81% 16.25%
Net Margin ‐4.18 8.33% 12.51% 10.01% 14.43%
Profit Before Tax Margin ‐7.96 12.51% 20.47% 13.94% 15.93%
Return on Equity ‐131.29 55.21% 186.50% 61.23% 78.31%
Return on Capital Employed ‐14022.53 ‐14941.98% ‐919.45% ‐681.87% 108.92%
Return on Working Capital ‐58.71 53.12% 111.83% 67.62% 67.86%
Return on Assets ‐44.70 50.77% 95.47% 57.42% 58.59%
Return on Fixed Assets ‐249.21 1935.06% 2184.27% 457.65% 429.89%
Cost RatiosOperating costs (% of Sales) 3.04 14.43% 11.39% 4.69% 83.75%
Administration costs (% of Sales)
2.73 14.33% 11.60% 5.75% 0.00%
Interest costs (% of Sales) ‐0.21 0.36% 0.57% 1.05% 0.32%
Liquidity RatiosCurrent Ratio 28.55% 1.92 1.50 1.47 3.19
Cash Ratio ‐74.54% 0.17 0.68 0.65 ‐0.03
Leverage RatiosDebt to Equity Ratio 704.32% 0.08753724 0.01 0.06 0.27
Debt to Capital Ratio 647.63% 0.08 0.01 0.05 0.21
Interest Coverage Ratio 53.26% 236.72 154.46 90.44 50.94
Efficiency RatiosFixed Asset Turnover 34.32% 229.26 170.68 45.02 29.78
Asset Turnover ‐19.38% 6.01 7.46 5.65 4.06
Current Asset Turnover 4.22% 3.02 2.90 2.14 3.23
Working Capital Turnover ‐27.98% 6.29 8.74 6.65 4.70
Capital Employed Turnover ‐55.12% 6.54 14.57 6.02 5.43
Improved Decline
Profit / Loss
Total Income
23,302.1
1,200.8
0
5,000
10,000
15,000
20,000
25,000
0
500
1,000
1,500
2,000
2,500
ProfitINR mn
Total IncomeINR mn
20102009
3,493.8
2008 2011
16,018.6
Private: Domestic Company – Micromax Informatics Ltd. (2/3)
ISIEmergingMarketsPDF in-nmimsmum from 122.170.126.130 on 2013-01-27 06:38:05 EST. DownloadPDF.
Downloaded by in-nmimsmum from 122.170.126.130 at 2013-01-27 06:38:05 EST. ISI Emerging Markets. Unauthorized Distribution Prohibited.

24SMARTPHONE MARKET IN INDIA 2012.PPT
Key Recent Developments
Description Details
Overview
•Micromax Informatics is a leading player in technologies including real‐time bidding, data marketplaces, big data, algorithms and targetting in Asia Pacific
• Its engine is manned by over 300 people across India, Australia, Singapore, Hong Kong, Middle East, UK and North America
Partners and Investors
• The company works closely with top publishers across the global platform including Facebook and Bloomberg
• It constitutes an exclusive reseller of Facebook’s premium inventory in India, Thailand, Indonesia and Phillipines
• It also has partnership with technology vendors namely Lotame, Wildfire and Efficient Frontier
• Its list of investors include names such as Nexua Venture Partners, Helion Venture Partners, Norwest Venture Partners and Draper Fisher Juvertson,
Private: Domestic Company – Micromax Informatics Ltd. (3/3)
ISIEmergingMarketsPDF in-nmimsmum from 122.170.126.130 on 2013-01-27 06:38:05 EST. DownloadPDF.
Downloaded by in-nmimsmum from 122.170.126.130 at 2013-01-27 06:38:05 EST. ISI Emerging Markets. Unauthorized Distribution Prohibited.

25SMARTPHONE MARKET IN INDIA 2012.PPT
Private: Foreign Company – Nokia India Pvt. Ltd. (1/3)
Key People
Products and Services
Company Information Offices and Centres – India
Corporate AddressTower A SP Infocity, Industrial Plot no. 243 Udyog Vihar, Phase 1 Dundahera Gurgaon
Tel No. +91 12 4483 3000
Fax No. +91 12 4483 3090
Website www.nokia.com
Year of Incorporation 1995
Name Designation
Shiva D Kumar Managing Director
Poonam Kaul Director of Communications
Viral Oza Director, Marketing
Note: The list of products and services is not exhaustive
Gurgaon
Head Office
Category Products/Services
Product•Mobile Phone
•Tablet
ISIEmergingMarketsPDF in-nmimsmum from 122.170.126.130 on 2013-01-27 06:38:05 EST. DownloadPDF.
Downloaded by in-nmimsmum from 122.170.126.130 at 2013-01-27 06:38:05 EST. ISI Emerging Markets. Unauthorized Distribution Prohibited.

26SMARTPHONE MARKET IN INDIA 2012.PPT
Private: Foreign Company – Nokia India Pvt. Ltd. (2/3)
Financial Snapshot
Financial Summary
• The company incurred a net profit of INR 8208.8 mn in FY 2011, as compared to net profit of INR 13297.9 mn in FY 2010
• The company reported total income of INR 278524.7 mn in FY 2011, as compared to INR 262564.1 mn in FY 2010
• The company earned an operating margin of 4.99 per cent in FY 2011 a decrease of 1.44 percentage points over FY 2010
Improved Decline
Net Profit/LossTotal Income
278524.7262564.1262039.9
214133.8
0
50000
100000
150000
200000
250000
300000
0
5000
10000
15000
INR mnINR mn
2011201020092008
Key Ratios
Particulars y‐o‐y change (2011‐10)
2011 2010 2009 2008
Profitability RatiosOperating Margin ‐1.44 4.99% 6.43% 5.46% 6.24%
Net Margin ‐2.12 2.95% 5.06% 4.19% 4.54%
Profit Before Tax Margin ‐1.45 4.98% 6.42% 5.46% 6.16%
Return on Equity ‐14.41 15.65% 30.07% 35.49% 48.67%
Return on Capital Employed 25.15 ‐61.59% ‐86.74% ‐49.84% ‐48.06%
Return on Working Capital ‐18.65 18.45% 37.10% 48.89% 74.08%
Return on Assets ‐14.41 15.65% 30.07% 35.49% 48.67%
Return on Fixed Assets ‐56.87 131.71% 188.59% 166.32% 179.66%
Cost RatiosOperating costs (% of Sales) 1.44 95.01% 93.57% 94.54% 93.76%
Administration costs (% of Sales)
N.A. 0.00% 0.00% 0.00% 0.00%
Interest costs (% of Sales) 0.01 0.01% 0.00% 0.00% 0.08%
Liquidity RatiosCurrent Ratio 1.95% 1.59 1.56 1.38 1.27
Cash Ratio ‐36.86% 0.15 0.24 0.24 0.30
Leverage RatiosDebt to Equity Ratio N.A. 0.00 0.00 0.00 0.00
Debt to Capital Ratio N.A. 0.00 0.00 0.00 0.00
Interest Coverage Ratio ‐70.44% 412.19 1394.54 7477.71 77.68
Efficiency RatiosFixed Asset Turnover 20.02% 44.69 37.24 39.70 39.61
Asset Turnover ‐10.53% 5.31 5.94 8.47 10.73
Current Asset Turnover ‐11.64% 2.33 2.64 3.19 3.52
Working Capital Turnover ‐14.55% 6.26 7.33 11.67 16.33
Capital Employed Turnover ‐10.53% 5.31 5.94 8.47 10.73
ISIEmergingMarketsPDF in-nmimsmum from 122.170.126.130 on 2013-01-27 06:38:05 EST. DownloadPDF.
Downloaded by in-nmimsmum from 122.170.126.130 at 2013-01-27 06:38:05 EST. ISI Emerging Markets. Unauthorized Distribution Prohibited.

27SMARTPHONE MARKET IN INDIA 2012.PPT
Private: Foreign Company – Nokia India Pvt. Ltd. (3/3)
Key Recent Developments
Description Details
Overview
•Nokia India Pvt. Ltd. designs, manufactures, and markets mobile phones and
communication network devices
•Offers mobile phones and devices based on the GSM/EDGE, 3G/WCDMA, and CDMA
cellular standards
• Also, provides wireless and fixed network infrastructure, communications, and networks
service platforms, including base stations, base station controllers, cellular transmission
equipment, switches, various network servers, media gateways, and transmission
systems for dense wavelength division multiplexers
Extended Product
Portfolio
• Also offers synchronous digital hierarchy, IP routers, carrier ethernet switches, microwave
radio equipment, and operations and business support systems software
• It also engages itself in providing digital subscriber line access multiplexers, passive
optical network, and narrowband/multi‐service equipment, and operation services,
including consultancy, outsourced operations, systems integration, hosting, network
design, and turnkey solutions
ISIEmergingMarketsPDF in-nmimsmum from 122.170.126.130 on 2013-01-27 06:38:05 EST. DownloadPDF.
Downloaded by in-nmimsmum from 122.170.126.130 at 2013-01-27 06:38:05 EST. ISI Emerging Markets. Unauthorized Distribution Prohibited.
28SMARTPHONE MARKET IN INDIA 2012.PPT
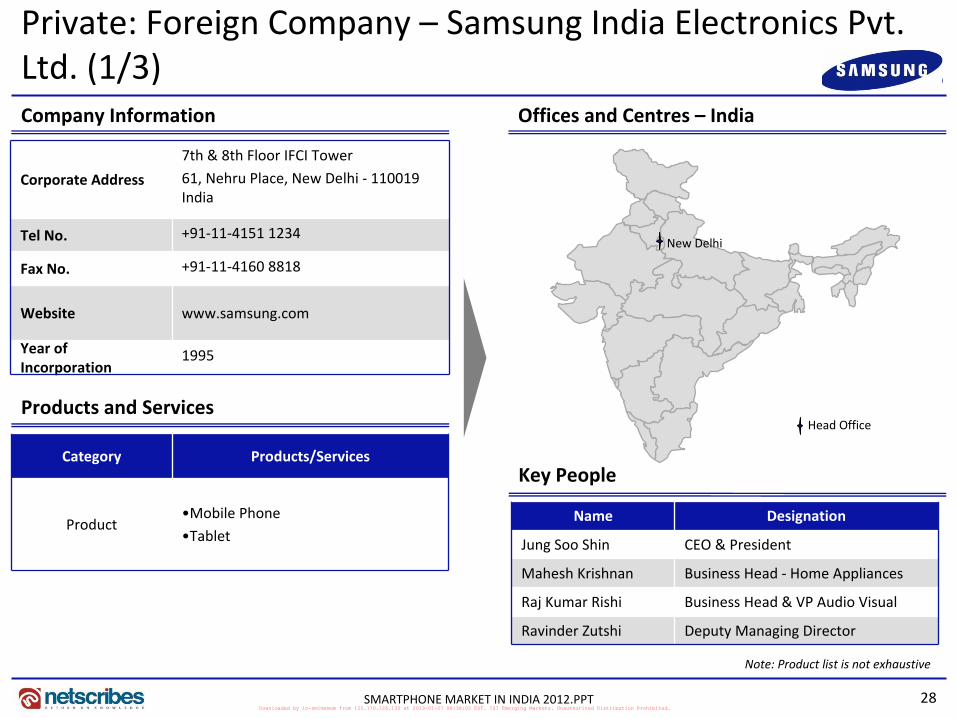
Private: Foreign Company – Samsung India Electronics Pvt. Ltd. (1/3)
Key People
Products and Services
Company Information Offices and Centres – India
Corporate Address
7th & 8th Floor IFCI Tower
61, Nehru Place, New Delhi ‐ 110019 India
Tel No. +91‐11‐4151 1234
Fax No. +91‐11‐4160 8818
Website www.samsung.com
Year of Incorporation
1995
Name Designation
Jung Soo Shin CEO & President
Mahesh Krishnan Business Head ‐ Home Appliances
Raj Kumar Rishi Business Head & VP Audio Visual
Ravinder Zutshi Deputy Managing Director
New Delhi
Note: Product list is not exhaustive
Head Office
Category Products/Services
Product•Mobile Phone
•Tablet
ISIEmergingMarketsPDF in-nmimsmum from 122.170.126.130 on 2013-01-27 06:38:05 EST. DownloadPDF.
Downloaded by in-nmimsmum from 122.170.126.130 at 2013-01-27 06:38:05 EST. ISI Emerging Markets. Unauthorized Distribution Prohibited.

29SMARTPHONE MARKET IN INDIA 2012.PPT
Financial Snapshot Key Ratios
Financial Summary
Private: Foreign Company – Samsung India Electronics Pvt. Ltd. (2/3)
• Company incurred a net profit of INR 0.76 bn in FY 2011, as compared to net profit of INR 4.02 bn in FY 2010
• It reported total Income of INR 141.40 bn in FY 2011, registering an increase of 32.30 per cent over FY 2010
• Earned an operating margin of 98.52 per cent in FY 2011 a decrease of 0.17 percentage points over FY 2010
• The company reported debt to equity ratio of 0.58 in FY 2011, an increase of 424.54 per cent over FY 2010
Particulars y‐o‐y change (2011‐10)
2011 2010 2009 2008
Profitability RatiosOperating Margin ‐0.17 98.52% 98.69% 98.16% 98.16%
Net Margin ‐3.23 0.54% 3.76% 0.53% ‐1.50%
Profit Before Tax Margin ‐4.22 1.40% 5.62% 2.29% 3.03%
Return on Equity ‐41.12 8.60% 49.72% 10.19% ‐25.90%
Return on Capital Employed ‐379.35 ‐960.92% ‐581.57% ‐1045.91% ‐826.79%
Return on Working Capital ‐253.28 19.81% 273.09% 18.00% ‐44.85%
Return on Assets ‐39.31 5.43% 44.74% 6.06% ‐13.77%
Return on Fixed Assets ‐82.85 8.60% 91.45% 10.12% ‐21.66%
Cost RatiosOperating costs (% of Sales) 0.17 1.48% 1.31% 1.84% 1.84%
Administration costs (% of Sales)
N.A. N.A. N.A. N.A. N.A.
Interest costs (% of Sales) 0.02 0.14% 0.12% 0.43% 0.26%
Liquidity RatiosCurrent Ratio 7.63% 1.13 1.05 1.16 1.15
Cash Ratio ‐92.00% 0.01 0.12 0.03 0.02
Leverage RatiosDebt to Equity Ratio 424.54% 0.58 0.11 0.68 0.88
Debt to Capital Ratio 268.08% 0.37 0.10 0.41 0.47
Interest Coverage Ratio ‐16.71% 704.88 846.29 229.63 375.63
Efficiency RatiosFixed Asset Turnover ‐34.23% 15.98 24.30 19.02 14.47
Asset Turnover ‐15.14% 10.09 11.89 11.39 9.20
Current Asset Turnover 16.95% 4.37 3.74 4.73 3.83
Working Capital Turnover ‐49.27% 36.82 72.57 33.83 29.96
Capital Employed Turnover 20.93% 15.98 13.21 19.16 17.30
Improved Decline
Net Profit / Loss
Total Income
141.4106.9
77.9
51.0
0
50
100
150
‐1
0
1
2
3
4
5
Net ProfitINR bn
Total IncomeINR bn
2011201020092008
ISIEmergingMarketsPDF in-nmimsmum from 122.170.126.130 on 2013-01-27 06:38:05 EST. DownloadPDF.
Downloaded by in-nmimsmum from 122.170.126.130 at 2013-01-27 06:38:05 EST. ISI Emerging Markets. Unauthorized Distribution Prohibited.

30SMARTPHONE MARKET IN INDIA 2012.PPT
Private: Foreign Company – Samsung India Electronics Pvt. Ltd. (3/3)Business Highlights
Description Details
Overview
• Samsung Electronics Co. Ltd., together with its subsidiaries, engages in the manufacture,
distribution, and sale of finished electronic products and device solutions worldwide
• Samsung Electronics Co Ltd. operates through its subsidiary Samsung India Electronics
Private Ltd. (Samsung)
Extended Product
Portfolio
• It offers consumer products, including mobile phones, tablets, televisions, Blu‐rays, DVD
players, home theaters, multimedia players, and digital cameras and camcorders; home
appliances, such as refrigerators, air conditioners, washing machines, dishwashers, ovens,
vacuum cleaners, and other appliances; and PC/peripherals/printers comprising
notebooks, personal computers (PCs), monitors, printers, memory and storage products
• The company also designs and manufactures integrated circuits for storing digital
information, which include dynamic random access memory (DRAM), static random
access memory (SRAM), NAND flash memory, and Solid State Drives (SSDs); and logic and
analog integrated circuit devices, such as display driver IC, CMOS image sensor, mobile
application processor, smart card IC, and media player SoC
ISIEmergingMarketsPDF in-nmimsmum from 122.170.126.130 on 2013-01-27 06:38:05 EST. DownloadPDF.
Downloaded by in-nmimsmum from 122.170.126.130 at 2013-01-27 06:38:05 EST. ISI Emerging Markets. Unauthorized Distribution Prohibited.

31SMARTPHONE MARKET IN INDIA 2012.PPT
Private: Domestic Company – Motorola Mobility Holdings Inc. (1/2)
Key People
Products and Services
Company Information Offices and Centres – India
India Head Office415/2, Mehrauli Gurgaon Road, Sector‐14, 3rd Floor, Satellite Cross Roads, Gurgaon, Haryana
Tel No. 91‐12‐42303212
Fax No. 91‐12‐42306688
Website www.motorola.com
Year of Incorporation
NA
Name Designation
Amit Sharma President
Lloyd Mathias Marketing Director
Sudhir Agarwal Director of Sales ‐ India Nepal & Sri Lanka for Mobile Devices
India Head Office
Category Products/Services
Product•Mobile Phone
•Tablet
Gurgaon
ISIEmergingMarketsPDF in-nmimsmum from 122.170.126.130 on 2013-01-27 06:38:05 EST. DownloadPDF.
Downloaded by in-nmimsmum from 122.170.126.130 at 2013-01-27 06:38:05 EST. ISI Emerging Markets. Unauthorized Distribution Prohibited.

32SMARTPHONE MARKET IN INDIA 2012.PPT
Key Recent Developments
Description Details
Overview
•Motorola Mobility Holdings, Inc., together with its subsidiaries, provides technologies, products, and services for mobile and wire line digital communication, information, and entertainment applications
• As of January 04, 2011, Motorola Mobility Holdings, Inc. (NYSE:MMI) operates independently of Motorola Solutions, Inc. As of May 22, 2012, Motorola Mobility Holdings, Inc. operates as a subsidiary of Google Inc.
Partners and Investors
• The company’s mobile device portfolio includes smartphones on the Android operating system, feature phones, voice‐centric phones, media tablet devices, and wireless accessories. Its integrated products and platforms deliver multimedia content, including video, voice, messaging, and cloud‐based and Internet‐based applications and services to multiple screens, such as mobile devices, televisions, media tablets, and personal computers
• In addition, the company provides set‐top boxes, and data and voice modems and gateways on consumers’ premises; a range of network equipment to transport signals to and from the end‐user premises; integrated receiver decoders, multiplexers, transcoders, encoders for local programming, and video‐on‐demand servers; and broadband access infrastructure products
Private: Domestic Company – Motorola Mobility Holdings Inc. (2/2)
ISIEmergingMarketsPDF in-nmimsmum from 122.170.126.130 on 2013-01-27 06:38:05 EST. DownloadPDF.
Downloaded by in-nmimsmum from 122.170.126.130 at 2013-01-27 06:38:05 EST. ISI Emerging Markets. Unauthorized Distribution Prohibited.

33SMARTPHONE MARKET IN INDIA 2012.PPT
Thank you for the attentionThe Smartphone Market – India 2012 report is a part of Netscribes’ Telecom and Consumer Electronics Series.For more detailed information or customized research requirements please contact:
About NetscribesNetscribes is a knowledge‐consulting and solutions firm with clientele across the globe. The company’s expertise spans areas of investment & business research, business & corporate intelligence, content‐management services, and knowledge‐software services. At its core lies a true value proposition that draws upon a vast knowledge base. Netscribes is a one‐stop shop designed to fulfil clients’ profitability and growth objectives.
Disclaimer: This report is published for general information only. Although high standards have been used in the preparation of this report,Netscribes is not responsible for any loss or damage arising from use of this document. This document is the sole property of Netscribes. and prior permission is required for guidelines on reproduction.
Phone: +91 33 4064 6214E‐Mail: [email protected]
Follow us on:
ISIEmergingMarketsPDF in-nmimsmum from 122.170.126.130 on 2013-01-27 06:38:05 EST. DownloadPDF.
Downloaded by in-nmimsmum from 122.170.126.130 at 2013-01-27 06:38:05 EST. ISI Emerging Markets. Unauthorized Distribution Prohibited.