smartphone usage behavior in indonesia
TRANSCRIPT
STUDY ABOUT SMARTPHONE USAGE
BEHAVIOR IN INDONESIA
October, 2017
1DI Marketing Co., Ltd.
This survey was conducted to study about Smartphone Usage Behavior in
Indonesia
Methodology: Online survey
Fieldwork time: 5 days (24/07/2017 – 28/07/2017)
Sample size: N = 1300
Geography: Nationwide
SURVEY DESIGN
2DI Marketing Co., Ltd.
Respondents of this survey had to be qualified below criteria
Age : From 24 years old and above
Gender : Both Female and Male
Usage : Smartphone
RESPONDENTS SELECTION
3DI Marketing Co., Ltd.
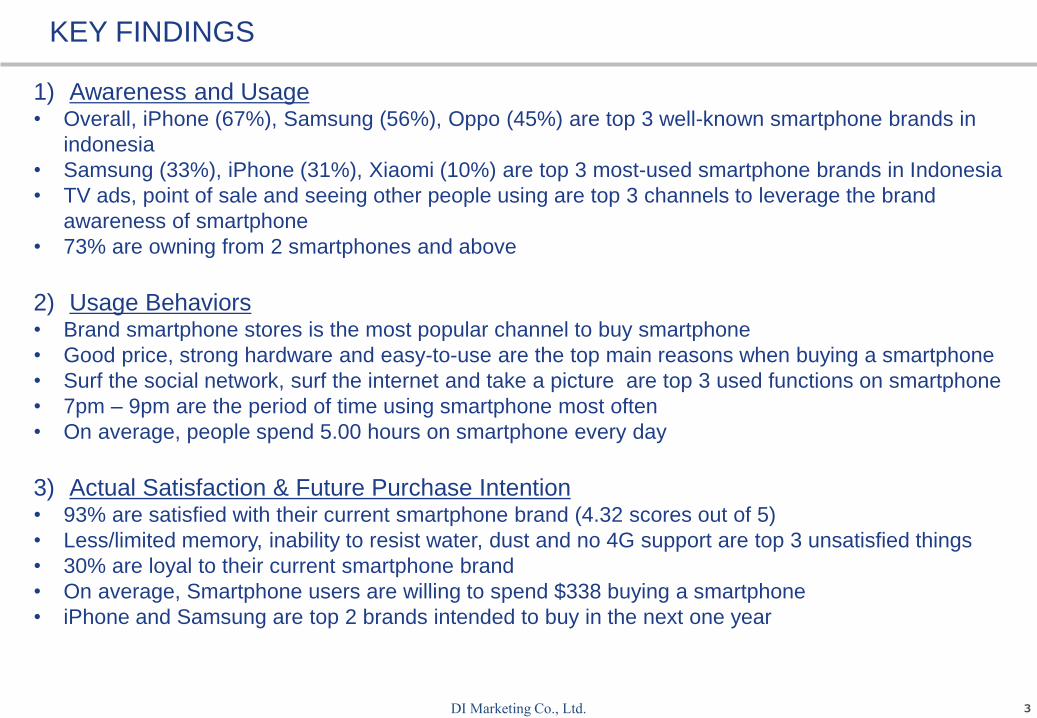
1) Awareness and Usage• Overall, iPhone (67%), Samsung (56%), Oppo (45%) are top 3 well-known smartphone brands in
indonesia
• Samsung (33%), iPhone (31%), Xiaomi (10%) are top 3 most-used smartphone brands in Indonesia
• TV ads, point of sale and seeing other people using are top 3 channels to leverage the brand
awareness of smartphone
• 73% are owning from 2 smartphones and above
2) Usage Behaviors• Brand smartphone stores is the most popular channel to buy smartphone
• Good price, strong hardware and easy-to-use are the top main reasons when buying a smartphone
• Surf the social network, surf the internet and take a picture are top 3 used functions on smartphone
• 7pm – 9pm are the period of time using smartphone most often
• On average, people spend 5.00 hours on smartphone every day
3) Actual Satisfaction & Future Purchase Intention• 93% are satisfied with their current smartphone brand (4.32 scores out of 5)
• Less/limited memory, inability to resist water, dust and no 4G support are top 3 unsatisfied things
• 30% are loyal to their current smartphone brand
• On average, Smartphone users are willing to spend $338 buying a smartphone
• iPhone and Samsung are top 2 brands intended to buy in the next one year
KEY FINDINGS
4DI Marketing Co., Ltd.
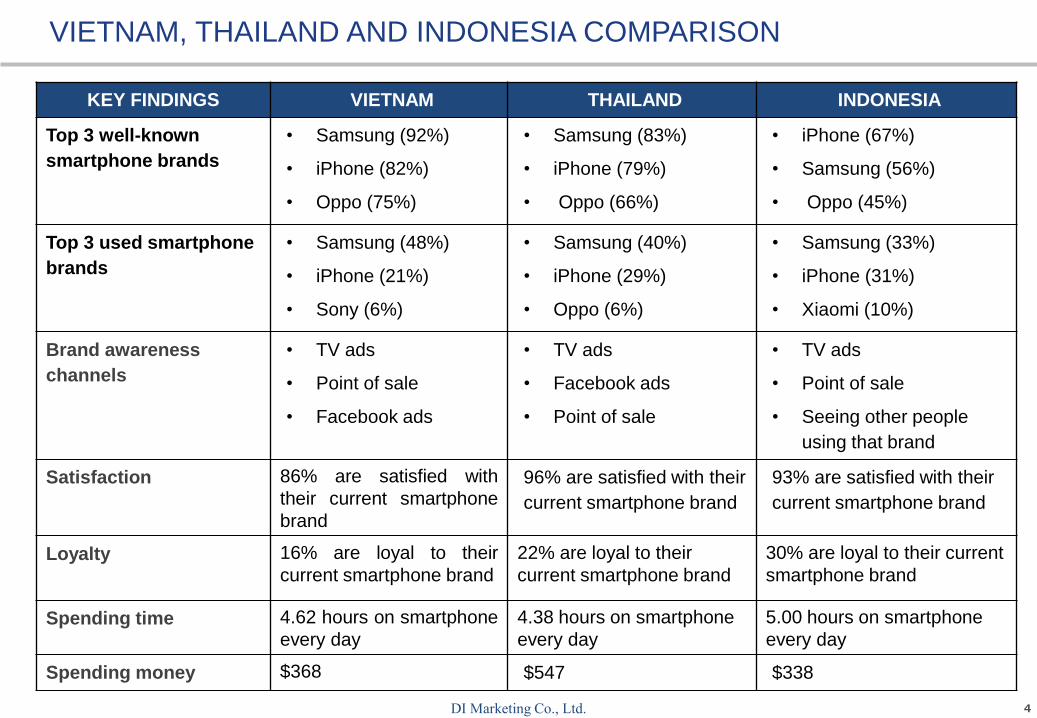
KEY FINDINGS VIETNAM THAILAND INDONESIA
Top 3 well-known
smartphone brands
• Samsung (92%)
• iPhone (82%)
• Oppo (75%)
• Samsung (83%)
• iPhone (79%)
• Oppo (66%)
• iPhone (67%)
• Samsung (56%)
• Oppo (45%)
Top 3 used smartphone
brands
• Samsung (48%)
• iPhone (21%)
• Sony (6%)
• Samsung (40%)
• iPhone (29%)
• Oppo (6%)
• Samsung (33%)
• iPhone (31%)
• Xiaomi (10%)
Brand awareness
channels
• TV ads
• Point of sale
• Facebook ads
• TV ads
• Facebook ads
• Point of sale
• TV ads
• Point of sale
• Seeing other people
using that brand
Satisfaction 86% are satisfied with
their current smartphone
brand
96% are satisfied with their
current smartphone brand
93% are satisfied with their
current smartphone brand
Loyalty 16% are loyal to their
current smartphone brand
22% are loyal to their
current smartphone brand
30% are loyal to their current
smartphone brand
Spending time 4.62 hours on smartphone
every day
4.38 hours on smartphone
every day
5.00 hours on smartphone
every day
Spending money $368 $547 $338
VIETNAM, THAILAND AND INDONESIA COMPARISON
5DI Marketing Co., Ltd.
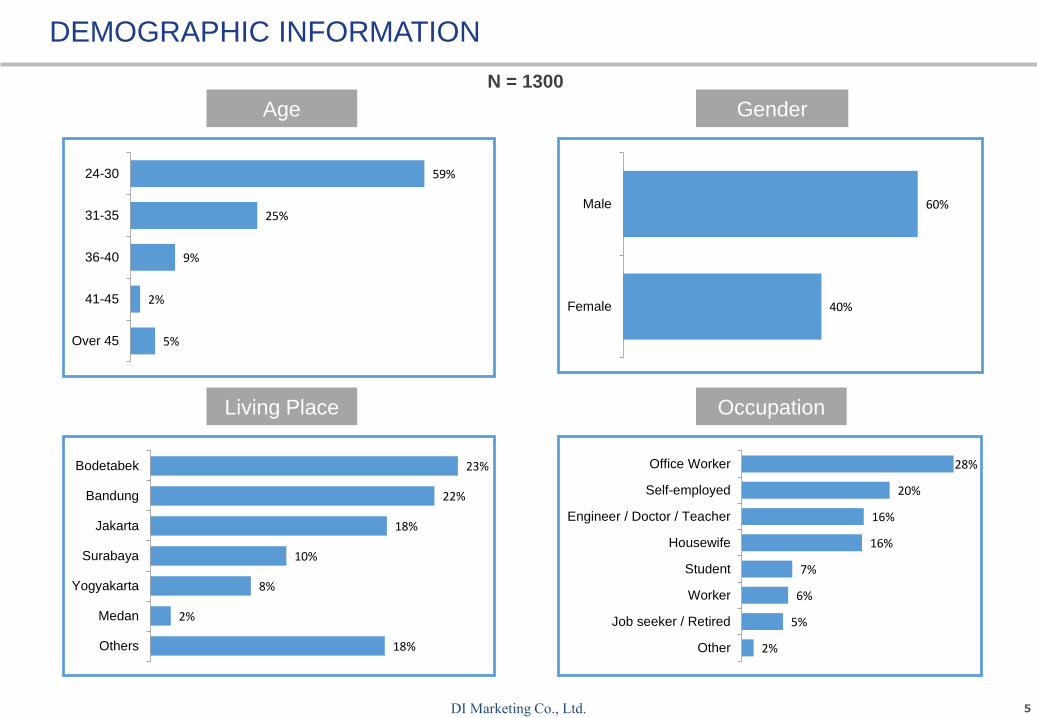
N = 1300
GenderAge
OccupationLiving Place
5%
2%
9%
25%
59%
Over 45
41-45
36-40
31-35
24-30
18%
2%
8%
10%
18%
22%
23%
Others
Medan
Yogyakarta
Surabaya
Jakarta
Bandung
Bodetabek
40%
60%
Female
Male
2%
5%
6%
7%
16%
16%
20%
28%
Other
Job seeker / Retired
Worker
Student
Housewife
Engineer / Doctor / Teacher
Self-employed
Office Worker
DEMOGRAPHIC INFORMATION
6DI Marketing Co., Ltd.
1) Awareness and Usage
2) Usage Behaviors
3) Actual Satisfaction & Future Purchase Intention
CONTENT
7DI Marketing Co., Ltd.
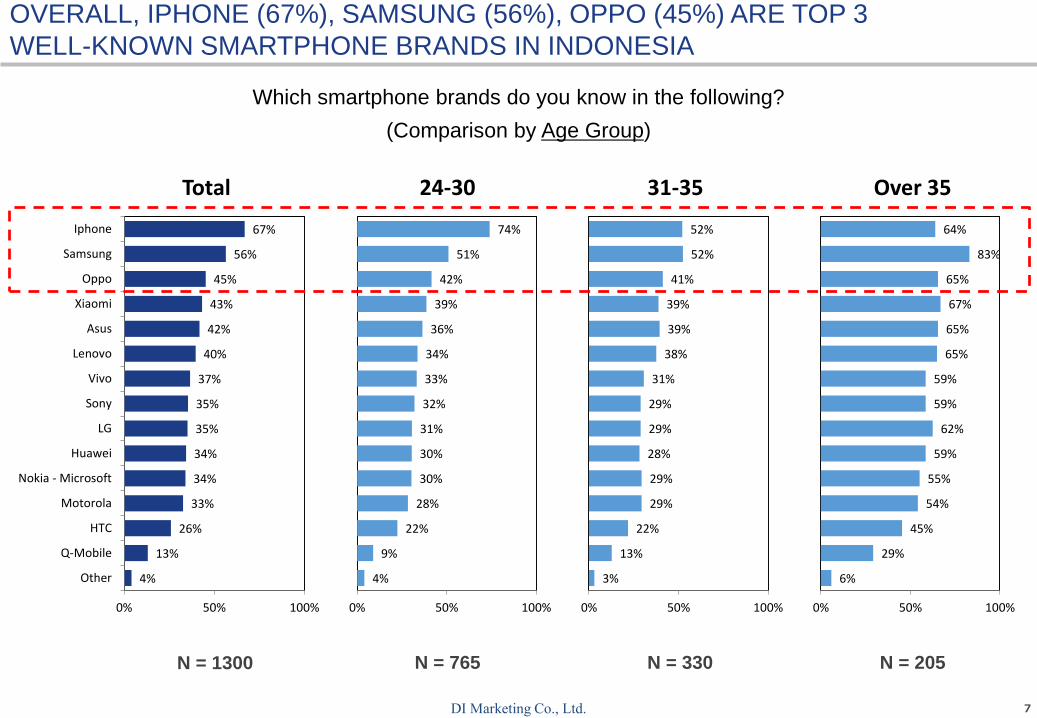
Which smartphone brands do you know in the following?
(Comparison by Age Group)
N = 1300 N = 765 N = 330 N = 205
4%
13%
26%
33%
34%
34%
35%
35%
37%
40%
42%
43%
45%
56%
67%
0% 50% 100%
Other
Q-Mobile
HTC
Motorola
Nokia - Microsoft
Huawei
LG
Sony
Vivo
Lenovo
Asus
Xiaomi
Oppo
Samsung
Iphone
Total
4%
9%
22%
28%
30%
30%
31%
32%
33%
34%
36%
39%
42%
51%
74%
0% 50% 100%
24-30
3%
13%
22%
29%
29%
28%
29%
29%
31%
38%
39%
39%
41%
52%
52%
0% 50% 100%
31-35
6%
29%
45%
54%
55%
59%
62%
59%
59%
65%
65%
67%
65%
83%
64%
0% 50% 100%
Over 35
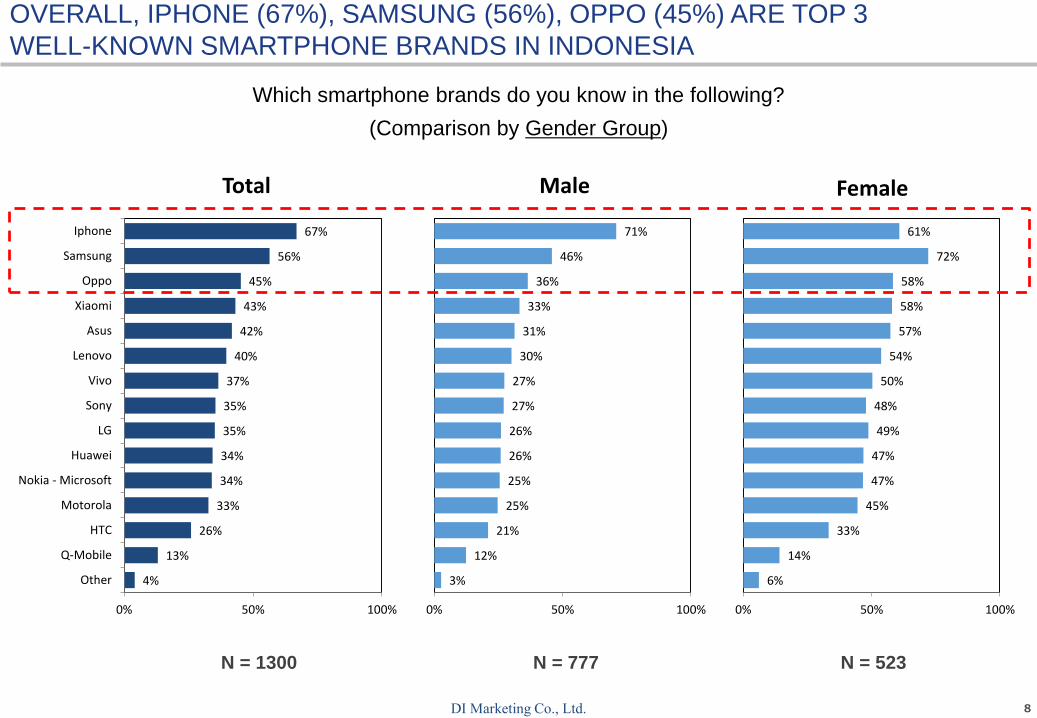
OVERALL, IPHONE (67%), SAMSUNG (56%), OPPO (45%) ARE TOP 3
WELL-KNOWN SMARTPHONE BRANDS IN INDONESIA
8DI Marketing Co., Ltd.
N = 1300 N = 777 N = 523
4%
13%
26%
33%
34%
34%
35%
35%
37%
40%
42%
43%
45%
56%
67%
0% 50% 100%
Other
Q-Mobile
HTC
Motorola
Nokia - Microsoft
Huawei
LG
Sony
Vivo
Lenovo
Asus
Xiaomi
Oppo
Samsung
Iphone
Total
3%
12%
21%
25%
25%
26%
26%
27%
27%
30%
31%
33%
36%
46%
71%
0% 50% 100%
Male
6%
14%
33%
45%
47%
47%
49%
48%
50%
54%
57%
58%
58%
72%
61%
0% 50% 100%
Female
OVERALL, IPHONE (67%), SAMSUNG (56%), OPPO (45%) ARE TOP 3
WELL-KNOWN SMARTPHONE BRANDS IN INDONESIA
Which smartphone brands do you know in the following?
(Comparison by Gender Group)
9DI Marketing Co., Ltd.
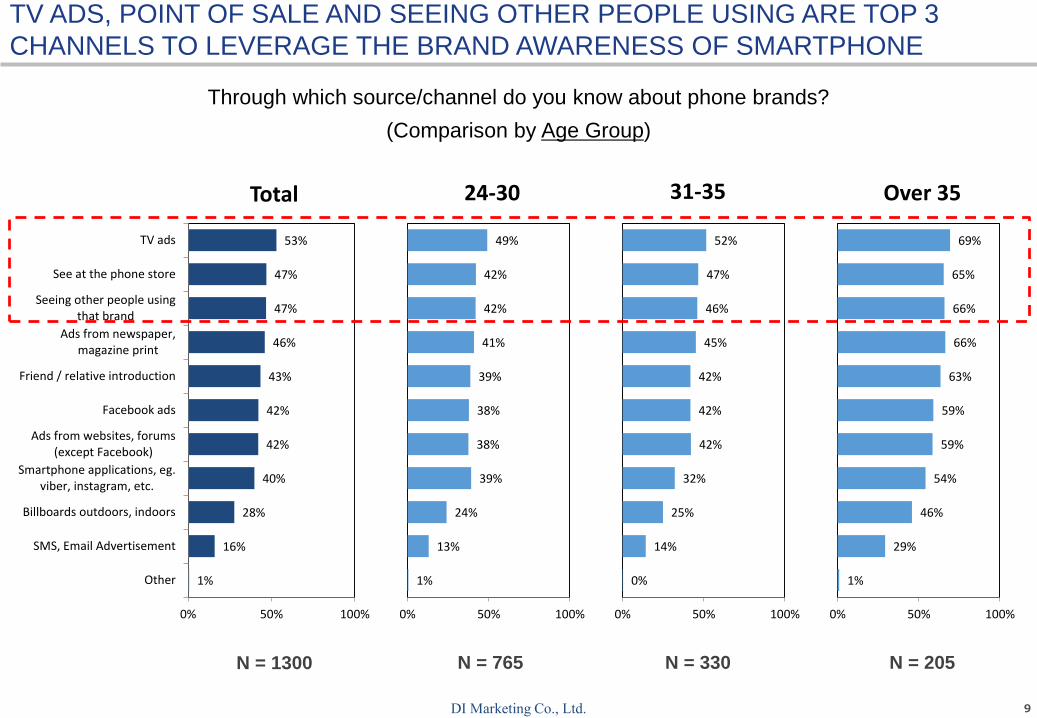
N = 1300 N = 765 N = 330 N = 205
1%
16%
28%
40%
42%
42%
43%
46%
47%
47%
53%
0% 50% 100%
Other
SMS, Email Advertisement
Billboards outdoors, indoors
Smartphone applications, eg.viber, instagram, etc.
Ads from websites, forums(except Facebook)
Facebook ads
Friend / relative introduction
Ads from newspaper,magazine print
Seeing other people usingthat brand
See at the phone store
TV ads
Total
1%
13%
24%
39%
38%
38%
39%
41%
42%
42%
49%
0% 50% 100%
24-30
0%
14%
25%
32%
42%
42%
42%
45%
46%
47%
52%
0% 50% 100%
31-35
1%
29%
46%
54%
59%
59%
63%
66%
66%
65%
69%
0% 50% 100%
Over 35
TV ADS, POINT OF SALE AND SEEING OTHER PEOPLE USING ARE TOP 3
CHANNELS TO LEVERAGE THE BRAND AWARENESS OF SMARTPHONE
Through which source/channel do you know about phone brands?
(Comparison by Age Group)
10DI Marketing Co., Ltd.
N = 1300 N = 777 N = 523
1%
16%
28%
40%
42%
42%
43%
46%
47%
47%
53%
0% 50% 100%
Other
SMS, Email Advertisement
Billboards outdoors, indoors
Smartphone applications, eg. viber,instagram, etc.
Ads from websites, forums (exceptFacebook)
Facebook ads
Friend / relative introduction
Ads from newspaper, magazine print
Seeing other people using that brand
See at the phone store
TV ads
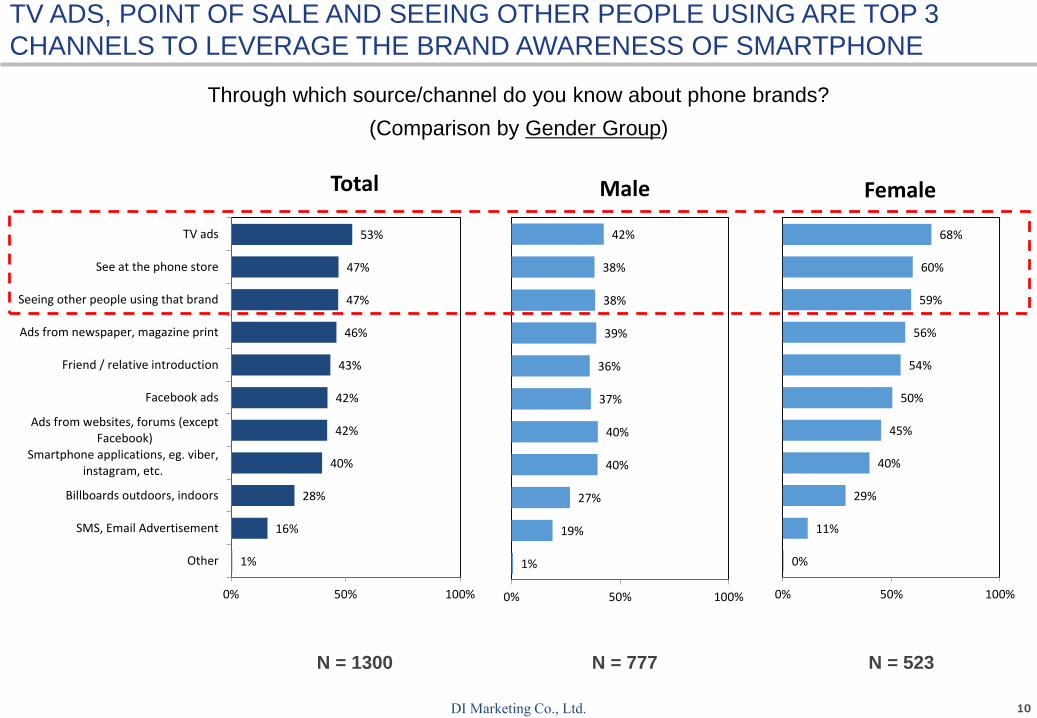
Total
1%
19%
27%
40%
40%
37%
36%
39%
38%
38%
42%
0% 50% 100%
Male
0%
11%
29%
40%
45%
50%
54%
56%
59%
60%
68%
0% 50% 100%
Female
TV ADS, POINT OF SALE AND SEEING OTHER PEOPLE USING ARE TOP 3
CHANNELS TO LEVERAGE THE BRAND AWARENESS OF SMARTPHONE
Through which source/channel do you know about phone brands?
(Comparison by Gender Group)
11DI Marketing Co., Ltd.
4% 2%9%
5%
18%
12%
33%
15%
51%
59%
37%
43%
27% 27%20%
38%
0%
10%
20%
30%
40%
50%
60%
70%
80%
90%
100%
Total 24-30 31-35 Over 35
1
2
3
Over 3
4% 4% 5%
18% 22%12%
51%
52%
49%
27%23%
33%
0%
10%
20%
30%
40%
50%
60%
70%
80%
90%
100%
Total Male Female
1
2
3
Over 3
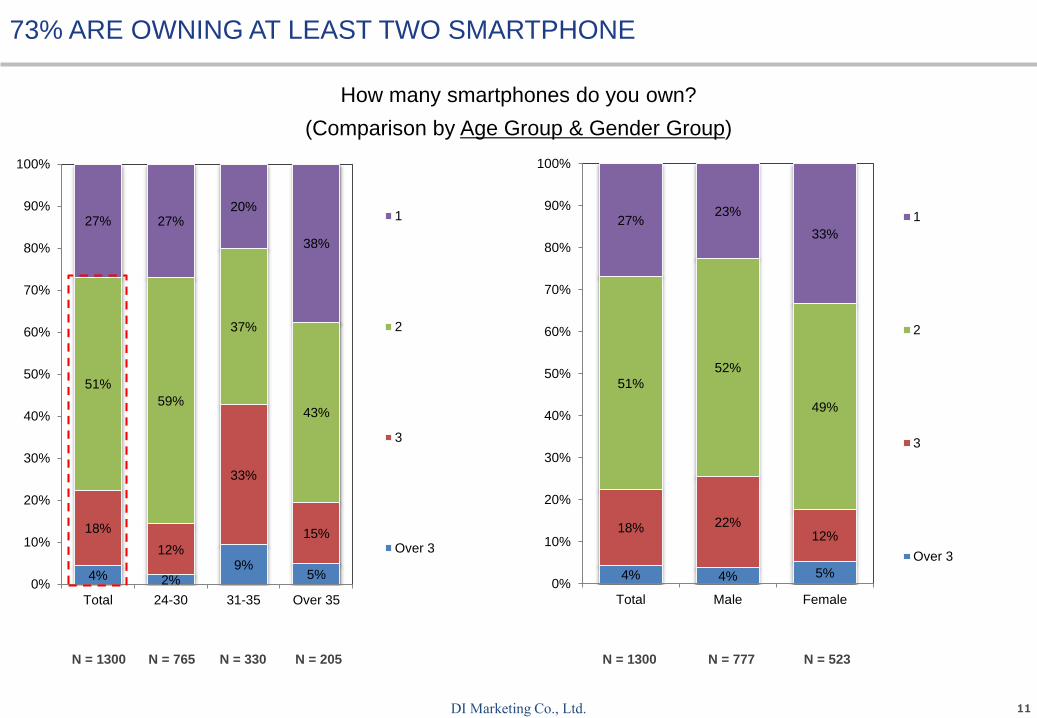
How many smartphones do you own?
(Comparison by Age Group & Gender Group)
N = 1300 N = 765 N = 330 N = 205 N = 1300 N = 777 N = 523
73% ARE OWNING AT LEAST TWO SMARTPHONE
12DI Marketing Co., Ltd.
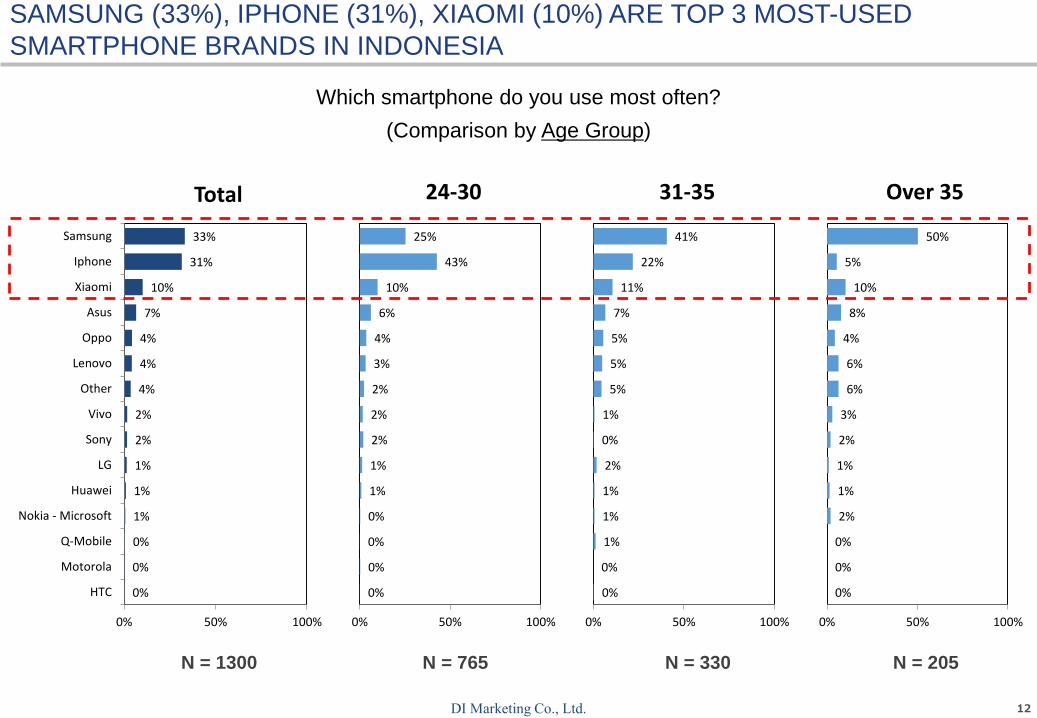
SAMSUNG (33%), IPHONE (31%), XIAOMI (10%) ARE TOP 3 MOST-USED
SMARTPHONE BRANDS IN INDONESIA
Which smartphone do you use most often?
(Comparison by Age Group)
N = 1300 N = 765 N = 330 N = 205
0%
0%
0%
1%
1%
1%
2%
2%
4%
4%
4%
7%
10%
31%
33%
0% 50% 100%
HTC
Motorola
Q-Mobile
Nokia - Microsoft
Huawei
LG
Sony
Vivo
Other
Lenovo
Oppo
Asus
Xiaomi
Iphone
Samsung
Total
0%
0%
0%
0%
1%
1%
2%
2%
2%
3%
4%
6%
10%
43%
25%
0% 50% 100%
24-30
0%
0%
1%
1%
1%
2%
0%
1%
5%
5%
5%
7%
11%
22%
41%
0% 50% 100%
31-35
0%
0%
0%
2%
1%
1%
2%
3%
6%
6%
4%
8%
10%
5%
50%
0% 50% 100%
Over 35
13DI Marketing Co., Ltd.
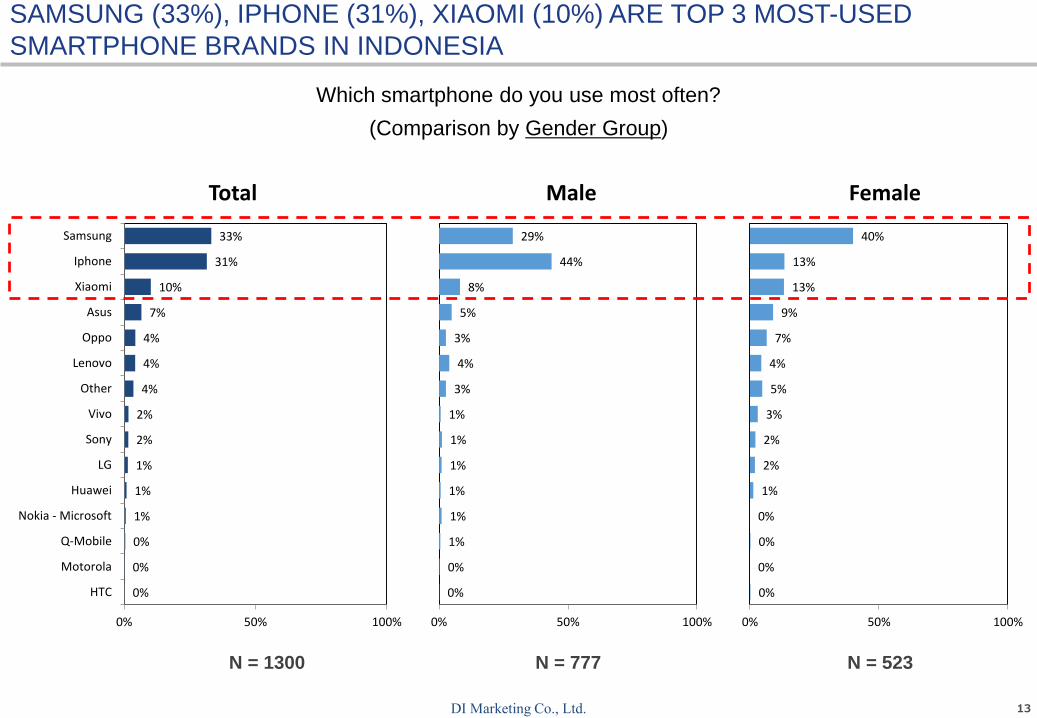
N = 1300 N = 777 N = 523
0%
0%
0%
1%
1%
1%
2%
2%
4%
4%
4%
7%
10%
31%
33%
0% 50% 100%
HTC
Motorola
Q-Mobile
Nokia - Microsoft
Huawei
LG
Sony
Vivo
Other
Lenovo
Oppo
Asus
Xiaomi
Iphone
Samsung
Total
0%
0%
1%
1%
1%
1%
1%
1%
3%
4%
3%
5%
8%
44%
29%
0% 50% 100%
Male
0%
0%
0%
0%
1%
2%
2%
3%
5%
4%
7%
9%
13%
13%
40%
0% 50% 100%
Female
SAMSUNG (33%), IPHONE (31%), XIAOMI (10%) ARE TOP 3 MOST-USED
SMARTPHONE BRANDS IN INDONESIA
Which smartphone do you use most often?
(Comparison by Gender Group)
14DI Marketing Co., Ltd.
6% 7% 7% 5%
7%9%
4% 7%
7%8%
6% 8%
26% 20%
51%
8%
53%57%
32%
73%
0%
10%
20%
30%
40%
50%
60%
70%
80%
90%
100%
Total 24-30 31-35 Over 35
Samsung Galaxy J(1, 2,3,5,7)
Samsung Galaxy S(1,2,3,4,5,6,7,7 Edge,8.8 +)
Samsung GalaxyNote (1,2,3,4,5,6,7)
Samsung Galaxy A(3,5,7,9)
Other Samsungseries
6% 5%9%
7%5%
9%
7%
7%
8%
26% 36%16%
53%47%
59%
0%
10%
20%
30%
40%
50%
60%
70%
80%
90%
100%
Total Male Female
Samsung Galaxy J (1,2,3,5,7)
Samsung Galaxy S(1,2,3,4,5,6,7,7 Edge,8.8 +)
Samsung GalaxyNote (1,2,3,4,5,6,7)
Samsung Galaxy A(3,5,7,9)
Other Samsungseries
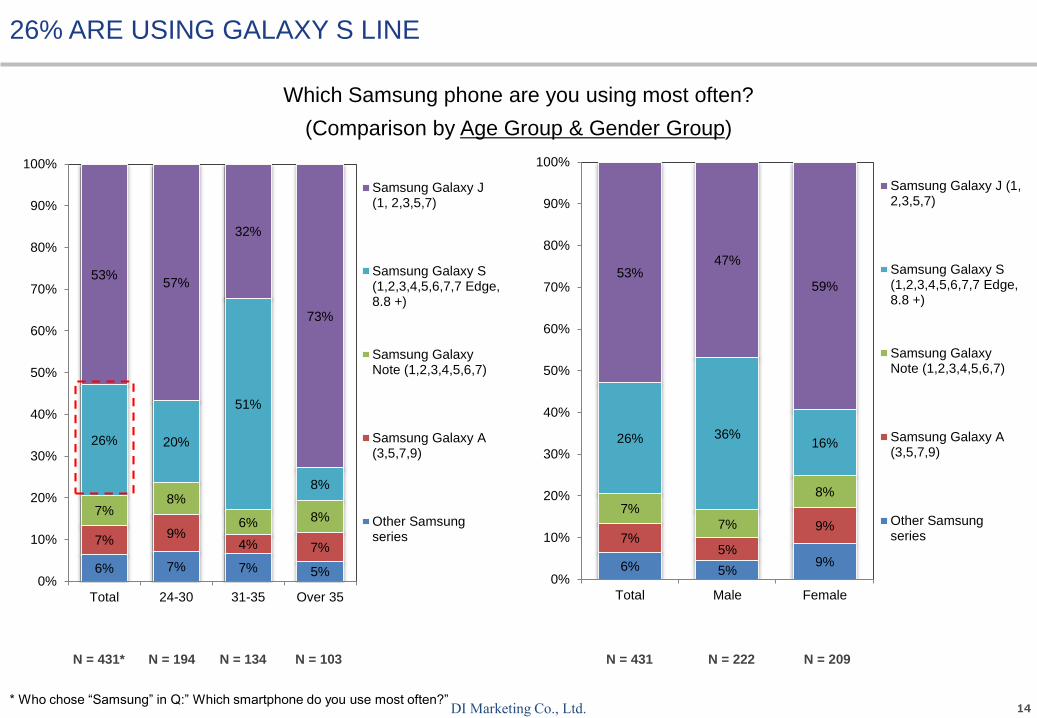
26% ARE USING GALAXY S LINE
Which Samsung phone are you using most often?
(Comparison by Age Group & Gender Group)
* Who chose “Samsung” in Q:” Which smartphone do you use most often?”
N = 431* N = 194 N = 134 N = 103 N = 431 N = 222 N = 209
15DI Marketing Co., Ltd.
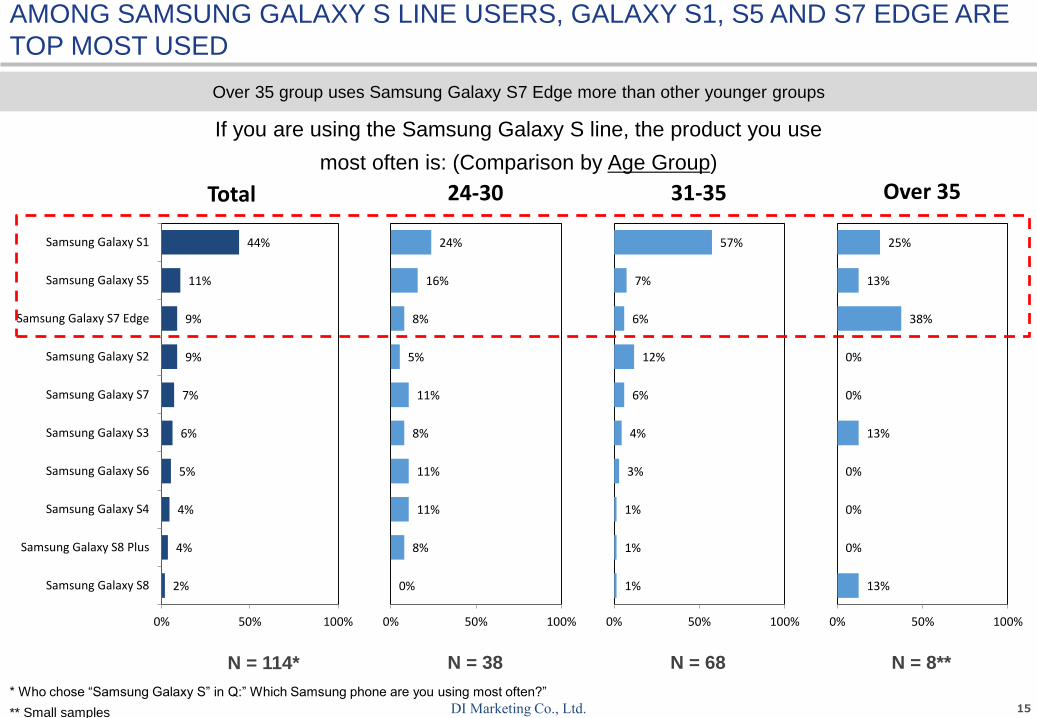
AMONG SAMSUNG GALAXY S LINE USERS, GALAXY S1, S5 AND S7 EDGE ARE
TOP MOST USED
If you are using the Samsung Galaxy S line, the product you use
most often is: (Comparison by Age Group)
N = 114* N = 38 N = 68 N = 8**
Over 35 group uses Samsung Galaxy S7 Edge more than other younger groups
* Who chose “Samsung Galaxy S” in Q:” Which Samsung phone are you using most often?”
** Small samples
2%
4%
4%
5%
6%
7%
9%
9%
11%
44%
0% 50% 100%
Samsung Galaxy S8
Samsung Galaxy S8 Plus
Samsung Galaxy S4
Samsung Galaxy S6
Samsung Galaxy S3
Samsung Galaxy S7
Samsung Galaxy S2
Samsung Galaxy S7 Edge
Samsung Galaxy S5
Samsung Galaxy S1
Total
0%
8%
11%
11%
8%
11%
5%
8%
16%
24%
0% 50% 100%
24-30
1%
1%
1%
3%
4%
6%
12%
6%
7%
57%
0% 50% 100%
31-35
13%
0%
0%
0%
13%
0%
0%
38%
13%
25%
0% 50% 100%
Over 35
16DI Marketing Co., Ltd.
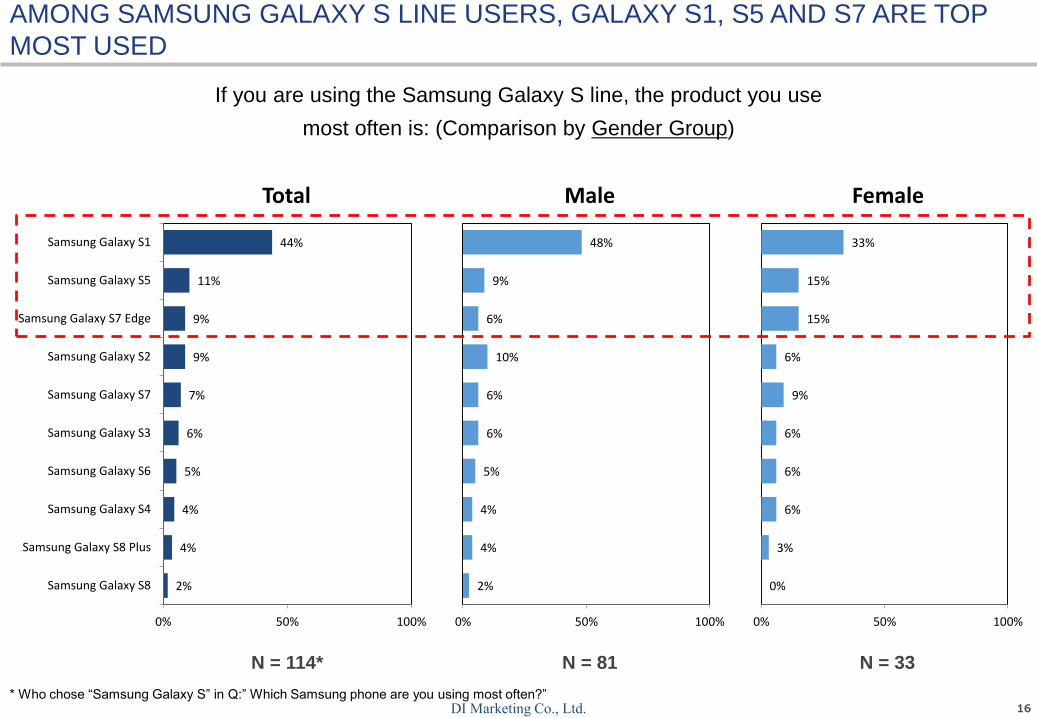
If you are using the Samsung Galaxy S line, the product you use
most often is: (Comparison by Gender Group)
N = 114* N = 81 N = 33
* Who chose “Samsung Galaxy S” in Q:” Which Samsung phone are you using most often?”
2%
4%
4%
5%
6%
7%
9%
9%
11%
44%
0% 50% 100%
Samsung Galaxy S8
Samsung Galaxy S8 Plus
Samsung Galaxy S4
Samsung Galaxy S6
Samsung Galaxy S3
Samsung Galaxy S7
Samsung Galaxy S2
Samsung Galaxy S7 Edge
Samsung Galaxy S5
Samsung Galaxy S1
Total
2%
4%
4%
5%
6%
6%
10%
6%
9%
48%
0% 50% 100%
Male
0%
3%
6%
6%
6%
9%
6%
15%
15%
33%
0% 50% 100%
Female
AMONG SAMSUNG GALAXY S LINE USERS, GALAXY S1, S5 AND S7 ARE TOP
MOST USED
17DI Marketing Co., Ltd.
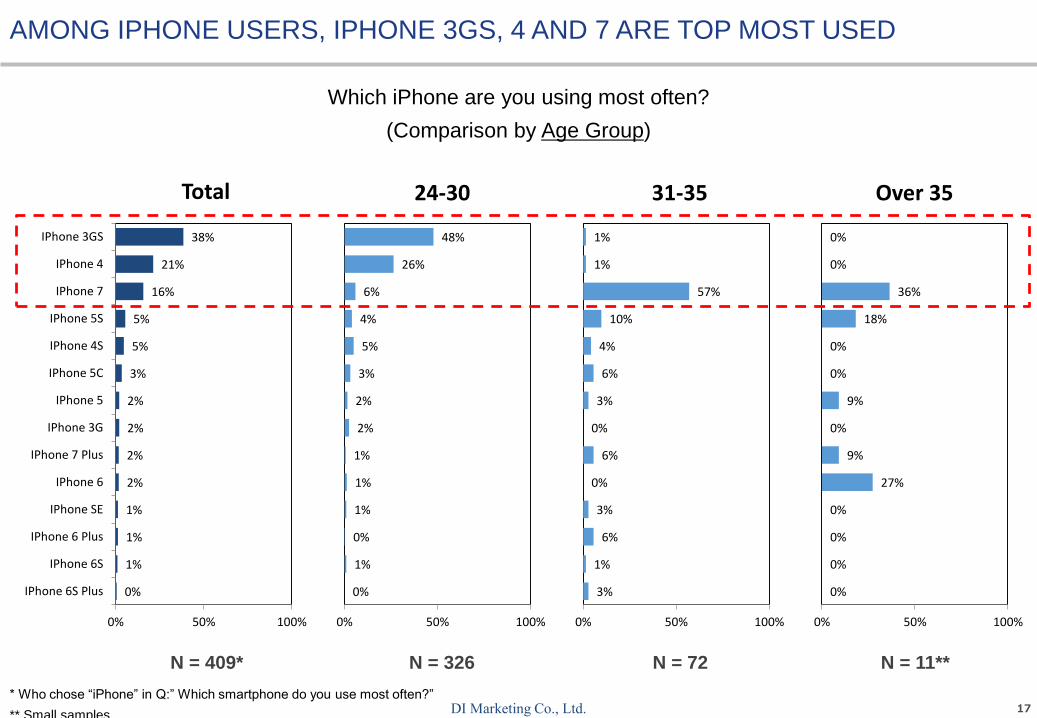
Which iPhone are you using most often?
(Comparison by Age Group)
N = 409* N = 326 N = 72 N = 11**
AMONG IPHONE USERS, IPHONE 3GS, 4 AND 7 ARE TOP MOST USED
* Who chose “iPhone” in Q:” Which smartphone do you use most often?”
** Small samples
0%
1%
1%
1%
2%
2%
2%
2%
3%
5%
5%
16%
21%
38%
0% 50% 100%
IPhone 6S Plus
IPhone 6S
IPhone 6 Plus
IPhone SE
IPhone 6
IPhone 7 Plus
IPhone 3G
IPhone 5
IPhone 5C
IPhone 4S
IPhone 5S
IPhone 7
IPhone 4
IPhone 3GS
Total
0%
1%
0%
1%
1%
1%
2%
2%
3%
5%
4%
6%
26%
48%
0% 50% 100%
24-30
3%
1%
6%
3%
0%
6%
0%
3%
6%
4%
10%
57%
1%
1%
0% 50% 100%
31-35
0%
0%
0%
0%
27%
9%
0%
9%
0%
0%
18%
36%
0%
0%
0% 50% 100%
Over 35
18DI Marketing Co., Ltd.
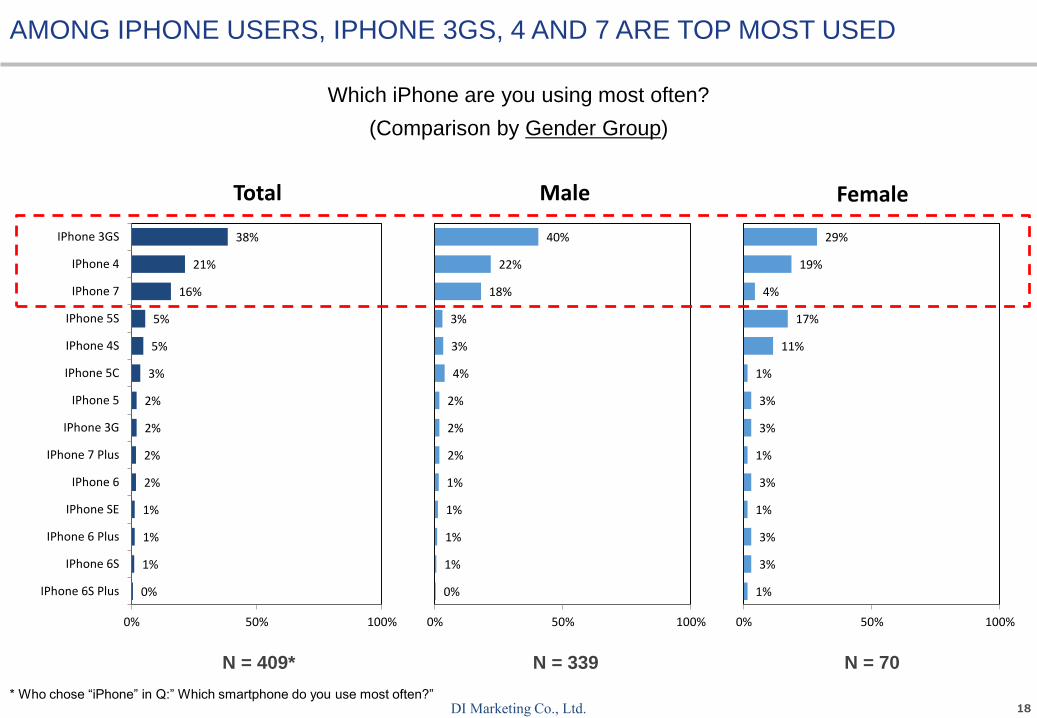
N = 409* N = 339 N = 70
* Who chose “iPhone” in Q:” Which smartphone do you use most often?”
0%
1%
1%
1%
2%
2%
2%
2%
3%
5%
5%
16%
21%
38%
0% 50% 100%
IPhone 6S Plus
IPhone 6S
IPhone 6 Plus
IPhone SE
IPhone 6
IPhone 7 Plus
IPhone 3G
IPhone 5
IPhone 5C
IPhone 4S
IPhone 5S
IPhone 7
IPhone 4
IPhone 3GS
Total
0%
1%
1%
1%
1%
2%
2%
2%
4%
3%
3%
18%
22%
40%
0% 50% 100%
Male
1%
3%
3%
1%
3%
1%
3%
3%
1%
11%
17%
4%
19%
29%
0% 50% 100%
Female
AMONG IPHONE USERS, IPHONE 3GS, 4 AND 7 ARE TOP MOST USED
Which iPhone are you using most often?
(Comparison by Gender Group)
19DI Marketing Co., Ltd.
7% 4%
19% 18%
43%
40%
57%
27%
45%53%
14%
18%
5% 3%10%
36%
0%
10%
20%
30%
40%
50%
60%
70%
80%
90%
100%
Total 24-30 31-35 Over 35
16GB
32GB
64GB
128GB
256GB
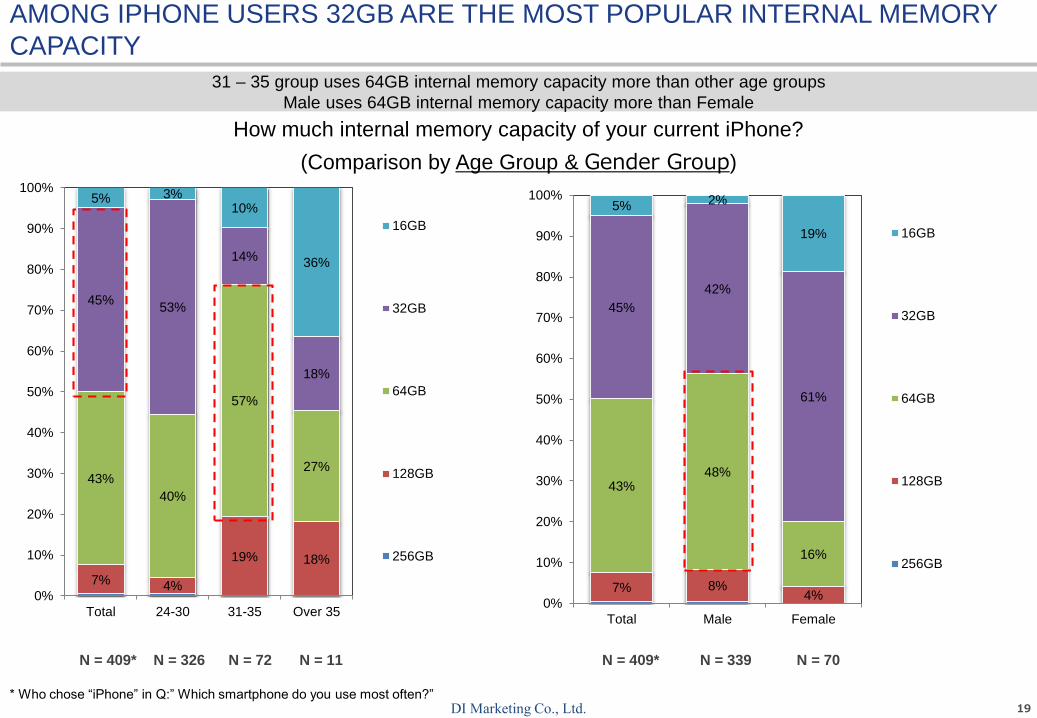
How much internal memory capacity of your current iPhone?
(Comparison by Age Group & Gender Group)
N = 409* N = 326 N = 72 N = 11
31 – 35 group uses 64GB internal memory capacity more than other age groups
Male uses 64GB internal memory capacity more than Female
N = 409* N = 339 N = 70
AMONG IPHONE USERS 32GB ARE THE MOST POPULAR INTERNAL MEMORY
CAPACITY
* Who chose “iPhone” in Q:” Which smartphone do you use most often?”
7% 8%4%
43%48%
16%
45%
42%
61%
5% 2%
19%
0%
10%
20%
30%
40%
50%
60%
70%
80%
90%
100%
Total Male Female
16GB
32GB
64GB
128GB
256GB
20DI Marketing Co., Ltd.
1) Awareness and Usage
2) Usage Behaviors
3) Actual Satisfaction & Future Purchase Intention
CONTENT
21DI Marketing Co., Ltd.
3%
28%
44%
44%
51%
0% 50% 100%
Other
Hypermarket (Carrefour,Hypermart, Giant)
Electronic retail stores (ITC,Mall-mall)
Electronic specialist stores(Okeshop, Erafone, Global
Teleshop)
Brand smartphone stores(Apple Store, Samsung Store,
OPPO Store, etc.)
Total
2%
26%
42%
42%
51%
0% 50% 100%
24-30
3%
32%
42%
46%
48%
0% 50% 100%
31-35
6%
30%
58%
51%
57%
0% 50% 100%
Over 35
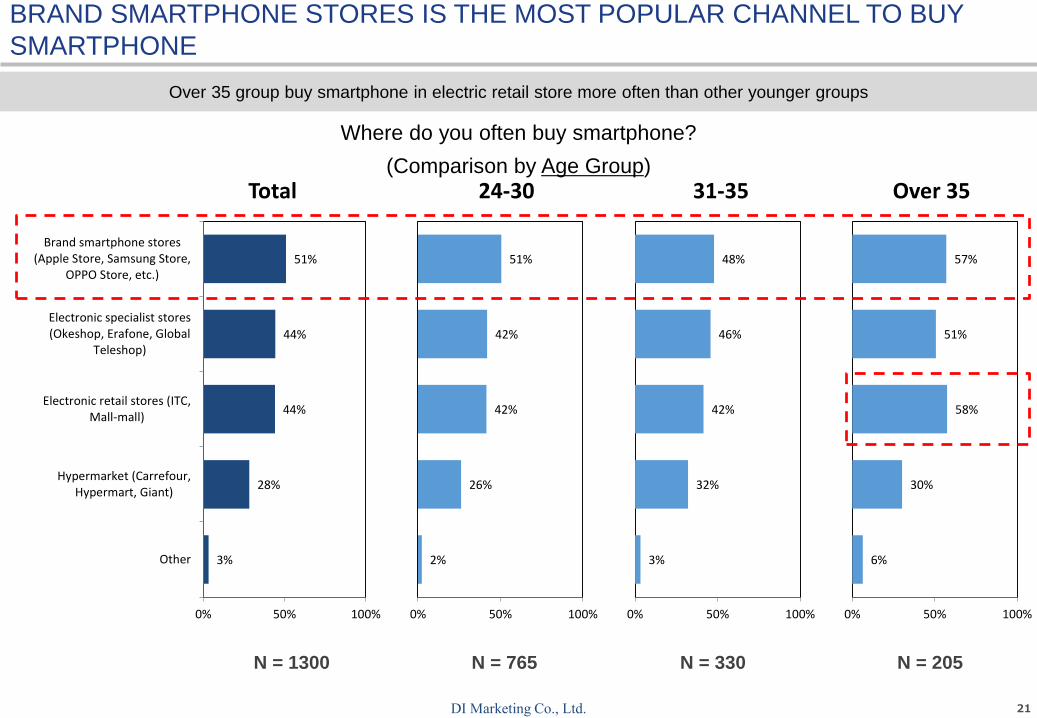
BRAND SMARTPHONE STORES IS THE MOST POPULAR CHANNEL TO BUY
SMARTPHONE
Where do you often buy smartphone?
(Comparison by Age Group)
N = 1300 N = 765 N = 330 N = 205
Over 35 group buy smartphone in electric retail store more often than other younger groups
22DI Marketing Co., Ltd.
3%
28%
44%
44%
51%
0% 50% 100%
Other
Hypermarket (Carrefour, Hypermart,Giant)
Electronic retail stores (ITC, Mall-mall)
Electronic specialist stores (Okeshop,Erafone, Global Teleshop)
Brand smartphone stores (Apple Store,Samsung Store, OPPO Store, etc.)
Total
2%
38%
47%
49%
51%
0% 50% 100%
Male
5%
14%
40%
37%
50%
0% 50% 100%
Female
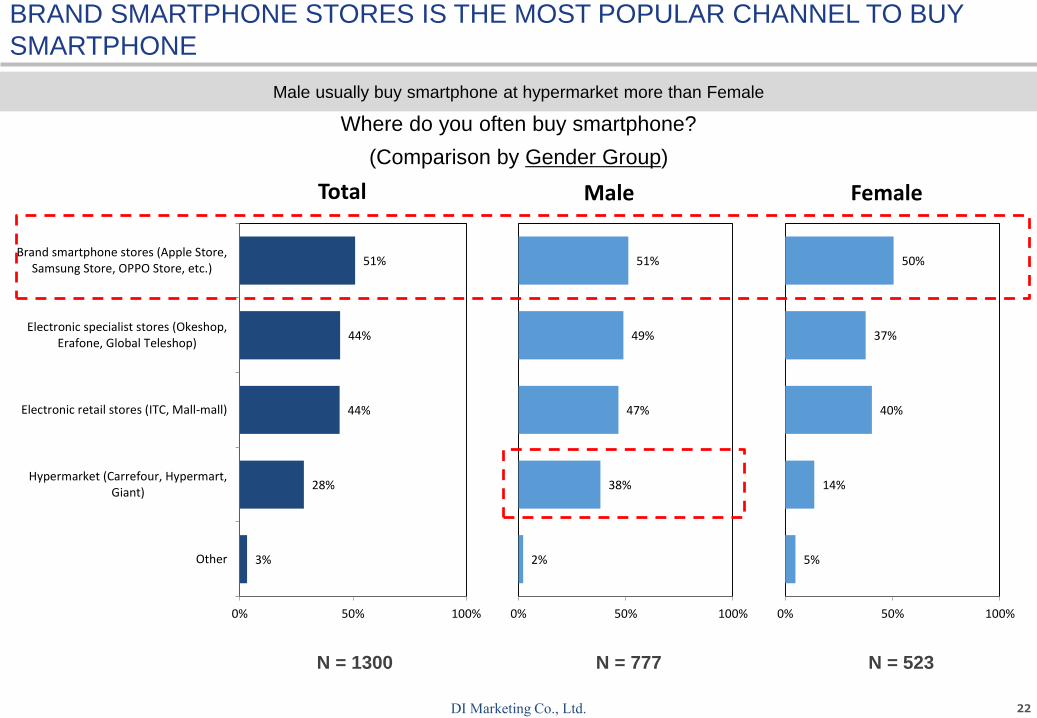
N = 1300 N = 777 N = 523
BRAND SMARTPHONE STORES IS THE MOST POPULAR CHANNEL TO BUY
SMARTPHONE
Where do you often buy smartphone?
(Comparison by Gender Group)
Male usually buy smartphone at hypermarket more than Female
23DI Marketing Co., Ltd.
1%
22%
25%
27%
32%
32%
33%
36%
38%
38%
42%
43%
45%
0% 50% 100%
Other
Luxury brand
Good information security
Integrated fingerprint security
Many promotions / discounts / after-sales
Friends / relatives recommendation
Famous brand
Beautiful, thin, light design
Good reviews on technology forums
There is a rich, diverse application stores
Easy-to-use operation system
Strong hardware configuration
Good price
Total
1%
30%
33%
32%
39%
38%
48%
42%
44%
46%
53%
51%
48%
0% 50% 100%
Samsung
0%
22%
19%
24%
22%
25%
22%
23%
24%
25%
23%
19%
20%
0% 50% 100%
Iphone
2%
14%
27%
34%
33%
35%
28%
40%
59%
42%
42%
64%
69%
0% 50% 100%
Xiaomi
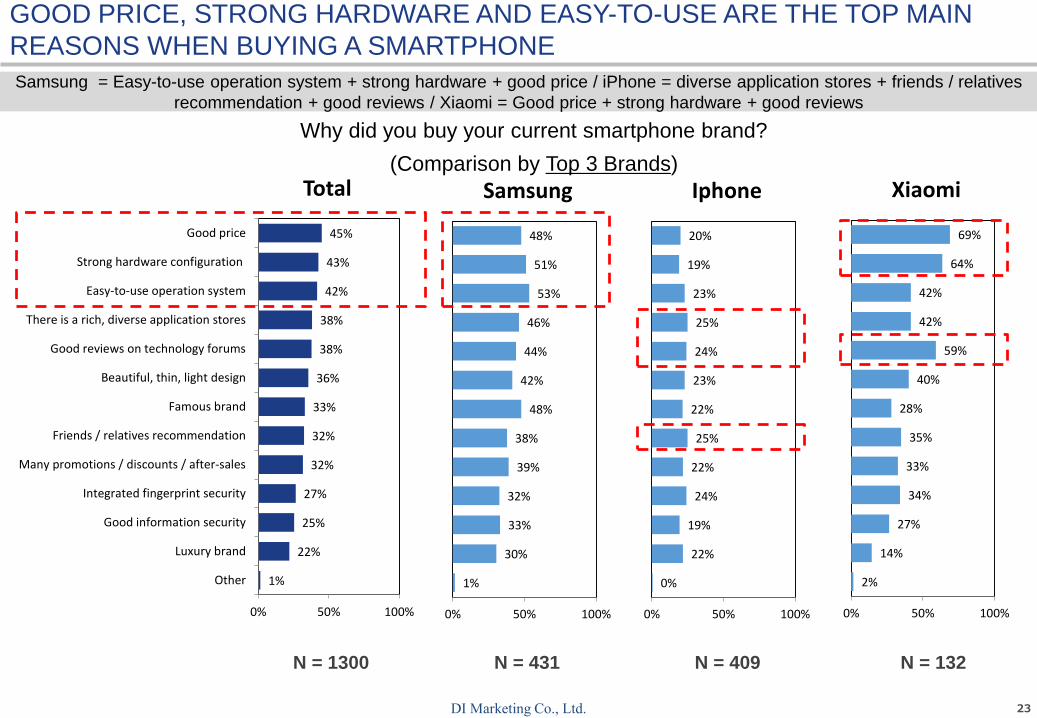
Samsung = Easy-to-use operation system + strong hardware + good price / iPhone = diverse application stores + friends / relatives
recommendation + good reviews / Xiaomi = Good price + strong hardware + good reviews
N = 1300 N = 431 N = 409 N = 132
GOOD PRICE, STRONG HARDWARE AND EASY-TO-USE ARE THE TOP MAIN
REASONS WHEN BUYING A SMARTPHONE
Why did you buy your current smartphone brand?
(Comparison by Top 3 Brands)
24DI Marketing Co., Ltd.
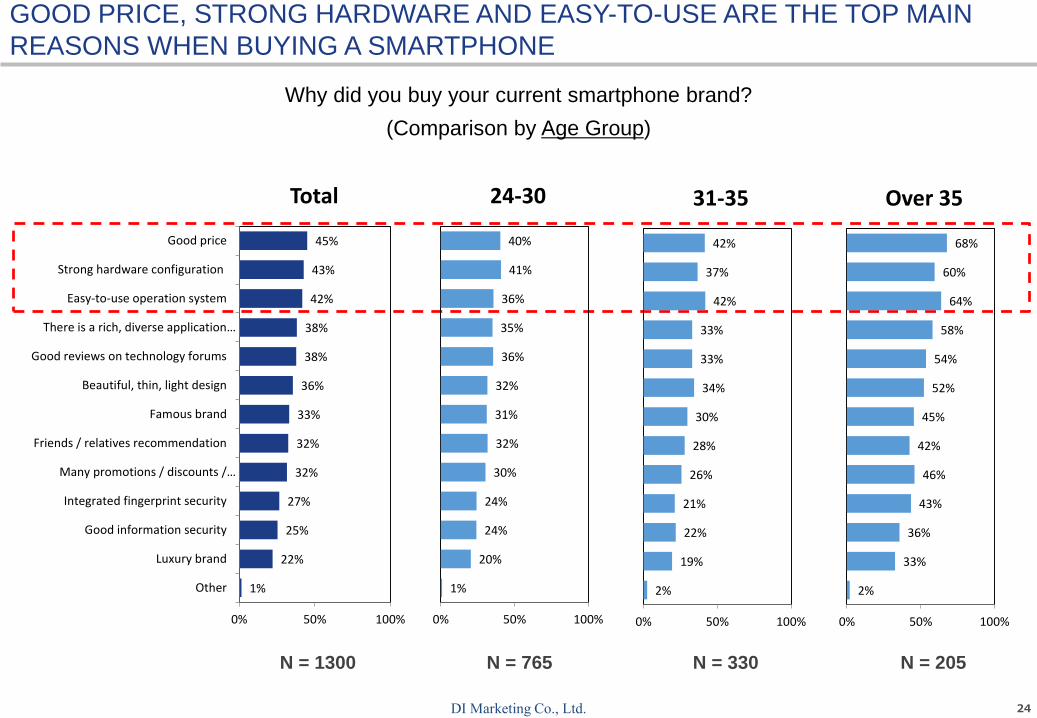
N = 1300 N = 765 N = 330 N = 205
GOOD PRICE, STRONG HARDWARE AND EASY-TO-USE ARE THE TOP MAIN
REASONS WHEN BUYING A SMARTPHONE
1%
22%
25%
27%
32%
32%
33%
36%
38%
38%
42%
43%
45%
0% 50% 100%
Other
Luxury brand
Good information security
Integrated fingerprint security
Many promotions / discounts /…
Friends / relatives recommendation
Famous brand
Beautiful, thin, light design
Good reviews on technology forums
There is a rich, diverse application…
Easy-to-use operation system
Strong hardware configuration
Good price
Total
1%
20%
24%
24%
30%
32%
31%
32%
36%
35%
36%
41%
40%
0% 50% 100%
24-30
2%
19%
22%
21%
26%
28%
30%
34%
33%
33%
42%
37%
42%
0% 50% 100%
31-35
2%
33%
36%
43%
46%
42%
45%
52%
54%
58%
64%
60%
68%
0% 50% 100%
Over 35
Why did you buy your current smartphone brand?
(Comparison by Age Group)
25DI Marketing Co., Ltd.
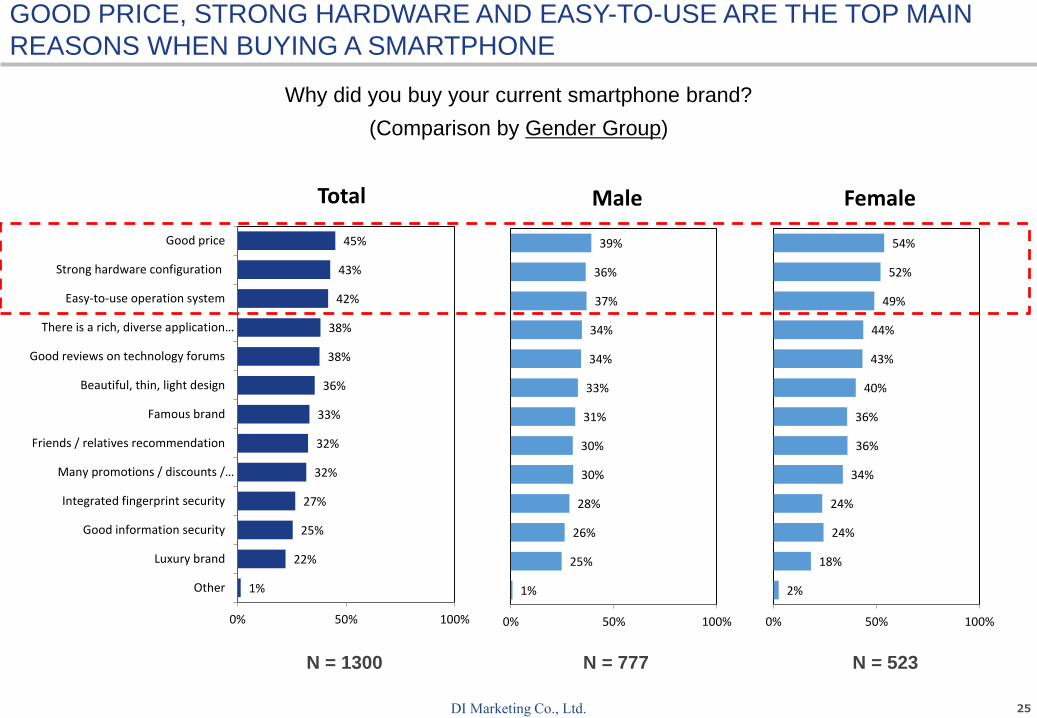
N = 1300 N = 777 N = 523
GOOD PRICE, STRONG HARDWARE AND EASY-TO-USE ARE THE TOP MAIN
REASONS WHEN BUYING A SMARTPHONE
Why did you buy your current smartphone brand?
(Comparison by Gender Group)
1%
22%
25%
27%
32%
32%
33%
36%
38%
38%
42%
43%
45%
0% 50% 100%
Other
Luxury brand
Good information security
Integrated fingerprint security
Many promotions / discounts /…
Friends / relatives recommendation
Famous brand
Beautiful, thin, light design
Good reviews on technology forums
There is a rich, diverse application…
Easy-to-use operation system
Strong hardware configuration
Good price
Total
1%
25%
26%
28%
30%
30%
31%
33%
34%
34%
37%
36%
39%
0% 50% 100%
Male
2%
18%
24%
24%
34%
36%
36%
40%
43%
44%
49%
52%
54%
0% 50% 100%
Female
26DI Marketing Co., Ltd.
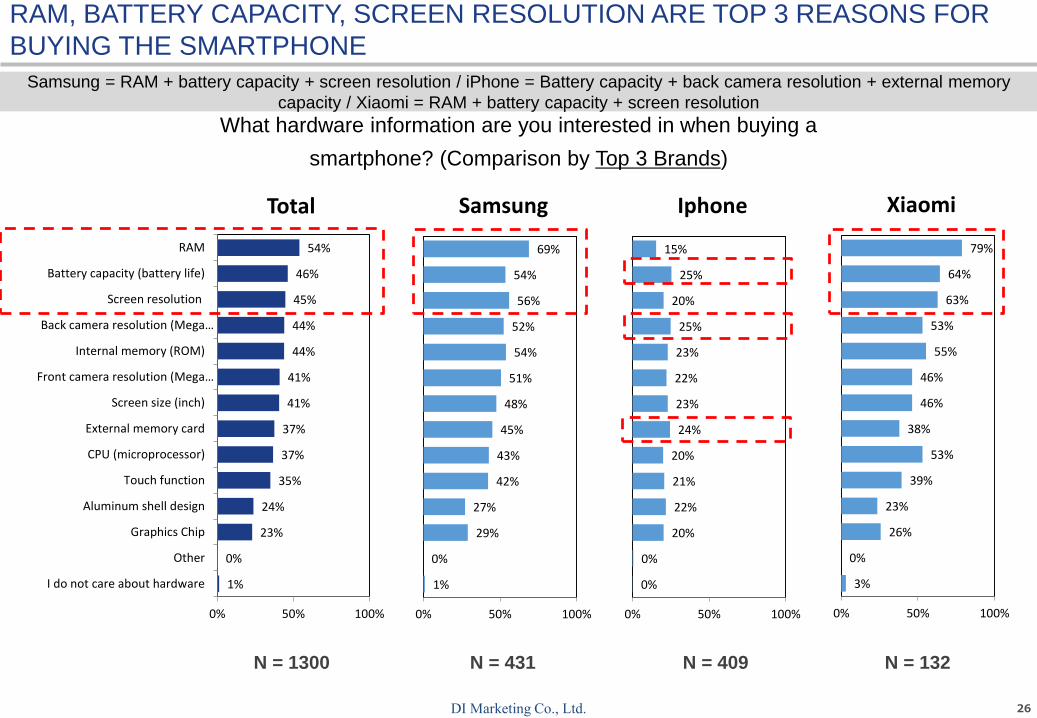
N = 1300 N = 431 N = 409 N = 132
RAM, BATTERY CAPACITY, SCREEN RESOLUTION ARE TOP 3 REASONS FOR
BUYING THE SMARTPHONE
Samsung = RAM + battery capacity + screen resolution / iPhone = Battery capacity + back camera resolution + external memory
capacity / Xiaomi = RAM + battery capacity + screen resolution
What hardware information are you interested in when buying a
smartphone? (Comparison by Top 3 Brands)
1%
0%
23%
24%
35%
37%
37%
41%
41%
44%
44%
45%
46%
54%
0% 50% 100%
I do not care about hardware
Other
Graphics Chip
Aluminum shell design
Touch function
CPU (microprocessor)
External memory card
Screen size (inch)
Front camera resolution (Mega…
Internal memory (ROM)
Back camera resolution (Mega…
Screen resolution
Battery capacity (battery life)
RAM
Total
1%
0%
29%
27%
42%
43%
45%
48%
51%
54%
52%
56%
54%
69%
0% 50% 100%
Samsung
0%
0%
20%
22%
21%
20%
24%
23%
22%
23%
25%
20%
25%
15%
0% 50% 100%
Iphone
3%
0%
26%
23%
39%
53%
38%
46%
46%
55%
53%
63%
64%
79%
0% 50% 100%
Xiaomi

27DI Marketing Co., Ltd.
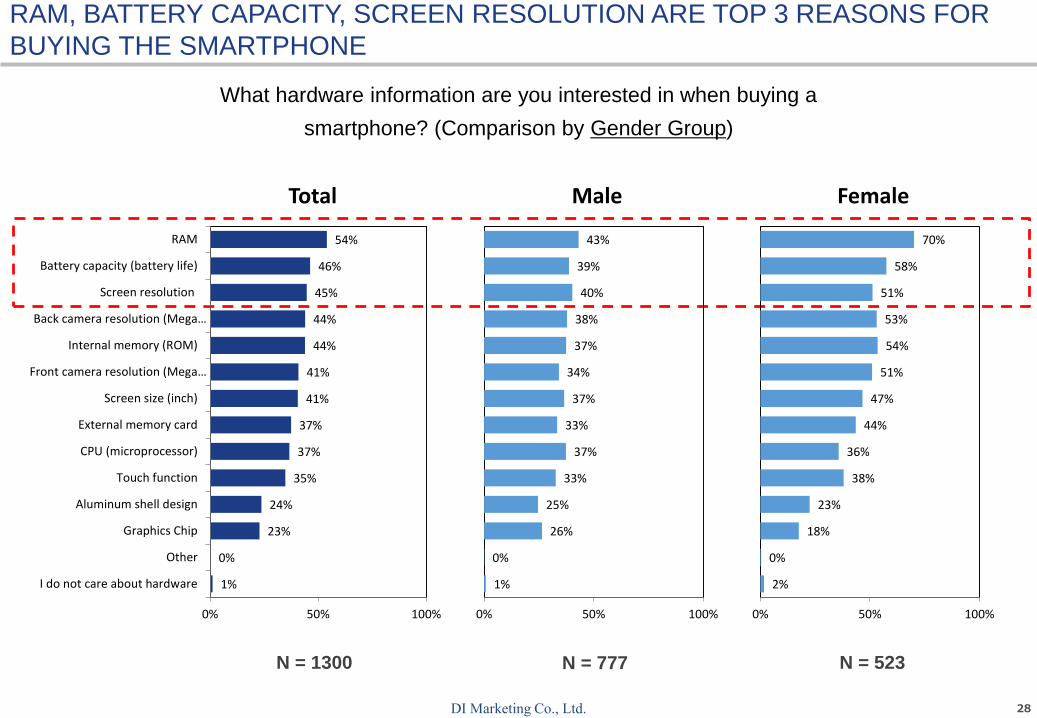
What hardware information are you interested in when buying a
smartphone? (Comparison by Age Group)
N = 1300 N = 765 N = 330 N = 205
RAM, BATTERY CAPACITY, SCREEN RESOLUTION ARE TOP 3 REASONS FOR
BUYING THE SMARTPHONE
1%
0%
23%
24%
35%
37%
37%
41%
41%
44%
44%
45%
46%
54%
0% 50% 100%
I do not care about hardware
Other
Graphics Chip
Aluminum shell design
Touch function
CPU (microprocessor)
External memory card
Screen size (inch)
Front camera resolution (Mega…
Internal memory (ROM)
Back camera resolution (Mega pixel)
Screen resolution
Battery capacity (battery life)
RAM
Total
1%
0%
21%
23%
32%
32%
33%
37%
37%
40%
40%
42%
43%
51%
0% 50% 100%
24-30
1%
1%
20%
18%
31%
36%
35%
39%
38%
40%
42%
38%
43%
49%
0% 50% 100%
31-35
3%
0%
33%
36%
51%
56%
57%
57%
59%
66%
62%
65%
63%
73%
0% 50% 100%
Over 35
28DI Marketing Co., Ltd.
What hardware information are you interested in when buying a
smartphone? (Comparison by Gender Group)
N = 1300 N = 777 N = 523
RAM, BATTERY CAPACITY, SCREEN RESOLUTION ARE TOP 3 REASONS FOR
BUYING THE SMARTPHONE
1%
0%
23%
24%
35%
37%
37%
41%
41%
44%
44%
45%
46%
54%
0% 50% 100%
I do not care about hardware
Other
Graphics Chip
Aluminum shell design
Touch function
CPU (microprocessor)
External memory card
Screen size (inch)
Front camera resolution (Mega…
Internal memory (ROM)
Back camera resolution (Mega…
Screen resolution
Battery capacity (battery life)
RAM
Total
1%
0%
26%
25%
33%
37%
33%
37%
34%
37%
38%
40%
39%
43%
0% 50% 100%
Male
2%
0%
18%
23%
38%
36%
44%
47%
51%
54%
53%
51%
58%
70%
0% 50% 100%
Female
29DI Marketing Co., Ltd.
0%
19%
27%
35%
36%
42%
43%
43%
45%
46%
51%
52%
59%
59%
0% 50% 100%
Other
Health check
Read books / Take notes / Look up dictionary
Electronic banking services
View map directions
Play games
Listen to music, watch movies
Call / Text SMS (charge fee)
Call / Text SMS (free)
Shopping online
Check the email
Take a picture
Surf the Internet
Surf the social network
Total
0%
18%
25%
32%
32%
40%
40%
39%
40%
43%
46%
48%
54%
55%
0% 50% 100%
24-30
0%
17%
23%
32%
29%
37%
43%
40%
42%
42%
48%
46%
55%
55%
0% 50% 100%
31-35
0%
30%
40%
52%
59%
55%
57%
67%
68%
63%
75%
78%
86%
84%
0% 50% 100%
Over 35
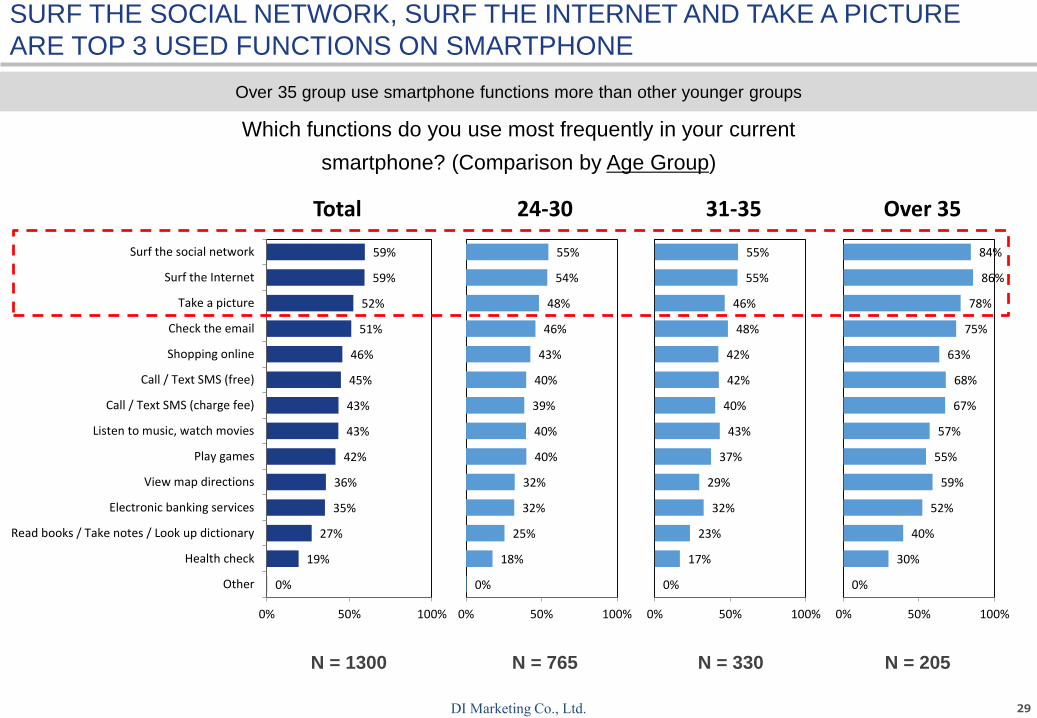
SURF THE SOCIAL NETWORK, SURF THE INTERNET AND TAKE A PICTURE
ARE TOP 3 USED FUNCTIONS ON SMARTPHONE
Which functions do you use most frequently in your current
smartphone? (Comparison by Age Group)
N = 1300 N = 765 N = 330 N = 205
Over 35 group use smartphone functions more than other younger groups
30DI Marketing Co., Ltd.
0%
19%
27%
35%
36%
42%
43%
43%
45%
46%
51%
52%
59%
59%
0% 50% 100%
Other
Health check
Read books / Take notes / Look up dictionary
Electronic banking services
View map directions
Play games
Listen to music, watch movies
Call / Text SMS (charge fee)
Call / Text SMS (free)
Shopping online
Check the email
Take a picture
Surf the Internet
Surf the social network
Total
0%
22%
26%
31%
33%
38%
36%
37%
37%
36%
43%
40%
46%
46%
0% 50% 100%
Male
0%
16%
29%
41%
40%
47%
54%
53%
56%
60%
63%
70%
78%
79%
0% 50% 100%
Female
N = 1300 N = 777 N = 523
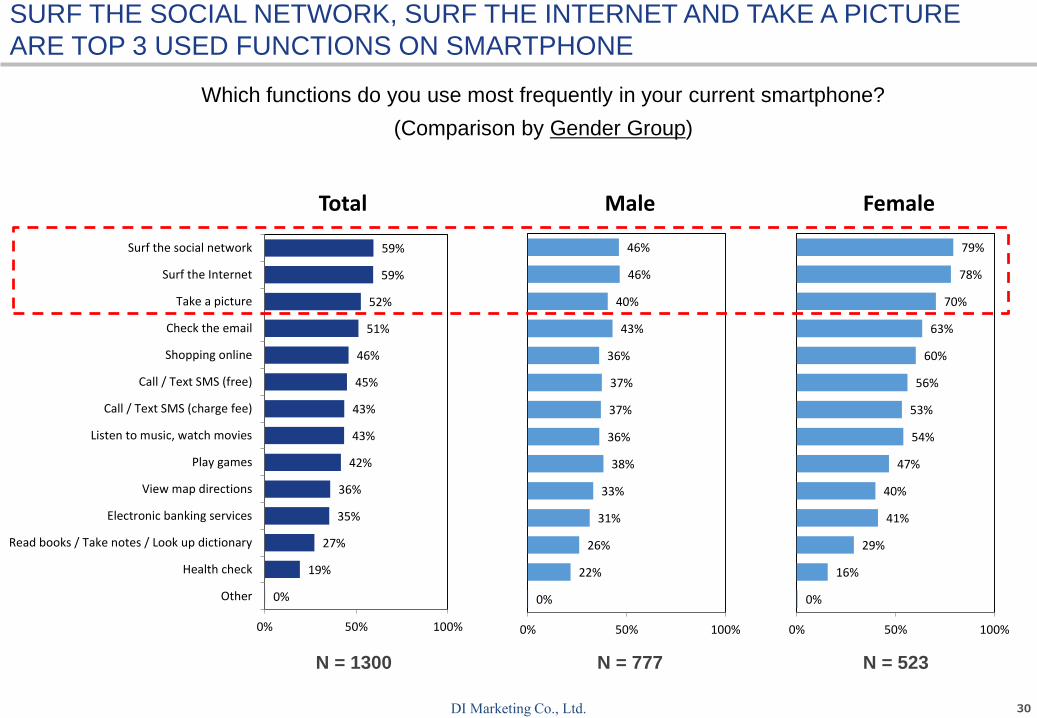
SURF THE SOCIAL NETWORK, SURF THE INTERNET AND TAKE A PICTURE
ARE TOP 3 USED FUNCTIONS ON SMARTPHONE
Which functions do you use most frequently in your current smartphone?
(Comparison by Gender Group)
31DI Marketing Co., Ltd.
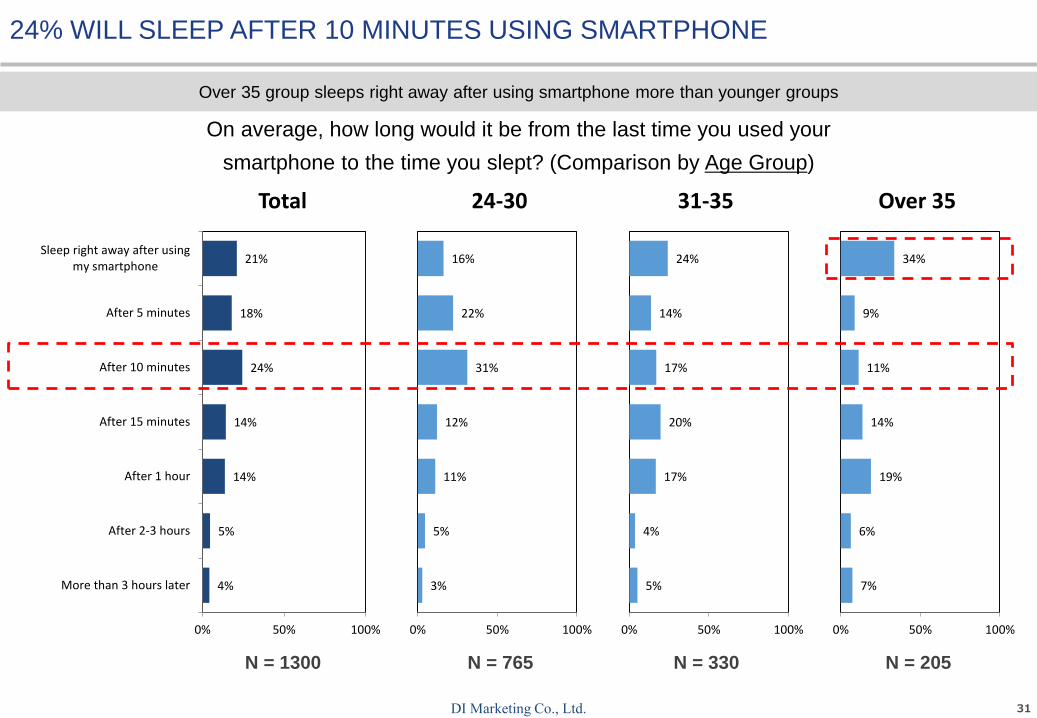
24% WILL SLEEP AFTER 10 MINUTES USING SMARTPHONE
On average, how long would it be from the last time you used your
smartphone to the time you slept? (Comparison by Age Group)
N = 1300 N = 765 N = 330 N = 205
Over 35 group sleeps right away after using smartphone more than younger groups
4%
5%
14%
14%
24%
18%
21%
0% 50% 100%
More than 3 hours later
After 2-3 hours
After 1 hour
After 15 minutes
After 10 minutes
After 5 minutes
Sleep right away after usingmy smartphone
Total
3%
5%
11%
12%
31%
22%
16%
0% 50% 100%
24-30
5%
4%
17%
20%
17%
14%
24%
0% 50% 100%
31-35
7%
6%
19%
14%
11%
9%
34%
0% 50% 100%
Over 35
32DI Marketing Co., Ltd.
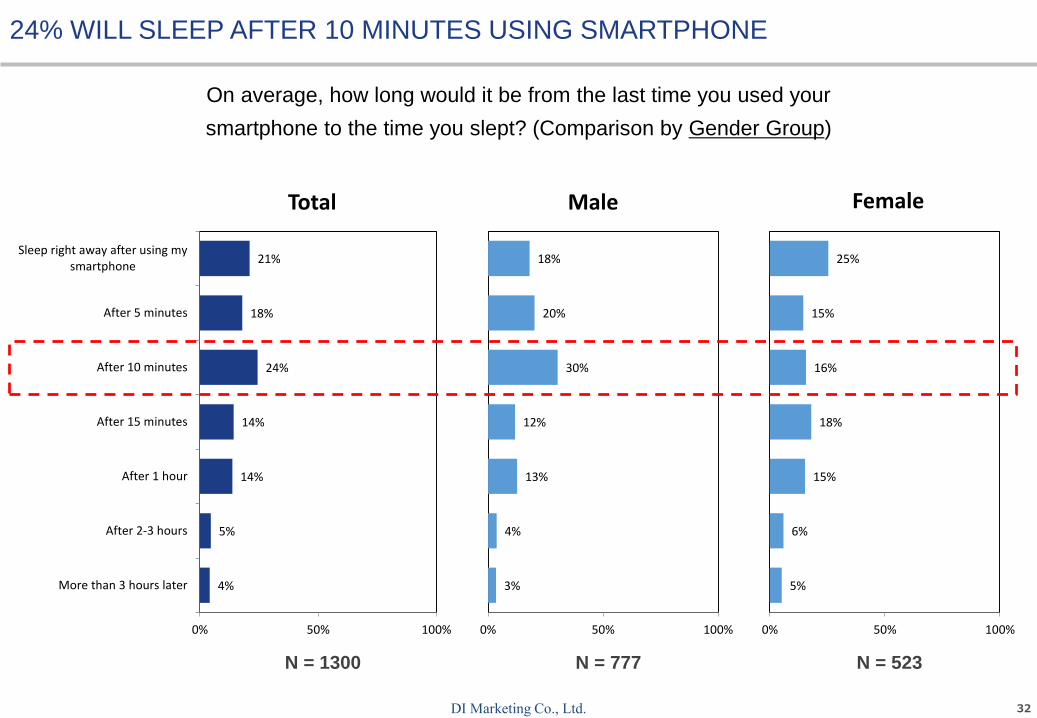
On average, how long would it be from the last time you used your
smartphone to the time you slept? (Comparison by Gender Group)
N = 1300 N = 777 N = 523
4%
5%
14%
14%
24%
18%
21%
0% 50% 100%
More than 3 hours later
After 2-3 hours
After 1 hour
After 15 minutes
After 10 minutes
After 5 minutes
Sleep right away after using mysmartphone
Total
3%
4%
13%
12%
30%
20%
18%
0% 50% 100%
Male
5%
6%
15%
18%
16%
15%
25%
0% 50% 100%
Female
24% WILL SLEEP AFTER 10 MINUTES USING SMARTPHONE
33DI Marketing Co., Ltd.
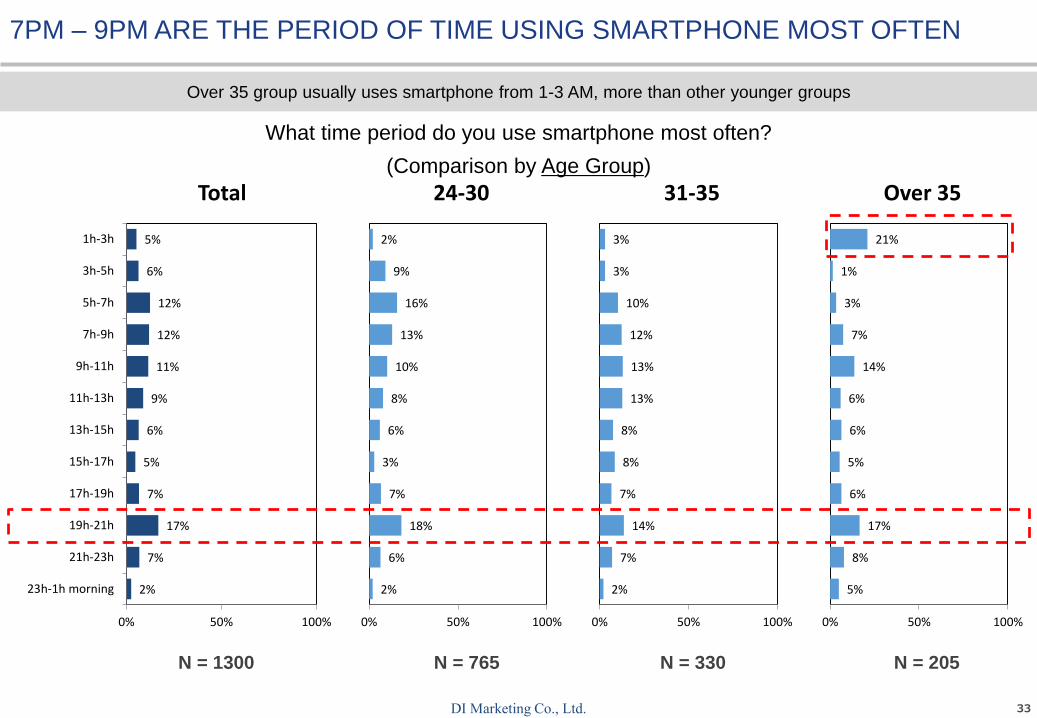
7PM – 9PM ARE THE PERIOD OF TIME USING SMARTPHONE MOST OFTEN
What time period do you use smartphone most often?
(Comparison by Age Group)
N = 1300 N = 765 N = 330 N = 205
2%
7%
17%
7%
5%
6%
9%
11%
12%
12%
6%
5%
0% 50% 100%
23h-1h morning
21h-23h
19h-21h
17h-19h
15h-17h
13h-15h
11h-13h
9h-11h
7h-9h
5h-7h
3h-5h
1h-3h
Total
2%
6%
18%
7%
3%
6%
8%
10%
13%
16%
9%
2%
0% 50% 100%
24-30
2%
7%
14%
7%
8%
8%
13%
13%
12%
10%
3%
3%
0% 50% 100%
31-35
5%
8%
17%
6%
5%
6%
6%
14%
7%
3%
1%
21%
0% 50% 100%
Over 35
Over 35 group usually uses smartphone from 1-3 AM, more than other younger groups
34DI Marketing Co., Ltd.
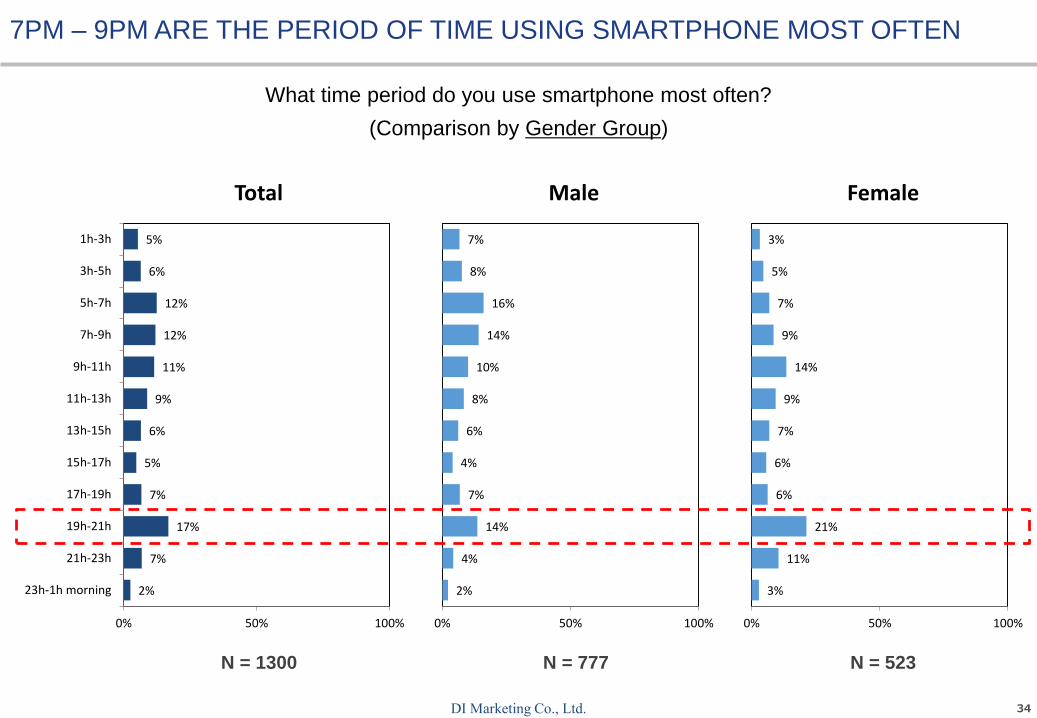
What time period do you use smartphone most often?
(Comparison by Gender Group)
7PM – 9PM ARE THE PERIOD OF TIME USING SMARTPHONE MOST OFTEN
2%
7%
17%
7%
5%
6%
9%
11%
12%
12%
6%
5%
0% 50% 100%
23h-1h morning
21h-23h
19h-21h
17h-19h
15h-17h
13h-15h
11h-13h
9h-11h
7h-9h
5h-7h
3h-5h
1h-3h
Total
2%
4%
14%
7%
4%
6%
8%
10%
14%
16%
8%
7%
0% 50% 100%
Male
3%
11%
21%
6%
6%
7%
9%
14%
9%
7%
5%
3%
0% 50% 100%
Female
N = 1300 N = 777 N = 523
35DI Marketing Co., Ltd.
5% 3%8%
5%4%
6%11%
11%
11%
23%24%
21%
33%33%
32%
20%21%
18%
4% 5% 3%
0%
10%
20%
30%
40%
50%
60%
70%
80%
90%
100%
Total Male Female
Under 1 hour
From 1 to 3 hours
Over 3 - 5 hours
Over 5 - 7 hours
Over 7 - 9 hours
Over 9 - 11 hours
Over 11 hours5% 5% 3% 6%
5% 4% 7% 4%
11% 10%
15%10%
23%21%
29%
17%
33% 36%
30%
24%
20% 23%13%
22%
4% 1% 2%
18%
0%
10%
20%
30%
40%
50%
60%
70%
80%
90%
100%
Total 24-30 31-35 Over 35
Under 1 hour
From 1 to 3 hours
Over 3 - 5 hours
Over 5 - 7 hours
Over 7 - 9 hours
Over 9 - 11 hours
Over 11 hours
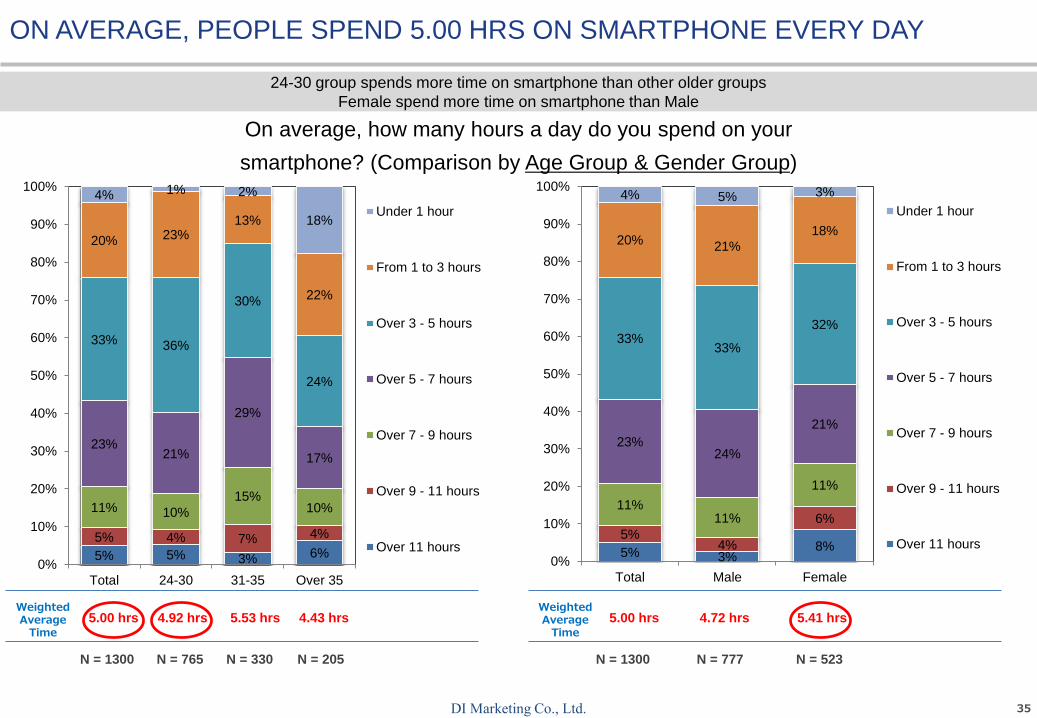
On average, how many hours a day do you spend on your
smartphone? (Comparison by Age Group & Gender Group)
24-30 group spends more time on smartphone than other older groups
Female spend more time on smartphone than Male
ON AVERAGE, PEOPLE SPEND 5.00 HRS ON SMARTPHONE EVERY DAY
WeightedAverageTime
WeightedAverageTime
5.00 hrs 4.92 hrs 5.53 hrs 4.43 hrs 5.00 hrs 4.72 hrs 5.41 hrs
N = 1300 N = 765 N = 330 N = 205 N = 1300 N = 777 N = 523
36DI Marketing Co., Ltd.
1) Awareness and Usage
2) Usage Behaviors
3) Actual Satisfaction & Future Purchase Intention
CONTENT
37DI Marketing Co., Ltd.
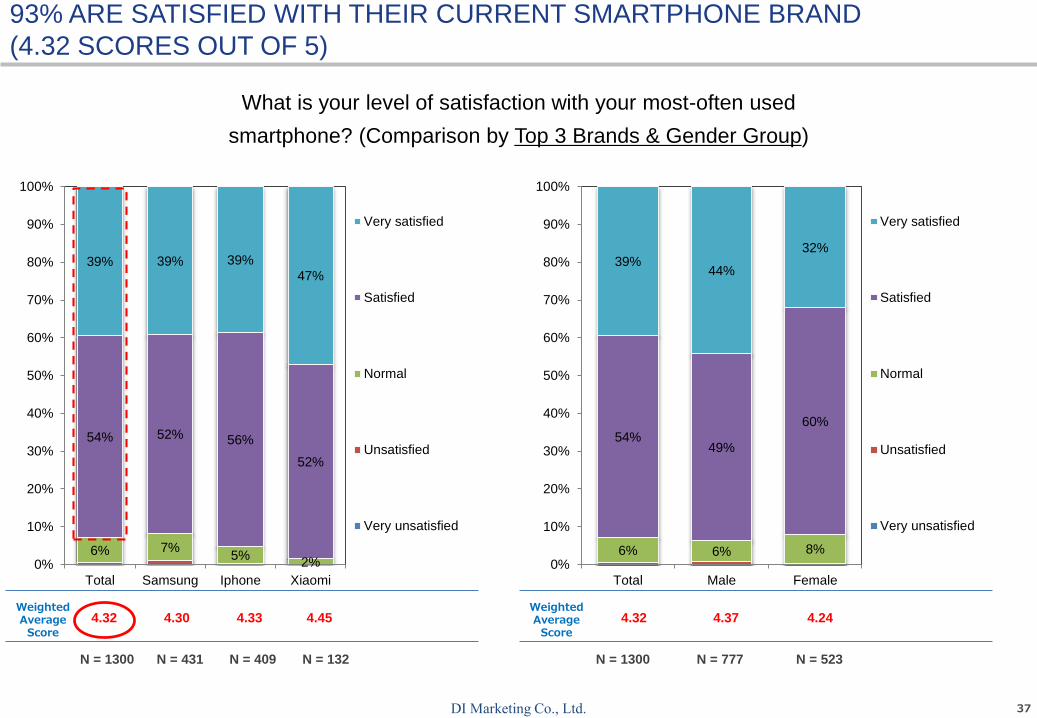
6% 7%5%
2%
54% 52% 56%
52%
39% 39% 39%
47%
0%
10%
20%
30%
40%
50%
60%
70%
80%
90%
100%
Total Samsung Iphone Xiaomi
Very satisfied
Satisfied
Normal
Unsatisfied
Very unsatisfied
6% 6% 8%
54%49%
60%
39%44%
32%
0%
10%
20%
30%
40%
50%
60%
70%
80%
90%
100%
Total Male Female
Very satisfied
Satisfied
Normal
Unsatisfied
Very unsatisfied
93% ARE SATISFIED WITH THEIR CURRENT SMARTPHONE BRAND
(4.32 SCORES OUT OF 5)
What is your level of satisfaction with your most-often used
smartphone? (Comparison by Top 3 Brands & Gender Group)
N = 1300 N = 431 N = 409 N = 132 N = 1300 N = 777 N = 523
WeightedAverageScore
WeightedAverageScore
4.32 4.30 4.33 4.45 4.32 4.37 4.24
38DI Marketing Co., Ltd.
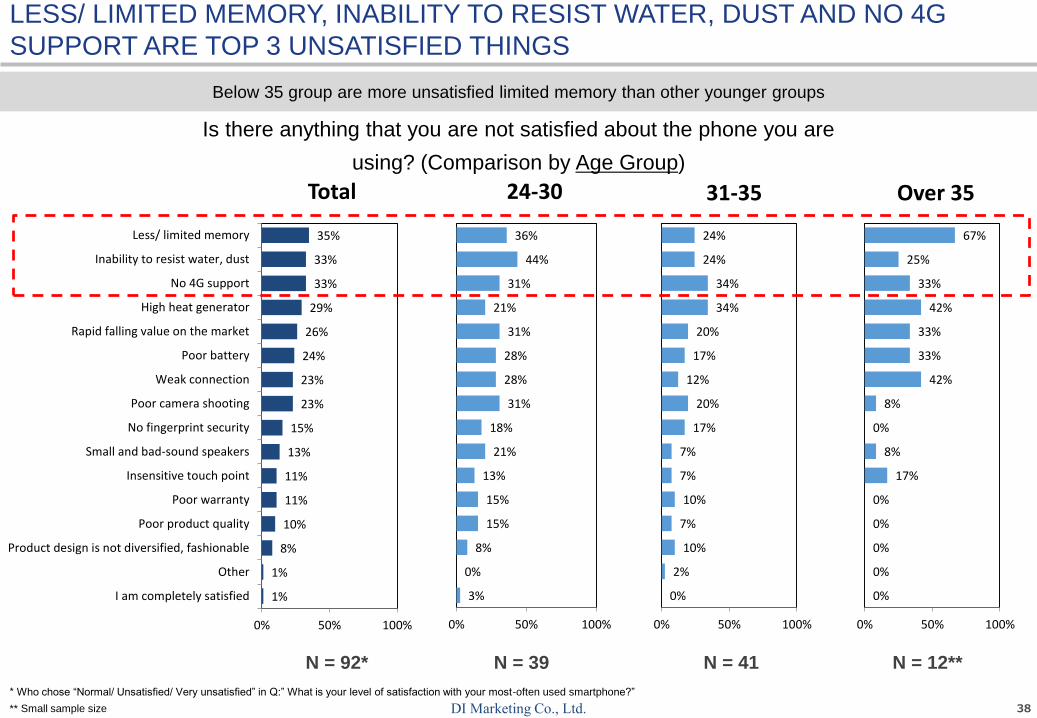
1%
1%
8%
10%
11%
11%
13%
15%
23%
23%
24%
26%
29%
33%
33%
35%
0% 50% 100%
I am completely satisfied
Other
Product design is not diversified, fashionable
Poor product quality
Poor warranty
Insensitive touch point
Small and bad-sound speakers
No fingerprint security
Poor camera shooting
Weak connection
Poor battery
Rapid falling value on the market
High heat generator
No 4G support
Inability to resist water, dust
Less/ limited memory
Total
3%
0%
8%
15%
15%
13%
21%
18%
31%
28%
28%
31%
21%
31%
44%
36%
0% 50% 100%
24-30
0%
2%
10%
7%
10%
7%
7%
17%
20%
12%
17%
20%
34%
34%
24%
24%
0% 50% 100%
31-35
0%
0%
0%
0%
0%
17%
8%
0%
8%
42%
33%
33%
42%
33%
25%
67%
0% 50% 100%
Over 35
LESS/ LIMITED MEMORY, INABILITY TO RESIST WATER, DUST AND NO 4G
SUPPORT ARE TOP 3 UNSATISFIED THINGS
Is there anything that you are not satisfied about the phone you are
using? (Comparison by Age Group)
N = 92* N = 39 N = 41 N = 12**
Below 35 group are more unsatisfied limited memory than other younger groups
* Who chose “Normal/ Unsatisfied/ Very unsatisfied” in Q:” What is your level of satisfaction with your most-often used smartphone?”
** Small sample size
39DI Marketing Co., Ltd.
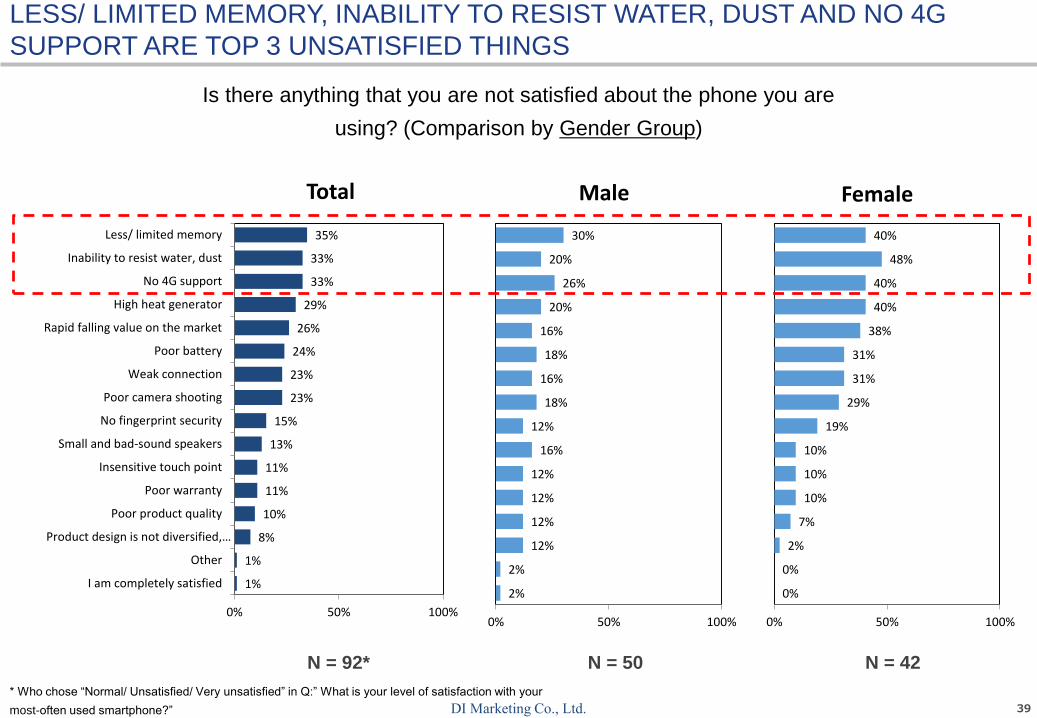
1%
1%
8%
10%
11%
11%
13%
15%
23%
23%
24%
26%
29%
33%
33%
35%
0% 50% 100%
I am completely satisfied
Other
Product design is not diversified,…
Poor product quality
Poor warranty
Insensitive touch point
Small and bad-sound speakers
No fingerprint security
Poor camera shooting
Weak connection
Poor battery
Rapid falling value on the market
High heat generator
No 4G support
Inability to resist water, dust
Less/ limited memory
Total
2%
2%
12%
12%
12%
12%
16%
12%
18%
16%
18%
16%
20%
26%
20%
30%
0% 50% 100%
Male
0%
0%
2%
7%
10%
10%
10%
19%
29%
31%
31%
38%
40%
40%
48%
40%
0% 50% 100%
Female
N = 92* N = 50 N = 42
* Who chose “Normal/ Unsatisfied/ Very unsatisfied” in Q:” What is your level of satisfaction with your
most-often used smartphone?”
LESS/ LIMITED MEMORY, INABILITY TO RESIST WATER, DUST AND NO 4G
SUPPORT ARE TOP 3 UNSATISFIED THINGS
Is there anything that you are not satisfied about the phone you are
using? (Comparison by Gender Group)

40DI Marketing Co., Ltd.
4% 2% 1%6%
27% 33%
5%
33%
39% 29%
61%
35%
30%37%
32%26%
0%
10%
20%
30%
40%
50%
60%
70%
80%
90%
100%
Total Samsung Iphone Xiaomi
I use only this brandsmartphone
I will prioritize usingthis smartphonebrand
I will use thissmartphone brand inparallel with otherbrands
I will change toanother brandsmartphone
30% ARE LOYAL TO THEIR CURRENT SMARTPHONE BRAND
What is the intention to continue using your current smartphone in
the future? (Comparison by Top 3 Brands & Gender Group)
Samsung owns the highest loyalty among top 3 brands
N = 1300 N = 395 N = 389 N = 130 N = 1300 N = 777 N = 523
4% 3% 5%
27%
17%
43%
39%
41%
35%
30%
39%
16%
0%
10%
20%
30%
40%
50%
60%
70%
80%
90%
100%
Total Male Female
I use only this brandsmartphone
I will prioritize usingthis smartphonebrand
I will use thissmartphone brand inparallel with otherbrands
I will change toanother brandsmartphone
41DI Marketing Co., Ltd.
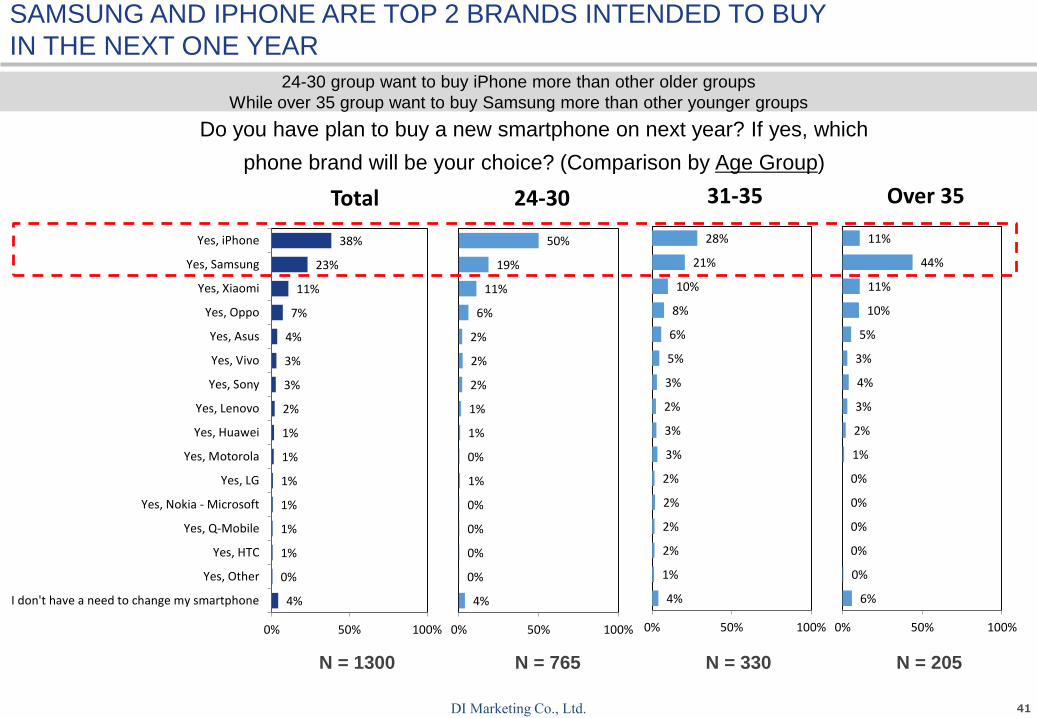
4%
0%
1%
1%
1%
1%
1%
1%
2%
3%
3%
4%
7%
11%
23%
38%
0% 50% 100%
I don't have a need to change my smartphone
Yes, Other
Yes, HTC
Yes, Q-Mobile
Yes, Nokia - Microsoft
Yes, LG
Yes, Motorola
Yes, Huawei
Yes, Lenovo
Yes, Sony
Yes, Vivo
Yes, Asus
Yes, Oppo
Yes, Xiaomi
Yes, Samsung
Yes, iPhone
Total
4%
0%
0%
0%
0%
1%
0%
1%
1%
2%
2%
2%
6%
11%
19%
50%
0% 50% 100%
24-30
4%
1%
2%
2%
2%
2%
3%
3%
2%
3%
5%
6%
8%
10%
21%
28%
0% 50% 100%
31-35
6%
0%
0%
0%
0%
0%
1%
2%
3%
4%
3%
5%
10%
11%
44%
11%
0% 50% 100%
Over 35
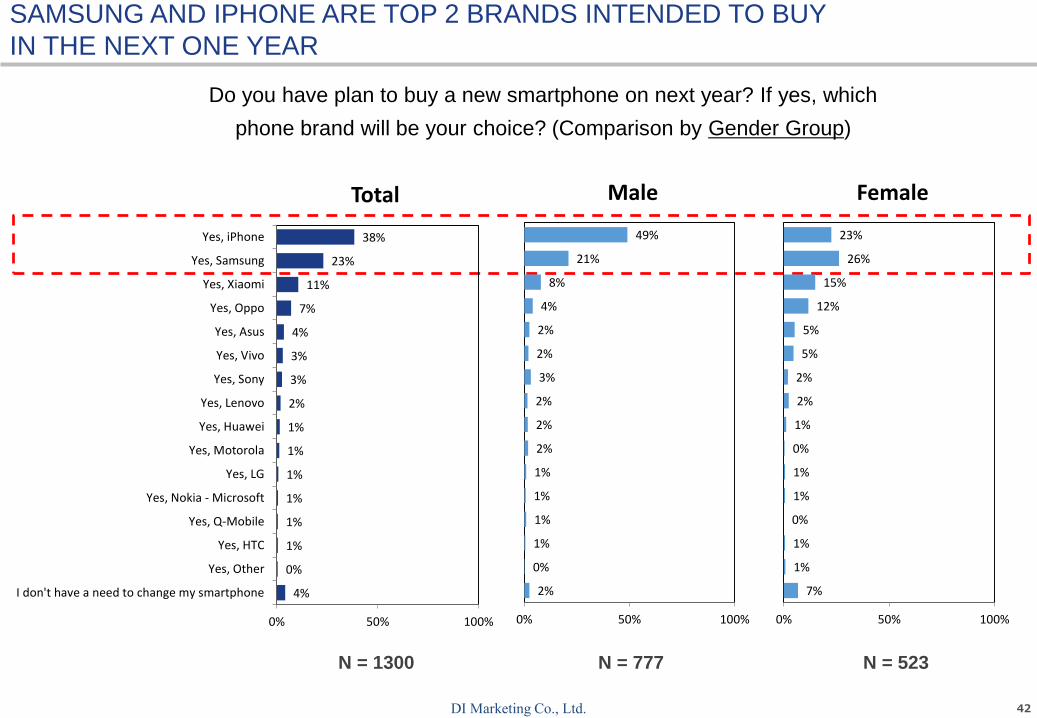
SAMSUNG AND IPHONE ARE TOP 2 BRANDS INTENDED TO BUY
IN THE NEXT ONE YEAR
Do you have plan to buy a new smartphone on next year? If yes, which
phone brand will be your choice? (Comparison by Age Group)
24-30 group want to buy iPhone more than other older groups
While over 35 group want to buy Samsung more than other younger groups
N = 1300 N = 765 N = 330 N = 205
42DI Marketing Co., Ltd.
Do you have plan to buy a new smartphone on next year? If yes, which
phone brand will be your choice? (Comparison by Gender Group)
N = 1300 N = 777 N = 523
SAMSUNG AND IPHONE ARE TOP 2 BRANDS INTENDED TO BUY
IN THE NEXT ONE YEAR
4%
0%
1%
1%
1%
1%
1%
1%
2%
3%
3%
4%
7%
11%
23%
38%
0% 50% 100%
I don't have a need to change my smartphone
Yes, Other
Yes, HTC
Yes, Q-Mobile
Yes, Nokia - Microsoft
Yes, LG
Yes, Motorola
Yes, Huawei
Yes, Lenovo
Yes, Sony
Yes, Vivo
Yes, Asus
Yes, Oppo
Yes, Xiaomi
Yes, Samsung
Yes, iPhone
Total
2%
0%
1%
1%
1%
1%
2%
2%
2%
3%
2%
2%
4%
8%
21%
49%
0% 50% 100%
Male
7%
1%
1%
0%
1%
1%
0%
1%
2%
2%
5%
5%
12%
15%
26%
23%
0% 50% 100%
Female
43DI Marketing Co., Ltd.
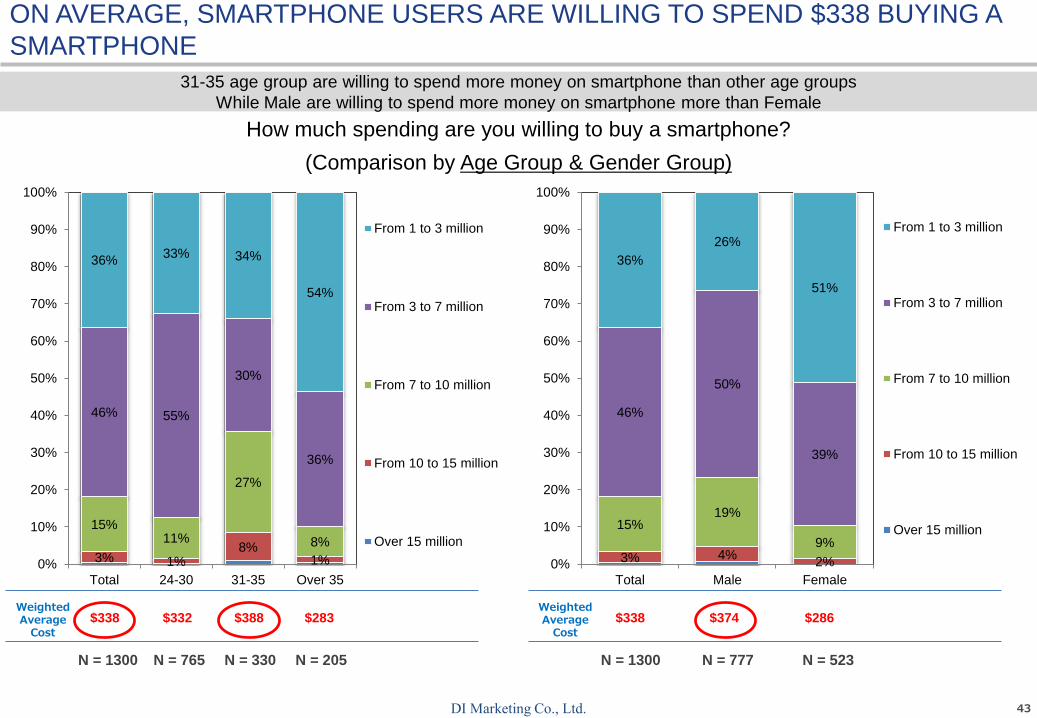
ON AVERAGE, SMARTPHONE USERS ARE WILLING TO SPEND $338 BUYING A
SMARTPHONE
How much spending are you willing to buy a smartphone?
(Comparison by Age Group & Gender Group)
N = 1300 N = 765 N = 330 N = 205
31-35 age group are willing to spend more money on smartphone than other age groups
While Male are willing to spend more money on smartphone more than Female
N = 1300 N = 777 N = 523
WeightedAverageCost
$283WeightedAverageCost
$286$338 $332 $388 $338 $374
3% 1%8%
1%
15%11%
27%
8%
46% 55%
30%
36%
36%33% 34%
54%
0%
10%
20%
30%
40%
50%
60%
70%
80%
90%
100%
Total 24-30 31-35 Over 35
From 1 to 3 million
From 3 to 7 million
From 7 to 10 million
From 10 to 15 million
Over 15 million
3% 4%2%
15%19%
9%
46%
50%
39%
36%
26%
51%
0%
10%
20%
30%
40%
50%
60%
70%
80%
90%
100%
Total Male Female
From 1 to 3 million
From 3 to 7 million
From 7 to 10 million
From 10 to 15 million
Over 15 million

44DI Marketing Co., Ltd.
5% 5% 6% 6%
14%10%
20% 20%
29%
24%
25%
53%
51%
61%
47%
21%
0%
10%
20%
30%
40%
50%
60%
70%
80%
90%
100%
Total 24-30 31-35 Over 35
Iphone 8/8 Plus(ready to launch intothe market)
Samsung Galaxy S8 /S8 Plus
Samsung GalaxyNote (ready to launchinto the market)
Sony Xperia XZPremium
HTC U11
APART FROM THE PRICE FACTOR, IPHONE 8/ 8 PLUS WILL BE THE FIRST
OPTION TO BUY
Apart from the price factor, which phone do you want to buy in the
following? (Comparison by Age Group & Gender Group)
N = 1300 N = 765 N = 330 N = 205 N = 1300 N = 777 N = 523
24-30 group want to buy iPhone 8/ 8 plus more than other older groups
While over 35 group want to buy Samsung Galaxy S8/ S8 plus more than other younger groups
5% 4%7%
14%13%
16%
29%
24%
37%
51%
59%
39%
0%
10%
20%
30%
40%
50%
60%
70%
80%
90%
100%
Total Male Female
Iphone 8/8 Plus(ready to launch intothe market)
Samsung Galaxy S8 /S8 Plus
Samsung GalaxyNote (ready to launchinto the market)
Sony Xperia XZPremium
HTC U11
45DI Marketing Co., Ltd.
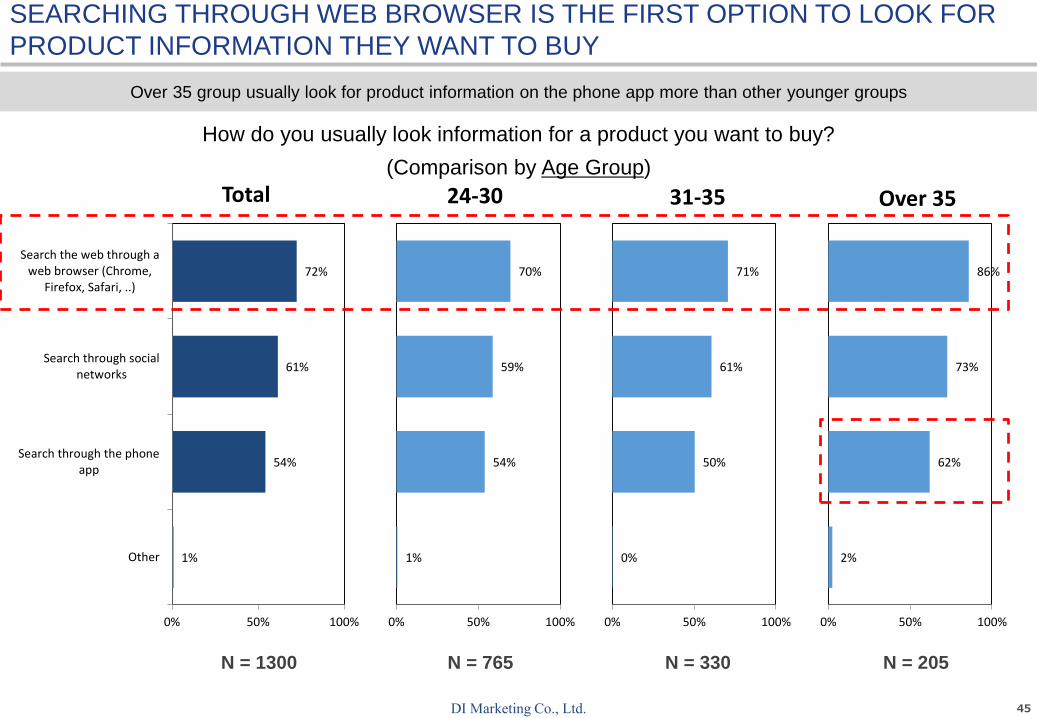
SEARCHING THROUGH WEB BROWSER IS THE FIRST OPTION TO LOOK FOR
PRODUCT INFORMATION THEY WANT TO BUY
How do you usually look information for a product you want to buy?
(Comparison by Age Group)
N = 1300 N = 765 N = 330 N = 205
1%
54%
61%
72%
0% 50% 100%
Other
Search through the phoneapp
Search through socialnetworks
Search the web through aweb browser (Chrome,
Firefox, Safari, ..)
Total
1%
54%
59%
70%
0% 50% 100%
24-30
0%
50%
61%
71%
0% 50% 100%
31-35
2%
62%
73%
86%
0% 50% 100%
Over 35
Over 35 group usually look for product information on the phone app more than other younger groups
46DI Marketing Co., Ltd.
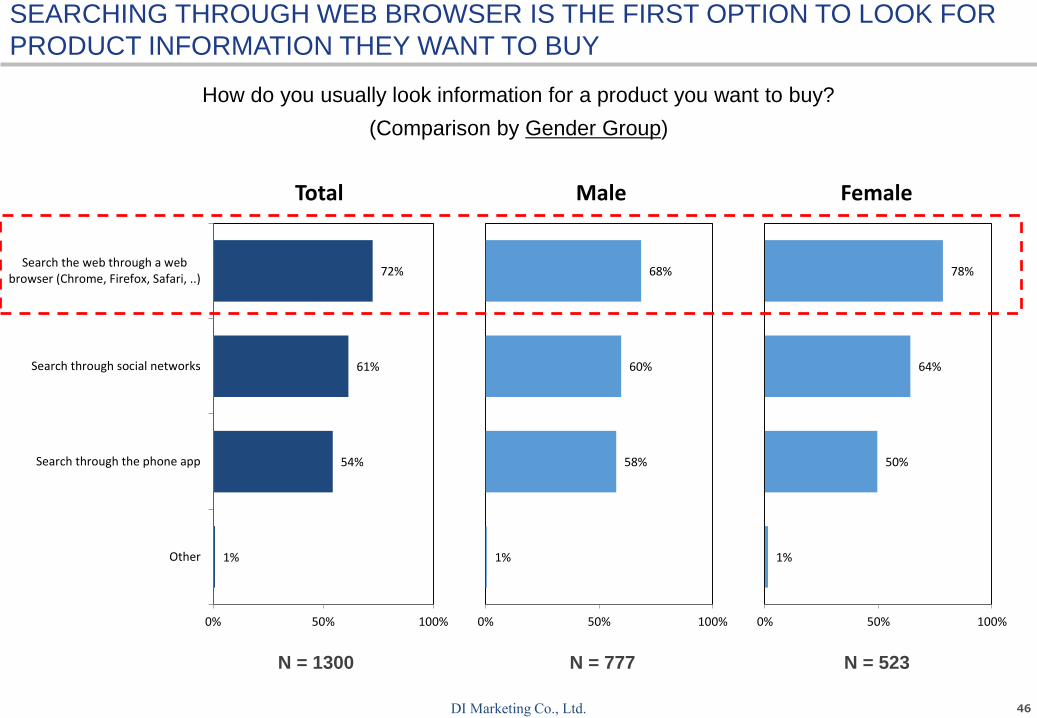
How do you usually look information for a product you want to buy?
(Comparison by Gender Group)
N = 1300 N = 777 N = 523
SEARCHING THROUGH WEB BROWSER IS THE FIRST OPTION TO LOOK FOR
PRODUCT INFORMATION THEY WANT TO BUY
1%
54%
61%
72%
0% 50% 100%
Other
Search through the phone app
Search through social networks
Search the web through a webbrowser (Chrome, Firefox, Safari, ..)
Total
1%
58%
60%
68%
0% 50% 100%
Male
1%
50%
64%
78%
0% 50% 100%
Female
47DI Marketing Co., Ltd.
FEEL FREE TO DROP US ANY QUESTION
• Japan
o Address: 3 Chome-2-6 Kasumigaseki, Chiyoda, Tokyo 100-0013, Japan
o Contact person: Mr. Hideyuki Kato (CEO)
o Email: [email protected]
o Contact number: +81 3-5532-3200
• Vietnam
o Address: 9-15, Vincom center, 45A Ly Tu Trong, Ben Nghe ward, District 1,
Ho Chi Minh City, Vietnam
o Contact person: Mr. Ho Hai Dang (Country Manager)
o Email: [email protected]
o Contact number: +84 902-73-9944
• Thailand
o Address: 246 Time Square Bld., 10th Fl., Room 10/04, Sukhumvit 12-14 Rd. Klongtoey, Bangkok
10110, Thailand
o Contact person: Ms. Sariya Achawananthakul (Marketing & Operation Manager)
o Email: [email protected]
o Contact number: +66 876 724 832
• Indonesia
o Address: Jalan Prof Dr Satrio Kav 18, 45th floor AXA Tower, Jakarta 12940, Indonesia
o Contact person: Mr. Hendry Pratama (Country Manager)
o Email: [email protected]
o Contact number: +62 21 3005 3541

48
DI Marketing Co., Ltd.