smelting and slag processing - us epa · smelting and slag processing segments of the ferroa/loy...
TRANSCRIPT

EPA
Development Document for Effluent Limitations Guidelines
and New Source Performance Standards for the
SMELTING AND SLAG PROCESSING
Segments of the
Ferroa/loy Manufacturing
Point Source Category
FEBRUARY 1974
U.S. ENVIRONMENTAL PROTECTION AGENCY
Washington, D.C. 20460

DEVELOPMENT DOCUMENT
for
EFFLUENT LIMITATIONS GUIDELINES
and
NEW SOURCE PERFORMANCE STANDARDS
FOR THE SMELTING AND SLAG PROCESSING
SEGMENTS OF THE
FERROALLOY MANUFACTURING POINT SOURCE CATEGORY
Russell Train Administrator
Allen Cywin Director, Effluent Guidelines Division
Patricia w. Diercks Project Officer
Fetruary, 1974
Effluent Guidelines Division Off ice of Air and water Programs
u.s. Environmental Protection Agency Washington, D.C. 20460
For sale by the Superintendent of Documents, U.S. Government Printing Office Washington, D.C. 20402 - Price $2.10


ABSTRACT
For the purpose of establishing effluent limitations guidelines and standards of performance for the ferroalloys industry, the industry has been categorized on the basis of the types of furnaces, air pollution control equipment installed, and water uses. The categories are as follows:
I Open Electric Furnaces with Wet Air Pollution Control Cevices
II covered Electric Furnaces and Other smelting Operations with Wet Air Pollution Control Devices
III Slag Processing
The effluent limitations to be achieved by July 1, 1977 are based upon the pollution reduction attainable using those treatment technologies as presently practiced by the average of the best plants in these categories, unless present technology is uniformly inadequate within a category. The technologies are for the most part based upon the use of 'end of pipe' treatment and once-through water usage.
The effluent limitations to be achieved by July 1, 1983 are based upon the pollution reduction attainable using those control and treatment technologies as presently practiced by the best plant in the category, or readily transferrable from one industry process to another.
The new source performance standards are based upon the best available demonstrated control technology, process, operating methods, or other alternatives which are applicable to new sources.
Costs are given for the various levels of treatment identified for each category and for the attainment of the suggested effluent guidelines and new source performance standards.
iii


section
I
II
III
IV
v
VI
VII
VIII
IX
x
XI
XII
XIII
XIV
CONTENTS
Conclusions
Recommendations
Introduction
Industry categorization
waste Characterization
Selection of Pollutant Parameters
control and Treatment Technology
Cost, Energy and Non-Water Quality Aspect
Best Practicable Control Technology Currently Available, Guidelines and Limitations
Best Availatle Technology Economically Achievable, Guidelines and Limitations
New source Performance Standards and Pretreatment standards
Acknowledgements
References
Glossary
v
1
3
7
45
51
61
67
131
143
149
155
161
163
167

FIGURES No~ Page
l Ferroalloy Production Flow Diagram 20
2 Submerged-Arc Furnace Diagram 24
3 Cross Section of Open Furnace 25
4 Flow Sheet LC Ferrochromium 32
5 Vacuum Furnace for Ferroalloy Production 35
6 Induction Furnace Diagram 36
7 Plant A water and wastewater 71
8 Plant B Water and wastewater 77
9 Plant c water and Wastewater 82
10 Steam/Hot water Scrubbing system 89
11 Plant D water and wastewater systems 90
12 Plant E water and Wastewater Systems 95
13 Plant F Water and wastewater Systems 106
14 Plant G Water and Wastewater Systems 109
15 Diagram of "Wet Baghouse" System 115
16 Plant H Water and Wastewater Systems 116
17 Diagram of Waste Water Treatment system 122
18 Cost of Treatment Vs. Effluent Reduction 136 Category I
19 cost of Treatment Vs. Effluent Reduction 137 Category II
20 cost of Treatment Vs. Effluent Reduction 138 Category III
vi

1
2
3
4
5
6
7
8
9
10
11
12
13
14
15
16
17
18
TABLES
Ferroalloy Facilities and Plant Locations
Ferroalloy Production and Shipments in 1970
No. of Plants versus values of Shipment - 1967
Water Intake, Use, and Discharge: 1968
Water Intake by Water Use Region: 1968
Water Intake, Use, and Discharge: 1968
Intake, Use, and Discharge by Water Use Region: 1968
Intake Water Treatment Prior to Use: 1968
Water Treated Prior to Discharge: 1968
Material Balance for 50% Ferrosilicon
Ferromanganese Charge Materials-Flux Method
Ferromanganese Charge Materials - Self-Fluxing Method
MC Ferromanganese Charge Materials
Silicomanganese Charge Materials
Charge Materials for HC Ferrochromium
Raw Material Components to Smelting Products for HC Fecr
Typical Furnace Fume Characteristics
Production and Emission Data for Ferroalloy Furnaces
Page
13
12
14
15
15
16
17
18
18
26
27
28
29
29
30
31
38
42
19 Types of Air Pollution Systems used on American 43 Ferroalloy Furnaces
20 Illustrative Off-Gas Volumes from Open and Closed Furnaces 41
21 Raw waste Loads-Open Chromium Alloy and Ferrosilicon Furnaces with Steam/Hot Water scrubbers
vii
54

22
23
24
25
26
27
28
29
30
31
32
33
34
35
36
37
38
39
40
41
42
43
44
Raw Waste Load - High Energy Scrubber On Open Electric Furnace
Raw Waste Loads-Open Chromium Alloy Furnaces with Electrostatic Precipitators
Raw Waste Loads for covered Furnaces with Disintegrator Scrubbers
Raw waste Loads-sealed Silicomanganese Furnace with Disintegrator Scrubber
Raw Waste Load-covered Furnaces with scrubbers
Raw waste Loads-Aluminothermic Smelting with Combination Wet scrubbers and Baghouse
Raw Waste Loads-Slag Concentration Process
Pollutant Parameters for Industry categories
Characteristics of surveyed Plants
Analytical Data -SP A- Plant A Lagoon Influent
Analytical Data -SP E- Plant A Lagoon Effluent
Analytical Data -SP c- Plant A Cooling Tower #2
Analytical Data -SP D- Plant A Cooling Tower #1
Analytical Data -SP E- Plant A Well Water
Analytical Data -SP A- Plant B Intake Water
Analytical Data -SP B- Plant B Wet Scrubbers
Analytical Data -SP c- Plant B Thickener Inlet
Analytical Data -SP D- Plant B Thickener Overflow
Analytical Data -SP E- Plant B cooling Water
Analytical Data -SP F- Plant B Sewage Plant Effluent
Analytical Data -SP G- Plant B Total Plant Discharge
Analytical Cata -SP A- Plant c Well Water
Analytical Data -SP B- Plant c Cooling Tower
viii
54
55
SG
57
57
58
59
61
G7
72
72
73
73
74
74
78
78
79
79
80
80
83
83

Blowdown
45 Analytical Data -SP c- Plant c Spray Tower sump 84
46 Analytical Data -SP D- Plant c Thickener Under- 84 flow
47 Analytical Data -SP E- Plant c Sewage Plant 85 Effluent
48 Analytical Data -SP F- Plant c Sludge Lagoon 85 Effluent
49 Analytical Data -SP G- Plant c Thickener Overflow 86
5·0 Analytical Data -SP A- Plant D Well Water 86
51 Analytical Data -SP B- Plant D Cooling Tower 91 Blowdown
52 Analytical Data -SP c- Plant D Slurry Blend Tank 91
53 Analytical Data -SP E- Plant D Continuous Blow- 92 down
54 Analytical Data -SP D- Plant D Filter supply 92 Tank
55 Analytical Data -SP F- Plant D Plant Discharge 93
56 Analytical Data -SP A- Plant E Furnace A 96 Scrubber Discharge
57 Analytical Data -SP B- Plant E Furnace B 96 Scrubber Discharge
58 Analytical Data -SP c- Plant E Metals Refining 97 Scrubber Discharge
59 Analytical Data -SP D- Plant E Slag Shotting 97 wastewater
60 Analytical Data -SP E- Plant E Furnace c 98 Scrubber Discharge
61 Analytical Data -SP F- Plant E Furnace D 98 scrubber discharge
62 Analytical Data -SP G- Plant E Furnace E 99 Scrubber Discharge
63 Analytical Data -SP H- Plant E Furnace E 99 Scrubber Settling Basin Discharge
ix

64
65
66
67
68
69
70
71
72
73
74
75
76
77
78
79
80
81
82
83
Analytical Data -SP I- Plant E Slag Concentrator wastewater
Analytical Data -SP J- Plant E Slag Tailings Pond Discharge
Analytical Data -SP K- Plant E Lagoon #3 Influent
Analytical Data -SP L- Plant E Lagoon #3 Effluent
Analytical Data -SP M- Plant E Intake River Water
Analytical Data -SP N- Plant E cooling Water Discharge
Analytical Data -SP o- Plant E Combined Slag Shotting & Cooling Water Discharge
Analytical Data -SP P- Plant E Fly Ash Influent to Lagoon
Analytical Data -SP Q- Plant E Fly Ash Influent to Lagoon
Analytical Data ~sp A- Plant F Intake Water
Analytical Data -SP B- Plant F Cooling Tower Blowdown
Analytical Data -SP c- Plant F Plant Discharge
Analytical Data -SP A- Plant G Intake City Water
Analytical Data -SP B- Plant G Cooling Tower Blowdown
Analytical Data -SP c- Plant G Spray Tower Discharge
Analytical Data -SP D- Plant G Settling Basin Effluent
Analytical Data -SP E- Plant G Plant Discharge
Analytical Data -SP F- Plant G Slag Processing Discharge
Analytical Data -SP A- Plant H Intake City Water
Analytical Data -SP B- Plant H Baghouse
x
100
100
101
101
102
102
103
103
104
104
107
107
110
110
111
111
112
112
117
117

84
85
86
87
88
89
Wastewater Discharge
Analytical Data -SP c- Plant H Treated Baghouse Wastewater
Analytical Data -SP D- Plant H Settling Lagoon Discharges
Analytical Data -SP E- Plant H Polishing Lagoon Discharge
Analytical Cata -SP F- Plant H Plant Discharge
Analytical Data -SP G- Plant H Plant Well Water
Analytical Data -SP H- Plant H Cooling Water
90 Control and Treatment Technologies by Category
91 Industry category I, Open Electric Furnace with Wet Air Pollution Control Devices
118
118
119
119
120
120
124
128
92 Industry category II, covered Electric Furnace and Other 129 Smelting Operations with Wet Air Pollution Control Devices
93 Industry Category III, Slag Processing
94 Treatment Level Costs on Unit of Production Basis
95 Treatment Level costs on Wastewater Flow Basis
96 BPCTCA Effluent Guidelines Treatment Basis
97 Best Practicable Control Technology currently Available Guidelines and Limitations
98 BATEA Effluent Guidelines Treatment Basis
99 Best Available Technology Economically Achievable Guidelines and Limitations
100 New source Performance Standards Basis
101 New source Performance Standards
xi
130
134
135
144
147
150
153
156
159


SECTION I
CONCLUSIONS
For the purpose of establishing effluent limitations guidelines and standards of perf onnance for the ferroalloys industry, the industry has been categorized on the basis of the types of furnaces, air pollution control equipment installed, and water uses. 'Ihe categories are as follcws:
I Open Electric Furnaces with Wet Air Pollution control Devices
II covered Electric Furnaces and Other smelting Operations with Wet Air Pollution Control Devices
III Slag Processing
other factors, such as age, size of plant, geographic location, product, and waste control technologies do not justify segmentation of the industry into any further subcategories for the purpose of establishing effluent limitations and standards of performance. Similarities in waste loads and available treatment and control technologies within the categories further substantiate this. The guidelines for application of the effluent limitations and standards of performance to specific plants take into account the mix of furnace types and water uses possible in a single plant which directly influence the quantitative pollutional load.
1
• •

•

SECTION II
RECOMMENDATIONS
It is recommended that the effluent limitations guidelines and new source performance standards be adopted as suggested herein for the ferroalloy industry. These suggested guidelines and performance standards have been developed on the basis of an intensive study of the industry, including plant surveys, and are believed to be reasonable and attainable from the standpoints of both engineering and economic feasibility.
The application of these guidelines and performance standards to specific plants is intended to be on the basis of a "building block" approach to define the effluent limits from the plant as a whole. Consider, for example, a large ferroalloy plant having one or more of the processes and/or water uses in each category. The total effluent limitation for the plant would be based upon the total of the allowable loads for each category, determined by multiplying the allowable unit load by the total production rate in that category. It is recommended that this method of application of the guidelines and performance standards be used.
It is recommended that the industry be encouraged to develop or adopt such pollution reduction methods as the recovery and reuse of collected airborne particulates for recycle to smelting operations or use in electrolytic processes, and the use or sale of by-products. The development or adoption of better wastewater treatment controls and operating methods should also be encouraged.
The best practicable control technology currently available for existing point sources is as follows, by category:
I Physical/chemical treatment to remove or destroy suspended solids and potentially harmful or toxic pollutants, with recirculation of water at the scrubber.
II Physical/chemical treatment to remove or destroy suspended solids and potentially harmful or toxic pollutants.
III Physical/chemical treatment to remove suspended solids and potentially harmful pollutants.
The effluent limitations are based on achieving by July 1, 1977 at least the pollution reduction attainable using these treatment technologies as presently practiced by the average of the best plants in these categories. The above technologies are generally based upon the use of •end of pipe' treatment and once-through water usage.
3

The 30 day average practicable control category:
effluent limitations corresponding to the best technology currently available are as follows, by
Category category category I II III
kg/ lb/ kg/ lb/ kg/ lb/ mwhr mwhr mwhr mwhr kkg pr. ton pr •
suspended Solids.160 .352 .209 • 461 1.330 2.659 Total Chromium .0032 .007 .004 .009 .026 • 053 Hex. Chromium .0003 .0007 .0004 .0009 Cyanide .002 .005 Manganese .032 .070 .042 .092 .266 .532 Phenol .004 .009 pH 6 - 9 6 - 9 6 - 9
The best available technology economically achievable for existing point source is as follows, by category:
I Partial recycle of water, with blowdown treated for removal of suspended solids and potentially harmful or toxic pollutants by physical/chemical treatment.
II Partial recycle of water, with blowdown treated for removal of suspended solids and potentially harmful or toxic pollutants by physical/chemical treatment.
III Partial recycle of water, with blowdown treated for removal of suspended solids and potentially harmful or toxic pollutants by physical/chemical treatment.
The effluent limitations are based on achieving least the pollution reduction using these technologies as presently practiced by the best and using transfer of technology where the best felt to be insufficient.
by July 1, 1983, at control and treatment
plant in each category, plant in the category is
The 30 day average effluent limitations corresponding available technology economically achievable for categories III are as follows:
to the best I, II and
4

Category I Category II Category III kg/mwhr lb/mwhr kg/mwhr lb/mwhr kg/kkg pr. lb/ton
SUSFended Solids .012 .026 .016 .035 .136 • 271 Total Chromium • 0004 .0009 .0005 .0012 .0027 .0054 Hex. Chromium .00004 .0001 .00005 .0001 Total cyanide .0003 .0006 Manganese .0039 .0086 .005 .012 • 027 .054 Phenol .0002 • 0005 pH 6 - 9 6 - 9 6 - 9
The new source performance standards are based upon the best available demonstrated control technclogy, process, operating methods, or other alternatives which are applicable to new sources. The best available demonstrated control technology for new sources is the same as the best available technology economically achievable, which will be utilized to meet the 1983 limitations.
The 30 day average standard of performance for new sources, which corresponds to the application of best available demonstrated control technology, process, operating methods or other alternatives for Categories I, II and III are as follows:
Category I category II Category III
pr.
kg/mwhr lb/mwhr kg/mwhr lb/mwhr kg/kkg pr. lb/ton pr •
Suspended Solids .012 .026 .016 .035 .136 • 271 Total Chromium .0004 .0009 .0005 .0012 .0027 .0054 Hex. Chromium .00004 .0001 .00005 • 0001 Total Cyanide .0003 .0006 Manganese .0039 .0086 .005 .012 • 027 .054 Phenol .0002 • 0005 pH 6 - 9 6 - 9 6 ~ 9
5


SECTION III
INTRODUCTION
The Federal Water Pollution Control Act Amendments of 1972 (the "Act") requires the United States Environmental Protection Agency to establish effluent limitations which must be achieved by point sources of discharge into the navigable waters of the United States. Section 301 of the Act requires the achievement by July 1, 1977, of effluent limitations which require the application of the 11best practicable control technology currently available," and the achievement by July 1, 1983, of effluent limitations which require the application of the "best available technology economically achievable."
Within one year of enactment, the Administrator is required by Section 30U(b) to promulgate regulations providing guidelines for the effluent limitations required to be achieved under Section 301 of the Act. These regulations are to identify in terms of amounts of constituents and chemical, physical, and biological characteristics of pollutants, the degree of effluent reduction attainable through the application of the best practicable control technology currently available and best available technology economically achievable. The regulations must also specify factors to be taken into account in identifying the two statutory technology levels and in determining the control measures and practices which are to be applicable to point sources within given industrial categories or classes to which the effluent limitations apply.
In addition to his responsibilities under sections 301 and 304 of the Act, the Administrator is required by sectjon 306 to promulgate standards of performance for new sources. These standards are to reflect the greatest degree of effluent reduction which the Administrator determines to be achievable through the application of the "best available demonstrated control technology, processes, operating methods, or other alternatives, including, where practicable, a standard permitting no discharge of pollutants."
The Off ice of Air and water Programs of the Environmental Protection Agency has been given the responsibility by the Administrator for the development of effluent limitation guidelines and new source standards as required by the Act. The Act requires the guidelines and standards to be developed within very strict deadlines and for a broad range of industries. Effluent limitations guidelines under Section 301 and 304 of the Act and standards of performance for new sources under section 306 of the Act will be developed for 21 industrial categories. Moreover, each of these industrial categories probably will require further subcategorization in order to provide standards that are meaningful.
7

In order to promulgate the required guidelines and standards, it is first necessary to (a) categorize each industry; (b) characterize the waste resulting from discharges within industrial categories and sutcategories; and (c) identify the range of central and treatment technology within each industrial category and subcategory. Such technology will then be evaluated in order to determine what constitutes the "best practicable control technology currently available," what is the 11best availal::le technology econcmically achievable" and, for new sources, what is the "best available demonstrated control technology."
In identifying the technologies to l::e applied under Section 301, Section JQq(b) of the Act requires that the cost of application of such technologies be considered, as well as the non-water quality environmental impact (including energy requirements) resulting from the application of such technologies. It is imperative that the eff lu~nt limitations and standards to be promulgated by the Administrator be supported by adequate, verifiable data and that there be a sound rationale for the judgments made. such data must be readily identifiable and available and such rationale must be clearly set forth in the documentation supporting the regulations.
FERROALLOY MANUFACTURE
Ferroalloys are used for deoxidation, alloying,and graphitization of steel and cast iron. In the nonferrous metal industry, silicon is used primarily as an alloying agent for copper, aluminum, magnesium, and nickel. seventy five percent ferrcsilicon is used as a reducing agent in the production of magnesium by the Pidgeon process. Manganese is the most widely used element in ferroalloys, followed by silicon and chromium. Others include molytdenum, tungsten, titanium, zirconium, vanadium, boron, and columbium.
There are four major methods used to produce ferroalloy and high purity metallic additives for steelmaking. These are (l) blast furnace, (2) electric smelting furnace, (3) alumina- or silicothermic process and (4) electrolytic deposition. 'I'he choice of process is dependent upon the alloy produced and the availability of furnaces. Ferromanganese is the principal metallurgical form of manganese. This product contains 75% or more of manganese, the balance being mainly iron. It is produced in the blast furnace or electric-arc furnace and is available in several grades. A few steel companies produce ferromanganese for their own use since they have their own ore sources and suitable blast furnaces available. The ~reduction of ferromanganese in blast furnaces is a part of s.r.c. 3312 and such production is not considered herein, but will be covered under the guidelines for the iron and carbon steel industry. Electric smelting furnaces produce most of the f erroalloy tonnage.
The majority of electric ferroalloy furnaces are termed submerged arc, although the mode of energy release in many cases is resistive heating. Raw ore, coke, and limestone or dolomite mixed in proper proportions
8

constitute the charge for the electric-arc furnace process. A large supply of electric power is necessary for economical operation. Important operating considerations include power and electrode requirements, size and type of furnace, amount and size of coke, and slag losses. The major ferroalloys thus produced are:
1. Silicon Alloys - Ferrosilicon (50-98% Si) and Calcium Silicide
2. Chromium Alloys - High carbon Ferrochromium in various grades and Ferrochrornesilicon.
3. Manganese Alloys - standard Ferromanganese and Silicomanganese
There are a smaller number of furnaces which do not operate with deep submergence of the electrodes and produce a batch melt which is usually removed by tilting the furnace. Mix additions and power input would usually be cyclic. Examples of products produced in this type of furnace are:
1. Manganese Ore-Lime melt for subsequent ladle reactions with silicomanganese to produce medium carbon and low carbon f erromanganese.
2. Chrome Ore-Lime melt for subsequent ladle reaction with ferrochromesilicon to produce low carbon ferrochromium.
3. Special Alloys, such as Aluminum - Vanadium, Ferrocolumbium, Ferroboron, Ferrovanadium and Ferromolybdenum.
The largest source of waterborne pollutants other than thermal in the industry is the use of wet methods for air pollution control: consideration of air pollution sources is thus of importance here. The production of ferroalloys has many dust or fume producing steps. Particulates are emitted from raw materials handling, mix delivery, crushing, grinding, and sizing, and furnace operations. Emissions from furnaces vary widely in type and quality, depending upon the particular ferroalloy being produced and the type of furnace used.
The conventional submerged-arc furnace utilizes carbon reduction of metallic oxides and continuously produces large quantities of carbon monoxide. Other sources of gas are moisture in the charge materials, reducing agent volatile matter, thermal decomposition products of the raw ore, and intermediate products of reaction. The carbon monoxide content of the furnace off-gas varies from 50-90% by volume, depending upon the alloy being produced and the amount of furnace feed pretreatment. The gases rising out the top of the furnace carry fume or fume precursors and also entrain the finer size constituents of the mix or charge. Submerged-arc furnaces operate in steady-state and gas
9

generation is continuous. In an open furnace, all the co burns with induced air at the top of the charge, resulting in a large volume of gas. In a covered or closed furnace most or all of the CO is withdrawn from the furnace without combustion with air. The controls used are thus affected by the type of furnace, the gas volume and emitted particle size and particle characteristics.
Fume emission also occurs at furnace tap holes. Because most furnaces are tapped intermittently, tap hole fumes occur only about 10 to 203 of the furnace operating time. Melting operations may be conducted in an open arc furnace (as opposed to a submerged arc furnace) in some plants. While no major quantities of gas are generated in this operation, thermally induced air flow may result in fume emission.
WATER POLLUTION SOURCES
Air pollution control devices include baghouses, wet scrubbers, and electrostatic precipitators. Wet scrubbers, of course, produce slurries containing most of the particulates in the off-gases. Spray towers used to cool and condition the gases before precipitators produce slurries containing some percentage of the particulates in the gases. Baghouses generally produce no wastewater effluents. In one plant, however, the gases from excthermic processes are cooled by water sprays, scrubbed in wet dynamic scrubbers, and finally cleaned in a baghouse in which the bags are periodically washed with water.
The only currently feasible type of wet collector for cleaning the large gas volume from open furnaces is the venturi type scrubber. With required pressure drops on the order of 152.4 cm (60 in.) W.G., the power consumption approaches 10% of the furnace rating. Most venturi designs allow recirculation of scrubbing liquor so that water consumption is reduced to that evaporated into the gas plus that exiting with the concentrated solids stream. The venturi has the advantage of being able to absorb gas temperature peaks by evaporating more water. For a ferrosilicon or ferrochromesilicon operation substantially all of the sulfur in the reducing agent appears in the gas phase, and a corrosion problem occurs in any liquid recycle system unless neutralizing agents or special materials of construction are used.
Electrostatic precipitators have been installed on open furnaces producing ferrosilicon, ferrochromesilicon, high-carbon f errochromium, and silicomanganese, beth in this country and abroad. Most ferroalloy fumes at temperatures below 259.?oc (5000F) have too high an electrical resistivity, i.e., greater than 1 X io10 ohm-cm for the use of electrostatic precipitators. The resistivity is in an accepted range only if the gas temperature is maintained above 259.7-315.2°c (500-600•F). Water conditioning would lower the resistivity, but a large spray tower is required for proper humidification. Stainless steel construction would be a necessity for ferrosilicon or ferrochromesilicon
10

operations. The alternate use of steam is feasible if low-cost steam is available.
The resistivity Froblem could be overcome by using a wet precipitator. but water usage appears to be greater than that for a wet scrubber without recycle. Wet electrostatic precipitators have been used at one installaticn in Europe. However, all parts of the precipitator exposed to the dirty water and to the wet gas were constructed of stainless steel. Electrostatic precipitators have found limited usage in American ferroalloy plants, although commcnly used in Japan.
Submerged arc furnaces may be characterized as open, semi-closed, and sealed. The latter two types may also be termed covered furnaces. The open furnace has no cover and air is freely available to burn the co coming off from the charge. The semi-closed furnace has a cover through which the electrodes extend down into the charge; the space around the electrodes is kept filled with the charge materials to form a quasi-seal which reduces the emissions from these locations but does not completely prevent the escape of the gases generated. The sealed furnace has a similar cover but with mechanical seals around both the electrodes, which do prevent the escape of gases.
The sealed furnace has thus far been applied only to calcium carbide, pig ircn, standard ferromanganese and silicomanganese. In Japan, it has also been used tc Frcduce ferrochromium, ferrochromesilicon, and 50% and 75% ferrosilicon. Sealed covers are difficult to adapt to an existing furnace because of the extensive revisions that are usually required.
The disintegrator types of scrubber was formerly often employed for the cleaning of gases from covered furnaces. Although it can do a good cleaning jcb when properly maintained on furnaces producing calcium carbide, venturi scrubbers do a better job of dust removal for other products. The disintegrator type of scrubber has the advantage of producing a slight pressure head (about 5 cm (2 in.) W.G.), but the capacity limitations and high water and power consumption make it uneconomical for most new furnace installations. Additionally, the need for greater dust removal from furnace gases have caused disintegrator scrubbers to be eclipsed by venturi scrubbers.
The venturi type scrubber has been installed for cleaning CO gas from covered furnaces, but the required pressure drops are high (about 152 cm (60 in.)W.G.). The electrostatic precipitator is a po~sible co gas cleaning device, but has found no such applications in the United states, although it is commonly used in Japan. It is possible to use a £ag collector to clean co gas, but only one such installation is known in the world, and none in this country. A "candle filter" system for cleaning co gases in ceramic filters, is another (albeit rare) type of dry dust collectors.
11

Other sources of wastewater in the industry are from cooling uses, boiler feed, air conditioning, and sanitary uses. Wastew~ters also result frcm slag processing operations in which slag is crushed and sized for recovery of metal values, or from slag shotting operations in which the slag is granulated for further use.
PLANT LOCATIONS AND INDUSTRY STATIS~ICS
There are some 40 plants in the United States which produce f erroalloys, chromium, manganese, and other additive metals as tabulated in Table 1.
The 1S67 ~~§ of ~ufacture§ reports 34 establishments in S.I.C. 3313, i.e., primarily engaged in the ~roduction of electrometallurgical products. Of these establishments, only 20 were included in the 1968 !@~r Use in Manufacturing data as having used 75.7 million liters (20 million gals.) or more of water annually. The total value of shipments in s.r.c. 3313 (34 plants) in 1967 was $467.9 million. The value of shipments from the 20 large ~ater-using plants was $411.4 million.
Although according to the Mi~ls X~arbook, lilQ, shipments rather than production are the measure of activity in the industry, as production in the high-volume ferroalloys may be irregular and intermittent, for air and water pollution regulatory purposes production is a better indicator of industry activity than is shipments. Production and shipments in 1970 were as shown in Table 2.
Table 2. FERROALLOY PRODUCTION AND SHIPMENTS IN 1970
-------------------- --- -Production Shi12.ment2-Value
PrQg~.:£ kkg !Q!!§ kkq !2!12 1!1000l
Ferrcmanganese 757,920 835,463 732, 2 83 807,368 134,456 Silicomanganese 175,285 193,219 156,900 172,988 32,024 Ferrosilicon 643,455 709,287 597,909 659,216 136,238 Sil very Iron 178,143 196,369 188,351 207,664 16, 853 Chromium Alloys:
Ferrochromium 280,876 309,613 262,481 289,395 100,667 Other 87,238 96,163 73,968 81,552 25,606
Ferrctitanium 3,048 3,360 2,985 3,291 3,503 Ferrocolumbium 1,143 1. 260 - 1,28,2 1,421 __ 9,385_ --Total 2,127,108 2,344,734 2,016,166 2,222,895 458,732
12

Table 1. TYPES, SIZES, l\ND IJXATIONS OF FERro/\LI.OY PRODOCING PLANTS IN THI:: UNITED STATES
Pldllt No. Prcxlucers Siz~ locations Products ~ of furnace Furn"-lceS
l Air Reduction Co. , Inc. L Calvert City, Ky. Ft:'Cr, FeMn, FeSi, FeCrSi Electric 11 2 Airco Alloys Div. M Charleston, S.C. Electric 2 3 M Niagara Falls, N.Y. Electric 1 4 s Theodore, Ala. Electric 1 5 American Potash Co. s Aberdeen, Miss. Mn Electrolytic 6 Chranium Mi.r.ing & S:nelting M W:x:x:lstock , Tenn Fd-ln,SiMn,FeSi,FeCr, Electric 5
Co. FeCrSi 7 Climax MJlybdenum Co. s Langeloth, Pa. Fd1o Aluminothermic 8 Foote Mineral Co. s Carrbridge, Ohio FeB,FeCb,FeTi,FeV,other Electric 2 9 L ·Graham, w. Va. FeCr,FeCrSi,FeSi,othe~ Electric 9
10 M Keokuk, Iowa FeSi, Silvery Iron Electric 5 11 s New Johnsonville,'IN Mn Electrolytic 12 M Steubenville, Ohio FeCr, FeCrSi Electric 6 13 M Wenatchee, wash. Fe>.Si, Si Electric 4 14 Hanna Nickel S:nelting Co. s Riddle, Oreg. FeSi Electric 4 15 Interlake, Inc. L Beverly, Ohio FeCr, FeSi, SiMn Electric 7 16 Kawecki Berylco Industries s Springfield, Oreg. Si Electric 2 17 Kuwecki Chemical Co. s Easton, Pa. FeCb Aluminothermic 18 Luckenby s Selma, Ala. FeSi Electric 1 19 Manganese Chemicals Co., s Kingwood, w. Va. FeMn Fused Salt Electro-
Diairorrl Shamrock lytic 20 MJlybdenum Corp. of llrnerica s Washington, Pa. Fe!-b Electric & Alumino-
thennic 21 National Lead Co. s Niagara Falls,N.Y. FeCl:fl'i,FeTi,other Electric 3 22 New Jersey Zinc Co. s Palmerton , Pa. Spiegeleisen Electric 1 23 Ohio Ferro Alloy Corp. M Brilliant, c»-iio FeCr,FeSi,Si,FeCrSi Electric 4 24 L Philo, Ohio FeB,FeMn,FeSi,SiMn,Si Electric 10 25 M Pa..hatan, Ohio FeSi, Si Electric 4 26 s Taccrna, Wash. FeCr, FeSi Electric 2 27 Reynolds Metals Co. s Lister Hill, Ala. Si Electric 1 28 Reading Alloys s Robesonia, Pa. FeB,FeCb,FeV,NiCb,Fd1o Aluminothermic 29 Sandgate Corp. s Houston, Texas FeMn, SiMn Electric 3 30 Shieldalloy Corp. s Newfield, N.J. FeV,FeTi,FeB,FeMo, Aluminotherm:ic
FeCb, FeCbTa 31 Tennessee Alloys Carp. s Bridgeport, Ala. FeSi Electric 3 32 Tennessee Metallurgical Co. s Kirrt>all, Tenn. FeSi Electric 2 33 Unicn Carbide Carp. L Alloy, W. Va. FeB,FeCr,FeCrSi,FeCb, Electric 16
FeSi, FeMn 34 L Ashtal:ula, Ohio Fe!I'i,FeW,FeV ,SiMn,other Electric 8 35 L Marietta, Ohio Electric,
electrolytic, vac:uum 11 36 s Niagara Falls,N.Y. Electric,
aluminothei:m:l.c 2 37 s Portland, Oreg. Electric 2 38 M Sheffield; Ala. Electric 5 39 Wocxiward Co. M Rockwood, Tenn. FeMn, SiMn Electric 7 40 Div. 1'Ead Carp. s W:lodward, Ala. FeSi Electric l
a Plant. size classificaticm
S-Up to 25,000 l<W M- 25,000 to 75,000 l<W I.rOlrer 7 5 t 000 l<W
13

In 1970, 345,567 kkgs (381,000 tons) of ferroalloys were produced in blast furnaces according to the Annual Statistical Report, ~S.I.-1570. Plants using other than tlast furnaces thus produced about 1;781,107 kkgs (1,963,734 tons) in that year.
On the basis of the census data and the number of plants enumerated in Table 1, the distribution of numbers of plants versus capacity in the industry appears to be as in Table 3.
Table 3. NUMBER OF PLANTS vs. VALUES OF SHIPMEN~S-1967
No. of plants
20 34 40
Value of Shipments {$ willion) __ Kerroallovs Tot.~a=l __ _
398.2 420.4
411.4 467.9
------~--
The large water-using plants thus account for some 88 percent of the value of shipments in s.r.c. 3313, while numbering 20 out of 40 and apparently account for over 80 percent of the total value of the shipment of ferroalloys.
The 1968 Water Use in Manufacturing data for those establishments using more than 75.7liiillion liters (20 million gal) of water annually are summarized in Tables 4 thru 9.
14

Table 4. WATER INTAKE, USE, AND DISCHARGE: 1968
~~--~~------~~~-
No. of Establishments No. of Employees Value Added by Manufacture No. of Establishments Recirculating Water
Liters
Total Intake 1128.7 x Intake Treated Prior to Use 3406 .. 5 x Total water Discharged 1120.7 x Intake for Process 4.9 x Intake for Air Conditioning 757. x Intake for Steam Electric Power 701.4 x Intake for Other Cooling or Condensing 381.5 x Intake for Boiler Feed, sanitary, etc. 40.1 x
20 .. 8,700.
$168.9 x 10⁶ 17
Gallon~
109 298.2 x 10⁹ 106 900. x 106 109 296.l x 109 109 1.3 x 10⁹ 109 200. x 109 109 185.3 x 10⁹ 109 100.8 x 10⁹ 109 10.6 x 10⁹
Table s. WATER INTAKE EY WATER USE REGION: 1968
Region
Delaware and Hudson Eastern Great Lakes Ohio River Tennessee Southeast Upper Mississi~~i Pacific Northwest
(D) 381.5 684.3
(D) (D) (D) (D)
Intake
(D) 100.8 180.8
(D) (D) (0) (0)
(D) 5 7
(D) (D) (D) (D)
(D) Withheld to avoid disclosing data on individual plants.
15

Table 6. WATER INTAKE. USE. AND DISCHARGE: 1968
Value of Shipments $411.4 x 10⁶
Liters __ G_a_,llon_s __ _
Intake from Public systems 3028. x 106 800. x 106 Co. surf ace Intake 1119.2 x 109 295.7 x 10⁹ Co. Ground Intake 6.4 x 10⁹ 1.7 x 10⁹ Gross Water Used 1212.3 x 109 320.3 x 10⁹ Public Sewer Discharge 1514. x 106 400. x 106 Surface water Discharge 1102.2 x 109 291.2 x 10⁹ Ground Water Discharge 1892.5 x 106 500. x 106 Transferred to other users 15.5 x 10⁹ 4.1 x 10⁹ Treated before Discharge 199.4 x 10⁹ 52.7 x 10⁹
16

Table 7. INTAKE, USE, AND DISCHARGE BY WATER USE REGION: 1968
Value of Shipments
Intake from Public Systems co. Surface Intake Co. Ground Intake Gross Water Used Public Sewer Discharge surface water Discharge Ground Water Discharge Transferred to ether Users Treated before Discharge
$ 97.2 x 10⁶
Eastern Great Lakes Liters Gallons
1892.5 x 109 379.6 x 10⁹
(Z) 379.6 x 10⁹
1514. x 106 364.5 x 10⁹ 378.5 x 10⁶
15.5 x 10⁹ (Z)
500. x 109 100.3 x 10⁹
(Z) 100.3 x 10⁹ 400. x 106
96.3 x 10⁹ 100. x 106
4.1 x 10⁹ (Z)
Value of Shipments $179.8 x 10⁶
Intake from Public Systems Co. surface Intake co. Ground Intake Gross Water Used Public Sewer Discharge surface Water Discharge Ground Water Discharge Transferred to other Users Treated before Discharge
Ohio River Liters Gallo!!§___
378.5 x 10⁶ 100. x 106 677.9 x 10⁹ 179.1 x 10⁹
6.1 x 10⁹ 1.6 x 10⁹ 718.8 x 10⁹ 189.9 x 10⁹
(Z) (Z) 679.4 x 10⁹ 179.5 x 10⁹ 757. x 106 200. x 106
157.1 x 10⁹ 41.5 x 10⁹
·~-------- ·~~--~~-~----~·~~~~--------~------
(Z) Less than 1.89 million l/year (500,000 gal/year)
17

Table 8. INTAKE WATER TREATMENT PRIOR TO USE: 1968
--~-------------------~------------------------·----~~------------------------- -------------Treatment
~-... -
Aeration coagulation Filtration Softening Corrosion Control pH other None
Estatlishments .....--------1 4 4 4 4 3 2
13
1.9 1.5
.4 1.5
0.5 0.4 0.1 0.5
Table 9. WATER TREATEt PRIOR TO J:ISCHARGE: 1968
____ neatment -Primary Settling Secondary Settling Trickling Filters Activated Sludge Digestion Ponds or Lagoons pH Chlorination Flotation other
Establishments
3 3 1 2 5 6 3 3 3 9
18
109 liters 1Q.! gal.
• 4 157.5
0.1 41. 6

PRODUCTION PROCESSES
The ferroalloy manufacturing processes are listed below with the product groups manufactured by each process.
Submerged-arc furnace process -
Exothermic process -
Electrolytic process -
vacuum furnace process -Induction furnace process -
Silvery iron 50% Ferrosilicon 65-75% Ferrosilicon Silicon metal Silicon-manganese-zirconium High-carbon (HC) Ferromanganese Silicomanganese Ferromanganese silicon Charge chrome HC ferrochrcmium Ferrochrome silicon Calcium carbide Low-carbon (LC) ferrochromium LC f erromanganese Medium-carbon (MC) ferromanganese Chromium metal Titanium, Vanadium and Columbium Alloys Chromium metal Manganese metal LC f errochromium Magnesium ferrosilicon Ferrotitanium
Ferroalloy production in submerged-arc furnaces consists of ra~ materials preparation and handling, smelting, and product sizing and handling as shown in Figure 1.
RAW MATERIALS PREPARATION AND HANDLING
The mineralogy of individual ores used by the ferroalloys industry is highly technical and specialized. The ores must be analyzed and carefully evaluated to identify any undesirable elements. careful evaluation of the ore is essential not only with regard to costs, including government tariffs, since ores are commonly sold on the basis of contained metal or metallic oxide, but also with regard to freight charges to ferroalloy plants. Other considerations in the purchase of ores are their physical characteristics, ease of reduction, and analytical specifications necessary to meet customer requirements.
19

Figure I. FERROALLOY PRODUCTION FLOW DIAGRAM
!-w_g : lvWcusr : . --. )l I Q-I DRYING
i DUSTI
I I I
· ~ ~-.L~~O-lN_G_A_N_D~SO~R'T-ING~..:....c~--J._~O~RE--S-T~O-RA_G_E~~~-~__._~-C-R~US~H~IN~G~~-W-El-GH_F_E-ED-IN-G~----~--1--S-M-El-J-1N-G--~===---CA-ST-~-G-_t>~+l.-I l_._ ______ _ __ ._ ______ ......,. ______ ._ ___ J I I • I I I I I DUST
LM~~~g __ CRUSHING SC REENI NG STORAGE SHIPMENT

The United States is depende:n:. almost 2ntirEly Uf;On corrunt:rcial sources of manganese and chromium ores from outside ._bE cour.try. l.tH::::se ores are imported mainly from South America, Africa., Turkey, Ir.die., a.nd riussia. Since the time interval bstween mining the ores and their receipt at the ferroalloy plants is usually many months, or even as long as a year, a substantial stock of manganese and chromium ores of th~ particular types and grades necessary to produce thE desired alloys wust b~ maintained.
It is the qeneral practice ~o frocure ores from familiar sources since their peculiarities will be known. Such ores will nave already demonstrated their suh:.::i.bili ty for "::Le. in-r E:nded sme 1 i:-. iag process. There are not many known chromium ore dE:: posits and t~heir f unciamS:L ::al chemical composition and physical properties have be~n reaso~ct~ly well defined. The same is true of commercially mined manga~PSE ores.
Most ores come to the mark~t for sale in th~ drsssed st:.aLt and are sold on the basis of their ccrn.:.•2nt. cf the n;ctal oxi::ic or metal, i.e., contained manganese, chromium oxid.:, etc. In g.::ri"'.-ral, ores containing high percentages of m2tal o~~dss arE E~si~r to pr0c~ss ana result in lower production costs than orPS wi-~ lower p~rcentag~ti or m~tal oxides.
In addi ~ion to chromium and mar:qar: es<-: 01:<-:s, columb:i um-u.:=ar.:u.y orc:·s or slags, titanium orr-:s, ar.d zirccr::ium cr,:::s ar;:, also import,::u. COHtrnercial sources of vanaaium and tungstcL t~aring cr~s ~xist:. in ~he United States. High-purity quartzes or quartzi-+::E:s with low alumina and low iron oxide are found in selected areas of this cou~~ry. rtiyn ~uality limestone deposits are also available domestically at a few locations.
The chromium ores imported and usEd for h:rroalloy vrouuction in the United States have a Cr203 content of about 45 to SJ "-Yt::rcent. 'I'hE - - ~
manganese content of the manganese o:r.-es rar.ges from 43 to 54 1:-'t:rcent. Since the ores used for ferrcalloy production contain consirieraLle qangue, ore rec8ipts and storage at the ferroalloy plarn:s involvE large tonnages.
The sizing of ores is important. Fine ores, sucn as tlotation concentrates, are not desirable as a dirEct charge into reduction furnaces because such ores lack porosity and do not allow thE release of reaction gases. Dust losses are therefore high. FinE ores can be used effectively with minimum mechanical losses in mel~ furnacE:s and can later be reduced with silicon alloys. While work has been done on briquetting fin~ ores, Equipment investment and briquetting costs have been difficult to justify through incr~ased production and improved recovery. On the other hand, ores rEceived at the plants are fre~uently oversized and must be crushed to a suitable size.
It is desirable to have in storage an adequatEc quantity or ore wi.th the desired chemical analysis and physical properties. i'he desirable quantities stored will depend on the furnace cai>acity, marketing situation, and storage capacity of the plant. The int~rest on the funds
21

invested in the ores held in storage may become a significant cost factor. Often it is possible to assemble ore from several sources which will complement each other in their composition.
The ore shipment, plus the required quartzes or quartzites, lime, scrap steel turnings, and reducing agents, etc., are generally transported to plants by railway or river barges. Ores are unloaded by traveling cranes or railroad-car dumpers and moved with belt ccnveyors to storage areas. The free moisture in the raw materials is significant, ranging from 10 to 20 percent. In some plants, the moisture is decreased by passing the material through driers before use in furnaces.
Care is required in the preparation of furnace charges in order to produce a specified ferroalloy. Normally, raw materials are conveyed to a mix house where they are weighed and blended. After the batch has been assempled, it is moved by conveyors, buckets, skip hoist, or cars to the hoppers above the furnace, where it may flow by gravity through chutes to the furnaces.
SUBMERGED-ARC FURNACES
The general design of electric submerged-arc furnaces for the production of alloys is basically the same throughout the industry; but they differ in electrical connections, arrangements of electrodes, and shape and size of the hearth. The three car£cn electrodes are arranged in a delta formation, with the tifS submerged .9-1.5 m (3-5 ft.) into the charge within the furnace crucible, so the reduction center lies in the middle of the charge and the reaction gases, formed in the reduction center, pass upward through the charge. A portion of ~he heat is transferred to the charge and partly prereduces the ore as it passes downward into the center of the furnace. Because of the passage of the reaction gas through the charge, fume losses are reduced.
Existing submerged-arc furnaces are generally built with an open top, and large quantities of reaction gases evolved in the reaction zone during the reduction process will flow without hindrance into a hood built above the furnace. The gases burn on the surface of the charge supported by the oxygen of in-rushing air, and are then discharged through stack{s) {after gas cleaning) to the atmosphere. Due to the open configuration, the parts above the furnace, i.e., the electrode holders, the hangers, the current conductors, the charging equipment. etc., are exposed to the radiant heat of the furnace and the hot furnace gases. These components must receive effective heat protection through the use of cooling water flowing through interior passages in the metal parts. In some reduction furnaces that produce ferroalloys water-cooled covers having gas removal equipment are built over the top of the furnace crucible. In such furnaces raw materials are used that do not tend to bridge and block the flow of gas so that it is not imperative to
22

work the charge with stoking rods. To reduce the bridging problem, raw materials may be pretreated.
The crucible of the submerged-arc furnace consists of a sealed metal shell adequately supported on foundations with provisions for cooling the steel shell. The bottom interior of the steel shell is lined with two or more layers of carbon blocks and tightl1 sealed with a carbon compound packed between the joints. The interior walls of the furnace shell are lined with refractory or carbon brick. One or more tap-holes are provided through the shell at the top level of the bottom carbon block. In some cases, provisions are made for the furnace to rotate or oscillate slowly.
Figure 2 shows a diagram of a f erroalloy furnace while Figure 3 shows an overall cross section of the same furnace with its accessory equipment.
The iron content in the ferroalloy charge material and product greatly facilitates both its manufacture and use. When metals that melt at high temperatures are alloyed with iron, the resulting alloy has a lower melting temperature than the metal with the high melting point. The lower melting temperature greatly facilitates the furnace production of ferroalloys and also facilitates its solution in molten steel or iron.
In the submerged-arc furnace the conversion of electrical energy to heat takes Flace by current flow from the electrode tips to the hearth and between electrodes. Final reduction of the oxidic ores occurs in the lower portion of the furnace.
submerged-arc furnaces generally operate continuously except for periods of power interruption or mechanical breakdown of components. Operating time averages 90 to 98 percent. The electrodes are submerged from .9 -1.5 m (3-5 ft.) below the mix level, and their tips are located about .9 - 1.8 m (3-6 ft.) above the hearth. The electrodes• position thus facilitates both heat exchange and mass transfer between reaction gases and the mix.
High temperatures, u~ to 2ooo•c (3632•F), are required to effect reduction reactions. Carbon monoxide is a necessary byproduct of the smelting reaction. In the case of silicon metal, about 2 kg (4.4 lb) of carbcn monoxide are Froduced for each kg (2.2 lb) of metal; significant amounts of silicon monoxide are also produced as an intermediate.
Although furnaces may be changed from production of one product group to another. such as from ferromanganese to ferrochromium. this may entail rearrangement of electrode spacing and different power loads and voltage requirements. It may also reduce the efficiency of the furnace operation, since most furnaces are designed to produce one type of alloy. However. it is relatively easy to switch from ferromanganese to silicomanganese. for example, since they are in the same product group.
23

REACTION GASES
Figure 2. SUBMERGED-ARC FURNAtE DIAGRAM
ELECTRODES
CAR BON HEARTH
CRUCIBLE
24
REFRACTORY LINING

N Ul --10T METAL CRANE
IN!)JCEO AIR ~
!_ },~--
F;9ure 3. CROSS SECTIQ\J OF OPEN FURNACE
CRANE FOR PASTE&. CASING HANDLING =-'3.
= 0
HEARTH LINE~
~ I I
HOOD
~ INDUCED AIR
:::/
® I
TRANSFORMER
OPERATING
!t=~======~=-==~f-ti---=FLOoR
CAPACITOR
RACKS

The molten alloy from the carbon reduction of the ore accumulates at the base of the electrodes in the furnace. The molten alloy is periodically removed through a tap-hole placed to drain the metal from the hearth of the furnace.
FERROSILICON PRODUCTION
Quartz and quartzite are the minerals mostly used for smelting ferrosilicon. The ores should contain not less than 98 percent SiO~ and the lowest possible content of alumina, magnesium oxide, calcium oxide, and phosphorous. The reducing agent usually used is coke; other reducing agents are coal, petroleum coke, and charcoal. The reducing agent should have minimum ash and phosphorous content. The ironcontaining substance should be clean, carbon steel scrap or pelletized iron ore; the chromium and phosphorous contents should be low. These requirements preclude the use of stainless scrap and cast iron scrap.
A material balance for the production of 50% ferrosilicon is typically as shown in Table 10.
Quartzite Coke
Table 10. MATERIAL BALANCE FOR 50% FERROSILICON (% of material charged}
---... ----·----outpuL ___ _
Alloy Volatilized
41.8 58.2
Steel Shavings Electrode Mass
47.2 27.4 24.5
c. ~ IOO.o 100.0
-------~
The charge materials for the production of silicon metal should contain no iron. Petroleum coke or charcoal is used as the reducing agent and pre-baked carbon electrodes are generally used. Power consumption increases with increasing silicon content of the product from 50% FeSi to silicon metal.
Ferrosilicon is usually smelted in 3~phase electric furnaces which may be rated at over 40 mw. Modern ferrosilicon furnaces are equipped with continuous self-baking electrodes and automated charging machinery. The electrodes are sheet steel cylinders which are filled with the electrode paste, made of a mixture of anthracite, coke and other carbonaceous substances, and a mixture of coal tar and pitch used as a binder. The
26

electrode is consumed during the furnace reduction process and is periodically slipped into the furnace to compensate for its consumption.
The charge materials are prepared in charge yards, transported by conveyors to the proportioning floor, and distributed among the furnace hoppers. From the hoppers the charge is fed into the furnace charge holes. During the production of ferrosilicon, the furnace operates continuously and the metal is tapped as it accumulates. Six to eight tappings per shift are made. After tapping is finished as indicated by the appearance of flame at the tap hole, plugs consisting of electrode mass or a mixture of fire clay and coke dust are rammed in.
FERROMANGANESE PRODUCTION
Electric furnaces similar to those used for the production of ferrosiliccn are used to produce ferromanganese. When ferromanganese is produced from its ores, iron, manganese, silicon, phosphorous. and sulfur are reduced and complex iron and manganese carbides are formed. Smelting is continuous with metal and/or slag being tapped every 2-4 hours.
Ferromanganese is produced in the electric furnace by either the flux process or the self-fluxing process. The self-fluxing process is commonly used in the United states. In the flux process, lime is introduced in the charge; MnO which forms silicates with the silicon in the ore and coke dust ash is displaced by calcium oxide, reducing losses of manganese to the slag. Phosphorous in the ore is mostly reduced and passes into the alloy. Up to 90% of the phosphorous in the ore can be reduced; the reduced phosphorous partially evaporates and escapes from the furnace while 60% of the total phosphorous in the charge passes into the alloy. Of the total sulfur introduced in the charge 1% passes into the alloy, 40-45% passes into the slag, and 55% escapes with the gases. The normal charge to produce high-carbon ferrornanganese by the flux method is as in Table 11. ~he charge~to-alloy ratio is about 4.0.
Table 11. HC FERROMANGANESE CHARGE MATERIALS-FLUX METHOD (% by weight)
Manganese ore Coke Limestone Electrode mass
64.7 18.0 16.8 0.5
100.0
27

In the self-fluxing method of producing ferromanganese, little or no lime is introduced in the charge; the slag is subsequently used to smelt silicomanganese. By this method, 60% of the manganese in the ore passes into the alloy, 8-10% escapes, and 30-32% passes into the slag; 70% of the manganese in the slag is extracted when silicomanganese is subsequently produced from the slag.
The normal charge to produce HC ferromanganese by the self-fluxing method is shown in Table 12. Of the charged materials, 30.9% pass into the alloy, 29.5% pass into the slag, and 39.6% escapes as gas and dust. The gas contains 65~70% co.
Table 12. HC FERROMANGANESE CHARGE MATERIALS -SELF-FLUXING METHOD
Manganese ore (48% Mn) Lime coke Electrode mass
(% by weight)
74.8 4.6
20.0 0.6
100 .. 0
----- ·--~~----~----~~--------------~~-----------
Medium-carbon and low-carbon ferromanganese differ from high-carbon ferromanganese by their reduced carbon contents and are produced by a special process. Production in an electric furnace is usually by the silicothermic reduction method. The charge for MC ferromanganese is composed of silicomanganese, manganese ore, and lime, as shown in Table 13. The charge-to-alloy ratio is about 3.5.
28

Table 13. MC FERROMANGANESE CHARGE (% by weight)
Manganese ore Lime Silicomanganese (20% Si, 65% Mn) Electrode Mass
43.6 24.3 31. 2
0.9
100.0
A similar charge would be used to produce LC f erromanganese, but using silicomanganese with a higher silicon, lower carbon content (ferromanganese-silicon) •
SILICOMANGANESE PROBUCTION
Silicomanganese is also produced in electric submerged-arc furnaces. The charge is continuously loaded and slag and metal are tapped 3 to 4 times during an 8-hour shift. Silicomanganese may be smelted from manganese ore, from self-fluxing slag from ferrornanganese production, or from a combination of coth.
A typical charge to produce silicornanganese is shown in Table 14.
Table 14. SILICOMANGANESE CHARGE MATERIALS '% by weight}
~-----~~·--~~~-
Manganese Slag Manganese Ore Coal or coke Lime Recycle scrap
27.9 27.9 17.3 15.6 11.l
100.0
~~~·-------...----------~~--~--~~·
29
•

Low-phosphorous silicomanganese is produced in a manner similar to that above except that no manganese ore is used in the charge, only manganese slag.
FERRCCHROMIUM FRCDUCTION
Ferrcchromium is produced in several grades differing mainly in carbon content. Careful selection of chrome ores is important in producing each of the several grades of alloy.
HC FerrochrorniYID_§melting
In the production of HC ferrochromium, the chromium and iron oxides contained in the ore are reduced by a carbonaceous reducing agent. HC ferrochromiurn is smelted continuously; the charge materials are fed in small portions, keeping the furnace full while metal and slag are tapped about every 1 1/2 - 2 hours. smelting of HC Fecr requires higher voltages and higher power loadings than are used for most other ferroalloys.
A typical charge for the production of HC ferrochromium, normally 60-68% chromium, is shown in ~able 15. The charge-to-alloy ratio is about 4.0.
Table 15. CHARGE MATERIALS FOR HC FERRCCHRCMIUM (% by ~eight)
Chromium ore Coke Quartzite Bauxite flux Electrode mass
---·-
72.4 14.7 6.6 s.s
_ _Q_& 100.0
The charge elements pass into the smelting products as shown in ~able 16.
30
•

Table 16. RAw MATERIAL COMPONENTS TO SMELTING PRODUCTS FOR HC FeCr
--------~-...--- ·------------.--------
_Element
Chromium Iron Silicon Phosphorous Sulfur
~ % in total charge_~~ £Q_alJ.QY !o'~~ l,Q§§_
90 98 15 60 10
6 2
80 20 30
4
5 20 60
-----~
Ferrochromesilicon is generally produced by the direct method. In the direct method, chromium ore and quartzite are reduced by coke. The process is carried out in arc furnaces similar to those used in the production of ferrosilicon.
EXOTHERMIC PROCESSES
The exothermic process using silicon or aluminum, or a combination of the two, is used to a lesser extent than the submerged-arc process. In the exothermic process the silicon or aluminum combines with oxygen of the charge, generating considerable heat and creating temperatures of several thousand degrees in the reaction vessel. The exothermic process is generally used to produce higher grade alloys with low carbon content. Low-carbon and medium-carton ferrochrorrium and low-carbon or medium-carbon ferromanganese are produced by silicon reduction. A flow diagram of a typical silicon reduction process for manufacturing LC ferrcchromium is shown in Figure 4. First, chromium ore and lime are fused together in a furnace to form a chromium ore/lime melt. second, a known amount of the melt is poured into the No. 1 reaction ladle followed by a known quantity of an intermediate molten ferrochromesilicon previously produced in a No. 2 ladle. The reaction in the No. 1 ladle is a rapid reduction of the chrome from its oxide and the formation of LC ferrochromium and a calcium silicate slag.
31

Figure 4. FLOW SHEET LC FERROCHROMIUM
ELECTRODES
FeCrSi SUBMERGED-A RC
FURNACE
I --,_±_3_4_1._c_r_-\ SLAG 8foCrz03
ELECTROOES
Cr ORE LIME
Cr ORE/LIME MELT. OPEN-ARC FURNACE
REACTION LADLE #1
REACTION LADLE +t2
THR™-AWAY SECONDARY SLAG THROW AWAY
SLAG
32
PRODUCT LC FeCr ± 70%Cr

Since the slag from ladle No. l still contains recoverable chromium oxide, a second silicon reduction is made in the No. 2 ladle with molten ferrochromesilicon directly from the submerged-arc furnace. The reaction in the No. 2 ladle produces the intermediate ferrochromesilicon used in the No. l ladle reaction. LC and MC f erromanqanese are produced ty a similar practice using a silicon bearing manganese alloy for reduction.
The reaction in these ladles from the silicon reduction results in strong agitation of the molten bath and a rise in temperature. elevated temperature and agitation froduces emissions for about minutes per heat that have similar characteristics to the emissions
a The
five from
submerged-arc furnaces.
ALUMINUM REDUCTION
Aluminum reduction is used to produce chromium metalr ferrotitanium, ferrovanadium and ferrocolumbium. Although aluminum is a more expensive reductant than carbon or silicon, the products are purer. Mixed aluminothermal-silicothermal processing is used for the production of ferromolybdenum and ferrotungsten. Usually such alloys are produced by exothermic reactions initiated by an external heat source and carried out in open vessels. ~he high-temperature reaction of aluminum reduction produces emissions for a limited time similar to those by silicon reduction.
SLAG PROCESSING
some of the electric-arc smelting processes produce slag along with the ferroalloy product. ~hese are:
Low-carbon Ferrochromesilicon High-carbon Ferrochromium High-carbon Ferromanganese Silicomanganese
These slags may contain metal entrapped in the slag which is recovered by crushing and separation of the slag and metal by a wet sink-float process, called slag concentration. The slag fines are also separated from the heavier particles so that a secondary product is slag of such size that it is usable for road building and similar purposes. This process is usually applied to ferrochromium slags for recovery of chromium which is re-charged to the furnace.
Another method of recovering metal values from manganese slag is to "shot" the slag, then use the slag as the raw material for electrolytic production of the metal. Rapid quenching of the molten slag in a large volume of flowing water produces a small-sized particle (shot) which can be readily leached with acid to froduce the electrolyte solution for electrolytic manganese production.
33

VACUUM AND INDUCTION FURNACE PROCESSES
The vacuum furnace process for ~reducing LC ferrochromium was developed commercially in the early 1950's. In this method, carbon is removed from HC f errochromium in a solid state within vacuum furnaces carefully controlled at a temperature near the melting point cf the alloy. such a furnace is shown in Figure 5.
The process is based on the oxidation of BC ferrochromium by the oxygen in silica or chrome oxide, with which it has b€en mixed after crushing. The co gas resulting from the reaction is pumped out of the furnace in order to maintain a high vacuum and to facilitate the ferrochromium decarburization. Heat is supplied to the furnace by electric resistance elements.
Induction furnaces, either low-frequency or high-frequency, are used to produce small tonnages of a few specialty alloys through remelting of the required constituents. such a furnace is shown in Figure 6.
PRODUCT SIZING AND HANDLING
Ferroalloys are marketed in a bread range of sizes from ~ieces weighing 34.1 kg (75 lbs.) to granules of 100 mesh or finer, depending upon the final usage. Ferroalloys are intermediate products, and are usually melted and blended with molten metal. For this reason, the ferroalloy product size is im~ortant.
Molten ferroalloys from the submerged-arc furnaces are generally tapped into refractory-lined ladles and then into molds or chills for cooling. The chills are low, flat iron or steel pans that remove heat rapidly from the molten pour. After the ferroalloy has cooled to a workable temperature,it is cleaned of any adhering slag and sized to market specifications.
The s1z1ng operation consists of breaking the large initial chills by drop weights or hammers, then crushing and screening the broken product. Large jaw crushers, rolls, mills, er grinders for reducing the product size and rotating and vibrating screens are used for this purpose. conveyors and elevators move the product between the crushing and screening operations. Storage bins are provided to hold the finished or intermediate products.
34

w (.Jl
TO INERT GAS COOLING
REMOVABLE END CLOSURE
Figure 5.
VACUUM FURNACE FOR FERROALLOY PRODUCTION
ELECTRICAL LEADS
TRACK
TO VACUUM PUMPING SYSTEM
HEARTH CAR
CARBON RESISTORS
FURNACE CHARGE

w CT'\
FURNACE CRUCIBLE
f LADLE
I ,----,' I
----- -
Figure 6. INDUCTION FURNACE DIAGRAM
FURNACE
OPERATORS PANEL
SUBSTATION

EMISSIONS FROM SUBMERGED-ARC FURNACES
Since the quantity and composition of the emissions from ferroalloy furnaces have a major impact upon the potential for water pollution in those plants using wet air pollution control devices, some discussion of such emissions is appropriate. The conventional submerged-arc furnace utilizes carbon reduction of metallics in the oxide ores, and continuously produces large quantities of hot carbon monoxide which can be greater by weight than the metallic product. The co gas venting from the top of the furnace carries fume from high-temperature regions of the furnace and entrains the finer sized constituents of the mix.
In an open furnace, all co and other combustibles in the furnace gas burn with induced air at the top of the charge, resulting in a large volume of high-temperature gas. In a covered furnace, most or all of the co and other gases are withdrawn from the furnace without combustion.
Properties and quantities of emitted particulates depend upon the alloy being produced. Except for ejected mix particles from the furnace the fume size is generally below two microns (u) and ranges from O.l to l.Ou with a geometric mean of 0.3 to 0.6 depending upon the ferroalloy produced. In some cases, agglomeration does occur, and the effective particle size may be larger. Grain loadings and flowrates are dependent upon the type of furnace and hooding. Open submerged-arc furnaces have high f lowrates and moderate grain loadings, while covered furnaces have moderate flowrates and generally high grain loadings. In the dry state, the ccllected emissions are very light and the bulk density varies from 64.l to 480.6 kgs./cu. meter (4 to 30 pounds per cubic foot).
Silicon alloys produce a gray fume containing a high percentage of primarily amorphous silicon dioxide (SiOl) (Ref. 5). some tars and carbon are present arising from the coal, coke, or wood chips used in the charge. Ferrochrome-silicon furnaces produce an Si01 emission similar to a ferrosilicon operation with some additional chromium oxides. Manganese operations produce a brown emission, which analyses indicate to be largely a mixture of Si01 and manganese oxides. The emissions from chromium furnaces contain Si01, MgO and some iron and chromium oxides.
Chemical analysis of the fumes indicate their compositicn to be similar to oxides of the product being produced. Typical chemical analyses are given in Table 17~
37

w 00
Ref. 5 Table 17. TYPICAL FURNACE FUME CHARACTERISTICS
Furnace product
Furnace type Fume shape
Fume size characteristics, microns
50% FeSi SMZ a
Open Open Spherical, Spherical, sometimes sometimes in chains in chains
SiMnb SiMnb Fe Mn HC Fe Cr
Covered Covered o·pen Covered Spherical Spherical Spherical Spherical
Maximum 0.75 0.8 0.75 0.75 o. 75 1.0 Most particles 0.05 to 0.3 0.05 to 0.3 0.2 to 0,4 0.2 to 0.4 0.05 to 0.4 0.1 to 0.4
X-ray diffraction All
Fe304 Fe 203 Quartz SiC
fumes were· prfmarily amorphous trace constituents FeSi
FeSi2
Chemical Analysis, %
Si02
a
FeO MgO Cao MnO Al203 LOI TCr as cr 203 SiC Zr02 PbO Na20 Bao K20
63 to 883 61.12 14.08 1. 08 1. 01 6.12 2.10
1. 82 1. 26
Si - 60 to 65%; Mn - 5 to 7%; Zr - 5 to 7% b
Mn304 Quartz Mn304 MnO SiMn MnO Quartz Spinel Quartz
15.68 24.60 25.48 6.75 4.60 5.96 1.12 3.78 1.03
1. '>R 2.24 31. 35 31. :,4 33.60 5.55 4.48 8.38
23.25 12.04
. 0. 47 2.12
Manganese fume analyses in particular are subject to wide variations, depending on the ores used.
Spinel Quartz
20.96 10.92 15.41
2.84 7.12
29.27
Chrome ore- Mn ore-lime melt lime melt
Open Open "Spherical Spherical
and and irregular irregular
0.50 2.0 0.05 to 0.2 0.2 to 0.5
Spinel Cao
10.86 3.28 7.48 1. 22 7.43 0.96
15 .06 34.24 12.34
4.88 1. 36 13.86 11. 92 14.69
0.98 1. 70 2.05
1.13 13.08

EMISSIONS FROM EXOTHERMIC PROCESSES
Oxide fumes similar in physical characteristics to those from the submerged-arc furnace are emitted from the reaction ladle or furnace while the reducing agent is being charged during alumino- or silicothermic reduction. This emission is due to strong agitation of the molten bath and the rapid temperature rise. The reaction may take from 5-15 minutes per heat, and the heat cycle is about 1 1/2 to 2 hours. Therefore, atmospheric emissions from the exothermic reactions take place during about 10 percent of the cycle.
The quantity of emissions from the exothermic reactions ranges from 9.08 to 18.6 kg (20-40 lbs) of particulates per ton of ferroalloys produced. The total tcnnage of ferroalloys made by the exothermic process amounts to 10 to 15 percent of the total ferroalloys production in the United States.
OPERATING VARIAELES AFFECTING EMISSIONS
Because of the complexity of the heavy mechanical and electrical equipment associated with a modern submerged-arc furnace, close supervision and maintenance are required to prevent frequent furnace shutdowns. The furnaces are designed to operate continuously to maintain satisfactory metallurgical and thermal equilibria.
Normal furnace shutdowns on an annual basis may average three to ten percent of the operating time and are caused by a wide variety of situations. These can be electrode installations, maintenance, repair of water leaks at electrode contact plates, mix chute failures, furnace hood or cover failures, taphole problems, electrical or other utility failures, crane failures, ladle or chill problems or curtailments of service by the power companies. In general, furnace interruptions are relatively short in duration and usually are not more than several hours. Following such interruptions, the furnace usually returns to normal operation with normal emissions in a period of time approximately equal to the length of the interruption.
Greater-than-normal emissions occur after returning power to the furnace following a lengthy interruption caused by a major furnace operational problem. These ~roblems may include electrode failure that makes it necessary to dig out an electrode stub or to bake at a reduced load for self-baking electrodes, serious mixture blows of the furnace, metallurgical problems that require a furnace burndown to return it to normal operations, serious water leaks that flood the furnace with water, furnace hearth failure, major ta~hole problems, transformer or major electrical system failures. etc. When starting up a new furnace or one with a cleaned out hearth, as well as a furnace with a cold hearth after a long shutdown, heavier-than-normal emissions may last up to a week before the furnace operates in an optimum manner.
39

The quantity of emissions from submerged-arc furnaces will vary up to several times the normal emission level over a period of one to three percent of the operating time due to major furnace interruptions and. to a lesser extent, because of normal interruptions.
QUAN'IITIES OF EMISSIONS
Emissions and emission rates will vary with (1) type of alloy produced. (2) process (i.e., continuous or batch), (3) choice of raw materials and pretreatment thereof. (4) operating techniques. (5) furnace size. (6) maintenance practices.
An example of the varying emissions that result from process changes can be seen in the manufacturing of silicon alloys. As the percentage of silicon in the alloy increases, the loss of Si0£ increases, therefore, a silicon-metal furnace emits substantially more Si0£ fumes than an equivaJent-size 50% ferrosilicon furnace.
Emissions from batch-operated open-arc furnaces are periodic. Following sudden addition of mix containing volatile or reactive constituents (coal. moisture. aluminum. etc.) to a hot furnace crucible. violent gas eruptions can occur. This is best exemplified by the manganese ore-lime melt furnace where momentary gas flow following mix addition can be five times the average flow. Under these conditions. temperature. dust loading. and gas flow all peak simultaneously. In contrast. chromium ore-lime melt furnaces, to which few or no gas-releasing constituents are fed. are net subject to this violent behavior.
Some of the special alloys are also produced by aluminothermic reactions without the addition of electrical energy. These reactions also cause momentary peaks of gas flow with high emission rates.
Volatile materials in the furnace charge may cause rough operation. One significant contributor to such operation is the presence of fines. moisture or dense material in the feed. These materials promote bridging and nonuniform descent of the charge which may cause gas channeJs to develop. The collapse of a bridge causes a momentary burst of gases. A porous charge will promote uniform gas distribution and decrease bridging. For some products economics dictates the use of raw materials with more fines or with more volatile matter than desirable. Pretreatment of the feed materials promotes smooth furnace operation. Each of these factors has an effect on the smooth operation of the furnace, and consequently upon the emissions.
Differences in operation techniques can have a significant effect on emissions. The average rate of furnace gas production is directly proportional to electrical input, so that a higher lead on a given furnace normally causes a proportional increase in emissions. In some cases, ·-~n1is..::ions increase at a rate greater than the load increase, due to rough operation and inadequate gas withdrawal.
40

At a fixed load and with the gas generation remaining almost constant, the emission concentration and weight per hour of particulates can vary by a factor of 5 to 1. Operating with insufficient electrode immersion promotes increased emissions.
Higher voltage operation electrode positions and emissions.
for a given increase the
furnace will concentration
promote higher and amount of
On scrne operations, especially silicon metal production, the charge must be stoked to break up crusts, cover areas of gas blows, and permit the flow of reaction gases. Therefore, both furnace operations and emissions can be a function of how well and how often the furnace is stoked.
Maintenance practices significantly affect emissions on covered furnaces because accumulation of material under the cover and in gas ducts reduces the gas withdrawal capacity of the exhaust system. Plugging of gas passages in the control equipment results in reduced efficiency of gas cleaning.
PRODUCTION AND EMISSION DATA FOR FERROALLOY FURNACES
The data in Table 18 summarize pertinent data as to production and emission factors fer submerged-arc furnaces (Ref. 32).
The data of Table 19 summarize the types of air pollution control devices used in various ferroalloy furnaces producing specific products in the United states.
Some comparisons of the off-gas volume from covered furnaces and controlled open furnaces are shown in ~able 20.
Table 20. ILLUSTRATIVE OFF-GAS VOLUMES FROM OPEN AND CLOSED FURNACES - REF 32.
---------~----~-..---~--
Closed Furnaces Product Nm3/min-mw scfm/mw --------...,.
FeMn FeSi (65-75%) Si Mn FeSi (50%)
6.16 5.88 5.60 5.04
220 210 200 180
41
Open Furnaces ~/min-mw scf rn/rnw
370 521 204 258
13,200 18,600 7,300 9,200

Table 18. PRODUCTION AND EMISSION DATA FOR FERROALLOY FURNACES
Uncontrolled Particulate Emissions Electric Energy Ratio of Charge Product kg/kkg a11oy_ 1bs/ton a11oy_ kg/mwhr lb/mwhr mwhr/kkg alloy_ mwhr/ton alloy_ to Product Weight
Silvery Iron 58 116 20.4 45 2.9 2.6 1.8 50 % FeSi 223 446 40.4 89 5.5 5.0 2.5 65-75% FeSi 458 915 47.2 104 9.7 8.8 4.5 Si Metal 500-1000 1000-2000 33-65 72-144 15.4 14.0 4.9 SMZ No data No data No data rfo data 9.7 8.8 4.5 Mn ore/lime melt 67 133 37.7 83 1.8 1.6 3.5 Ca Si 672 1343 51.7 114 13. 0 11.8 3.9
.i::. HCFeMn 168 335 28 .1 62 2.6 2.4 3.0 N
Si Mn 110 219 22.7 50 4.9 4.4 3 .1 FeMnSi 158 315 26.3 58 6.0 5.4 4.3 FeCrSi 416 831 50.8 112 8.2 7.4 3.4 Chg Cr 168 335 28.l 62 4.6 4.2 4.0 HCFeCr 168 335 28. l 62 4.6 4.2 4.0 Cr ore/lime melt 6 11 4. l 9 l.3 l.2 1.2

Table 19. TYPES OF AIR POLLUTION CONTROL SYSTEMS USED ON AMERICAN FERROALLOY FURNACES
Covered furnaces with withdrawal and cleaning of unburned gases
Control device
Wet scrubbers
Products
Ferromanganese 50 to 75% Ferrosilicon
HC f errochromium Silicomanganese
Open furnaces with withdrawal and cleaning of burned gases
Control device
Wet scrubbers
Cloth type filters
Electrostatic precipitator
Products
50 to 85% Ferrosilicon Silicomanganese HC f errochromium Ferrochrome-silicon Silicomanganese Ferromanganese silicon 75% and higher grades of ferrosilicon
Silicon metal Ferrochromesilicon HC f errochromium Ferrochromesilicon


SECTION IV
INDUSTRY CATEGORIZATION
The purpose of the effluent limitation guidelines can be realized only by categorizing the industry into the minimum number of groups for which separate effluent limitation guidelines and new sources performance standards must be developed. The categorization here is believed to be that minimum, i.e., the least number of groups having significantly different water pollution potentials and treatment problems.
I. Open Electric Furnaces with Wet Air Pollution Control Devices
II. covered Electric Furnaces and Other Smelting Operations with Wet Air Pollution Control Devices
III. Slag Processing
In developing the above categorization, the following factors were considered as possibly providing some basis for categorization. These factors include characteristics of individual plants, various production processes, and water uses.
1. Air Pollution Control Equipment
2. Production Processes
a. Electric Furnace
b. Exothermic
c. Slag Processing
3. Furnace Types
a. Open
b. covered or sealed
4. Raw Materials
s. Product Produced
6. Size and Age of Production Facilities
7. waste water constituents
8. Treatability of Wastes
9. water uses
45

a. Wet Air Pollution Control Devices
b. cooling Water
c. Electric Power Generation
d. sanitary wastes
e. Slag Processing
f. Drainage From Slag or Raw Material storage
Air EQllution Control Eguipm§ni
Air pollution is the major pollution problem in this industry. Much of the water pollution problem is created by solving air pollution problems with wet air pollution control devices such as scrubbers. Since the only water pollution potential from an electric furnace, which is either uncontrolled or controlled with a dry air pollution control system (such as a baghouse), is that from cooling water, there is no justification for including these furnaces with those having wet systems, since any standard which would be fair to the •wet• furnaces, would be excessively permissive to the 'dry• ones, and vice versa. For this reason, the categorization selected is partially based upon the type of air pollution control equipment, i.e., wet or dry.
Although another breakdown might be made based upon the types of wet air pollution control equipment, such as high energy scrubbers, disintegrator scrubbers, electrostatic precipitators with water sprays, etc., this would unnecessarily multiply the number of categories and have too small an effect upon the total pollutant load from this industry to be warranted.
Production Process~§
The various production processes vary markedly in their ability to pollute water, and this provides an additional basis for categorization. This basis consists of the differential in raw waste loads and concentrations between the slag processing operations and the electric furnace and exothermic processes. The electric furnace and exothermic processes are dry by nature, although water is used for cooling and possibly for air pollution abatement. The plant survey data obtained at an exothermic operation using wet air pollution control methods indicate that the water use per ton (when divided by 3) is of the same order of magnitude as that of covered electric furnaces {per mwhr), and the exothermic operations were therefore included with the covered electric furnaces.
46

Although not properly a ferroalloy production process, slag processing is performed at many plants to recover the residual metal values left in the slag after smelting, and helps reduce the solid waste load somewhat at these plants. This process is intrinsically different from the other production processes, inasmuch as it is inherently •wet•, and therefore merits a separate category. Additionally, the •building block' approach, such as is used for establishing the allowable plant effluents herein, requires a separate category since all plants de not use such a process and the magnitude of the potential wasteload is substantial.
~~e,Types
The types of smelting furnaces were found to provide a basis for categorization in conjunction with consideration of water uses and other factors. The differences between open and covered or sealed electric smelting furnaces are significant insofar as they relate to the raw waste loads and the pollutants present and air pollution control technologies available for use. The off-gas volumes from the two types of furnaces may vary by a factor of 50 between the two types of furnaces, and cyanides are present in scrubber waters from the covered types, but not from the open type. ~he water uses for wet air pollution control devices may be quite different due to the differences in the off-gas volumes. Person's (5) published data show a difference in water circulation with venturi scrubbers of a factor of 24 between open and covered furnaces. The final volume of water flowing from the scrubbers on open or covered furnaces may not vary significantly; the plant survey data indicate, in fact, that the differences are not great and are probably more dependent on scrubber type than furnace type. The recirculation of water at the venturi scrubbers on open furnaces must be regarded as a part of the waste water treatment methods and is so specified when effluent limitations for such sources are determined.
Additionally, dry dust collectors are widely used on open furnaces, and are more common than wet collectors. The converse is true with covered furnaces. There are only two kncwn examples of dry dust collectors being installed on covered or sealed furnaces, while the vast majority utilize wet air pollution controls.
Raw Materials
Depending on the product produced, the raw materials for the smelting operations vary principally in the types of ores and the proportions of the materials in the charge. For example, the charge for HC ferromanganese consists of manganese ore, coke, and limestone, while the charge for HC f errochromium consists of chromium ore, coke, quartzite and bauxite flux. There are no differences, however, in the raw materials used in the production of 50% ferrosilicon, whether it is produced in an open or covered furnace, although the covered furnace feed materials may require pretreatment. There are, of course,
47

substantial differences in the charge into electric furnaces and the feed to slag processing operations.
Product Produced ---~-
categorization by product would result in a large number of guidelines and standards, since the number cf products which can be produced in a furnace is fairly large, and many products can be produced in either open or covered furnaces. Additionally, this method would create unnecessary problems for the person writing the discharge permit, since plants are accustomed to changing the product produced in the furnaces depending upon market conditions. For example, during the last few years, with a decline in the market for ferrochromium and ferromanganese products, many plants discontinued or cut back the production of these products and converted to other, more profitable product lines. With a categorization based on product, this would either entail the issuance of a new discharge permit, or the writing of the original permit to reflect all the possible variations which may take place.
Size and Age of Facilitig§
The size and age of production facilities provides no basis for categorization. This judgement is based largely upon the fact that the emissions factors for the various products (given in kg (lb)/mwhr and which represent the uncontrolled particulate emissions and upon which the raw waste water loads are dependent) are not variable by furnace size. Since effluent loads were based upon units of electric power used in the furnaces, the factor of furnace size seems to be eliminated by the nature of the process. Size of the plant may have some bearing on the cost of waste water treatment, since obviously it will cost a very small plant more for treatment per unit capacity than it would a large one, but this is not so great as to warrant a separate categorization.
Although elder furnaces are not as likely to be controlled for air emissions, and therefore to require scrubber water treatment, by the nature of the categorization selected tbis has been taken into account. The newer electric furnaces differ from the older ones only in size; the older furnaces are about 10 rnw or less, the newer ones are double or triple that in size. The essential nature of the furnace has changed little over many years, although newer furnaces may utilize somewhat more water for cooling.
waste Water_£Qnstituents
The waste water constituents provide a collateral, but not independent basis for categorization. Suspended solids are the largest single constituent of the waste waters and appear in effluent from all of the various processes. suspended solids cbviously result from the use of wet devices to remove particulates from smelting off-gases. Chromium, as another example, is in the effluents from chromium smelting
48

operations, and chromium slag concentrating operations. cyanides are generated in significant concentrations only in covered furnaces. This distinction appears in the differentiation between open and closed furnaces and is thus no independent basis for categorization based on waste water constituents.
Treatability of Ws~
'Ireatability of waste also provides a collateral, but not independent basis for categorization, largely for the same reasons that the waste constituents do. The treatment methods consist principally of coagulation and sedimentation, neutralization and precipitation, reduction of chromium, oxidation of cyanides and phenol, and recirculation and re-use. All of these methods, except for cyanide oxidation, are applicable to one extent or another in all of the various types of production operations. Cyanide is found in significant quantities only in scrubber water from covered furnaces, but such a differentiation is inherent in the chosen categorization, since covered furnaces are separately considered for other reasons.
From the standpoint of air pollution control, emissions from open electric furnaces are fairly easily controlled with fabric filter systems, and this method has been commonly used in the industry for this type furnace. covered or sealed furnaces, however, in this country are only controlled with wet scrubbers, although there are two foreign plants which utilize dry dust collection systems for control of emissions from covered furnaces.
The use of baghouses, of course, reduces water use to zero insofar as air pollution controls are concerned, and a smelting furnace shop so equipped does not fall under the categories based upon furnace type.
Water uses were judged to be a significant basis for categorization. The categorization differentiates between processes on the basis of water use for wet air polluticn control devices and for slag processing.
Electric power is presently generated in very few ferroalloy plants. A separate category is not warranted; the guidelines separately developed for steam electric power plants should be applicable, since, as shown in the previous section, water use per kwhr is about the same as for power plants in general. sanitary wastes are common to all plants, whether treated on-site or discharged to a municipal treatment plant and no separate category is needed.
49


SECTION V
WASTE CHARACTERIZATION
The waste characteristics to be determined may be considered on the basis of the industry categories and the various water uses as follows:
1. water for wet Air Pollution Control Devices a. Electric Furnace Smelting
i. Disintegrator-type Scrubbers ii. High Energy Scrubbers iii. Electrostatic Precipitator Spray Towers iv. Steam/Hot water Scrubbers
b. Exothermic smelting Processes 2. Sanitary Uses, Boiler Feed, Air Conditioning, etc. 3. Slag Processing uses
PUBLISHED DATA SOURCE CHARACTERIZATIONS
A total of 2,329,630 kkgs (2,568,500 tons) of ferroalloys were produced in 1967, using 11,206 million kw-hrs. of electric energy according to the 1967 Census of Manufacture§ Of the total energy used, 3,354 million kw-hrs. were generated by ferroalloy plants. Assuming miscellaneous losses and other uses of 15 percent, an average use of 4,089 kw-hrs. per kkg (3,709 kw~hrs. per ton of alloy in terms of furnace power is indicated.
Total water intake for s.1.c. 3313 plants was 1128.7 X 109 liters (298.2 X 10⁹ gals.) per year according to the 1~7 Census of Manufactures while gross water use was 1212.3 X 109 liters (320.3 X 10⁹ gals.). Intake for cooling was 381.5 X 10⁹ liters (100.8 X \09 gals.). Assuming that all water recirculation and reuse was for cooling, cooling water use was 465.2 X 10⁹ liters (122.9 X 10⁹ gals.) Cooling water use of 199,679 liters per kkg (47,849 gal. per short ton) of alloy, or 48.8 liters (12.9 gals.) per kw-hrs. of furnace power is indicated.
The 1967 Census of Manufactures indicates a water use of 701.4 X 10⁹ liters~-(l85.3 X 109 gals.)~of water in generating the aforementioned 3,354 miLlion kw-hrs. of electric energy in-plant. ~he indicated use of 208.9 liters (55.2 gals.) per kw-hrs. is about equal to the 1964 thermal electric power plant use of 215 liters (56.8 gals.) per kw-hr. (Final Report, EPA Contract 68-01-0196). Assuming losses and other uses at 15 percent, a water use of 245.6 liters (64.9 gals.) per kw-hr. of furnace power is indicated for in-plant power generation.
The 1967 census data indicate a use of 40.9 X 10⁹ liters (10.8 x 10⁹ gal.) per year for sanitary, boiler feed, air conditioning, and other minor uses and plant employment of 8,700. At 378.5 liters (100 gals.) per capita per day, 250 days per employee per year, sanitary use would have been 825 X 106 liters (218 X 106 gals.) per year; air conditioning
51

use was 757 X 106 liters (200 X 106 gals.) per year. These uses total 4.28 liters (1.13 gals.) per kw-hr. of furnace power, assuming losses and other uses at 15 percent.
Person's data (5) indicate the water use in high energy scrubbers on open furnaces as 113.6 l/sec (1,800 gpm) for each of three furnaces producing FeCrSi, SiMn, and HC FeCr and rated at 25, 30 and 30 mw, respectively. At an assumed operating load of 75% with 95% operating time, the indicated water use is 1,226,340 liters (324,000 gals.) per 60.6 mw-hrs., or 20,238 liters (5,347 gals.) per mw-hr. of furnace power.
Person's data further indicated an average use of 5.5 l/sec (87.5 gpm) for a high energy scrubber on a semi-closed 45 mw 50% Fesi furnace. At 95% operating time and 75% operating load, the indicated water use is 620.7 liters (164 gals.) per mw-hr. of furnace power.
According to Retelsdorf, et.al. (6) an electrcstatic precipitator installed on a 20 mw f errochromesilicon furnace uses water in a spray tower preceeding the precipitator at the rate of about 9,084 liters (2,400 gals.) per hour. This indicates a use of 635.9 liters (168 gals.) per mw-hr. of furnace power at 95% operating time and 75% operating load. About 10-15 % of the water used is discharged from the bottom of the spray tower, the remainder being evaporated into the gas stream. These data indicate about 556.4 liters (147 gals.) of water per mw-hr. of furnace power evaporated in the gas stream.
From the above data and those given in section III, some limited calculations of waste characteristics may be made.
Assuming that 556 liters (147 gals.) of water per mw-hr. of furnace power is evaporated in the gas streams from open furnaces using wet air polluticn control devices and that such evaporation in the case of covered furnaces is in proportion to the gas volume, the effluent volumes expected would be as follows:
High energy scrubbers (open furnace) = 19,682 l/mw-hr (5200 gal/mw-hr)
High· energy scrubbers (covered furnace) = 609 l/mw-hr (161 gal/ mw-hr)
Electrostatic precipitator = 79.5 l/mw-hr (21 gal/mw-hr)
On the basis of the data given in Section III on production processes, compositions of raw materials, and compositions of products and byproducts, the following constituents/parameters appear to be those potentially present in waste water:
52

Acidity Alkalinity Aluminum Ammonia Barium B. O. D. Calcium Chromates Chromium
columbium Cyanide Dissolved Solids Iron Magnesium Manganese Molybdenum pH Phosphates
Potassium Radioactivity Silica Sulfates suspended Solids Temperature Titanium Vanadium Zirconium
WASTE CHARACTERIZATIONS FROM DISCHARGE PERMIT DATA
waste constituents/parameters listed as present in discharge permit applications for the plants in s.I.c. 3313 are as follows:
Algicides Aluminum Ammonia Barium Boron Calcium Chloride Chromium Colo.r copper
Fluorides Hardness Iron Magnesium Manganese Nickel Nitrate Oil and Grease Organic N Phosphorous
Sodium Solids Sulfate Sulfide sulfite surfactants Titanium Turbidity Zinc
Additionally, pH and temperature are given as waste parameters.
WAS'IE CHARAC~ERIZA~IONS FROM PLANT SURVEY DATA
waste characteristics were determined where possible from the plant survey data for various specific waste-producing sources. These data, of course, apply to the particular units operating as they were during the sampling period and represent the type of result to be expected during the actual operation. To the extent possible, reasons for variations are explained.
WASTE CHARACTERIZATION - OPEN ELECTRIC FURNACES WITH WET AIR POLLUTION CON'IROL DEV.J:CES
The data from Plant D provides raw waste loads for open submerged arc furnaces in which the off-gases are scrubbed with steam/hot water scrutbers as shown in Table 21.
53

Tacle 21. RAW WASTE LOADS-OPEN CHROMIUM ALLOY AND FERROSILICON FURNACES WITH STEAM/HOT WATER SCRUBBERS
---~--------------.,.------------
Constituent .=.,;;;;;.-...;;;__ __
sus~ended Solids Manganese Cr, total Cr, hex.
Flow
kg/mwhr 8. 2 ,
.005
.003
.002
l/mwhr
2,691
lbs/mwhr 18.l
0 .010 0.007 0.004
9als/mwhr
711
The data from Plant E provide an additional raw waste load for an open electric furnace using a venturi scrubber, as shown in '!able 22.
Table 22. RAW WAS'IE LOAD - HIGH ENERGY SCRUBBER ON OPEN ELECTRIC FURNACE
constituent suspended Solids Manganese Chrorrium {Total)
Flow
_]sg/mwhr 23. 74 10.06 0.002
6,382
------------------~
_lb/mwhr 52.29 22.15 0.005
qals/mwhr
1,686
The data from Plant G providing raw waste loads for c~en submerged arc furnaces in which the off-gases are conditioned in a spray tower preceding an electrostatic precipitator are shown in Table 23.
54

Table 23. RAW WAS7E LOADS-OPEN CHROMIUM ALLOY FURNACES WITH ELECTROSTATIC PRECIPITA~ORS
constituent
suspended Solids Manganese Chromium, total
Flow
kg/~
.289
.0012 • 0016
84.0
lbs/mwhi:
0.636 0.0026 0.0036
gals/mwhr
22.2
Although the data as given in Table 23 for water flew agrees quite well with that predicted (84.0 vs 79.5 l/mwhr) (22.2 vs 21 gal/mwhr), and the flow rate from the steam/hot water scrubbers cannot be compared with anything, the values for flow from the high energy scrubber are about one-third of that predicted. However, the flow frcm the high energy scrutber does not take into account recirculation of the scrubber water which is done at the scrubber prior to clarification and which may account for the difference.
WASTE CHARACTERIZATION-COVERED ELECTRIC FURNACES WITH WET AIR POLLUTION CONTROL CEVICES
The data from Plant B provides information on the waste water from disintegrator scrubbers operating on covered furnaces producing silicon alloys. Raw waste loads of suspended solids and cyanides are given in Table 24 on the basis of the furnace power during the 16-hour sampling periods.
55

Table 24. RAW WASTE LCADS FOR COVERED FURNACES WITH DISINTEGRATOR SCRUBBERS
SiMnZr 75% FeSi 50% FeSi 75% FeSi
20.1 39.2 5.1 6.8
44.3 86.3 11.3 15.0
~£yanides __ Flow ~SL~ lts/mwhr -i/inw!g: qal{mwhr
.0338
.0001
.0139
.0745
.0002 • 0307
8270 8967 8823 7562
2185 2369 2331 1998
The data for the second furnace in Table 24 protably represent reliable data, since at 75% particulate removal efficiency the suspended solids load is somewhat higher than are given in the EPA air pollution study (Ref. 32) data. The remaining data in Table 24 indicate suspended solids loads much lower than would be expected from the air emissions data. This could have either occurred due to poor functioning of the scrubbers (as evidenced by the lower temperature of the effluent water and observations of visible stack emissions, sometimes very heavy). Another possitle explanation is that the samples may have been taken in a region where water sprays are used to suppress foaming, and could, therefore, have been diluted.
The data from Plant c provides raw waste load data for a sealed silicomanganese furnace where the off-gases are scrubbed in a spray tower and a disintegrator scrubber. These data are shown in Table 25.
56

Table 25. RAW WASTE LOACS-SEALED SILICOMANGANESE FURNACE WI'IH DISIN'IEGRATOR SCRUEBER
suspended solids Phenol Cyanide, total Cyanide, free Chromium, total Manganese
Flew
kg/mwhr
16.6 .009 .044 .011 .0004
4.858
~bL
10,863
lb/mwhr -36.6
.019
.098
.024 0.001
10.70
'{als/mwhr
2,870
The data from Plant E also ~rovide data on scrubber raw waste water loads from covered furnaces equipped with high energy and disintegrator scrul::bers.
Table 26. RAW WASTE LCAD-COVERED FURNACES WITH SCRUEEERS
Constituent -- ~~
susp. Solids Phenol Cyanide (Total) Manganese Chromium (Total)
Flew
4.01 0.002 0.007 0.016 0.002
9,746
--lbs/mwhr
8.83 0.004 0.015 0.034 0.004
The data from aluminothermic treated in a 'Iable 27.
Plant H provide data on the raw waste loads from ~roduction of chromium alloys in which the off-gases are combination wet scrubber and baghouse and are given in
57

Table 27. RAW WASTE LCACS-ALUMINOTHERMIC SMELTING WITH COMBINA~ION WET SCRUBBERS AND BAGHOUSE
----___ constituent
suspended Solids Phenol Cyanide (Total) Cyanide (Free) Manganese Chrorr.ium (Total) Chromium (Hex.)
Flow
kg/kkg
3.6 0 0 0 0.0005 2.98 0.95
l/kkg
26, 332
lbilln
7.1 0 0 0 0.001 5.95 1.90
gals/ten
6,310
----Since open furnaces produce greater volumes of gas than do covered furnaces, and since water usage in wet scrubbers is generally a function of gas volume treated, it was expected that open furnace scrubbers would have higher water usages than covered furnace scrubbers. Contrary to expectations, the covered furnaces which were surveyed had water uses higher than those of open furnaces using high energy scrubbers. This may te because water use in disintegrator scrubbers is higher, for a particular gas volume, than the water use in high energy scrubbers. Most of the covered furnaces surveyed used disintegrator, rather than high energy scrubbers. However, one furnace at Plant E was equipped with a high energy scrubber, and the water use on that equalled 9572 l/mwhr {2529 gal/mwhr), so it would seem that this ex~lanation may not always be valid.
WASTE CHARACTERIZATION - SLAG PROCESSING
The data from Plant E provides information on the raw waste loads from slag processing operations. That from slag concentrating is shown in Table 28.
58

Table 28. RAW WASTE LOADS-SLAG CONCENTRATION PROCESS
~~~~constituent
suspended Solids Manganese Chrorr,ium, (Total)
Flow
kg/kkg
46.0 .245 .109
l/kkg
91.9 .489 .217
gals/ton ... 12.750
No raw waste load can te calculated directly for the slag shotting process, since tonnage figures were not given. However. an estimate for tonnage can be made from production figures. The charge to alloy ratio is 3:1 for HC FeMn, meaning that three tons of charge materials are required to produce one ton of alloy. Assuming no losses, this means that two tons of slag and particulates are produced for every ton of alloy. The emission factor for HC FeMn is 335 lb/ton product, so the slag produced is two tons minus 335 lbs = 3665 lb/ton alloy. This figure times operating load divided by the electrical energy required per ton of alloy gives us an hourly production figure for slag of 24.452 lb/hr. This divided into the water flow rate gives a water use of a.sea gal/ton processed, a suspended solids raw waste load of 15.5 lb/ton, and a manganese lead of 3.87 lb/ton.
59


SECTION VI
SELECTION OF POLLUTANT PARAME'IERS
Pollutant parameters have been selected by industry categories on the basis of those which originate in the production processes in significant amounts and for which control and treatment technologies are reasonably available. The parameters for each category have also been sel~ted so as to be the minimum number which will insure control. The pollutant parameters selected are shown by category in Table 29.
Table 29. POLLU'IANT PARAMETERS FOR INDUSTRY CATEGORIES
~--~-~~~~~~-~~------------·
Parameters
suspended solids pH Total Chromium Hexavalent Chromium Total Cyanide Manganese Phenol
Industry £~teqory
x x x x x x x x x x x
x x x x
x ---- - ....
Although effluent flow volumes are not specified in the recommended guidelines, its measurement and control is implicit in attaining the pollutant effluent loads specified. Flow, of course, is a tasic parameter in that its magnitude indicates the degree of recirculation and reuse practiced and the degree to which water conservation is utilized. Additionally, flow measurements ~ill be necessary for calculating treated waste loads for monitoring purposes.
Oil is not here considered as a parameter because it was found in lower concentrations in the raw waste than were allowable by the proposed guidelines. Additionally, oil is not associated with the process itself, but only appears as leaks from machinery, etc. At the levels detectable by the NPDES test methods, oil would be visible as a light sheen, and the plant would realize that there was an oil leakage somewhere.
suspended solids are frimary pollutants resulting from wet air pollution control devices and slag processing. suspended solids concentrations may range up to 7600 mg/l. The pH determination in conjunction with metals determinations indicates that excessive free acidity or
61
t

alkalinity has been neutralized after precipitation, or cyanide destruction.
chromate reduction and
Chromium, manganese, iron, zinc, and aluminum are the principal metals originating in the production processes. Manganese concentrations may be as high as 1576 mg/l, while the maximum chromium concentrations found were 8.36 mg/l from an electrostatic precipitator spray tower and 121 mg/l from an exothermic chromium smelting operation. Hexavalent chromium is additionally included because it may be harmful at low levels.
Cyanide is not oxidized in the reducing atmospheres of covered furnaces and appears in the waste water. It must be considered in view of the potential danger as ~ith hexavalent chromium.
Phenols evidently originate from electrode binding materials and are considered because of the taste-and-odor producing potential of even low concentrations of such compounds. They principally appear in the waste water from covered furnaces, although very small quantities may be present in that from open furnaces. It would seem that phenols are oxidized in open furnaces, but not in the reducing atmosphere of covered furnaces. Because they are evidently oxidized in open furnaces, phenols are not considered as a pollutant parameter for category I.
Phosphate was originally considered as a pollutant parameter because it was present in some quantity in the wastewaters at a few plants. Examination of the data base for this pollutant, however, convinces us that it is generally present in fairly low concentrations in the raw waste, and drops out during treatment (even the rudimentary treatment given at some plants) to levels allowable by the proposed guidelines. Therefore, phosphate was dropped as a parameter after consideration of the costs of monitoring for a pollutant which will probably never exceed the guidelines.
The pollutant parameters chosen have been those which appeared in significant concentrations from the sampling and analysis conducted during the plant surveys, and are those parameters amenable to control. Other parameters such as dissolved solids, chlorides and sulfates appear in effluents, but largely result from neutralization, softener regeneration, and water reuse; they are thus a result of treatment and there would be no logic in attempting to set limits. Many of the metals contained in the raw waste, particularly iron, zinc, aluminum, and lead are part of the solids generated in the smelting furnaces. Plant survey data indicates that they are controlled if suspended solids concentrations are controlled.
Envi.!.Q.!!illfil!tal Im~£1_2.t_Pollutant Parameters
The following is a discussion of the environmental impacts of the pollutant parameters selected for regulation:
62
•

§Yspenged §Qlids
suspended solids include both organic and inorganic materials. The inorganic components include sand, silt, and clay. The organic fraction includes such materials as grease, oil, tar, animal and vegetable fats, various fibers, sawdust, hair, and various materials from sewers. These solids may settle out rapidly and bottom deposits are often a mixture of both organic and inorganic solids. They adversely affect fisheries by covering the bottom of the stream or lake with a blanket of material that destroys the fish-food bottom fauna or the spawning ground of fish.
In raw water sources for domestic use, state and regional agencies generally specify that suspended solids in streams shall not be present in sufficient concentration to be objectionable or to interfere with normal treatment processes. suspended solids in water may interfere with many industrial processes, and cause foaming in boilers, or encrustations on equipment exposed to water, especially as the temperature rises. Suspended solids are undesirable in water for textile industries; paper and pulp; beverages; dairy products; laundries; dyeing; photography; cooling systems, and power plants. suspended particles also serve as a transport mechanism for pesticides and other substances which are readily sorbed into or onto clay particles.
Solids may be suspended in water for a time, and then settle to the bed of the stream or lake. These settleable solids discharged with man's wastes may be inert, slowly biodegradable materials, or rapidly decomposable substances. While in suspension, they increase the turbidity of the water, reduce light penetration and impair the photosynthetic activity of aquatic plants.
Solids in suspension are aesthetically displeasing. When they settle to form sludge deposits on the stream or lake bed, they are often much more damaging to the life in water, and they retain the capacity to displease the senses. Solids, when transformed to sludge deposits, may do a variety of damaging things, including blanketing the stream or lake bed and thereby destroying the living Sfaces for those benthic organisms that would otherwise occupy the habitat.
Turbidity is principally a measure of the light abscrbing properties of suspended solids. It is frequently used as a substitute method of quickly estimating the total suspended solids when the concentration is relatively low.
The term pH is a logarithmic expression of the concentration of hydrogen ions. At a pH of 7, the hydrogen and hydroxyl ion concentrations are essentially equal and the water is neutral. Lower pH values indicate acidity while higher values indicate alkalinity. ~he relationship
63

between pH and acidity or alkalinity is not necessarily linear or direct.
Waters with a pH below 6.0 are corrosive to water works structures, distribution lines, and household plumbing fixtures and can thus add such constituents to drinking water as iron, copper, zinc, cadmium and lead. The hydrogen ion concentration can affect the "taste" of the water. At a low pH water tastes "sour11 • The bactericidal effect of chlorine is weakened as the pH increases, and it is advantageous to keep the pH close to 7. This is very significant for providing safe drinking water.
Extremes of pH or rapid pH changes can exert stress conditions or kill aquatic life outright. Dead fish, associated algal blooms, and foul stenches are aesthetic liabilities of any waterway. Even moderate changes from "acceptable" criteria limits of pH are deleterious to some species. The relative toxicity to aquatic life of many materials is increased by changes in the water pH. Metallocyanide complexes can increase a thousand-fold in toxicity with a drop of 1.5 pH units. The availability of many nutrient substances varies with the alkalinity and acidity.
The lacrimal fluid of the human eye has a pH of approximately 7.0 and a deviation of 0.1 pH unit from the norm may result in eye irritation for the swimmer. Appreciable irritation will cause severe pain.
Phenols ~-
Many phenolic ccmpounds are more toxic than pure phenol; their toxicity varies with the combinations and general nature of total wastes. The effect of combinations of different phenolic compounds is cumulative.
Phenols and phenolic compounds are both acutely and chronically toxic to fish and other aquatic animals. Also, chlorophenols produce an unpleasant taste in fish flesh that destroys their recreational and commercial value.
It is necessary to limit phenolic compounds in raw water used for drinking water supplies, as conventional treatment methods used by water supply facilities do not remove phenols. The ingestion of concentrated solutions of phenols will result in severe pain, renal irritation, shock and ~ossibly death.
Phenols also reduce the utility of water for certain industrial uses, notably food and beverage processing, where it creates unpleasant tastes and odors in the product.
64
•

Cyanides in water derive their toxicity primarily from undissolved hydrogen cyanide (HCN) rather than from the cyanide ion (CN-) • HCN dissociates in water into H+ and CN- in a pH-dependent reaction. At a pH of 7 or below, less than 1 percent of the cyanide is present as CN-; at a pH of 8, 6.7 percent; at a pH of 9, 42 percent; and at a pH of 10, 87 percent of the cyanide is dissociated. The toxicity of cyanides is also increased by increases in temperature and reductions in oxygen tensions. A temperature rise of lO•c produced a two- to threefold increase in the rate of the lethal action of cyanide.
cyanide has been shown to be poisonous to humans, and amounts over 18 ppm can have adverse effects. A single dose of about 50-60 mg is reported to be fatal.
Trout and other aquatic organisms are extremely sensitive to cyanide. Amounts as small as .1 part per million can kill them. Certain metals, such as nickel, may complex ~ith cyanide to reduce lethality especially at higher pH values, but zinc and cadmium cyanide complexes are exceedingly toxic.
When fish are poisoned by cyanide, the gil~s become considerably brighter in color than those of normal fish, owing to the inhibition by cyanide of the oxidase responsible for oxygen transfer from the blood to the tissues.
Chromium
Chromium, in its various valence states, is hazardous tc man. It can produce lung tumors when inhaled and induces skin sensitizations. Large doses of chromates have corrosive effects on the intestinal tract and can cause inflammation of the kidneys. Levels of chromate ions that have no effect on man appear to be so low as to prohibit determination to date.
The toxicity of chromium salts toward aquatic life varies widely with the species, temperature, pH, valence of the chromium, and synergistic or antagonistic effects, especially that of hardness. Fish are relatively tolerant of chromium salts, but fish food organisms and other lower forms of aquatic life are extremely sensitive. Chromium also inhibits the growth of algae.
In some agricultural crops, chromium can cause reduced growth or death of the crop. Adverse effects of low concentrations of chromium on corn, tobacco and sugar beets have been documented.
Manganese (
65
The presence of manganese may interfere with water usage. since manganese stains materials, especially when the pH is raised as in laundering. scouring, or other washing operations. These stains. if not masked by iron. may be dirty brown, gray or black in color and usually occur in spots and streaks. Waters containing manganous bicarbonate cannot be used in the textile industries. in dyeing, tanning, laundering, or in hosts of other industrial uses. In the pulp and paper industry, waters containing above 0.05 ppm manganese cannot be tolerated except for low-grade products. Very small amounts of manganese--0.2 to 0.3 ppm--may form heavy encrustations in piping, while even smaller amounts may form noticeable black deposits.
66

SECTION VII
CONTROL AND TREATMENT TECHNOLOGY
The water pollution control and treatment technology used in the ferroalloy industry has generally been sedimentation in lagoons. some of which are very large. The 8 plants which were surveyed in the course of the present study cover the full range of processes used in the industry and the various levels of control and treatment technology.
By far the most serious pollution problem to the industry has been that of air pollution. Air pollution abatement has been a major concern of the industry and has involved most of the expenditures for pollution control. Air pollution control systems installed. being built. or planned are generally capable of meeting existing state regulations; in cases where controls have been installed for 5 years or more. such controls were adequate to meet then-existing regulations, but may be marginal insofar as newer regulations are concerned.
The plants surveyed are classified in Table 30 in terms of the industry categorization given previously.
Table 30. CHARACTERISTICS OF SURVEYED PLANTS
category
A
B II
c II
D I
E I,II,III
F
G I.III
H II
The treatment and waste water may parameters:
be
Processes and water uses and Air coutrol~
Baghouses being built, recirculated cooling water Disintegrator scrubbers, once-through cooling water use Sealed furnace, disintegrator scrubbers, recirculated cooling water and scrubber water Stearn/hot water scrubbers. recirculation of cooling and scrubber water Cisintegrator scrubbers, venturi scrubbers, once-through water use, slag processing Baghouse/no air controls, recirculated cooling water Electrostatic precipitators with water sprays. recirculated cooling water, slag processing Exothermic process, wet scrubbers and baghouse
control technologies available for this industry's grouped as follows for the principal waste
67

Suspended Solids: Water recirculation, lagoons, clarif ier-flocculators, sand filters
pH: Neutralization
Chromium: Hexavalent chromium reduction, precipitation, sedimentation
Cyanide: Alkaline chlorination, ozonation
Manganese: Neutralization of acid salts, precipitation, sedimentation
Phenol: Biological oxidation, breakpoint chlorination, activated carbon
Water recirculation can be used to initially reduce the volume of water to be treated for suspended solids removal. Lagoons and clarifierflocculators can achieve effluent concentrations cf 25 mg/l, when well operated. Lagoons are less expensive in capital and operating costs, but require much more land area. Sand filters achieve effluent concentrations of 10-15 mg/l and are little more expensive than clarif ier-f locculators.
Neutralization is, of course, simply a matter of adding an acid or a base to achieve a neutral pH. 'Ihis is most efficiently done with chemical feed pumps controlled by a pH instrument. A caustic or sulfuric acid solution can be used and pH controlled to ~ithin !0.2 of the desired pH.
Hexavalent chromium is reduced almost instantaneously at pH levels below 2.s by sulfur dioxide. 'Ihe pH is then raised with lime to about pH &.2 and the reduced chromium is settled out. With proper operation, the hexavalent chromium should be completely reduced. The effluent concentration of total chromium depends upon good pH control and adequate sedimentation. Cyanide is oxidized rapidly to the less harmful form of cyanate at a pH of 10.S by alkaline chlorination. Cyanate is oxidized to C01 and N1 by continued chlorination at a pH of about 7.0 and a reaction time of about 60 minutes. ozonation is an alternate method for the destruction of cyanide.
Manganese and iron, to the extent they are removed by neutralization of the manganese and above about 8 for iron. and sedimentation. Ferrous hydroxide, precipitate which settles slowly. sedimentation, and oxidation is concentrations.
are present as dissolved salts, acid salts, at a pH above 9.5 for This is followed by precipitation in particular, forms a gelatinous Sufficiently high pH, adequate
required for low effluent
Phenol can be oxidized biologically or chemically ty chlorine dioxide (Ref. 34). Chlorine dioxide must. generated on-site. Phenol can also be removed by
chlorine and of course, be
absorption on
68

activated carbon. Biological oxidation may be industry with its generally low BOD levels, although nutrients are added. Activated carbon absorption is treatment technique, as is breakpoint chlorination.
unfeasible for this it may be usable if also possible as a
The treatment ~recesses discussed here are conventional. There does not appear to be any particular need for more advanced treatment methods. The main problems are the reduction of waste water volumes requiring treatment to the minimum, design of adequately sized facilities (particularly for suspended solids removal), proper operation (preferably with instrumental control) , and operator training.
The choice of air pollution control technology is of importance in affecting waste water volumes. Most open furnaces are utilizing dry baghouses and, of course, produce no waste water effluent from this source.
There are only two known examples in the world of dry dust collectors being used on sealed or covered furnaces, neither of which is in the United States. The vast majority of covered furnaces use wet scrubbers; few open furnaces use wet systems. Some operations (such as exothermic) may require the use of such novel air systems as a wet baghouse.
Where a dash is shown under net concentration in Tables 31-89, except for those tables for intake water, no analysis was made for that parameter. Where a zero is sho~n under net concentration, but the maximum, minimum and average concentrations are represented by dashes, the parameter concentrations found were below the detectable limit for that parameter. In ether cases where the net concentration is zero, it is because the average concentration is the same as or less than that of the intake water.
The test methods used for the constituents of the waters are as follows: pH - Standard Method No. 221, Aluminum, Chromium, Iron (Total), Lead, Manganese, and Zinc standard Method No. 129 (Atomic Absorption), Cyanide - Standard Method Nos. 207A, 207c, Phenol - Standard Method Nos. 222A, 222B and 2220, Phosphate - Standard Method No. 223E, and suspended Solids ~ Standard Method No. 148C. With the exception of the test procedure for suspended solids, the tests used are identical with those specified for use for monitoring under the NPDES system (38 c.F.R., Part 136). The test for suspended solids gives results within the experimental error of the NPDES test method. •standard Method• refers to methods contained in "Standard Methods for Examination of Water and Wastewater," Thirteenth Edition, 1971, American Public Health Association.
69

PLANT A
This plant was built in 1952 with five 10 mw submerged-arc open furnaces; at the time of our visit. three of these furnaces were still operating. A 35 mw furnace was built in 1968, and a 20 mw furnace is currently under construction. The large furnace produces 50-85 percent FeSi. The other furnaces produce 50 percent Fesi. proprietary silicon tase alloys, and a rare earth silicide. Chromium alloys have been produced in the past. No wet air pollution controls are used; baghouses are being installed. The water use system is as shown in Figure 7.
All plant water is supplied from wells and the furnace cooling water is recirculated. The No. l cooling tower was built in 1952 and serves the three 10 mw furnaces. It is being automated and modified to include softeners and strainers, similar to the No. 2 cooling tower. The No. 2 cooling tower was built in 1968 to serve the 35 mw furnace. Proprietary treatment chemicals and sulfuric acid are used in each system. Blowdown from the Ne. l tower is manual and from No. 2 tower is automatically controlled by total solids levels. A softener is used in the No. 2 tower system with bulk salt used as a regenerant. Recirculated flow in the No. 1 tower system is 227 l/sec (3600 gpm} and can be increased to 341 l/sec (5400 gpm) if required by cooling neec;. Recirculation flow in the No. 2 tower system is 284 l/sec (4500 gpm). The total furnace power during the sampling period was 48.l mw. The cooling water use was thus 38.2 liters (10.l gals.) per kwhr. Other furnaces exist in the plant, but have not been recently operated, and there are no plans to reactivate them. The treatment facilities consist only of a settling lagoon insofar as removal of constituents from the cooling tower blowdown and miscellaneous yard drainage is concerned.
A storm sewer had been installed to by-pass storm run off originating in the hills behind the plant. This has reduced the wet weather flow through the treatment lagoon.
Summarized data from the plant survey are shown for various sampling points as designated in Figure 7 in Tables 31 through 35. The temperature drop across cooling tower No. 1 was determined to be 6.7•c (120F) • The operating power on the furnaces served by this tower during the sampling period was 21.9 mw.
70

-...J ......
FCE.
STRAINER BACKWASH
STORY SEWER
Figure 7. PLANT A WATER ANO WASTEWATER SYSTEMS
DRAINAGE
FURNACE CONDENSATE
WATER
YARD DRAINAGE
LAB08ATORY DRAINAGE
YARD DRAINAGE
FCE
COOLING TOWER
SEPTIC SYSTEM
OVERFLOW
FCE
VARIES
TO .--:R~l~V~E':"'R __ _... ________ ,._ __________ _. B '------'LAGOON
FCE

Table 31 ANALYTICAL DATA -SPA- PLANT A LAGOON INFLUENT
Constituent
Suspended Solids Total Chromium Hexavalent Chromium Total Cyanide Free Cyanide Manganese Oil Iron Zinc Aluminum Phenol Phosphate Lead pH (units)
Concentrations, mg/l (except as noted) Minimum Maximum Average Net Average
50 0.01
1. 08 1. 8 0.99 0.07 0.33 0.07 1. 29
5.4
440 0.01
1. 08 6.4 1. 78 0.07 0.33 1. 00 3.09
7.6
183 0.01
1.08 4.3 1.39 0.07 0.33 0.40 2.42
6.7
170 0.01
0 0 0.76 3.5 1.36 0.03 0.33 0.06 2.34 0
lwerage Flow = 6. 7 l/sec. ( 106 gpm)
Table 32
Constituents
Suspended Solids Total Chromium Hexavalent Chromium Total Cyanide Free Cyanide Manganese Oil Iron Zinc Aluminum Phenol Phosphate Lead pH (units)
ANALYTICAL DATA -SP E - PLANT A LAGOON EFFLUENT
Concentrations, mg/l (except as noted) Minimum Maximum Average Net Average
20
0.91 1. 4 1. 71 0.05
0.34 1. 01
5.7
440 0.01
1.15 58.6
2.06 0.06
0.71 1. 35
7.6
73
1.07 25.9 1. 85 0.05
0.49 1.12
7.0
60 0 0 0 0 0.75
25.1 1.82 0.01 0 0.15 1.04 0
Average Flow = 6.7 l/sec. ( 106 gpm) Average Temperature =13.3°C (56 °F)
72

Table 33 ANALYTICAL DATA -SPC- PLANT A COOLING TOWER #2
Concentrations, mg/l (except as noted) Constituent Minimum Maximum Average Net Average
Suspended Solids Total Chromium Hexavalent Chromium Total Cyanide Free Cyanide Manganese Oil Iron Zinc Aluminum Phenol Phosphate Lead pH (units)
Average Flow =
34
0.32 0.4 0.23 0.03
0.04 5.26
6.9
38
0.32 1.0 0.36 0.08
0.57 5.79
7.8
l/sec. (
36
0.32 0.7 0.30 0.05
0.22 5.47
7.3
gpl'T1)
23 0 0 0 0 0 0 0.27 0.01 0 0 5.39 0
Table 34 ANALYTICAL DATA -SP D - PLANT A COOLING TOWER #1
Constituents Concentrations, ms/l (exce~t as noted) Minimum Maximum Average Net Average
Suspended Solids 14 500 183 170 Total Chromium 0 Hexavalent Chromium 0 Total Cyanide 0 Free Cyanide 0 Manganese 0.53 0.53 0.53 0.21 Oil 0.4 0.8 0.6 0 Iron 0.34 0.38 0.36 0.33 Zinc 0.03 0.055 0.039 0 Aluminum 0 Phenol 0.07 0.57 0.31 0 Phosphate 4.47 5.26 4.83 4.75 Lead 0 pH (units) 6.6 8. 3 7.4
Average Flow= 1.55 l/sec. ( 24.6 gpm) Average Temperature =15.6°C (60 °F)
73

Table 35
Constituent
Suspended Solids Total Chromium Hexavalent Chromium Total Cyanide Free Cyanide Manganese Oil Iron Zinc Aluminum Phenol Phosphate Lead pH (units)
ANALYTICAL DATA -SPE- PLANT A WELL WATER
Concentrations, mg/l (except as noted) Minimum Maximum Average Net Average
8 16 13
0.32 0.32 0.32 0.6 1. 0 0.8
0.06 0.03 0.022 0.07 0.044
0.30 0.41 0.34 0.14 0.08
6. 9 7.7 7.3
Average Flow = l/sec. ( gpm)
Table 36
Constituents
Suspended Solids Total Chromium Hexavalent Chromium Total Cyanide Free Cyanide Manganese Oil Iron Zinc Aluminum Phenol Phosphate Lead pH (units)
ANALYTICAL DATA -SP A - PLANT B INTAKE WATER
Concentrations, rng/l (except as noted) Minimum Maximum Average Net Average
4
0.018 0.4 1. 31 0.02
0.23
6.5
38
0.016
0.018 1. 5 1. 37 0.02
0.23
7.7
20
0.005
0.018 0.8 1. 34 0.02
0.23
6.9
Average Flow = 353 l/sec. (5,600 gpm)
74

PLANT E
This plant has been operating since 1939 and has four covered submergedarc furnaces producing 50 percent ferrosilicon, 75 percent ferrosilicon and silicon-manganese-zirconium (SMZ) • These furnaces have a total rating of 71.0 mw and operated during the plant survey period at 54.3 mw. The water and waste water system for the plant is shown in Figure 8.
The four covered furnaces use cooling water on a once-tbrough basis and the sewage by the 350 employees is treated at an on-site plant. The total effluent is 30,282 cu. m/day (8 mgd). Water is drawn from a surface source.
The fumes from the four furnaces are scrubbed using seven Buffalo Forge (disintegrator) scrubbers, each using 15.78 l/sec (250 gpm) of water. During the plant survey, one furnace had only one scrubber, each of the other furnaces had 2 scrubbers; a second scrubber was being installed on the first furnace. The scrubber water is combined at a lift station where lime and chlorine are added to oxidize the cyanides produced in the covered furnaces. The scrubber water then flows through 2 lagoons in series totaling 30.5 acres in area and providing 5-6 days retention. The flow then goes to a clarif locculator where lime and a flocculant are added for improved sedimentation. The clarif locculator underflow is returned to the first lagoon and the clariflocculator effluent is treated with chlorine, lime being added if necessary, to destroy residual cyanides. The clariflocculator overflow effluent then passes through 2 additional lagocns in series totaling 2.2 acres in area. The treated scrubber water is then combined with cooling water, sewage plant effluent, and yard drainage and flows through a final lagoon 0.25 acres in area. The cooling water temperature averages 8.33•c (lS•F) above ambient. (The plant states that the average temperature rise of the cooling water is 4-5.5oc (7-10•F)).
The total plant eff luerlt was determined by measurements over a rectangular weir and the sewage plant effluent was measured by bucket and stopwatch. The yard drainage flow was estimated. The furnace cooling water flow was determined by difference and checked by a calculated chloride balance. The discharge permit data for this plant indicated a cooling water flow of 378.6 l/sec (6,000 gpm) and recirculation of some of this water. There is no chloride buildup and a low temperature increment in this system. The plant states that there is no evaporation associated with recirculation, which is done to increase water velocity in cooling passages. This recirculation may account for some of the difference between discharge permit data and that found during the ~lant survey. In light of the low temperature increment, however, it is doubtful that 43 percent of the cooling water is recirculated and the flow obtained during the plant survey was judged to be correct.
75

The total operating loads on the furnaces during the sampling was 54.3 mw. summarized analytical data are shown for the sampling points as designated in Figure 8 in Tables 36 through 42.
76

Figure 8. PLANT B WATER AND WASTEWATER SYSTEMS
YARD DRAINAGE
SEWAGE TREATMENT PLANT
F
FURNACE COOUNG WATER
SETTLING LAGOON
0. 25 ACRES
D E' ECTR FOR INFLUENT 4-COVERE L IC COOLING WATER SUBMERGED ARC ------~--~-----~----~•A
FURNACES
7-WET SCRUBBERS
a _E~S!:!~~!_ _ _. DISPOSAL LAGOON __ _ OVERFLOW 2.5 ACRES I
-----
I I
LIFT STATION ,------------
LIME FLOCCULANT
DISPOSAL LAGOON C C LARIFLOCCULATOR 17 ACRES OVERFLOW --------
( HLO RINE --ei
pH CONTROL
ETTLING LAGOON SETTLING LAGOON ..... -----t I.I ACRES I.I ACRES

Table 37 ANALYTICAL DATA -SPB · PLANT B WET SCRUBBERS
Constituent
Suspended Solids Total Chromium Hexavalent Chromium Total Cyanide Free Cyanide Manganese Oil Iron Zinc Aluminum Phenol Phosphate Lead pH (units)
Concentrations, mg/l (except as noted) Minimum Maximum Average Net Average
968
1.18 0.20
15.9 2.4 6.1 1. 46 0.69 5.62 0.54 1. 43 6.2
2,242
3.28 1. 57
38.6 7.6 8.9 3.10 1. 29 9.05 2.25 1. 96 6.4
1,555
2.49 1.04
24.0 4.5 7.8 2.10 0.99 7.27 1.11 1.71 6.3
1,535 0 0 2.48 1.03
24.0 3.7 6.5 2.08 0.99 7.27 0.88 1. 71
Average Flow = 126 l/sec. (2,000 gpm)
Table 38 ANALYTICAL DATA -SPC - PLANT B THICKENER INLET
Constituents
Suspended Solids Total Chromium Hexavalent Chromium Total Cyanide Free Cyanide Manganese Oil Iron Zinc Aluminum Phenol Phosphate Lead pH (units)
Concentrations, mg/1 (except as noted) Minimum Maximum Average Net Average
70
0.15 0.15 2.58 0.6 0.79 0.94
0.43 0.45
6.3
96
0.36 0.36 2.97 2.2 1.14 1. 08 0.29 0.44 0.54
6.9
83
0.22 0.22 2.84 1. 2 0.95 1. 01 0.19 0.43 0.51
6.6
63
0 0.21 0.21 2.82 0.4 0 0.99 0.19 0.43 0.28 0
Average Flow = 126 l/sec. (2,000 gpm)
78

Table 39
Constituent
Suspended Solids Total Chromium Hexavalent Chromium Total Cyanide Free Cyanide Manganese Oil Iron Zinc Aluminum Phenol Phosphate Lead pH (units)
Average Flow =
Table 40
Constituents
Suspended Solids Total Chromium Hexavalent Chromium Total Cyanide Free Cyanide Manganese Oil Iron Zinc Aluminum Phenol Phosphate Lead pH (uni ts)
ANALYTICAL DATA -SPD- PLANT B THICKENER OVERFLOW
Concentrations, mg/l (except as noted) Minimum Maximum Average Net Average
8
0.15 0.15 0.88 1. 2 0.41 0.38
0.49 0.27
8.2
86 0.01
0.34 0.34 0.93 3.0 0.50 0.39
0.51 0.54 0.05 9.6
56
0.21 O.Jl 0.90 2.2 0.47 0.38
0.50 0.41 0.03 9.0
126 l/sec. (2,000 gpm)
ANALYTICAL DATA -SPB - PLANT B COOLING WATER
36 0 0 0.20 0.20 0.88 1. 4 0 0.36 0 0.50 0.18 0.03
Concentrations, mg/l (except as noted) Minimum Maximum Average Net Average
4
0.006
0.025 0.6 1.20 0.044 0.47
0.22
6.7
22
0.061
0.025 0.8 1.34 0.044 0.47
0.22
8.5
11
0.025
0.025 0.7 1.27 0.044 0.47
0.22
7.9
0 0 0 0.020 0 0.007 0 0
0.024 0.47 0 0 0
Average Flow= 217 1/sec. (3,440 gpm)
79

Table 41
Constituent
Suspended Solids Total Chromium Hexavalent Chromium Total Cyanide Free Cyanide Manganese Oil Iron Zinc Aluminum Phenol Phosphate Lead pH (uni ts)
ANALY~ICAL DATA -SPF- PLANT B SEWAGE PLANT EFFLUENT
Concentrations, mg/l (except as noted) Minimum Maximum Average Net Average
20 0.01
1. 52 1. 0 0.33 0.11 0.33
6.31
6.6
48 0.01
1. 52 2.6 1. 31 0.11 0.33
6.31
7. 6
32 0.01
1.52 2.0 0.82 0.11 0.33
6.31
7.2
12 0.01 0 0 0 1.50 1.2 0 0.09 0.33 0 6.08 0
Average Flow = 1.0 l/sec. ( 16 gprn)
Table 42
Constituents
Suspended Solids Total Chromium Hexavalent Chromium Total Cyanide Free Cyanide Manganese Oil Iron Zinc Aluminum Phenol Phosphate Lead pH (units)
ANALYTICAL DATA -SP G - PLANT B TOTAL PLANT DISCHARGE
Concentrations, rng/l (except as noted) Minimum Maximum Average Net Average
10 70 35 15 0.02 C.01 0.01
0.006 0.030 0.020 0.015 0.006 0.020 0.010 0.010 0.20 0.22 0.21 0.19 1. 0 2.6 1. 6 0.8 0.24 0.28 0.27 0 0.08 0.11 0.09 0.07 0.22 0.35 0.30 0.30 0.11 0.12 0.12 0.12 0.30 0.33 0.31 0.08
0 8.1 9.2 8.5
Average Flow = 350 l/sec. (5,556 gpm) Average Temperature =20.8°C (69.~F)
Bo

PLANT C
This plant was built in 1967 and has a single sealed furnace rated at 33 mw. The principal product is silicomangan~se.
The water use and waste treatment system is shown in Figure 9. The furnace off-gases are scrubbed in a spray tower and a low energy (Dingler) scrubber. Water is recycled and reused in both the scrubber system and the furnace cooling water system; the latter incorporates a cooling tower. Makeup for the scrubber system is attained from blowdown from the cooling water system. The scrubber effluent is treated with potassium permanganate to oxidize the cyanides and a f locculant aid to improve sedimentation in the thickener to which all of the scrubber water flows. The thickener overflow is recycled to the scrubbers and the underflow is treated in a series of 2 lagoons. 'Ihe effluent of these lagoons and the cooling tower blowdown are combined and flow through 2 additional lagoons in series. The sanitary sewage is treated in a package~type plant and allowed to settle in a small lagoon before being combined with the industrial waste water for discharge. The cooling tower recirculation rate is 163 l/sec (2580 gpm). The temperature drop across the cooling tower is 14°c (25.20F).
summarized analytical data are shown for the designated sampling points in ~ables 43 through 49.
81

CX> N
COOLING TOWER
Figure 9.
PLANT C WATER AND WASTEWATER SYSTEMS
BLOW B OWN LIFT s TA TION ----LA GOON----~---- LAGOON i---.::.:.:.:.;..;.;~~-...
MAKE
UP
REFUSE WATER TANK
FURNACE
POLYELECT ROLY TE
SCRUBBER
LAGOON
LAGOON
THICKENER
EMERGENCY OVERFLOW
ACTIVATED CARBON FILTERS
SANITARY SEWER
LIFT STATION
SANITARY TREATMENT
PLANT
CHLORINE
LAGOON

Table 43 ANALYTICAL DATA -SP ii- PLANT c WELL WATER
Constituent Concentrations, mg/l (except as noted) Minimum Maximum Average Net Average
Suspended Solids Total Chromium Hexavalent Chromium Total Cyanide Free Cyanide Manganese Oil Iron Zinc Aluminum Phenol Phosphate Lead pH (units)
0.013
0.51 0.021
6.9
2
0.017 0.4 0.51 0.029
7.5
1
0.016 0.2 0.51 0.026
7.2
Average Flow = 50.4 l/sec. (BOO gpro)
Table 44 ANALYTICAL DATA -SPD - PLANT C
COOLING TOWER BLOWDOWN
Constituents Concentrations, mg/l (except as noted) Minimum Maximum Average Net Average
Suspended Solids Total Chromium Hexavalent Chromium Total Cyanide Free Cyanide Manganese Oil Iron Zinc Aluminum Phenol Phosphate Lead pH (uni ts)
40
1. 37
49 0.6 0.51 3.32
0.14 0.28
7.6
50
3.81
56 1. 2 0.68 3.40
0.24 0.95
7.8
45
2.21
52 0.9 0.57 3.35
0.19 0.50
7.7
Average Flow = 3.1 l/sec. ( 49 gpm) Average Temperature = 36 °C (96.8 °F)
83
44 0 0 2.21
52 0.7 0.06 3.32
0.19 0.50

Table 4~
Constituent
Suspended Solids Total Chromium Hexavalent Chromium Total Cyanide Free Cyanide Manganese Oil Iron Zinc Aluminum Phenol Phosphate Lead pH (units)
ANALYTICAL DATA -SPE- PLANT C SEWAGE PLANT EFFLUENT
Concentrations, mg/l (except as noted) Minimum Maximum Average Net Average
2 8
3.5 fi • 3 1. 0 1. 6 0.42 0.47 0.181 0 .. lS l
0.04 0.29
5.2 7. 0
6
5.0 1. 3 0.44 0.181
0.17
6.1
5 0 0 0 0 5.0 1.1 0 0.155 0 0.17
0
Average Flow = O. 06 l/sec. Average Temperature= 19.3
1 gpm) °C (66.7 °F)
Table 50 ANALYTICAL '.JA'T'A -SP.F - PLANT C SLUDGE LAGOON F.FFLUEW;,
Concentrations, mg/l (except as noted) Constituents Minimum Maximum ~verage Net Average
Suspended Solids Total Chromium Hexavalent Chromium Total Cyanide Free Cyanide Manganese Oil Iron Zinc Aluminum Phenol Phosphate Lead pH (units)
Average Flow =
106
1. 85 0.32
65 1. 4 1.11 1. 93 9.4 0.15 1. 52
7.3
312
2.41 1. 08
97 2.4 1. 64 3.11
11. l 0.36 2.23 0.77 7.7
l/sec.
84
188
2.15 0.77
75.5 1. 9 1. 30 2.51
10.0 0.23 1. 82 0.50 7. 5
gpm)
187 0 0 2.15 0.77
75.5 1. 7 0.79 2.48
10.0 0.23 1. 82 0.50

Table .'..il
Constituent
Suspended Solids Total Chromium Hexavalent Chromium Total Cyanide Free Cyanide Manganese Oil Iron Zinc Aluminum Phenol Phosphate Lead pH (units)
ANALYTICAL DATA -SPG- PLANT C THICKENER OVERFLOW
Concentrations, mg/l (except as noted) Minimum Maximum Average Net Average
100
5.01 0.73
51 2. 8 0.27 1. 00 4.1 0.47 1. 02
7.2
252
6.48 1.12
82 4.0 0.43 2.80 9.4 0.86 4.0 0.80 7.7
181
5.60 0.90
71 3.4 El. 38 1. 73 6.2 0.64 2.05 0.49 7.5
180 0 0 5.60 0.90
71 3.2 0 1. 70 6.2 0.64 2.05 0.49
Average Flow= 67.71/sec. (1,075 gpm)
Table
Constituents
l . .J.c.
Suspended Solids Total Chromium Hexavalent Chromium Total Cyanide Free Cyanide Manganese Oil Iron Zinc Aluminum Phenol Phosphate Lead pH (units)
ANALYTICAL DATA -SPA - PLANT D WELL WATER
Concentrations, mq/l (except as noted) Minimum Maximum Average ~et Average
10
0.20
2.24 0.026
0.02
6.1
16
0.20
2.30 0.026
0.04
7.9
13
0.20
2.27 0.026
0.03
6.7
Average Flow = 16. 3 l/sec. ( 259 gpm)
85

Table 49 ANALYTICAL DATA -SPG- PLANT C THICKENER OVERFLOW
Concentrations, mg/l (exceEt as noted) Constituent Minimum Maximum Avera~e Net Avera~e
Suspended Solids 100 252 181 180 Total Chromium 0 Hexavalent Chromium 0 Total Cyanide 5.01 6.48 5.60 5.60 Free Cyanide 0.73 1.12 0.90 0.90 Manganese 51 82 71 71 Oil 2.8 4.0 3.4 3.2 Iron 0.27 0.43 e.38 0 Zinc 1. 00 2.80 1.73 1. 70 Aluminum 4.1 9.4 6.2 6.2 Phenol 0.47 0.86 0.64 0.64 Phosphate 1. 02 4.0 2.05 2.05 Lead 0.80 0.49 0.49 pH (units) 7.2 7.7 7.5
Average Flow = 67.71/sec. (1,075 gpm)
Table SO ANALYTICAL DATA -SP A - PLANT D WELL WATER
Constituents
Suspended Solids Total Chromium Hexavalent Chromium Total Cyanide Free Cyanide Manganese Oil Iron Zinc Aluminum Phenol Phosphate Lead pH (units)
Concentrations, mg/1 (except as noted) Minimum Maximum lwerage Net Average
10
0.20
2.24 0.026
0.02
6.1
16
0.20
2.30 0.026
0.04
7.9
13
0.20
2.27 0.026
0.03
6.7
Average Flow = 16. 3 l/sec. ( 259 gpm)
86

PLANT B
This plant has open submerged-arc furnaces which produce ferrochrornium, ferrosilicon, blocking chrome, and ferromanganese. Three of the furnaces are rated at 5.5 mw and the fourth at 16.5 rnw.
These furnaces are equipped with a new type of dust-removal system utilizing waste heat from the furnace to provide the energy for gas scrubbing without the use of exhaust fans. This system has recently been installed on four ferroalloy furnaces. The reaction gas passes through a heat exchanger. a nozzle, and a separator. The heat from the reaction gases is transferred to the water in the heat exchanger, increasing the temferature of the water to about 177-204°C (350-400•F) and the water pressure to about 21 kg/sq cm (300 psi). As the heated water is expanded through the nozzle of the scrubber, partial flashing occurs, and the remaining liquid is atomized. Thus. a two-phase mixture of steam and small droplets leaves the nozzle at high velocity. The reaction gas from the furnace is entrained by this high velocity, twophase mixture. and in the subsequent mixing, the reaction gas is scrubbed and cleaned. At the same time, the action of the gases leaving the nozzle aspirates the reaction gases from the furnace and propels them through the system. The mixture of steam, gas, and water droplets entrained with the collected particulates from the gas passes through a separator after discharge from the mixing section. The water and dust are removed from the gas-steam mixture; the gas leaves the separator through the stack, and the water and dust are discharged from the separator to a waste water treatment system. Chemicals and other treatment are ap~lied to settle the solids and other contaminants from the water, and the fluid slurry is discharged to settling fOnds. This system is illustrated in Figure 10. The water is then filtered, softened, and returned to a pump for recycling to the heat exchanger. Makeup water is added to replace any losses.
The water flow diagram is shown in Figure 11. The clarifiers consist of 3 inclined, tube-type clarif ier-flocculators in parallel. The filters are 3 deep-bed sand filters in parallel; backwash on the filters is controlled by a continuously reading turbidimeter. The softener is a fluidized moving-bed ion exchange unit. rated at 38 l/sec (600 gpm). The particular softener design is claimed to minimize resin attrition to less than 1 percent per year and to minimize rinsewater requirements.
The recirculation rate at the cooling tower is 284 l/sec (4500 gpm), and the blowdown rate is 1.3 percent, or 3.7 l/sec (58.5 gpm). The temperature change across the tower is 1.2oc (130F).
During the sampling period, 2 of the smaller furnaces were operating as was the largest furnace. The products produced were blocking chromium. ferrochromium, and 50 percent ferrosilicon. The average daily power consumption on the furnaces totaled 695.5 mwhr.
67

Summarized analytical data for various sampling points as designated in Figure 11 are shown in 7ables 50 through 55.
88

Figure 10.
s T EA.MfHor WA. T f R sc Ru Sat IVG SYsrfl.,
HEAT EXCHANGER..__--._

Figure I I.
PLANT D WATER AND WASTEWATER SYSTEMS
BLOW DOWN
FURNACES ---...1
COOLING ~-.. PUMP$ __ _.._ SCRUBBERS
TOWER
MAKE UP TO WELL SCRUBBERS
PLANT DISCHARGE
BLOW DOWN------'
SLUDGE LAGOONS..,.__,.___ ...... CLARlFtERS
DRY SLUDGE DUMP
pH ADJUSTMENT
CELL
FILTERS
SOFTENER
TURBIDIMETER CELLS
PUMPS

Table 51
Constituent
Suspended Solids Total Chromium Hexavalent Chromium Total Cyanide Free Cyanide Manganese Oil Iron Zinc Aluminum Phenol Phosphate Lead pH (units)
ANALYTICAL DATA -SPB- PLANT D COOLING TOWER BLOWDOWN
Concentrations, mg/l (except as noted) Minimum Maximum Average Net Average
10
0.007
0.09 0.2 3.08 0.059 0.7
1. 95
6.2
28
0.007
0.14 0.2 3.15 0.077 0.7
2.77
7.8
19
0.007
0.11 0.2 3.10 0.069 0.7
2.54
6.8
6 0 0 0.007
0 0.2 0.83 0.043 0.7
2.51 0
Average Flow =0.38 l/sec. ( 6 gpm)
Table 52 ANALYTICAL DATA -SPC - PLANT D SLURRY BLEND TANK
Constituents
Suspended Solids Total Chromium Hexavalent Chromium Total Cyanide Free Cyanide Manganese Oil Iron Zinc Aluminum Phenol Phosphate Lead pH (units)
Concentrations, mg/l (except as noted) Minimum Maximum Average Net Average
768 0.10 0.06
0.60
2.47 11. 2 10.8
0.03 0.45 0.68 8.7
7,644 3.37 1. 85 0.062 0.020 4.06 1. 3
60. 34.
103. 0.48 6.95 4.4 9.3
3,070 1.24 0.68 0.031 0.018 1. 89 0.70
27.9 25.1 58.6
0.24 3.95 3.03 9.0
3,057 1. 24 0.68 0.031 0.018 1. 69 0.70
25.6 25.1 58.6
0.24 3.92 3.03
Average Flow =21.6 l/sec. (343.5 gpm)

Table 53
Constituent
Suspended Solids Total Ci1.romium Hexavalent Chromium Total Cyanide Free Cyanide Manganese Oil Iron Zinc Aluminum Phenol Phosphate Lead pH (units)
ANALYTICAL DATA -SPL- PLANT D CONTINUOUS BLOWDOWN
Concentrations, mg/1 (except as noted) Minimum Maximum Average Net Average
8
0.05 0.2 0.39 0.173
0.02 0.04
7.1
102 2.24
0.014
0.60 1. 6 0.77 0.325 0.6 0.30 0.10
11.1
38 0.46
0.005
0.25 1.0 0.57 0.175 0.2 0.12 0.06
9.6
25 0.46
0.005
0.05 1.0 0 0.149 0.2 0.12 0.03 0
Average Flow= 6.3 l/sec. ( 100 gpm)
Table 54 ANALYTICAL DATA -SPD - PLANT D FILTER SUPPLY TANK
Constituents Concentrations, rng/l (except as noted) Minimum Maximum Average Net Average
Suspended Solids Total Chromium Hexavalent Chromium Total Cyanide Free Cyanide Manganese Oil Iron Zinc Aluminum Phenol Phosphate Lead pH (units)
68 0.25
0.020
0.42 0.3 1. 53 0.288 0.7
0.01
9.1
134 0.43
0.029
1. 23 1. 6 6.15 2.51 1. 8 0.23 0.18 0.42
10.3
112 0.31
0.024
0.78 1.1 3.15 1. 24 1. 3 0.12 0.07 0.14 9.7
Average Flow = 19. 2 l/sec. ( 305 gprn)
92
99 0.31
0.024
0.58 1.1 0.88 1. 21 1. 3 0.12 0.04 0.14

Table 55 ANALYTICAL DATA -SPF- PLANT D PLAN'.:' DISCHARGE
Concentrations, ms/l (exceEt as noted) Constituent Minimum Maximum Average Net Average
Suspended Solids 60 532 186 173 Total Chromium 0.54 1. 35 0.87 0.87 Hexavalent Chromium 0.138 0.215 0.177 0.177 Total Cyanide 0.014 0.030 0.025 0.025 Free Cyanide Manga'1ese 0.81 3.25 1. 81 1. 61 Oil 0.4 0.61 0.54 0.54 Iron 1. 06 7.83 3.79 1. 52 Zinc 0.592 3.79 2.03 2.00 Aluminum 0 Phenol 0.05 0.02 0.02 Phosphate 0.10 0.06 0.03 Lead 0.63 0.21 0.21 pH (units) 8.4 9.6 8.9
Average Flow = 9.8 l/sec. 155 gpm)
93

FLANT E
This i:lant where waste discharged. electrolytic
has been operating since 1951 and has principally two areas waters other than cooling waters are generated and
These two areas contain electric arc furnaces and cells. respectively.
There are seven covered and two open submerged-arc furnaces where 50 percent ferrosilicon. silicomanganese. standard and medium carbon ferrcmanganese. and high carbon ferrochrornium are produced. This area also contains metals refining and slag shotting operations. These furnaces have a total ratinq of 126 rnw and operated during the survey period at 82 mw.
The nine furnaces use cooling water on a once-through basis. The sanitary sewage is treated at an on-site plant and discharges with the cooling water. The total plant effluent is 1.16 X 10⁶ cu. m/day (305.5 mgd), the majority of which is cooling water from the plant's power generating station.
The water and waste water systems for the plant are shown in Figure 12. Also shown in this figure are the sampling points used during the survey.
The fumes from the furnaces are scrubbed with either venturi or disintegrator type scrutbers. There ~re five venturi and 12 disintegrator type scrubbers available for the nine furnaces. The scru£bers use between 22-32 l/sec (350-500 gpm) of the water when operating. The metals refining operation also utilizes a venturi scrubber. The scrubber water flows via a common line to the first of two lagoons operated in series. The lagoons have a combined surface area of 78 acres. The wash water from the electrolytic operations mixes with the scrubber waste water before entering the lagoons.
The acid waste water from the electrolytic operations flows to the second of these lagoons where a hydrated lime slurry is also added as a neutralizing agent. ~his second lagoon also receives the effluent from a flyash removal system at the power plant. ~he effluent fro~ the second lagoon flows to the receiving stream.
A waste water discharge from the slag concentrator flows to a separate 4.3 acre tailings lagoon and then to the receiving stream.
summarized analytical data for sampling points as designated in Figure 12 are shown in Tables 56 through 72. The 1971 average temperature increase· in cooling water temperatures over inlet was 3. 9°c (7°F) •
94

SEYIAGE TREAiMENT
PLANT
FOR COOLING
SUBMERGED ARC - FURNACES
ELECTROLYTIC PLANTS
VACUUM FURNACE
PLANT
N
OUTFALL TO RIVER
Figure 12.. PLANT E WATER AND WASTEWATER SYSTEMS
FOR MISCELLANEOUS OPERATIONS
SUBMERGED ARC - FURNACES
Mn SLAG ELECTROLYTIC Cr SLAG SHOTTING PROCESS CONCENTRATOR
METAL SYSTEMS OPERATIONS SYSTEM
REFINING D © FLUID FLUID
WASTE WASTE FINE SIZING
FACILITY
FLUID WASTE SETTLING
BASINS FOR FCE I. SCRUBBING AND FINE SIZING
SLUDGE LAGOON NO I 8.S ACRES
SLUDGE LAGOON N0.3
69.6 ACRES
OUTFALL
TO RIVER
ACID WASTE
HOLDING TANK
LIME
FLUID WASTE
SLAG TAILINGS LAGOONS
4.3 ACRES
YARD DRAINAGE
OUTFALL TO 'RIVER
FLY ASH REMOVAL
FOR POWER PLANT
BOTTOM A'.:.H
REll)'IAL
BOTTOM ASH LA&00N
2.5 ACRES
OUTFALL TO RIVER
COCL:NG
OUTF,:.:...L
TO RIVER

Table 56 ANALYTICAL DATA -SP A- PLANT E FURNACE A SCRUBBER DISCHARGE
Constituent
Suspended Solids Total Chromium Hexavalent Chromium Total Cyanide Free Cyanide Manganese Oil Iron Zinc Aluminum Phenol Phosphate Lead pH (units)
Concentrations, mg/l (except as noted) Minimum Maximum Average Net Average
210 0.01
54 1. 2 5.26
18 4.45
1. 79 7.0
342 0.01
54 1. 2 5.26
18 4.45
1. 79 7.1
261 0.01
54 1.2 5.26
18 4.45
1. 79 7.0
228 0 0 0 0
54 1. 2 4.68
18 3.78 0 0 1. 79
Average Flow = 28.4 l/sec. ( 450 gpm)
Table 57 ANALYTICAL DATA -SPB - PLANT E FURNACE B SCRUBBER DISCHARGE
Constituents
suspended Solids Total Chromium Hexavalent Chromium Total Cyanide Free Cyanide Manganese Oil Iron Zinc Aluminum Phenol Phosphate Lead pH (units)
Concentrations, mg/l (except as noted) Minimum Maximum Average Net Average
318 0.09
0.87
256 1.6
18.0 48 13.0
0.22
5.6 6.4
426 0.09
0.87
256 1.6
18.0 48 13.0
0.22
5.6 6.9
373 0.09
0.87
256 1. 6
18.0 48 13.0
0.22
5.6 6.7
340 0.09
0.87
256 1. 6
17.4 48 12.3
0.22 0 5.6
Average Flow= 25.2 l/sec. ( 400 gpm)

Table 58 ANALYTICAL DATA -SPC- PLANT E
MEI'AI.S REFINING SCRUBBER DISCHARGE
Concentrations, ms/l (exceEt as noted) Constituent Minimum Max:l..mum Averase Net Average
Suspended Solids 874 1,674 1,204 1,171 Total Chromium 0.06 0.06 0.06 0 Hexavalent Chromium Total Cyanide 0 Free Cyanide 0 Manganese 597 597 597 597 Oil 1. 2 1. 2 1. 2 1. 2 Iron 1. 82 1. 82 1. 82 1. 24 Zinc 0.46 0.46 0.46 0.44 Aluminum 0.87 0.87 0.87 0.20 Phenol 0 Phosphate 0 Lead 0 pH (units) 7.8 8.7 8.2
Average Flow = 22.11/sec. 350gpm)
Table 59 ANALYTICAL DATA -SPD - PLANT E SLAG SHOTTING WASTEWATER
Constituents
Suspended Solids Total Chromium Hexavalent Chromium Total Cyanide Free Cyanide Manganese Oil Iron Zinc Aluminum Phenol Phosphate Lead pH (units)
Concentrations, mg/l (except as noted) Minimum Maximum Average Net Average
132 0.03
54 1.2 0.28 0.13
10.5
7.3
302 0.03
54 1.2 0.28 0.13
10.5
7.4
217 0.03
54 1. 2 0.28 0.13
10.5
7.5
184 0
0 0
54 1. 2 0 0.11 9.8 0 0 0
Average Flow =110.3 l/sec. (1,750 gpm) (atout 20 nun/nr)
97

Table 60 ANALYTICAL DATA -SPE- PLANT E FURNACE C SCRUBBER DISCHARGE
Concentrations, ms/l (exceEt as noted) Constituent Minimum Maximum Average Net Averase
Suspended Solids 264 364 317 284 Total Chromium 0.57 0.57 0.57 0.41 Hexavalent Chromium Total Cyanide 0.16 0.16 0.16 0.16 Free Cyanide Manganese 21. 9 21. 9 21. 9 21.4 Oil 1. 8 1. 8 1.8 1.8 Iron 3.19 3.19 3.19 2.61 Zinc 8.7 8.7 8.7 8.7 Aluminum 7.1 7.1 7.1 6.4 Phenol 0.09 0.09 0.09 0.09 Phosphate 0.32 0.32 0.32 0.32 Lead 0.26 0.26 0.26 0.26 pH (units) 7.3 7.3 7.3
Average Flow = 50.4 1/sec. { 800 gpm)
Table 61 ANALYTICAL DATA -SP p - PLANT E FURNACE D SCRUBBER DISCHARGE
Constituents
Suspended Solids Total Chromium Hexavalent Chromium Total Cyanide Free Cyanide Manganese Oil Iron Zinc Aluminum Phenol Phosphate Lead pH (units)
Concentrations, ms/l (except as noted) Minimum Maximum Average Net Average
268 0.10
0.96
4.22 1. 6 4.00 3.00 1. 68 0.15 0.50 1. 03 4.4
414 0.10
0.96
4.22 1. 6 4.00 3.00 1. 68 0.15 0.50 1. 03 4. 4
343 0.10
0.96
4.22 1. 6 4.00 3.00 1. 68 (). 15 0.50 1. 03 4.4
310 0
0.96
3.73 1. 6 3.42 2.98 1. 01 0.15 0.50 1. 03
Average Flow = 50.4 l/sec. ( 800 gpm)
98

Table 62 ANALYTICAL DATA -SP G - PLANT E FURNACE E SCRUBBER DISCHARGE
Constituent
Suspended Solids Total Chromium Hexavalent Chromium Total Cyanide Free Cyanide Manganese Oil Iron Zinc Aluminum Phenol Phosphate Lead pH (units)
Concentrations, mg/l (except as noted) Minimum Maximum Average Net Average
3,244 0.50
1,576
6.94 51
178 0.09
11. 7 8.6
4,140 0.50
1,576
6.94 51
178 0.09
11. 7 8.7
3,753 0.50
1,576
6.94 51
178 G.09
11. 7 8.6
3,720 0.34
0 0
1,576
6.36 51
177 0.09 0
11. 7
Average Flow =44.1 l/sec. ( 700 gpm)
Table 63 ANALYTICAL DATA -SPH - PLANT E FURNACE E SCRUBBER SETTLING BASIN DISCHARGE
Constituents
Suspended Solids Total Chromium Hexavalent Chromium Total Cyanide Free Cyanide Manganese Oil Iron Zinc Aluminum Phenol Phosphate Lead pH (units)
Concentrations, mg/l (except as noted) Minimum Maximum Average Net Average
3,348 0.17
1,322 1.0 7.16
89 178
9.1 8.5
11,364 6,080 0.17 0.17
1,322 1. 0 7.16
89 178
9.1 8.6
1,322 1. 0 7.16
89 178
9.1 8. 6
6,047 0.01
1,322
0 0
1. 0 6.58
89 177
0 0 9.1
Average Flow = 44.1 l/sec. 700 qpm)
99

Table 64 ANALYTICAL DATA -SP I - PLANT E SLAG CONCENTRATOR WASTEWATER
Concentrations, m2/l (exceEt as noted) Constituent Minimum Maximum Average Net Average
Suspended Solids 856 872 864 831 Total Chromium 2.04 2.04 2.04 1. 88 Hexavalent Chromium 0 Total Cyanide 0.013 0.007 0.007 Free Cyanide Manganese 4.39 4.81 4.60 4.11 Oil 0.2 2.2 1.2 1.2 Iron 5.8 14.6 10.2 9.6 Zinc 0.22 0.22 0.22 0.20 Aluminum 10.7 10.7 10.7 10.0 Phenol 0 Phosphate 0 Lead 0 pH (units) 6.1 6.2 6.2
Average Flow = 107.11/sec. (1,700 gpm)
Table 65 ANALYTICAL DATA -SPJ - PLANT E SLAG TAILINGS POND DISCHARGE
Constituents
Suspended Solids Total Chromium Hexavalent Chromium Total Cyanide Free Cyanide Manganese Oil Iron Zinc Aluminum Phenol Phosphate Lead pH (units)
Concentrations, mg/l (except as noted) Minimum Maximum Average Net Average
46 0.02
0.006
0.95
1.14 0.032 0.72 0.25
6.2
90 0.16
0.006
1. 26
1. 54 0.058 1.13 0.25
6.9
62 0.09
0.006
1.08
1. 32 0.048 0.86 0.25
6.4
29 0 0 0.006
0.59 0 0.74 0.026 0.19 0.25 0 0
Average Flow =107.1 l/sec. (1,700 gpm)
100
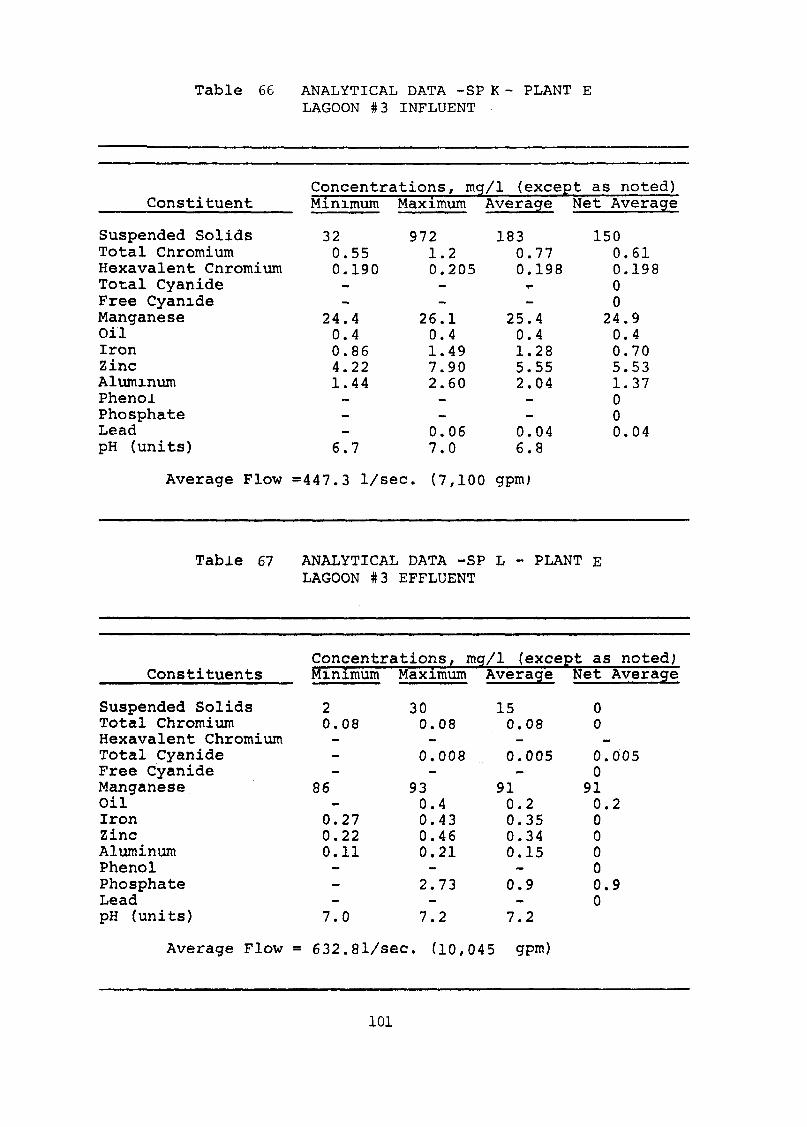
Table 66
Constituent
suspended Solids Total Cnromium Hexavalent Cnromium Total Cyanide Free Cyanide Manganese Oil Iron Zinc Aluminum Phenol Phosphate Lead pH (units)
ANALYTICAL DATA -SP K - PLANT E LAGOON #3 INFLUENT
Concentrations, mg/l (except as noted) Minimum Maximum Average Net Average
32 0.55 0.190
24.4 0.4 0.86 4.22 1.44
6.7
972 1.2 0.205
26.1 0.4 1. 49 7.90 2.60
0.06 7.0
183 0.77 0.198
25.4 0.4 1. 28 5.55 2.04
0.04 6.8
150 0.61 0.198 0 0
24.9 0.4 0.70 5.53 1. 37 0 0 0.04
Average Flow =447.3 l/sec. (7,100 gpmJ
Table 67
Constituents
Suspended Solids Total Chromium Hexavalent Chromium Total Cyanide Free Cyanide Manganese Oil Iron Zinc Aluminum Phenol Phosphate Lead pH (uni ts)
Average Flow =
ANALYTICAL DATA -SP L - PLANT E LAGOON #3 EFFLUENT
Concentrations, m~/l (exceEt as noted) Minimum Maximum Average Net Average
2 30 15 0 0.08 0.08 0.00 0
0.008 0.005 0.005 0
86 93 91 91 0.4 0.2 0.2
0.27 0.43 0.35 0 0.22 0.46 0.34 0 0.11 0.21 0.15 0
0 2.73 0.9 0.9
0 7.0 7.2 7.2
632.81/sec. (10,045 gpm)
101

Table 68
constituent
Suspended Solids Total Chromium Hexavalent Chromium Total Cyanide Free Cyanide Manganese 0., 1 ....
Iron Zinc Aluminum Phenol Phosphate Lead pH (units)
Average Flow
ANALYTICAL DATA -SP M- PLANT E INTAKE RIVER WATER
concentrations, mg/l (exceEt as noted) Minimum Maximum Average Net Average
24 38 33 0.16 0.16 0.16
0.49 0.49 0.49 0.2
0.54 0.62 0.58 0.022 0.022 0.022 0.67 0.67 0.67
7.2 7.2 7.2
= 13,366 l/sec. 212,150 gpm)
Table 69 ANALYTICAL DATA -SP N - PLANT E COOLING WATER DISCHARGE
Concentrations, mg/l (exceEt as noted) Constituents Minimum Maximum Average Net Average
Suspended Solids 90 176 125 92 Total Chromium 6.6 6.6 6.6 6.4 Hexavalent Chromium 0 Total Cyanide 0.014 0.005 0.005 Free Cyanide Manganese 0.053 4.61 1. 58 1.09 Oil 0.4 0.3 0.3 Iron 3.42 32. 15.0 14.4 Zinc 0.045 0.045 0.045 0.023 Aluminum 4.28 4.28 4.28 3.61 Phenol 0 Phosphate 1. 98 1. 98 1. 98 1.98 Lead 0 pH (uni ts) 3.8 7.2 5.4
Average Flow = 3,571 l/sec. ( 56,680 gpm)
102

Table 70 ANALYTICAL DATA -SPO - PLANT E COMBINED SLAG SHOTTING & COOLING WATER DISCHARGE
Constituent
Suspended Solids Total Chromium ttexavalent Chromium Total Cyanide Free Cyanide Manganese Oil Iron Zinc Aluminum Phenol Phosphate Lead pH (units)
Concentrations, mg/l (except as noted) Minimum Maximum Average Net Average
148 0.02
19.1 1. 0 3.72 0.049 4.95
7.5
192 0.02
19.1 1. 0 3.72 0.049 4.95
7.5
170 0.02
19.1 1. 0 3.72 0.049 4.95
137 0.02
0 0
18.6 1.0 3.14 0.027 4.28 0 0 0
Average Flow= 50.41/sec.
7.5
BOOgpm)
Table 71 ANALYTICAL DATA -SP p - PLANT E FLY ASH INFLUENT TO LAGO~N
Constituents
Suspended Solids Total Chromium Hexavalent Chromium Total Cyanide Free cyanide Manganese Oil Iron Zinc Aluminum Phenol Phosphate Lead pH (units)
Concentrations, mg/l (except as noted) Minimum Maximum Average Net Average
1,246 20,156 7,667 7,634
6.6 7.0 6.7
Average Flow ~ 70.9 l/sec. (1,125 gpm)
103

Table 72 ANALYTICAL DATA -SP Q - PLANT E FLY ASH INFLUENT TO LAGOON
Constituent
Suspended Solids Total Chromium Hexavalent Chromium Total Cyanide Free Cyanide Manganese Oil Iron Zinc Aluminum Phenol Phosphate Lead pH (units)
Concentrations, mg/l (except as noted) Minimum Maximum Average Net Average
510 5,200 2,209 2,176
6.6 6.8 6.7
Average Flow =70.9 l/sec. (1,125 gpm)
Table 73 ANALYTICAL DA'l'A -SP A - PLANT F INTAKE WATER
Constituents
Suspended Solids Total Chromium Hexavalent Chromium Total Cyanide Free Cyanide Manganese Oil Iron Zinc Aluminum Phenol Phosphate Lead pH (units)
Concentrations, mg/l (except as noted) Minimum Maximum Average Net Average
17 u.01
0.026 1. 0
0.008
7.3
17 0.01
0.026 1. 0
0.008
7.3
17 0.01
0.026 1. 0
0.008
7.3
Average Flow = 25.2 l/sec. ( 400 gpm)
104

PLAN~ F
This plant utilizes seven electric arc furnaces to produce a product line including 50 percent ferrosilicon, low carbon ferrochromesilicon, high carbon ferrochromium, low carbon ferrochromium and silicon metal. The furnaces range in size from 10 mw to 36 mw with a collective capacity of 142 mw. No wet air pollution devices are used; baghouses have been installed on some furnaces. The water use system is as shown in figure 13.
All plant water is supplied from wells and the furnace cooling water is recirculated. Blowdown from all three cooling towers is automatically controlled by total solids levels. Flow rate in the cooling tower serving 4 furnaces with a capacity of 51 mw is 76 l/sec (1200 gpm). Bleed-off from this unit is 5 l/sec (80 gpm) or 6.6 percent of the recirculating flow. Another cooling tower serving a 20 mw furnace has a flow rate of 50 l/sec (800 gpm) and a bleed-off of 1 l/sec (20 gpm) or 2.5 percent of the recirculating flow. Two additional furnaces with a capacity of 65 mw are served by a 316 l/sec (5000 gpm) recirculating flow ana a bleed-off of 13 l/sec (200 gpm) or 4 percent of the flow. Water treatment in the cooling system consists of a chromate based proprietary compound and algaecides.
Except for the overflew from septic tanks and isolated roof drains, the cooling system bleed-off is the major source of the plant discharge. Yard drainage resulting from surface run-off is collected and transfered to a small off-site lagoon. Under normal conditions there is no discharge from the lagoon as accumulated waste water either evaporates or drains through the lagoon bottom.
With 6 furnaces operating during the sampling period at 92.8 mw, the coqling water use was thus 17.15 l/kwhr (4.53 gal/kwhr). A limited number of samples were collected at this plant and the analytical data are summarized in Tables 73 through 75. The temperature drop across the cooling tower is 5.6oc (lOOF).
A slag concentration process is used at this plant which utilizes water on a completely closed recirculation system, the only discharge is blowdown to a closed lagoon i.e., a lagoon with no outlet. This process was not operating at the time of our visit. ~he plant reports the blowaown rate to be 1.58 l/sec (25 gpm) from this system, while the total circulation rate is 94.65 l/sec (1500 gpm).
105

Table 76 ANALYTICAL DATA -SPB- PLANT F COOLING TOWER BLOWDOWN
Concentrations, mg/l (exceEt as noted) Constituent Minimum Maximum Average Net Average
Suspended Solids 14 14 14 0 Total Chromium 10.8 10.8 10.8 10.8 Hexavalent Chromium 0.015 0.015 0.015 Total Cyanide 0 Free Cyanide 0 Manganese 0.093 0.093 0.093 0.067 Oil 1. 4 1. 4 1.4 0.4 Iron 0.11 0.11 0.11 0.11 Zinc 6.98 6.98 6.98 6.97 Aluminum 0 Phenol 0 Phosphate 0 Lead 0 pH (units) 5.9 5.9 5.9
Average Flow = 12.6 l/sec. ( 200 gpm)
Table 77 ANALYTICAL DATA -SP C - PLANT F PLANT DISCHARGE
Concentrations, mg/l (exceEt as noted) Constituents Minimum Maximum Average Net Average
Suspended Solids Total Chromium Hexavalent Chromium Total Cyanide Free Cyanide Manganese Oil Iron Zinc Aluminum Phenol Phospnate Lead pH (units)
14 13.6
0.008 0.010
0.370 4.2 0.58 6.98 0.67
6.5
14 13.6
0.008 0.010
0.370 4.2 0.58 6.98 0.67
6.5
14 13.6
0.008 0.010
0.370 4.2 0.58 6.98 0.67
6.5
Average Flow = 20.8 l/sec. ( 330 gpm)
106
0 13.6
0.010
0.344 3.2 0.58 6.97 0.67 0 0 0

PLA.NT G
This plant has two 35 mw oper; furnac<:::s wbicb produce ferrocl1romium and a slag concentration operation. l>.t -r.imE:S fE:rrochromesilicon is produced here. The water flow diagram for the plant is shown in Figure 14. Air pollution control is by mear,s of elt:ct:rostatic precifJi ta tors which are preceded by spray towers. Tbe gases frcm tLE: furnaces are conditioned by the water sprays in the towers in order to improve tne perrormance of the precipitators; ammonia is added -to th€- ~'pray water.
The water supply is purchased city wa~Fr anci criginates irom wells. The cooling water used on ths furnaces is rE-circulated tnrough a cooling tower at the rate of 316 l/sE:c (5000 cn-'m}. 'Tr1E' SI1ray towers remove a portion of the particulates from the fur~ace gases prior to the precipitators; the resultan~ slurry ~asses t~rough settling oasins near the furnaces and then a lagoon ~hich has teFn excavate~ rrom a slag Pile.
The slag concentrate~ is a sink-float frocess in w~ich slag separated from larger, usable slag po.rticlf~S and in
rEcoverable mE:tal. The products ar2 thus slaq for sale: and reuse; the waste is a slurry of slag fines. The wastE: stream in 2 small lagoons in series prior to discharge to a stream.
.tines turn metal
are from
for is treated
Plant production has been reported at 245 kkgs (270 short tons) of alloy per day. Reference 32 indicatEs a factor of 4.2 mwhr i~r ton, i.e., a furnace load of 1, 134 mwhr per day. Analytical data are surrunarized in Tables 7 8 through 83, for sampling locations dEsigna -i:eci in E'ig ure 14.
107

PLANT G
This plant has two 35 mw open furnaces which produce ferrochromium a~d a slag concentration operation. At times ferrochromesilicon is produced here. The water flow diagram for the plant is shown in Figure 14. Air pollution control is by means of electrostatic precipitators which are preceded by spray towers. The gases from the furnaces are conditioned by the water sprays in the towers in order to im~rove the performance of the precipitators; ammonia is added to the spray water.
The water supply is purchased city water and originates from wells. The cooling water used on the furnaces is recirculated through a cooling tower at the rate of 316 l/sec (5000 gpm). The spray towers remove a portion of the particulates from the furnace gases prior to the precipitators; the resultant slurry passes through settling basins near the furnaces and then a lagoon which has been excavated from a slag pile.
The slag concentrator is a sink-float process in which slag fines are separated from larger, usable slag particles and in turn from recoverable metal. ~he products are thus slag for sale and metal for reuse; the waste is a slurry of slag fines. The waste stream is treated in 2 small lagoons in series prior to discharge to a stream.
Plant production has been reported at 245 kkgs (270 short tons) of alloy per day. Reference 32 indicates a factor of 4.~ mwhr per ton, i.e., a furnace load of 1,134 mwhr per day. Analytical data are summarized in Tables 76 through 81, for sampling locations designated in Figure 14.
108

..... 0 \0
--
Figure 1'4.
PLANT G WATER AND WASTEWATER SYSTEMS
CITY .. WATER -
- COOLING .. - -
FURNACE FURNACE .. TOWER -- -0
0 - - LAGOON - SPRAY B SPRAY -
TOWER - - TOWER
H
c c LAGOON
1, 1 '
SETTLING SETTLING BASIN BASIN
, , 1 t ~ I ®-+ LAGOON : E
0
SLAG CONCENTRATION
F --
.. "'"

Table 76 ANALYTICAL DATA -SP A PLANT G INTAKE CITY WATER
Constituent Concentrations, mg/l (except as noted) Minimum Maximum Average Net Average
Suspended Solids Total Chromium Hexavalent Chromium Total Cyanide Free cyanide Manganese Oil Iron Zinc Aluminum Phenol Phosphate Lead pH (units)
0.030 0.2 0.13 0.159
6.9
0.030 0.2 0.14 0.159
7.9
0.030 0.2 0.13 0.159
7.3
Average Flow =20.5 l/sec. ( 325 gpm)
Table 77 ANALYTICAL DATA -SP B - PLANT G COOLING TOWER BLOWDOWN
Concentrations, mg/1 (exceEt as noted) Minimum Maximum Constituents Average Net Average
Suspended Solids 18 40 25 25 Total Chromium 3.23 3.35 3.31 3.31 Hexavalent Chromium 1. 43 1. 57 1. 49 1.49 Total Cyanide 0 Free Cyanide 0 Manganese 0.094 0.094 0.094 0.064 oil 0.2 0.4 0.3 0.1 Iron 0.19 0.46 0.32 0.19 Zi11c 0.52 0.71 0.65 0.491 Aluminum 0.98 0.98 0.98 0.98 Phenol 0 Phosphate 0.05 0.15 0.12 0.12 Lead 0 pH (uni ts) 7.3 8.4 8.0
Average J:<'low = 1. 6 l/sec. ( 25 gpm)
110

Table 78 ANALYTICAL DATA -SP c PLANT G SPRAY TOWER DISCHARGE
Constituent
Suspended Solids Total Chromium Hexavalent Chromium Total Cyanide Free cyanide Manganese Oil Iron Zinc Aluminum Phenol Phosphate Lead pH (units)
Concentrations, mg/l (except as noted) Minimum Maximum Average Net Average
4,134 2.66
1. 68 0.2 1. 77 0.75 4.34
0.01
7.3
6,104 8.36 0.49
14.0 0.6 3.50 5.28
23.0
0.02
8.6
4,980 4.76 0.32
8.15 0.3 2.58 2.45
11.28
0.02
8.1
4,873 4.76 0.32 0 0 8.12 0.1 2.45 2.29
11. 28 0 0.02 0
Average Flow = 1.1 l/sec. 17.5gpm)
Table 79 ANALYTICAL DA'l'A -SP D PLANT G
SEI'I'LING BASIN EFFWENl'
Concentrations, mg/l (exce~t as noted) Constituents Minimum Maximum Average Net Avera~e
Suspended Solids 204 1,898 784 784 Total Chromium 3.48 7.44 5.29 5.29 Hexavalent Chromium 0 Total Cyanide 0 Free Cyanide 0 Manganese 2.89 3.81 3.33 3.30 Oil 0.4 0.2 Iron 1. 27 5.87 2.95 2.82 Zinc 2.67 6.83 4.75 4.59 Aluminum 7.8 29.0 21. 9 21. 9 Phenol 0 Phosphate 0.03 0.03 Lead 0 pH (units) 7.7 8.9 8.3
Average Flow = 3.8 l/sec. 60 gpm)
111

Table 80 ANALYTICAL DATA -SP E. PLANT G PLANT DISCHARGE
Concentrations, m51/l (exceEt as noted) Constituent Minimum Maximum Avera9:e Net Avera9:e
Suspended Solids 96 104 101 101 Total Chromium 2.2b 2.81 2.52 l.52 Hexavalent Chromium 0 Total Cyanide 0 Free Cyanide 0 Manganese 0.87 1. 45 l.2u 1.17 Oil 0.4 2.0 1.1 0.9 Iron 0.45 0.83 0.60 0.47 Zinc 0.35 1.15 0.84 U.68 Aluminum 1. 60 3.49 2.57 2.57 Phenol 0 Phosphate 0.01 0.01 0.04 0.04 Lead 0 pH (units) 8.0 8.2 8.1
Average Flow = 3.8 l/sec. 60 gpm)
Table 81 ANALYTICAL DATA -SPF - PLANT G SLAG PROCESSING DISCHARGE
Concentrations, mg/l (exceEt as noted) Constituents Minimum Maximum Avera9:e Net Avera9:e
Suspended Solids Total Chromium Hexavalent Chromium Total Cyanide Free Cyanide Manganese Oil Iron Zinc Aluminum Phenol Phosphate Lead pH (uni ts)
26 0.55 0.16
0.50 0.8 0.98 0.088 0.27
B.4
2,894 4.54 0.45
10.8 1. 0 5.33 3.36
37.0
9.5
1,250 2.61 0.30
4.14 1.0 4.38 1.65
14.1
8.9
Average Flow= 0.66 l/sec. ( 10.4 gpm)
112
1,250 2.61 0.30 0 0 4.11 0.8 4.25 1.49
14.1 0 0 0

PLANT H
Chromium metal is produced at this plant by an aluminothermic process using chromium oxide produced by the exothermic reaction of wood flour and sodium dichromate. The production of chromium oxide is not considered here.
The off-gases from the aluminothermic process are cleaned in a unique "wet baghouse" system shown in Figure 15. Water sprays and a wet dynamic scrubber preceed the baghouse and an air heater which raises the gas temperature above the dewpoint to prevent bag clogging. The bags are cleaned by water sprays between each batch-type operation and are dried prior to the next cycle. The waste water effluent contains suspended solids and hexavalent chromium as the principal pollutants.
The waste water is treated batchwise in a series of rubber lined lagoons as shown in Figure 16. There are three reduction basins which each treat one batch of waste water from the baghouse. Treatment time as measured from the filling of the basin to discharge of treated wastewater to the sludge lagoon should take approximately two hours. Two 56,775 liters (15,000 gallon) tanks are provided for treatment flexibility and storage.
Sufficient sulfuric acid addition capacity is provided to lower the waste water pH to about 3.0. At maximum conditions, the daily sulfuric acid requirements are expected to be 454 kg/day (l,000 lbs/day).
Sulfur dioxide added to the waste water through chlorine-type sulfonators is the reducing agent for the treatmePt process. The theoretical reduction of chromium requires approximately .5 kg (1 lb.} of sulfur dioxide for every kg (2 lb.) of cbromates (CrO]) to be reduced. On a daily basis, 136 kg (300 lb.) of SO£ is required.
Upon completion of chemical reduction, sodium hydroxide is added to the basin to raise the pH to form an insoluble chromium hydroxide from the reduced chrome. Approximately 36 kg/day (80 lb/day) of sodium hydroxide is required under maximum flow conditions.
Diffused air agitation is provided to completely mix the reduction basin and to prevent the settling of precipitated solics before the waste water is released to the sludge lagoons. The air supply capacity was based on providing 0.054 cu. m/hr/gal. (0.5 cu. ft./hr/gal.) of waste water to be mixed.
The rubber-lined sludge lagoons have an approximate volume of 1,741,100 liters (460,000 gallons) when gravity flow is used from the reduction basins to the lagoons. Pumping the treated waste water, however, could theoretically utilize the full 3.5 m (11 ft.) depth of the lagoon and would almost triple their capacity. Currently, gravity flow is used, but provisions have been made for the later addition of pumps if needed.
113

Sludge production is expected to approach 454 kg/day (1.000 lb/ day). Approximately six months of sludge storage is provided before removal would be required. This storage capacity will allow for 180 days of continuous o~eration at the maximum flow and chromium concentrations.
Analytical data from the plant survey are summarized in Tables 82 through 89 for sampling points indicated in Figure 16. The measured tem~erature rise of the cooling water was 6°c (10.0 8 F). The cooling pond is designed for a maximum rise of 2.78°c (S•F). and is 61 m X 67 rn (200 ft. x 220 ft.).
114

NO I.
NO 2.
D FIR:N\, CUBICLE
WITH FIR!NG POT
DUCTS WITH WATER SPRAYS
' / ' , ' t
TRAP ....__.• ......... • --.i
SLURRY TO DRAIN
Figurl! I~
DIAGRAM OF •wE.T BAGHOUSE• SYSTEM
BAGS CLEANED BY INTERNAL WATER SPRAY
( BAG HOUSE
-
SLURRY TO DRAIN
WET DYNAMIC SCRUBBER
-f
~ i SLURRY TO DRAIN
MAIN EXHAUST FAN
(CLEANED GAS TO ATMOSPHERE) SLURRY TO
DRA1N
t
TEtlPERATURE
PROBE
MAN0ME TE R CONTROL
GAS FIRED AIR HEATER

Figure 16.
PLANT H WATER AND WASTEWATER SYSTEMS
GASES
EXOTHERMIC SMELTING ......___... BAGHOUSE
CITY WATER
OPERATION
TO STREAM
TREATMENT LAGOON (LINED)
SEASQNAL BY-PASS
THER~AL
POND (UNLINED)
1-----cc ----SETTLING
LAGOON
(LINED)
POLISHING LAGOON (LINED)
COOLING
WATER

Table 82 ANALYTICAL DATA -SPA- PLANT H INTAKE CI~Y WATER
Constituent Concentrations, mg/l (except as noted) Minimum Maximum Average Net Average
Suspended Solids Total Chromium Hexavalent Chromium Total Cyanide Free Cyanide Manganese Oil Iron zinc Aluminum Phenol J:Jhosphate Lead pH (units)
0.026
0.22 0.016
5.6
0.026
0.29 0.016
5.7
0.026
0.25 0.016
5.6
Average Flow = 28.4 l/sec. ( 450 gpm)
Table 83 ANALYTICAL DATA -SP B- PLANT H BAGHOUSE WASTEWATER DISCHARGE
Constituents Concentrations, mgLl Minimum Maximum
(exceEt as noted) Average Net Average
Suspended Solids 106 220 136 136 Total Chromium 101 121 112 112 Hexavalent Chromium 17 44 37 37 Total Cyanide 0 Free Cyanide 0 Manganese 0.040 O.U51 0.048 0.022 Oil 1. 2 2.b 1. 8 1. 8 Iron 0.04 0.04 0.04 0 Zinc 0.002 0.003 0.002 0 Aluminum 0 Phenol 0 Phosphate 0 Lead 0 pH (units) 12.3 12.4 12.3
Average Flow = 100,303 l/da (26,500 gal/da)
117

Table 84 ANALYTICAL DATA -SPC- PLANT H TREATED BAGHOUSE WASTEWATER
Concentrations, ms/l {exceEt as noted) Constituent Minimum Maximum Average Net Average
Suspended Solids 674 748 713 713 Total Chromium 114 114 114 114 Hexavalent Chromium 0.047 0.363 0.162 0.162 Total Cyanide 0 Free Cyanide 0 Manganese 0.41 0.73 0.54 0.51 Oil 0.8 2.0 1.3 1.3 Ix-on 2.64 3.73 3.27 3.01 Zinc 0.90 1.53 1.27 1.25 Aluminum 127 130 129 129 Phenol 0 Phosphate 0.41 a.so 0.46 0.46 Lead 0 pH {units) 4.7 6.2 5.4
1'.verage Flow = 100,303 l/da (26,500 gal/da)
Table 85 ANALYTICAL DATA -SP D - PLANT H SETTLING LAGOON DISCHARGE
Constituents
Suspended So.Lids Total chromium Hexavalent chromium Total Cyaniae Free Cyanide Manganese Oil Iron Zinc Aluminum Phenol Pnosphate Lead pH (units)
Average Flow =
Concentrations, mg/l (except as noted) Minimum Maximum Average Net Average
58 17.9
0.189
0.70 3.4 0.24 0.77
31
0.05
4.9
70 18.3
0.218
0.70 3.4 0.42 0.77
31
0.05
4.9
l/sec. (
118
66 18.1
0.208
0.70 3.4 0.32 0.77
31
o.ns
4.9
gpm)
66 18.1
0.208 0 0 0.67 3.4 0.06 0.75
31 0 0.05 0

Table 86 ANALYTICAL DATA -SP~- PLANT H POLISHING LAGOON DISCHARGE
Constituent Concentrations, mg/l (except as noted) Minimum Maximum Average Net Average
Suspended Solids Total Chromium Hexavalent Chromium Total Cyanide Free Cyanide Manganese Oil Iron Zinc Aluminum Phenol Phosphate Lead pH (units)
10 7.13 a.214
a.92 4.0 a.17 a.44
15.3
a.05
5.2
56 7.56 a.261
a.92 4.a a.17 a.44
15.3
o.os
5.2
38
7.4a 0.245
a.92 4.a a.17 0.44
15.3
a.as
5.2
Average Flow =0.32 l/sec. ( 5 gpm)
Table 87 ANALYTICAL DATA -SPF - PLANT H PLANT DISCHARGE
38 7.4a a.245 a 0 0.89 4.0 0 0.42
15.3 a a.as a
Constituents Concentrations, Mg/l (except as noted) Minimum Maximum Average Net Average
Suspended Solids Total Chromium Hexavaient Chromium Total Cyanide Free Cyanide Manganese Oil Iron Zinc Aluminum Phenol Phosphate Leaa pH (uni tsJ
0.37 0.024
0.22 2.0 0.27 0.023
a.os
5.2
22 0.81 0.090 0.016 0.016 0.40 4.0 0.34 0.074
o.a5
6.1
6 0.57 o.a57 0.009 0.009 0.32 2.7 a.29 0.048
0.05
5.7
Average F iow = 18.9 l/sec. ( 300 gpm)
119
6 0.57 0.057 0.009 0.009 0.29 1. 8 0 o.a32 a a a.a4 0

Table 88
Constituent
Suspended Solids Total Chromium Hexavalent Chromium Total Cyanide Free Cyanide Manganese Oil Iron Zinc Aluminum Phenol Phosphate Lead pH (units)
ANALYTICAL DATA -SPG- PLANT H PLANT WELL WATER
Concentrations, mg/l (except as noted) Minimum Maximum Average Net Average
0.037 4. 6 0.52 0.011
0.05
5.2
0.037 4.6 0.57 0.011
0.05
5.3
0.037 4.6 0.55 0.011
0.05
5.3
Average Flow = 3.01 L/sec. ( 48 gpm)
Taole 89
Constituents
suspended Solids Total Chromium Hexavalent Chromium Total Cyanide Free Cyanide Manganese Oil lron Zinc Aluminum Phenol Phosphate Lead pH (units)
Average Flow
ANALYTLCAL DATA -~PH - PLANT H COOLING WATER
Concentrations, m9:/l (exceEt as notea) Minimum Maximum Averase Net Averase
40 40 40 40 0.44 0.44 0.44 0.44 0.38 0.38 0.38 0.38
0 0
1. 45 1. 45 1. 45 1. 42 2. 2 2.2 2.2 2.2 1. 49 1. 49 1. 49 1.24 0.060 0.060 0.060 0.044 0.27 0.27 0.27 0.27
0-0 0
6.0 6.0 b.O
= 18.6 l/sec. { 295 gpm)
120

In Figure 17, a waste treatment scheme is shown waste constituents for which guidelines have reduced to minimal concentrations. Not all waste all constituents and appropriate modifications can be made to reduce costs.
in which all of the been developed can be
streams will contain of this general scheme
The first step consists of raising the pH of the waste stream to about 11 and the addition of sufficient chlorine to maintain a free residual, followed by sedimentation. In this step, phenol is oxidized, cyanide is oxidized to cyanate, and manganese is precipitated as the hydroxide. In the second step, additional chlorine is added and the pH is lowered to 7.0 by a suitable acid. With a reaction time of 60 minutes, the cyanate is oxidized to COl and N£. In the third step, the pH is lowered to 2.5 and sulfur dioxide is added. Allowing a reaction time of 30 minutes, the hexavalent chromium is reduced to trivalent. The fourth step consists of raising the pH to 8.2, adding a polyelectrolyte, and allowing sedimentation. At this point, the trivalent chromium will be removed and final clarification accomplished. With a sufficiently low overflow rate and addition of flocculants in sufficient quantities, an effluent solids concentration of 25 mg/l of suspended solids can be attained and metals reduced to low levels.
Sand filtration of the final clarifier effluent, with backwash returned to the clarifier, can reduce suspended solids concentrations to 15 mg/l or less. After filtration, the water may be recycled back to the scrubbers.
Obviously, not all plants will require the entire treatment system. For example, plants (such as B or C) producing only manganese or only silicon products in covered furnaces, will require only the first, second and fourth (excluding raising the pH to 8.2) steps of the treatment scheme for removal/destruction of cyanide, phenols, manganese and suspended solids. A plant which specializes in chromium products using open furnaces, would require only the third and fourth steps for reduction of hexavalent chromium and removal of the trivalent and suspended solids. For those plants which produce a variety of products, an alternative solution may be the segregation of wastes and installation of the various treatment modules for chromium reduction, cyanide destruction, etc., to be utilized in series or parallel as required to achieve the proper results. 'Ihis might result in considerable economies over treatment of all wastes for all parameters.
Some plants which do not have any particular problem with metals or cyanides may be able to use a system similar to that in practice at Plant E, i.e., the addition of flyash from a nearby power station to scrubber waste water, follcwed by settling. The average suspended solids concentration reached by this system was 15 mg/l. It may be useful to some plants to operate such a system, using existing lagoons, to meet the 1977 standards.
121

1--' N N
I 'FRt>1v1
I
I
I
...
Figure 17. Diagram of Waste Water Treatnent Systan
-----, I
I
ri£-T~ ;z. B.:u:,,.,, •VA s "'! ,-------·------------···r I I
I < ~ .. ,F,FL •rru'•Kr m ! L ____ _
I ~~I
r'"'-TE~ ~----
'=r,r--vc""T -,,:: SC;;! r./R-~i:~
~-----
---------,
..y.-s-· /1 ht'.
R t&T-#-+'/'''-"" 4T 1•11 -2 • .>
J,.. ilfltl; C"~
cA,.',,;.r-.c S.t'z>A
Al.1<v/R4L 1"-AT-'t:"-' TA#IC
s:-..·.:>~ e
De"'""T.e.etN~
SL.-..:>f£ f11Sij'•"..> AL.
.~.;:
l'(Gplel?t:.Cc.?1/& Ry

Another alternative solution for 1977 might be the conversion of oncethrough systems to recirculation, with only the blowdown treated for removal of metals (obviously, recirculated water would need to be treated for removal of suspended solids). Since less chemicals would be required for treatment, in addition to smaller tanks, etc., this might result in some savings over the costs estimated in Section VIII.
Some ~!ants may be able to meet the 1977 guidelines simply by modifying their present treatment system somewhat, while some other plants (such as G) seem to meet all the 1977 pollutant load requirements for scrubber waste water. For example, both ~;~nts c and D appear to meet all but one of the 30 day average pol.l.iltant load requirements for 1977 (manganese and suspended solids, respectively). Plant c should be able to meet fully the 1977 pollutant load standards by some additional treatment for manganese removal prior to clarification. Plant D may be able to rectify the suspended solids load by using more of their clarification capacity (one of their three clarifiers was not operating at the time of our visit), or by making the flow into the clarifiers more quiescent (which may have caused improper distribution of the inlet water) , or by backwashing the sand filter more frequently.
Plant B apparently meets all 1977 pollutant load standards but that for suspended solids (in spite of using water on a once-through basis} • It is possible that the suspended solids level after the final two settling lagoons (which was not checked) may presently be low enough to meet the standards, but possibly some additional clarification might be necessary. Plant E probably meets the 1977 standard for suspended solids (since the concentration at the outfall was 15 mg/l).
The treatment system as shown in Figure 17 is not utilized in toto in any one plant in the industry. However, the modules which comprise the system are in use in this, or similar, industries.
Plant P, studied as part of the Alloy and Stainless Steel Industry (Ref. 33) , utilizes a treatment system for hexavalent chromium reduction, neutralization and clarification almost identical to that shown in steps 3 and 4 of Figure 17. This system had an average influent concentration of about 18 mg/l total chromium and 16 mg/l hexavalent chromium. After treatment, the average concentrations were 0.10 and less than 0.01 mg/l, respectively. This system was operating on a continuous basis. Plant s of the Iron and steel Industry study (Ref. 35), achieved an average suspended solids concentration of 22 mg/l after clarification of scrutber water from a B.O.F. Plant B achieved concentrations of 0.22 mg/l cyanide after alkaline chlorination, while the phenol level was reduced to 0.50 mg/l. Plant D demonstrates the use of alkaline precipitation of metals and the use of sand filters, although not in a completely optimum manner. The treatment scheme shown may be thought to be tased upon the cornFonents of all these systems, although as discussed above, any particular plant may not find it necessary to utilize the entire system.
123

Other treatment methods in use in the industry appear to be relatively ineffective for some constituents. For examples, the relatively high concentrations of suspended solids in the treated water from the clarifier and the sand filter at Plant D has already been discussed, along with suggestions as to the cause for such concentrations. Although flyash treatment appears to work well for removal of suspended solids, as utilized at Plant E, the same treatment has little or no effect on the content of metals found in the effluent. Although the potassium permanganate used at Plant c might be ex~ected to oxidize the cyanide as well as some of the manganese, such was not the case, since the cyanide and manganese concentrations in the overflow were almost as high as in the raw waste. It is possible that higher dosages may more effectively oxidize these wastes, but the cost of such treatment would almost certainly be higher than chlorination. Although the cyanide destruction system was fairly ineffective, this plant stood out in the recirculation and reuse of water from scrubbers and cooling. some of the blowdown from the cooling tower was used as makeup water for the scru~ber system, and 97 percent of the scrubber water was recirculated, the only blowdown being the clarifier underflow.
The control and treatment technologies which have been identified herein are identified as applicable to the various industry categories in Table 90.
Table 90. CONTROL AND ~REATMENT TECHNOLOGIES BY CATEGORY
Treatment ~gQ~ ~hnolo9~
I
II
III
1
2
1 2
1
2
~--~------~~escript_i_o_n __ ~~-
Chemical treatment, clarif ier-flocculators, recirculation at the scrubber Chemical treatment, clarif ier-flocculators, sand filters and process water recirculation
Chemical treatment, clarif ier-flocculators Chemical treatment, clarif ier-flocculators, sand filters and process water recirculation
Clarif ier-flocculators, chemical treatment (if necessary) Clarif ier-f locculators, chemical treatment (if necessary), process water recirculation
·----~-----~------
124

It should be noted that with the exception of the slag processing operations, the raw waste loads and final effluent leads have been calculated in terms of mwhr as the production basis. 'Ibis was done for the following reasons, after examining the other possible basis (kg (tons) ) :
1. Uncontrolled emission factors (upon which the raw waste loads depend), are more uniform over the various types of products when expressed as kg (lb)/mwhr, rather than as kg/kkg (lb/ton).
2. Power usage is already such a la7ge factor in prcduction costs (about 30 percent) that an increase in power consumption so that the permissible effluent discharge would be higher is very unlikely.
3. Power usage is very well monitored at the furnace itlself, usually with a continuous automatic recording device.
4. Furnaces are commonly referred to in the industry as '10 mw' or 1 35 mw•, rather than '50 ton' or '150 ton•, as is common practice in the steel industry.
5. The tonnage which may be produced for a given power consumption is fairly wide (factor of 10) and depends on the product, and numerous products can be produced in a given furnace. Use of kg/kkg (lb/ton) as limitations would involve the permit writer in writing a permit with many different conditions. The reader may refer to Table 18 for comparisons of power usage per ton for various products.
Aggregate raw waste loads, representing for some parameters such as chromium and manganese the maximum load which might be expected in the waste, are shown in Tables 91 through 93. The manganese concentrations, for example, would probably only be encountered at these levels from a furnace producing manganese products.
The loads were calculated from flows and concentrations as follows:
load (kg(lb)/mwhr) =mass flow rate of water (kg(lb)/hr) x concentration ~ (106 x furnace power (m~))
load (kg/kkg(lb/ton)) = mass flow rate of water (kg(lb)/hr) x concentration ~ (amount processed (kkg(tons)/hr) x 106)
Furnace power may be calculated by dividing the number of megawatt-hours used in the furnace in a 24 hour period by 24 hours.
Tables 91-93, describing raw waste and treated effluent loads, have been constructed on the following bases:
Category I - Ofen Electric Furnaces with Wet Air Pollution Control Devices.
125

,
Raw Waste Load - Flow based upon the total water flow in the scrubber [113.6 l~sec (1800 gpm)] rather than effluent water flow at Plant E, sample point G from the scrubber (44.2 l/sec (700 gpm) ]. concentrations of suspended solids and manganese at that sample point adjusted accordingly to compensate for increased flow. Chromium concentrations taken from Plant G, sample point c.
Treatment Level 1 Concentrations shown are those achievable by the treatment system as shown in Figure 17, less the sand filter and recirculation portions and are generally somewhat higher than those at Plant D, sample point E. Loads are based upon concentrations shown and a water use of 6382 l/mwhr (1686 gal/mwhr).
Treatment Level 2 - concentrations based on entire treatment system as shown in Figure 17, including the sand filter and recirculation, and are generally somewhat higher than those at Plant D, sample point E. These levels would require better operation of the treatment system than was necessary in Level 1. Loads based upon blowdown rate of 783 l/mwhr (207 gal/mwhr).
Category II - covered Electric Furnaces and Other Smelting Operations with wet Air Polluticn Control Devices.
Raw waste Load - concentrations and loads as at Plant E, sample point B, except that chromium concentrations are taken from Plant G, sample point c, and manganese concentrations taken from Plant c, sample point c. Leads calculated from Plant B, sample point B, flow.
Treatment Level 1 - Concentrations same as for Category I, treatment level 1, except that cyanide and phenol concentrations are based upon those found at Plant E, sample point D. Loads in kg (lb)/mwhr were calculated using the flows found at Plant B, sample point D.
Treatment Level 2 Concentrations same as for Category I, treatment level 2, with cyanide concentration based on Plant E, sample point D. Loads in kg (lb)/mwhr based on 1060 1 (280 gal)/mwhr being blown down from the recirculation system.
Note: Loads for exothermic and other nonelectric furnace smelting operations based on water usage three times higher (fer ton) than for electric furnaces (per mwhr)
Category III - Slag Processing
Raw waste Load - Maximum of Plant E, sample point I, or sample point D.
Treatment Level 1 - Based on use of clarif ier-flccculators.
126

Treatment Level 2 - Based on recirculation of ~rocess water precipitation of fine suspended solids in clarifier-flocculators. based on a blowdown rate of 5419 l/kkg (1300 gal/ton).
after Loads
The 24-hour maximums are generally twice the 30 day averages and based upon maximum concentrations found at exemplary plants, or those which might be attained during system upsets or the like. In the case of phenol, the limitations are 1.5 times the 30 day average.
STARTUP AND SHUTDOWN PROBLEMS
There have been no problems of consequence identified in connection with the startup or shutdown of production facilities insofar as waste water control and treatment is concerned. As often as not, scrubber water continues to flow during such periods. There might be some upsets in undersized lagoons or clarif iers used in once-through systems if the water flow is abruptly started after a shutdown. Proper operating procedures can easily handle such occurences and there would be little or no effect in sufficiently large facilities.
Loss of power can effect most of the treatment systems such as chemicals addition for flocculation, cyanide destruction, or chrcmium reductionprecipitation. In such' cases, however, the production ~recess also will stop and little effect on waste water treatment would result.
127

{
Table 91 Ii"IDUS'l'l{Y Cl\'I'IT.OHY I OPIN I'UHNl\CLS 11rrll \'lTT l\In POI..Illl'IOl'l CONTmr.s
Level 1 Effluent Level 2 Lfflucnt
kq/r.~Jhr lJ •/n"l1r 111q/l 30 day l\vcrage 24 hr r laxli;1un1
kc_r/m.Air 1b/1~7'vl.r r.\(1/1 30 dJ.fr{'vcrcic;c 24 hr ;.:ixir:<uu,
k_,/r:"f..l1r /nc .. 1u: m:;;/l kcj/nnir f;,/J:,,;.r r.'Jll luw liaste Load
Suspcrilcd Si;:>lids 24.0 52.8 1460 .lGO .352 25. .319 .703 so. .012 • 02G 15 • .024 • 0'.12 30 • '~'otal Chromium .078 .172 4.7G .0032 .007 .5 .006 .014 1. .0004 .0009 .s .0008 .0017 1. llcx.avalcnt
I-' Chror:iiur:1 .oos .012 .32 .0003 .0007 .os .0006 .0014 .1 .00004 .0001 .05 .00008 .0002 .1 N Manganese 10.07 22.17 613 .032 .070 s. .064 .141 10. .0039 • 008(i s . .008 .017 10. ro
Value Value Value
pH 7.2 6.0 - 9.0 6.o·- 9.o
l/riwhr 'i.[al/mwhr l/rnwhr c;ral/r.whr l/n:hr oal/rw!u"
Flew 16,410 4335 6382 1686 783 207

Suspended Solids Total Chranium
I-' Hexavale.1t ~ Chrcmi.um
Total Cyanide Manganese Phenol
Flovt
pH
Table 9 2 INDUSTRY CATEXDRY II roJERED ELECTRIC FURN1\CES AND OI'HER SMELTING OPERATIC.NS
WITH WET AIR POLLUI'ICN CONl'ROL DE.VICES
Level I Effluent Level 2 Effluent Raw Waste Load 30 DaJt Average 24 hr Maximum 30 Day Avera9e 24 hr Maximum
k9/nwhr lb/mwhr m<J/l kg/rrwhr /rrwhr rng/l kgjmwhr lbl'.'.rrwhr !1971 kg/mwhr lb/mwhr m::i/l kg/mwhr lb/mwhr llX]/l 13.02 2~ 1555. 0.209 0.461 25. 0.419 0.922 50. 0.016 0.035 15. 0.032 0.071 30.
0.040 0.088 4.76 0.004 0.009 0.5 0.008 0.018 1.0 0.0005 0.0012 0.5 0.001 0.002 l.O
0.003 0.006 0.32 0.0004 0.0009 0.05 0.0008 0.0018 0.1 0.00005 0.0001 0.05 0.0001 0.0002 0.10 0.021 0.046 2.49 0.002 0.005 0.25 0.004 0.009 0.5 0.0003 0.0006 0.25 0.0005 0.001 0.5 3.74 8.24 447. 0.042 0.092 5.0 0.084 0.184 10. 0.005 0.012 5. 0.011 0.023 10. 0.061 0.134 7.27 0.004 0.009 0.5 0.006 0.013 0.7 0.0002 0.0005 0.2 0.0004 0.0009 0.4
g:al£'.'.m.ihr l/rrwhr gal/rrwhr llmNhr gal/rrwhr l/rrwhr
2210 8365 2210 8365 280 1060
Value Value Value
6.0-9.0 6.0-9.0 6.0-9.0

f-' w susF€J1d.Erl Solids 0 Total ChrC11.ium
M.:mganese
pl!
FlCM
P"1w \·iaste Load kg;kkg 1L/ton
J2rocessed I::roccssed ~ 46.0 91.9 864.
Table 93 IlIDUS'rRY CATEGORY III SLl\G I'R<XXSSING
Level 1 Effluent 30 Datt l\vcrage 24 hr Max.i.ruM
kg/kkg i/ton kq/kkg lb/ton process al i;;rocessed rrq/l 12rocessed [!recessed
1.330 2.659 25. 2.659 5.319 0.109 0.217 2.04 0.026 0.053 o.s 0.053 0.106 2.87 5.74 54. 0.266 0.532 s. 0.532 1.064
Value Value
6.2 6.0 - 9.0
l/kkq $lill/ton l/kkQ 2al/ton
53,100 12,750 53,100 12,750
Level 2 Effluent 30 DatEl\vera:;ze 24 hr ~ 'laxinim
kq/kkg /ton kg/kkg lb/ton rrq/l t:;rocesscd Erocessro !!!!L!, 12rocessed processed !!IL.!. so. 0.136 0.271 25. 0.271 0.542 so. 1. 0.0027 0.0054 o.s 0.0054 0.011 l.
10. 0.027 0.054 s. 0.054 0.108 10.
Value
6.0 - 9.0
~ lb/ton
5419 1300

SECTION VIII
COST, ENERGY AND NONWATER QUALITY ASPECT
Capital and operating cost information was obtained from each plant surveyed. The capital costs (per mw capacity) for water treatment systems at the plants surveyed varied from $5,581 (for an extensive lagooning system with a clarifier) to $21,760 (for a treatment and recirculation system). Operating costs varied from a low of $0.010/mwhr (for settling ponds) to a high of $0.652/mwhr (for a treatment and recirculation system).
Capital costs are given in terms of installed capacity costs in terms of units of production and also in terms flows. These costs were based upon cost of capital at an of 8 percent, and a depreciation period of 15 years.
and operating of waste water interest rate
Capital costs have been adjusted to August, 1971 dollars using Chemical Engineering Plant Cost Index (1957-59=100). ~his index been indicated by a consultant to The Ferroalloys Association to be indicative of cost changes in the industry. Operating costs have adjusted when necessary on the basis of an average of 3.5 percent year.
the has
best been per
Power costs were calculated on the basis of flow rates and pumping head, and have been assumed at one cent per kwhr, which is the cost used in the EPA-TFA Air Pollution Study (Ref. 32). This estimate has been confirmed by The Ferroalloys Association as being equal to the average cost in the industry.
The cost of land was not included as part of the total investment, since it is thought that very few (if any) plants will need to purchase land for wastewater treatment. Of the seven plants which were visited which used some type of wet air pollution control system, six were sampled and are discussed in Section VII. Three of the plants which were visited had multi-acre lagoon systems, which could either be utilized as part of wastewater treatment system, or used for landfilling sludge. The other four plants had varying degrees of treatment systems presently in use. Those two which appeared to have the least amount of land available, are in such position as to already meet all (or most of) the standards. The remaining two plants appeared to have sufficient land so as not to require the purchase of additional land. The treatment system at Plant D, for example, was housed in a building about 50 1 x 100 1 with two lagoons totalling about another 50' x 100'. Being generous, this would give a total land requirement of about a third of an acre. Therefore, it is not anticipated that the cost of acquiring land for those few plants which may require it would add more than $2,000 to the total investment cost. Additionally, the cost would be for the entire plant, not merely per mw of capacity, so that for a small, 20 mw plant. the
131

added investment for land would probably be less than 1 percent of the cost of the treatment system.
The following bases were used for cost calculations by category and Treatment Level:
category I, Treatment Level 1.
costs were developed for the treatment system as shewn in figure 17, on the basis of a 63.1 l/sec (1000 qpm) flow rate. At a water use of 6362 l/mwhr (1686 gal/mwhr], this is equivalent to the flow rate from a furnace operating at 35 mw. The costs include mechanical equipment, tanks, piping, valves, electrical, engineering, installation, etc. They are based upon the complete system less the sand filter and recirculation and may, therefore, be somewhat high, since a particular plant may not require all the treatment steps. The investment costs will probably be less (per mw) for a plant larger than the model, and greater for a plant smaller than the model.
Operating and maintenance costs at this level of estimation are best figured as a percentage of capital costs for similar type plants. The "Inorganic Chemicals Industry Prof ile11 indicated for 59 plants surveyed operating costs per annual unit of production equal to 28 percent of the capital cost per annual unit of production. The operating costs at Plant c are equal to 23.4 percent per year of the capital cost. The operating costs at Plant D are equal to 23.0 percent of the capital cost. The operating costs at Plant B are equal to 30.9 percent per year of the capital costs. Operating costs are thus estimated on the basis of 30 percent per year of the estimated capital cost, prorated as at Plant c.
category I, Treatment Level 2.
costs expanded from Level 1, above, to include and sand filtration, with a proportionate operating costs.
category II, Treatment Level 1.
costs of recirculation increase in annual and
costs were developed as for category I, Level 1. 63.1 l/sec (1000 gpm) at a use comparable to that at Plant B, sample point B, (8365 l/mwhr [2210 gal/mwhr]), is equivalent to the flew from a furnace operating at 27 nw. As before, the investment cost per mw will be somewhat higher for small plants and less for large plants.
Category II, Treatment Level 2 and 3.
same as for category I, Level 2, but based on 27 mw furnace.
132

Category III, Treatment Level 1.
Costs were calculated for two clarifier flocculators, with the necessary piping, pumps and other appurtenances. costs were based upon the use of 53,148 l/kkg (12,750 gal/ton) processed.
category III, Treatment Level 2.
Costs are greater than for Level 1 by the addition of pumps and pipes necessary for recycle.
The costs for each are summarized in Tables 94 and 95.
Figures 18 through 20 show the relative costs of treatment for reduction of effluent loads of the critical pollutants from the raw wastes. ~hese curves provide graphical information of interest, but must be read in the context of the previously described Treatment Levels to be of value.
133

........ w ~
Table 94. TPJ:ATl-lll'lT LI:.VLL COSTS ON UUIT OF PRODUCTIQ-J BASIS (costs on basis of m-1 and ffi.'lhr unless noted thus*)
Annual Costs ( $ per rrwhr or ton) Inudstry Category Investment Operating Cost
and Treatment Level ($ per m.-: or t1xi) Capital Depreciation less rower
Category I: Treabnent Level 1 17,143 0.103 0.138 0.606 Treabnent Level 2 21,063 0.127 0.169 o. 745
Category II: Treabnent Level 1 22,222 0.134 0.178 0.785 'rreabnent Level 2 27,303 0.165 0.219 0.965
Category III: Treabnent Level 1 2.526* 0.344* 0.459* 0.421* Treatment Level 2 2,604* 0.357* 0.485* 0.421*
:rower 'Ibtal
0.012 0.859 0.015 l.056
0.016 1.113 0.019 1.368
0.051* 1.28* 0.051* 1.31*

Table 95. Treatment Level Costs on \Jastewater Flow Basis
Industry Category Annual Costs ($ per l,ooo ~al)
Operating Cost an:J. Treatment Level ($ per gpn) Capital Depreciation less Power Power 'lbtal
Category I: TreatT.lent Level 1 600 0.057 0.076 0.336 0.007 0.476 ...... Treatnent Level 2 737 0.070 0.094 0.413 0.008 0.585 w
U"I
Category II: Treat:rrent Level 1 600 0.057 0.076 0.336 0.007 0.476 Treatment Level 2 737 0.070 0.094 0.413 0.008 0.585
Category III: Treatment Level 1 285.29 0.027 0.036 0.033 0.004 0.100 Treatrient Level 2 294.12 0.028 0.038 0.033 0.004 0.103

I .859 r----- , __ _
~ I
ti)
§
i 0 20
FIGUP.J:: 18.
Ca3T OF TREATMENT vs. EFFliJINl' REDUCI'IOO CATEGORY I
40 60
PEIONI' RL"'·OVED
80 100

0 20
FIGURC 19.
COST OF TREA'.Il1U.1T vs. EFFLUEN'l' REDUCTICT'J CATEGORY II
40 60 80 100

0 20
FIGURL 20.
ca:i'T OF TREl\TMINI' vs • I'.FFllJENT REDUCTia'J CATEGORY III
--,-----,----.-----------,----...----------1 40 60 80 100

INCREMENTAL COSTS OF ACHIEVING LEVELS OF TREATMENT TECHNOLOGY
The cost of achieving the various levels of treatment technology in the industry will vary from plant-to-plant, depending upon the treatment currently in use. The best estimates of these costs are given below by category, based upon the assumed levels of present technology in "typical" plants.
category I
The "typical" plant probal::ly has a lagoon in which the scrubber wastewater is treated by plain sedimentation prior to discharge. Although this •typical' lagoon may be usable as part of a new treatment scheme, it is likely that almost all of the costs shewn in Table 94 would be incurred to bring the plant's effluent down to the suggested limitation. If the plant were to go to Level 2 from this base, it would require only the addition of a sand filter and recirculation system, i.e., the arithmetic difference in costs between Levels 1 and 2. Therefore, the incremental cost of reaching Level 1 would be $17,143/mw in investment, and $0.859/ITMhr in annual costs. The additional cost of reaching Level 2 would be $3,920/mw for investment, and $0.197/mwhr in annual costs.
category II
The "typical" plant probably has a lagoon in which the scrubber waste water is treated by sedimentation and for destruction of cyanides prior to discharge. Again, it may be assumed that the cost of reaching Level 1 is 100 percent of that shown, and the cost of reaching Level 2 from Level 1 is the arithmetic difference. Therefore, the incremental cost of reaching Level 1 would be $22,222/mw in investment, and $1.113/mwhr in annual costs. The additional costs to reach Level 2 would be $5,081/rnw in investment, and $0.255/mwhr in annual costs.
Category III
The "typical" plant again for this Category probably has a small lagoon and would probably require expenditure of 100 percent of the costs shown, which makes the incremental cost for Level 1 $2,526/tpd for investment, and $1.28/ton for annual costs. To reach Level 2 would require an additional investment of $78/tpd, and increase annual costs by $0.03.
ENERGY AND NON-WATER QUALITY ASPECTS
There are significant energy and nonwater quality aspects to the selection and operation of treatment systems. These may be considered as land requirements, air and solid waste aspects, by-product potentials, and energy requirements.
139
~~~irement~
One of the important aspects in the selection of wastewater treatment systems in this industry is the land required for water treatment systems. Many plants in this industry have extensive land areas available for such uses and may elect to use this land, and existing lagoons, as part of their water treatment system. Other plants might possibly not have land readily available and would have to select alternative treatment systems such as the use of filters for sludge dewatering, rather than sludge lagoons, for this reason alone.
Air and Solid ~a~
The solid waste produced by treatment of waste waters in the industry derives principally from the smelting operation as waste from air polluticn controi devices. The solid waste from air pollution controls is produced whether a dry or wet system is utilized and varies only in that the former produces a slurry or sludge, the latter a fine dust. The slurry or sludge is generally accumulated in sludge lagoons, while the dry dust may be bagged and landfilled or simply piled. More careful attention Should be directed to the disposal of these potentially harmful materials. Possible improvements might be landfilling in a sealed site, or encapsulation in concrete or polymers. There has been little success in efforts to agglomerate these solids for recharging to the smelting furnaces, although it is probable that dry dust could be utilized more easily than wet sludge.
In the case of metals refining at cne plant, a baghouse is to replace a wet scrubber and the particulate matter is to be leached to produce the electrolyte for electrolytic manganese production. ~he potential for such recovery methods is probably very limited, since this refining process is not a common operation. Although there has been some discussion in the industry of reusing the particulates collected in baghouses as part of the furnace charge, to the best of our knowledge this has not actually been attempted as yet.
Slag concentration is used at a number of plants to recover metal values and as a by~product, to produce slag for sale or other use. The sale or use of slag varies from place to place. In one location slag can be readily sold at a good price, since stone must be im~orted from a distance. This is probably not a common situation. At another plant all of the slag produced is used on-site for road building. At other plants, markets or uses for slag cannot be found.
By-product recovery in the case of the further use of the metals refining particulates reduces a solid waste problem and does not add to potential water pollution, since the particulates replace ore in an
140

electrolytic process. Slag concentration reduces solid wastes, but results in a water pollution potential not otherwise present.
~gy Req~ments
The use of recirculation cooling water systems is primarily due to water supply limitations. Plants that use well water supplies generally do not have enough water for once-through cooling systems. ~hose which use purchased city water find that water costs favor recirculating systems.
Power requirements for waste water treatment systems are generally low. Power uses range from less 0.07 percent to 1.3 percent of the power used in the smelting furnaces. The higher figure is fer the most powerintensive system found during the survey, which uses clarifierflocculators, sand filters, softening, and recirculation of process water. The lower figure is for a system using lagoons, a clarifierflocculater, and recirculation. This compares with the use of about 10 percent of the productive power for operation of high-energy scrubbers for air pollution control.
Moni!£2ring
For the purpose of writing a permit, one would need to know historical production figures for the plant. These may be in the form of tonnage of the various products (broken down by product, and also by the type of furnace and air pollution control system) , or else in the form of power consumption, broken down by the type of furnace and air pollution control system.
For example, Plant X may have produced 200 tons per day of HC ferrcmanganese in open electric furnaces with wet scrubbers, 150 tons per day of silicomanganese in a covered electric furnace with a wet scrubber, and 350 tons per day of 50 percent ferrosilicon in furnaces with dry or no air pollution control equipment. ~ese tonnage figures may then be converted, using Table 18, into power consumption figures.
As another example, Plant Y may with wet air pollution control furnace with a wet scrubber, bag houses.
An alternative for plants which data, would be the use of transformer rating.
have used 110 mwhr/day in open furnaces systems, 290 mwhr/day in a covered
and 480 mwhr/day in furnaces with
do not posses historical production capacity figures, such as the furnace or
Historical data covering a year's time would probably be necessary, although in the case of a plant which has several furnaces out of operation, but plans to use these in the future, a longer period might be necessary.
141

Once the permit has been issued, the plants would need to know the appropriate flows and concentrations of the pollutant parameters so that the pollution load from the plant may be reported as lb/day.
142

SECTION IX
BEST PRACTICABLE CONTROL TECHNOLOGY CURRENTLY AVAILABLE, GUIDELINES AND LIMITATIONS
INTROCUCTION
The effluent limitations which must be achieved by July 1, 1977 are to specify the degree of effluent reduction attainable through the application of the Best Practicable Control Technology currently Available. This is generally based upon the average of the best existing plants of various sizes, ages and unit processes within the industrial category and/or sutcategory.
consideration must also be given to:
a. The total cost of application of technology in relation to the effluent reduction benefits to be achieved from such application;
b. the size and age of equipment and facilities involved;
c. the processes employed;
d. the engineering aspects of the application of various types of control techniques;
e. process changes;
f. non-water quality environmental impact (including energy requirements).
Also, Best Practicable Control Technology Currently Available emphasizes treatment facilities at the end of a manufacturing process but includes the control technologies within the process itself when the latter are considered to be normal practice within an industry.
A further consideration is the degree of econorric and engineering reliability which must be established for the technology to be "currently available." As a result of demonstration projects, pilot plants and general use, there must exist a high degree of confidence in the engineering and economic practicability of the technology at the time of commencement of construction or installation of the control facilities.
Definition of what constitutes 1 best practicable' technology for many industries involves, at first, a general review of the industry to determine the best technologies being practiced in the industry. Then, after closer review and investigation of these technologies, the •best practicable' technology would be assessed as the average of the best,
143

though not necessarily the best technology, after taking into account information relating to other factors spelled out in the Act. In those industries where present treatment is uniformly inadequate, a higher degree of treatment than is presently practiced may be required, based on a comparison with existing treatments for similar wastes in other industries. Factors for determining the 'best available' technology are similar, except that rather than assessing the average of the best, the focus is on the very best technology currently in use or demonstrably achievable.
Under thi3 analysis of the statutory standard, it is the opinion of the Agency that it is not necessary that 'best practicable' technology be currently in use as a single treatment.
EFFLUENT REDUCTION ATTAINABLE THROUGH THE APPLICATION PRACTICAELE CONTROL TECHNOLOGY CURRENTLY AVAILABLE (BPCTCA)
OF BEST
Based upon the information contained in sections III through VIII of this report, a determination has been made that the degree of effluent reduction attainable through the application of the best practicable technology currently available is the application of the levels of treatment described in Section VII as the Level 1 technologies to the various industry categories as shown in Table 96.
Table 96. BPCTCA EFFLUENT GUIDELINES TREATMENT EASIS
I
II III
Category I
Treatment Basi=s~~-
Chemical treatment, clarifier-flocculators, recirculation at the scrubber Chemical treatment, clarifier-flocculators Clarifier-f locculators
New, larger open furnaces have generally been equipped with high-energy scrubbers when wet air pollution controls have been selected. The water use at the scrubber is high due to the volume of the off-gases to be treated, but the waste water effluent volume is reduced by recirculation at the scrubber and this lowered volume is that to be treated for discharge. The costs here would be those given in Tables 94 and 95, Category I, Treatment Level 1. The alternative use of steam/hot water scrubbers or electrostatic precipitators should result in even less
144

costs if treatment is for discharge, since waste water volumes would be less.
Although the entire treatment system is not presently in use at any one plant, portions of the suggested technology as shown in Figure 17 are readily transferable from other plants within this or similar industries. No innovative or new technology is involved - rather, the application of existing and fairly pedestrian technology to this industry's problem.
Category II
Covered furnaces have generally been Eoquipped with disintegrator scrubbers in the past, although so;ne of the newer furnaces are equipped with high energy scrubbers. The volume to be treated for discharge was taken as that of Plant B, sample point D. As in Category I, the usage of steam/hot water scrubbers should significantly reduce treatment costs, since water volumes would be less.
Although the technology is not in use at any one plant, portions are in use at various plants and should be r€adily transferable.
Category IIT
The loads attainable by the use of such technology described as Level 1 for this category are probably as good as could be expected if water is us~d on a once-through basis. The technology of clarification and flocculation i~, again, rather coI1monplace. Other methods for sedimentation (such as lagoons) might be used f cr meeting the recommended guidelines, if sufficient land is available. The suggested technology, however, minimizes land requirements.
Summary
The suggested Guidelines do not appear to present- any particular problems in implementation. The processes involved are all in present use in ferroalloy plants, are coFmon waste water treatment methods and no engineering problems are involved in design er construction. Process changes are not :cequired in any existing plants and the size or age of facilities has little or no bearing on the applicability of these methcds.
Some additional solid wastes are generated by the suggested treatment methods since better treatment than is presently practiced is proposed. Power consumption for treatment is about 1 percent of that used in the furnaces.
The effluent limitations here apply to measurements taken at the outlet of the last waste water treatment process unit.
145

The effluent loads, together with estimated costs applicable to the Best Practicable Control Technology currently Available Guidelines and Limitations are summarized in Table 97.
APPLICATION OF LIMITATIONS
The application of these guidelines and performance standards to specific plants is intended to be on the basis of a "building block" approach to define the effluent limits from the plant as a whole. Consider, for example, a ferroalloy plant with the following processes:
30 mw open furnace with an electrostatic precipitator with water sprays 20 mw open furnace with a baghouse 15 mw covered furnace with a scrubber Slag concentrating, feed rate 9.07 kkg (10 tons)/hr Exothermic smelting, producing 4.54 kkg (5 tons)/day.
The total permissible 30 day average load of suspended solids would be calculated by category as follows:
category I: (30 X 24) mwhr/day X 0.352 lbs/mwhr = 254 lbs/day
category II: (15 X 24} mwhr/day X 0.461 lbs/mwhr = 166 lbs/day 5 ton/day X 3 X 0.461 lb/ton product = 7 lb/day
category III: 10 ton/hr x 24 hr/day x 2.659 lb/ton processed = 638 lb/day
Total plant load, lb/day suspended solids = 1,065 lbs/day ( Lf84 kg/day)
146

I-'
""' -..J
Susr..ended Solids TotJ.1 Chromium llexavalcnt
Chran.ium Manganese 'Iotal 01anide Phenol pll
Cost Itea
Investnent Car.ital.Costs Depreciation Operating Costs
Less I'01-.'er Pa1,;er Costs Total Operating
Costs
Table 97. DEST PHl\C'l'ICl\BLE CCllTROL 'l'IDJNOitX:."Y CURRUJTLY iWl\IUillIL QJIDDLINl:S l\ND IJ}Tl.'ATIWS
CATIX'.clRY I 30 ~ Average 24 hr Maximum
kg/m.- lb/nwhr kg/11111hi lli/r.-whi
.160 .352 .319 • 703
.0032 .007 .006 .014
.0003 .0007 .0006 .0014
.032 .070 .064 .141
6.0 - 9.0
$/nw $/mwhr
17,143 0.103 0.138
0.606 0.012
0.859
. CATEGORY II* 30 Day l\vcril<JC 24 hr : llxfo1um
kg/mmr lL/ni'.lhr k<J/mwhi 1L/1,1wnr
.209
.004
.0004
.042
.002
.004
$/mw
22,222
.461
.009 .419 .008
.0009 .ooos
.092 .004
.005 .004
.009 .006 6.0 - 9.0
0.134 0.178
0.785 0.016
1.113
.922
.018
.0018
.184
.009
.013
C'l\TL'GORY III 30 Day Average 24 hr Maxiwum
k0/kkg lb/ton kg/kkg lb;ton
1.330 2.659 2.659 .026 .053 .053
.26.6 .532 .532
G.O - 9.0
$/ton/da;i::
2,526
$/ton
0.344 o.459
0.421 0.051
1.28
5.319 .106
1.064
*For nonelectric furnace srrelting operations, read WU.ts as kg/kkg (lb/ton), rather than Y...g/m.·1hr (lb/mwb.r), and multiply the metric unit limitations by 3.3 and t.'1e Ihglish wll.t limitations by 3.0.


SECTION X
BEST AVAILABLE TECHNOLOGY ECONOMICALLY ACHIEVABLE, GUIDELINES AND LIMITATIONS
INTRODUCTION
The effluent limitations which must be achieved by July 1, 1983 are to specify the degree of effluent reduction attainable through the application of the Best Available Technology Economically Achievable (BATEA). BATEA is determined by the very best control and treatment technology employed by a specific point source within the industry category or by technology which is readily transferable from another industrial process.
Consideration must also be given to:
a. The age of equipment and facilities involved;
b. the process emfloyed;
c. the engineering aspects of the application of various types of control techniques;
d. process changes;
e. cost of achieving the effluent reduction resulting from the application of this level of technology;
f. non-water quality environmental impact (including energy requirements).
Also, Best Available Technology Economically Achievable assesses the availability of in-process controls as well as additional treatment at the end of a production process. In-process control options include water re-use, alternative water uses, water conservation, by-product recovery, good housekeeping, and monitor and alarm systems.
A further consideration is the availability of plant process changes and control techniques up to and including "no d:scharge" of pollutants. Costs for this level of control are to be the top-of-the-line of current technology subject to engineering and economic feasibility.
EFFLUENT REDUCXION A~~AINABLE THROUGH THE APPLICATION OF BEST AVAILABLE TECENOLOGY ECONOMICALLY ACHIEVABLE (BATEA)
Based upon the information contained in Sections III through VIII of this refort, a determination has been made that the degree of effluent
149

reduction technology treatment categories
Table 98.
attainable through the application of best available economically achievable is the application of the levels of described in section VII as Level 2 to the various industry as shown in Table 98.
BATEA EFFLUENT GUIDELINES TREATMENT BASIS
_Industry Catego~ 'Ireatment Basis
I
II
III
Chemical treatment, clarif ier-f locculators, sand filters, recirculaticn Chemical treatment, clarifier-f locculators, sand filters, recirculation Clarif ier-f locculators, recirculation
These guidelines have been selected on the basis of the following considerations and assumptions.
Category I
The effluent load reduction above Level l is primarily due to the effluent reduction attained through recirculation of the scrubber water, although some of the reduction is due to lower concentrations in the effluent. Portions of the technology described are in use at various ferroalloys plants, and no new or innovative technology is required.
Consideration was given in category I to the replacement of existing scrubbers with fabric filter collectors, which would result in zero discharge of pollutants. However, the large investment costs required (from $1.19 to 2.34 million for a 30 mw furnace vs approximately $.632 million for a scrubber waste water treatment system) probably makes this technology economically unachievable, particularly so when it would cause the premature retirement of existing air pollution control systems. Additionally, some plants may not find baghouses to be the most efficient or economical means for reduction of air emissions.
Category II
Again, load reduction above Level 1 is due primarily to the reduction in effluent volume attained by recirculation. Although Plant C was achieving 97 percent recirculation of the scrubber water, this high a proportion may not be feasible for all plants and the standard was so selected. As before, no innovative technology is required.
150

Category III
since water is used only as a transport or cooling medium in slag processing, the quality of recirculated water is of importance only to the extent of its abrasiveness on valves and pumps. Operation with minimal discharge (less than 2 percent) of total circulation is practiced at one plant. However, since differing conditions may require greater blowdown rates, a higher blowdown rate has been used to calculate the guidelines. It is intended that removal of suspended solids be accomplished prior to recirculation, so that valves, etc. will not be unduly abraded. The engineering problems are minimal, requiring only recirculation pumps and clarif ier~f locculators close to the slag processing equipment.
Summary
The suggested Guidelines present no implementation from an engineering aspect changes. water reuse and good housekeeping equipment and facilities are of no particular
particular problems in and require no process
are emphasized. Age of importance.
No additional solid wastes of significance are created by the suggested treatment methods. Increased power consumption may amount to as much as 1.3 percent of furnace power in the most energy intensive water treatment system. The effluent limitations here apply to measurements taken at the outlet of the last waste water treatment process unit. It is not judged to be practical to require the treatment or control of runoff due to storm water for the 1983 standards for existing plants. such treatment or control would be very difficult to accomplish in older plants having many years of accumulations of slag, collected airborne particulates, etc. Depending upon the geography of a plant site and the acreage involved, costs would vary widely from plant to plant. Some such containment as earthen dikes around production areas could conceivably be used. In one steel mill where it was proposed to collect runoff and treat the collected water in a lagoon, the costs involved were equal to the total expenditures for a minimum discharge recirculation system.
The effluent loads, together with estimated Best Available Technology Econcmically summarized in ~able 99.
151
costs, apt:licable to Achievable Guidelines
the are

APPLICATION OF LIMITATIONS
The application of these guidelines and performance standards to specific plants is intended to be on the basis of a "building block" approach to define t-,he effluent lir.1its from the plant as a whole. The application is as illustrated under Best Practicable Control Technology Currently Available in Section IX, except that with Best Available Technology Econcmically Achievable, the permissible suspended solids load for the h"jpothetical plant would be 97 lb/day (44 kg/day), rather than 1,065 lb/day.
152

I-' Vl w
Suspended Solids Total Chromium Hexavalent
Chromium Total Cyanide }(anganese Phenol pH
Cost Item
Investment Capital Costs Depreciation Operating Costs
Less Power Power Costs Total Operating
Costs
Table 99 BEST AVAILABLE TECHNOLOGY ECONOMICALLY ACHIEVABLE GUIDELINES AND LIMITATIONS
CATEGORY I CATEGORY II* 30 Da:i: Average 24 hr Maximum 30 Dal Average 24 hr Maximum
kg/mwhr lb/mwhr kg/mwhr lb/mwhr kg/mwhr lb/mwhr kg/mwhr lb/mwhr
.012 .026 .024 .052 .016 .035 .032 .071
.0004 .0009 .0008 .0017 .0005 .0012 .001 .002
.00004 .0001 .00008 .0002 .00005 .0001 .0001 .0002 .0003 .0006 .0005 .001
.0039 .0086 .008 .017 .005 .012 .011 .023 .0002 .0005 .0004 .0009
6.0-9.0 6.0-9.0
$/mw $/mwhr .,/mw $/mwhr
21,063 27,303 0.127 0.165 0.169 0.219
0.745 0.965 0.015 0.019
1.056 1.368
CATEGORY III 30 Day Average 24 hr Maxirn•Jm
kg/kkg lb/ton kg/kkg lb/ton processed processed processed
.136
.0027
.027
$/ ton/"i..r
2,604
.271
.0054
.054
.271
.0054
.054
,6.0-9.0
$/ton
0.357 0.485
0.421 0.051
1.31
processed
.542
.011
.108
*For non-electric furnace smelting operations, read units as kg/kkg (lb/ton), rather than kg/mwhr (lb/mwhr) and multiply the metric unit limitations by 3.3 and the English unit limitations by 3.0.


INTRODUCTION
SECTION XI
NE~ SOURCE PERFORMANCE STANDARDS AND PRETREATMENT STANDARDS
The effluent limitations which must be achieved by new sources, i.e., any source, the construction of which is started after publication of new source performance standard regulations, are to specify the degree of treatment available through the use of improved ~reduction ~recesses and/or treatment techniques. Alternative processes, operating methods or other alternatives must be considered. The end result is to identify effluent standards achievable through the use of improved production processes (as well as control technology). A further determination which must be made for new source performance standards is whether a standard permitting no discharge of pollutants is practicable.
Consideration must also be given to:
a. the type of process employed and process changes;
b. operating methods;
c. batch as opposed to continuous operation;
d. use of alternative raw materials and mixes of raw materials;
e. use cf dry rather than wet processes;
f. recovery of pollutants as by-products.
In addition to recommending new source performance standards and effluent limitations covering discharges into waterways, constituents of the effluent discharge must be identified which would interfere with, pass through or otherwise be incompatible with a well designed and operated publicly owned activated sludge or trickling filter waste water treatment plant. A determination must be made as to whether the introduction of such pollutants into the treatment plant should be completely prohibited.
EFFLUENT REDUCTION ATTAINABLE THROUGH THE APPLICATION 0F NEW SOURCE FERFORMANCE STANCARCS
Based upon the information contained in section III through VIII of this report, a determination has been made that the degree of effluent
155

reduction attainable by new sources is the same achieved by application of the levels of treatment described in section X and as shown in Table 100.
Table 100. NEW SOURCE PERFORMANCE STANDARDS EASIS
-------~
--~~~---~~~---·--~~------~---_In9.Y§~ Cate go r x ._._..!~r~e~a •. t.m--..;;;e=n~t._.B~a~s~1~·-s _________ ~
I
II
III
--~--
Chemical treatment, clarifier -flocculators, sand filters, recirculation. Chemical treatment, clarifier -flocculators, sand filters, recirculation. Clarif ier-flocculators, recirculation
These performance standards have been selected on the basis of the following assumptions and considerations:
category I
Although baghouses may be used for air pollution control, because of energy, efficiency and cost considerations some plants may elect to use various •wet• systems, such as steam/hot water scrubbers or electrostatic precipitators. Therefore, the treatwent s~ecified for BATEA is that which will minimize waste discharge for those plants choosing to utilize wet air polluticn control systems.
category II
Although the possibility remains of developing baghouses which are explosion-froof and thus applicable to covered furnaces, it is by no means clear that this is a practical alternative. There is one such baghouse on a covered furnace in the world, but none in the United states. One other furnace utilizes a "candle filter" (ceramic filter) for dry cleaning of CO gas. At this time, and with only two closed furnaces in the world so equipped, it does not seem ~ractical to require the use of a dry dust collection system. Therefore, the treatment level specified for BATEA, Category II appears to be that which will minimize waste discharge.
category III
Some plants may be able processing operations by the blowdown will be characteristics, other
to achieve no discharge of pollutants from slag discharging blowdown into closed lagoons, where evaporated. However, due to varying soil plants, if attemfting to use such techniques,
156

would have leaching to ground water. Sealed lagoons may not be practicable for all plants, and additionally, may require large land areas. Therefore, the BATFA treatment is selected as the basis for limitations from new sources.
SUMMARY
The effluent leads, together with estimated costs, applicatle to the New source Performance Standards are summarized in Table 101.
For the new source performance standards, it should be additionally specified that all measurements taken for purposes of meeting the effluent limits should be at the plant outfall, if the new source is a new plant. This means, in effect, that run-off from materials handling and storage, slag piles, collected air borne particulates, and general plant areas must be collected and treated or that storm water must not initially contact such sources of pollutants. such control measures can rather easily te built into new plants, but would be very difficult to accomplish in elder plants, having many years of accumulation of slag, collected airborne particulates, etc. Practical control measures might include impoundment of storm water and use of such water as an intake source or landfill of waste particulates. The option of treating runoff to meet the effluent standard would, of course, be available. These standards should be applied by the "building block" approach, as discussed in section IX. If the hypothetical plant of that section were a new source, the permissible suspended solids discharge would be 97 lb/day (44 kg/day) •
PRETREATMENT STANDARDS
The raw wastes from the three categories included in this document are all generally high in metals (manganese and chromium (total and hexavalent)), as well as suspended solids. The wastes from Category II additionally contain cyanide and phenols. The metals are of particular concern, if the wastes are discharged directly to publicly owned treatment systems, since they tend to pass through such treatment works, essentially untreated or removed. The other parameters are of less concern, since (in the concentrations found in the typical raw waste in this industry), they will be treated or removed by the municipal system, and should, for this industry, be classified as "compatible pollutants." The metals, however, fall under the general classification of "incompatible pollutants," and therefore, a determination has been made that the wastes from these three categories should be treated to the level of best practicable technology (for existing sources) and to the level of the new source performance standards (for new sources).
The pretreatment standards under section 307(c) of the Act, for a source within the ferrcalloy industry which is an industrial user of a publicly owned treatment works (and which would be a new source subject to section 306 of the Act, if it were to discharge to navigable waters),
157

Shall be the standard set forth in Part 128, 40 CFR, except that the pretreatment standard for incompatible pollutants shall be the standard of performance for new sources of that subcategory. If the publicly owned treatment works is committed, in its NPDES permit, to remove a specified percentage of any incom~atible pollutant, the pretreatment standard applicable to users of such treatment works shall be correspondingly reduced for that pollutant.
158

Table 101 NEW SOURCE PERFORMANCE STANDARDS
CATEGORY I CATEGORY II* CATEGORY III 30 Daz Average 24 hr Maximum 30 Daz Average 24 hr Maximum 30 Daz Average 24 hr Maximum
Suspended Solids Total Chromium Hexavalent
kg/mwhr
.012
.0004
lb/mwhr
.026
.0009
kg/mwhr lb/mwhr
.024 .052
.0008 .0017
Chromium Total Cyanide Manganese Phenol
.00004 .0001 .00008 .0002
.0039 .0086 .008 .017
pH
Cost Item $/mw
Investment 21,063 Capital Costs Depreciation Operating Costs
Less Power Power Costs Total Operating
Costs
6.0-9.0
0.127 0.169
0.745 0.015
1.056
kg/mwhr
.016
.0005
.00005
.0003
.005
.0002
27,303
lb/mwhr kg/mwhr
.035 .032
.0012 .001
.0001 .0001
.0006 .0005
.012 .011
.0005 .0004 6.0-9.0
0.165 0.219
0.965 0.019
1.368
lb/mwhr
.071
.002
.0002
.001
.023
.0009
kg/kkg lb/ton kg/kkg processed processed 2rocessed
.ll6
.0027
.027
$/ton/zr
2,604
.271 .271
.0054 .0054
.054 .054
6.0-9.0
0.357 0.485
0.421 0.051
1.31
*For non-electric furnace smelting operations. read units as kg/kkg (lb/ton), rather than kg/mwhr (lb/mwhr) and multiply the metric unit limitations by 3.3 and the English unit limitations by 3.0.
lb/ton 2rocessed
.542
.011
.108


SECTION XII
ACKNOWLEDGEMENTS
The Environmental Protection Agency would like to thank Dr. H.c. Bramer and Messrs. E. Shapiro and N. Elliott of Datagraphics. Inc. for their aid in the preparation of this report. Thanks are also given to the sampling crews (Messrs. D. Bramer, D. Riston, c. Caswell, E. D. Escher, E. Brunell, et al). Special thanks is also given to Ms. Darlene Speight of Datagraphics. Inc., Mrs. Nancy Zrubek and Ms. Patsy Williams of EPA for their long, late hours spent in the typing and retyping of this report.
The author would like to thank her associates in the Effluent Guidelines Division, particularly Messrs. Edward Dulaney, Walter J. Hunt, Ernst P. Hall, and Allen Cywin for their helpful suggestions and assistance.
Thanks also are expressed to Messrs. George A. Watson and Arthur M. Killan of the Ferroalloys Association for their valuable assistance.
Acknowledgement and appreciation is extended tc those personnel of the industry who cooperated in plant visitations and supplying of data incl•tding Dr. R.A. Person, Dr. C.R. Allenbach and Messrs. R. Bilstein and J.E. Banasik of Union Carbide Corporation; L.C. Wintersteen. W.A. Moore, aud L.A. Davis of Airco, Inc.; R.D. Turner and W.A. Witt of Chromium Mining and Smelting Corporation; c.G. Adler and E.W. Batchelor of Foote Mineral Company; F. Krikau and J.C. Cline of Interlak~, Inc.; and c.F. Seybold, M. Evans, and L. Risi of Shieldalloy.
Appreciation is also expressed to Mr. H: Rathman who acted as a consultant to Datagraphics, Inc. and provided invaluable assistance in preparation of this report.
Thanks are also given to Messrs. K. Durkee and J.O. Dealey of the Office of Air Programs, EPA, for their assistance during the course of this study.
Thanks are also given to the members of the EPA Working Group/Steering Committee for their advice and assistance. They are: Messrs. A. Brueckmann, s. Davis, M. Dick, T. Powers, R. Zene~, E. Lazar, Dr. H. Durham and Walter J. Hunt.
161


SECTION XIII
REFERENCES
1. compilation of Air Pollutant Emission Factors, U.S. Environmental Protection Agency, Office of Air Programs, February, 1972 (N.T.I.s. No. PB-209 559) •
2. Sherman, P. R. & Springman, E. R., "Operating Problems with High Energy Wet Scrubbers en Submerged Arc Furnaces", a paper presented at the American Institute of Metallurgical Engineers Electric Furnace Conference, Chicago, Illinois December, 1972
3. Scherrer, R. E., "Air Pollution Control for a Calcium Carbide Furnace", A.I.M.E. Electric Furnace Proceedings, Volume 27, Detroit, 1969, pages 93-98
4. Seybold, Charles F., "Pollution Control Equipment for Thermite Smelting Processes", A.I.M.E. Electric Furnace Proceedings, Volume 27, Detroit, 1969, pages 99-108
5. Person, R. A., "Control of Emissions frcm Ferroalloy Furnace Processing", A.I.M.E. Electric Furnace Proceedings, Volume 27, Detroit, 1969, pages 81-92.
6. Retelsdorf, H. J., Hodapp, E., & Endell, N., "Experiences with an Electric Filter Dust Collecting system in Connection with a 20-MW Silicochromiurn Furnace", A.I.M.E. Electric Furnace Proceedings, Volume 27, Detroit, 1969, pages 109-114.
7. Garnroth, R. R., "Operation of 30,000 - KW Submerged Arc Furnace on Silicomanganese", A.I.M.E. Electric Furnace Proceedings, Volume 27, Detroit, 1969, pages 164-166
8. Dehuff, J. A., Coppolecchia, v. D., & Lesnewich, A., "The Structure of Ferrosilicon", A.I.M.E. Electric Furnace Proceedings.
9. "Annual Statistical Report - American Iron and steel Institute 197011 , A.I.s.I., Washington, D. c. 80 pages
10. " 1967 Census of Manufactures ~ Blast Furnaces, steel Works, and Rolling and Finishing Mills", U. s. Department of Commerce, Bureau of the Census, MC67 (2) - 33A, 48 pages
11. Elyutin, v. P., et al "Production of Ferroalloys Electrometallurgy", Translated from Russian by the Israel Program for Scientific Translations, u. s. Department of commerce,
163

12. "Water Use in Manufacturing", 1967 Census of Manufactures, u.s. Department of Commerce, Bureau of the Census, ME 67 (1) -7, April, 1971, 361 i:ages.
13. Ferrari, Renzo, "Experiences in Developing an control System for a Submerged Arc Ferroalloy Journal of Metals, AFril, 1968, pp. 95-104.
~
Effective Pollution Furnace Operation",
14. "Statement for Relief from Excessive ImForts" The Ferroalloys Association, Washington, D. c. 1973, 15 pages.
15. communications with Mr. Edwin F. Rissman of General Technologies corporation - Trip Report from the Astatula, Ohio plant of Union carbide corForation, February 14, 1973.
16. Braaten, o. and Sandberg, c., "Progress in Electric Furnace smelting of Calcium Carbide and Ferroalloys", 5th International Congress on Electro-Heat, 7 Fages.
17. Scott, J. w., "Design of a 35, 000 K. w. High carbon Ferrochrome Furnace Equipped with an Electrostatic Precipitator", The Metallurgical Society of A.I.M.E., paper No. EFC-2~ 9 pages.
18. "A Study of Pollution control Practices in Manufacturing Industries - Part 1 - Water Pollution Control", Dun & Bradstreet, Inc., June, 1971.
19. Blackmore, Samuels., "Dust Emission Control Program Union Carbide corporation Metals Division", Air Pollution control Association, 57th Annual Meeting, June 21-25, 1964, 16 pages.
20. "Control Techniques for Emissions Containing Chromium, Manganese, Nickel, and Vanadium" Off ice of Air Programs, Environmental Protection Agency, 1973, (Unpublished).
21. Mantell, c. L., "Electrochemical Engineering," McGraw-Hill Book com~any, Inc., 4th Edition, 1960, pages 468-533.
22. Person, R. A., "Emission Control presented at the 4th Annual North conference, July 13-15, 1971, 30 pages.
of Ferroallcy Furnaces," Paper Eastern Regional Antipollution
23. smith, Robert & McMichael, Walter F., "Cost and Performance Estimates for Tertiary wastewater Treating Processes", United States Dept. of Interior, Federal Water Pollution control Administration, June, 1969, 27 pages.
24. "Pretreatment Guidelines for the Discharge of Industrial Wastes to Municipal Treatment Works", Environmental Protection Agency, November 17, 1972, Draft Report.
164

25. "Minerals Yearbook - 1970 11 , United States Bureau of Mines, pages 513-518.
26. "Minerals Yearbook - 1967", United States Bureau of Mines, pages 499~506.
27. "A New Process for Cleaning and Pumping Industrial Gases The ADTEC System". Aronetics. Inc., Tullahoma. Tennessee. 22 pages.
28. "Cleanup in Our Ferroalloy Plants", Union carbide World, July 1972. Vol. 5, No. 3, 16 pages.
30. "Annual Statistical Report - American Iron and Steel Institute -1972, A.I.S.I., Washington, D. c. pages 45-51.
31. Eckenfelder, w. W., "Water Quality Engineering", Barnes and Noble. New York (1970).
32. "Air Pollution control Engineering and Cost study of the Ferroalloy Industry" (Draft Report). 1973. U. s. Environmental Protection Agency. Office of Air and Water Programs. Washington. D.C. (Unpublished).
33. "Draft Development Document for Effluent Limitations Guidelines and Standards of Performance, Alloy and Stainless Steel Industry"• Datagraphics, Inc., Pittsburgh, PA, 1974.
34. Rudolfs, Willem. "Industrial Wastes, Their Disposal and Treatment," Reinhold Publishing Corp •• 1953.
35. "Development Document for Proposed Effluent Limitations Guidelines and New source Performance Standards for the Steel Making Segment of the Iron and Steel Manufacturing Point source Category," United States Environmental Protection Agency, Fel::ruary 1974, EPA 440/1-73/024.
165


SECTION XIV
GLOSSARY
Blocking chrome A high 10-12 percent silicon grade of high carbon (HC) Ferrochromium, used as an additive in the making of chromium steel where it 'blocks' (i.e., stops) the reaction in the ladle.
Charge Chrome - A grade of HC f errochrornium, so called because it forms part of the charge in the making of stainless steel.
Charging - The process by which raw materials ("charge") are added to the furnace.
Chrome ore - lime melt open arc furnace and (LC) ferrochromium.
A melt of chromium ore and lime produced in an an intermediate in the production of low carbon
covered furnace - An electric furnace with a water-cooled cover over the top to limit the introduction of air which would burn the gases from the reduction process. The furnace may have sleeves at the electrodes (fixed seals or sealed furnaces) with the charge introduced through ports in the furnace cover, or the charge may be introduced through annular spaces surrounding the electrodes (mix seals or semi-closed furnace).
Exothermic Process - Silicon or alurrinum, or a combinaticn of the two, combine with oxygen of the chatge, generating considerable heat and creating temperatures of several 'thousand degrees in the reaction vessel. The process is generally used to produce high grade alloys with low carbon content.
~Q2lloy An intermediate material, used as an addition agent or charge material in the production of steel and other metals. Historically, these materials were ferrous alloys, hence the name. In modern usage, however, the term has been broadened to cover such materials as silicon metal, which are produced in a manner similar to that used in the production of ferroalloys.
Induction furnace Induction heating is obtained by inducing an electric current in the charge and may be considered as operating on the transformer principle. Induction furnaces, which may be low frequency or high frequency, are used to produce small tonnages of specialty alloys through remelting of the required constituents.
QJ2en furnac~ - An electric submerged-arc furnace with the surface of the charge exposed to the atmosphere, whereby the reaction gases are burned by the inrushing air.
167

Open_arc furnace ~ Heat is generated in an open arc furnace by the passage of an electric arc, either between two electrodes or between one or more electrodes and the charge. The arc furnace consists of a furnace chamber and two or more electrodes. The furnace chamber has a lining which can withstand the operating temperatures and which is suitable for the material to be heated. The lining is contained within a steel shell which, in most cases, can be tilted or moved.
Pre-baked electrodes - An electrode purchased in finished form available in--aia.Tieters u~-to about 130 cm (51 in.). ~hese electrodes come in sections with threaded ends, and are added to the electrode column.
Reducing Agent - carbon bearing materials, such as metallurigical coke, low volatile coal, and petroleum coke used in the electric furnace to provide the carbcn which combines with oxygen in the charge to form carbon monoxide, thereby reducing the oxide to the metallic form.
S~lf-baking electrod~ - The electrode consists of a sheet steel casing filled with a Faste of carbonaceous material quite similar to that us~~d to make prebaked amorFhous carbon electrodes. The heat from the passage of current within the electrode and the heat from the furnace itself, volatilize the asphaltic or tar binders in the paste to make a hard baked electrode.
Sintering The formation of larger particles, cakes, or masses small particles by heating alone, or by heating and pressing, so certain constituents of the particles coalesce, fuse, er otherwise together. This may occur in the furnace itself, in which case charge must be stoked to break up the agglomeration.
from that bind the
Steam/hot water scrubber A system for removing particulates from furnace gases, where water is first heated by the gases to partially form steam, and then intimately contacted with the dirty gases. The scrubber water containing the particulates is then separated from the cleaned gases, which are emitted to the atmosphere. This system is characterized by a low water usage and pressure droF.
~king - The stirring up of the upper portion of the charged materials in the furnace. This loosens the charge and allows free upward flow of furnacE gases.
Submerg~arc furnace - In ferroalloy reduction furnaces, the electrodes usually extend to a considerable depth into the charge, hence such furnaces are called "submerged-arc furnaces". This name is usP.d for the furnaces whose load is almost entirely of the resistant type.
Tapping This term is used in the metallurgical industries for the r~moval of molten metal frcm furnaces, usually by opening a taphol~
located in th('> lower portion of the furnace vessel.
168

Vacuum furnace A furnace in wh~ch the charge can be brought to an elevated temperature in a high vacuum. The high vacuum provides an almost completely inert enclosure where the p~ocess of reduction and sintering can occur.
~U.S. GOVERNMENT PRINTING OFFICE: 1974 546-316/280 1-3 169