smith chart utility -...
TRANSCRIPT

Advanced Design System 2011.01 - Smith Chart Utility
1
Advanced Design System 2011.01
Feburary 2011Smith Chart Utility

Advanced Design System 2011.01 - Smith Chart Utility
2
© Agilent Technologies, Inc. 2000-20115301 Stevens Creek Blvd., Santa Clara, CA 95052 USANo part of this documentation may be reproduced in any form or by any means (includingelectronic storage and retrieval or translation into a foreign language) without prioragreement and written consent from Agilent Technologies, Inc. as governed by UnitedStates and international copyright laws.
AcknowledgmentsMentor Graphics is a trademark of Mentor Graphics Corporation in the U.S. and othercountries. Mentor products and processes are registered trademarks of Mentor GraphicsCorporation. * Calibre is a trademark of Mentor Graphics Corporation in the US and othercountries. "Microsoft®, Windows®, MS Windows®, Windows NT®, Windows 2000® andWindows Internet Explorer® are U.S. registered trademarks of Microsoft Corporation.Pentium® is a U.S. registered trademark of Intel Corporation. PostScript® and Acrobat®are trademarks of Adobe Systems Incorporated. UNIX® is a registered trademark of theOpen Group. Oracle and Java and registered trademarks of Oracle and/or its affiliates.Other names may be trademarks of their respective owners. SystemC® is a registeredtrademark of Open SystemC Initiative, Inc. in the United States and other countries and isused with permission. MATLAB® is a U.S. registered trademark of The Math Works, Inc..HiSIM2 source code, and all copyrights, trade secrets or other intellectual property rightsin and to the source code in its entirety, is owned by Hiroshima University and STARC.FLEXlm is a trademark of Globetrotter Software, Incorporated. Layout Boolean Engine byKlaas Holwerda, v1.7 http://www.xs4all.nl/~kholwerd/bool.html . FreeType Project,Copyright (c) 1996-1999 by David Turner, Robert Wilhelm, and Werner Lemberg.QuestAgent search engine (c) 2000-2002, JObjects. Motif is a trademark of the OpenSoftware Foundation. Netscape is a trademark of Netscape Communications Corporation.Netscape Portable Runtime (NSPR), Copyright (c) 1998-2003 The Mozilla Organization. Acopy of the Mozilla Public License is at http://www.mozilla.org/MPL/ . FFTW, The FastestFourier Transform in the West, Copyright (c) 1997-1999 Massachusetts Institute ofTechnology. All rights reserved.
The following third-party libraries are used by the NlogN Momentum solver:
"This program includes Metis 4.0, Copyright © 1998, Regents of the University ofMinnesota", http://www.cs.umn.edu/~metis , METIS was written by George Karypis([email protected]).
Intel@ Math Kernel Library, http://www.intel.com/software/products/mkl
SuperLU_MT version 2.0 - Copyright © 2003, The Regents of the University of California,through Lawrence Berkeley National Laboratory (subject to receipt of any requiredapprovals from U.S. Dept. of Energy). All rights reserved. SuperLU Disclaimer: THISSOFTWARE IS PROVIDED BY THE COPYRIGHT HOLDERS AND CONTRIBUTORS "AS IS"AND ANY EXPRESS OR IMPLIED WARRANTIES, INCLUDING, BUT NOT LIMITED TO, THEIMPLIED WARRANTIES OF MERCHANTABILITY AND FITNESS FOR A PARTICULAR PURPOSEARE DISCLAIMED. IN NO EVENT SHALL THE COPYRIGHT OWNER OR CONTRIBUTORS BELIABLE FOR ANY DIRECT, INDIRECT, INCIDENTAL, SPECIAL, EXEMPLARY, ORCONSEQUENTIAL DAMAGES (INCLUDING, BUT NOT LIMITED TO, PROCUREMENT OF

Advanced Design System 2011.01 - Smith Chart Utility
3
SUBSTITUTE GOODS OR SERVICES; LOSS OF USE, DATA, OR PROFITS; OR BUSINESSINTERRUPTION) HOWEVER CAUSED AND ON ANY THEORY OF LIABILITY, WHETHER INCONTRACT, STRICT LIABILITY, OR TORT (INCLUDING NEGLIGENCE OR OTHERWISE)ARISING IN ANY WAY OUT OF THE USE OF THIS SOFTWARE, EVEN IF ADVISED OF THEPOSSIBILITY OF SUCH DAMAGE.
7-zip - 7-Zip Copyright: Copyright (C) 1999-2009 Igor Pavlov. Licenses for files are:7z.dll: GNU LGPL + unRAR restriction, All other files: GNU LGPL. 7-zip License: This libraryis free software; you can redistribute it and/or modify it under the terms of the GNULesser General Public License as published by the Free Software Foundation; eitherversion 2.1 of the License, or (at your option) any later version. This library is distributedin the hope that it will be useful,but WITHOUT ANY WARRANTY; without even the impliedwarranty of MERCHANTABILITY or FITNESS FOR A PARTICULAR PURPOSE. See the GNULesser General Public License for more details. You should have received a copy of theGNU Lesser General Public License along with this library; if not, write to the FreeSoftware Foundation, Inc., 59 Temple Place, Suite 330, Boston, MA 02111-1307 USA.unRAR copyright: The decompression engine for RAR archives was developed using sourcecode of unRAR program.All copyrights to original unRAR code are owned by AlexanderRoshal. unRAR License: The unRAR sources cannot be used to re-create the RARcompression algorithm, which is proprietary. Distribution of modified unRAR sources inseparate form or as a part of other software is permitted, provided that it is clearly statedin the documentation and source comments that the code may not be used to develop aRAR (WinRAR) compatible archiver. 7-zip Availability: http://www.7-zip.org/
AMD Version 2.2 - AMD Notice: The AMD code was modified. Used by permission. AMDcopyright: AMD Version 2.2, Copyright © 2007 by Timothy A. Davis, Patrick R. Amestoy,and Iain S. Duff. All Rights Reserved. AMD License: Your use or distribution of AMD or anymodified version of AMD implies that you agree to this License. This library is freesoftware; you can redistribute it and/or modify it under the terms of the GNU LesserGeneral Public License as published by the Free Software Foundation; either version 2.1 ofthe License, or (at your option) any later version. This library is distributed in the hopethat it will be useful, but WITHOUT ANY WARRANTY; without even the implied warranty ofMERCHANTABILITY or FITNESS FOR A PARTICULAR PURPOSE. See the GNU LesserGeneral Public License for more details. You should have received a copy of the GNULesser General Public License along with this library; if not, write to the Free SoftwareFoundation, Inc., 51 Franklin St, Fifth Floor, Boston, MA 02110-1301 USA Permission ishereby granted to use or copy this program under the terms of the GNU LGPL, providedthat the Copyright, this License, and the Availability of the original version is retained onall copies.User documentation of any code that uses this code or any modified version ofthis code must cite the Copyright, this License, the Availability note, and "Used bypermission." Permission to modify the code and to distribute modified code is granted,provided the Copyright, this License, and the Availability note are retained, and a noticethat the code was modified is included. AMD Availability:http://www.cise.ufl.edu/research/sparse/amd
UMFPACK 5.0.2 - UMFPACK Notice: The UMFPACK code was modified. Used by permission.UMFPACK Copyright: UMFPACK Copyright © 1995-2006 by Timothy A. Davis. All RightsReserved. UMFPACK License: Your use or distribution of UMFPACK or any modified versionof UMFPACK implies that you agree to this License. This library is free software; you canredistribute it and/or modify it under the terms of the GNU Lesser General Public License

Advanced Design System 2011.01 - Smith Chart Utility
4
as published by the Free Software Foundation; either version 2.1 of the License, or (atyour option) any later version. This library is distributed in the hope that it will be useful,but WITHOUT ANY WARRANTY; without even the implied warranty of MERCHANTABILITYor FITNESS FOR A PARTICULAR PURPOSE. See the GNU Lesser General Public License formore details. You should have received a copy of the GNU Lesser General Public Licensealong with this library; if not, write to the Free Software Foundation, Inc., 51 Franklin St,Fifth Floor, Boston, MA 02110-1301 USA Permission is hereby granted to use or copy thisprogram under the terms of the GNU LGPL, provided that the Copyright, this License, andthe Availability of the original version is retained on all copies. User documentation of anycode that uses this code or any modified version of this code must cite the Copyright, thisLicense, the Availability note, and "Used by permission." Permission to modify the codeand to distribute modified code is granted, provided the Copyright, this License, and theAvailability note are retained, and a notice that the code was modified is included.UMFPACK Availability: http://www.cise.ufl.edu/research/sparse/umfpack UMFPACK(including versions 2.2.1 and earlier, in FORTRAN) is available athttp://www.cise.ufl.edu/research/sparse . MA38 is available in the Harwell SubroutineLibrary. This version of UMFPACK includes a modified form of COLAMD Version 2.0,originally released on Jan. 31, 2000, also available athttp://www.cise.ufl.edu/research/sparse . COLAMD V2.0 is also incorporated as a built-infunction in MATLAB version 6.1, by The MathWorks, Inc. http://www.mathworks.com .COLAMD V1.0 appears as a column-preordering in SuperLU (SuperLU is available athttp://www.netlib.org ). UMFPACK v4.0 is a built-in routine in MATLAB 6.5. UMFPACK v4.3is a built-in routine in MATLAB 7.1.
Qt Version 4.6.3 - Qt Notice: The Qt code was modified. Used by permission. Qt copyright:Qt Version 4.6.3, Copyright (c) 2010 by Nokia Corporation. All Rights Reserved. QtLicense: Your use or distribution of Qt or any modified version of Qt implies that you agreeto this License. This library is free software; you can redistribute it and/or modify it undertheterms of the GNU Lesser General Public License as published by the Free SoftwareFoundation; either version 2.1 of the License, or (at your option) any later version. Thislibrary is distributed in the hope that it will be useful,but WITHOUT ANY WARRANTY; without even the implied warranty of MERCHANTABILITYor FITNESS FOR A PARTICULAR PURPOSE. See the GNU Lesser General Public License formore details. You should have received a copy of the GNU Lesser General Public Licensealong with this library; if not, write to the Free Software Foundation, Inc., 51 Franklin St,Fifth Floor, Boston, MA 02110-1301 USA Permission is hereby granted to use or copy thisprogram under the terms of the GNU LGPL, provided that the Copyright, this License, andthe Availability of the original version is retained on all copies.Userdocumentation of any code that uses this code or any modified version of this code mustcite the Copyright, this License, the Availability note, and "Used by permission."Permission to modify the code and to distribute modified code is granted, provided theCopyright, this License, and the Availability note are retained, and a notice that the codewas modified is included. Qt Availability: http://www.qtsoftware.com/downloads PatchesApplied to Qt can be found in the installation at:$HPEESOF_DIR/prod/licenses/thirdparty/qt/patches. You may also contact BrianBuchanan at Agilent Inc. at [email protected] for more information.
The HiSIM_HV source code, and all copyrights, trade secrets or other intellectual propertyrights in and to the source code, is owned by Hiroshima University and/or STARC.

Advanced Design System 2011.01 - Smith Chart Utility
5
Errata The ADS product may contain references to "HP" or "HPEESOF" such as in filenames and directory names. The business entity formerly known as "HP EEsof" is now partof Agilent Technologies and is known as "Agilent EEsof". To avoid broken functionality andto maintain backward compatibility for our customers, we did not change all the namesand labels that contain "HP" or "HPEESOF" references.
Warranty The material contained in this document is provided "as is", and is subject tobeing changed, without notice, in future editions. Further, to the maximum extentpermitted by applicable law, Agilent disclaims all warranties, either express or implied,with regard to this documentation and any information contained herein, including but notlimited to the implied warranties of merchantability and fitness for a particular purpose.Agilent shall not be liable for errors or for incidental or consequential damages inconnection with the furnishing, use, or performance of this document or of anyinformation contained herein. Should Agilent and the user have a separate writtenagreement with warranty terms covering the material in this document that conflict withthese terms, the warranty terms in the separate agreement shall control.
Technology Licenses The hardware and/or software described in this document arefurnished under a license and may be used or copied only in accordance with the terms ofsuch license. Portions of this product include the SystemC software licensed under OpenSource terms, which are available for download at http://systemc.org/ . This software isredistributed by Agilent. The Contributors of the SystemC software provide this software"as is" and offer no warranty of any kind, express or implied, including without limitationwarranties or conditions or title and non-infringement, and implied warranties orconditions merchantability and fitness for a particular purpose. Contributors shall not beliable for any damages of any kind including without limitation direct, indirect, special,incidental and consequential damages, such as lost profits. Any provisions that differ fromthis disclaimer are offered by Agilent only.
Restricted Rights Legend U.S. Government Restricted Rights. Software and technicaldata rights granted to the federal government include only those rights customarilyprovided to end user customers. Agilent provides this customary commercial license inSoftware and technical data pursuant to FAR 12.211 (Technical Data) and 12.212(Computer Software) and, for the Department of Defense, DFARS 252.227-7015(Technical Data - Commercial Items) and DFARS 227.7202-3 (Rights in CommercialComputer Software or Computer Software Documentation).

Advanced Design System 2011.01 - Smith Chart Utility
6
Introducing the Smith Chart Utility . . . . . . . . . . . . . . . . . . . . . . . . . . . . . . . . . . . . . . . . . . . 7 Step-by-Step Example . . . . . . . . . . . . . . . . . . . . . . . . . . . . . . . . . . . . . . . . . . . . . . . . . . . 7 Setting Up the Design Environment . . . . . . . . . . . . . . . . . . . . . . . . . . . . . . . . . . . . . . . . . . 7 Designing and Analyzing a Network . . . . . . . . . . . . . . . . . . . . . . . . . . . . . . . . . . . . . . . . . . 12
Using SmartComponents in Smith Chart Utility . . . . . . . . . . . . . . . . . . . . . . . . . . . . . . . . . . . 20 Placing and Editing SmartComponents . . . . . . . . . . . . . . . . . . . . . . . . . . . . . . . . . . . . . . . . 20 Copying SmartComponents . . . . . . . . . . . . . . . . . . . . . . . . . . . . . . . . . . . . . . . . . . . . . . . 22 Deleting SmartComponents . . . . . . . . . . . . . . . . . . . . . . . . . . . . . . . . . . . . . . . . . . . . . . . 22 Using SmartComponents as Standalone Components . . . . . . . . . . . . . . . . . . . . . . . . . . . . . 23
Smith Chart Drawing Area . . . . . . . . . . . . . . . . . . . . . . . . . . . . . . . . . . . . . . . . . . . . . . . . . . 25 Circle Options . . . . . . . . . . . . . . . . . . . . . . . . . . . . . . . . . . . . . . . . . . . . . . . . . . . . . . . . . 26 Circle Colors . . . . . . . . . . . . . . . . . . . . . . . . . . . . . . . . . . . . . . . . . . . . . . . . . . . . . . . . . . 26 Components . . . . . . . . . . . . . . . . . . . . . . . . . . . . . . . . . . . . . . . . . . . . . . . . . . . . . . . . . . 27 Network Termination Definitions . . . . . . . . . . . . . . . . . . . . . . . . . . . . . . . . . . . . . . . . . . . . 29 Scattering and Noise Parameters . . . . . . . . . . . . . . . . . . . . . . . . . . . . . . . . . . . . . . . . . . . . 30 Constant Circles . . . . . . . . . . . . . . . . . . . . . . . . . . . . . . . . . . . . . . . . . . . . . . . . . . . . . . . 31 Status Panel . . . . . . . . . . . . . . . . . . . . . . . . . . . . . . . . . . . . . . . . . . . . . . . . . . . . . . . . . . 32 Importing External Data . . . . . . . . . . . . . . . . . . . . . . . . . . . . . . . . . . . . . . . . . . . . . . . . . . 33
Smith Chart Network Area . . . . . . . . . . . . . . . . . . . . . . . . . . . . . . . . . . . . . . . . . . . . . . . . . . 35 Network Response . . . . . . . . . . . . . . . . . . . . . . . . . . . . . . . . . . . . . . . . . . . . . . . . . . . . . . 35 Network Schematic . . . . . . . . . . . . . . . . . . . . . . . . . . . . . . . . . . . . . . . . . . . . . . . . . . . . . 36

Advanced Design System 2011.01 - Smith Chart Utility
7
Introducing the Smith Chart Utility The Smith Chart Utility provides full Smith Chart capabilities, synthesis of matchingnetworks, enabling impedance matching and plotting of constant Gain / Q / VSWR / Noisecircles. The Smith Chart Utility is accessed from the Schematic window Tools menu.
The Smith Chart Utility documentation includes these sections:
Step-by-Step Example describes how to design the single frequency impedancematching network.
Using SmartComponents (smithchartutil) answers many common questions relatingto Utility use.
Smith Chart Drawing Area (smithchartutil) explains how to manipulate the SmithChart.
Smith Chart Network Area (smithchartutil) explains how to analyze network data.
Step-by-Step ExampleThe step-by-step example takes you through the through the design and analysis of asingle frequency impedance matching network. After completing this example, you shouldhave a basic understanding of the Utility and be ready to begin using the tool. Followthese steps to begin:
Setting Up the Design Environment
Designing and Analyzing a Network
NoteYou should already be familiar with the basic features of Advanced Design System. For help withADS basic features, refer to the Schematic Capture and Layout (usrguide) documentation.
Setting Up the Design EnvironmentBefore you can use the Smith Chart Utility, you must set up the design environment byusing these steps:
Setting DesignGuide Preferences
Opening a Workspace
Opening a Schematic Window

Advanced Design System 2011.01 - Smith Chart Utility
8
Opening the Smith Chart Utility
Displaying the SmartComponent Palette
Setting DesignGuide Preferences
All DesignGuides can be accessed through either cascading menus or dialog boxes. Youcan configure your preferred method in the ADS Main window or from the Schematicwindow.
To configure access through menus or dialog boxes:
From the Schematic window, choose DesignGuide > Preferences.1.In the DesignGuide Menu Style group box, choose either Use a selection dialog2.box or Use cascade menus.
Close and restart the program for your preference changes to take effect.3.
NoteOn PC systems, Windows resource issues might limit the use of cascading menus. When multiple windowsare open, your system could become destabilized. Therefore, the dialog box menu style might be best forthese situations.
The ADS Main window DesignGuide menu contains these choices:
DesignGuide Developer Studio > Start DesignGuide Studio is only available onthis menu if you have installed the DesignGuide Developer Studio to open the initialDeveloper Studio dialog box.

Advanced Design System 2011.01 - Smith Chart Utility
9
DesignGuide Developer Studio > Developer Studio Documentation is onlyavailable on this menu if you have installed the DesignGuide Developer Studio toopen the DesignGuide Developer Studio documentation.
NoteAnother way to access the DesignGuide Developer Studio documentation is by selecting Help > Topics andIndex > DesignGuides > DesignGuide Developer Studio from any ADS program window.
Add DesignGuide opens a directory browser in which you can add a DesignGuide toyour installation. This is primarily intended for use with DesignGuides that arecustom-built through the Developer Studio.
List/Remove DesignGuide opens a list of your installed DesignGuides. Select anythat you would like to uninstall and choose the Remove button.
Preferences opens a dialog box that enables you to:
Disable the DesignGuide menu commands (all except Preferences) in the Mainwindow by unchecking this box. In the Schematic and Layout windows, thecomplete DesignGuide menu and all of its commands are removed if this box isunchecked.Select your preferred interface method, either cascading menus or dialog boxes.
Opening a Workspace
The ADS design environment is set up within a Workspace.
To create a new Workspace:
From the ADS Main window, choose File > New Workspace or click Create a New1.Workspace icon on the toolbar.
In the dialog, define the location of the Workspace and assign a Workspace name.2.
For more details on creating a new space, refer to Using Workspace (adstour).
Opening a Schematic Window
A new schematic is needed to contain the lowpass component for this example.

Advanced Design System 2011.01 - Smith Chart Utility
10
To open a Schematic window:
From the ADS Main window, choose Window > New Schematic or click New1.Schematic Window icon on the toolbar. The New Schematic window appears.
NoteDepending on how your ADS preferences are set, a Schematic window can appear automaticallywhen you create or open a Workspace.
In the New Schematic window, provide Library and Cell details to create a cell named2.SmithChartExample.
For more details on creating a new schematic, refer Using Designs (adstour).
Opening the Smith Chart Utility
The Smith Chart Utility is accessed from the Tools menu or the DesignGuide menu in theSchematic window.
To open the Smith Chart Utility:
In the Schematic window, choose Tools > Smith Chart . The Smith Chart Utility1.window opens. Or, you can choose one of these paths from the DesignGuide menu:
DesignGuide > Amplifier > Tools > Smith Chart UtilityDesignGuide > Filter > Smith ChartDesignGuide > Mixers > Tools > Smith Chart UtilityDesignGuide > Oscillator > Tools > Smith Chart
NoteExpand the list under Tools by clicking the _ sign.
Using the Control Window
All Utility features are available from the Smith Chart Utility window. The Smith ChartUtility window houses menus, a toolbar, and SmartComponent manipulation controls. Themenus and toolbar buttons perform the basic functions of design, delete, and display theSmartComponent palette. The window can be placed anywhere on the screen. Explore thewindow menus as well to familiarize yourself with the basic Utility capabilities.
The pull down lists at the top of the utility window are designed to help you navigatemultiple schematic windows and SmartComponents. You can use the Current Schematic

Advanced Design System 2011.01 - Smith Chart Utility
11
drop-down list to select any of the currently opened schematic windows. This field isupdated any time Smith Chart Utility window is selected. You can use theSmartComponent drop-down list box to select any of the SmartComponents on thecurrently selected schematic window.
When you choose the DA_SmithChartMatch1 SmartComponent from theSmartComponent drop-down list box, the following dialog is displayed:

Advanced Design System 2011.01 - Smith Chart Utility
12
This dialog allows you to update the selected SmartComponent with the changes madeusing the Smith Chart utility, or conversely, update the Smith Chart Utility with theparameters of the SmartComponent. Selecting another component from the drop-downlist will update the Smith Chart with the parameters of that component.
To close the Control window:
Choose File > Exit Utility from the Control window menubar. (You can also close thewindow by clicking the x at the top of the window.)Continue the step-by-step example by Designing and Analyzing a Network.
Designing and Analyzing a NetworkLoad and source matching networks for amplifiers can be designed easily using the SmithChart. Using the Utility follows a normal design flow procedure:
Select a component needed for your Schematic from the component palette (Displaying the SmartComponent Palette) and place the component in your Schematic(Placing Example Component in the Schematic).
Provide specifications (Changing SmartComponent Parameters).
Design and analyze the component (Designing the Amplifier Using the Smith Chart).
NoteBefore starting this section of the step-by-step example, confirm your setup (Setting Up the DesignEnvironment).
Displaying the SmartComponent Palette
The program contains a SmartComponent palette, Smith Chart Matching Networks , thatprovides quick and easy access to the SmartComponents. A blue accent in the upper-leftcorner of a palette button indicates the component is a SmartComponent.
You can display the SmartComponent palettes in one of these ways:

Advanced Design System 2011.01 - Smith Chart Utility
13
By clicking Component Palette on the Control window toolbar.By choosing View > Palette from the Control window menu.By selecting the Smith Chart Matching palette from the Component Palette drop-down list box in the Schematic window toolbar (directly above the palette).Continue the example by selecting the Smith Chart Matching palette. The palettedisplays in the Schematic window.
Placing Example Component in the Schematic
To place a SmartComponent in the Schematic:
Click DA_SmithChartMatch on the component palette to select the component.1.
Click within the schematic window to place the component.2.You can change the orientation of the SmartComponent before placement bychoosing from the Insert > Component > Component Orientationcommands or by selecting Rotate by -90 repeatedly from the schematictoolbar.The place component mode remains active until you choose End Commandfrom the schematic toolbar.
NoteWhen a SmartComponent is placed initially, a temporary component is used to place and specify theparameters for the SmartComponent. This component does not contain a subnetwork design. After theutility has been used to design the SmartComponent, the temporary component is replaced with apermanent component. The SmartComponent is renamed to DA_ComponentName_Library_CellName andan autogenerated schematic is placed inside the SmartComponent's subnetwork design file. Subsequently,if the SmartComponent parameters are edited, the utility must be used again to update the subnetworkdesign file.
Designing the Amplifier Using the Smith Chart
During this example, you design the load matching network for this specific amplifierdesign problem:Design a microwave transistor amplifier, operating at 3 GHz, to have an operating powergain of 9 dB. The transistor S-parameters are:

Advanced Design System 2011.01 - Smith Chart Utility
14
S11 = .641 - -171.3S12 = .057 - 16.3S21 = 2.058 - 28.5S22 = .572 - -95.7
Changing SmartComponent Parameters
Parameters can be changed directly from the Control window.
To edit the DA_SmithChartMatch component parameters:
In the Control window, select the DA_SmithChartMatch component from the1.SmartComponent drop-down list. This ensures all changes are referenced to thiscomponent.From the Smith Chart window menu, choose View > S-Parameters . In the dialog2.box, enter the S-parameters (magnitude and angle) for this amplifier and click Done.
Displaying the Operating Power Gain Circle
To display the Operating Power Gain circle and its corresponding control box:
From the Smith Chart utility window menu, choose Circles > Bilateral > Gp to openthe Operating Power Gain dialog. Either use the slider or text box to choose a 9 dBcircle and click OK to display the chart.

Advanced Design System 2011.01 - Smith Chart Utility
15
Set Frequency
To set operating frequency:
Return to the Smith Chart utility main window.1.In the Frequency/GHz field, enter 3 and click OK to continue.2.
Finding Source and Load Points
For this example, we use a 50 Ohm load. The source lies on the power gain circle. First,place the terminations onto their correct locations in the Smith Chart using the SmithChart Drawing Palette.

Advanced Design System 2011.01 - Smith Chart Utility
16
To place the source and load on the chart:
Place the source termination by clicking the drawing palette button Source1.Termination Conjugate and then moving the crosshairs until gamma on the statuspanel at the bottom of the Smith Chart shows approximately .36 - 47.5.Highlight the source termination marker by clicking in the middle of the marker until2.a pink box highlights the marker. The load termination does not need to be movedsince the load termination defaults to 50 Ohm.
Fixing Termination Accuracy
If the source termination is not exactly .36 - 47.5 the source termination can be changedby entering the correct values into the Gamma section of the status panel.
Make sure the source marker is highlighted before changing values. Next, use thestatus panel again to conjugate the source marker (by negating the imaginary part ofthe impedance) for matching purposes.

Advanced Design System 2011.01 - Smith Chart Utility
17
Drawing the Matching Network
To draw the matching network:
Select the Shorted Stub component from the drawing palette and click the end point1.in the vicinity of Gamma .45 - 117.Select the Line Length component from the drawing palette and select its end point2.to be near the source marker. Fine tuning can be done by dragging both green nodemarkers until the end is exactly on the source marker.
Analyzing Frequency Response

Advanced Design System 2011.01 - Smith Chart Utility
18
To analyze the frequency response:
Click the Reset button next to the Network Response plot to re-normalize the start1.and stop frequencies.For Type select Mag and for S-Parm select S11. Notice that at 3 GHz the magnitude2.of S11 is zero, implying a good matching network.
Previewing Matching Network
After building, the network is displayed in the Network Schematic box.
To edit the network from the display:
Click either the shorted stub or the length of line. Notice that parameter valuescan be changed here. Also, you can delete the selected component here.

Advanced Design System 2011.01 - Smith Chart Utility
19
Building the Circuit
To build a circuit into the Smith Chart SmartComponent:
Click Build ADS Circuit at the bottom left of the utility window. The result displaysin the Schematic window.
Examining the Matching Component Design
You can look at the details of the autogenerated design inside the SmartComponent'ssubnetwork.
To examine the component's subnetwork:
Select the component DA_SmithChartMatch.1.Click Push Into Hierarchy on the schematic toolbar to reveal the subnetwork.2.
After examining the Schematic, click Pop Out on the schematic toolbar to close the3.view.This completes the step-by-step example.

Advanced Design System 2011.01 - Smith Chart Utility
20
Using SmartComponents in Smith ChartUtilityThis Utility provides a single SmartComponent representing a matching network.SmartComponents are smart sub-network designs that provide the container forspecification parameters and a schematic representation of the design when placed into adesign. The utility provides automated design and analysis for these SmartComponents.
SmartComponents can be placed, copied, edited and deleted like other components in theAdvanced Design System. The basics of placement, copying, editing and deleting aredescribed briefly in this section.
NoteFor help with ADS basic features, refer to the Schematic Capture and Layout (usrguide) documentation.
Placing and Editing SmartComponentsThe components are placed in the schematic by selecting the SmartComponent from thepalette and clicking at the point where you want to place the component in the schematic.
You can display the SmartComponent palette in two ways:
Open the Smith Chart Matching Utility by selecting Tools > Smith Chart . Displaythe SmartComponent palette by selecting the Palette button from the utility windowtoolbar or by selecting View > Palette from the utility window menu.Select the Smith Chart Matching palette from the Component Palette drop-downlist box in the Schematic window toolbar (directly above the palette).
Placing SmartComponents
To place a SmartComponent in the Schematic:
In the Schematic window, select the component from the SmartComponent palette.1.Click within the Schematic window at the location where you want to place the2.SmartComponent.
You can change the orientation of the SmartComponent before placement bychoosing from the Insert > Component > Component Orientationcommands or by selecting Rotate by -90 repeatedly from the schematictoolbar.The place component mode remains active until you choose End Commandfrom the schematic toolbar.

Advanced Design System 2011.01 - Smith Chart Utility
21
Changing Position and Orientation
A SmartComponent is moved by dragging it to any location in the Schematic window.
To change the component's orientation:
Select Edit > Advanced Rotate > Rotate Around Reference from the Schematic1.window or select Rotate Items from the toolbar.Click the SmartComponent you want to use.2.Rotate the component. The rotate mode remains active until you select End3.Command from the toolbar.
Editing SmartComponents
Specifications of the SmartComponent are entered directly on the Smith Chart UtilityControl window. You can also modify the specifications in one of these ways:
Click the SmartComponent parameters in the schematic window and change them1.(see The DA_SmithChartMatch Component (dgfilter)).Double-click the SmartComponent to open a dialog box containing all parameters.2.
The DA_SmithChartMatch Component
The SmartComponent schematic can be viewed by pushing into the SmartComponent'ssubnetwork. See Examining the Matching Component Design (smithchartutil).
A SmartComponent subnetwork is empty until the schematic is generated (see the note inthe section Placing and Editing SmartComponents (dgfilter)).

Advanced Design System 2011.01 - Smith Chart Utility
22
Copying SmartComponentsSmartComponents can be copied within a schematic or to another Schematic window.
Copying Within a schematic
To copy a SmartComponent to the same schematic:
Click the SmartComponent to be copied.1.Select Edit > Copy and then Edit > Paste from the schematic window.2.Click where you want the copy placed.3.
Copying Between Schematic Windows
To copy a SmartComponent to another schematic:
Click the SmartComponent to be copied.1.Select Edit > Copy from the Schematic window.2.Display the schematic window you want to copy the SmartComponent to.3.Select Edit > Paste to copy the SmartComponent to the Schematic.4.Click where you want the component placed.5.
Copying a SmartComponent as a Unique Design
Initially, all copied SmartComponents refer to the same SmartComponent design. Whenthe Smith Chart Utility is used to perform a design operation, the Utility transforms eachcopied SmartComponent into a unique SmartComponent design. A design operation isaccomplished from the Utility Control Window.
Deleting SmartComponentsSmartComponents can be deleted from a schematic like other components, but completelyremoving a SmartComponent's files requires the actions described here.
Deleting from Current schematic
A SmartComponent can be deleted from a schematic in one of these ways:

Advanced Design System 2011.01 - Smith Chart Utility
23
By selecting the component and pressing the Delete key.By selecting Delete from the toolbar.By selecting Edit > Delete from the schematic window.
NoteThis procedure does not remove the SmartComponent files from the Workspace. To delete files fromthe Workspace, see Deleting from Current Workspace (dgfilter).
Deleting from Current Workspace
To delete a SmartComponent and all associated files from your Workspace:
In the Schematic window, select the SmartComponent.1.In the utility window, select Edit > Delete SmartComponent. or on the toolbar,2.click Delete. This deletes the SmartComponent from the current schematic andremoves all of its files from your Workspace. The SmartComponent delete moderemains active until you select End Command from the schematic toolbar.
Deleting Manually Using File System
You can use your computer's file system to delete a SmartComponent by deleting theappropriate files in the respective library of a Workspace. Delete files that start with DA_or SA_ , containing the SmartComponent title, and end with . ael, .atf, or .wrk .
Using SmartComponents as Standalone ComponentsAfter SmartComponents are designed and tested, they can be used as standalonecomponents. The Matching Utility is not needed to use them in new designs unless youwish to modify or analyze them. When using the SmartComponent in a design, however,the power supply pins (Vdd, Vcc, Vp, Vm) must be connected to a DC voltage sourcewhose voltage level corresponds the parameter setting.
Using an Existing SmartComponent Within the Same Workspace
To use an existing SmartComponent within the same Workspace:
Open the Component Library window by selecting Insert > Component >1.Component Library from the Schematic window or Display Component LibraryList on the toolbar.Select the Library name under All Libraries list at the left of the Component Library2.window. Available components are listed in the Components list at the right of the

Advanced Design System 2011.01 - Smith Chart Utility
24
Component Library window.Select the SmartComponent in the Components list.3.Place the SmartComponent into your schematic by clicking in the Schematic window4.at the location you wish to place. The insert mode remains active until you click EndCommand.
Using an Existing SmartComponent in Any Workspace
A library of predesigned reusable SmartComponents can be created by placing thereusable SmartComponents in a Workspace. This Workspace can be included in anyWorkspace and its SmartComponents can be accessed using the Component Library.
To use an existing SmartComponent in any Workspace:
Open the Workspace where the SmartComponent needs to be inserted.1.Open the Library in the Workspace by selecting File > Open > Library.2.Open the Component Library window by selecting Insert > Component >3.Component Library from the Schematic window or Display Component LibraryList from the toolbar.Select the Library name under All Libraries list at the left of the Component Library4.window. Available components are listed in the Components list at the right of theComponent Library window.Select the SmartComponent in the Components list.5.Place the SmartComponent into your schematic by clicking in the Schematic window6.at the location where you wish to place the component. The insert mode remainsactive until you click End Command.

Advanced Design System 2011.01 - Smith Chart Utility
25
Smith Chart Drawing AreaThe Smith Chart Drawing Area is the central focus of the Smith Chart Utility. In this areathe full functionality of a Smith Chart can be utilized. Gain, VSWR, Q, and Stability circlescan be plotted easily by simply entering S-parameters and then choosing thecorresponding menu items. Noise circles can also be plotted in a similar manner. Compleximpedance matching is also done in this area by using any of the available passiveelements.
To view a SmartComponent, select the SmartComponent from the SmartComponentdrop-down list box in the upper right corner of the utility window. Changes made in theSmith Chart Utility affect the selected SmartComponent.

Advanced Design System 2011.01 - Smith Chart Utility
26
Circle OptionsThe Smith Chart itself consists of four sets of circles of constant value: resistance (R),reactance (X), conductance (G), and susceptance (B). Using the check boxes at the top ofthe dialog, these circles can be toggled on and off.
The actual circles plotted are controlled using the bottom portion of the dialog. SelectingView > Chart Options in the Smith Chart utility window opens the dialog box.
Circle ColorsCircle colors can be changed on the Smith Chart by choosing View > Colors in the SmithChart utility window.

Advanced Design System 2011.01 - Smith Chart Utility
27
ComponentsTwelve components are available to be used on the Smith Chart for matching purposes.
Source Conjugate Termination - Complex point to match to.
Load Conjugate - Complex point to match from.
Series Inductor - Snaps to constant resistance circles.
Shunt Inductor - Snaps to constant conductance circles.

Advanced Design System 2011.01 - Smith Chart Utility
28
Series Capacitor - Snaps to constant resistance circles.
Shunt Capacitor - Snaps to constant conductance circles.
Series Resistor - Snaps to constant reactance circles.
Shunt Resistor - Snaps to constant susceptance circles.
Transformer - Snaps to constant Q circles.
Line Length - Snaps to circles of constant reflection coefficient magnitude.
Shorted Stub - Snaps to constant conductance circles.
Open Stub - Snaps to constant conductance circles.
Advanced Design System 2011.01 - Smith Chart Utility
29
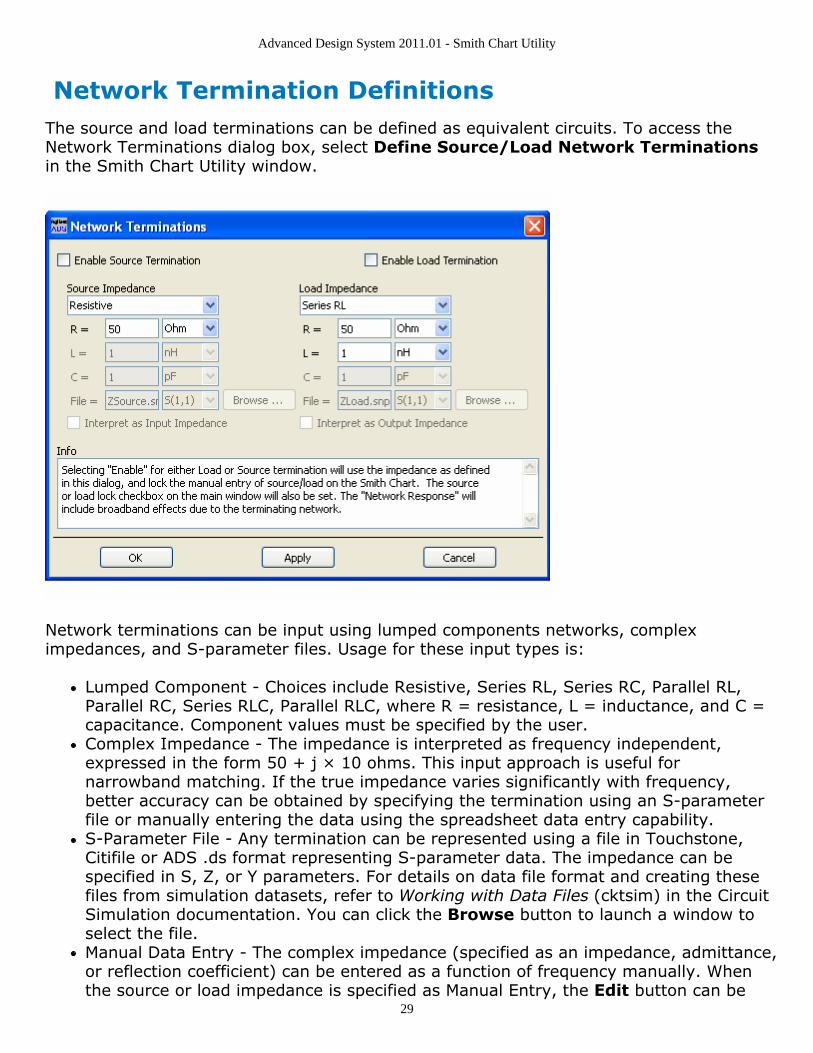
Network Termination DefinitionsThe source and load terminations can be defined as equivalent circuits. To access theNetwork Terminations dialog box, select Define Source/Load Network Terminationsin the Smith Chart Utility window.
Network terminations can be input using lumped components networks, compleximpedances, and S-parameter files. Usage for these input types is:
Lumped Component - Choices include Resistive, Series RL, Series RC, Parallel RL,Parallel RC, Series RLC, Parallel RLC, where R = resistance, L = inductance, and C =capacitance. Component values must be specified by the user.Complex Impedance - The impedance is interpreted as frequency independent,expressed in the form 50 + j × 10 ohms. This input approach is useful fornarrowband matching. If the true impedance varies significantly with frequency,better accuracy can be obtained by specifying the termination using an S-parameterfile or manually entering the data using the spreadsheet data entry capability.S-Parameter File - Any termination can be represented using a file in Touchstone,Citifile or ADS .ds format representing S-parameter data. The impedance can bespecified in S, Z, or Y parameters. For details on data file format and creating thesefiles from simulation datasets, refer to Working with Data Files (cktsim) in the CircuitSimulation documentation. You can click the Browse button to launch a window toselect the file.Manual Data Entry - The complex impedance (specified as an impedance, admittance,or reflection coefficient) can be entered as a function of frequency manually. Whenthe source or load impedance is specified as Manual Entry, the Edit button can be

Advanced Design System 2011.01 - Smith Chart Utility
30
used to open a spreadsheet that is useful for entering frequency/impedance pairs.
Interpret as Input/Output Impedance - These options are available for three cases ofsource and load impedance: complex load, S-parameter file, and Manual entry. Usethe Interpret as Input Impedance option to specify that the value you have entered isof impedance looking into the device (S-parameters of the measured device, forinstance). Use the Interpret as Output Impedance option to specify that the valueyou've entered is of impedance looking out from the device (impedance you want tosee).
Scattering and Noise ParametersScattering and noise parameters are an easy way to describe the characteristics ofamplifiers and other devices. For a given set of parameters, constant parameter circlescan be plotted on the Smith Chart. These constant parameter circles can be used to creatematching networks that solve specific design problems.
The Scattering Parameters dialog box can be opened by choosing View > S-Parametersfrom the Smith Chart utility window menu. S-parameters are entered as a magnitude andphase (in degrees).

Advanced Design System 2011.01 - Smith Chart Utility
31
The Noise Parameters dialog box can be opened by choosing View > Noise Parametersfrom the Smith Chart utility window menu.
Four noise parameters are entered here: magnitude and phase of the optimal sourcereflection coefficient (GammaOpt), the minimum noise figure (FMin), and the normalizedeffective noise resistance (Rn).
Constant CirclesConstant circles are a locus of points on the Smith Chart that refer to a certain value. Forexample, a constant gain circle would be all the points that refer to a certain gain. Ninecircles can be plotted on the Smith Chart. These circles can be divided into threedependencies.
No Dependence. Circles of constant Q can be manipulated on the Smith Chartwithout entering any external data.Scattering Parameters Dependence. Stability (input and output), VSWR, unilateral(Gs and Gl), and bilateral (Ga and Gp) circles all require valid S-parameter data.Noise Parameters Dependence. Constant noise circles require a valid input of noisedata.

Advanced Design System 2011.01 - Smith Chart Utility
32
All circles are either manipulated by entering in a value or by using the slider.Clicking OK closes the dialog box but keeps the circle plotted while Hide/Showtoggles, displaying the circle on the Smith Chart.
Status PanelThe status panel shows point data for the Smith Chart. You can view Z, Y, and Gamma(reflection coefficient) values for any point clicked on the Smith Chart. More exact valuescan also be entered by selecting the appropriate edit text box and changing the values.Only the current highlighted node is affected by changes made in the status panel.

Advanced Design System 2011.01 - Smith Chart Utility
33
The Lock Source Impedance and Lock Load Impedance check boxes are locatedabove the status panel. Checking either box makes the corresponding node uneditable.
Importing External DataThe Smith Chart Utility supports three data types for importation: ADS datasets,Touchstone, and Citifiles.
To open the data import dialog box, choose File > Import Data File from the utilitywindow. Imported data can only be applied to S-parameter data for the device.

Advanced Design System 2011.01 - Smith Chart Utility
34
Browse - Choose a file from one of the available file types to import (Dataset,Touchstone, Citifile).Frequency - After importing, the S-parameters can be viewed by scrolling throughtheir frequencies.OK - Closes the dialog box after applying the selected S-parameters.Cancel - Closes the dialog box without applying the selected S-parameters.

Advanced Design System 2011.01 - Smith Chart Utility
35
Smith Chart Network AreaThe Smith Chart Network Area is a quick and easy reference for viewing your matchingnetwork and seeing its performance with the given data. A real-time frequency response isplotted for each change made on the Smith Chart. A network schematic is displayed,showing a preview before the SmartComponent is built.
Network ResponseThe Network Response (frequency response) area can plot both the magnitude and phaseof the S-parameters of the drawn network from the Smith Chart.
Start Freq - Starting frequency point (in Hz) from the left edge of the graph. Defaultis 0 Hz.Stop Freq - Stopping frequency point (in Hz) at the right edge of the graph. Defaultis twice the Smith Chart frequency.

Advanced Design System 2011.01 - Smith Chart Utility
36
Max - Maximum value at the top edge of the graph. Default is 1 for magnituderesponse and 180 for phase response.Min - Minimum value at bottom edge of the graph. Default is 0 for magnituderesponse and -180 for phase response.Type - Chooses plot type, either magnitude or phase.Trace1 - Chooses which S-parameter to plot in blue.Trace2 - Chooses which S-parameter to plot in red.Reset - Resets the graph to default values.
The view in the frequency response can be changed by either replacing the edge valueswith values you want or by clicking and dragging a box inside the graph area.
Network SchematicThe Network Schematic area displays a preview of what the SmartComponent looks likeafter building the circuit. Also, in this area component parameter values can be changedor components can be deleted from the network.
Delete Selected Component - Deletes the selected component from the schematicand removes its corresponding trail from the Smith Chart area.Set Defaults - Choose default values for Q, loss, and characteristic impedance.Zo - The characteristic impedance of the microstrip elements (shorted stub, seriesstub, and length of line).Value - The component's value (for example, Ohms, Farads, etc.).Loss - Displays either a component's loss in dB/m or in Q.
Any changes made to the schematic area are reflected on the drawing in the Smith Chartarea (see Changes in Component Parameters Reflect on Chart).
Changes in Component Parameters Reflect on Chart

Advanced Design System 2011.01 - Smith Chart Utility
37