smoke in the air
TRANSCRIPT

ECMWF Newsletter No. 119 – Spring 2009
9
NEWS / METEOROLOGY
The forecasts are based on specialmodel outputs from ECMWF, the USAntarctic Mesoscale Prediction System(AMPS) and the German Global-Model(GME). Model outputs are availabletwice a day and are received as attach-ments to e-mails. They are used tocover a forecast period of about oneweek. The EPSgrams from ECMWF playa key role in preparing the medium-and long-term forecasts.For short-term forecasts and flight
180135E
90E
45E
045W
90W135W
ARTIC
CIRCLE NEUMAYER
WASA /ABOA
SVEAKOHNEN
Dronning Maud Land
TROLLSANAE IV
TOR
MAITRI
SYOWA
HALLEY
NOVOLAZAREVSKAYA
4200 kmfrom
CAPE TOWN
1060 km740 km
530 km
360 km
640 km
860 km
830 km
1300 km
Dronning Maud Land and the various stations run by the DROMLAN national operators. Illustration based on original from Terra Incognita.
activities the satellite imagery is ofgreat importance. Up to twenty NOAAsatellite passes can be obtained.Additionally, all the informationtransmitted via the Global Telecom-munication System (GTS) – includingthe three-hourly synoptic observa-tions and daily upper-air soundings –is available at any time via thepermanent data link. Also measure-ments from surrounding automaticweather stations not available via the
GTS get extracted automatically fromthe NOAA satellite information.During the summer season of
2008/09 more than 4,000 forecastswere prepared for field parties, ships,stations and especially aircrafts. It isclear that this service increased thesafety of the ambitious projectscarried out in Dronning Maud Land.Furthermore, it helps to reduceweather-induced idle time for expen-sive flight operations.
JOHANNES W. KAISER, OLIVIER BOUCHER, MARIE DOUTRIAUX-BOUCHER, JOHANNES FLEMMING, YVES M. GOVAERTS,JOHN GULLIVER, ANGELIKA HEIL, LUKE JONES, ALESSIO LATTANZIO, JEAN-JACQUES MORCRETTE, MARIA R. PERRONE,MIHA RAZINGER, GARETH ROBERTS, MARTIN G. SCHULTZ, ADRIAN J. SIMMONS, MARTIN SUTTIE, MARTIN J. WOOSTER
Smoke in the air
SMOKE from forest fires can greatly impact regional airquality and thus human health. The degree of humanexposure depends on the fire location, amount of fuelburned, type of fire, and the atmospheric transport ofand chemistry in the plume. We have started develop-ing a global fire assimilation system that producesemission estimates for the monitoring and forecastingof fire plumes in the GMES Atmospheric Core Service(GACS), which is developed in the GEMS and MACCprojects under the leadership of ECMWF. Note thatprojects and satellite instruments referred to in thisarticle are briefly described in Box A.The system currently delivers global fields of observed
fire intensity. Figure 1 provides an example that illustrates
AffiliationsJohannes W. Kaiser, Johannes Flemming, Luke Jones,Jean-Jacques Morcrette, Miha Razinger, Adrian Simmons,Martin Suttie: ECMWF, Reading, UK.Olivier Boucher, Marie Doutriaux-Boucher: Met Office Hadley Centre,Exeter, UK.Yves Govaerts: EUMETSAT, Darmstadt, Germany.John Gulliver: University of the West of Scotland, Paisley, Scotland, UK.Angelika Heil, Martin G. Schultz: Forschungszentrum Jülich, Jülich,Germany.Alessio Lattanzio: Makalumedia GmbH, Darmstadt, Germany.Maria R. Perrone: Università del Salento, Dipartimento di Fisica, Lecce,Italy.Gareth Roberts, Martin Wooster: King’s College London, Department ofGeography, London, UK.

ECMWF Newsletter No. 119 – Spring 2009
10
METEOROLOGY
the huge range of the global fire intensities. Note thatthe fire season in Sub-Saharan Africa dominates theglobal picture. Large fire intensity is also evident inSouth America, Cambodia and Vietnam. Also note thelocalized spot of extreme fire intensity in Victoria, in thesoutheast of Australia, which is associated with the worstbush fires in Australian history in terms of death toll.Due to the high variability of fires on all time scales
from hours to decades, the smoke emissions have to bederived from fire observations. Open fires can beobserved from space. The EUMETSAT Land Satellite
Application Facility (SAF) in Lisbon, Portugal, hasrecently started the production of a quantitative fireproduct from the observations of SEVIRI onboard thegeostationary satellite Meteosat-9. It features an unprece-dented combination of quantitative accuracy andtemporal resolution.The Greek fires of August 2007 were well observed
by SEVIRI because of cloud-free conditions over thewhole period. We have used the SEVIRI data to estimatethe fire emissions and to simulate the resulting smokeplumes with the GEMS global aerosol model. We found
Box AProgrammes and satellite instruments
Programmes
FREEVAL. The Fire Radiative Energy Evaluation (FREE-VAL) project was funded by EUMETSAT to validate theFRPPIXEL data product from METEOSAT’s SEVIRIsensor and explore its potential use in operationalsystems.GACS. The GMES Atmospheric Core Service (GACS)will provide coherent information on the atmosphericcomposition at European and global scale in supportof European policies and for the benefit of Europeancitizens.GEMS. An EU-funded project to develop compre-hensive data analysis and modelling systems formonitoring the global distributions of atmosphericconstituents important for climate, air quality andUV radiation, as a baseline for the GACS.GMES. Global Monitoring for Environment andSecurity (GMES) is a European initiative for the imple-mentation of information services dealing withenvironment and security.
160°W
80°N
60°N
40°N
20°N
0°
20°S
40°S
60°S
80°S
120°W 80°W 40°W 0° 40°E 80°E 120°E 160°E00.0020.0050.010.020.050.10.20.5125102050100200500100020005000
Figure 1 Daily averaged fire intensity (mW m–2, with ~125 km resolution) observed by the two MODIS instruments and SEVIRI on 7February 2009. Coverage subject to observational limitations illustrated in Figure 2 (http://gems.ecmwf.int/d/products/aer/fire).
MACC. The EU-funded project Monitoring Atmos-pheric Composition and Climate (MACC) is thesuccessor to GEMS and the ESA-funded GMES ServiceElement project PROMOTE.
Satellite instruments
MODIS. This is a key instrument aboard the Terraand Aqua satellites. These instruments view the entireEarth’s surface every 1 to 2 days, acquiring data in 36spectral bands.SEVIRI. This instrument on the Meteosat SecondGeneration (MSG) satellites delivers daylight imagesof the weather patterns, plus atmospheric pseudo-soundings and thermal information. It provides imagedata in visible, near-infrared and infrared channels.The image sampling distance is 3 km at the sub-satel-lite point for the standard channels and down to 1 kmfor the so-called High Resolution Visible channel.

ECMWF Newsletter No. 119 – Spring 2009
11
METEOROLOGY
good agreement with independent aerosol observa-tions and widespread population exposure to fine modeparticulate matter in excess of a World HealthOrganization (WHO) guideline.
Satellite-based fire observations
Satellite instruments can either detect the thermal emis-sion during a fire or the burnt area after. The formerproducts are referred to as ‘hot spots’, ‘active fires’,‘fire pixels’ or ‘fire counts’, while the latter are knownas ‘burnt area’, ‘burnt scar’, ‘burnt pixel’ or ‘fire affectedarea’. Only the hot spot products can be delivered in realtime, which is required by the GACS. One example isESA’s ATSR World Fire Atlas (dup.esrin.esa.int/ionia/wfa/).Hot spot products are typically derived from satellite
observations of the thermal emission in a mid-infraredatmospheric window channel near 4 µm wavelength,where fires produce a strong signal with radianceincreases of several orders of magnitude. The intensityof fires varies greatly, which is partly due to fires beinga sub-pixel size process. Traditional hot spot productsfrom polar orbiting imagers can estimate the likeli-hood of a fire being present in each pixel, but they areunable to quantify the fire intensity. A quantitative fireproduct, WF_ABBA, has been available since the 1990sfrom the GOES satellites; it estimates fire temperatureand burning sub-pixel area with a resolution of about4 km at the sub-satellite point.Another quantitative hot spot product is available
from the two MODIS instruments aboard the Terraand Aqua satellites, the design of which has takenrequirements for quantitative fire observations intoaccount. The fire products generated by NASA andNOAA contain a Fire Radiative Power (FRP) estimatethat quantifies the thermal radiation emitted by thefires in units of megawatts (MW) with a resolution ofabout 1 km at the sub-satellite point. FRP is roughlyproportional to the chemical energy released by thefires, and thus also to the biomass combustion andpollutant emission rates. Therefore, FRP is consideredthe most appropriate fire observation product for emis-sion estimation.The main shortcoming of the MODIS observations
is that the polar orbits of the satellites limit the samplingfrequency. The potential for fire observations is alsoreduced by the presence of clouds. Figure 2a illustratesthe observation return periods of potential fire obser-vations that have actually been achieved during a given24-hour period. Water, ice, cloud and snow pixels arenot processed. The satellite orbits induce stripey patterns(e.g. over the Sub-Saharan region) and persistent cloudcover inhibits observations in several regions. Otherwisethere is coverage with indicative return periods typicallybetween 4 and 12 hours.In March 2008 the EUMETSAT Land SAF started
real-time production of a newly developed FRP prod-uct generated from SEVIRI observations. This productmaintains SEVIRI’s return (sampling) period of 15
minutes. It is therefore capable of resolving the diur-nal cycle of open fires in Africa and Southern Europewith unprecedented accuracy. The high samplingfrequency also helps to take advantage of brief cloud-free spells for fire observations in mostly cloudy regions.Figure 2b illustrates the return periods of potential
observations of fires for SEVIRI. The FRP product islimited to the geographical disk visible from Meteosat-9. But, within this disk, it covers higher latitudes thanthe MODIS fire products since snow/ice pixels arebeing processed. It is apparent, however, that the obser-vational capabilities of SEVIRI are affected by the samecloud pattern as in the MODIS data. For example, theITCZ over Central Africa is particularly persistent in thisrespect. Nevertheless return periods of around 30minutes in the SEVIRI disk constitute a major improve-ment over those of the MODIS instruments.
Smoke from the Greek fires in August 2007
The EUMETSAT project FREEVAL and GEMS havecombined SEVIRI FRP data with the global atmosphericaerosol model developed by GEMS to test how accuratelythe combined system can simulate smoke plumes. Thecatastrophic Greek fires in August 2007 were selectedas a test case.The total FRP observed over Greece during the huge
fire event in August 2007 is shown in Figure 3. It exhibitsstrong diurnal and day-to-day variations with the maxi-mum fire intensity occurring on the afternoon of 25August around 15:45 local time. The fire behaviour ofburning continuously through the night is typical for largefire events in middle and high latitudes, while tropicalfires mostly extinguish during night-time. The plot high-lights the high temporal resolution of the SEVIRI data.Smoke aerosols are represented as black carbon and
organic matter in the GEMSmodel. The emission coef-ficient relating FRP (Wm–2) to the total aerosol emissionrate (kg s–1 m–2) has been taken from a previous studyof FRP and aerosol optical depth (AOD) observed byMODIS. The partitioning of the aerosol species isprescribed according to the Global Fire EmissionsDatabase (GFED). Thus the smoke aerosol fluxes for theentire fire episode have been calculated from the SEVIRIdata with a spatial resolution of ~25 km (T799) and atemporal resolution of 1 hour.The global GEMS products are generally produced
at 125-km (T159) resolution. For this study we haveoperated the model with the higher resolution of T799because it is more typical for present-day regional airquality models, which are the primary tool for fore-casting European population health impacts. Theatmospheric simulation was set up in a ‘cycling’ mode,in which the meteorological fields are calculated in aseries of consecutive 12-hour forecasts that are initialisedfrom the operational analysis. In contrast the aerosolfields are solely governed by the model parametrizationand the surface flux input. The SEVIRI-derived fluxeswere injected into the lowest model level.

ECMWF Newsletter No. 119 – Spring 2009
12
METEOROLOGY
Figure 4a shows the observed FRP at 25-km resolu-tion and the AOD of the modelled smoke aerosols at12 UTC on 25 August. For comparison, Figure 4b showsa visible composite of concurrent MODIS observationsthat is overlaid with red markers for MODIS hot spotfire detections. SEVIRI and MODIS agree well on thelocations of the fires.Figure 4b shows that the smoke is blown in a south-
westerly direction over the Mediterranean Sea toNorthern Africa. The modelled smoke plumes in Figure4a reproduce the main observed features. In particu-lar, the observations show that the plume is structuredin a series of ‘pulses’ originating from the daily fireintensity maxima. Clearly visible just off the Pelopon-nesian coast is the pulse emitted by the fire earlier inthe day. The pulse emitted the day before just reaches
Libya; the landfall is well reproduced while the timingis slightly shifted. Also it is apparent that the wideningof the plume over the central Mediterranean Sea iswell represented.SEVIRI also detected strong fires in Algeria on 28–30
August 2007. We have simulated the transport of theemitted smoke plumes, mixed with a larger desert dustplume, northwards over the Mediterranean. Ground-based AOD observations in Lecce, Southern Italy,confirm the plume simulation quantitatively.Simulating the separation of the plume into pulses
from the Greek fires obviously depends on the hightemporal resolution and quantitative nature of theSEVIRI FRP product. Also the good representation ofthe plume transport is a testament to the accuracy oftropospheric winds produced by ECMWF’s Integrated
80°S
60°S
40°S
20°S
0°
20°N
40°N
60°N
80°N
160°W 120°W 80°W 40°W 0° 40°E 80°E 120°E 160°E
0.25
0.5
1
2
3
4
5
6
7
8
9
10
11
12
14
16
18
20
22
24
80°S
60°S
40°S
20°S
20°N
40°N
60°N
80°N
160°W 120°W 80°W 40°W 0° 40°E 80°E 120°E 160°E
a MODIS instruments
b SEVERI
Figure 2 Indicative return periods (hours) for observations with the potential to detect a fire by (a) the two MODIS instruments and(b) SEVIRI on 7 February 2009.

ECMWF Newsletter No. 119 – Spring 2009
13
METEOROLOGY
Forecast System (IFS). The remaining discrepanciesare primarily attributed to shortcomings of ourapproach in the very active research fields dealing withplume rise and emission factors that scale FRP to theindividual species fluxes, depending on fuel type andmeteorological conditions.In order to relate the plume simulations directly to
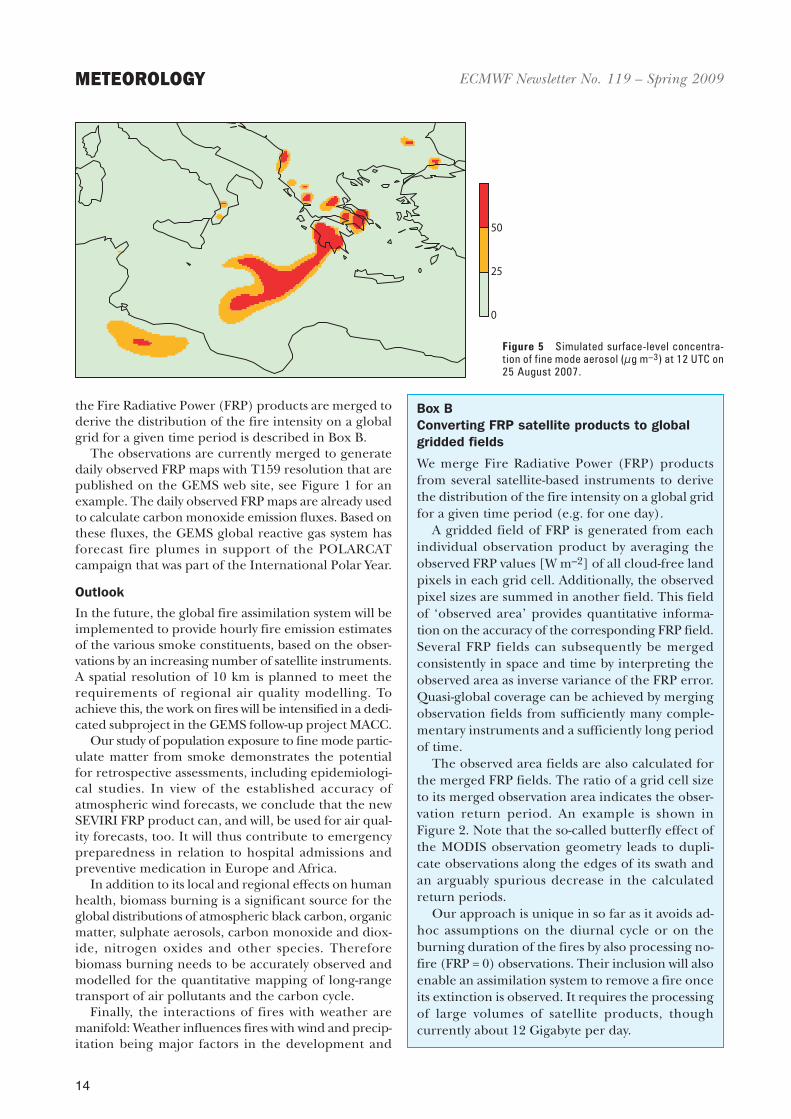
regional air quality and its impact on human health, wehave calculated the respirable fine mode (i.e. PM2.5)concentration in the smoke by assuming that two thirdsof the smoke is of type PM2.5, which is a conservativeestimate. An example of the resulting surface concen-trations is plotted in Figure 5.The World Health Organization (WHO) has deter-
mined an air quality guideline of the PM2.5 concentrationnot exceeding 25 µg m–3 for any 24-hour average. Acomparison of our simulation with a population densitymap indicates that more than 40 million people wereexposed to smoke PM2.5 concentrations exceeding theWHO guideline due to the large fires in Greece andAlgeria and smaller fires in neighboring countries. It isrecognized, however, that the injection of all fire emis-sions into the lowest model level may introduce someoverestimation. On the other hand, the exposure toPM2.5 from other sources, such as traffic, also needs tobe taken into account. While this case study highlightsthe potential of ingesting SEVIRI FRP products intoregional air quality models, extensive validation is neededbefore such a system is used for epidemiological studies.Such studies are use to quantify the toxic potentials ofthe different chemical component of air pollution.
Development of a Global Fire Assimilation System
Based on the success of the case study concerning theGreek fires, GEMS has started to implement a fire assim-ilation system at ECMWF that merges FRP observationsfrom SEVIRI and other instruments to achieve globalcoverage. It provides real-time estimates of pollutantfluxes from fires that are ultimately intended for use inall global atmospheric composition and regional airquality systems in the GACS.While SEVIRI was able to observe the diurnal vari-
ability of the Greek fires directly, cloud cover maygenerally get in the way. Outside the SEVIRI disk, theMODIS instruments provide global coverage, albeitwith large data gaps (see Figure 2). Since the operationof the GACS will require continuous global flux inputthat resolves diurnal variations, complementary obser-vations from several satellite instruments must bemerged. Also the remaining observational gaps must befilled by data assimilation with a numerical model of thefire intensity.As a first development step, the FRP products of
SEVIRI andMODIS are acquired and pre-processed foruse in a dedicated fire assimilation system. We obtain theSEVIRI FRP pixel product with a time lag of 30 minutesvia EUMETCast and theMODIS fire products with a timelag of 3–4 hours by ftp from NOAA. The way in which
18
12
6
0
4
2
1
0.7
0.4
0.2
0.1
0
a
b
7
Fire
Rad
iati
vePo
wer
(MW
×10
4) 6
5
4
3
2
1
021 22 23 24 25
August 20072726 28 29 30
Figure 3 Total Fire Radiative Power (FRP) observed over Greeceby SEVIRI. Date ticks at 00 UTC, 2 a.m. local time. The results arederived from a test version of the operational Land SAF product.
Figure 4 (a) FRP observed by SEVIRI (reddish, W m–2, with ~25 kmresolution) and modelled smoke column optical depth (blueish)compared to (b) observed hot spots (red) and true colour image byMODIS aboard Aqua at 1205 UTC on 25 August 2007(http://rapidfire.sci.gsfc.nasa.gov).
ECMWF Newsletter No. 119 – Spring 2009
14
METEOROLOGY
the Fire Radiative Power (FRP) products are merged toderive the distribution of the fire intensity on a globalgrid for a given time period is described in Box B.The observations are currently merged to generate
daily observed FRP maps with T159 resolution that arepublished on the GEMS web site, see Figure 1 for anexample. The daily observed FRPmaps are already usedto calculate carbonmonoxide emission fluxes. Based onthese fluxes, the GEMS global reactive gas system hasforecast fire plumes in support of the POLARCATcampaign that was part of the International Polar Year.
Outlook
In the future, the global fire assimilation system will beimplemented to provide hourly fire emission estimatesof the various smoke constituents, based on the obser-vations by an increasing number of satellite instruments.A spatial resolution of 10 km is planned to meet therequirements of regional air quality modelling. Toachieve this, the work on fires will be intensified in a dedi-cated subproject in the GEMS follow-up project MACC.Our study of population exposure to fine mode partic-
ulate matter from smoke demonstrates the potentialfor retrospective assessments, including epidemiologi-cal studies. In view of the established accuracy ofatmospheric wind forecasts, we conclude that the newSEVIRI FRP product can, and will, be used for air qual-ity forecasts, too. It will thus contribute to emergencypreparedness in relation to hospital admissions andpreventive medication in Europe and Africa.In addition to its local and regional effects on human
health, biomass burning is a significant source for theglobal distributions of atmospheric black carbon, organicmatter, sulphate aerosols, carbon monoxide and diox-ide, nitrogen oxides and other species. Thereforebiomass burning needs to be accurately observed andmodelled for the quantitative mapping of long-rangetransport of air pollutants and the carbon cycle.Finally, the interactions of fires with weather are
manifold: Weather influences fires with wind and precip-itation being major factors in the development and
0
25
50
Figure 5 Simulated surface-level concentra-tion of fine mode aerosol (µg m–3) at 12 UTC on25 August 2007.
Box BConverting FRP satellite products to globalgridded fields
We merge Fire Radiative Power (FRP) productsfrom several satellite-based instruments to derivethe distribution of the fire intensity on a global gridfor a given time period (e.g. for one day).A gridded field of FRP is generated from each
individual observation product by averaging theobserved FRP values [W m–2] of all cloud-free landpixels in each grid cell. Additionally, the observedpixel sizes are summed in another field. This fieldof ‘observed area’ provides quantitative informa-tion on the accuracy of the corresponding FRP field.Several FRP fields can subsequently be mergedconsistently in space and time by interpreting theobserved area as inverse variance of the FRP error.Quasi-global coverage can be achieved by mergingobservation fields from sufficiently many comple-mentary instruments and a sufficiently long periodof time.The observed area fields are also calculated for
the merged FRP fields. The ratio of a grid cell sizeto its merged observation area indicates the obser-vation return period. An example is shown inFigure 2. Note that the so-called butterfly effect ofthe MODIS observation geometry leads to dupli-cate observations along the edges of its swath andan arguably spurious decrease in the calculatedreturn periods.Our approach is unique in so far as it avoids ad-
hoc assumptions on the diurnal cycle or on theburning duration of the fires by also processing no-fire (FRP = 0) observations. Their inclusion will alsoenable an assimilation system to remove a fire onceits extinction is observed. It requires the processingof large volumes of satellite products, thoughcurrently about 12 Gigabyte per day.

ECMWF Newsletter No. 119 – Spring 2009
15
METEOROLOGY
propagation of wildfires. Vice versa, fires influence theweather as the smoke aerosol particles efficiently absorbsolar radiation and act as cloud condensation nuclei.In extreme cases, fires have been observed to generateso-called pyroconvection that may even penetrate thetropopause. Proper description of these effects has apotential for improving future numerical weatherpredictions and, with the help of the new global fireproducts, MACC will be able to quantify all these effectsmore accurately.
FURTHER READINGAndreae, M.O., D. Rosenfeld, P. Artaxo, A.A. Costa,G.P. Frank, K.M. Longo & M.A.F. Silva-Dias, 2004: Smokingrain clouds over the Amazon. Science, 303, 1337–1342.Hollingsworth, A., R.J. Engelen, C. Textor, A. Benedetti,O. Boucher, F. Chevallier, A. Dethof, H. Elbern, H. Eskes,J. Flemming, C. Granier, J.W. Kaiser, J.-J. Morcrette,P. Rayner, V.-H. Peuch, L. Rouil, M.G. Schultz,A.J. Simmons & GEMS Consortium, 2008: Toward a moni-toring and forecasting system for atmospheric composition:The GEMS Project. Bull. Am. Meteorol. Soc., 89, 1147–1164.Ichoku, C. & Y.J. Kaufman, 2005: A method to derive smokeemission rates from MODIS fire radiative energy measure-ments. IEEE Trans. Geosci. Remote Sensing, 45, 2636–2649.
Kaiser, J.W.,M. Suttie, J. Flemming, J.-J.Morcrette,O. Boucher &M.G. Schultz, 2009: Global real-time fire emis-sion estimates based on space-borne fire radiative powerobservations. In AIP Conf. Proc. 1100, 645–648. DOI:10.1063/1.3117069. Also http://link.aip.org/link/?APCPCS/1100/645/1Morcrette, J.-J., O. Boucher, L. Jones, D. Salmond,P. Bechtold, A. Beljaars, A. Benedetti, A. Bonet, J.W. Kaiser,M. Razinger, M. Schulz, S. Serrar, A.J. Simmons, M. Sofiev,M. Suttie, A.M. Tompkins & A. Untch, 2009: Aerosol analysisand forecast in the ECMWF Integrated Forecast System.Part I: Forward modelling. J. Geophys. Res., 114, D06206,doi:10.1029/2008JD011235.Schultz, M.G., M. Wooster, O. Boucher, M. Doutriaux-Boucher, C. Granier, A. Heil, A. Hollingsworth, J.W. Kaiser,T. Kasikowski, J.-J. Morcrette, G. Roberts, A. Simmons &G. van der Werf, 2009: FREEVAL Evaluation of a FireRadiative Power Product derived from Meteosat 8/9 andidentification of operational user needs. Final Report:EUMETSAT Contract EUM/CO/06/4600000277/YG.Forschungszentrum Jülich GmbH, Jülich, Germany. ISBN 978-3-89336-549-4.van der Werf, G.R., J.T. Randerson, L. Giglio, G.J. Collatz,P.S. Kasibhatla & A.F. Arellano Jr., 2006: Interannual vari-ability in global biomass burning emissions from 1997 to2004. Atmos. Chem. Physics, 6, 3423–3441.
PETER BECHTOLD, JEAN-RAYMOND BIDLOT U10 gust = U10 + 7.71u*[1 + f(z/L)]
Parametrization of convective gusts
GUSTS are defined as wind extremes and constitute animportant forecast parameter in particular for air, shipand road traffic guidance, and warnings concerningenvironmental damage. The latter is related to theforce the wind exerts on an obstacle which is propor-tional to the square of the wind speed. Therefore it isnot only necessary to know the mean wind speed, ingeneral the near-surface 10-metre wind speed is usedas the relevant quantity, but also the wind extremes.Until recently the gust formulation has been based
on an assessment of the turbulent gustiness in the bound-ary layer. However, this takes no account of gustinessassociated with convective situations. A new formula-tion has been developed which overcomes this limitation.
Representation of gusts
Practically, gusts are defined as extreme winds observedby anemometer. A 3-second running average is appliedto the data. The reporting practice is such that gusts arereported as extremes over the preceding 3 or 6 hours.Until IFS cycle 33r1 (Cy33r1) the ECMWF model windgusts have been parametrized as the sum of the instan-taneous 10-metre wind speed and a turbulent gustinessdepending on the static stability of the boundary layer:
where u* is the friction velocity, itself a function of the10-metre wind speed, z is the height, and L is the Monin-Obukhov length-scale. This is an empirical relationbased on observed turbulence spectra. Post-processingis applied to the model data in accordance with thereporting practice.This formulation has proven quite successful when
compared to standard SYNOP,METAR and Buoy reports.However, it cannot represent gusts that are generatedin deep convective situations either through organizeddowndraughts in a sheared environment or evapora-tively driven downdraughts. Following reports fromDeutsche Wetterdienst (DWD) and other meteorolog-ical centres about the underestimation of wind gustsover land, the introduction of a convective contributionto the wind gusts was put forward for implementationin Cy35r1 (30 September 2008). Indeed, this seemedfeasible as since Cy32r3 (7 November 2007) the modeldeep convection has a reasonably smooth spatial struc-ture and a decent diurnal cycle in the extra-tropics.The convective gusts are simply estimated as propor-
tional to the low-level wind shear:U10 gust, conv = αmax (0, U850 – U950)
with α= 0.6 a tunable ‘mixing’ parameter andU850 –U950