snab the information revolution topic 1 · 12/7/2007 · sites 1 revolution. topic 1
TRANSCRIPT

© 2008 Gatsby Technical Education Projects. This page may be copied solely for use in the purchaser’s school or college.
1
The information revolution SNAB Topic 1
This activity is about information storage and retrieval, about books and journals and about comparing print with electronic information storage. Information storage is in the process of transforming how we behave, both because of the ongoing explosion of the quantity of information available and because of increasing ease of access.
OutcomesStudents will be able to:
compare paper and print with electronic media •
locate resources in a library•
use information research skills•
discuss the impact of information storage • technologies on their own learning.
Time requiredAllow one to two hours, depending on the extent of discussion.
Outline of the activityStudents carry out searches for information to develop information research skills. These searches can be done in the context of the current topic being studied. Finally, there are opportunities to discuss issues of the information revolution.
Part 1 involves searching for information in the library,andfindingoutaboutserialnumbersofbooks and journals.
It might be helpful to point out the existence of ISBN and ISSN numbers, how these are subject to international agreement and how they are useful for ordering books and journals whether from a library or from a shop.
In Part 2 students learn about research skills from the British Library website, search in the British Librarycatalogueandlearnaboutrefiningtheirsearch.
Part 3 could be a collaborative piece of work carried out for homework / private study. One or two students should be responsible for collecting
information from the class and producing the resource.
Discussion could be structured by allocating one or two questions to small groups or pairs of students, who then report back on their discussion. If students become more aware of living through an unprecedented information revolution and the impact of this on all areas of life, including their own learning, then the activity will have achieved a great deal. If class time can not be allocated to discussion of all these questions, some of them could be given for homework for individuals or pairs to discuss and write about.
In preparation for the activity:
The teacher should ascertain whether students have already had an introduction to the library and its structure in the past year or so and the extenttowhichthisspecificallyrelatedtoscienceand technology resources (as opposed to the arts and humanities). The level of the students’ sophistication in using cataloguing systems and information retrieval methods should also be established.
The teacher should ensure that the library the students are to use actually carries the books or journals to which the students have been referred to in this activity. If not, alternative resources will have to be substituted.
The librarian should be informed about the activity which is expected to take place in the library. They might even be invited to participate. Involvement of the librarian greatly contributes towards building healthy working teacher / librarian and student / librarian relationships.
1 of 2
© 2008 Gatsby Technical Education Projects. This page may be copied solely for use in the purchaser’s school or college.
2
The information revolution
2 of 2
The librarian’s talk must be short and to the point so that the students do not lose patience. This activity is mainly about students actively becoming familiar withfindingbooksinthelibraryandthemethodsofclassifying them.
Further informationFor further information about Melvil Dewey, the DeweyDecimalClassificationandothermethodsofclassificationseetheweblinksontheLSSwebsitehttp://www.sep.org.uk/lss.
Today books and articles can be located in the library through a computerised catalogue by typing only key words, thus answering the problem of rapidlylocatingspecificinformationfromdatabases.However, though the computerised catalogue supplies information on the location of a book or an article, for the most part (at least for reference books) it is necessary to go to the correct bookshelf in order physically to get to the book. Therefore we have to know the method of cataloguing and how to locate a book on the bookshelf.
We might compare locating a certain book in the library to locating a person who lives in London. If we want to visit them, we do not simply go into the street and call their name! We have to know the name and location of the neighbourhood they live in, the name of the street, the number of the house andeventhenumberoftheflat.Inasimilarway,aDeweynumbergivesusspecificinformationaboutwhere the book is located in the library.
The library generally includes two main sections: 1fictionbooks 2non-fictionbooks,textbooksandreferencebooks
Fiction books are arranged on the shelves alphabetically according to author’s name. Non–fictionbooksarearrangedinthelibraryaccording to subject – most by the Dewey method. Thisactivityfocusesonthenon-fictionbookssection.
When interdisciplinary subjects are involved, it is sometimes hard to decide how to classify them and to which branch to ascribe them. The Dewey method does not always give a clear enough answer to these
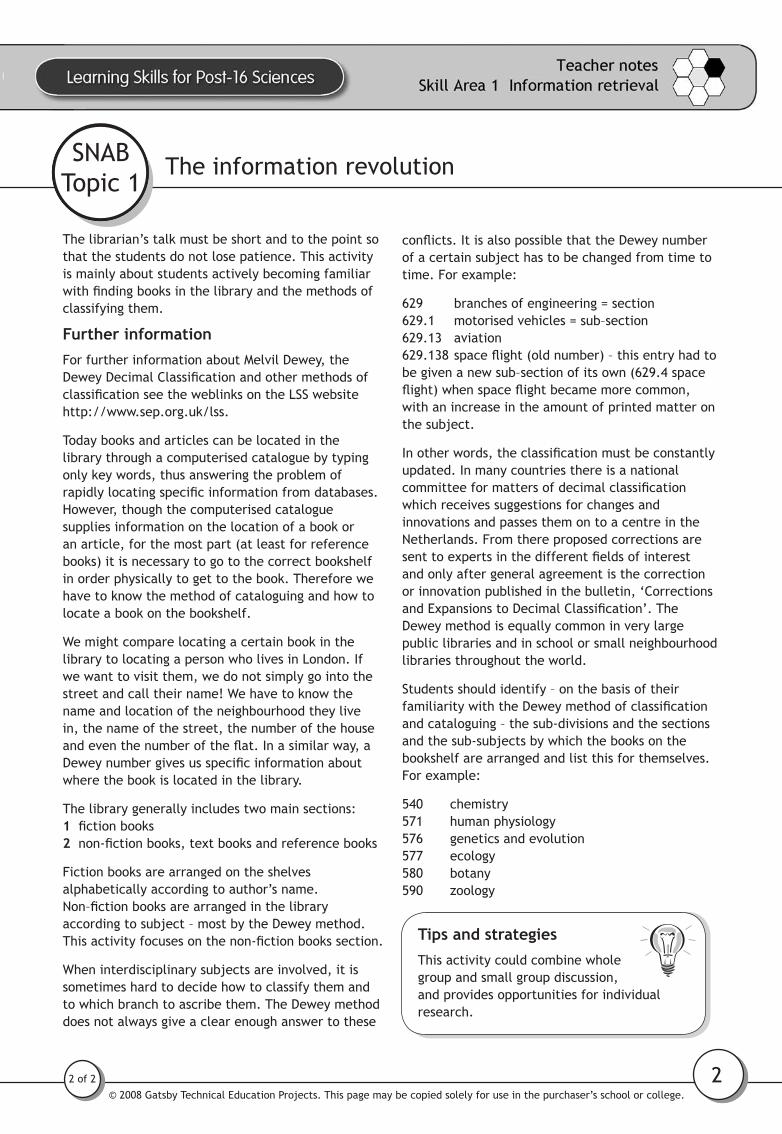
conflicts.ItisalsopossiblethattheDeweynumberof a certain subject has to be changed from time to time. For example:
629 branches of engineering = section 629.1 motorised vehicles = sub–section 629.13 aviation 629.138spaceflight(oldnumber)–thisentryhadtobe given a new sub–section of its own (629.4 space flight)whenspaceflightbecamemorecommon,with an increase in the amount of printed matter on the subject.
Inotherwords,theclassificationmustbeconstantlyupdated. In many countries there is a national committeeformattersofdecimalclassificationwhich receives suggestions for changes and innovations and passes them on to a centre in the Netherlands. From there proposed corrections are senttoexpertsinthedifferentfieldsofinterestand only after general agreement is the correction or innovation published in the bulletin, ‘Corrections andExpansionstoDecimalClassification’.TheDewey method is equally common in very large public libraries and in school or small neighbourhood libraries throughout the world.
Students should identify – on the basis of their familiaritywiththeDeweymethodofclassificationand cataloguing – the sub-divisions and the sections and the sub-subjects by which the books on the bookshelf are arranged and list this for themselves. For example:
540 chemistry 571 human physiology 576 genetics and evolution 577 ecology 580 botany 590 zoology
Tips and strategiesThis activity could combine whole group and small group discussion, and provides opportunities for individual research.
SNAB Topic 1

© 2008 Gatsby Technical Education Projects. This page may be copied solely for use in the purchaser’s school or college. © 2008 Gatsby Technical Education Projects. This page may be copied solely for use in the purchaser’s school or college.
3
In this activity you will use information research skills and discuss the impact of information storage systems on your own learning.
There are different estimates of the rate at which the total amount of information stored in the world is increasing. In some specialist subjects, including large parts of the sciences, the quantity of information is reckoned to double every 18 months.
Part 1 Books and journals
1 Visit your school or college library and locate the textbooks for the science course you are studying. Familiarise yourself with the books available, so you know where to look for information you might need in the future. Look up one key term relevant to your current study in the index of a selected book. Note the book title, author and page number, along with one new fact you have discovered on that page.
2 Locate one text book relevant to your current area of study. Find the ISBN number on the back of this book. Find out what ISBN stands for, and how this number might be useful to you.
3 What type of publication has an ISSN (International Standard Serial Number)? Who issues ISSN numbers?
Part 2 The British Library
4 Go to the home page of the British Library. (You can use the link from the LSS website http://www.sep.org.uk/lss, or search in Google.)
5 Search on ‘British Library research skills’. Explore the links from this page.
6 Choose one important and interesting point that is new to you and you would like to share with others. Make a note of the key information, including the full URL. Share the information with others. Discuss how useful or interesting the information is as a class.
Narrowing a search7 Return to the research skills page. Click on Using The British Library. Click on the Catalogue hyperlink. Click on Search the Integrated Catalogue. Type a key term relating to your current topic of study, such as acceleration, atomic structure or cell organelle. How many results or records did you obtain? Try another search, moretightlyspecified,byaddingasecondkeyterm.Forexample,tryaccelerationmeasurement, or atomic structure carbon or cell organelle plant.
The information revolution
Briefing sheet
1 of 3
SNAB Topic 1

© 2008 Gatsby Technical Education Projects. This page may be copied solely for use in the purchaser’s school or college.
4
The information revolution
Briefing sheet
2 of 3
Boolean search
TryusingaBooleansearchtechniquetofindwhatyouneedintheBritishLibrarycatalogue. This technique can be used in any Internet search engine.
‘Boolean operators’ are link words which combine multiple search terms.
The three most common link words are: AND, OR, NOT. AND (+)Using ‘+’ gives results which contain both the key terms you search on.
e.g.‘chemistry+physics’findsallsitesthatmentionthe word ‘chemistry’ and the word ‘physics’. (Note: no space between the ‘+’ and the word ‘physics’)
Compare this with:
‘chemistryandphysics’whichfindsallthesitesmentioning the words ‘chemistry’, ‘and’, and ‘physics’.
ORUsing OR gives you either or both of the terms you searched on.
e.g.‘chemistryORphysics’findsallsitesthatmentioneithertheword‘physics’or the word ‘chemistry’.
NOT (-) Using ‘–‘ excludes a term from a search.
e.g.‘chemistry-physics’findsallthesitesthatmentiontheword‘chemistry’thatdo not mention the word ‘physics’. (Note: there is no space between the ‘–’ and the word ‘physics’)
8 Draw Venn diagrams like the one above for OR and NOT Boolean searches on two terms.
9 Use a Boolean technique to narrow your search on your chosen topic.
10 When your search returns fewer than 10 records, have a look in more detail at each one (by clicking on the title). How many of them are books and how many are articles in journals? How can you tell?
SNAB Topic 1

© 2008 Gatsby Technical Education Projects. This page may be copied solely for use in the purchaser’s school or college. © 2008 Gatsby Technical Education Projects. This page may be copied solely for use in the purchaser’s school or college.
5
Part 3 Discussion
11 Discuss whether there are some types of information you prefer to access electronically and others which you prefer in print.
12 Which is most reliable, electronic or paper information storage?
13 In an age of electronic information storage, how important is it to store knowledge in your own head? Is it more important to have information in your ownmemory,ortoknowhowtofindtheinformationfromotherstorage?(Itmight help to think about different professionals, such as doctors, teachers, scientists,lawyers,journalistsandengineers.)Doesthishavesignificanceforyour own study?
The information revolution
Briefing sheet
3 of 3
SNAB Topic 1

© 2008 Gatsby Technical Education Projects. This page may be copied solely for use in the purchaser’s school or college.
6

© 2008 Gatsby Technical Education Projects. This page may be copied solely for use in the purchaser’s school or college. © 2008 Gatsby Technical Education Projects. This page may be copied solely for use in the purchaser’s school or college.
7
UsingtheInternettofindinformation
StudentsfirstcarryoutanInternetsearchtofindwebsitesthatwouldbehelpfulinansweringspecificquestionsaboutasciencetopic.Inthesecondpartoftheactivity,studentsrefinetheirsearchusingaBoolean-styleapproach,outlinedinthebriefingsheet.Thestudentsthencompletearelatedhomework task.
OutcomesStudents will be able to:
usebasicsearchtechniquestofindwebsites•relating to a topic
evaluate the usefulness and reliability of •different websites as a suitable source of information on a particular topic
apply Boolean-style operators to narrow a •search, with a view to identifying more useful sites
extract information from websites to answer •specificquestions.
Time requiredAllow 30 minutes plus homework.
Outline of the activityThis task provides students with the opportunity to refinetheirskillsatInternetsearchingbyprovidingthemwithtoolstoevaluatewebsitesandrefinesearches using ‘Boolean operators’ (link words which combine multiple search terms).
Thereisatableonbriefingsheet1forstudentstoconsider the usefulness of a particular website. The following points for discussion may be useful when considering reliability.
Reliability of the author – Who is the author? What is the professional background of the author? What year was the information written?
Reliability of publisher – What is the purpose of the website? Is it to persuade or to inform? Who are the target audience?
1 Introduce the task as an opportunity for students torefinetheirskillsintheareaofInternetsearching,withaviewtoimprovingtheirefficiencyandhelpingthemtofindmorerelevantinformation.Itwouldbehelpful to discuss criteria to use in evaluating the usefulness of websites.
2StudentsdoInternetsearchestofindsourcesof information to answer three questions which theyhaveidentified.Theyfindthreewebsitesandevaluate them.
3 Students join up to discuss their evaluations as describedonthebriefingsheet.Thisshouldbefollowed by a class discussion on search methods. Issuebriefingsheet2.Remindstudentshowtodoa Boolean search; see Activity 1.1 The information revolution.
4Studentscontinuetoworkinpairstorefinetheirsearch.
1 of 1
Tips and strategiesAt Post-16, many students will already be familiar with the use of the Internet for researching information on key vocabulary. But withoutspecificteachingandlearningactivities,theymaynotdothisthoughtfullyandefficiently.Most students will need guidance in intelligent selection and concise re-interpretation of material.
Draw students’ attention to the ‘Advanced Search’ button in Google, Google Scholar, Google Images and The Advanced Google Operators web page.
SNAB Topic 1

© 2008 Gatsby Technical Education Projects. This page may be copied solely for use in the purchaser’s school or college.
8

© 2008 Gatsby Technical Education Projects. This page may be copied solely for use in the purchaser’s school or college. © 2008 Gatsby Technical Education Projects. This page may be copied solely for use in the purchaser’s school or college.
9
In this activity you will evaluate some websites used in your research.
Part 1 Evaluating websites
1 In your group, agree three questions that you would like to know the answer to. These should relate to your current topic of study in science.
2Youhavetwominutestofindthreewebsiteswhicharesourcesofinformationthat can help answer the questions. You can do this individually or in pairs. Write down the website URLs below.
Site 1: _____________________________________________________________
Site 2: _____________________________________________________________
Site 3: _____________________________________________________________
3 You are now going to evaluate the usefulness of these websites according to the criteria in the table. Rank each site where 1 = Most useful, 3 = Least useful.
Criteria Site 1 Site 2 Site 3
Reliability of the author
Reliability of the publisher
Whether the information is subject to independent checks
Presentation of the information (simple / sophisticated)
Presence of distracting clutter
Usefulness of links to related information
Relevance of the information to the question
Amount of irrelevant information
Amount of interesting issues that are not the main point
Ease of access
Visual appeal
Requires little prior knowledge
Date of last update
Levelofdifficultyoftheinformation
Total score: _________ _________ _________
Using the Internet to find information
Briefing sheet 1
1 of 2
SNAB Topic 1

© 2008 Gatsby Technical Education Projects. This page may be copied solely for use in the purchaser’s school or college.
10
4 Join up with the other students in your group and discuss your evaluation of the websites you found. Take a look at each others’ websites and discuss the approach you took to searching for them.
In your group, agree your top three websites for the topic you are studying. How well do they serve your particular purpose?
2 of 2
Using the Internet to find information
Briefing sheet 1
SNAB Topic 1
© 2008 Gatsby Technical Education Projects. This page may be copied solely for use in the purchaser’s school or college. © 2008 Gatsby Technical Education Projects. This page may be copied solely for use in the purchaser’s school or college.
11
Using the Internet to find information
Briefing sheet 2
Part 2 Successful searching
1 Use a Boolean technique to narrow your search on websites which will help answerthequestionsyouidentifiedinPart1.Whenyoursearchreturnsfewerthan ten records, have a look in more detail at each one.
2 Discuss with your partner whether these are more useful than the websites you found earlier. You do not need to complete another table, but refer to the criteria used before.
3 In your group, allocate one person to research each of the following. After 5 minutes, each student should feed back to the group to demonstrate how these can improve the accuracy of your searching.
i Google Advanced Search techniques. Allocate two students to this area,soyoucancoveraspecifictechniquesuchas‘inurl’andthegeneral advanced search page.
ii Google Scholar iii Google Images
4 Identify which website is the most useful of those you have looked at. Make notes so you are ready to discuss with the class how you found the site and what made you decide that this was the most useful.
5 Discuss other techniques which can be used to narrow your searches.
1 of 1
SNAB Topic 1

© 2008 Gatsby Technical Education Projects. This page may be copied solely for use in the purchaser’s school or college.
12

© 2008 Gatsby Technical Education Projects. This page may be copied solely for use in the purchaser’s school or college. © 2008 Gatsby Technical Education Projects. This page may be copied solely for use in the purchaser’s school or college.
13
Believe it or not: classifying statements
Students examine the claims to truthfulness of statements of different kinds. The aim is to become more critical of the use of language and to develop a constructive scepticism when assessing primary and secondary information.
OutcomesStudents will be able to:
distinguish between rhetorical statements, •subjective statements, statements based on definitionandstatementsbasedonobservation
distinguish between primary and secondary •information
assess the reliability of secondary information •from different sources.
Time requiredAllow 30 minutes plus discussion time. The 30 minutes does not have to be during contact time.
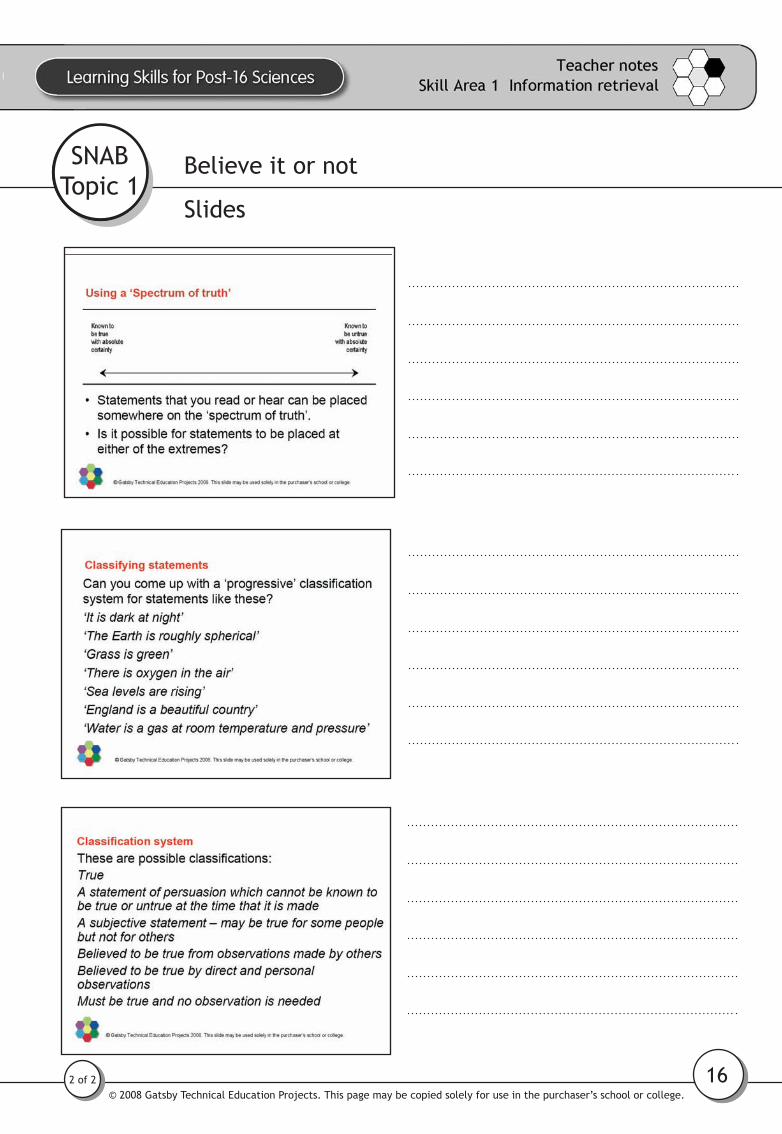
Outline of the activityThis activity considers the nature of statements and the grey area between fact and opinion. Students are provided with information that they need to place into a ‘spectrum of truth’ from ‘known to be true with absolute certainty’ to ‘know to be untrue with absolute certainty’.
Students should be able to recognise:
rhetorical statements – a statement in the form of a question formulated for effect rather than the expectation of an answer
subjective statements – a statement, that is based on a personal opinion
statements based on definition – a formal statement based on the meaning of something
statements based on observation – a description of what someone has seen
statement of persuasion – a statement designed to influencepeoples’opinions
primary information and data–definitioninbriefingsheet 1
1 of 2
secondary information and data–definitioninbriefingsheet1.
In slides 1.4 the following is suggested as a classificationsystem:
•true
•astatementofpersuasionwhichcannotbeknownto be true or untrue at the time that it is made
•asubjectivestatementmaybetrueforsomepeople but not for others
•believedtobetruefromobservationsmadebyothers
•believedtobetruebydirectandpersonalobservations
•mustbetrueandnoobservationisneeded.
Students should be provided with an opportunity to discusstheirreasoningfortheirclassificationofthestatements.
1Usethefirstthreeslidestodiscussthe‘spectrumof truth’ and the background to the activity.
2Issuebriefingsheet1andtheresourcesheet,forthe students to do the ‘spectrum of truth’ activity.
3 Continue the slides from slide 4 to introduce the ideaofaprogressiveclassificationofstatements.Studentsarelikelytofindthischallenging,soitisworth spending a few minutes discussing ideas with them.
4Issuebriefingsheet2,whichincludesthestatementclassificationactivity.Discussthedifferentcategories into which the statements can be placed.
5 Follow the activities with a discussion, focussing on the reasoning that students apply to their classifications.
SNAB Topic 1

© 2008 Gatsby Technical Education Projects. This page may be copied solely for use in the purchaser’s school or college.
14
Believe it or not: classifying statements
2 of 2
Tips and strategiesThe headings in the table on resource sheet 2 will require some discussion before the students complete the activity.
You could ask the students ‘How would you know if a statement is untrue?’ etc. for each heading and get them to debate this for a minute or two.
Different students are sure to have differing views, and it is worth spending some time on this tomakesurethattheygivetheclassificationof each statement an appropriate amount of thought.
SNAB Topic 1

© 2008 Gatsby Technical Education Projects. This page may be copied solely for use in the purchaser’s school or college. © 2008 Gatsby Technical Education Projects. This page may be copied solely for use in the purchaser’s school or college.
15
Believe it or not
Slides
1 of 2
SNAB Topic 1
© 2008 Gatsby Technical Education Projects. This page may be copied solely for use in the purchaser’s school or college.
16
Believe it or not
Slides
2 of 2
SNAB Topic 1

© 2008 Gatsby Technical Education Projects. This page may be copied solely for use in the purchaser’s school or college. © 2008 Gatsby Technical Education Projects. This page may be copied solely for use in the purchaser’s school or college.
17
Believe it or not
Briefing sheet
In this activity you will discuss the ‘truthfulness’ of some primary and secondary information.
Primary information and data
Scientificstatementsarebasedonobservations.Weallmakeobservationsofall kinds and they are important to us as individuals in forming our ideas. These direct observations provide ‘primary data’ about the world.
In science, observations made by one person have limited value, except to the observer. Observations reported to other people gain value if others can then ‘replicate’, or repeat, the observations. That makes the process of reporting very important.
Secondary information and data
Reported observations provide ‘secondary information’ about the world. Your report of a practical investigation is based on your own primary data, but it is secondaryinformationtopeoplewhoreadit.Anewspaperreportofascientificdevelopment also provides secondary information.
You will be given a resource sheet containing some examples of secondary information. Decide which you believe, which you are more cautious about and which you do not believe. Think about your reasoning for each choice – you will discuss this with another group later on.
This is a ‘spectrum of truth’:__________________________________________________ ___________________
Known to Known tobe true be untruewith absolute with absolutecertainty certainty
_____________________________________________________________________
Place each of the examples of secondary information, A – G on the spectrum.
Join with another group / pair to compare your spectrum with those produced by other students. Discuss any differences in terms of the reasoning behind your decisions.
1 of 1
SNAB Topic 1

© 2008 Gatsby Technical Education Projects. This page may be copied solely for use in the purchaser’s school or college.
18

© 2008 Gatsby Technical Education Projects. This page may be copied solely for use in the purchaser’s school or college. © 2008 Gatsby Technical Education Projects. This page may be copied solely for use in the purchaser’s school or college.
19
A‘The initially controversial congestion charge introduced in 2003 by the City of London, turned out to be very successful within a year (15 % less traffic in the charging zone and 30 % reduction in traffic delays).’ Source: Transport for London
B ‘Credible UFO sights are on the increase around the world. The majority of incidents happen at night. They are reported by one or more witnesses, and generally do not involve physical contact. Nondescript photos are often offered as proof of a sighting. Contact information from aliens is generally channelled and speaks about the nature of humanity and its evolution. Description of ships are the same as those recorded throughout history, in recent years centering on triangular formations, one of which I witnessed in November 2003. Without physical contact and information shared, our connection remains a mystery.’ Extraterrestrial interest group website C
From Forest Woodland / Grassland
Farmland Urban areas
Losses Gains Net change
Forest 39699 30 98 2 –130 57 -73
Woodland /Grassland
14 34 355 10 2 –26 50 24
Farmland 43 20 15 138 16 –79 108 29
Urban areas n.s. n.s. n.s. 380 0 20 20
Total -235 235
Source: Holmgren 2006, taken from Global Environment Outlook published by the United Nations Environment Programme
Believe it or not
Resource sheet 1
1 of 2
SNAB Topic 1

© 2008 Gatsby Technical Education Projects. This page may be copied solely for use in the purchaser’s school or college.
20
D‘Research like that being done at the Colorado State University’s (CSU) Engines and Energy Conservation Laboratory and the University of New Hampshire (UNH), suggests that algae could supply enough fuel to meet all of America’s transportation needs in the form of biodiesel. That’s right . . . all of it! Whereas with our current biodiesel feedstocks, like soy and palm, there’s no way we could grow enough to supply all of our transportation needs. In fact, it would actually require twice the land area of the US devoted to soybean production to meet current heating and transportation needs. That’s a lot of beans! Algae, on the other hand, could supply all U.S. diesel power using a mere 0.2% of the nation’s land. In fact, enough algae can be grown to replace all transportation fuels in the U.S. on only 15,000 square miles or 4.5 million acres of land. That’s about the size of Maryland.’Source: Biodiesel Bliss - The Second Coming By Nick Hodge, April 2007Energy and Capital website http://www.energyandcapital.com E‘A small amount of radioactive waste comes from medical (2%) and military (1%) sources, but the bulk of it is produced by the nuclear power industry. In the UK, about 20% of our electricity is generated in nuclear power stations which use uranium as their fuel.’ David Sang, Catalyst Magazine, April 2004
F‘Under the proposed new Planning Bill, the Government wants to push through plans for nuclear power stations and airport expansions, which will have drastic implications for our ability to cut our carbon emissions and tackle climate change.’ Friends of the Earth http://www.foe.co.uk
G‘The blockbuster success of Yahoo! Answers is all the more surprising once you spend a few days using the site. While Answers is a valuable window into how people look for information online, it looks like a complete disaster as a traditional reference tool. It encourages bad research habits, rewards people who post things that aren’t true, and frequently labels factual errors as correct information. It’s every middle-school teacher’s worst nightmare about the Web.’Jacob Leibenluft, Slate.com, 07 December 2007
Believe it or not
Resource sheet 1
2 of 2
SNAB Topic 1

© 2008 Gatsby Technical Education Projects. This page may be copied solely for use in the purchaser’s school or college. © 2008 Gatsby Technical Education Projects. This page may be copied solely for use in the purchaser’s school or college.
21
Believe it or not
Briefing sheet 2Do you believe everything you ever hear? Do you understand everything you ever hear? Do you believe your own eyes? To ensure that you are not fooled by things you read and hear, it helps to understand that there are different kinds of statements.
Tick the columns as appropriate for statements in the table on page 47 overleaf. Therearenotalways‘right’answers.Tickthecolumnsthatyouthinkbestfitthe statement.
If you prefer, make your own ‘progressive’ table headings which allow you to make statements from ‘certain to be untrue’ to ‘certain to be true’. Find six statements to rank and discuss in your group.
1 of 1
SNAB Topic 1

© 2008 Gatsby Technical Education Projects. This page may be copied solely for use in the purchaser’s school or college.
22
Statement Not true
A statement of persua-sion which cannot be known to be true or untrue at the time it is made
A subjec-tive state-ment - may be true for some peo-ple but not for others
Must be true and no obser-vation is needed
Believed to be true from obser-vations made by others
Believed to be true from observations made by you
Expected out-come of further observation
Very strongly be-lieved
Not so strong-ly be-lieved
Very strong-ly be-lieved
Not so strong-ly be-lieved
Pre- dic-tions are certain
Pre-dic-tions are not certain
Lightobeysalawofreflection
The Sun rises every morning
All triangles have three sides
The population of the USA is about 300 000 000
I exist
Other people exist
A universe exists
The moons of Saturn exist
The universe would still exist if there were no people to observe it
Big Brother is a TV show
Big Brother is a good TV show
Titan (a moon of Saturn) has hydrocarbon clouds
A stone released from rest near the Earth falls to the surface
2 + 2 = 4
Elephants are beautiful
Nuclear generation of electricity increases carbon emissions
Nuclear generation of electricity decreases carbon emissions
NeilArmstrongwasthefirstmanonthe Moon
The Moon landings were staged in an elaborate movie studio on Earth
The Solar System is about four-and-a-half billion years old
The Solar System was created about 4000 years ago
The new Peugault 27XLi will give you the drive of your life
Oxycare skin cream gets rid of spots
Gravitationalfieldstrengthatthesurface of the Earth is 9.8 N kg-1
The pressure exerted by a gas doubles when its temperature in Kelvin is doubled
When we win the election we will cut taxes
Believe it or not
Resource sheet 2
1 of 1
SNAB Topic 1

© 2008 Gatsby Technical Education Projects. This page may be copied solely for use in the purchaser’s school or college. © 2008 Gatsby Technical Education Projects. This page may be copied solely for use in the purchaser’s school or college.
23
Statement Not true
A statement of persua-sion which cannot be known to be true or untrue at the time it is made
A subjec-tive state-ment - may be true for some peo-ple but not for others
Must be true and no obser-vation is needed
Believed to be true from obser-vations made by others
Believed to be true from observations made by you
Expected out-come of further observation
Very strongly be-lieved
Not so strong-ly be-lieved
Very strong-ly be-lieved
Not so strong-ly be-lieved
Pre- dic-tions are certain
Pre-dic-tions are not certain
Lightobeysalawofreflection
The Sun rises every morning
All triangles have three sides
The population of the USA is about 300 000 000
I exist
Other people exist
A universe exists
The moons of Saturn exist
The universe would still exist if there were no people to observe it
Big Brother is a TV show
Big Brother is a good TV show
Titan (a moon of Saturn) has hydrocarbon clouds
A stone released from rest near the Earth falls to the surface
2 + 2 = 4
Elephants are beautiful
Nuclear generation of electricity increases carbon emissions
Nuclear generation of electricity decreases carbon emissions
NeilArmstrongwasthefirstmanonthe Moon
The Moon landings were staged in an elaborate movie studio on Earth
The Solar System is about four-and-a-half billion years old
The Solar System was created about 4000 years ago
The new Peugault 27XLi will give you the drive of your life
Oxycare skin cream gets rid of spots
Gravitationalfieldstrengthatthesurface of the Earth is 9.8 N kg-1
The pressure exerted by a gas doubles when its temperature in Kelvin is doubled
When we win the election we will cut taxes
Speed survey
Surveys are an important method of information retrieval. This activity allows students to evaluate the process of collecting data from short interviews with their peers.
OutcomesStudents will understand:
the importance of gathering information from •people (survey)
the case study approach to research.•
Time requiredAllow one hour, 30 minutes for the speed survey and 30 minutes to plan and collate results.
Outline of the activityThis speed survey game is similar to the concept of speed dating and speed networking.
Askstudentstoplanfivequestionsrelatedtotheirscience lessons that they could ask their peers to form part of a small research project. Give them some examples, such as the following.
Are you a vegetarian?•
How often do you get ill (colds, coughs)?•
What is your resting pulse rate? •
How regularly do you play sports?•
Discuss whether, by asking enough people, it is possible to make a link between the answers such as ‘those who are vegetarian are healthier?’ or ‘those who play sport regularly have a lower resting pulse rate than those who do not’.
Once students have their questions, they all start off with one partner and you shout ‘go’. When 1½ minutes is up, ring a bell / alarm (or shout ‘change’).Thisindicatesthatthefirststudentinterviewer now becomes the interviewee. After another 1½ minutes ring a bell and call ‘move!’. Thissignalsthatstudentsmustfindsomeoneelseto talk to, and the process repeats. Each student in the pair has only 1½ minutes to conduct their interview.
Tips and strategiesStudents can mingle in the classroom, or sit at desks as if being interviewed while one in the pair remains stationary and the others move around (just like speed dating!).
Agree that potentially embarrassing questions will not be part of the survey.
This activity if extended (i.e. asking the students to prepare their data for a presentation) would allow you to cover Skill Areas 4 and 6 as well.
After half an hour (or ten interviews), ask students to look at their results and see if there are any trends. Can students compile their results in a form that can be presented to the rest of the class (graphs, tables etc.)? Ask for a few volunteers to tell the whole class what they have found.
Have a short discussion based on the last question onthebriefingsheet.Canstudentsusetheirpreliminary data to generalise about their year group (or even age group)? Why? This illustrates how ‘case studies’, i.e. getting a lot of information (orfivequestions!)fromasmallsample,mightgiveyou rich data, but this is not enough to tell you everything. The sample is not representative of the whole population, so you cannot generalise.
1 of 1
SNAB Topic 1

© 2008 Gatsby Technical Education Projects. This page may be copied solely for use in the purchaser’s school or college.
24

© 2008 Gatsby Technical Education Projects. This page may be copied solely for use in the purchaser’s school or college. © 2008 Gatsby Technical Education Projects. This page may be copied solely for use in the purchaser’s school or college.
25
In this activity you will collect data from speed surveys of your classmates.
1 Writedownfivequestions,basedaroundatopicyouarecurrentlystudyinginscience,which you would like to interview your classmates about.
2 Choose questions that may allow you to link your classmates’ answers to general statements such as ‘people who take part in sport have lower pulse rates’ or ‘girls are more likely to try to conserve energy in the home compared with boys’. Your teacher may suggest some examples.
A
B
C
D
E
3 Now play the speed survey game, as organised by your teacher. Whilst interviewing your friends, write down all their answers, along with any other information that may be relevant (e.g. name, gender).
4 Whenyouhavefinished,lookatallyourresults.Doyouseeanypatterns?Writedownwhat you have found. If you haven’t found any patterns, what can you conclude? Is this an effect of your methods, or can you be sure there is no pattern?
5 Howwouldyoupresentyourfindings?Sketchyourresultsanddiscusswithanotherstudent in your class.
6 Discuss whether you should make generalisations for such small-scale surveys. Write down the reasons for your answer below.
1 of 1
Speed survey
Briefing sheet
SNAB Topic 1

26© 2008 Gatsby Technical Education Projects. This page may be copied solely for use in the purchaser’s school or college.

© 2008 Gatsby Technical Education Projects. This page may be copied solely for use in the purchaser’s school or college. © 2008 Gatsby Technical Education Projects. This page may be copied solely for use in the purchaser’s school or college.27
Learning from tables
Biology
In this activity, students examine a complex table of data and generate statements relating to the evidence.
OutcomesStudents will be able to:
extract information from numerical data, and •identify any patterns and trends
link conclusions with evidence from the data•
summarise knowledge acquired from data •arranged in a table
suggest how data can be processed to make it •easier to extract information.
Time requiredAllow 45 minutes.
Outline of the activityStudents work in pairs, analysing the data in the table.Theyhavefiveminutestoidentifyfivepieces of information revealed in the data and write these down as statements.
The pairs combine with another pair and each of the pairs assess whether the others’ statements are supported by evidence in the table. The group of fourthenchoosethefivebeststatementsfromtheten available, through discussion and negotiation.
Finally, each group’s statements are displayed and discussed with the rest of the class.
Tips and strategiesDescribe different strategies for identifying patterns and trends in data.
Discuss ways of representing the data graphically.
Discuss the use of statistical tools to help reduce the amount of data or to highlight trends.
1 of 1
SNAB Topic 1

28© 2008 Gatsby Technical Education Projects. This page may be copied solely for use in the purchaser’s school or college.

© 2008 Gatsby Technical Education Projects. This page may be copied solely for use in the purchaser’s school or college.29
© 2008 Gatsby Technical Education Projects. This page may be copied solely for use in the purchaser’s school or college.
Learning from tables
Biology briefing sheet
1Inpairs,studythetableofdatacarefully.Makealistoffivestatementsthataresupported by data in the table.
2 Join another pair of students. Decide whether their statements are supported by the evidence in the table. Then discuss your statements with them to let them assess whether your statements are supported by evidence.
3Reviewandevaluatethetenstatementsinyourgroupoffour.Selectfivestatements which you agree best summarise the data.
4 Decide how the data in the table could be processed to make it easier to identify trends and patterns.
5 Present your group’s statements and suggestions for data processing to the class.
6 Extension: you could carry out the data processing and explain how it allows trendsandpatternstobeidentified.
1 of 1
In this activity you will examine a complex table of data and generate statements relating to the evidence.
Body Mass Index (BMI, = mass/height2) by gender, 1993-2005
http://www.ic.nhs.uk/
SNAB Topic 1

30© 2008 Gatsby Technical Education Projects. This page may be copied solely for use in the purchaser’s school or college.

© 2008 Gatsby Technical Education Projects. This page may be copied solely for use in the purchaser’s school or college.31
© 2008 Gatsby Technical Education Projects. This page may be copied solely for use in the purchaser’s school or college.
Processing large data sets
Applied Science
Much research relies on collecting lots of data and then looking for trends in the data. In this activity students will have the chance to choose results within the large datasets to focus on, and find out if there are any links between the data.
OutcomesStudents will be able to:
study large volumes of data and look for patterns•
put forward hypotheses based on the raw data•
choose sections of relevant data from the large • volume to analyse and present it appropriately.
Time requiredAllow one hour lesson time plus homework.
Can also be an ICT lesson.
Outline of the activityGive all students a copy of the briefing sheet. They can choose which dataset they wish to work with, either ‘Fruit and Veg’ or ‘Smoking’. Each large dataset consists of questions asked in the survey, participant responses and compiled data. Whilst all instructions are given on the briefing sheet, students may need guidance on what they should be looking for, i.e. they should be encouraged to look at trends in the data and whether they want to investigate a particular relationship in greater detail. How would they go about doing this?
Tips and strategiesIf at all possible, students should be allowed to have the data as computer spreadsheets rather than printouts. This will allow them to convert spreadsheet data into graphs and tables easily if they wish to do so.
The data is provided separately as an Excel spreadsheet.
1 of 1
SNAB Topic 1

32© 2008 Gatsby Technical Education Projects. This page may be copied solely for use in the purchaser’s school or college.
© 2008 Gatsby Technical Education Projects. This page may be copied solely for use in the purchaser’s school or college.33
© 2008 Gatsby Technical Education Projects. This page may be copied solely for use in the purchaser’s school or college.
Processing large data sets
Briefing sheet
In this activity you will look for trends and analyse a large data set.
1 Choose a data set that you wish to study in detail: ‘Fruit and Veg’ or ‘Smoking’.
Which one have you chosen? _____________________
2 Have a look at all the data. Is there anything interesting within the data that you would like to investigate further?
3 What trends in the data do you wish to look at more closely? How are you going to do this? Use the space below to plan.
4 What is your hypothesis?
5 Now manipulate the data to test your hypothesis, and present the data in a visual (graph or chart) form on a separate sheet.
6 Share your data with a classmate who analysed the same data set. Did you choose the same results to focus on or not? Discuss what you have both discovered.
1 of 1
SNAB Topic 1

34© 2008 Gatsby Technical Education Projects. This page may be copied solely for use in the purchaser’s school or college.

© 2008 Gatsby Technical Education Projects. This page may be copied solely for use in the purchaser’s school or college.35
© 2008 Gatsby Technical Education Projects. This page may be copied solely for use in the purchaser’s school or college.
Interpreting graphs
Formulating questions relating to graphs encourages deep understanding of the data.
OutcomesStudents will be able to:
analyse and synthesise information presented in • graphs
interpret graphs to develop understanding and • knowledge.
Time requiredAllow 30 minutes.
Outline of the activityThis activity looks at more complex graphs and their interpretation. The activity asks students to formulate questions which could be answered by the graph, and then to answer questions produced by fellow students. This generates more active learning where the students analyse the data more closely. This is a useful activity which could be used as a starter / plenary for any lesson. Graphs from examination papers could be used.
Give each group of four students one type of graph. Each student should have his or her own copy. After looking carefully at the graph, each group splits up into pairs. Each pair has to write three questions which they think could be answered from the graph. After 5-10 minutes the question sheets are swapped. Each pair receives questions from the other pair in the group. The students answer the questions posed by the other pair, using information in the graph.
Groups then feed back to the rest of the class the questions answered, and what the group found out about the processes being investigated.
Tips and strategiesIt would be useful to demonstrate the data logging equipment and how it could be used to generate similar graphs.
This exercise could be used as an introduction to the teaching of a topic, or a means of summarising learning following a series of lessons on the topic.
1 of 1
SNAB Topic 1

36© 2008 Gatsby Technical Education Projects. This page may be copied solely for use in the purchaser’s school or college.

© 2008 Gatsby Technical Education Projects. This page may be copied solely for use in the purchaser’s school or college.37
© 2008 Gatsby Technical Education Projects. This page may be copied solely for use in the purchaser’s school or college.
Interpreting graphs
Briefing sheetIn this activity you will generate questions about a graph, and describe what the graph is showing.
1 In groups of four, spend a couple of minutes studying the graph you have been given.
2 Split into pairs. Devise three questions that could be answered using information from the graph.
Question related to patterns shown in the data:
Question that requires numerical calculation from the graph:
Question that asks students to identify and suggest explanations for an anomaly shown in the graph:
3 Swap your questions with the other pair in your group.
4 Answer the questions you have been given, using only information in the graph.
5 Check your answers with the other pair in your group.
6 Present your ideas about the graph to the class. Describe what the graph shows, your explanation for what is shown and how you think the data was collected. Suggest one further question about the topic which cannot be answered from the graph.
7 In your group, discuss how the process of generating questions affected the way you engaged with the graphs
1 of 1
SNAB Topic 1

38© 2008 Gatsby Technical Education Projects. This page may be copied solely for use in the purchaser’s school or college.

© 2008 Gatsby Technical Education Projects. This page may be copied solely for use in the purchaser’s school or college.39
© 2008 Gatsby Technical Education Projects. This page may be copied solely for use in the purchaser’s school or college.
Interpreting graphs
Resource
Effect of posture on heart rate in beats per minute (BPM)
Changing heart rate with posture:Sitting 0 – 110 secondsStanding 110 – 240 secondsLying down 240 – 360 seconds
Ventilation effect in a room
1 of 2
SNAB Topic 1

40© 2008 Gatsby Technical Education Projects. This page may be copied solely for use in the purchaser’s school or college.
Changes in breathing with posture
Interpreting graphs
Resource
2 of 2
SNAB Topic 1
© 2008 Gatsby Technical Education Projects. This page may be copied solely for use in the purchaser’s school or college.41
Preparing a scientific poster
Students create their own poster on the topic of cancer and risk factors. They will improve their ability to summarise information in a range of forms, and will think about how they can communicate scientific ideas using a poster as a cue.
OutcomesStudents will be able to:
summarise a significant topic in the form of a • poster
Time required15 minutes introduction + homework.
Outline of the activityExplain that scientific posters are used by scientists to communicate their work at conferences.
1 Start the activity by telling students that they will be required to produce a poster on the topic of CHD and risk factors.
2 Ask the students ‘What should be included in each section of the poster?’ to elicit their ideas about content. Note ideas on the board as part of a class discussion.
3 Use the slide presentation to run through the requirements of the activity.
4 Point out that the students will be presenting their poster to a reviewer (which will be one of their fellow students) as part of the subsequent activity ‘Evaluating a scientific poster’. This will require them to explain the contents of their poster verbally, and be prepared to answer any questions that are posed on the topic. Following this review students will have the opportunity to explain how they could improve their poster.
6 Run through the specification for the size/formatting and content of the poster, and set the deadline for submission.
SNAB Topic 1
1 of 1
Tips and strategiesA lot of work is involved in creating a poster, and you may decide that this type of activity lends itself to the development of team-working skills, in which case students could work in pairs or small groups. However, it should be within the capabilities of an A-level student to put together an appropriate poster.
Depending on the topic chosen, you may set the task at the end of the topic to help students consolidate their knowledge and understanding. However, if you are confident in the ability of your students, this activity could be set at the start of the topic as part of a ‘self-study’ approach.
You may wish to issue the criteria for assessment from activity ‘Evaluating scientific posters’ here. It is important that students are aware of the criteria for evaluation of their posters.

© 2008 Gatsby Technical Education Projects. This page may be copied solely for use in the purchaser’s school or college.
42

© 2008 Gatsby Technical Education Projects. This page may be copied solely for use in the purchaser’s school or college. © 2008 Gatsby Technical Education Projects. This page may be copied solely for use in the purchaser’s school or college.43
Preparing a scientific poster
Briefing sheet
1 of 1
SNAB Topic 1
Your task is to prepare a poster with the title (fill in as directed by your teacher):
............................................................................
The diagram below gives you guidelines about the content of the poster, but you have some freedom to choose your presentation style.
Unless your school or college has the facility to print A1 posters, which is unlikely, you will need to prepare the different sections as smaller pieces. These will need to be stuck onto some sort of backing card or paper.
In the next activity you will be asked to present your own poster, and evaluate others.
Layout of a scientific posterPoster formatSize: A1 (4 times the size of A3)Font style: ArialTitle: 84 point fontNames and institution: 36 point fontSub-headings: 54 point fontMain body text: 24 point fontImage captions: 16 point font

© 2008 Gatsby Technical Education Projects. This page may be copied solely for use in the purchaser’s school or college.
44
© 2008 Gatsby Technical Education Projects. This page may be copied solely for use in the purchaser’s school or college. © 2008 Gatsby Technical Education Projects. This page may be copied solely for use in the purchaser’s school or college.45
Evaluating scientific posters
Students work in pairs to assess their posters and discuss presenting it verbally. The students swap with another pair to carry out evaluation of the presentation. This is followed by a class discussion on the outcomes.
OutcomesStudents will be able to:
plan the presentation of a scientific poster and • anticipate the questions that may be asked on the topic
evaluate i) the quality of a scientific poster and • ii) the quality of the presentation of a scientific poster.
Time requiredAllow 45 to 60 minutes.
Outline of the activityWhen pairing the students up, assign them as student A and student B, as this will aid the smooth running of the activity.
1 Start the activity by suggesting that students use the criteria provided when they first evaluate a) the poster itself, and b) the presentation of the poster. Ask students to make any changes to the criteria that they wish for the second time around. (The evaluation sheet is available as a Word document for modification.)
2 Students work in pairs to complete Part 1 of the evaluation task as detailed on briefing sheet 1.This involves inspection of the posters themselves and the evaluation of the content / visual presentation.Students also discuss how they plan to present their poster to a reviewer, and they will be required to anticipate questions that they may be asked in this process (this is the same as thinking of questions that they would ask if they were a reviewer).
3 Get student B in each pair to swap with student B in another pair. Tell the students that student A in each pair will be presenting their poster to student B, with student B carrying out the evaluation. This is described in Part 2 on briefing sheet 2.
SNAB Topic 1
1 of 1
Tips and strategiesIf the students worked in pairs or groups to prepare their posters, rather than working on their own, you will need to manage the evaluation activities and discussions appropriately.
You could define the criteria that the students use to evaluate the posters / presentations in the class discussion at the start of the activity, rather than using those on the briefing sheet. Adapt the briefing sheet so students write in their own criteria and weightings.
If poster boards are available, this will aid the presentation of the posters. But the activity can still be carried out if the posters are laid on top of a table or desk.
4 Finish off the activity with a class discussion on best practice. This could be handled in various different ways, but one suggestion is as follows:
i Ask the reviewers (student B) to suggest examples of good practice they have seen in terms of the posters themselves, and the presentations they’ve reviewed.
ii Ask the presenters (student A) to give examples of things they would do to improve their poster and the presentation they gave. iii Agree any changes need to the evaluation criteria.

© 2008 Gatsby Technical Education Projects. This page may be copied solely for use in the purchaser’s school or college.
46

© 2008 Gatsby Technical Education Projects. This page may be copied solely for use in the purchaser’s school or college. © 2008 Gatsby Technical Education Projects. This page may be copied solely for use in the purchaser’s school or college.47
You are going to work in pairs / groups to evaluate your posters and present them to a reviewer.
Part 1 Looking at each others’ postersLook at each others’ posters and carry out the assessment using the criteria listed below. The criteria should be adapted to the topic being studied. Each category has a weighting. For instance, content is 35%, so you’ll need to award a mark out of 35 in that category. Later you will do a presentation.
Then discuss with your partner / group how you plan to present your poster orally. Try to anticipate questions that a reviewer might ask (or questions you would ask if you were a reviewer).
Criteria for assessment Weighting Mark
ContentThe introduction contains appropriate content, for example:i The discussion covers the structure of benzene, explaining the bonding present. Several reactions of benzene are described. Mechanisms are described where appropriate.ii The conclusion is a concise summary of the main points covered in the poster, and explains what makes benzene remarkable.A bibliography is included.
35 %
Structure and formattingThe poster has a clear beginning and end.The textual areas have clearly defined pieces of information.The poster has been created in the correct format.
15 %
Language and images
Language is clear, concise and easy to understand.Language is appropriate for the intended audience.No spelling or grammatical errors. The images enhance the text.The science contained in the images is correct (mechanisms, curly arrows, reaction schemes)
30 %
Amount of information
There is enough information to inform the audience of the topic and not too much to require lengthy reading.
10 %
General impression
The poster is visually attractive and well presented. Correct information is presented in an interesting and novel way.
10 %
Evaluating scientific posters
Briefing sheet 1
1 of 1
Total mark: _______ %
SNAB Topic 1

48© 2008 Gatsby Technical Education Projects. This page may be copied solely for use in the purchaser’s school or college.

© 2008 Gatsby Technical Education Projects. This page may be copied solely for use in the purchaser’s school or college. © 2008 Gatsby Technical Education Projects. This page may be copied solely for use in the purchaser’s school or college.
49
SNAB Topic 1
Taking notes from a presentation
Students will encounter presentations with increasingly demanding content. They need to refine their skills in summarising the material in a way that makes sense to them, and allows them to assimilate the key information. The aim is to embed good practice that students will use every time they listen to a presentation.
OutcomesStudents will be able to:
apply techniques for learning from oral • presentations
take notes and summarise information given in a • presentation
identify the theme(s) covered in a presentation.•
Time requiredPresentation length plus approximately 30 minutes.
Outline of the activityStudents’ experience of presentations depends on their teachers’ preferred teaching styles. Many teachers minimise teacher-led presentation in favour of maximising interactivity in their lessons. But the skills addressed in this activity are likely to be needed by students in the future, at university or at work. The presentation used for this activity is therefore rather formal in style, although this is not essential.
1 Ask the students ‘Why is note-taking important?’. Use the powerpoint slides overleaf to assist the discussion.
2 Get the students to discuss their approaches to note-taking with the whole class. One approach is outlined in the slides and on the briefing sheet.
3 At the end of the presentation and after students have completed their summaries, it is useful for them to evaluate their summaries. This could be done by self-assessment, using the evaluation sheet.
If you can scan in some (anonymous) examples of students’ notes you could discuss good (and not so good) practice with the whole group. Evaluating the summary should reinforce the content of the presentation for students.
Alternatively, students could work in pairs showing each other their notes from a presentation and commenting on each others’.
4 Students should be encouraged to carry out some follow-up work after taking notes from a presentation. Some tips on what can be done are given at the bottom of the evaluation sheet.
1 of 2
Tips and strategiesThis activity is intended to be repeated several times to allow the students to develop their skills. You may choose to do this informally, but do keep reminding the students of what they have learned so they do not slip out of good habits.
If you use the student evaluation sheets, save them to compare the outcomes with future occasions, to demonstrate progress (or otherwise).
Tell the students to record their questions (on the right of the page if they follow the approach suggested in the briefing sheet) during the presentation and to ask them at the end. The presenter may invite questions during the presentation, but this may disrupt the activity.

© 2008 Gatsby Technical Education Projects. This page may be copied solely for use in the purchaser’s school or college.
50
SNAB Topic 1
Taking notes from a presentation
More teacher guidance
Students will encounter presentation with increasingly demanding content. They need to refine their skills in summarising the material in a way that makes sense to them and allows them to assimilate the key information. The aim is to embed good practice that students will use every time they listen to a presentation.
In these activities students gain experience in summarising and documenting information transmitted orally through presentations, podcasts etc. The student is given a guided ‘prescription; on how to develop this ability.
Much has already been published on methods of summarising and ‘note taking’ during an oral presentation. These activities contribute in a practical way a technique for documenting information transmitted orally.
Students receive a guided outline on how to summarise the information in the presentation. Afterwards they are asked to think and to evaluate how they carried out the task.
Did the students succeed in concentrating and listening to the presentation?
How did they accomplish the task?
Many students do not have the skills of summarising information; and even in the course of routine lessons in the class the teacher often has to point out the main ideas of the lesson. Because of this, these activities should be repeated in different contexts, and in the course of ongoing teaching in the class.
These activities include forms for self-evaluation. The completed forms should be saved. The next time students listen to a presentation, the activity should be repeated so that the students can compare the marks they gave themselves each time. By doing this, both student and teacher can assess which sub-skills are difficult for the student and need additional support and whether there is improvement in others.
The self-evaluation form is a useful tool for the teacher to learn about students’ levels and capabilities in implementing the skill of summarising information.
2 of 2

© 2008 Gatsby Technical Education Projects. This page may be copied solely for use in the purchaser’s school or college. © 2008 Gatsby Technical Education Projects. This page may be copied solely for use in the purchaser’s school or college.
51
SNAB Topic 1
Taking notes from a presentation
Slides
1 of 2
© 2008 Gatsby Technical Education Projects. This page may be copied solely for use in the purchaser’s school or college.
52
SNAB Topic 1
Taking notes from a presentation
Slides
2 of 2

© 2008 Gatsby Technical Education Projects. This page may be copied solely for use in the purchaser’s school or college.
53© 2008 Gatsby Technical Education Projects. This page may be copied solely for use in the purchaser’s school or college.
SNAB Topic 1
Taking notes from a presentation
Briefing sheet
In this activity you will develop the skills for learning from presentations. You may already have ideas about how to learn effectively from presentations. These tips will help you to produce useful notes.
1 Before the presentation make sure you have the equipment you need (paper, pen etc.) and focus your mind on the task of identifying and summarising the key ideas.
2 At the top of the page, write the title of the presentation and the name of the presenter. It may also be useful to record the date and place (this will be more important at university or at work).
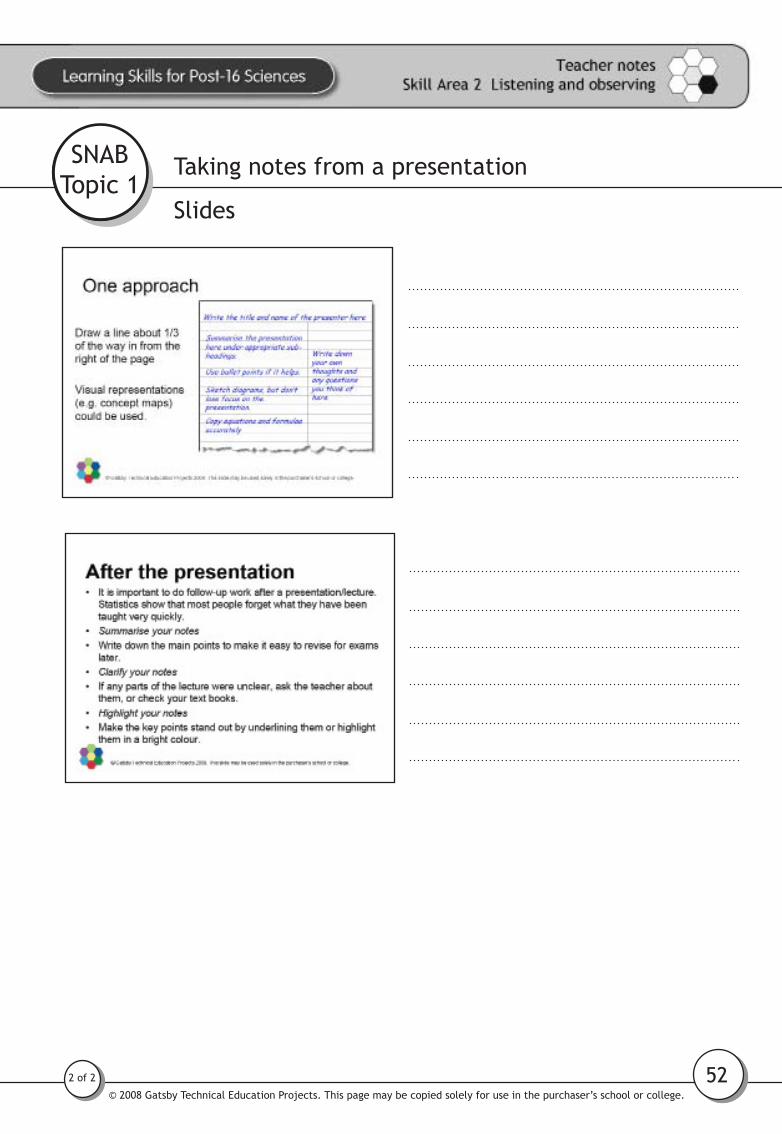
3 You should draw a line down the page about a third of the way in from the right. Write your notes of the presentation on the left. Write your own thoughts and any questions you think of on the right.
4 Don’t lose focus – write down quickly any thoughts or questions, so you don’t lose track of the presentation. You can take your thoughts forward and ask questions at the end.
5 As the presentation proceeds, try to break it down into sub-topics. The presenter may help you by indicating the different parts of the presentation. If they do not, you need to do this yourself. As you write your notes, keep the sub–topics in separate paragraphs.
6 You could use a visual representation (e.g. flow diagram, spider diagram, concept map or mind map) for each sub–topic. Or you can use written text if you prefer. Experiment with different formats; unfamiliar techniques need practice, but may be helpful in the long–term.
7 If time allows, write a sentence after each paragraph / sub–topic summarising the main message.
8 If you need to copy illustrations (e.g. pictures, images) you might find it best to sketch a representation rather than aiming to reproduce it faithfully. Obviously, it is important to copy chemical equations, calculations, graphs and diagrams accurately. Check if the presenter will give you access to notes or their slides; this may remove the need to copy visuals as you go along.
9 Write down the main ideas covered in the presentation at the end of your notes. This can form the basis of a summary.
10 Write down anything that you feel you need to learn more about, in addition to any questions you wrote down during the presentation.
1 of 1

54© 2008 Gatsby Technical Education Projects. This page may be copied solely for use in the purchaser’s school or college.

© 2008 Gatsby Technical Education Projects. This page may be copied solely for use in the purchaser’s school or college.
55© 2008 Gatsby Technical Education Projects. This page may be copied solely for use in the purchaser’s school or college.
Complete your summary, then evaluate the quality of your summary using this form.
Item Score (1-5)
I concentrated and listened throughout
I broke my summary down into sub-topics / paragraphs
I identified the key points and noted them
I summarised what was said in my own words
I used visual representations in my summary
I copied down any data or equations accurately in my summary
I made accurate sketches of diagrams in my summary
I made notes on my own thoughts / questions during the presentation
I wrote down the main ideas covered in the presentation at the end
I documented and summarised most of the information delivered in the presentation
Total score: _______
This second form can be used for a peer-assessment of your summary.
Item Score (1-5)
I concentrated and listened throughout
I broke my summary down into sub-topics / paragraphs
I identified the key points and noted them
I summarised what was said in my own words
I used visual representations in my summary
I copied down any data or equations accurately in my summary
I made accurate sketches of diagrams in my summary
I made notes on my own thoughts / questions during the presentation
I wrote down the main ideas covered in the presentation at the end
I documented and summarised most of the information delivered in the presentation
Total score: _______
Make a list of areas to improve next time you make notes from a presentation.
Taking notes from a presentation
Evaluation sheet
1 of 1
SNAB Topic 1