snacking - usdec.org site/c3-using dairy/c3.… · snacking. identifying a world of opportunities...
TRANSCRIPT
Snacking Identifying a World of Opportunities for Dairy
Dairy Management Inc. Prepared for the Innovation Center for U.S. Dairy April 2010
2
Table of Contents
Executive Summary ............................................................................................................... 4 Snack Category ...................................................................................................................... 4 Snack Market Structure ......................................................................................................... 4 Dairy Opportunity Areas in Snacking ................................................................................... 6 Snacking Market Overview .................................................................................................... 7 Figure 1. Dollar Sales of Snacks by Where Purchased ........................................................ 7 Figure 2. Food Share of Retail Snacking Dollars—Total Snacking ....................................... 8 Figure 3. Retail Snacking Categories & 5-Year CAGR ......................................................... 9 Figure 4. Restaurant Traffic Counts for Snack Occasions .................................................... 9 Figure 5. Spending at Restaurants on Snack Occasions .................................................... 10 Consumer Dynamics ........................................................................................................... 10 Who Is Snacking? ................................................................................................................ 10 Figure 6. Population Change & Projected Snack Eatings as the Generations Age ............. 11 Figure 7. Percent of Americans Attempting to Eat Mini Meals Throughout the Day ............ 11 When Do People Snack? ..................................................................................................... 12 Figure 8. In-Home Snacking Projections, 2008 & 2018 ...................................................... 12 What Are People Snacking On? .......................................................................................... 12 Figure 9. Percent of Foods Eaten as a Snack—Total In-home & Carried From Home ....... 12 Figure 10. Top Snack Food Categories .............................................................................. 13 Health & Snacking ............................................................................................................... 13 Figure 11. Percent of Americans Falling Short of Recommended Nutrients ....................... 14 Figure 12. Dairy-Based Snacks as a Percentage of Total Snacks ...................................... 15 Empty Snacking ................................................................................................................... 15 Figure 13. Contribution of Snacks to Total Daily Calories & Select Nutrient Intakes ........... 15 Cheese, Including Cheese in Prepared Foods ................................................................... 16 Figure 14. Contribution of Cheese, Including Cheese in Prepared Foods, to Snacking Nutrition ............................................................................................................. 16 Milk, Including Milk in Prepared Foods .............................................................................. 16 Figure 15. Contribution of Milk, Including Milk in Prepared Foods, to Snacking Nutrition .... 17 Market Structure .................................................................................................................. 17 Why a Snacking Market Structure? .................................................................................... 17 Figure 16. Understanding Consumer Choices .................................................................... 18 Figure 17. 360o Consumer View ......................................................................................... 18 Snacking Market Structure .................................................................................................. 19 Figure 18. Consumer Need States ..................................................................................... 19 Figure 19.World of Snacking—Market Structure ................................................................ 20 Dairy Within the Market Structure ....................................................................................... 21 Understanding the Market Structure .................................................................................. 22 Figure 20. Market Structure Level 1—Nutritious & Fun Munching ...................................... 22 Figure 21. Market Structure Level 2—Mealtime Nutrition & Healthy Snacks ...................... 22 Figure 22. Market Structure Level 3—Morning Energy & Tasty PM Meals ......................... 23 Figure 23. Market Structure Level 3 – Substantial Crunch & Naturally Nutritious ............... 24 Figure 24. Market Structure Level 2—Salty & Sweet .......................................................... 25 Figure 25. Market Structure Level 3—Late-Day Crunch & Multitasking Munch ................... 26 Figure 26. Market Structure Level 3—Cool Evening Treat & Sweet Bites ........................... 27 Opportunities for Dairy Industry to Explore Further ......................................................... 27 Figure 27. Dairy Opportunity Areas on Nutritious Side of Snack Structure ......................... 28 Figure 28. Dairy Opportunity Areas on Fun Munching Side of Snack Structure .................. 28
3
Sizing the Opportunity Areas .............................................................................................. 29 Figure 29. U.S. Snack Market by Volume of Occasion ....................................................... 29 Conclusion ........................................................................................................................... 30 Appendix .............................................................................................................................. 31 A Closer Look At Cheese As a Snack................................................................................. 31 Figure 30. Average Number of Snacks per Day by Attitude Toward Cheese ...................... 31 Figure 31. Time of Day Cheese Snack Foods Eaten .......................................................... 31 Figure 32. Proportion of Snack Foods Eaten Away From Home......................................... 32 Figure 33. Characteristics of Snacks Eaten Out of Home ................................................... 32 Figure 34. Health Perceptions of Snack Categories ........................................................... 33 Kids & Snacking ................................................................................................................... 33 What Kids Snack On ............................................................................................................ 33 Figure 35. Kids Choices for Snacks by Annual Eatings per Capita ..................................... 34 Kids’ Needs While Snacking ............................................................................................... 34 Figure 36. Kids’ Activities During Snacking ........................................................................ 34 Mom’s Needs for Kids’ Snacking ........................................................................................ 35 Figure 37. Mom Satisfaction With Food Child Eats at Occasion ......................................... 35 Figure 38. Importance of Product Attributes & Snacks’ Ability to Deliver Attributes According to Mom .............................................................................................. 35 Figure 39. Evolving Food Desires & Concerns According to Parents ................................. 35 Figure 40. Percent of Parents Agreeing Which Attributes Are Ideal for Foods .................... 36 Figure 41. Adult & Child Influences on Food Choices ......................................................... 37 Conclusion ........................................................................................................................... 37 Hispanics .............................................................................................................................. 38 Hispanics & the Snacking Market Structure ...................................................................... 38 Hispanic Kids & Snacking ................................................................................................... 39
4
Executive Summary Through the direction given by farmers, and on behalf of the dairy industry, Dairy Management Inc. (DMI) invested significant resources over the last 18 months to better understand the current position of dairy in the snack occasion and what the potential incremental volume could be if dairy became a greater force in this growing eating occasion. This white paper will identify opportunities for dairy within the snacking occasion utilizing snack category and consumer insights, as well as take an in-depth look at a proprietary market structure for the snacking world that will provide a roadmap for opportunities in the next 3-5 years. The opportunities will be prioritized based on dairy’s strengths and weaknesses. In addition, the paper will also present directional volume data quantifying incremental volume opportunities that dairy can enjoy by expanding its presence in the snack occasion across several market segments. This paper should serve as a starting point for manufacturers and processers to further explore snack opportunities utilizing their own consumer research and product development. Then, by working together, the industry can solidify dairy’s place in the snack occasion, and incremental volume will be realized. Snack Category Sales of foods eaten during a snack occasion are estimated to be over $90 billion. This staggering number, coupled with the fact that sales are projected to increase, makes the snack occasion an attractive strategic focus area for many food manufacturers. The idea that “anything goes” as a snack and the availability of multiple options for sourcing (homemade, retail, school, foodservice, etc.) make snacking options virtually limitless for consumers. DMI believes that the state of the market and the findings from the strategic consumer research commissioned by DMI point to some very real snack opportunity areas for dairy and dairy-ingredient-based snack innovations. Snack Market Structure The structure outlined later in this white paper shows that the market can be subdivided into two main categories—Nutritious and Fun Munching. The majority of dairy and dairy-ingredient-based innovations naturally align with the Nutritious side of the snack market. As consumers’ health and wellness needs evolve, snacking becomes a legitimate strategy to address those needs, and dairy is well positioned to take advantage of them. However, the opportunity on the fun side of the snacking world should not be ignored. One very large area within the Fun Munching side is Sweet Bites, which can be well aligned with dairy-based products if the products deliver on the key lever points that characterize this area, or domain.
5
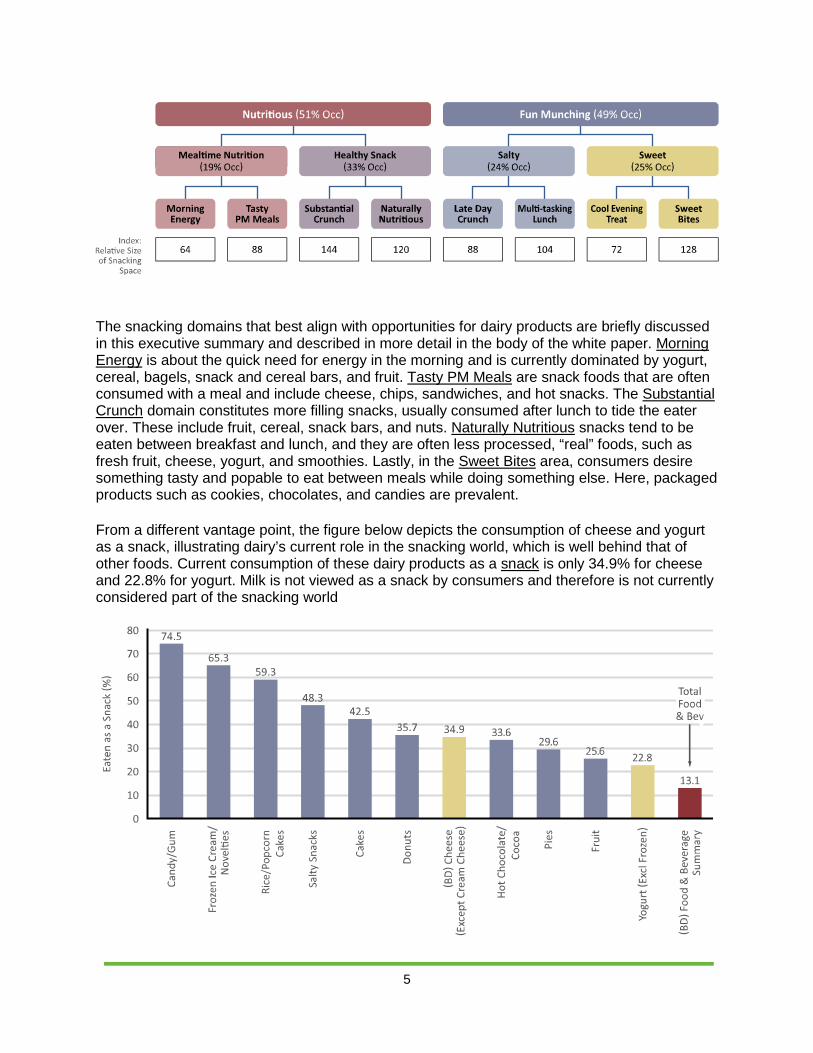
The snacking domains that best align with opportunities for dairy products are briefly discussed in this executive summary and described in more detail in the body of the white paper. Morning Energy is about the quick need for energy in the morning and is currently dominated by yogurt, cereal, bagels, snack and cereal bars, and fruit. Tasty PM Meals are snack foods that are often consumed with a meal and include cheese, chips, sandwiches, and hot snacks. The Substantial Crunch domain constitutes more filling snacks, usually consumed after lunch to tide the eater over. These include fruit, cereal, snack bars, and nuts. Naturally Nutritious snacks tend to be eaten between breakfast and lunch, and they are often less processed, “real” foods, such as fresh fruit, cheese, yogurt, and smoothies. Lastly, in the Sweet Bites area, consumers desire something tasty and popable to eat between meals while doing something else. Here, packaged products such as cookies, chocolates, and candies are prevalent. From a different vantage point, the figure below depicts the consumption of cheese and yogurt as a snack, illustrating dairy’s current role in the snacking world, which is well behind that of other foods. Current consumption of these dairy products as a snack is only 34.9% for cheese and 22.8% for yogurt. Milk is not viewed as a snack by consumers and therefore is not currently considered part of the snacking world
6
Yogurt and cheese can also be examined within all domains of the snacking market structure. Cheese—either alone or as an ingredient—is ubiquitous across most snacking domains, and it can play in both the Nutritious and the Fun Munching sides of the snacking world. Yogurt innovations should focus most on the healthier side, especially in the underdeveloped Morning Energy area. However, as a component, yogurt could potentially marry healthfulness with indulgence and succeed in the Sweet space. Dairy Opportunity Areas in Snacking The high-priority opportunity areas for dairy and dairy-ingredient innovations are based on the relative size of the domain and on dairy’s ability to capitalize upon consumer needs and/or the underdevelopment of current dairy products in the market. The innovations that the industry chooses to pursue to address these consumer needs may range from messaging to repositioning or repackaging existing products to more breakout product development innovations. The main opportunities lie within the following domains:
• Morning Energy • Tasty PM Meals • Substantial Crunch • Naturally Nutritious • Sweet Bites
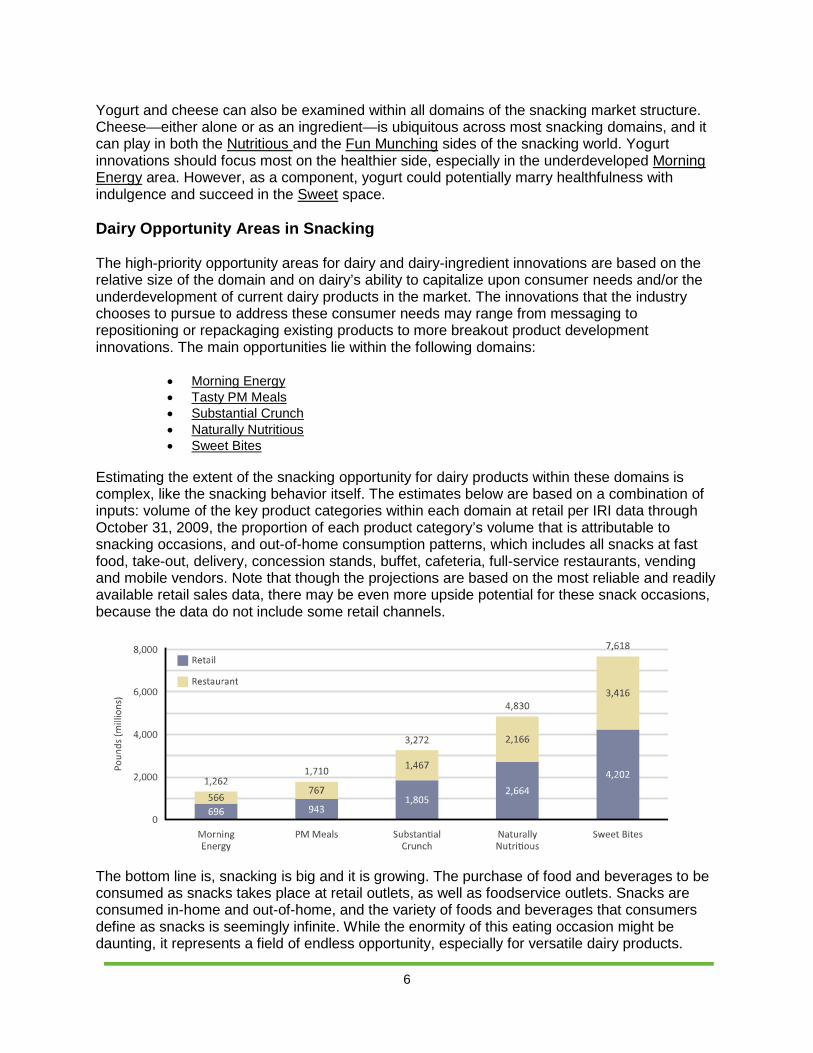
Estimating the extent of the snacking opportunity for dairy products within these domains is complex, like the snacking behavior itself. The estimates below are based on a combination of inputs: volume of the key product categories within each domain at retail per IRI data through October 31, 2009, the proportion of each product category’s volume that is attributable to snacking occasions, and out-of-home consumption patterns, which includes all snacks at fast food, take-out, delivery, concession stands, buffet, cafeteria, full-service restaurants, vending and mobile vendors. Note that though the projections are based on the most reliable and readily available retail sales data, there may be even more upside potential for these snack occasions, because the data do not include some retail channels.
The bottom line is, snacking is big and it is growing. The purchase of food and beverages to be consumed as snacks takes place at retail outlets, as well as foodservice outlets. Snacks are consumed in-home and out-of-home, and the variety of foods and beverages that consumers define as snacks is seemingly infinite. While the enormity of this eating occasion might be daunting, it represents a field of endless opportunity, especially for versatile dairy products.
7
Snacking Market Overview Snacking is a complex and multidimensional behavior. Trying to define snack foods is a challenge, because what might be a snack to one individual could be considered a meal by another. Snacks include foods traditionally thought of as such, but also any foods or beverages that consumers define as snacks. Given this definition, snacks can be consumed as part of a meal, instead of a meal, or between meals, either in-home or out-of home. The lines between snacking and meals are blurring as the concept of eating several, small mini meals throughout the day becomes more commonplace. Consumers spent over $93.5 billion on snacks in 20091
. This figure represents retail sales of UPC-coded foods that are considered to be snack foods in proportion to how often they are consumed as snacks, according to NPD’s National Eating Trends® (NET®) data and estimates of foodservice spending. These categories of snack foods, which will be covered in more detail later, can be consumed both at home and away from home.
Seventy-eight percent of snacks are consumed at home, with nearly one-fourth of snacks consumed outside the home regardless of where they were purchased2
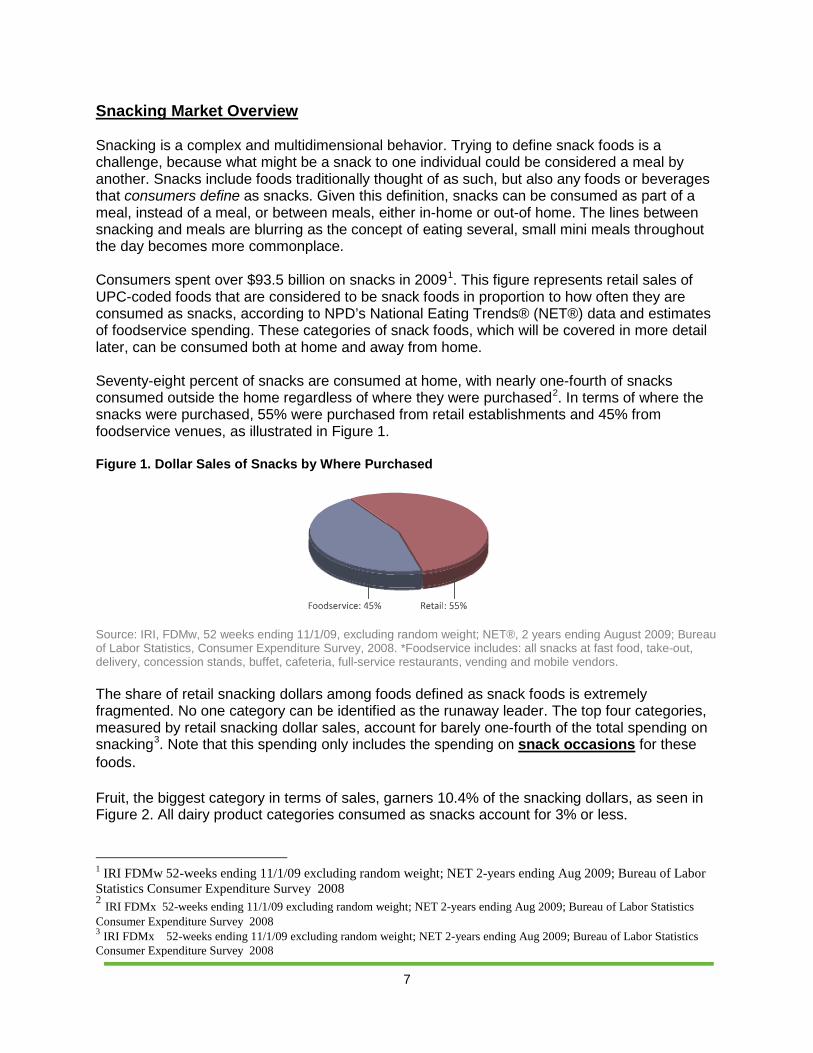
. In terms of where the snacks were purchased, 55% were purchased from retail establishments and 45% from foodservice venues, as illustrated in Figure 1.
Figure 1. Dollar Sales of Snacks by Where Purchased Source: IRI, FDMw, 52 weeks ending 11/1/09, excluding random weight; NET®, 2 years ending August 2009; Bureau of Labor Statistics, Consumer Expenditure Survey, 2008. *Foodservice includes: all snacks at fast food, take-out, delivery, concession stands, buffet, cafeteria, full-service restaurants, vending and mobile vendors. The share of retail snacking dollars among foods defined as snack foods is extremely fragmented. No one category can be identified as the runaway leader. The top four categories, measured by retail snacking dollar sales, account for barely one-fourth of the total spending on snacking3
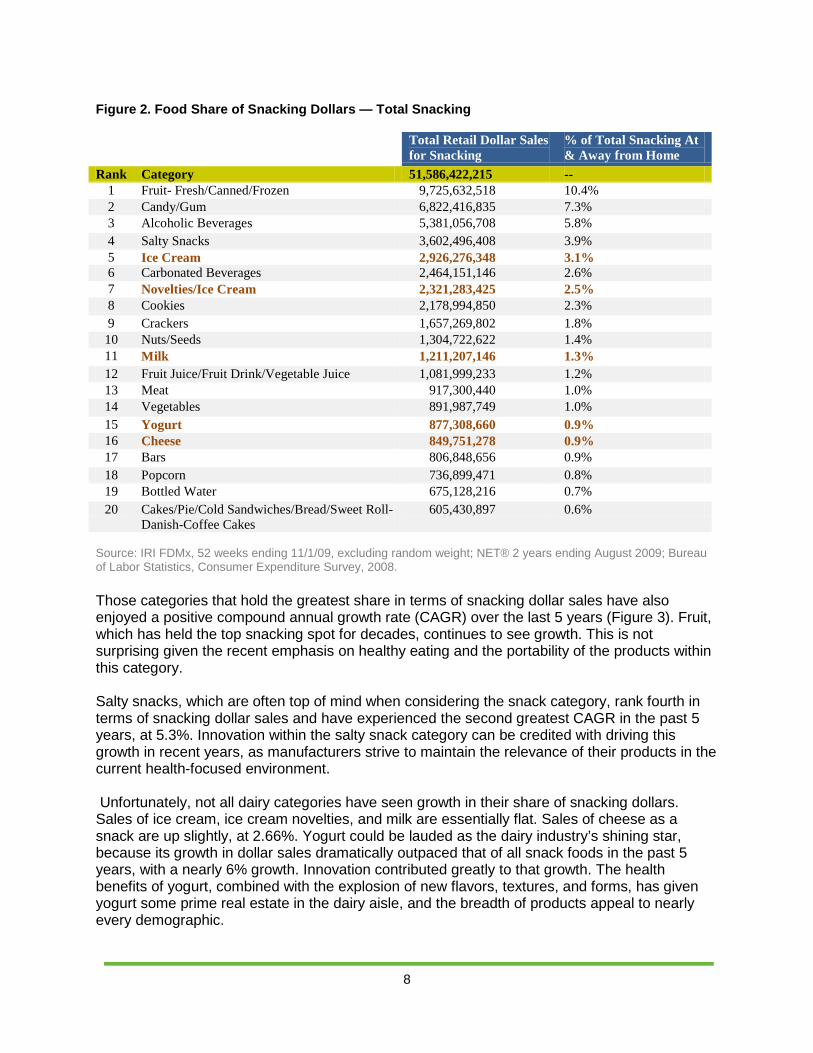
Fruit, the biggest category in terms of sales, garners 10.4% of the snacking dollars, as seen in Figure 2. All dairy product categories consumed as snacks account for 3% or less.
. Note that this spending only includes the spending on snack occasions for these foods.
1 IRI FDMw 52-weeks ending 11/1/09 excluding random weight; NET 2-years ending Aug 2009; Bureau of Labor Statistics Consumer Expenditure Survey 2008 2 IRI FDMx 52-weeks ending 11/1/09 excluding random weight; NET 2-years ending Aug 2009; Bureau of Labor Statistics Consumer Expenditure Survey 2008 3 IRI FDMx 52-weeks ending 11/1/09 excluding random weight; NET 2-years ending Aug 2009; Bureau of Labor Statistics Consumer Expenditure Survey 2008
8
Figure 2. Food Share of Snacking Dollars — Total Snacking Total Retail Dollar Sales
for Snacking % of Total Snacking At & Away from Home
Rank Category 51,586,422,215 -- 1 Fruit- Fresh/Canned/Frozen 9,725,632,518 10.4% 2 Candy/Gum 6,822,416,835 7.3% 3 Alcoholic Beverages 5,381,056,708 5.8% 4 Salty Snacks 3,602,496,408 3.9% 5 Ice Cream 2,926,276,348 3.1% 6 Carbonated Beverages 2,464,151,146 2.6% 7 Novelties/Ice Cream 2,321,283,425 2.5% 8 Cookies 2,178,994,850 2.3% 9 Crackers 1,657,269,802 1.8% 10 Nuts/Seeds 1,304,722,622 1.4% 11 Milk 1,211,207,146 1.3% 12 Fruit Juice/Fruit Drink/Vegetable Juice 1,081,999,233 1.2% 13 Meat 917,300,440 1.0% 14 Vegetables 891,987,749 1.0% 15 Yogurt 877,308,660 0.9% 16 Cheese 849,751,278 0.9% 17 Bars 806,848,656 0.9% 18 Popcorn 736,899,471 0.8% 19 Bottled Water 675,128,216 0.7% 20 Cakes/Pie/Cold Sandwiches/Bread/Sweet Roll-
Danish-Coffee Cakes 605,430,897 0.6%
Source: IRI FDMx, 52 weeks ending 11/1/09, excluding random weight; NET® 2 years ending August 2009; Bureau of Labor Statistics, Consumer Expenditure Survey, 2008. Those categories that hold the greatest share in terms of snacking dollar sales have also enjoyed a positive compound annual growth rate (CAGR) over the last 5 years (Figure 3). Fruit, which has held the top snacking spot for decades, continues to see growth. This is not surprising given the recent emphasis on healthy eating and the portability of the products within this category. Salty snacks, which are often top of mind when considering the snack category, rank fourth in terms of snacking dollar sales and have experienced the second greatest CAGR in the past 5 years, at 5.3%. Innovation within the salty snack category can be credited with driving this growth in recent years, as manufacturers strive to maintain the relevance of their products in the current health-focused environment.
Unfortunately, not all dairy categories have seen growth in their share of snacking dollars. Sales of ice cream, ice cream novelties, and milk are essentially flat. Sales of cheese as a snack are up slightly, at 2.66%. Yogurt could be lauded as the dairy industry’s shining star, because its growth in dollar sales dramatically outpaced that of all snack foods in the past 5 years, with a nearly 6% growth. Innovation contributed greatly to that growth. The health benefits of yogurt, combined with the explosion of new flavors, textures, and forms, has given yogurt some prime real estate in the dairy aisle, and the breadth of products appeal to nearly every demographic.
9
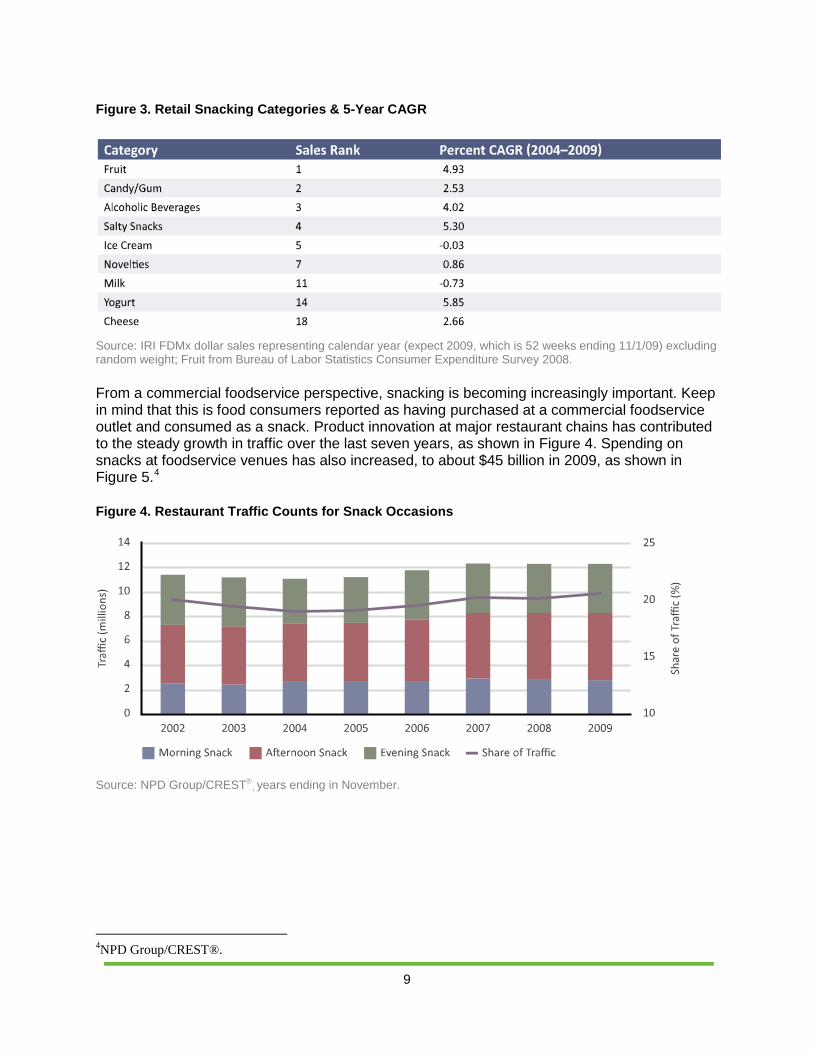
Figure 3. Retail Snacking Categories & 5-Year CAGR
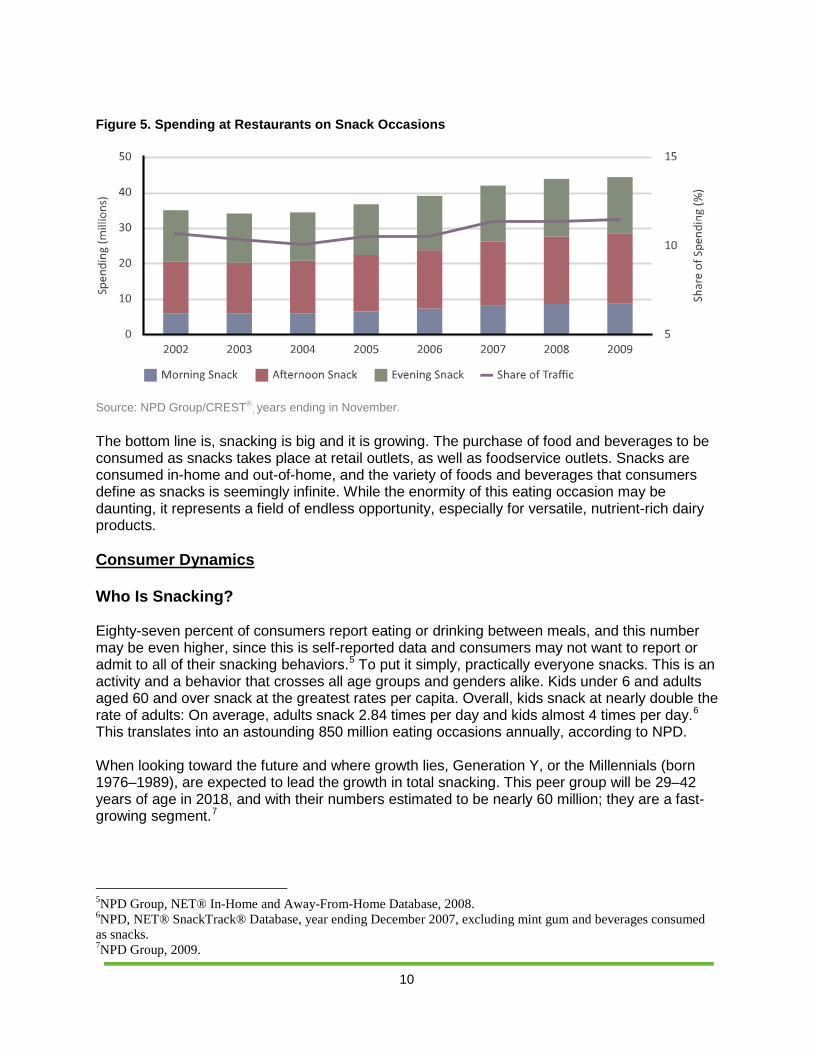
Source: IRI FDMx dollar sales representing calendar year (expect 2009, which is 52 weeks ending 11/1/09) excluding random weight; Fruit from Bureau of Labor Statistics Consumer Expenditure Survey 2008. From a commercial foodservice perspective, snacking is becoming increasingly important. Keep in mind that this is food consumers reported as having purchased at a commercial foodservice outlet and consumed as a snack. Product innovation at major restaurant chains has contributed to the steady growth in traffic over the last seven years, as shown in Figure 4. Spending on snacks at foodservice venues has also increased, to about $45 billion in 2009, as shown in Figure 5.4
Figure 4. Restaurant Traffic Counts for Snack Occasions
Source: NPD Group/CREST
, years ending in November.
4NPD Group/CREST®.
10
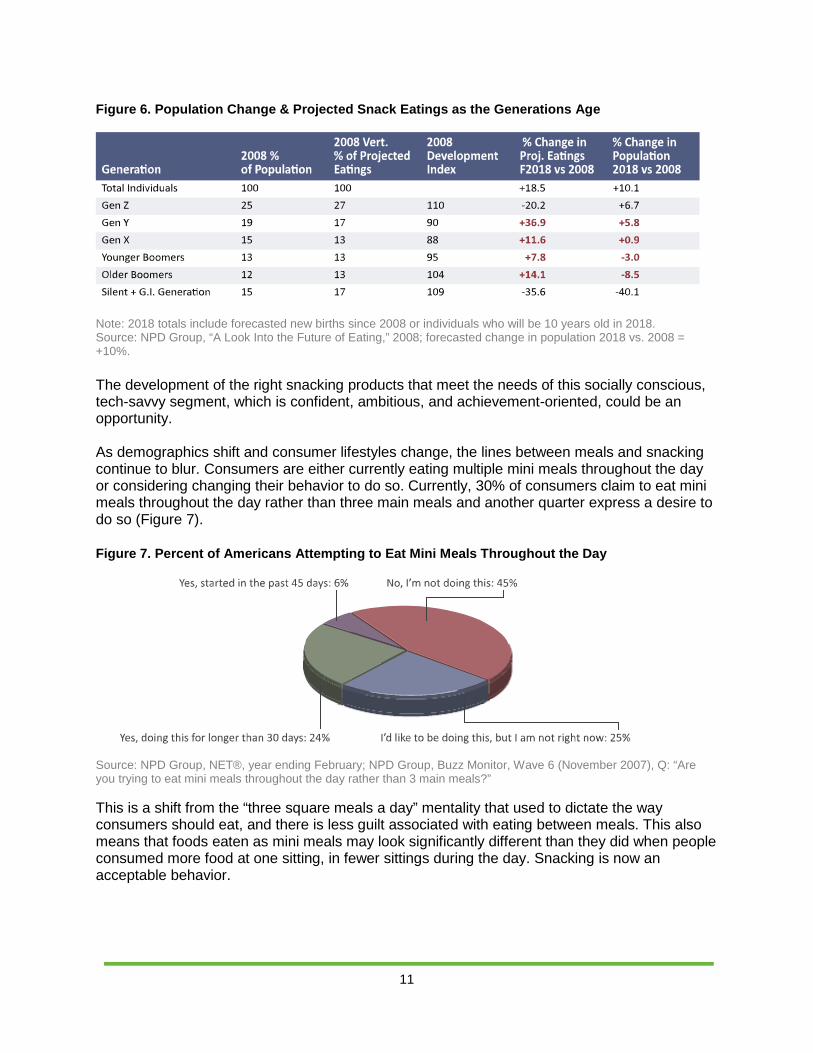
Figure 5. Spending at Restaurants on Snack Occasions
Source: NPD Group/CREST
, years ending in November.
The bottom line is, snacking is big and it is growing. The purchase of food and beverages to be consumed as snacks takes place at retail outlets, as well as foodservice outlets. Snacks are consumed in-home and out-of-home, and the variety of foods and beverages that consumers define as snacks is seemingly infinite. While the enormity of this eating occasion may be daunting, it represents a field of endless opportunity, especially for versatile, nutrient-rich dairy products. Consumer Dynamics Who Is Snacking? Eighty-seven percent of consumers report eating or drinking between meals, and this number may be even higher, since this is self-reported data and consumers may not want to report or admit to all of their snacking behaviors.5 To put it simply, practically everyone snacks. This is an activity and a behavior that crosses all age groups and genders alike. Kids under 6 and adults aged 60 and over snack at the greatest rates per capita. Overall, kids snack at nearly double the rate of adults: On average, adults snack 2.84 times per day and kids almost 4 times per day.6
This translates into an astounding 850 million eating occasions annually, according to NPD.
When looking toward the future and where growth lies, Generation Y, or the Millennials (born 1976–1989), are expected to lead the growth in total snacking. This peer group will be 29–42 years of age in 2018, and with their numbers estimated to be nearly 60 million; they are a fast-growing segment.7
5NPD Group, NET® In-Home and Away-From-Home Database, 2008. 6NPD, NET® SnackTrack® Database, year ending December 2007, excluding mint gum and beverages consumed as snacks. 7NPD Group, 2009.
11
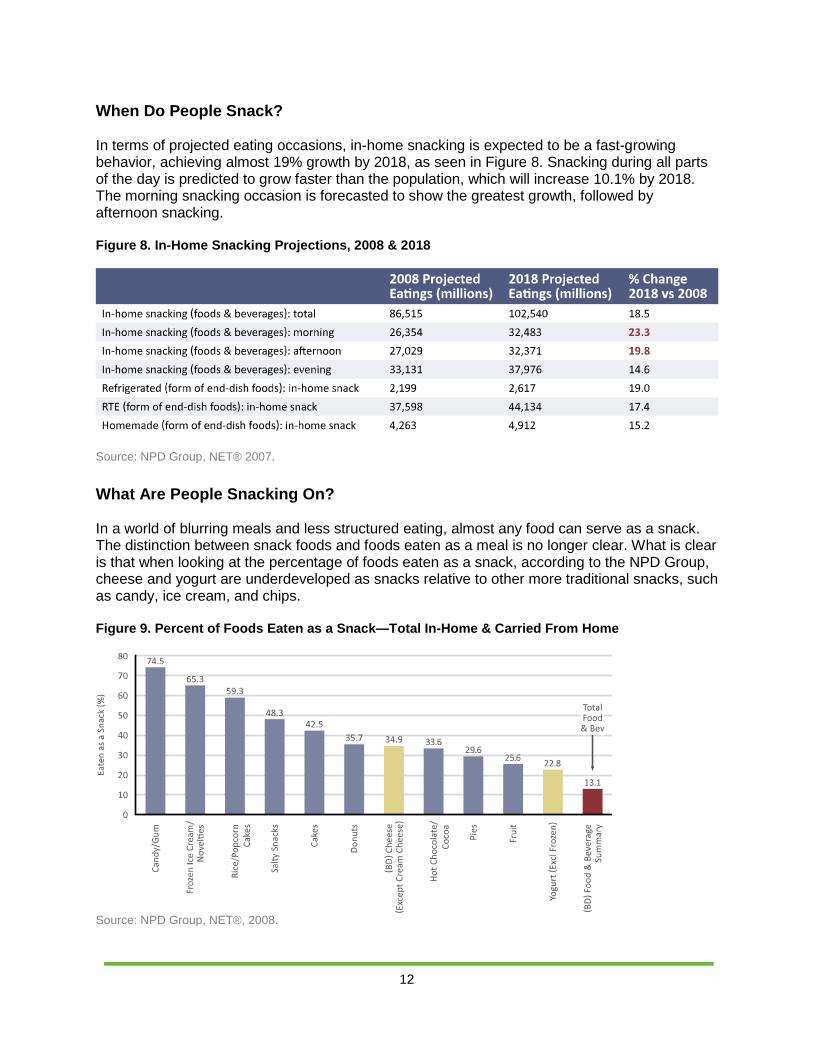
Figure 6. Population Change & Projected Snack Eatings as the Generations Age
Note: 2018 totals include forecasted new births since 2008 or individuals who will be 10 years old in 2018. Source: NPD Group, “A Look Into the Future of Eating,” 2008; forecasted change in population 2018 vs. 2008 = +10%. The development of the right snacking products that meet the needs of this socially conscious, tech-savvy segment, which is confident, ambitious, and achievement-oriented, could be an opportunity. As demographics shift and consumer lifestyles change, the lines between meals and snacking continue to blur. Consumers are either currently eating multiple mini meals throughout the day or considering changing their behavior to do so. Currently, 30% of consumers claim to eat mini meals throughout the day rather than three main meals and another quarter express a desire to do so (Figure 7). Figure 7. Percent of Americans Attempting to Eat Mini Meals Throughout the Day
Source: NPD Group, NET®, year ending February; NPD Group, Buzz Monitor, Wave 6 (November 2007), Q: “Are you trying to eat mini meals throughout the day rather than 3 main meals?” This is a shift from the “three square meals a day” mentality that used to dictate the way consumers should eat, and there is less guilt associated with eating between meals. This also means that foods eaten as mini meals may look significantly different than they did when people consumed more food at one sitting, in fewer sittings during the day. Snacking is now an acceptable behavior.
12
When Do People Snack? In terms of projected eating occasions, in-home snacking is expected to be a fast-growing behavior, achieving almost 19% growth by 2018, as seen in Figure 8. Snacking during all parts of the day is predicted to grow faster than the population, which will increase 10.1% by 2018. The morning snacking occasion is forecasted to show the greatest growth, followed by afternoon snacking. Figure 8. In-Home Snacking Projections, 2008 & 2018
Source: NPD Group, NET® 2007. What Are People Snacking On? In a world of blurring meals and less structured eating, almost any food can serve as a snack. The distinction between snack foods and foods eaten as a meal is no longer clear. What is clear is that when looking at the percentage of foods eaten as a snack, according to the NPD Group, cheese and yogurt are underdeveloped as snacks relative to other more traditional snacks, such as candy, ice cream, and chips. Figure 9. Percent of Foods Eaten as a Snack—Total In-Home & Carried From Home
Source: NPD Group, NET®, 2008.
13
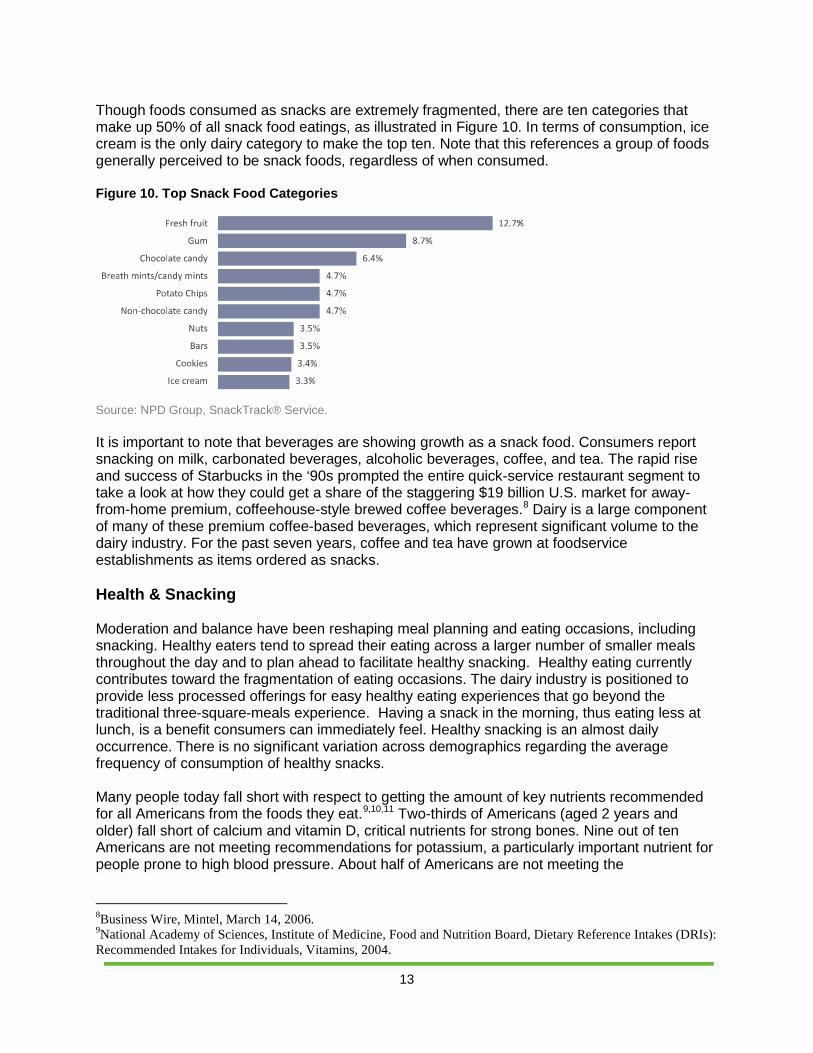
Though foods consumed as snacks are extremely fragmented, there are ten categories that make up 50% of all snack food eatings, as illustrated in Figure 10. In terms of consumption, ice cream is the only dairy category to make the top ten. Note that this references a group of foods generally perceived to be snack foods, regardless of when consumed. Figure 10. Top Snack Food Categories
Source: NPD Group, SnackTrack® Service. It is important to note that beverages are showing growth as a snack food. Consumers report snacking on milk, carbonated beverages, alcoholic beverages, coffee, and tea. The rapid rise and success of Starbucks in the ‘90s prompted the entire quick-service restaurant segment to take a look at how they could get a share of the staggering $19 billion U.S. market for away-from-home premium, coffeehouse-style brewed coffee beverages.8
Dairy is a large component of many of these premium coffee-based beverages, which represent significant volume to the dairy industry. For the past seven years, coffee and tea have grown at foodservice establishments as items ordered as snacks.
Health & Snacking Moderation and balance have been reshaping meal planning and eating occasions, including snacking. Healthy eaters tend to spread their eating across a larger number of smaller meals throughout the day and to plan ahead to facilitate healthy snacking. Healthy eating currently contributes toward the fragmentation of eating occasions. The dairy industry is positioned to provide less processed offerings for easy healthy eating experiences that go beyond the traditional three-square-meals experience. Having a snack in the morning, thus eating less at lunch, is a benefit consumers can immediately feel. Healthy snacking is an almost daily occurrence. There is no significant variation across demographics regarding the average frequency of consumption of healthy snacks. Many people today fall short with respect to getting the amount of key nutrients recommended for all Americans from the foods they eat.9
8Business Wire, Mintel, March 14, 2006.
,10,11 Two-thirds of Americans (aged 2 years and older) fall short of calcium and vitamin D, critical nutrients for strong bones. Nine out of ten Americans are not meeting recommendations for potassium, a particularly important nutrient for people prone to high blood pressure. About half of Americans are not meeting the
9National Academy of Sciences, Institute of Medicine, Food and Nutrition Board, Dietary Reference Intakes (DRIs): Recommended Intakes for Individuals, Vitamins, 2004.
14
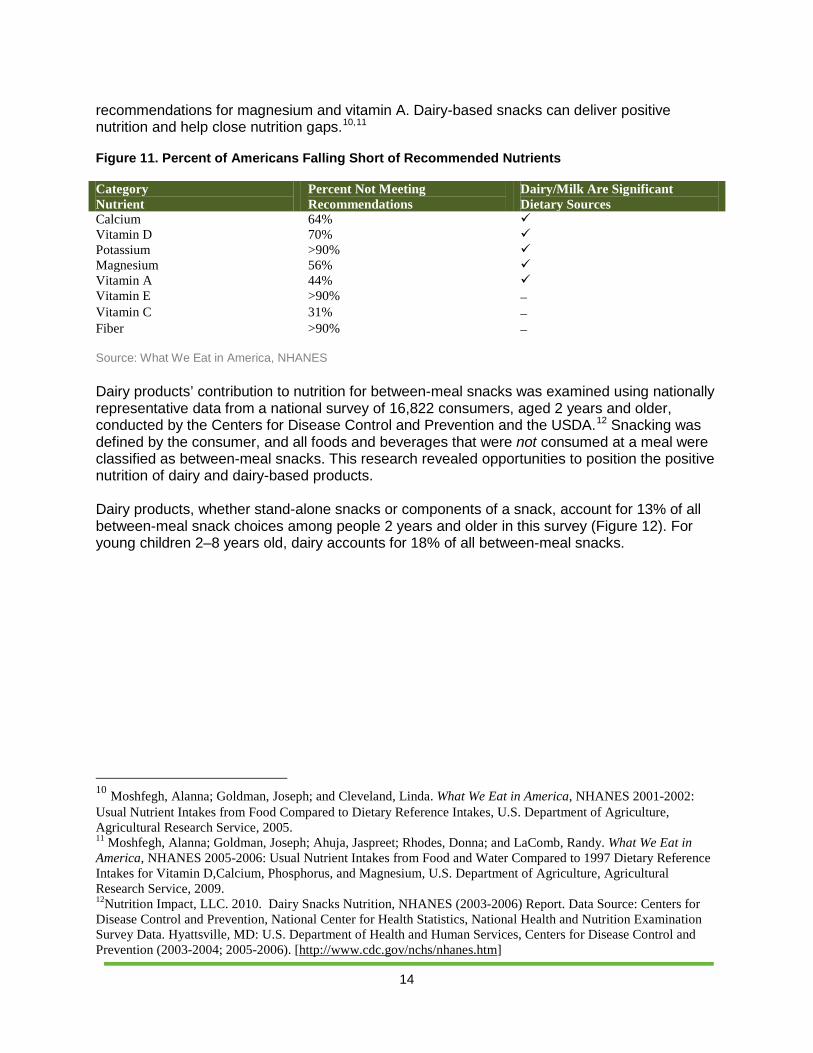
recommendations for magnesium and vitamin A. Dairy-based snacks can deliver positive nutrition and help close nutrition gaps.10,11
Figure 11. Percent of Americans Falling Short of Recommended Nutrients
Category Nutrient
Percent Not Meeting Recommendations
Dairy/Milk Are Significant Dietary Sources
Calcium 64% Vitamin D 70% Potassium >90% Magnesium 56% Vitamin A 44% Vitamin E >90% − Vitamin C 31% − Fiber >90% − Source: What We Eat in America, NHANES Dairy products’ contribution to nutrition for between-meal snacks was examined using nationally representative data from a national survey of 16,822 consumers, aged 2 years and older, conducted by the Centers for Disease Control and Prevention and the USDA.12
Snacking was defined by the consumer, and all foods and beverages that were not consumed at a meal were classified as between-meal snacks. This research revealed opportunities to position the positive nutrition of dairy and dairy-based products.
Dairy products, whether stand-alone snacks or components of a snack, account for 13% of all between-meal snack choices among people 2 years and older in this survey (Figure 12). For young children 2–8 years old, dairy accounts for 18% of all between-meal snacks. 10 Moshfegh, Alanna; Goldman, Joseph; and Cleveland, Linda. What We Eat in America, NHANES 2001-2002: Usual Nutrient Intakes from Food Compared to Dietary Reference Intakes, U.S. Department of Agriculture, Agricultural Research Service, 2005. 11 Moshfegh, Alanna; Goldman, Joseph; Ahuja, Jaspreet; Rhodes, Donna; and LaComb, Randy. What We Eat in America, NHANES 2005-2006: Usual Nutrient Intakes from Food and Water Compared to 1997 Dietary Reference Intakes for Vitamin D,Calcium, Phosphorus, and Magnesium, U.S. Department of Agriculture, Agricultural Research Service, 2009. 12Nutrition Impact, LLC. 2010. Dairy Snacks Nutrition, NHANES (2003-2006) Report. Data Source: Centers for Disease Control and Prevention, National Center for Health Statistics, National Health and Nutrition Examination Survey Data. Hyattsville, MD: U.S. Department of Health and Human Services, Centers for Disease Control and Prevention (2003-2004; 2005-2006). [http://www.cdc.gov/nchs/nhanes.htm]
15
Figure 12. Dairy-Based Snacks as a Percentage of Total Snacks
Source: Nutrition Impact, LLC. 2010. Dairy Snacks Nutrition, NHANES (2003-2006)
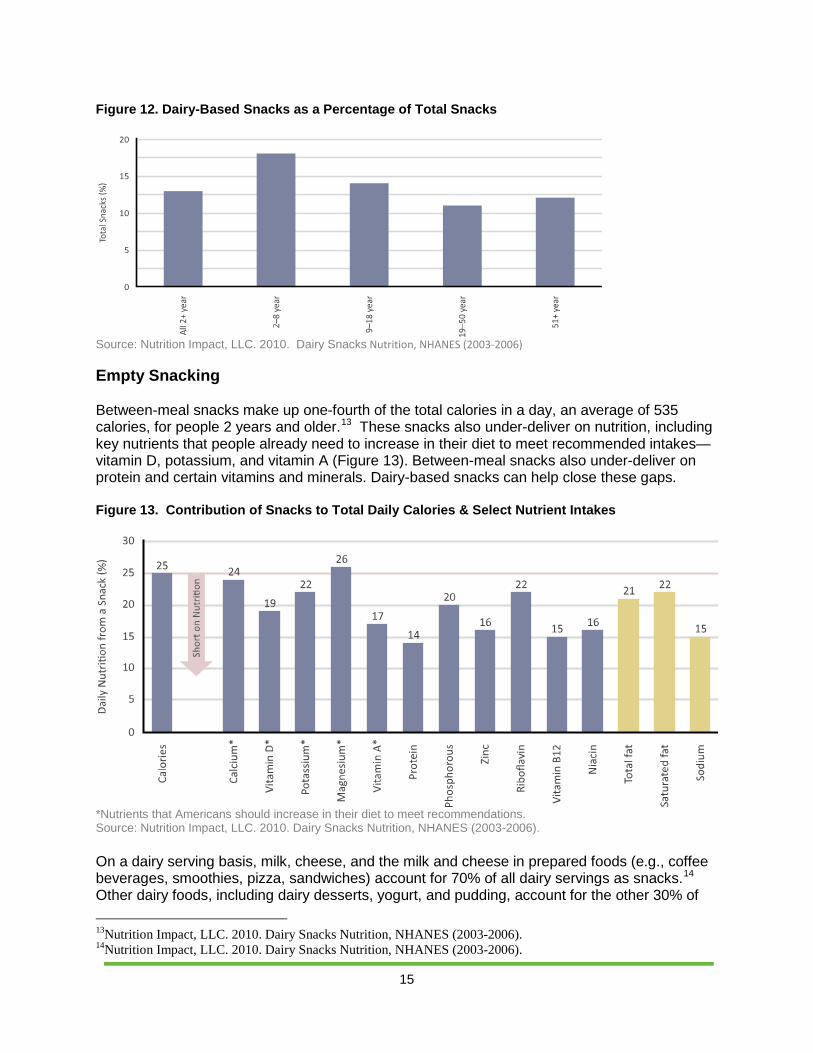
Empty Snacking Between-meal snacks make up one-fourth of the total calories in a day, an average of 535 calories, for people 2 years and older.13
These snacks also under-deliver on nutrition, including key nutrients that people already need to increase in their diet to meet recommended intakes—vitamin D, potassium, and vitamin A (Figure 13). Between-meal snacks also under-deliver on protein and certain vitamins and minerals. Dairy-based snacks can help close these gaps.
Figure 13. Contribution of Snacks to Total Daily Calories & Select Nutrient Intakes
*Nutrients that Americans should increase in their diet to meet recommendations. Source: Nutrition Impact, LLC. 2010. Dairy Snacks Nutrition, NHANES (2003-2006). On a dairy serving basis, milk, cheese, and the milk and cheese in prepared foods (e.g., coffee beverages, smoothies, pizza, sandwiches) account for 70% of all dairy servings as snacks.14
13Nutrition Impact, LLC. 2010. Dairy Snacks Nutrition, NHANES (2003-2006).
Other dairy foods, including dairy desserts, yogurt, and pudding, account for the other 30% of
14Nutrition Impact, LLC. 2010. Dairy Snacks Nutrition, NHANES (2003-2006).
16
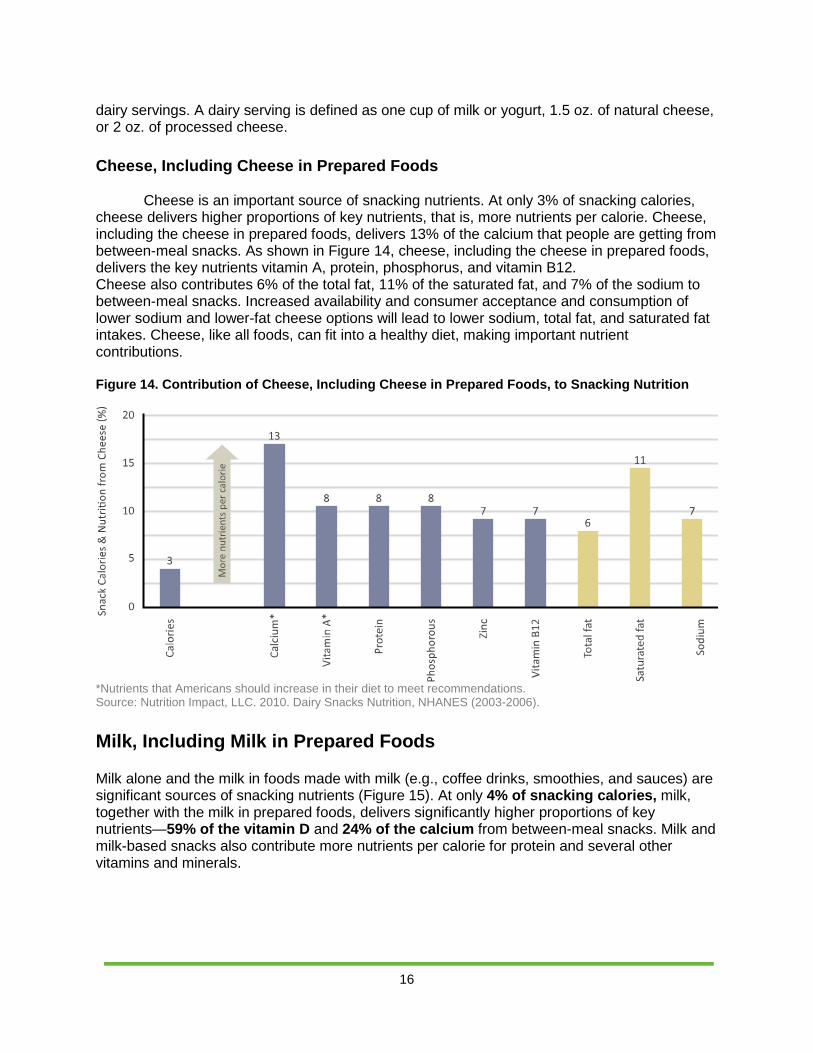
dairy servings. A dairy serving is defined as one cup of milk or yogurt, 1.5 oz. of natural cheese, or 2 oz. of processed cheese. Cheese, Including Cheese in Prepared Foods
Cheese is an important source of snacking nutrients. At only 3% of snacking calories, cheese delivers higher proportions of key nutrients, that is, more nutrients per calorie. Cheese, including the cheese in prepared foods, delivers 13% of the calcium that people are getting from between-meal snacks. As shown in Figure 14, cheese, including the cheese in prepared foods, delivers the key nutrients vitamin A, protein, phosphorus, and vitamin B12. Cheese also contributes 6% of the total fat, 11% of the saturated fat, and 7% of the sodium to between-meal snacks. Increased availability and consumer acceptance and consumption of lower sodium and lower-fat cheese options will lead to lower sodium, total fat, and saturated fat intakes. Cheese, like all foods, can fit into a healthy diet, making important nutrient contributions. Figure 14. Contribution of Cheese, Including Cheese in Prepared Foods, to Snacking Nutrition
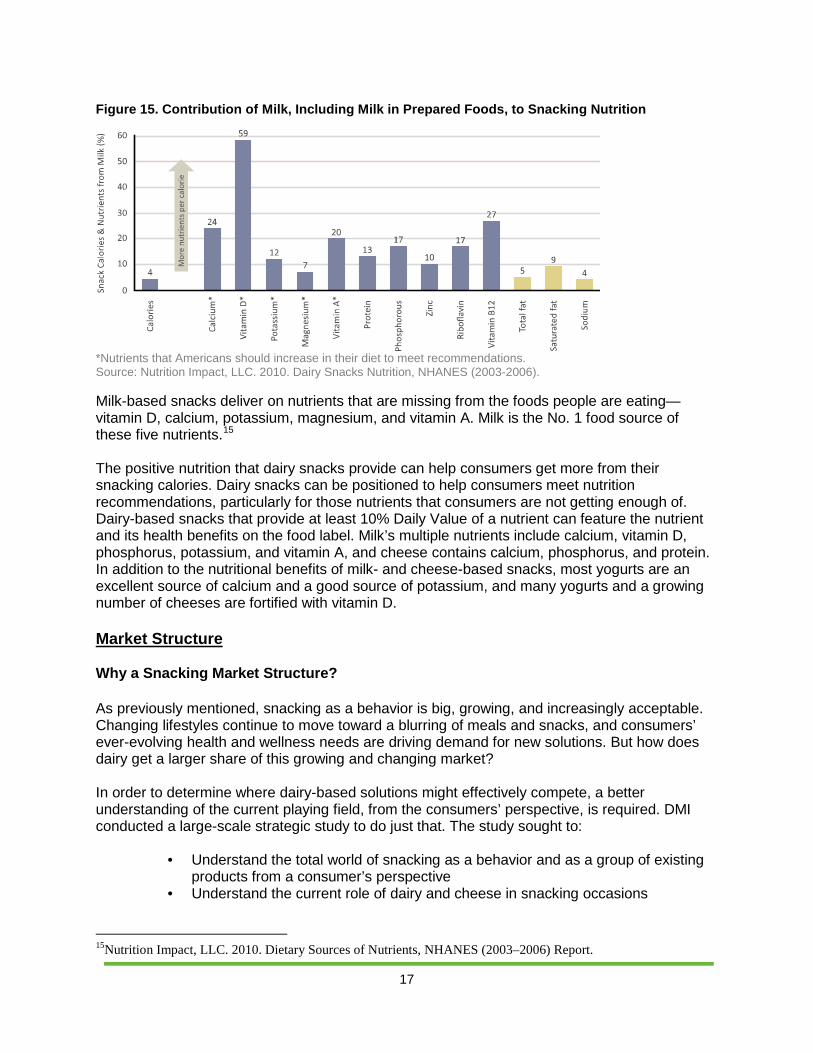
*Nutrients that Americans should increase in their diet to meet recommendations. Source: Nutrition Impact, LLC. 2010. Dairy Snacks Nutrition, NHANES (2003-2006). Milk, Including Milk in Prepared Foods Milk alone and the milk in foods made with milk (e.g., coffee drinks, smoothies, and sauces) are significant sources of snacking nutrients (Figure 15). At only 4% of snacking calories, milk, together with the milk in prepared foods, delivers significantly higher proportions of key nutrients—59% of the vitamin D and 24% of the calcium from between-meal snacks. Milk and milk-based snacks also contribute more nutrients per calorie for protein and several other vitamins and minerals.
17
Figure 15. Contribution of Milk, Including Milk in Prepared Foods, to Snacking Nutrition
*Nutrients that Americans should increase in their diet to meet recommendations. Source: Nutrition Impact, LLC. 2010. Dairy Snacks Nutrition, NHANES (2003-2006). Milk-based snacks deliver on nutrients that are missing from the foods people are eating—vitamin D, calcium, potassium, magnesium, and vitamin A. Milk is the No. 1 food source of these five nutrients.15
The positive nutrition that dairy snacks provide can help consumers get more from their snacking calories. Dairy snacks can be positioned to help consumers meet nutrition recommendations, particularly for those nutrients that consumers are not getting enough of. Dairy-based snacks that provide at least 10% Daily Value of a nutrient can feature the nutrient and its health benefits on the food label. Milk’s multiple nutrients include calcium, vitamin D, phosphorus, potassium, and vitamin A, and cheese contains calcium, phosphorus, and protein. In addition to the nutritional benefits of milk- and cheese-based snacks, most yogurts are an excellent source of calcium and a good source of potassium, and many yogurts and a growing number of cheeses are fortified with vitamin D. Market Structure Why a Snacking Market Structure? As previously mentioned, snacking as a behavior is big, growing, and increasingly acceptable. Changing lifestyles continue to move toward a blurring of meals and snacks, and consumers’ ever-evolving health and wellness needs are driving demand for new solutions. But how does dairy get a larger share of this growing and changing market? In order to determine where dairy-based solutions might effectively compete, a better understanding of the current playing field, from the consumers’ perspective, is required. DMI conducted a large-scale strategic study to do just that. The study sought to:
• Understand the total world of snacking as a behavior and as a group of existing products from a consumer’s perspective
• Understand the current role of dairy and cheese in snacking occasions
15Nutrition Impact, LLC. 2010. Dietary Sources of Nutrients, NHANES (2003–2006) Report.
18
• Identify the best short-term (1–2 years out) and longer-term (3–5+ years out) opportunity areas for dairy snacks in general, dairy as a component or ingredient, and cheese snacks in particular
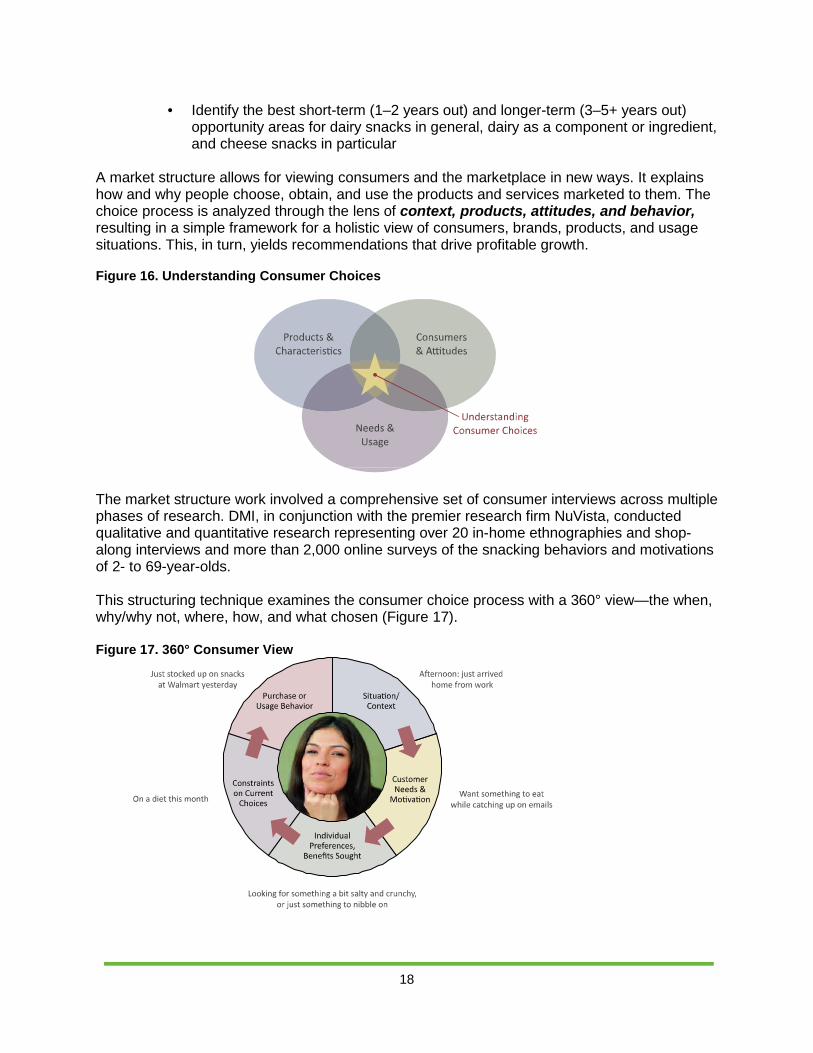
A market structure allows for viewing consumers and the marketplace in new ways. It explains how and why people choose, obtain, and use the products and services marketed to them. The choice process is analyzed through the lens of context, products, attitudes, and behavior, resulting in a simple framework for a holistic view of consumers, brands, products, and usage situations. This, in turn, yields recommendations that drive profitable growth.
Figure 16. Understanding Consumer Choices
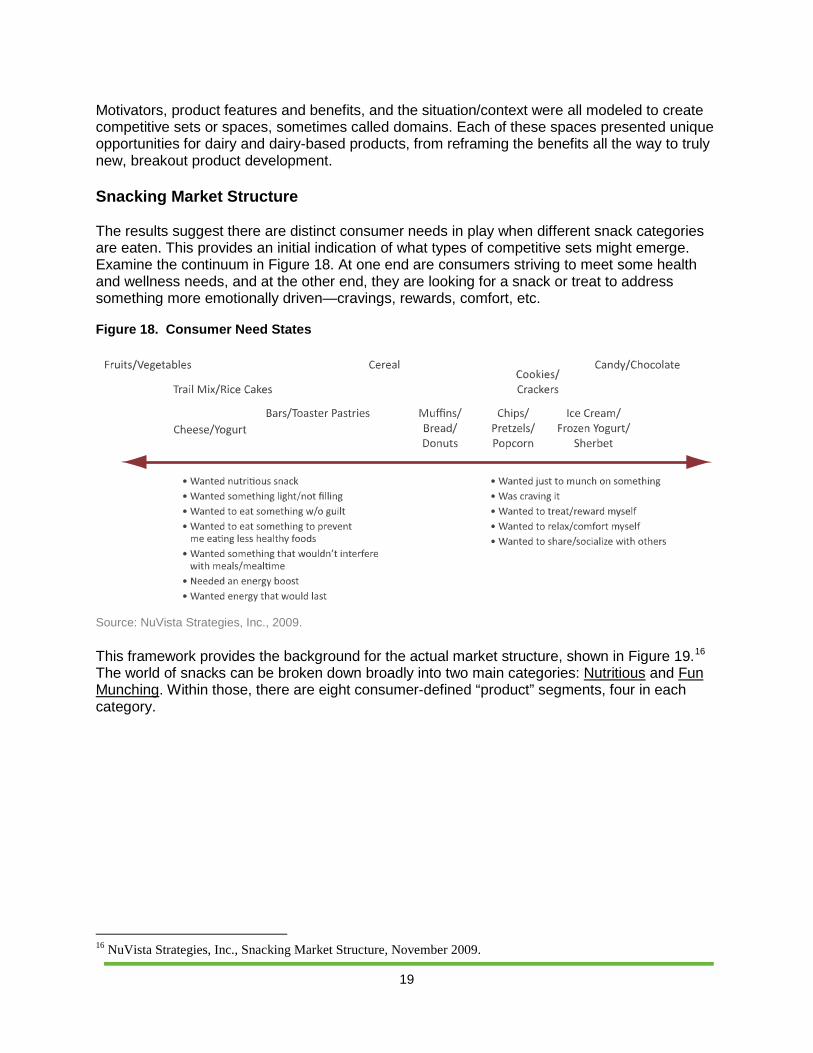
The market structure work involved a comprehensive set of consumer interviews across multiple phases of research. DMI, in conjunction with the premier research firm NuVista, conducted qualitative and quantitative research representing over 20 in-home ethnographies and shop-along interviews and more than 2,000 online surveys of the snacking behaviors and motivations of 2- to 69-year-olds. This structuring technique examines the consumer choice process with a 360° view—the when, why/why not, where, how, and what chosen (Figure 17). Figure 17. 360° Consumer View
19
Motivators, product features and benefits, and the situation/context were all modeled to create competitive sets or spaces, sometimes called domains. Each of these spaces presented unique opportunities for dairy and dairy-based products, from reframing the benefits all the way to truly new, breakout product development. Snacking Market Structure The results suggest there are distinct consumer needs in play when different snack categories are eaten. This provides an initial indication of what types of competitive sets might emerge. Examine the continuum in Figure 18. At one end are consumers striving to meet some health and wellness needs, and at the other end, they are looking for a snack or treat to address something more emotionally driven—cravings, rewards, comfort, etc. Figure 18. Consumer Need States
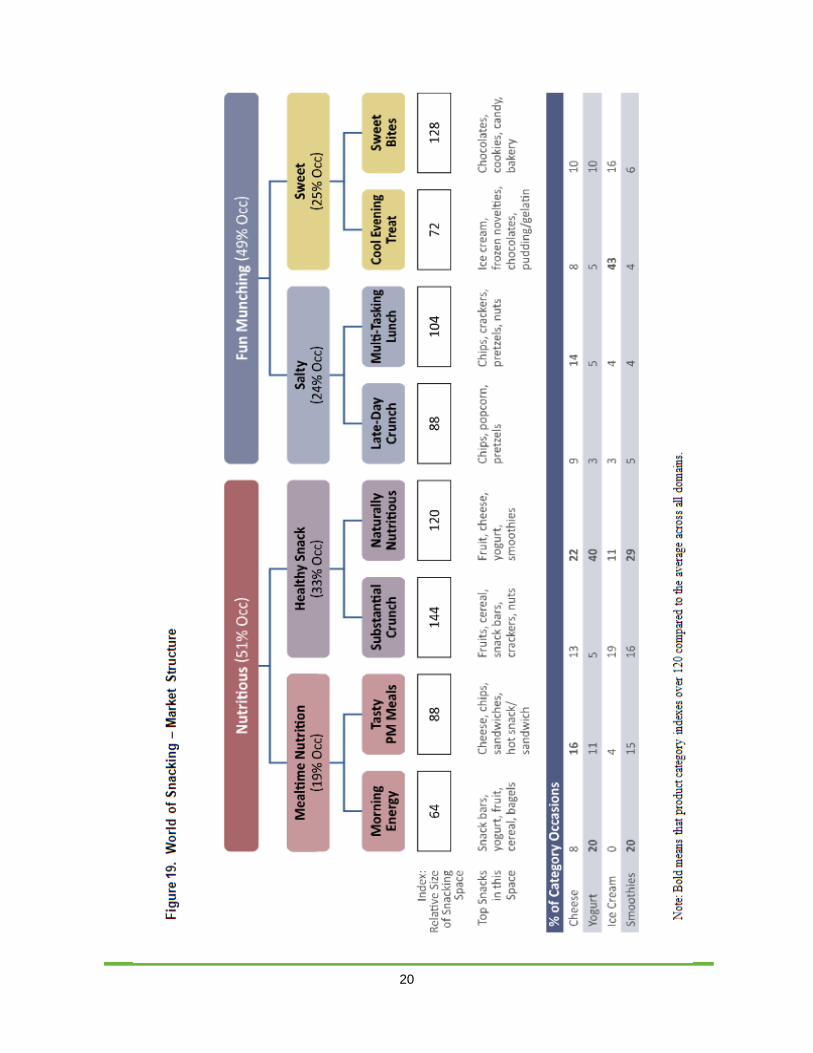
Source: NuVista Strategies, Inc., 2009. This framework provides the background for the actual market structure, shown in Figure 19.16
16 NuVista Strategies, Inc., Snacking Market Structure, November 2009.
The world of snacks can be broken down broadly into two main categories: Nutritious and Fun Munching. Within those, there are eight consumer-defined “product” segments, four in each category.
20
21
The structure spaces are fairly evenly balanced in terms of proportion of occasions. The next section will describe the characteristics of each of these eight spaces, but first a review of dairy’s presence in each is warranted. Dairy Within the Market Structure Current dairy products figure prominently in some of these structure spaces, but there is room to grow and innovate, since nondairy solutions often overshadow dairy-based products. More specifically, dairy products, as identified by consumers, are most significantly represented on the healthy side of the structure. Ice cream, a classic treat, plays well on the fun side. Nutritious Side Basic yogurt and some smoothies are appropriate for the Morning Energy needs, but cheese products have a relatively low presence and could seemingly excel in this state as a meal
22
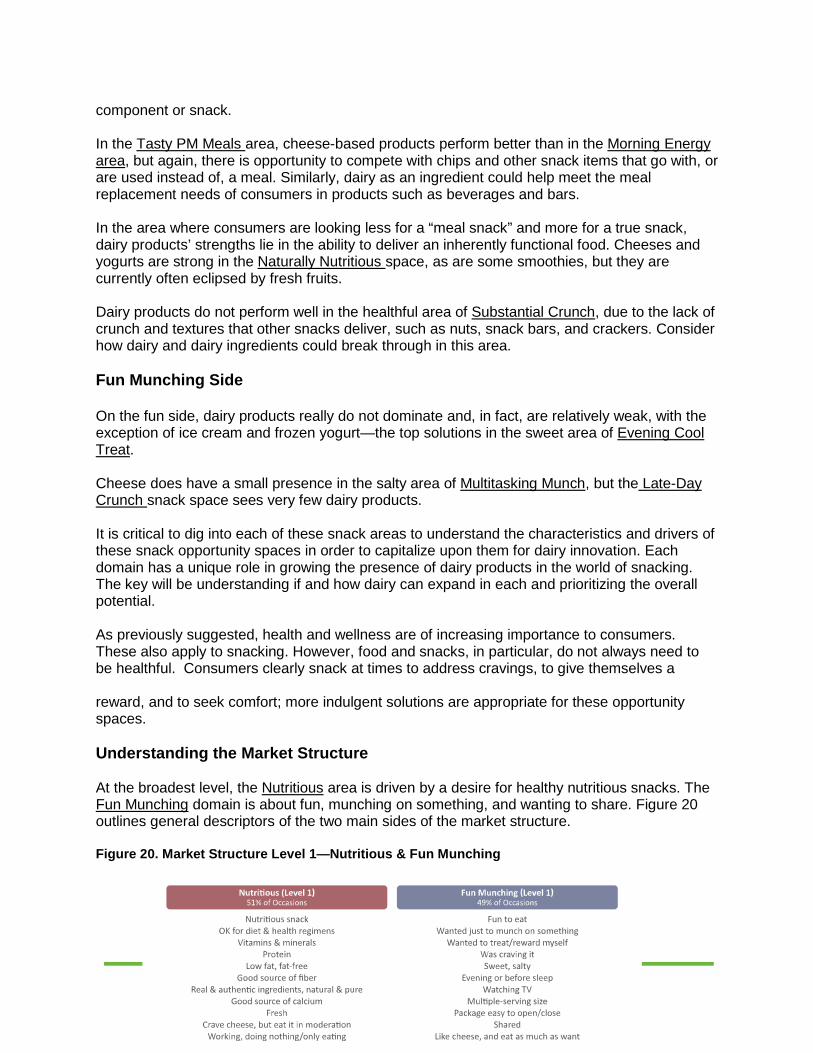
component or snack. In the Tasty PM Meals area, cheese-based products perform better than in the Morning Energy area, but again, there is opportunity to compete with chips and other snack items that go with, or are used instead of, a meal. Similarly, dairy as an ingredient could help meet the meal replacement needs of consumers in products such as beverages and bars. In the area where consumers are looking less for a “meal snack” and more for a true snack, dairy products’ strengths lie in the ability to deliver an inherently functional food. Cheeses and yogurts are strong in the Naturally Nutritious space, as are some smoothies, but they are currently often eclipsed by fresh fruits. Dairy products do not perform well in the healthful area of Substantial Crunch, due to the lack of crunch and textures that other snacks deliver, such as nuts, snack bars, and crackers. Consider how dairy and dairy ingredients could break through in this area. Fun Munching Side On the fun side, dairy products really do not dominate and, in fact, are relatively weak, with the exception of ice cream and frozen yogurt—the top solutions in the sweet area of Evening Cool Treat. Cheese does have a small presence in the salty area of Multitasking Munch, but the Late-Day Crunch snack space sees very few dairy products. It is critical to dig into each of these snack areas to understand the characteristics and drivers of these snack opportunity spaces in order to capitalize upon them for dairy innovation. Each domain has a unique role in growing the presence of dairy products in the world of snacking. The key will be understanding if and how dairy can expand in each and prioritizing the overall potential. As previously suggested, health and wellness are of increasing importance to consumers. These also apply to snacking. However, food and snacks, in particular, do not always need to be healthful. Consumers clearly snack at times to address cravings, to give themselves a reward, and to seek comfort; more indulgent solutions are appropriate for these opportunity spaces. Understanding the Market Structure At the broadest level, the Nutritious area is driven by a desire for healthy nutritious snacks. The Fun Munching domain is about fun, munching on something, and wanting to share. Figure 20 outlines general descriptors of the two main sides of the market structure. Figure 20. Market Structure Level 1—Nutritious & Fun Munching
23
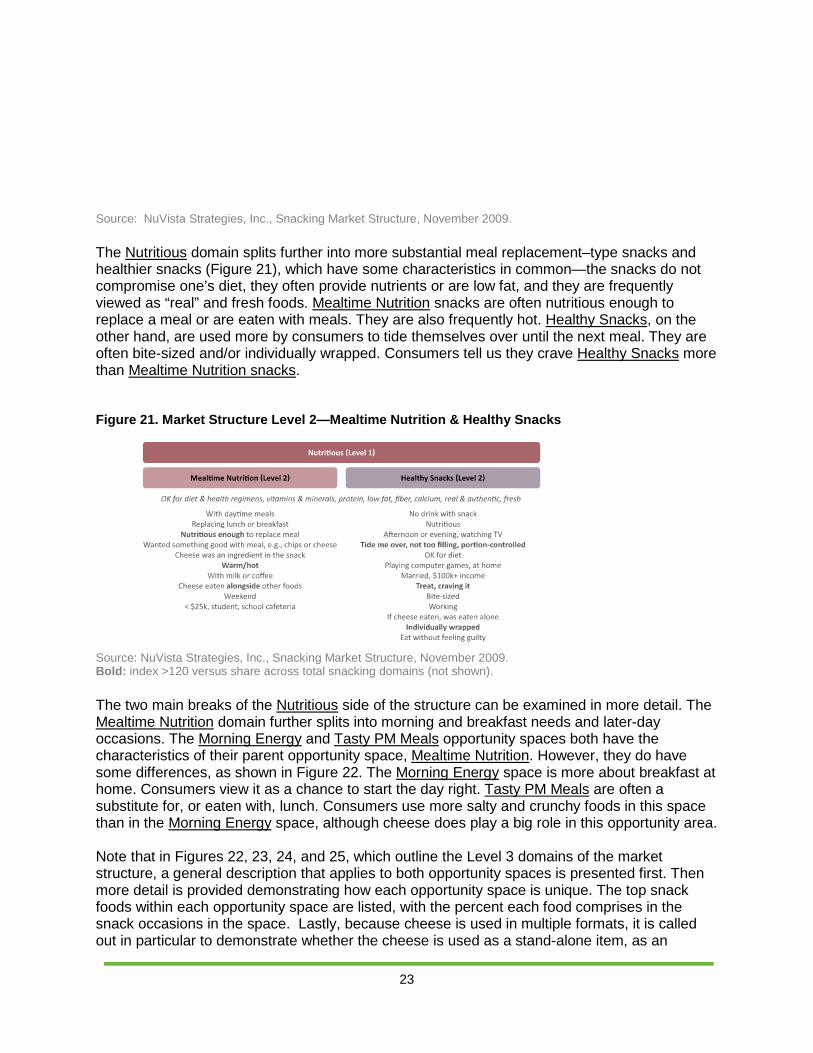
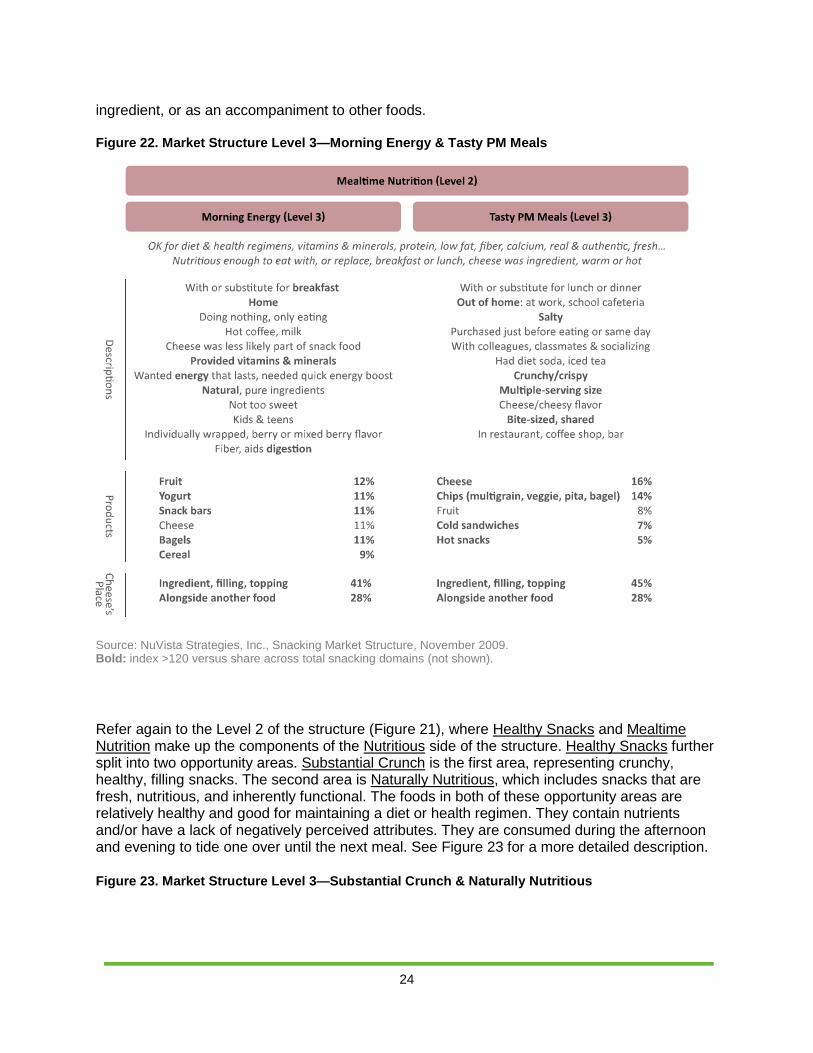
Source: NuVista Strategies, Inc., Snacking Market Structure, November 2009. The Nutritious domain splits further into more substantial meal replacement–type snacks and healthier snacks (Figure 21), which have some characteristics in common—the snacks do not compromise one’s diet, they often provide nutrients or are low fat, and they are frequently viewed as “real” and fresh foods. Mealtime Nutrition snacks are often nutritious enough to replace a meal or are eaten with meals. They are also frequently hot. Healthy Snacks, on the other hand, are used more by consumers to tide themselves over until the next meal. They are often bite-sized and/or individually wrapped. Consumers tell us they crave Healthy Snacks more than Mealtime Nutrition snacks. Figure 21. Market Structure Level 2—Mealtime Nutrition & Healthy Snacks Source: NuVista Strategies, Inc., Snacking Market Structure, November 2009. Bold: index >120 versus share across total snacking domains (not shown). The two main breaks of the Nutritious side of the structure can be examined in more detail. The Mealtime Nutrition domain further splits into morning and breakfast needs and later-day occasions. The Morning Energy and Tasty PM Meals opportunity spaces both have the characteristics of their parent opportunity space, Mealtime Nutrition. However, they do have some differences, as shown in Figure 22. The Morning Energy space is more about breakfast at home. Consumers view it as a chance to start the day right. Tasty PM Meals are often a substitute for, or eaten with, lunch. Consumers use more salty and crunchy foods in this space than in the Morning Energy space, although cheese does play a big role in this opportunity area. Note that in Figures 22, 23, 24, and 25, which outline the Level 3 domains of the market structure, a general description that applies to both opportunity spaces is presented first. Then more detail is provided demonstrating how each opportunity space is unique. The top snack foods within each opportunity space are listed, with the percent each food comprises in the snack occasions in the space. Lastly, because cheese is used in multiple formats, it is called out in particular to demonstrate whether the cheese is used as a stand-alone item, as an
24
ingredient, or as an accompaniment to other foods. Figure 22. Market Structure Level 3—Morning Energy & Tasty PM Meals
Source: NuVista Strategies, Inc., Snacking Market Structure, November 2009. Bold: index >120 versus share across total snacking domains (not shown). Refer again to the Level 2 of the structure (Figure 21), where Healthy Snacks and Mealtime Nutrition make up the components of the Nutritious side of the structure. Healthy Snacks further split into two opportunity areas. Substantial Crunch is the first area, representing crunchy, healthy, filling snacks. The second area is Naturally Nutritious, which includes snacks that are fresh, nutritious, and inherently functional. The foods in both of these opportunity areas are relatively healthy and good for maintaining a diet or health regimen. They contain nutrients and/or have a lack of negatively perceived attributes. They are consumed during the afternoon and evening to tide one over until the next meal. See Figure 23 for a more detailed description. Figure 23. Market Structure Level 3—Substantial Crunch & Naturally Nutritious
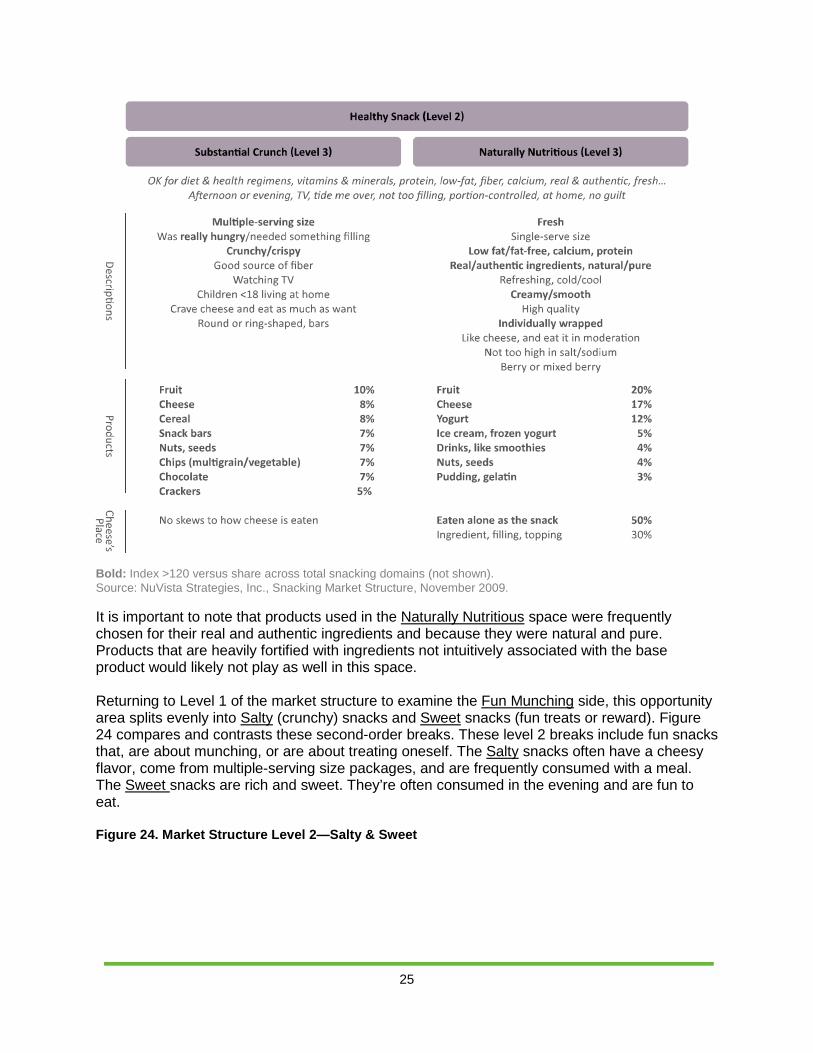
25
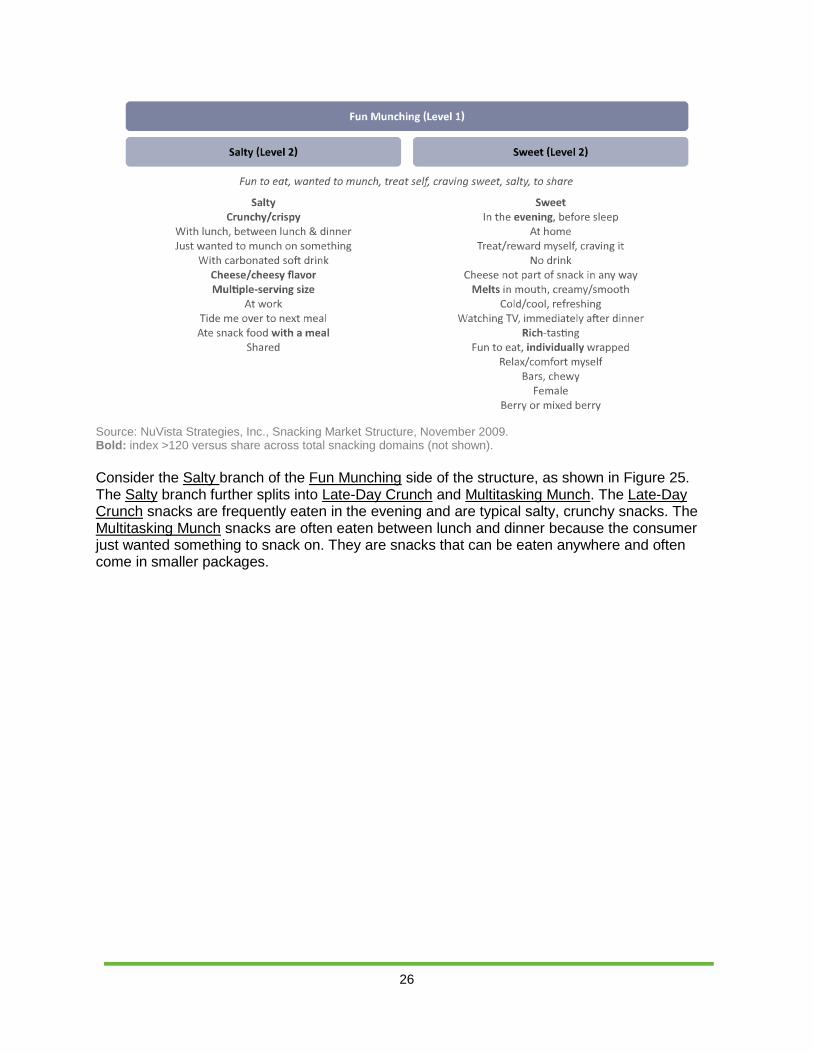
Bold: Index >120 versus share across total snacking domains (not shown). Source: NuVista Strategies, Inc., Snacking Market Structure, November 2009. It is important to note that products used in the Naturally Nutritious space were frequently chosen for their real and authentic ingredients and because they were natural and pure. Products that are heavily fortified with ingredients not intuitively associated with the base product would likely not play as well in this space. Returning to Level 1 of the market structure to examine the Fun Munching side, this opportunity area splits evenly into Salty (crunchy) snacks and Sweet snacks (fun treats or reward). Figure 24 compares and contrasts these second-order breaks. These level 2 breaks include fun snacks that, are about munching, or are about treating oneself. The Salty snacks often have a cheesy flavor, come from multiple-serving size packages, and are frequently consumed with a meal. The Sweet snacks are rich and sweet. They’re often consumed in the evening and are fun to eat. Figure 24. Market Structure Level 2—Salty & Sweet
26
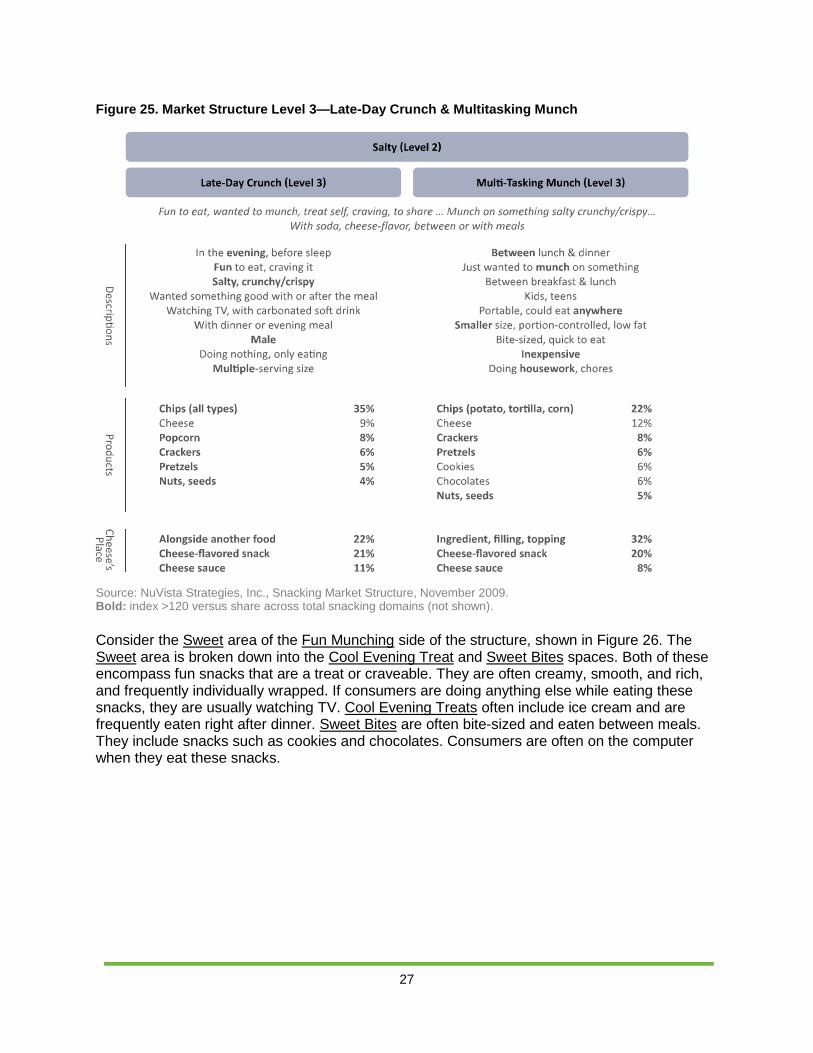
Source: NuVista Strategies, Inc., Snacking Market Structure, November 2009. Bold: index >120 versus share across total snacking domains (not shown). Consider the Salty branch of the Fun Munching side of the structure, as shown in Figure 25. The Salty branch further splits into Late-Day Crunch and Multitasking Munch. The Late-Day Crunch snacks are frequently eaten in the evening and are typical salty, crunchy snacks. The Multitasking Munch snacks are often eaten between lunch and dinner because the consumer just wanted something to snack on. They are snacks that can be eaten anywhere and often come in smaller packages.
27
Figure 25. Market Structure Level 3—Late-Day Crunch & Multitasking Munch
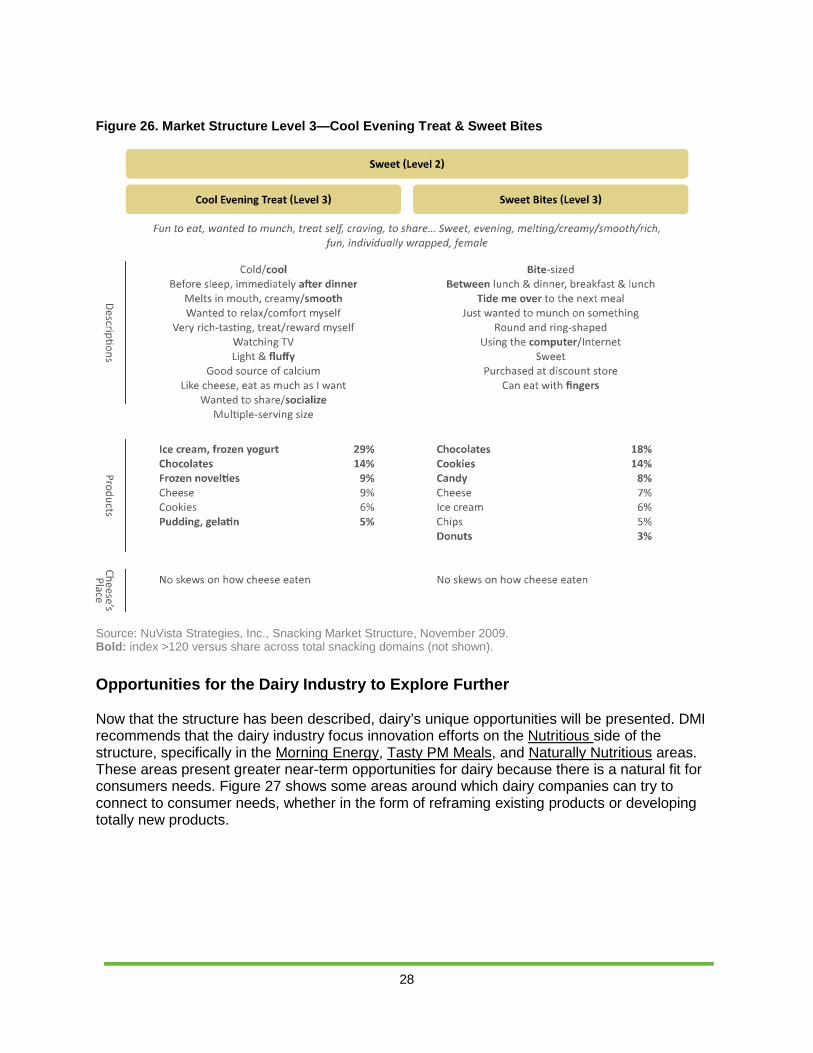
Source: NuVista Strategies, Inc., Snacking Market Structure, November 2009. Bold: index >120 versus share across total snacking domains (not shown). Consider the Sweet area of the Fun Munching side of the structure, shown in Figure 26. The Sweet area is broken down into the Cool Evening Treat and Sweet Bites spaces. Both of these encompass fun snacks that are a treat or craveable. They are often creamy, smooth, and rich, and frequently individually wrapped. If consumers are doing anything else while eating these snacks, they are usually watching TV. Cool Evening Treats often include ice cream and are frequently eaten right after dinner. Sweet Bites are often bite-sized and eaten between meals. They include snacks such as cookies and chocolates. Consumers are often on the computer when they eat these snacks.
28
Figure 26. Market Structure Level 3—Cool Evening Treat & Sweet Bites
Source: NuVista Strategies, Inc., Snacking Market Structure, November 2009. Bold: index >120 versus share across total snacking domains (not shown).
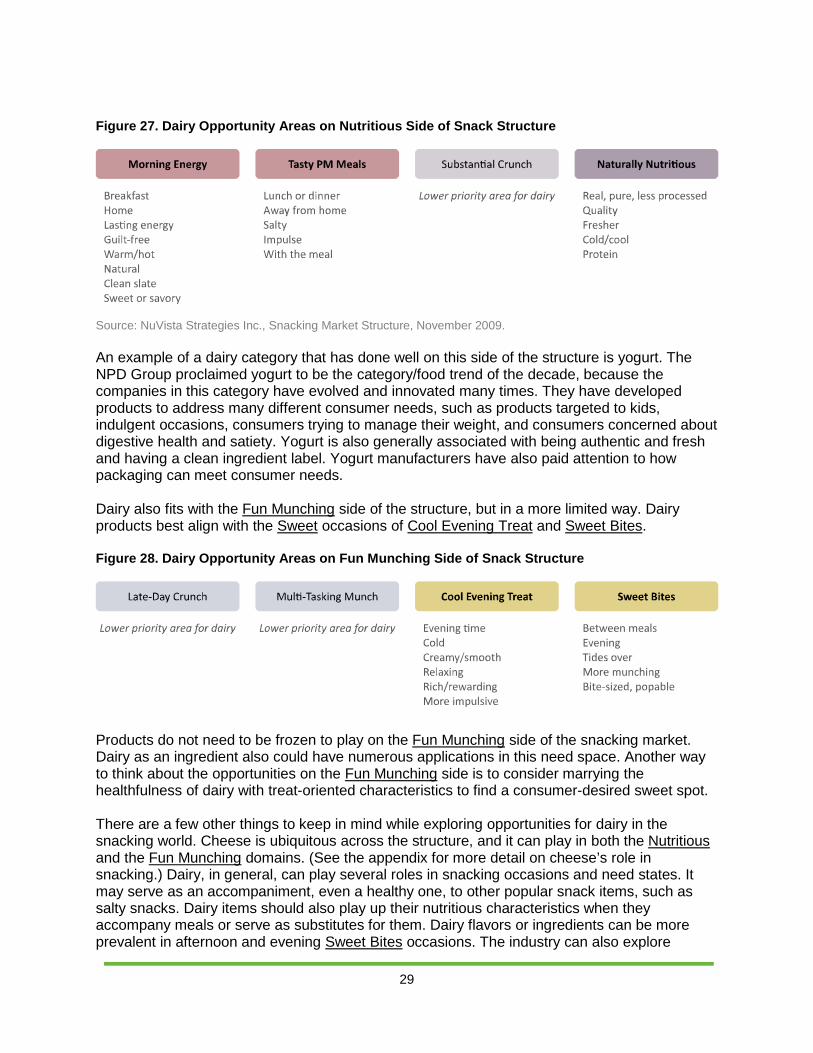
Opportunities for the Dairy Industry to Explore Further Now that the structure has been described, dairy’s unique opportunities will be presented. DMI recommends that the dairy industry focus innovation efforts on the Nutritious side of the structure, specifically in the Morning Energy, Tasty PM Meals, and Naturally Nutritious areas. These areas present greater near-term opportunities for dairy because there is a natural fit for consumers needs. Figure 27 shows some areas around which dairy companies can try to connect to consumer needs, whether in the form of reframing existing products or developing totally new products.
29
Figure 27. Dairy Opportunity Areas on Nutritious Side of Snack Structure
Source: NuVista Strategies Inc., Snacking Market Structure, November 2009. An example of a dairy category that has done well on this side of the structure is yogurt. The NPD Group proclaimed yogurt to be the category/food trend of the decade, because the companies in this category have evolved and innovated many times. They have developed products to address many different consumer needs, such as products targeted to kids, indulgent occasions, consumers trying to manage their weight, and consumers concerned about digestive health and satiety. Yogurt is also generally associated with being authentic and fresh and having a clean ingredient label. Yogurt manufacturers have also paid attention to how packaging can meet consumer needs. Dairy also fits with the Fun Munching side of the structure, but in a more limited way. Dairy products best align with the Sweet occasions of Cool Evening Treat and Sweet Bites. Figure 28. Dairy Opportunity Areas on Fun Munching Side of Snack Structure
Products do not need to be frozen to play on the Fun Munching side of the snacking market. Dairy as an ingredient also could have numerous applications in this need space. Another way to think about the opportunities on the Fun Munching side is to consider marrying the healthfulness of dairy with treat-oriented characteristics to find a consumer-desired sweet spot. There are a few other things to keep in mind while exploring opportunities for dairy in the snacking world. Cheese is ubiquitous across the structure, and it can play in both the Nutritious and the Fun Munching domains. (See the appendix for more detail on cheese’s role in snacking.) Dairy, in general, can play several roles in snacking occasions and need states. It may serve as an accompaniment, even a healthy one, to other popular snack items, such as salty snacks. Dairy items should also play up their nutritious characteristics when they accompany meals or serve as substitutes for them. Dairy flavors or ingredients can be more prevalent in afternoon and evening Sweet Bites occasions. The industry can also explore
30
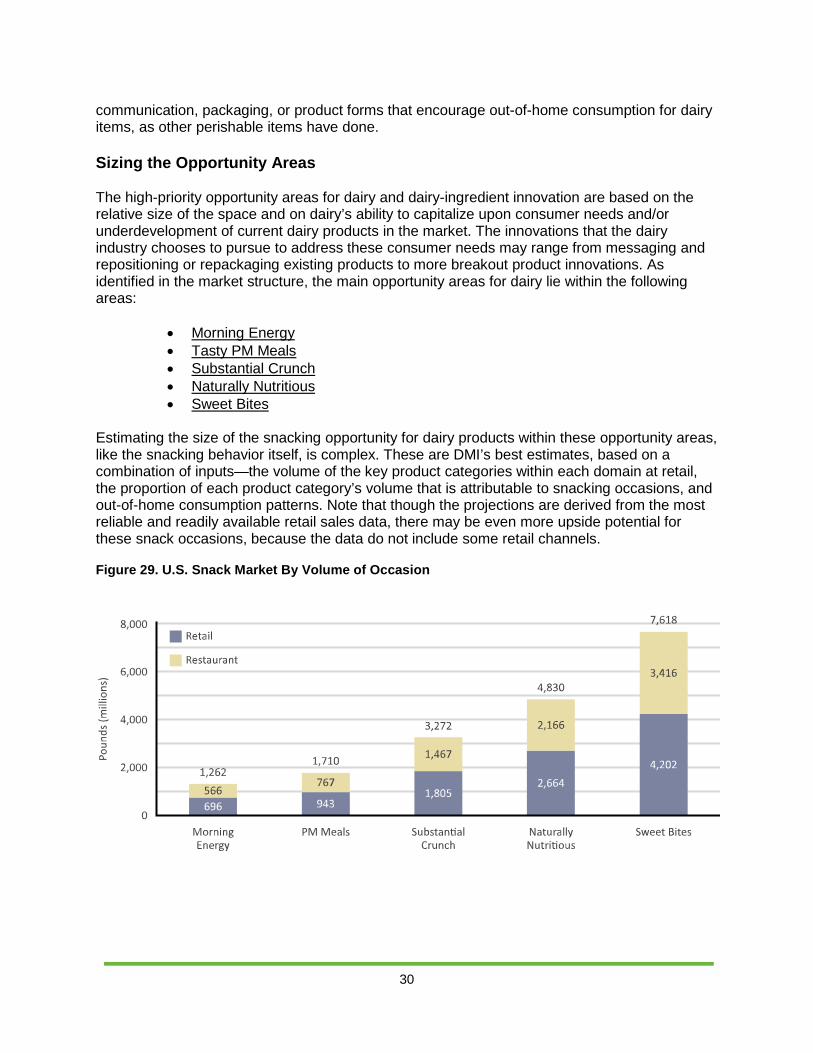
communication, packaging, or product forms that encourage out-of-home consumption for dairy items, as other perishable items have done. Sizing the Opportunity Areas The high-priority opportunity areas for dairy and dairy-ingredient innovation are based on the relative size of the space and on dairy’s ability to capitalize upon consumer needs and/or underdevelopment of current dairy products in the market. The innovations that the dairy industry chooses to pursue to address these consumer needs may range from messaging and repositioning or repackaging existing products to more breakout product innovations. As identified in the market structure, the main opportunity areas for dairy lie within the following areas:
• Morning Energy • Tasty PM Meals • Substantial Crunch • Naturally Nutritious • Sweet Bites
Estimating the size of the snacking opportunity for dairy products within these opportunity areas, like the snacking behavior itself, is complex. These are DMI’s best estimates, based on a combination of inputs—the volume of the key product categories within each domain at retail, the proportion of each product category’s volume that is attributable to snacking occasions, and out-of-home consumption patterns. Note that though the projections are derived from the most reliable and readily available retail sales data, there may be even more upside potential for these snack occasions, because the data do not include some retail channels. Figure 29. U.S. Snack Market By Volume of Occasion
31
Conclusion Dairy products are versatile. In most instances, they can be consumed as is, minimally processed in both foods and beverages during any eating occasion. If there is one thing dairy suffers from, it is being pigeonholed into traditional consumption roles: milk and cookies, milk and cereal, cheese on pizza, yogurt eaten in the morning, milk in coffee, ice cream and cake. These are valuable roles for dairy products and ones that need to be protected. However, the industry can capture new volume through new uses and occasions. In order to compete in the snacking occasion, the industry needs to innovate. Innovation beyond flavored milk, beyond snack cheese, beyond spoonable yogurt, beyond new ice cream flavors, beyond whey-based sports beverages, and, very possibly, beyond the refrigerated dairy case. To compete in the snacking occasion, the dairy industry needs to look past the usual competitive set and take a broader view. It needs to compete in new categories and go after new consumer segments. By capitalizing on the versatility of dairy products and using the snacking market structure outlined in this white paper as a roadmap for innovation, incremental dairy volume could come from the snacking occasion.
32
Appendix
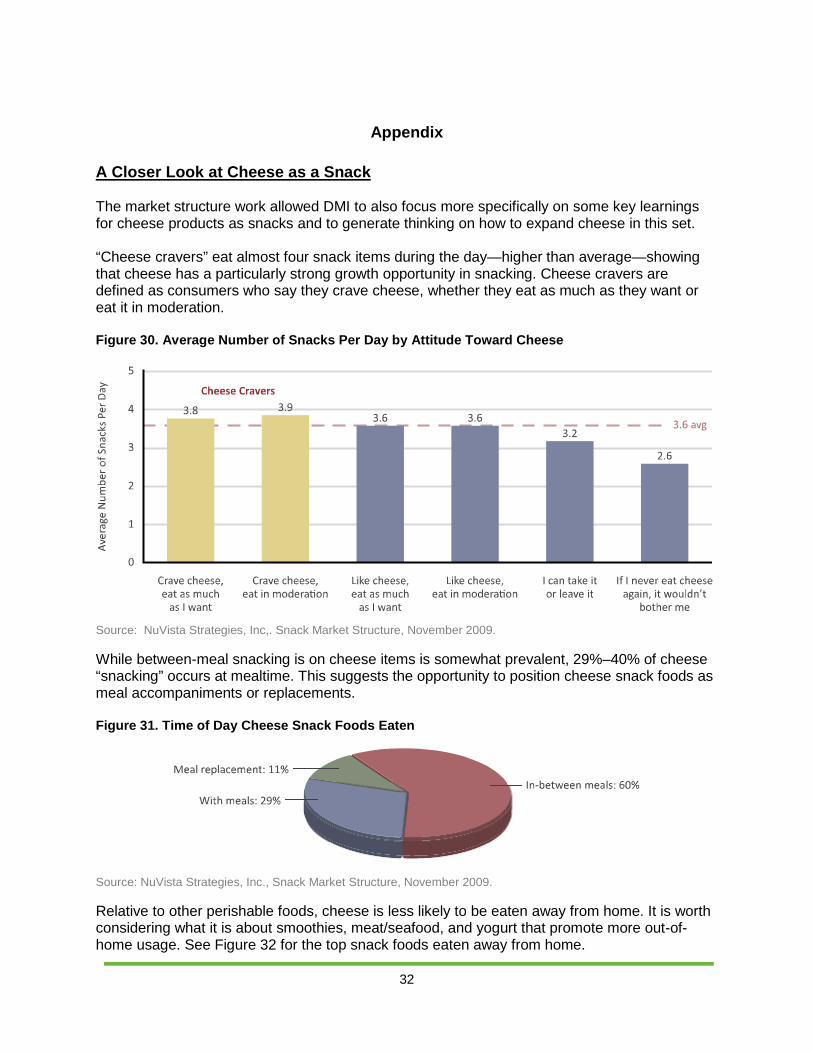
A Closer Look at Cheese as a Snack The market structure work allowed DMI to also focus more specifically on some key learnings for cheese products as snacks and to generate thinking on how to expand cheese in this set. “Cheese cravers” eat almost four snack items during the day—higher than average—showing that cheese has a particularly strong growth opportunity in snacking. Cheese cravers are defined as consumers who say they crave cheese, whether they eat as much as they want or eat it in moderation. Figure 30. Average Number of Snacks Per Day by Attitude Toward Cheese
Source: NuVista Strategies, Inc,. Snack Market Structure, November 2009. While between-meal snacking is on cheese items is somewhat prevalent, 29%–40% of cheese “snacking” occurs at mealtime. This suggests the opportunity to position cheese snack foods as meal accompaniments or replacements. Figure 31. Time of Day Cheese Snack Foods Eaten
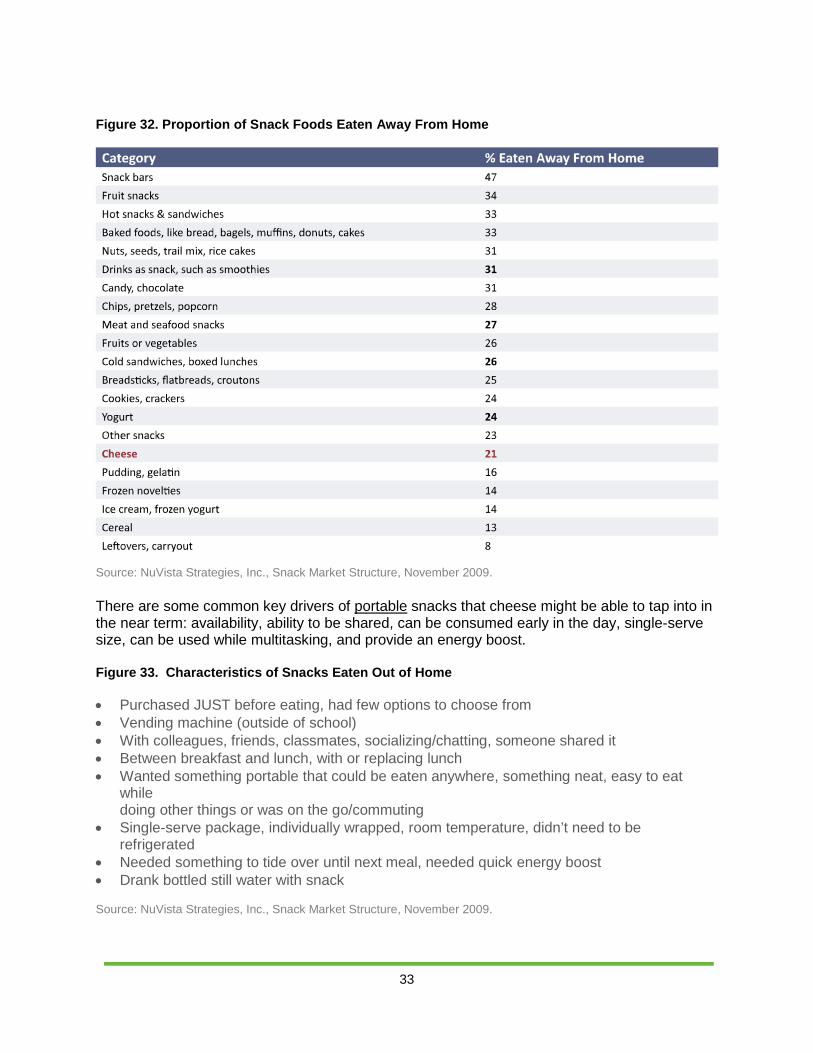
Source: NuVista Strategies, Inc., Snack Market Structure, November 2009. Relative to other perishable foods, cheese is less likely to be eaten away from home. It is worth considering what it is about smoothies, meat/seafood, and yogurt that promote more out-of-home usage. See Figure 32 for the top snack foods eaten away from home.
33
Figure 32. Proportion of Snack Foods Eaten Away From Home
Source: NuVista Strategies, Inc., Snack Market Structure, November 2009. There are some common key drivers of portable snacks that cheese might be able to tap into in the near term: availability, ability to be shared, can be consumed early in the day, single-serve size, can be used while multitasking, and provide an energy boost. Figure 33. Characteristics of Snacks Eaten Out of Home • Purchased JUST before eating, had few options to choose from • Vending machine (outside of school) • With colleagues, friends, classmates, socializing/chatting, someone shared it • Between breakfast and lunch, with or replacing lunch • Wanted something portable that could be eaten anywhere, something neat, easy to eat
while doing other things or was on the go/commuting
• Single-serve package, individually wrapped, room temperature, didn’t need to be refrigerated
• Needed something to tide over until next meal, needed quick energy boost • Drank bottled still water with snack Source: NuVista Strategies, Inc., Snack Market Structure, November 2009.
34
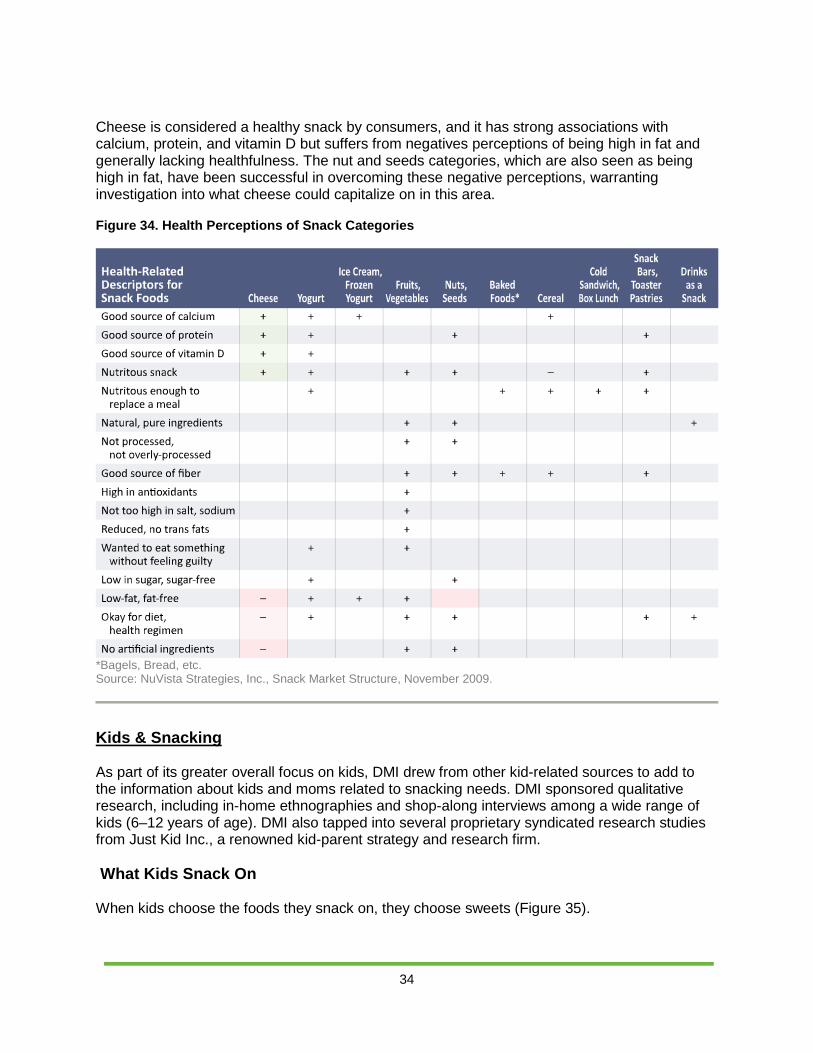
Cheese is considered a healthy snack by consumers, and it has strong associations with calcium, protein, and vitamin D but suffers from negatives perceptions of being high in fat and generally lacking healthfulness. The nut and seeds categories, which are also seen as being high in fat, have been successful in overcoming these negative perceptions, warranting investigation into what cheese could capitalize on in this area. Figure 34. Health Perceptions of Snack Categories
*Bagels, Bread, etc. Source: NuVista Strategies, Inc., Snack Market Structure, November 2009.
Kids & Snacking As part of its greater overall focus on kids, DMI drew from other kid-related sources to add to the information about kids and moms related to snacking needs. DMI sponsored qualitative research, including in-home ethnographies and shop-along interviews among a wide range of kids (6–12 years of age). DMI also tapped into several proprietary syndicated research studies from Just Kid Inc., a renowned kid-parent strategy and research firm. What Kids Snack On When kids choose the foods they snack on, they choose sweets (Figure 35).
35
Figure 35. Kids’ Choices for Snacks by Annual Eatings per Capita
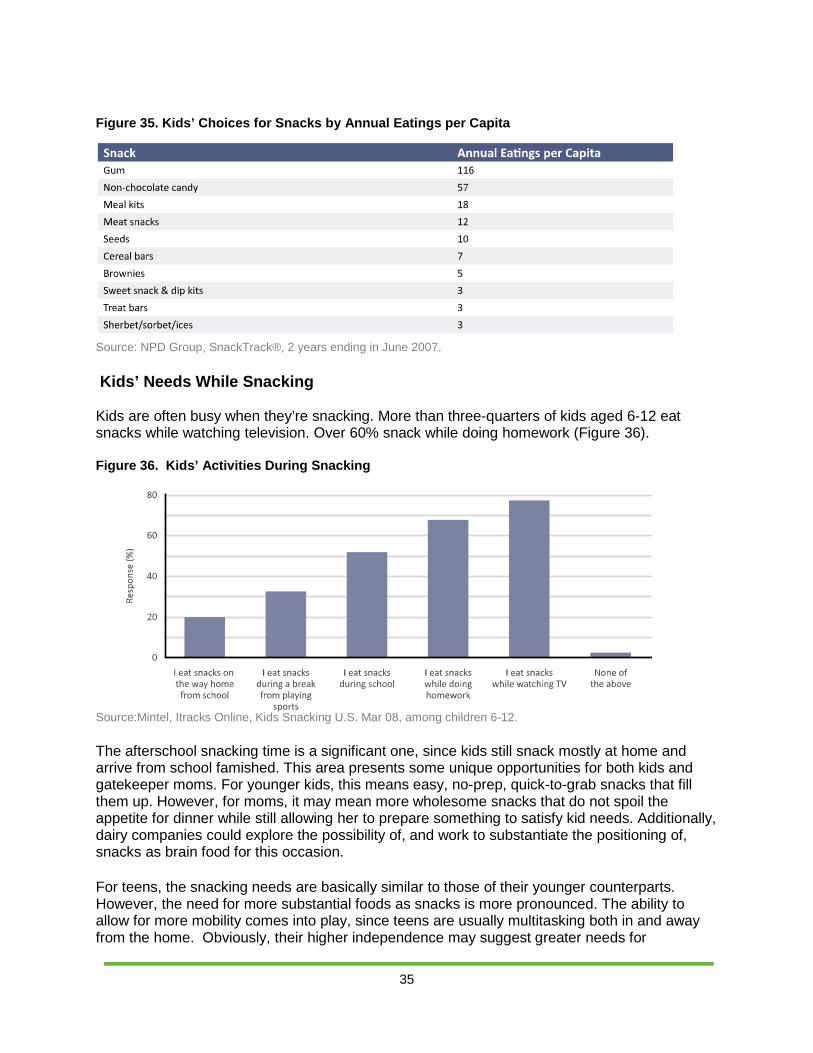
Source: NPD Group, SnackTrack®, 2 years ending in June 2007. Kids’ Needs While Snacking Kids are often busy when they’re snacking. More than three-quarters of kids aged 6-12 eat snacks while watching television. Over 60% snack while doing homework (Figure 36). Figure 36. Kids’ Activities During Snacking
Source:Mintel, Itracks Online, Kids Snacking U.S. Mar 08, among children 6-12. The afterschool snacking time is a significant one, since kids still snack mostly at home and arrive from school famished. This area presents some unique opportunities for both kids and gatekeeper moms. For younger kids, this means easy, no-prep, quick-to-grab snacks that fill them up. However, for moms, it may mean more wholesome snacks that do not spoil the appetite for dinner while still allowing her to prepare something to satisfy kid needs. Additionally, dairy companies could explore the possibility of, and work to substantiate the positioning of, snacks as brain food for this occasion. For teens, the snacking needs are basically similar to those of their younger counterparts. However, the need for more substantial foods as snacks is more pronounced. The ability to allow for more mobility comes into play, since teens are usually multitasking both in and away from the home. Obviously, their higher independence may suggest greater needs for
36
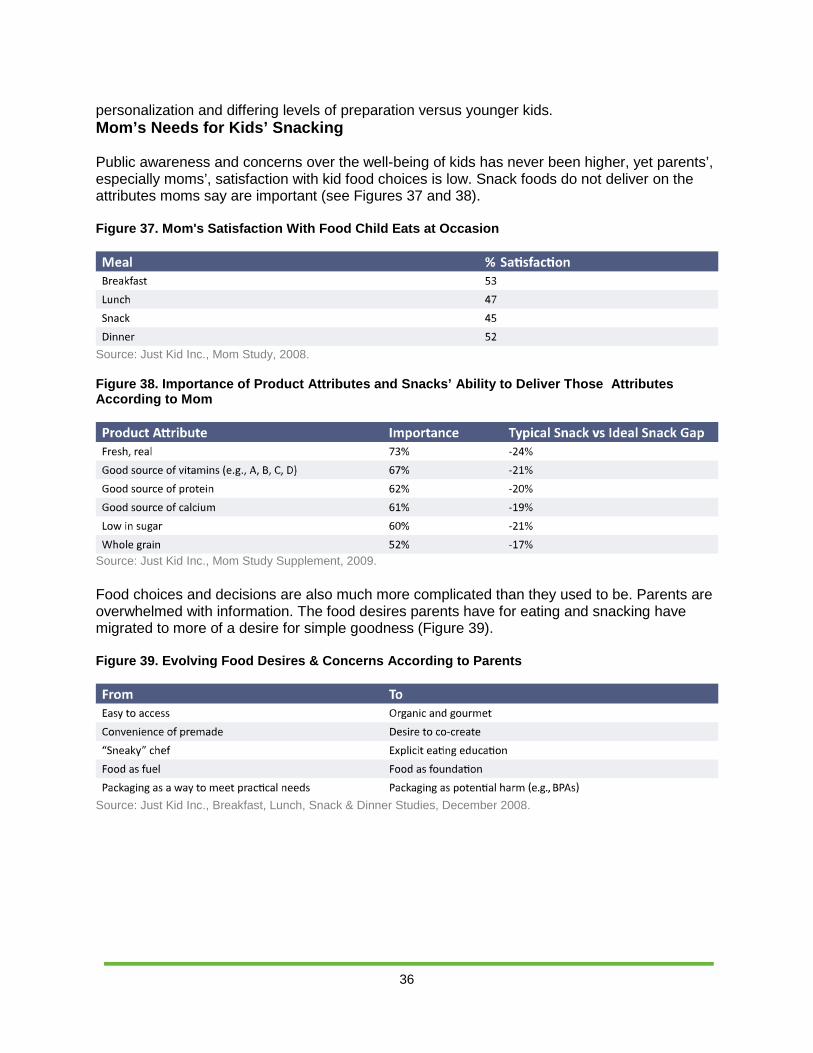
personalization and differing levels of preparation versus younger kids. Mom’s Needs for Kids’ Snacking Public awareness and concerns over the well-being of kids has never been higher, yet parents’, especially moms’, satisfaction with kid food choices is low. Snack foods do not deliver on the attributes moms say are important (see Figures 37 and 38). Figure 37. Mom's Satisfaction With Food Child Eats at Occasion
Source: Just Kid Inc., Mom Study, 2008. Figure 38. Importance of Product Attributes and Snacks’ Ability to Deliver Those Attributes According to Mom
Source: Just Kid Inc., Mom Study Supplement, 2009. Food choices and decisions are also much more complicated than they used to be. Parents are overwhelmed with information. The food desires parents have for eating and snacking have migrated to more of a desire for simple goodness (Figure 39). Figure 39. Evolving Food Desires & Concerns According to Parents
Source: Just Kid Inc., Breakfast, Lunch, Snack & Dinner Studies, December 2008.
37
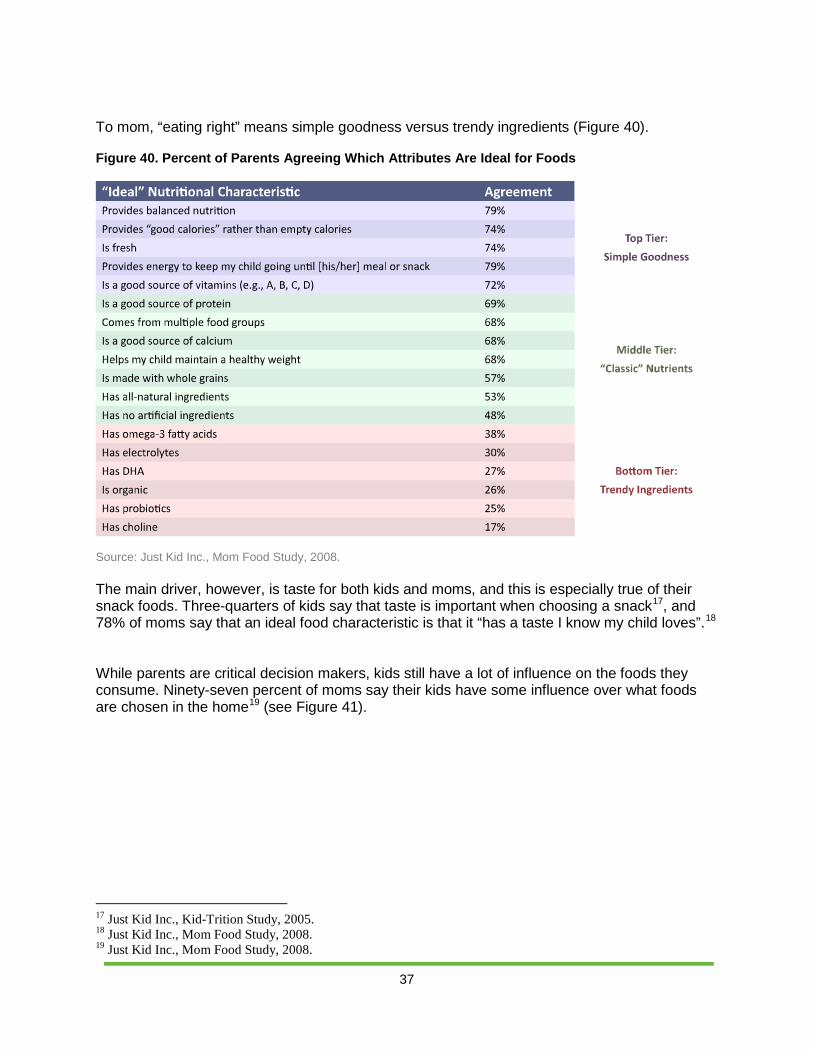
To mom, “eating right” means simple goodness versus trendy ingredients (Figure 40). Figure 40. Percent of Parents Agreeing Which Attributes Are Ideal for Foods
Source: Just Kid Inc., Mom Food Study, 2008. The main driver, however, is taste for both kids and moms, and this is especially true of their snack foods. Three-quarters of kids say that taste is important when choosing a snack17, and 78% of moms say that an ideal food characteristic is that it “has a taste I know my child loves”.18
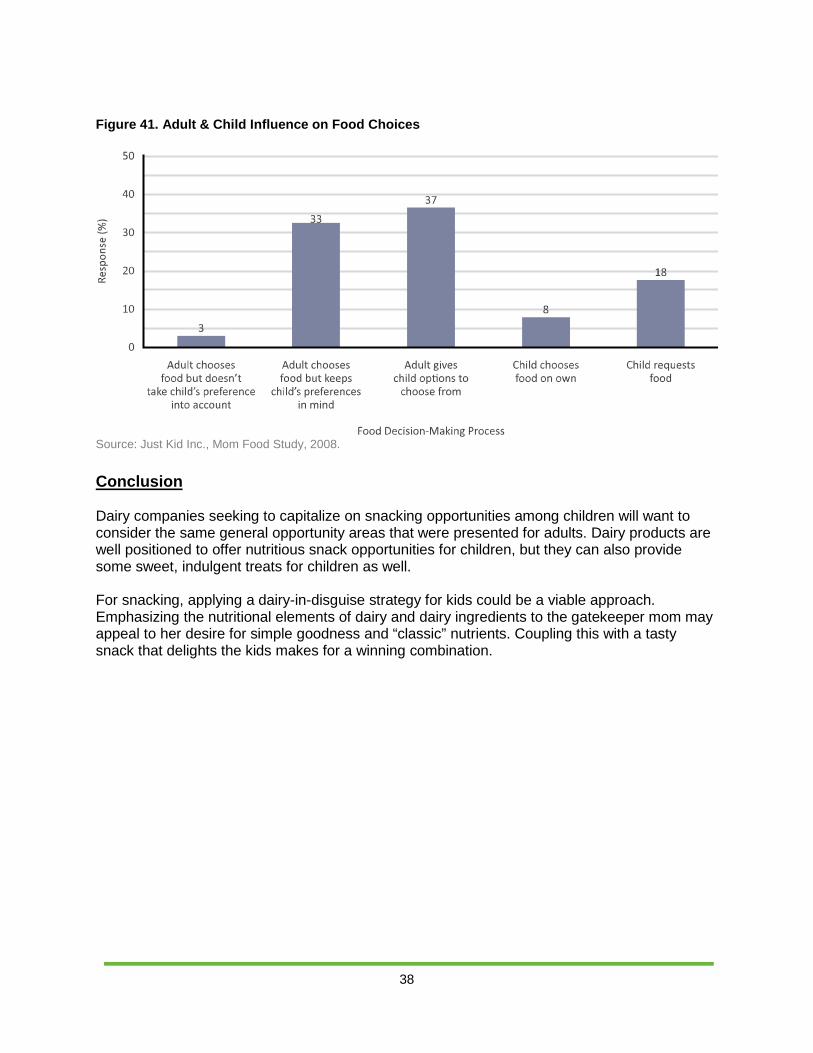
While parents are critical decision makers, kids still have a lot of influence on the foods they consume. Ninety-seven percent of moms say their kids have some influence over what foods are chosen in the home19
(see Figure 41).
17 Just Kid Inc., Kid-Trition Study, 2005. 18 Just Kid Inc., Mom Food Study, 2008. 19 Just Kid Inc., Mom Food Study, 2008.
38
Figure 41. Adult & Child Influence on Food Choices
Source: Just Kid Inc., Mom Food Study, 2008. Conclusion Dairy companies seeking to capitalize on snacking opportunities among children will want to consider the same general opportunity areas that were presented for adults. Dairy products are well positioned to offer nutritious snack opportunities for children, but they can also provide some sweet, indulgent treats for children as well. For snacking, applying a dairy-in-disguise strategy for kids could be a viable approach. Emphasizing the nutritional elements of dairy and dairy ingredients to the gatekeeper mom may appeal to her desire for simple goodness and “classic” nutrients. Coupling this with a tasty snack that delights the kids makes for a winning combination.
39
Hispanics DMI also expanded the snacking research to include less-acculturated and moderately-acculturated Hispanics to better explore opportunities specific to this growing market.20
Hispanics & the Snacking Market Structure Overall, Hispanics use snack foods similarly to the general market, so many of the general market initiatives may resonate with Hispanics as well, particularly efforts to reinforce cheese, yogurt, and smoothies as fresh, natural, authentic, and local products. In addition, long-term innovations around cheese as a satiating item that can accompany meals could be beneficial. All of the recommendations below are based on the NuVista Snack Market Structure Study.21
There are some differences from the general snack market opportunities that can be capitalized on as well. Hispanics are more likely to snack on items that are perceived to be healthier, such as cereal, yogurt, sandwiches, and meats, traditional Hispanic snacks, and drinks. They snack less often on craveable items, such as chips, sweets, and ice cream. Companies can explore communicating that dairy snacks won’t ruin a meal or that they provide long-lasting energy. Hispanics are more motivated by snack foods that are light, that are not enough to ruin a meal, and that provide long-lasting energy. Longer term, there is an opportunity to develop a “healthy snack” market targeted toward Hispanics, since this healthier-snack market does not exist to the extent that it does in the general market. Dairy has perfect products for that context. In addition, Hispanics tend to eat more of their snack foods away from home than at home. This is also true of their cheese snacking. About one-quarter of Hispanic cheese snacking is on traditional, Hispanic-style cheeses (e.g. Queso Fresco, Ranchero, Blanco). These are typically sold in larger packages that have shorter shelf lives. There may be an opportunity to package some of these cheeses in more convenient, single-serving, and/or portable formats. Hispanics view yogurt as a fresh and natural start to the day, yet about one-third of the yogurt volume they eat is a sweet, fun treat. Yogurt’s ability to deliver protein and authentic ingredients should appeal to Hispanics and, therefore, may have the potential to be expanded as an option in the morning. In addition, a rich, flavorful yogurt could compete even more strongly with other sweet, fun treats.
20 Less acculturated Hispanics:
o At least 2 years in the U.S. but less than 10 o Speak Spanish all the time or speak Spanish more than English at home and at work o Must describe themselves as being either:
Hispanic, not American or Hispanic first, American second
Moderately acculturated Hispanics: o Between 11 and 15 years in the U.S. o Speak Spanish as much as English at home and at work o Must describe themselves as being Hispanic and American equally o Watch a minimum of 10 hours of Spanish TV weekly, listen to a minimum of 5 hours of Spanish radio o A mix of countries of origin, with about half being Mexican
21 Nuvista Strategies, Inc., Snack Market Structure, November 2009.
40
Ice cream consumption is lower among Hispanics than among the general market. They are less likely to consider it as an option for when they want treats. Emphasis of ice cream’s fresh or natural perceptions and that it contains milk and calcium could be appealing to Hispanics. Smoothies are less popular among Hispanics but have good growth potential because the use of drinks as a snack is overdeveloped with Hispanics compared to the general market. Hispanic Kids & Snacking Hispanic moms were observed as not trying very hard to keep snack foods out of the house, but they do exercise portion control and may veto snacking on treats immediately before a meal. Mom is not overly concerned about kids snacking on treats, as long as it is not immediately before a meal, since the nutrition provided by the main meal is perceived to compensate for any nutritional deficiencies of a treat. Fresh, natural snacks, such as fruits, vegetables, and cheese, are preferred, since they are perceived to be healthier and more quality-filled. However, lifestyle changes and kid requests are driving convenience snacks to become a significant part of the Hispanic snacking repertoire as Hispanics acculturate.