snapshot 2012: maine workers with disabilities · web viewfewer than half of adults with...
TRANSCRIPT


Cover photographs include models, and are used for illustrative purposes only.The State of Maine provides equal opportunity in employment and programs. Auxiliary aids and services are available to individuals with disabilities on request. This document is available on the Internet at: http://www.maine.gov/labor/cwri/pubs.html

Alternative formats are also available upon request by calling (207) 623-6799.TTY: Maine Relay 711

SnapShot 2012:Maine Workers with Disabilities i
i Printed under a Federal Grant to Maine DHHS by the Centers for Medicare and Medicaid Services/DHHS/grant 1QACMS030316 January, 2012

[This page left intentionally blank.]

Table of Contents
Introduction..................................................................................................1Data Sources.............................................................................................2
Economic Conditions and Employment........................................................3Persons with Disabilities in Maine.................................................................4
Distribution by Age and Geography..........................................................4Working-age Adults with Disabilities............................................................6
Disability Characteristics...........................................................................6Employment and Unemployment..............................................................7Type of Employment.................................................................................8The Effect of the Recession.......................................................................8
Indicators of Economic Well-being................................................................9Educational Attainment.............................................................................9Earnings from Work.................................................................................10Poverty Status of Working-age Adults.....................................................10Health Insurance Coverage.....................................................................11
Supports and Services................................................................................13Income Supports......................................................................................13Employment Services..............................................................................15
Appendix I - American Community Survey Disability Definition.................19Appendix II - End Notes..............................................................................21
Snapshot 2012 Maine Workers with Disabilities |
Tables and Charts
Chart 1. Maine Nonfarm Jobs and Unemployment Rate 2008 to 2011.........3Chart 2. Age Distribution of Maine Residents with Disabilities.....................4Table 1. Percent of Residents with a Disability by County, 2008 to 2010.. . .5Chart 3. Maine Working Adults by Disability Type........................................6Chart 4. Labor Force Participation and Unemployment Rate, Maine and United States................................................................................................7Chart 5. Percent Employed Full-time Year-round.........................................8Chart 6. Educational Attainment by Disability Status...................................9Chart 7. Distribution of Workers by Earned Income and Disability Status, Maine and United States............................................................................10Chart 8. Poverty by Disability Status, Maine and United States.................11Chart 9. Poverty Among Working Adults, Maine and United States............11Chart 10. Health Insurance Coverage by Disability Status, Maine and United States..............................................................................................12Chart 11. Overlap Between SSI and SSDI programs, Maine 2010..............13Chart 12. SSDI Recipients, Maine 2002 to 2010.........................................14Chart 13. SSI Recipients, Maine and United States, 2002 to 2010.............15Chart 14. One-Stop CareerCenter Job Seekers with Disabilities.................16Chart 15. Maine Bureau of Rehabilitation Services Outcomes, 2002 to 2011...................................................................................................................17Chart 16. Average Annual Enrollment, MaineCare for Workers with Disabilities..................................................................................................17
| Snapshot 2012 Maine Workers with Disabilities

Introduction
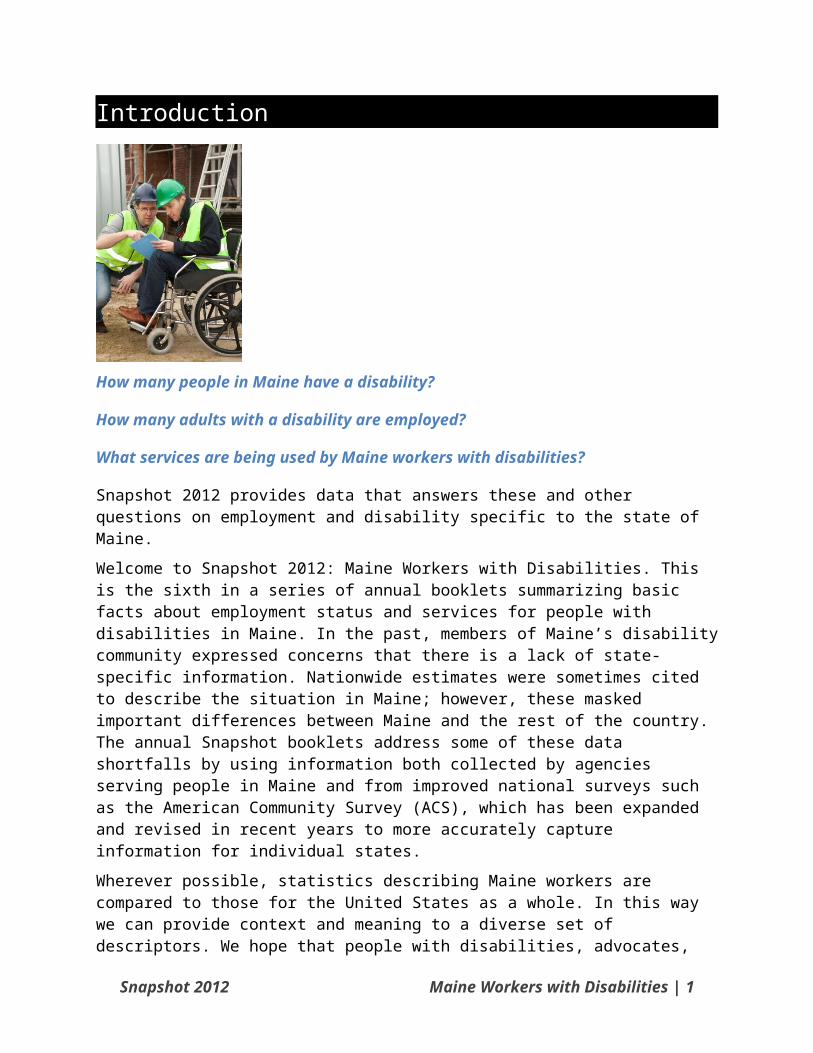
How many people in Maine have a disability?
How many adults with a disability are employed?
What services are being used by Maine workers with disabilities?
Snapshot 2012 provides data that answers these and other questions on employment and disability specific to the state of Maine.Welcome to Snapshot 2012: Maine Workers with Disabilities. This is the sixth in a series of annual booklets summarizing basic facts about employment status and services for people with disabilities in Maine. In the past, members of Maine’s disability community expressed concerns that there is a lack of state-specific information. Nationwide estimates were sometimes cited to describe the situation in Maine; however, these masked important differences between Maine and the rest of the country. The annual Snapshot booklets address some of these data shortfalls by using information both collected by agencies serving people in Maine and from improved national surveys such as the American Community Survey (ACS), which has been expanded and revised in recent years to more accurately capture information for individual states.Wherever possible, statistics describing Maine workers are compared to those for the United States as a whole. In this way we can provide context and meaning to a diverse set of descriptors. We hope that people with disabilities, advocates, policymakers, employers and other stakeholders will find the information useful.Snapshot 2012 provides multiple views of a population that is defined and measured in different ways, depending on the data source. Since each source has a distinct constituency, target population and methodology, the data produced is not necessarily comparable.1 The intent of Snapshot 2012 is to describe rather than explain.
Snapshot 2012 Maine Workers with Disabilities | 1
Data SourcesData for Snapshot 2012 are derived from multiple primary and secondary sources. The primary source for descriptive characteristics is the American Community Survey (ACS) conducted by the U.S. Census Bureau, accessed from the Census Bureau’s American Factfinder portal or from Integrated Public Use Microdata Series (IPUMS-USA)2. Three-year 2008–2010 ACS estimates are employed unless otherwise noted. ACS data is sample based and subject to sampling variability.In 2008, the ACS revised the criteria by which disability status is identified. The ACS uses six questions to identify persons with disabilities. A response of “yes” to any one of the questions – specifying difficulties with vision, hearing, cognitive, ambulatory, self-care, and independent living – indicates that the person in question has a disability. Respondents may specify more than one disabling condition.Data on public programs that serve and assist workers with disabilities are derived from state and federal reports. A secondary source of program data is StateData.info, a project of the Institute for Community Inclusion at UMass Boston. For each section, the latest data available is reported.Some data reported in Snapshot 2012 are based on sources that rely on self-disclosure of disability. Self-identification may overstate or understate the incidence of disability, depending on many factors that influence whether an individual identifies him- or herself as disabled. Sources reliant on self-identification are the ACS and One-Stop CareerCenters.
| Snapshot 2012 Maine Workers with Disabilities

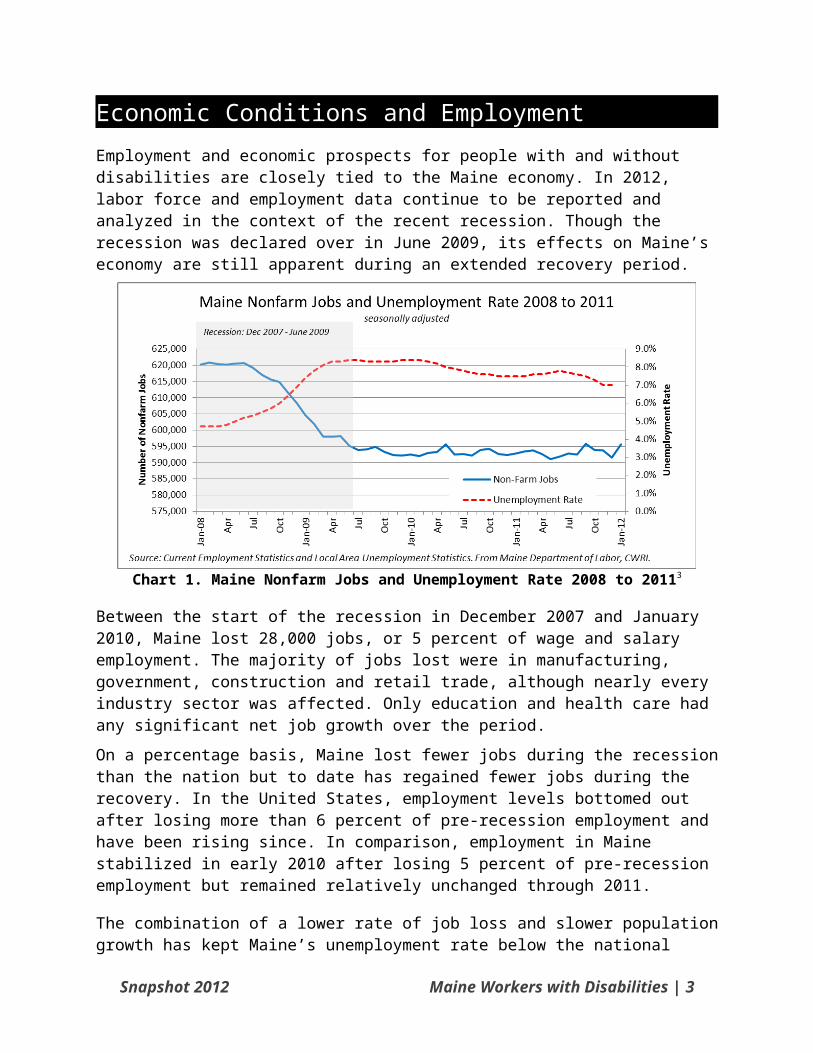
Economic Conditions and EmploymentEmployment and economic prospects for people with and without disabilities are closely tied to the Maine economy. In 2012, labor force and employment data continue to be reported and analyzed in the context of the recent recession. Though the recession was declared over in June 2009, its effects on Maine’s economy are still apparent during an extended recovery period.
Chart 1. Maine Nonfarm Jobs and Unemployment Rate 2008 to 20113
Between the start of the recession in December 2007 and January 2010, Maine lost 28,000 jobs, or 5 percent of wage and salary employment. The majority of jobs lost were in manufacturing, government, construction and retail trade, although nearly every industry sector was affected. Only education and health care had any significant net job growth over the period.On a percentage basis, Maine lost fewer jobs during the recession than the nation but to date has regained fewer jobs during the recovery. In the United States, employment levels bottomed out after losing more than 6 percent of pre-recession employment and have been rising since. In comparison, employment in Maine stabilized in early 2010 after losing 5 percent of pre-recession employment but remained relatively unchanged through 2011.
The combination of a lower rate of job loss and slower population growth has kept Maine’s unemployment rate below the national average since 2008. The recent trend shows a gradual decrease in the unemployment rate, attributable in part to people leaving the labor force. Data from the American Community Survey (ACS) show that a disproportionate share of Maine workers with disabilities left the labor force between 2008 and 2010.
Snapshot 2012 Maine Workers with Disabilities | 3
Persons with Disabilities in MaineFrom 2008 through 2010, an average of 206,400 persons with one or more disabilities resided in Maine, equal to 16 percent of its civilian non-institutionalized population of 1.3 million. This proportion was higher than that of the United States, where an estimated 12 percent of residents had a disability.4
A number of factors influence or contribute to rates of disability in the general population; these include general health, social environment, economic conditions, demographic trends, environmental factors, social mores and financial incentives.5 Another likely factor is the number of Maine residents who are veterans. In 2011, Maine had the fourth-highest percentage of veterans in the nation. Recent data indicates that, on average, the rate of disability among veterans is higher than among non-veterans. 6
Distribution by Age and GeographyDistribution of resident population with disabilities by age group is nearly identical in Maine and the nation, in spite of Maine’s older population. More than half of people with disabilities are of working age, between ages 18 and 64.
Chart 2. Age Distribution of Maine Residents with Disabilities.
| Snapshot 2012 Maine Workers with Disabilities

Within Maine, the highest shares of residents with disabilities are in Washington, Aroostook and Somerset counties.
Geographic Area Number of Residents with Disabilities
Maine 16%Androscoggin County 16%Aroostook County 22%Cumberland County 12%Franklin County 17%Hancock County 16%Kennebec County 17%Knox County 18%Lincoln County 16%Oxford County 18%Penobscot County 17%Sagadahoc County 14%Somerset County 20%Waldo County 18%Washington County 23%York County 14%
Table 1. Percent of Residents with a Disability by County, 2008 to 2010.7
Snapshot 2012 Maine Workers with Disabilities | 5

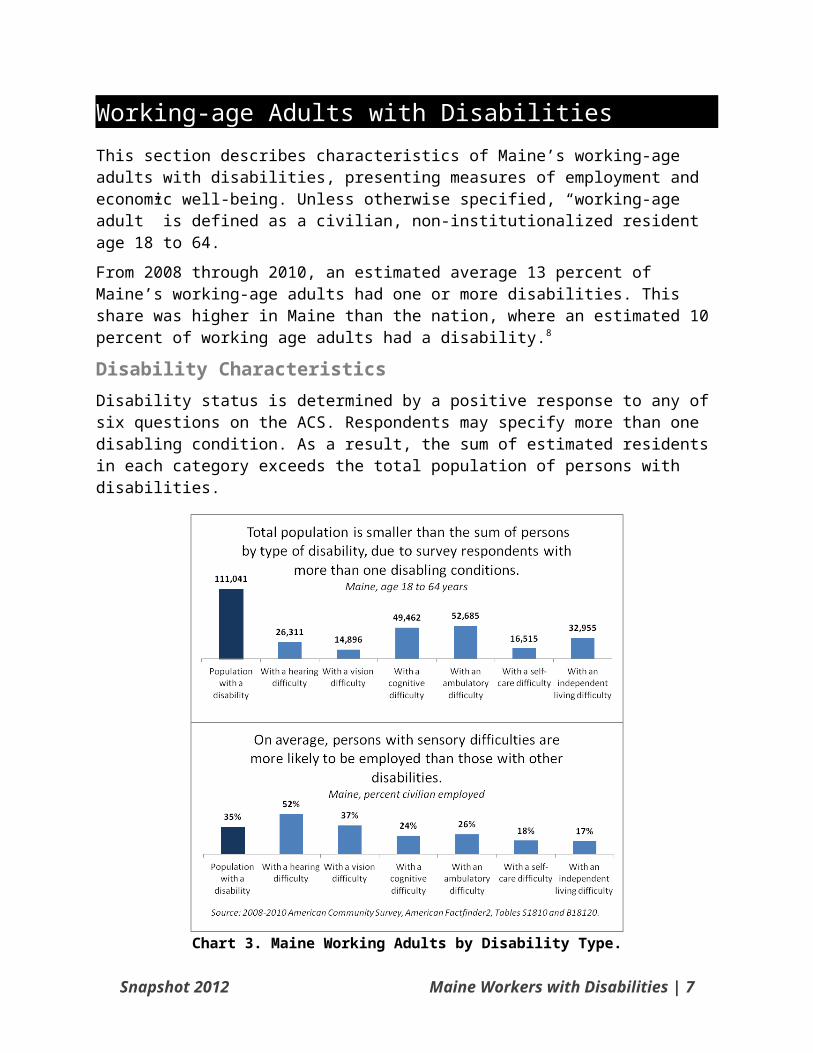
Working-age Adults with DisabilitiesThis section describes characteristics of Maine’s working-age adults with disabilities, presenting measures of employment and economic well-being. Unless otherwise specified, “working-age adult” is defined as a civilian, non-institutionalized resident age 18 to 64.From 2008 through 2010, an estimated average 13 percent of Maine’s working-age adults had one or more disabilities. This share was higher in Maine than the nation, where an estimated 10 percent of working age adults had a disability.8
Disability CharacteristicsDisability status is determined by a positive response to any of six questions on the ACS. Respondents may specify more than one disabling condition. As a result, the sum of estimated residents in each category exceeds the total population of persons with disabilities.
Chart 3. Maine Working Adults by Disability Type.
| Snapshot 2012 Maine Workers with Disabilities

Employment and UnemploymentAdults with disabilities are less likely to be employed than adults with no disability. On average, 35 percent of working-age Mainers with disabilities were employed from 2008 through 2010, compared to 79 percent of those with no disability. Yet, the majority of adults with disabilities does not work or seek work. By definition, these individuals are not in the labor force. The labor force consists of both people who work and those who are not working but available and actively seeking work. People who are without a job but not seeking work are not counted as unemployed and are not included in the labor force count. Labor force participation rate is the percentage of population in the labor force. Among working-age adults with disabilities, labor force participation is comparatively low.
Chart 4. Labor Force Participation and Unemployment Rate, Maine and United States.
From 2008 through 2010, working-age adults with disabilities were about half as likely to work or seek work as adults with no disability. In Maine, the adults with disabilities labor force averaged 45,300, or 40 percent of the population—slightly below the national rate of 42 percent. At the same time, average unemployment among Mainers with disabilities was 17 percent compared to 6 percent among Mainers with no disability.
Snapshot 2012 Maine Workers with Disabilities | 7
Type of EmploymentThe type of jobs held by workers with disabilities also sets them apart from other workers. On average, from 2008 through 2010, 45 percent of workers with disabilities held full-time, year round jobs, compared to 62 percent of employed workers with no disability.
Chart 5. Percent Employed Full-time Year-round.
The Effect of the RecessionThree-year ACS estimates from 2008 through 2010 document low rates of labor force participation and high rates of unemployment among workers with disabilities. Within that time frame, research based on national Current Population Statistics (CPS) data indicates that the recession had a disproportionate effect on workers with disabilities.9 Between October 2008 and June 2010, the percentage of working-age adults with disabilities who were employed fell 12 percent, compared to a 3 percent drop in working-age adults without disabilities. During this time there was a 3 percent decline in labor force participation among workers with disabilities, while participation rates among workers with no disability registered no statistically significant change10.Comparison of one-year ACS estimates from 2008 and 2010 suggest that the effect of the recession on Maine workers with disabilities was similarly amplified. The share of adults with disabilities who were employed fell an estimated 10 percentage points between 2008 and 2010; labor force participation also dropped 10 percentage points. In contrast, the share of adults with no disability who were employed decreased by one percentage point and labor force participation was unchanged.11 In other words, workers with disabilities lost jobs at a higher rate than other workers and, once without a job, were far less likely to seek work.In a May 2012 Bloomberg News report on the increase in Social Security Disability Insurance (SSDI) claimants during and following the recession, Virginia Reno of the National Academy of Social Insurance explains,
| Snapshot 2012 Maine Workers with Disabilities

“Impediments to work are compounded for people with disabilities when the economy turns sour and there are simply fewer jobs and greater competition for the jobs that remain.”12 The article reports that the increase in disability recipients may account for as much as one-fourth of the drop in the U.S. labor force participation rate between 2007 and 2012.
Indicators of Economic Well-beingThis section looks at educational attainment, earnings from work, poverty rate and health insurance coverage. Education is positively associated with both employment and earnings. Earnings, the principle reason that people work, are a primary indicator of economic well-being. Employment also can provide access to health insurance, a benefit that can substantially impact economic well-being.
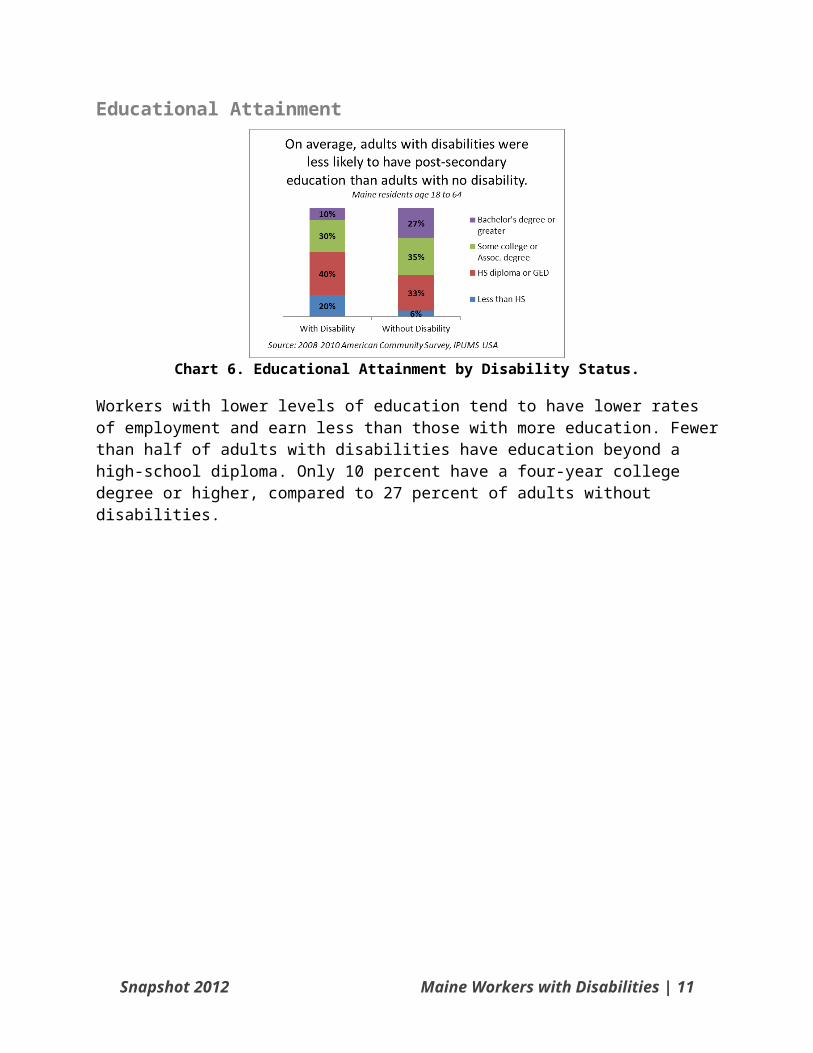
Educational Attainment
Chart 6. Educational Attainment by Disability Status.
Workers with lower levels of education tend to have lower rates of employment and earn less than those with more education. Fewer than half of adults with disabilities have education beyond a high-school diploma. Only 10 percent have a four-year college degree or higher, compared to 27 percent of adults without disabilities.
Snapshot 2012 Maine Workers with Disabilities | 9

Earnings from WorkWorkers with disabilities tend to earn less than those with no disability. Income disparity is affected by factors including type of job and educational attainment (Charts 5 and 6).
Chart 7. Distribution of Workers by Earned Income and Disability Status, Maine and United States.
On average, from 2008 through 2010, more than half of Maine workers with disabilities earned less than $25,000 in twelve months,13 whereas most workers with no disability earned more than $25,000. Compared to the nation, the distribution of workers with disabilities by income level shows a larger share in Maine with earnings below $25,000 and a smaller share with earnings over $50,000: 13 percent (Maine) compared to 20 percent (United States).
Poverty Status of Working-age AdultsIncome thresholds used by the Census Bureau determine poverty status for statistical use. The thresholds are based on income received during the twelve months prior to surveying and vary according to family size and composition.14 For these purposes, individuals with family income below the federal poverty threshold (FPT) are termed “in poverty,” and those with family income between 100 and 199 percent of the poverty threshold are “near poverty.”From 2008 through 2010, on average, more than one quarter of working-age adults with a disability lived in poverty. Another quarter lived near poverty. In Maine, adults with disabilities were nearly three times as likely to live in poverty as those with no disability and more than twice as likely to be poor or near poor.
| Snapshot 2012 Maine Workers with Disabilities

Chart 8. Poverty by Disability Status, Maine and United States.
Among employed adults, rates of poverty and near poverty were lower overall, and the differences between those with and without disability were smaller. Still, one in three Maine workers with a disability lived in or near poverty compared to one in five workers with no disability.
Chart 9. Poverty Among Working Adults, Maine and United States.
Health Insurance Coverage15
Health insurance coverage can have a profound impact on economic well-being by providing affordable access to comprehensive health-care services. For reporting purposes, the Census Bureau broadly classifies health insurance coverage as private health insurance or public coverage. Private health insurance is a plan provided through an employer or union, a plan purchased by an individual from a private company or TRICARE or other military health care.Public health coverage includes the federal programs Medicare, Medicaid and VA Health Care (provided through the Department of Veterans Affairs); the Children’s Health Insurance Program (CHIP); and individual state health
Snapshot 2012 Maine Workers with Disabilities | 11
plans. Health insurance plans are not mutually exclusive; people may be covered by more than one type of plan at the same time. 16
In Maine, the share of adults with any type of health insurance is six to seven percentage points higher than the nation, regardless of disability status. Adults with disabilities are far less likely to have private insurance, however, and the share in Maine of those who do (39 percent) is smaller than in the nation as a whole (45 percent).
Chart 10. Health Insurance Coverage by Disability Status, Maine and United States.
| Snapshot 2012 Maine Workers with Disabilities

Supports and Services Income SupportsPeople with disabilities and their families may receive income support from two programs administered by the U.S. Social Security Administration (SSA): Social Security Disability Insurance (SSDI) and Supplemental Security Income (SSI). To be eligible for disability benefits under SSI or SSDI, a person must be unable to engage in substantial gainful employment (SGA is a monthly earnings threshold determined annually by the SSA).17 In 2010, SGA for SSI and non-blind SSDI recipients was $1,000.In 2010, the share of Maine residents receiving worker disability benefits from SSDI or SSI was nearly 9 percent of resident population age 18 to 64, compared to about 6 percent nationally.
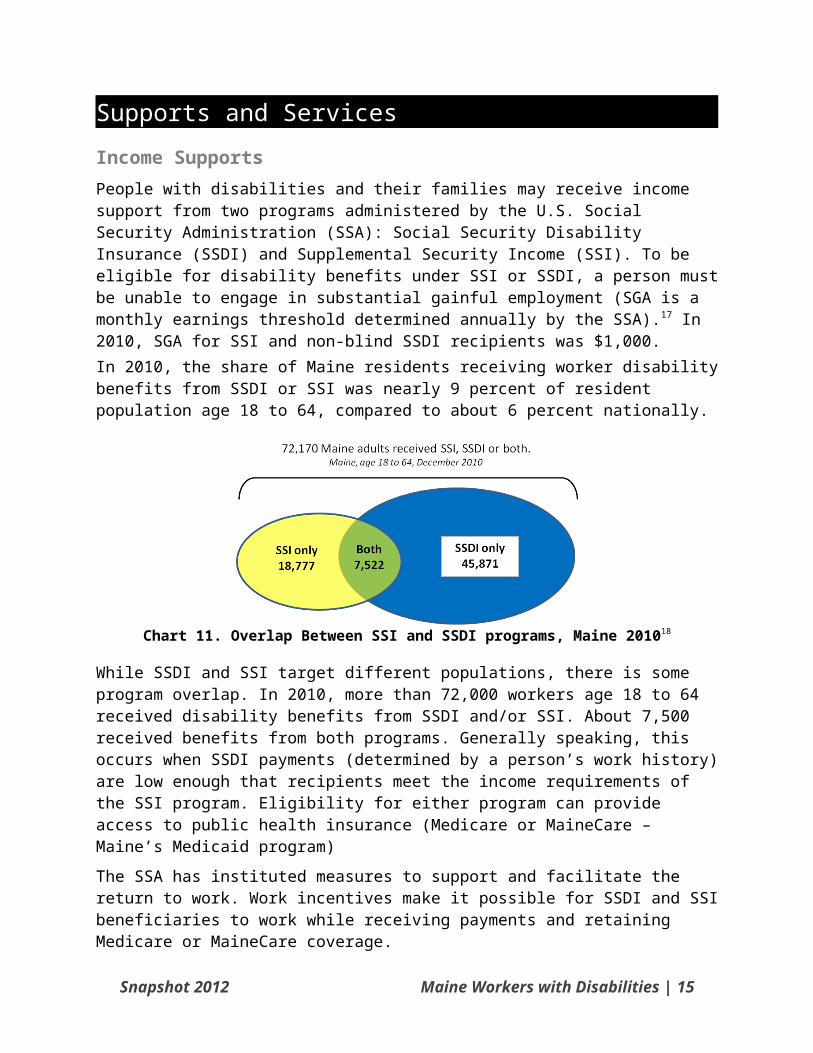
Chart 11. Overlap Between SSI and SSDI programs, Maine 201018
While SSDI and SSI target different populations, there is some program overlap. In 2010, more than 72,000 workers age 18 to 64 received disability benefits from SSDI and/or SSI. About 7,500 received benefits from both programs. Generally speaking, this occurs when SSDI payments (determined by a person’s work history) are low enough that recipients meet the income requirements of the SSI program. Eligibility for either program can provide access to public health insurance (Medicare or MaineCare – Maine’s Medicaid program)The SSA has instituted measures to support and facilitate the return to work. Work incentives make it possible for SSDI and SSI beneficiaries to work while receiving payments and retaining Medicare or MaineCare coverage.
Snapshot 2012 Maine Workers with Disabilities | 13

Social Security Disability Insurance (SSDI)SSDI provides cash support to workers who become blind or disabled before reaching retirement age.19 Participation and payment amount is determined by a worker’s history of contributions into the Social Security system.The number of disabled adult workers receiving SSDI in Maine and the United States increased 60 percent between 2000 and 2010. In Maine, the number rose from 34,700 in 2000 to 55,525 in 2010. Maine has a relatively large share of residents receiving disabled worker benefits: in 2010, it was 4 percent of total population compared to 3 percent nationally. Percentages in other states ranged from a low of 1.5 percent population (Utah) to a high of 5 percent (West Virginia).
Chart 12. SSDI Recipients, Maine 2002 to 2010
The SSA tracks and reports the number of SSDI recipients whose benefits are withheld because of substantial work or terminated upon successful return to work. These numbers represent a small fraction of disabled workers. In 2010, 265 Maine workers had benefits withheld and 272 had benefits terminated.While the number of workers receiving SSDI is trending up, the numbers of recipients with benefits either withheld or terminated show no clear trend. As a percentage of SSDI recipients, Maine workers whose benefits were withheld or terminated decreased from 1.4 percent in 2002 to 1 percent in 2010; nationally, the percentage decreased from 1.1 percent in 2002 to 0.9 percent in 2010.
Supplemental Security Income (SSI)The Supplemental Security Income (SSI) program is needs-based, targeting aged, blind and disabled people with low income and limited resources, with or without prior work history.Since 2002, the number of SSI recipients increased about 20 percent while the percentage of recipients who work has trended down. In 2010, about
| Snapshot 2012 Maine Workers with Disabilities

34,000 Mainers received SSI.20 Of those, 1,900 or 5.5 percent worked. Percentages in other states ranged from a high of 17 percent who worked (North Dakota) to a low of 2 percent (Alabama).21
Chart 13. SSI Recipients, Maine and United States, 2002 to 2010.
Employment ServicesMaine has multiple programs and agencies that help people with disabilities prepare for work, find a job and facilitate the return to work.
One-Stop CareerCentersCreated and funded by the Workforce Investment Act of 1998 (WIA), Maine’s workforce system features a network of twelve One-Stop CareerCenters providing services to employers and job seekers.Adult and Dislocated Workers ProgramProgram outcomes for the Adult and Dislocated Workers program are expressed as a percentage of participants who have exited from the program.22 Though Maine’s numbers are relatively small, in 2010, Maine reported a larger share of individuals with disabilities exiting the program than the nation as a whole: 7 to 11 percent of adults and 5 to 6 percent of dislocated workers who exited were individuals with disabilities. Nationally, individuals with disabilities comprised less than 4 percent of either the adult or dislocated worker populations exiting the program.Maine’s outcomes among program participants with disabilities are mixed compared to the nation.23
47 of 65 Maine adult and dislocated workers with disabilities entered employment after exiting the program, or 72 percent compared to 39 percent in the United States.
84 percent of Maine participants with disabilities remained employed for nine months after exiting compared to 74 percent nationally.
Snapshot 2012 Maine Workers with Disabilities | 15
Average earnings after exiting were lower in Maine than the nation, and there was a larger gap between the average for all who exited and the average for those with a disability – a difference of $4,129 or 28 percent in Maine compared to $3,199 or 21 percent in the United States.
Attainment of a Credential – About 43 percent of adults and dislocated workers with disabilities in Maine entered employment with a credential compared to an average of 63 percent among thirteen states or territories reporting outcomes for this measure.24
Job Seeker Services funded by the Wagner-Peyser ActMore than 3,300 job seekers with disabilities received employment services at Maine’s One-Stop CareerCenters, trending down slightly since 2008. As a percentage of total registered job seekers, that number represents 3.2 percent, slightly higher than the national rate of 2.8 percent and relatively unchanged since 2008.
Chart 14. One-Stop CareerCenter Job Seekers with Disabilities
Maine Job BankThe Maine Job Bank is an online job posting service managed by the Maine Department of Labor serving job seekers and employers. In April 2012, the Job Bank recorded nearly 23,000 active job seeker accounts. More than 1,500 accounts belonged to individuals who indicated they had a disability, accounting for 7 percent of job seekers registered with the Job Bank.
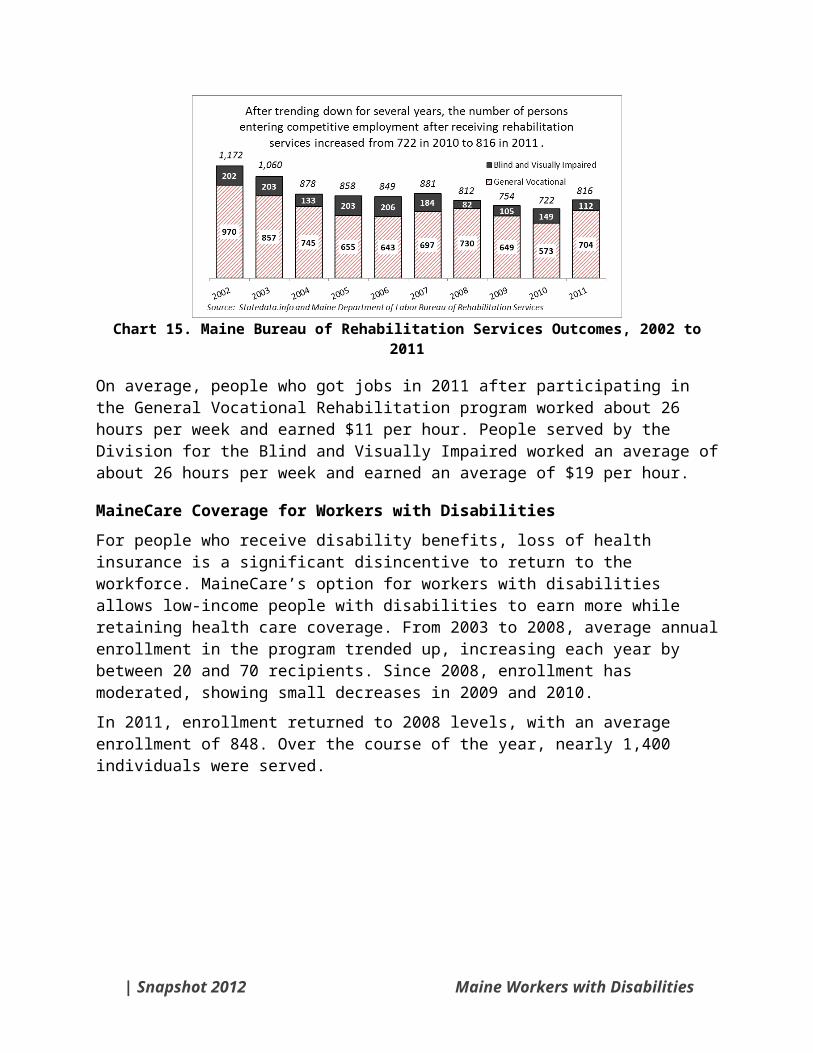
Bureau of Rehabilitation ServicesThe Bureau of Rehabilitation Services (BRS), a division of the Maine Department of Labor, provides a variety of services to help people with severe disabilities get or keep a job. These services include job development and placement, job training and rehabilitation technology. In fiscal year 2011, 816 people with significant disabilities entered competitive employment and stayed employed for a minimum of 90 days after receiving
| Snapshot 2012 Maine Workers with Disabilities

BRS services. Of those, 704 were served by the General Vocational Rehabilitation program and 112 were served by the Division for the Blind and Visually Impaired.
Chart 15. Maine Bureau of Rehabilitation Services Outcomes, 2002 to 2011
On average, people who got jobs in 2011 after participating in the General Vocational Rehabilitation program worked about 26 hours per week and earned $11 per hour. People served by the Division for the Blind and Visually Impaired worked an average of about 26 hours per week and earned an average of $19 per hour.
MaineCare Coverage for Workers with DisabilitiesFor people who receive disability benefits, loss of health insurance is a significant disincentive to return to the workforce. MaineCare’s option for workers with disabilities allows low-income people with disabilities to earn more while retaining health care coverage. From 2003 to 2008, average annual enrollment in the program trended up, increasing each year by between 20 and 70 recipients. Since 2008, enrollment has moderated, showing small decreases in 2009 and 2010.In 2011, enrollment returned to 2008 levels, with an average enrollment of 848. Over the course of the year, nearly 1,400 individuals were served.
Snapshot 2012 Maine Workers with Disabilities | 17
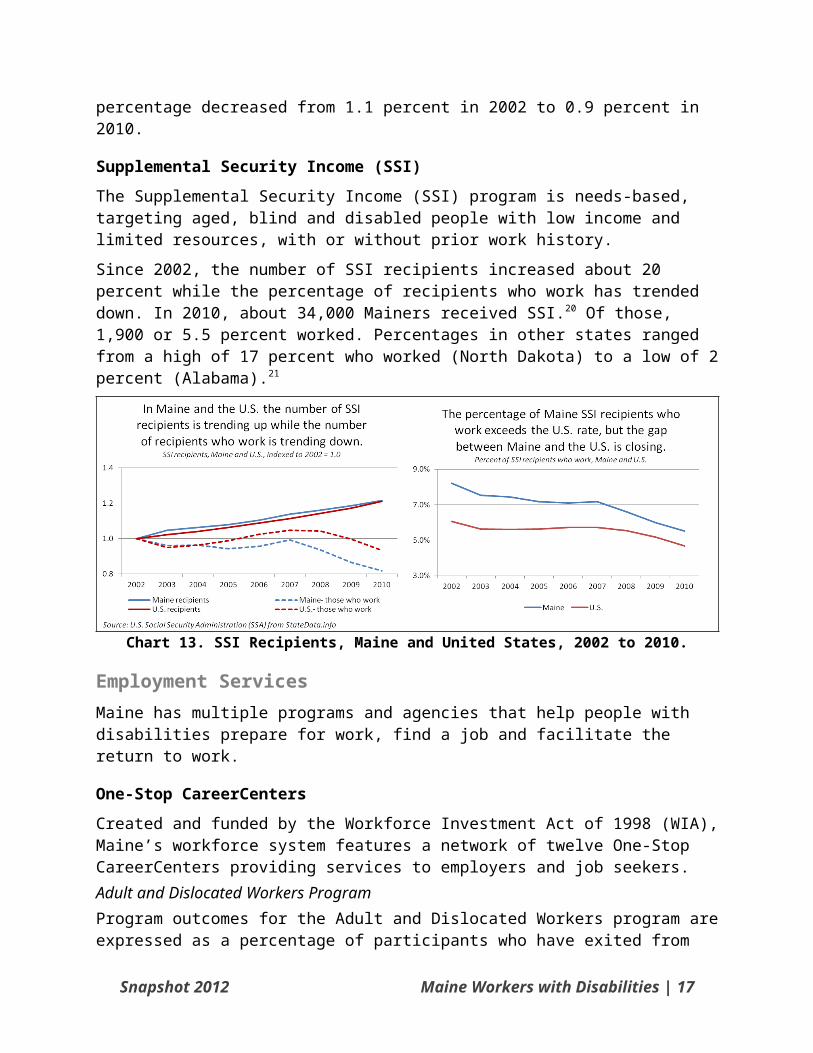
Chart 16. Average Annual Enrollment, MaineCare for Workers with Disabilities
Other Support ServicesThe Maine Department of Health and Human Services (DHHS) provides employment support services to individuals served by the Office of Adults with Cognitive and Physical Disabilities and the Office of Adult Mental Health Services and to their employers. In addition, DHHS and MDOL collaborate on joint initiatives. Recent and on-going collaborations include a comprehensive website, www.employmentforme.org, shared workforce development, and targeted employer outreach.
| Snapshot 2012 Maine Workers with Disabilities
Appendix I - American Community Survey Disability DefinitionThe U.S. Census Bureau defines a disability as: “the restriction in participation that results from a lack of fit between the individual’s functional limitations and the characteristics of the physical and social environment.” Using this definition as a framework, the 2008 American Community Survey identifies serious difficulty in four basic areas of functioning: vision, hearing, ambulation, and cognition. The ACS also includes two questions to identify people who have difficulties that might impact their ability to live independently. The six different types of disability are identified using the six questions outlined below. People aged 16 to 64 are classified as having a disability if they report having serious difficulty in at least one of these areas.25
The Census Bureau changed the measurement of disability in the 2008 ACS, preventing comparison to earlier years. The most notable change to the 2008 disability measure includes the separation of the “sensory disability” question into two separate questions designed to measure hearing and vision difficulties. Also, the measure for employment disability was dropped altogether from the 2008 ACS because several studies had found that respondents had difficulty understanding the intended meaning.26
Maine Workers with Disabilities ♦ 19

2008 to 2010 American Community Surveys
2003 to 2007 American Community Surveys
Census Term
Question Census Term
Question
Hearing difficulty
Is this person deaf or does he/she have serious difficulty hearing?
Sensory disability
Does this person have any of the following long-lasting conditions: Blindness, deafness, or a severe vision or hearing impairment?
Vision difficulty
Is this person blind or does he/she have serious difficulty seeing even when wearing glasses?
N/A Hearing and vision questions were not separated in 2003-2007 ACS
Ambulatory difficulty
Does this person have serious difficulty walking or climbing stairs?
Physical disability
A condition that substantially limits one or more basic physical activities such as walking, climbing stairs, reaching, lifting, or carrying?
Cognitive difficulty
Because of a physical, mental or emotional condition, does this person have serious difficulty concentrating, remembering, or making decisions?
Mental disability
Because of a physical, mental, or emotional condition lasting six months or more, does this person have any difficulty in doing any of the following activities: Learning, remembering, or concentrating?
Self-care difficulty
Does this person have serious difficulty dressing or bathing?
Self-care disability
Dressing, bathing, or getting around inside the home?
Independent living difficulty
Because of a physical, mental, or emotional condition, does this person have difficulty doing errands alone such as visiting a
Go-outside-the-home disability
Because of a physical, mental, or emotional condition lasting six months or more, does this person have any difficulty in doing any of
| Snapshot 2012 Maine Workers with Disabilities
Source: Brault, Matthew (September 2009). Review of Changes to the Measurement of Disability in the 2008 American Community Survey. U.S. Census Bureau. www.census.gov/hhes/www/disability/2008ACS_disability.pdf
Maine Workers with Disabilities ♦ 21

Appendix II - End Notes
22 ♦ Snapshot 2012
1 Placement rates and program outcomes vary according to many factors, including mission, budget and data collection process, that preclude direct comparison.2 Steven Ruggles, J. Trent Alexander, Katie Genadek, Ronald Goeken, Matthew B. Schroeder, and Matthew Sobek. Integrated Public Use Microdata Series: Version 5.0 [Machine-readable database]. Minneapolis: University of Minnesota, 2010.3 Local Area Unemployment Statistics data found at http://www.maine.gov/labor/cwri/laus1.html and Current Employment Statistics data found at http://www.maine.gov/labor/cwri/ces1.html, accessed 2/22/2012.4 Source: U.S. Census Bureau, 2008–2010 American Community Survey, American FactFinder, Table S1810, Maine;< http://factfinder2.census.gov>, accessed 2/1/2012.5 Adapted from “Population Factors Influencing Program Size,” Trends in the Social Security and Supplemental Security Income Disability Programs, U.S. Social Security Administration Office of Policy. Found at http://www.ssa.gov/policy/docs/chartbooks/disability_trends/sect03.html on 6/5/2012.6 Labor Market Activities of Maine Veterans, Maine Department of Labor, Center for Workforce Research and Information, March 2012. Found at http://www.maine.gov/labor/cwri/publications/Word/MaineVeterans2011.doc on 6/15/2012.7 Source: U.S. Census Bureau, 2008–2010 ACS, American FactFinder, Table GCT1810. Piscataquis County data not available due to small sample size.8 2008–2010 American Community Survey, extracted from Integrated Public Use Microdata Series: Version 5 (IPUMS-USA). See note 1 for IPUMS-USA citation. 9 Kaye, H. Stephen, The Impact of the 2007–2009 Recession on Workers with Disabilities, Monthly Labor Review, October 2010, pp. 19–30.10 Kaye, p. 22.11 2008 and 2010 American Community Surveys, extracted from Integrated Public Use Microdata Series: Version 5 (IPUMS-USA). See note 1 for IPUMS citation.12 Kowalski, Alex, “Disabled Americans Shrink Size of U.S. Labor Force,” Bloomberg News, posted on May 3, 2012, Found at http://www.businessweek.com/news/2012-05-03/disabled-americans-shrink-size-of-u-dot-s-dot-labor-force#p1 on 5/3/2012.13 Earned income is reported for the twelve months prior to the date of survey.14 For example, the 2010 U.S. Census Bureau poverty threshold for a single-person household was $11,344 for a person under 65 years of age and was $22,113 for a family of four with two children under 18 years. Found at http://www.census.gov/hhes/www/cpstables/032011/pov/new35_000.htm on 3/27/2012.15The ACS and other Census Bureau surveys’ definition of health insurance coverage includes plans and programs that provide comprehensive health coverage. Plans that provide insurance for specific conditions or situations such as cancer and long-term care policies are not considered coverage. Likewise, other types of insurance like dental, vision, life and disability insurance are not considered health insurance coverage. From page 69 of “ACS Subject Definitions” found at http://www.census.gov/acs/www/Downloads/data_documentation/SubjectDefinitions/2010_ACSSubjectDefinitions.pdf on 5/16/2012.16 From page 69 of “ACS Subject Definitions” found at http://www.census.gov/acs/www/Downloads/data_documentation/SubjectDefinitions/2010_ACSSubjectDefinitions.pdf on 5/16/2012.17 From “Substantial Gainful Activity” found at SocialSecurityOnline http://www.ssa.gov/oact/COLA/sga.html on 3/27/2012.18 Compiled and calculated by the Center for Workforce Research and Information. Data source: Social Security Administration, SSI Annual Statistical Report, 2010, Table 66 and SSDI Annual Statistical Report, 2010, Tables 17 and 38. 19 SSDI also makes payments to eligible spouses and children of disabled workers. The statistics employed here are for disabled workers only. Of 55,525 Maine workers receiving SSDI disability benefits in 2010, 53,393, or 96 percent, were between the ages of 18 and 64.20 SSI enrollment numbers include persons under age 18 and over age 65. In 2010, of Maine’s total count of 34,000, about 3,900 recipients were under age 18 and 3,800 were over age 65. Twenty-six thousand three hundred, or 77 percent, were between 18 and 64.

21 Domin, D. and Smith, F.A. (2011). SSI Recipients Who Work, Data Note Series, Data Note 36. Boston, MA. University of Massachusetts Boston, Institute for Community Inclusion. 22 For federal reporting purposes, customers served by the Adult and Dislocated worker programs are only counted after they have “exited,” meaning the customer has not received services within the past 90 days as of the end of the year or self-reported that they are exiting. As a result, these figures do not represent current participation. They do not include current customers, customers who received services within 90 days of the end of the program year (June 30) or who have future services scheduled.23 Outcomes for adults and dislocated workers are reported separately by states and for the nation. The populations are combined in the following section for comparison purposes.24 Participating states and territories in 2010 were: Alaska, Arizona, Connecticut, Georgia, Hawaii, Iowa, Massachusetts, Maine, Michigan, Minnesota, Puerto Rico, Rhode Island, and Vermont.25 U.S. Census Bureau, American Community Survey Office. 2008 Subject Definitions. www.census.gov/acs/www/UseData/Def.htm . Retrieved February 5, 2010.26 Brault, Matthew (September 2009). Review of Changes to the Measurement of Disability in the 2008 American Community Survey. U.S. Census Bureau. www.census.gov/hhes/www/disability/2008ACS_disability.pdf Retrieved December 29, 2009.