snapshot of the spanish chemical sector 2021
TRANSCRIPT

2021
Radiografíadel Sector Químico EspañolSnapshot of the Spanish Chemical Sector


Índice
1
2
3
4
El Sector Químico, estratégico para afrontar la pandemia y abordar la recuperación .......................................................................................05
Datos Clave del Sector Químico Español .............................................................................08
El Sector Químico en el contexto de la Economía Española .............................10Distribución del PIB IndustrialContribución de la Industria Química al Producto Interior Bruto
Estructura Empresarial del Sector Químico ........................................................................13Distribución de Empresas Químicas por Nº de Empleados (2)Distribución de Empresas Químicas por Años de ActividadImplantación Territorial del Sector Químico Español
Cifra de Negocios del Sector Químico ....................................................................................18Evolución de la Producción en el Sector QuímicoEvolución de la Cifra de Negocios del Sector QuímicoCifra de Negocios por Comunidad AutónomaDistribución Sectorial de la Cifra de Negocios (2)
Comercio Exterior .......................................................................................................................................24Evolución de las ExportacionesExportaciones de los Sectores Industriales Cifra de Negocios en Mercados InternacionalesDestino de las Exportaciones - Regiones Destino de las Exportaciones - Países Top 20Evolución de las ImportacionesOrigen de las Importaciones - RegionesOrigen de las Importaciones - Países Top 20Evolución de la Tasa de CoberturaTasa de Cobertura - Países Top 20
7
8
9
5
6
Consumo .............................................................................................................................................................35Consumo de Productos Químicos Consumo de Productos Químicos por Habitante
Empleo ...................................................................................................................................................................38Empleo Total GeneradoEvolución del EmpleoEstabilidad Laboral por Sectores EconómicosSalario Anual Percibido por Trabajador según Sectores EconómicosGasto en Formación por Sectores EconómicosCifra de Negocios por Empleado
Inversión ..............................................................................................................................................................45Inversión
Investigación, Desarrollo e Innovación .................................................................................47Inversión y Gasto en I+D respecto al Total IndustrialInversión en I+D+i Interna (excluidas compras)Empresas InnovadorasInvestigadores contratados sobre el total industrialIntensidad en I+D+i
Horizonte 2030 de la Industria Química Española .....................................................53Perspectivas 2030
Index
1
2
3
4
The chemical sector, considered strategic to tacklethe pandemic and address recovery .........................................................................................05
About the Spanish Chemical Sector .......................................................................................09
The Chemical Sector in the framework of the Spanish Economy ...............10Distribution of Gross Industrial ProductContribution of the Chemical Industry to Gross Domestic Product
Business Structure of the Chemical ............................................................................................13Distribution of Chemical Companies by No. of Employees (2)Distribution of Chemical Companies by Years of ActivityGeographic Location of the Spanish Chemical Sector
Turnover of the Chemical Sector .................................................................................................18Evolution of Production in the Chemical SectorEvolution of Turnover of the Chemical SectorTurnover by Autonomous RegionSector Distribution of Turnover (2)
Foreign Trade ...................................................................................................................................................24Evolution of ExportsExports of Industrial Sectors Turnover in InternationalDestination of Exports - Region Destination of Export - Top 20 CountriesEvolution of ImportsOrigin of Imports - RegionOrigin of Imports - Top 20 CountriesEvolution of the Coverage RateCoverage Rate - Top 20 Countries
7
8
9
5
6
Consumption ...................................................................................................................................................35Consumption of Chemical Products Consumption of Chemical Products per Inhabitant
Employment .....................................................................................................................................................38Total Employment GeneratedEvolution of EmploymentLabor Stability by Economic SectorAnnual Salary Perceived per Employee by Economic SectorExpenditure on Training by Economic SectorTurnover per Employee
Investment .........................................................................................................................................................45Investment
Research, Development and Innovation ..............................................................................47Investment and Expenditure on R&D compared to the Total IndustryInvestment on Internal R+D+I (purchases excluded)Innovative CompaniesResearch staff recruited of the total industryIntensity of R+D+i
2030 Horizon for the Spanish Chemical Industry .......................................................532030 Outlook

El Sector Químico, estratégico para
afrontar la pandemia y abordar la recuperación
The chemical sector, considered strategic to tackle the pandemic
and address recovery
La industria química es uno de los principales motores económicos de Es-paña tanto por su solidez como por su tamaño, pero sobre todo por su ca-pacidad tractora de la economía. De hecho, abastece de productos y tec-nologías al 98% de los sectores productivos y se encuentra en la base de innumerables cadenas de producción.
Esta transversalidad inherente ha impulsado un reconocido papel esencial en el contexto de la crisis causada por la pandemia. En ella se volcó desde el inicio aumentando su capacidad productiva y readaptando en muchos casos sus plantas de producción para garantizar la continuidad de las cadenas de suministro -severamente tensionadas- de muchos productos químicos de primera necesidad, especialmente en el ámbito sanitario, cuya demanda se elevó exponencialmente en el primer semestre de 2020.
Aunque el sector químico fue uno de los que mejor se desenvolvió al tratar-se de una industria declarada como estratégica, también se vio directamen-te afectada por el desplome de dos de sus principales sectores demandan-tes como la automoción y la construcción. Este impacto se tradujo en una caída de la cifra de negocios del -2,9%, hasta los 64.519 millones de euros, que en el caso de las exportaciones se elevó hasta el -6,1% (36.570 millones de euros).
La industria química continúa siendo uno de los mayores y más consolidados sectores industriales de España, al representar el 5,5% del PIB y el 3,7% del empleo, sumando sus efectos indi-rectos e inducidos. Con una cifra de negocios que asciende a 64.519 mill € de los cuales el 57% se facturaron en mercados exteriores -hasta los 36.570 mill €- el sector químico continúa siendo el 2º mayor exportador de la economía española y el primer inversor industrial en I+D+i.
En el ámbito del empleo, y a pesar del retroceso de la cifra de negocios, la industria química ha continuado generando puestos de trabajo de calidad con un crecimiento del 2%, alcanzando, así, su récord histórico hasta los 209.275 asalariados. Este dato refrenda el alto grado de compromiso del sector químico con la generación del empleo, que no solo ha mantenido, sino que lo ha impulsado en una coyuntura especialmente complicada. Esta cifra de empleo supera ya las 711.000 personas contando también los indirectos e inducidos.
Respecto a la estabilidad laboral, el 94% de los empleos directos de la in-dustria química tienen carácter indefinido, lo que evidencia su calidad, con un salario medio por trabajador que supera los 38.000 euros anuales, un 63% más que el salario medio en España (23.450 euros/año).
Uno de los principales rasgos de este sector y clave de su competitividad radica en su capacidad innovadora. De hecho, la industria química sigue liderando la inversión en I+D+i de toda la industria, área a la que desti-na 1.038 millones anuales (excluidas compras) y donde lidera también la contratación de investigadores del sector privado, ya que 1 de cada 5 son contratados por la industria química. Esta apuesta por la innovación se encuentra directamente ligada a la consecución de los objetivos de des-carbonización y economía circular y, junto con la digitalización, se sitúa como vector indispensable para ofrecer, por un lado, soluciones sosteni-bles a otros sectores, y por otro, para mejorar los procesos propios y ser una industria todavía más eficiente, productiva y segura.
Sin lugar a dudas, la industria química ha demostrado más que nunca ser estratégica para garantizar el funcionamiento y desarrollo de nuestra so-ciedad actual, sea cual sea el desafío que tenga ante sí y continuará siendo clave en el contexto de recuperación como sector tractor de la economía y proveedor de productos esenciales.
El Sector Químico, estratégico para afrontar la pandemia y abordar la recuperación

The chemical industry is one of the main economic drivers in Spain both for its strength and size, but above all because of its economic tractor capacity. In fact, it supplies products and technologies to 98% of production sectors and is basic for countless production chains.
This inherent mainstreaming capacity has fostered an acknowledged essen-tial role in the context of the pandemic crisis. The chemical industry focu-sed from the outset on increasing its production capacity and, in many cases, readapted its production plants to ensure the continuity of the supply chains - severely stressed - of many essential chemicals, especially in the health field, where demand rose exponentially in the first half of 2020.
Although the chemical sector
was one of the best performers as it was a declared strategic industry, it was also directly affected by the collapse of two of its main demanding sectors such as automotive and construction. This impact derived in a turnover de-crease of -2.9%, amounting to 64,519 million euros, which in the case of ex-ports rose to -6.1% (36.570 million euros).
The chemical industry remains one of the major and most con-solidated industrial sectors in Spain. It represents 5.5% of the national GDP and 3.7% of total employment, included its in-direct and induced effects. With a turnover of 64,519 million euros, 57% of which in foreign markets - up to 36,570 million euros - the chemical sector remains the 2nd largest exporter in the Spanish economy and the first industrial investor in R&D and innovation.
In terms of employment, and despite the turnover decline, the chemical industry has continued to generate quality jobs with growth rate of 2%, thus reaching its all-time record with 209,275 employees. This endorses the chemical sector’s commitment level to employment, which has not only maintained, but has led in a particularly complicated situation. This emplo-yment figures surpass a total of 711,000 people, including indirect and in-duced positions.
With regard to job stability, 94% of direct jobs in the chemical industry are permanent contracts, proof of their quality, with an average worker wage that exceeds 38,000 euros yearly, a figure 63% over the average salary in Spain (23,450 euros/year).
One of the main sector features and key to its competitiveness lies in its innovation capacity. In fact, the chemical industry continues to lead the in-vestment in R&D and innovation of all industry. It allocates 1,038 million eu-ros annually (excluding purchases) to these activities. The chemical indus-try also leads private sector researchers’ ratio. 1 of every 5 researchers are hired by the chemical industry. This commitment to innovation is directly linked to the achievement of decarbonization and circular economy goals as well as those of digitization, positioning the sector as an indispensable vector to offer, on the one hand, sustainable solutions to other sectors, and on the other, to improve its own processes, thus becoming an even more efficient, productive and safe industry.
Undoubtedly, the chemical industry has proven more than ever to be stra-tegic ensuring our current society’s functioning and development. Whate-ver challenges facing the chemical industry, it will continue to be key in the context of recovery as a tractor sector of the economy and a supplier of essential products.
The chemical sector, considered strategic to tackle the pandemic and address recovery

Datos Clave del Sector Químico Español
Contribución a la
ECONOMÍA30%
CRECIMIENTO ACUMULADOde la cifra de
negocios 2007-2020
Contribución a la
INNOVACIÓNContribución al
EMPLEO
Contribución al
COMERCIOEXTERIOR
2º
de la economía española
MAYOREXPORTADOR
1er
INVERSOR EN I+D+ide toda laindustriaInvestigadores contratados
18,6%Gasto en I+D
26% del total industrial
sobre el totalde la industria
Inversión en I+D+i interna(excluidas compras):
1.038 mill/€
Empresas Innovadoras
62% del totaldel sector
Exportaciones
36.570 mill/€ del total
del total
Ventas en el exterior
56,7%
Contribución a laexportación española
15,8%
Salario mediopor trabajador
38.147€/año
Contratosindefinidos
94%Gasto anual enformación
229 €/trabajador asalariados
del totalde contratos
Empleodirecto
209.300
Cifra de negocios
64.519 mill/€
Contribución al PIB Industrial
13,4%
del valor añadido dedicado a inversión productiva
13,5%
Nº de Empresas
3.088
EMPLEO GENERADO
(directo, indirectoe inducido)
711.620asalariados

Key Figures About the Spanish Chemical Sector
ContributionECONOMIC
30%
CUMULATIVE GROWTH
of turnover 2007-2020
Contribution to
INNOVATIONContribution to the
EMPLOYMENT
Contribution to
FOREIGNTRADE
2nd
of the Spanish economy
LARGESTEXPORTER
1st
investorin R+D+i of the total
industryResearch sta� recruited
18.6%Expenditure on R&D
26% of thetotal industry
of the totalindustry
Investment on internal R&D(purchases excluded)
1,038 mill/€
Innovative Companies
62% del totaldel sector
Exports
36,570 mill/€ of total
of total
Sales in foreign markets
56.7%
Contribution toSpanish exports
15.8%
Annual salaryper employee
38,147€/year
Permanentcontracts
94%Expenditure ontraining
229 €/per employeeand year
employeeson the payroll
of the totalcontracts
DirectEmployment
209,300
Turnover
64,519 mill/€
Contribution to the industrial GDP
13.4%
of added value allocatedto productive investment
13.5%
No. of Companies
3,088
EMPLOYEESON THE PAYROLLTotal jobs generated
(direct, indirectand induced)
711,620employees

El Sector Químico en el contexto de la Economía Española
1
The Chemical Sector in the framework of the Spanish Economy
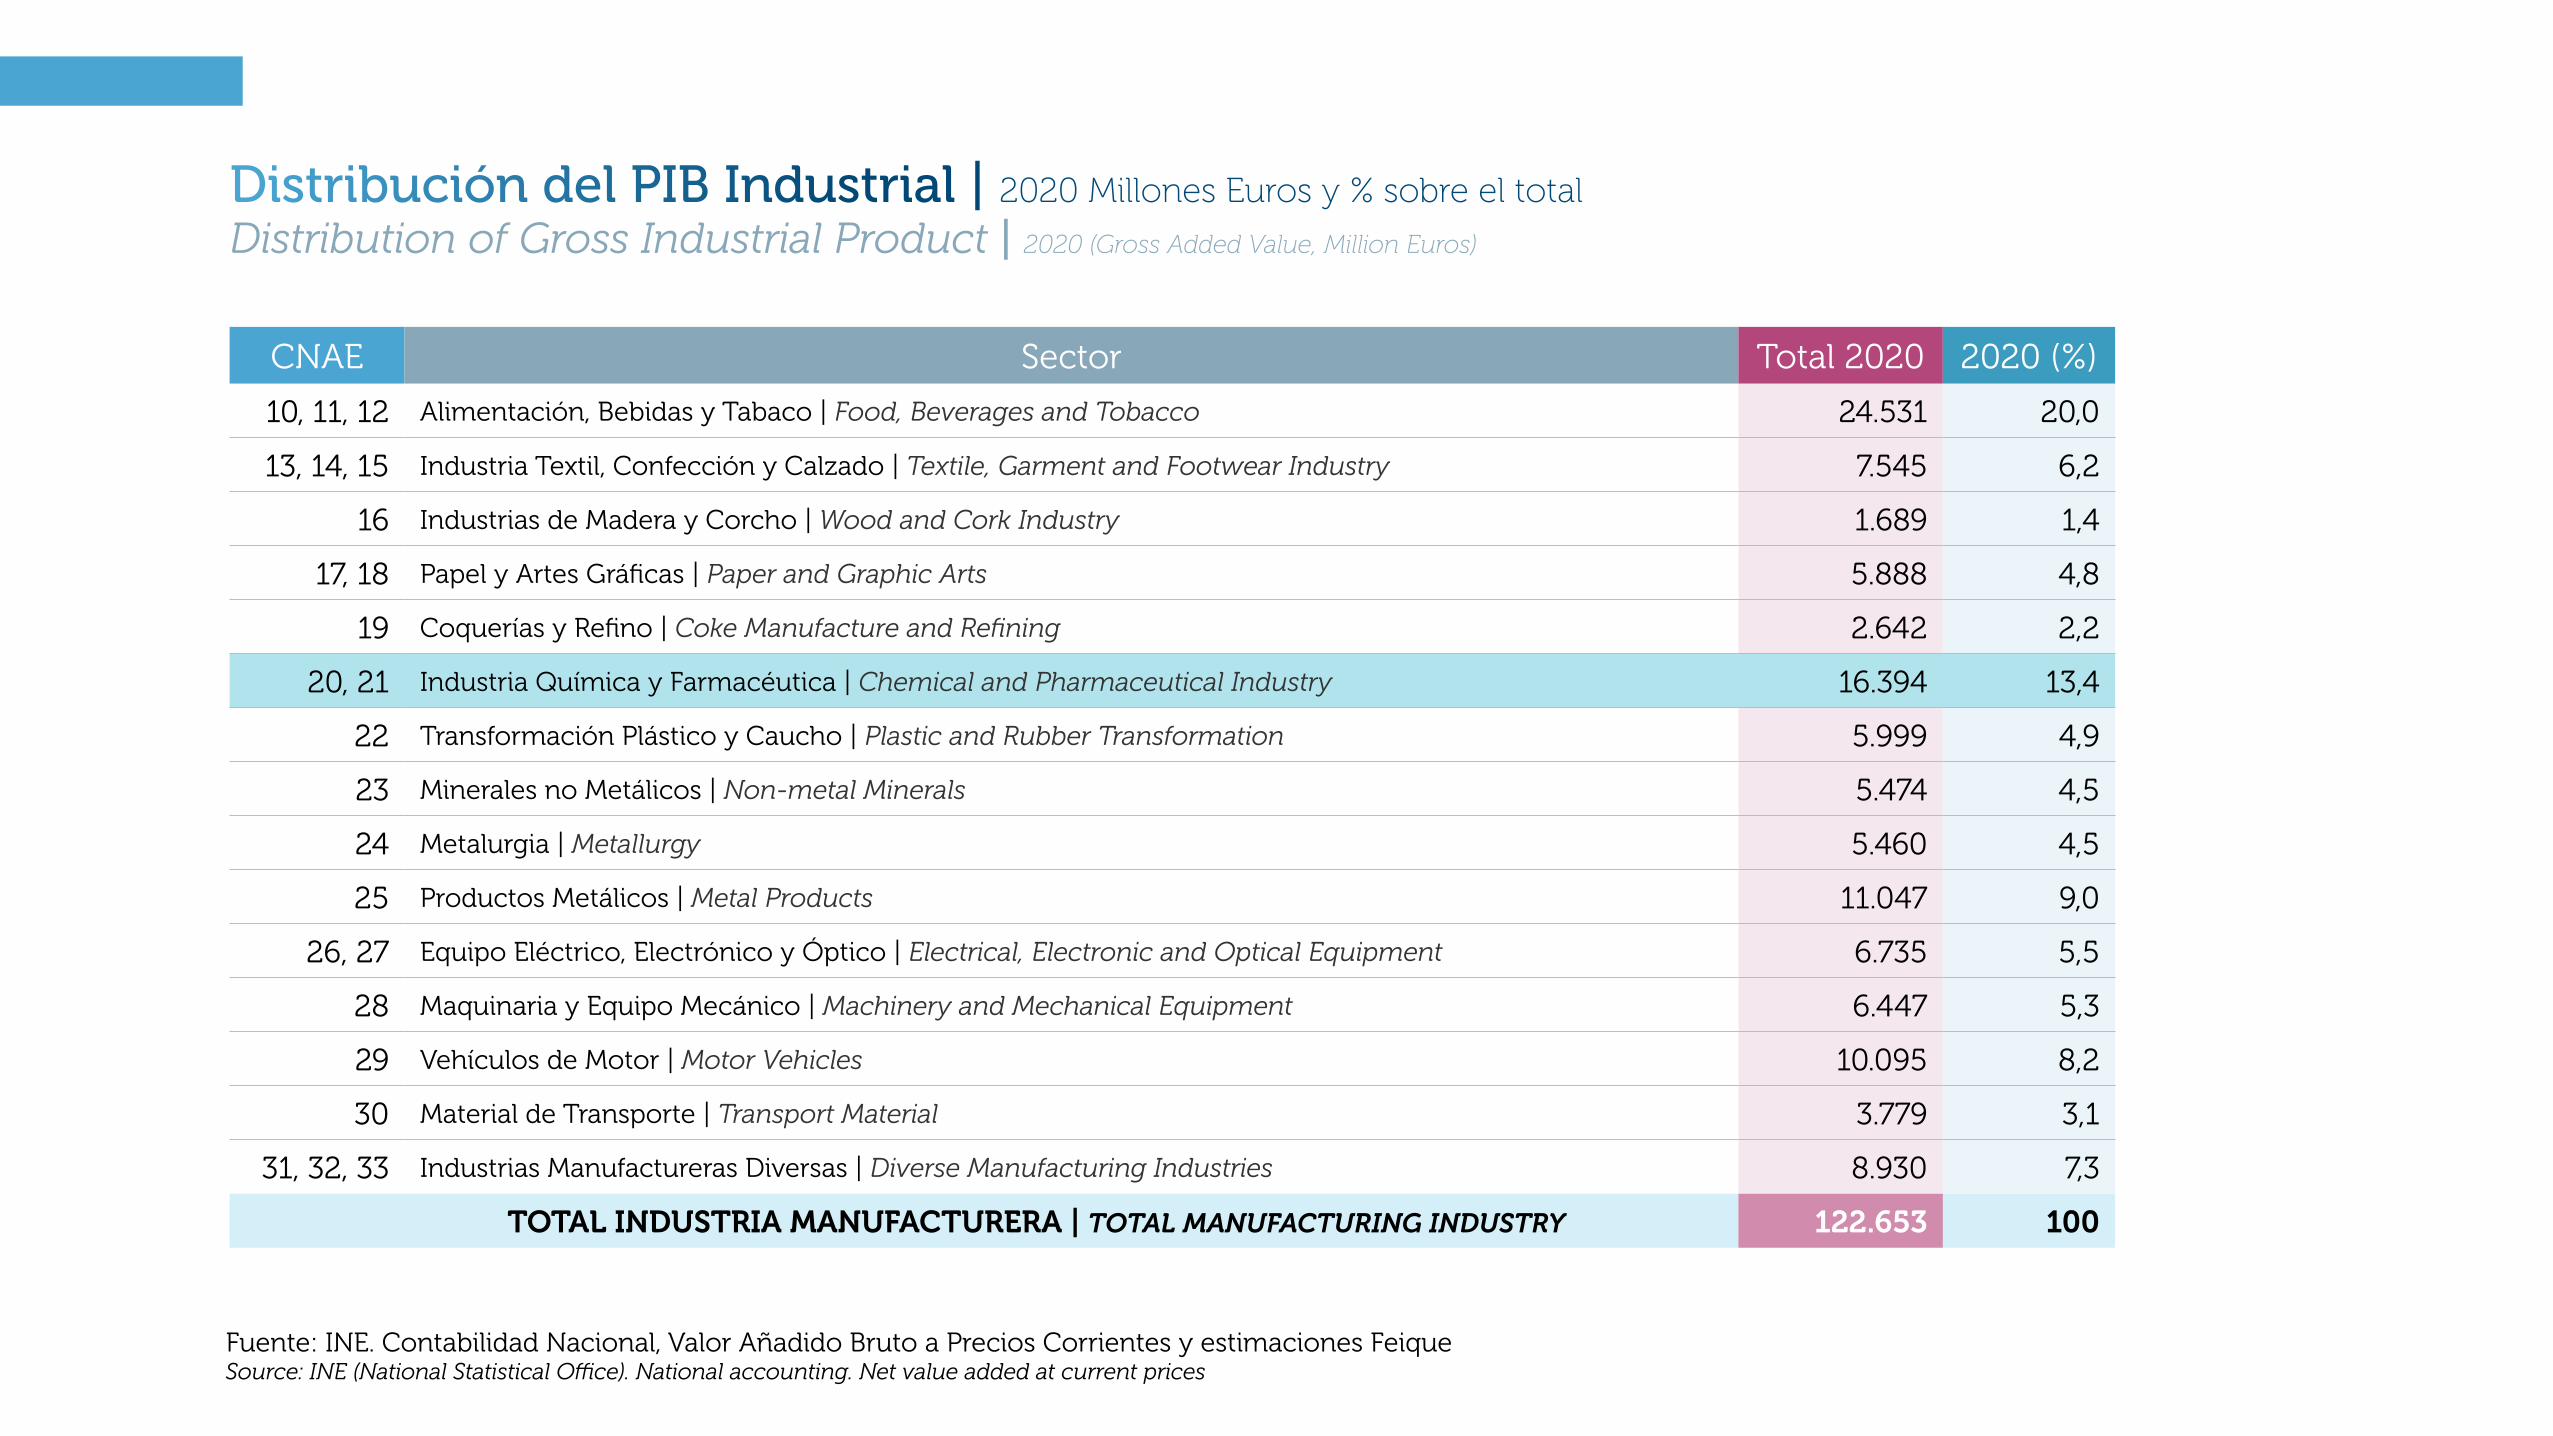
Distribución del PIB Industrial | 2020 Millones Euros y % sobre el total
Distribution of Gross Industrial Product | 2020 (Gross Added Value, Million Euros)
CNAE Sector Total 2020 2020 (%)
10, 11, 12 Alimentación, Bebidas y Tabaco | Food, Beverages and Tobacco 24.531 20,0
13, 14, 15 Industria Textil, Confección y Calzado | Textile, Garment and Footwear Industry 7.545 6,2
16 Industrias de Madera y Corcho | Wood and Cork Industry 1.689 1,4
17, 18 Papel y Artes Gráficas | Paper and Graphic Arts 5.888 4,8
19 Coquerías y Refino | Coke Manufacture and Refining 2.642 2,2
20, 21 Industria Química y Farmacéutica | Chemical and Pharmaceutical Industry 16.394 13,4
22 Transformación Plástico y Caucho | Plastic and Rubber Transformation 5.999 4,9
23 Minerales no Metálicos | Non-metal Minerals 5.474 4,5
24 Metalurgia | Metallurgy 5.460 4,5
25 Productos Metálicos | Metal Products 11.047 9,0
26, 27 Equipo Eléctrico, Electrónico y Óptico | Electrical, Electronic and Optical Equipment 6.735 5,5
28 Maquinaria y Equipo Mecánico | Machinery and Mechanical Equipment 6.447 5,3
29 Vehículos de Motor | Motor Vehicles 10.095 8,2
30 Material de Transporte | Transport Material 3.779 3,1
31, 32, 33 Industrias Manufactureras Diversas | Diverse Manufacturing Industries 8.930 7,3
TOTAL INDUSTRIA MANUFACTURERA | TOTAL MANUFACTURING INDUSTRY 122.653 100
Fuente: INE. Contabilidad Nacional, Valor Añadido Bruto a Precios Corrientes y estimaciones FeiqueSource: INE (National Statistical Office). National accounting. Net value added at current prices

Fuente: Elaboración propia (Feique)Source: Own elaboration (Feique)
Millones € / Million €
55.374
del PIB españolof Spanish GDP
DIRECTA
16.394Millones €
Million €
DIRECT
Millones €Million €
32.613
INDIRECTAINDIRECT
Millones €Million €
INDUCIDA
6.367INDUCED
5,5%
Contribución de la Industria Química al Producto Interior Bruto | 2020
Contribution of the Chemical Industry to Gross Domestic Product | 2020

Estructura Empresarial delSector Químico
2
Business Structure ofthe Chemical Sector

Distribución de Empresas Químicas por Nº de Empleados | 2020
Distribution of Chemical Companies by Nr. of Employees | 2020
Intervalos de EmpleoEmployment Intervals
Nº de EmpresasNr. of Companies
% del Total% of Total
1 a 9 asalariados / 1 to 9 employees 1.699 55
10 a 49 asalariados / 10 to 49 employees 870 28
50 a 99 asalariados / 50 to 99 employees 229 7
100 a 199 asalariados / 100 to 199 employees 126 4
200 a 1.000 asalariados / 200 to 1.000 employees 148 5
Más de 1.000 asalariados / 1.000 or more employees 16 1
TOTAL 3.088 100
Fuente: INE. Directorio Central de Empresas Source: INE. Central Directory of Companies
*No se incluyen las empresas sin asalariados (880)*Does not include companies with no employees on the payroll (880)

Distribución de Empresas Químicas por Nº de Empleados | 2020
Distribution of Chemical Companies by Nr of Employees | 2020
5%
28%
55%
7%50 a 99 asalariadosBetween 50 and 99 employees
100 a 199 asalariadosBetween 100 and 199 employees
200 a 1.000 asalariadosBetween 200 and 1.000 employees
1%Más de 1.000 asalariadosOver 1.000 employees
4%
10 a 49 asalariadosBetween 10 and 49 employees
1 a 9 asalariadosBetween 1 and 9 employees
Fuente: INE. Directorio Central de Empresas Source: INE. Central Directory of Companies
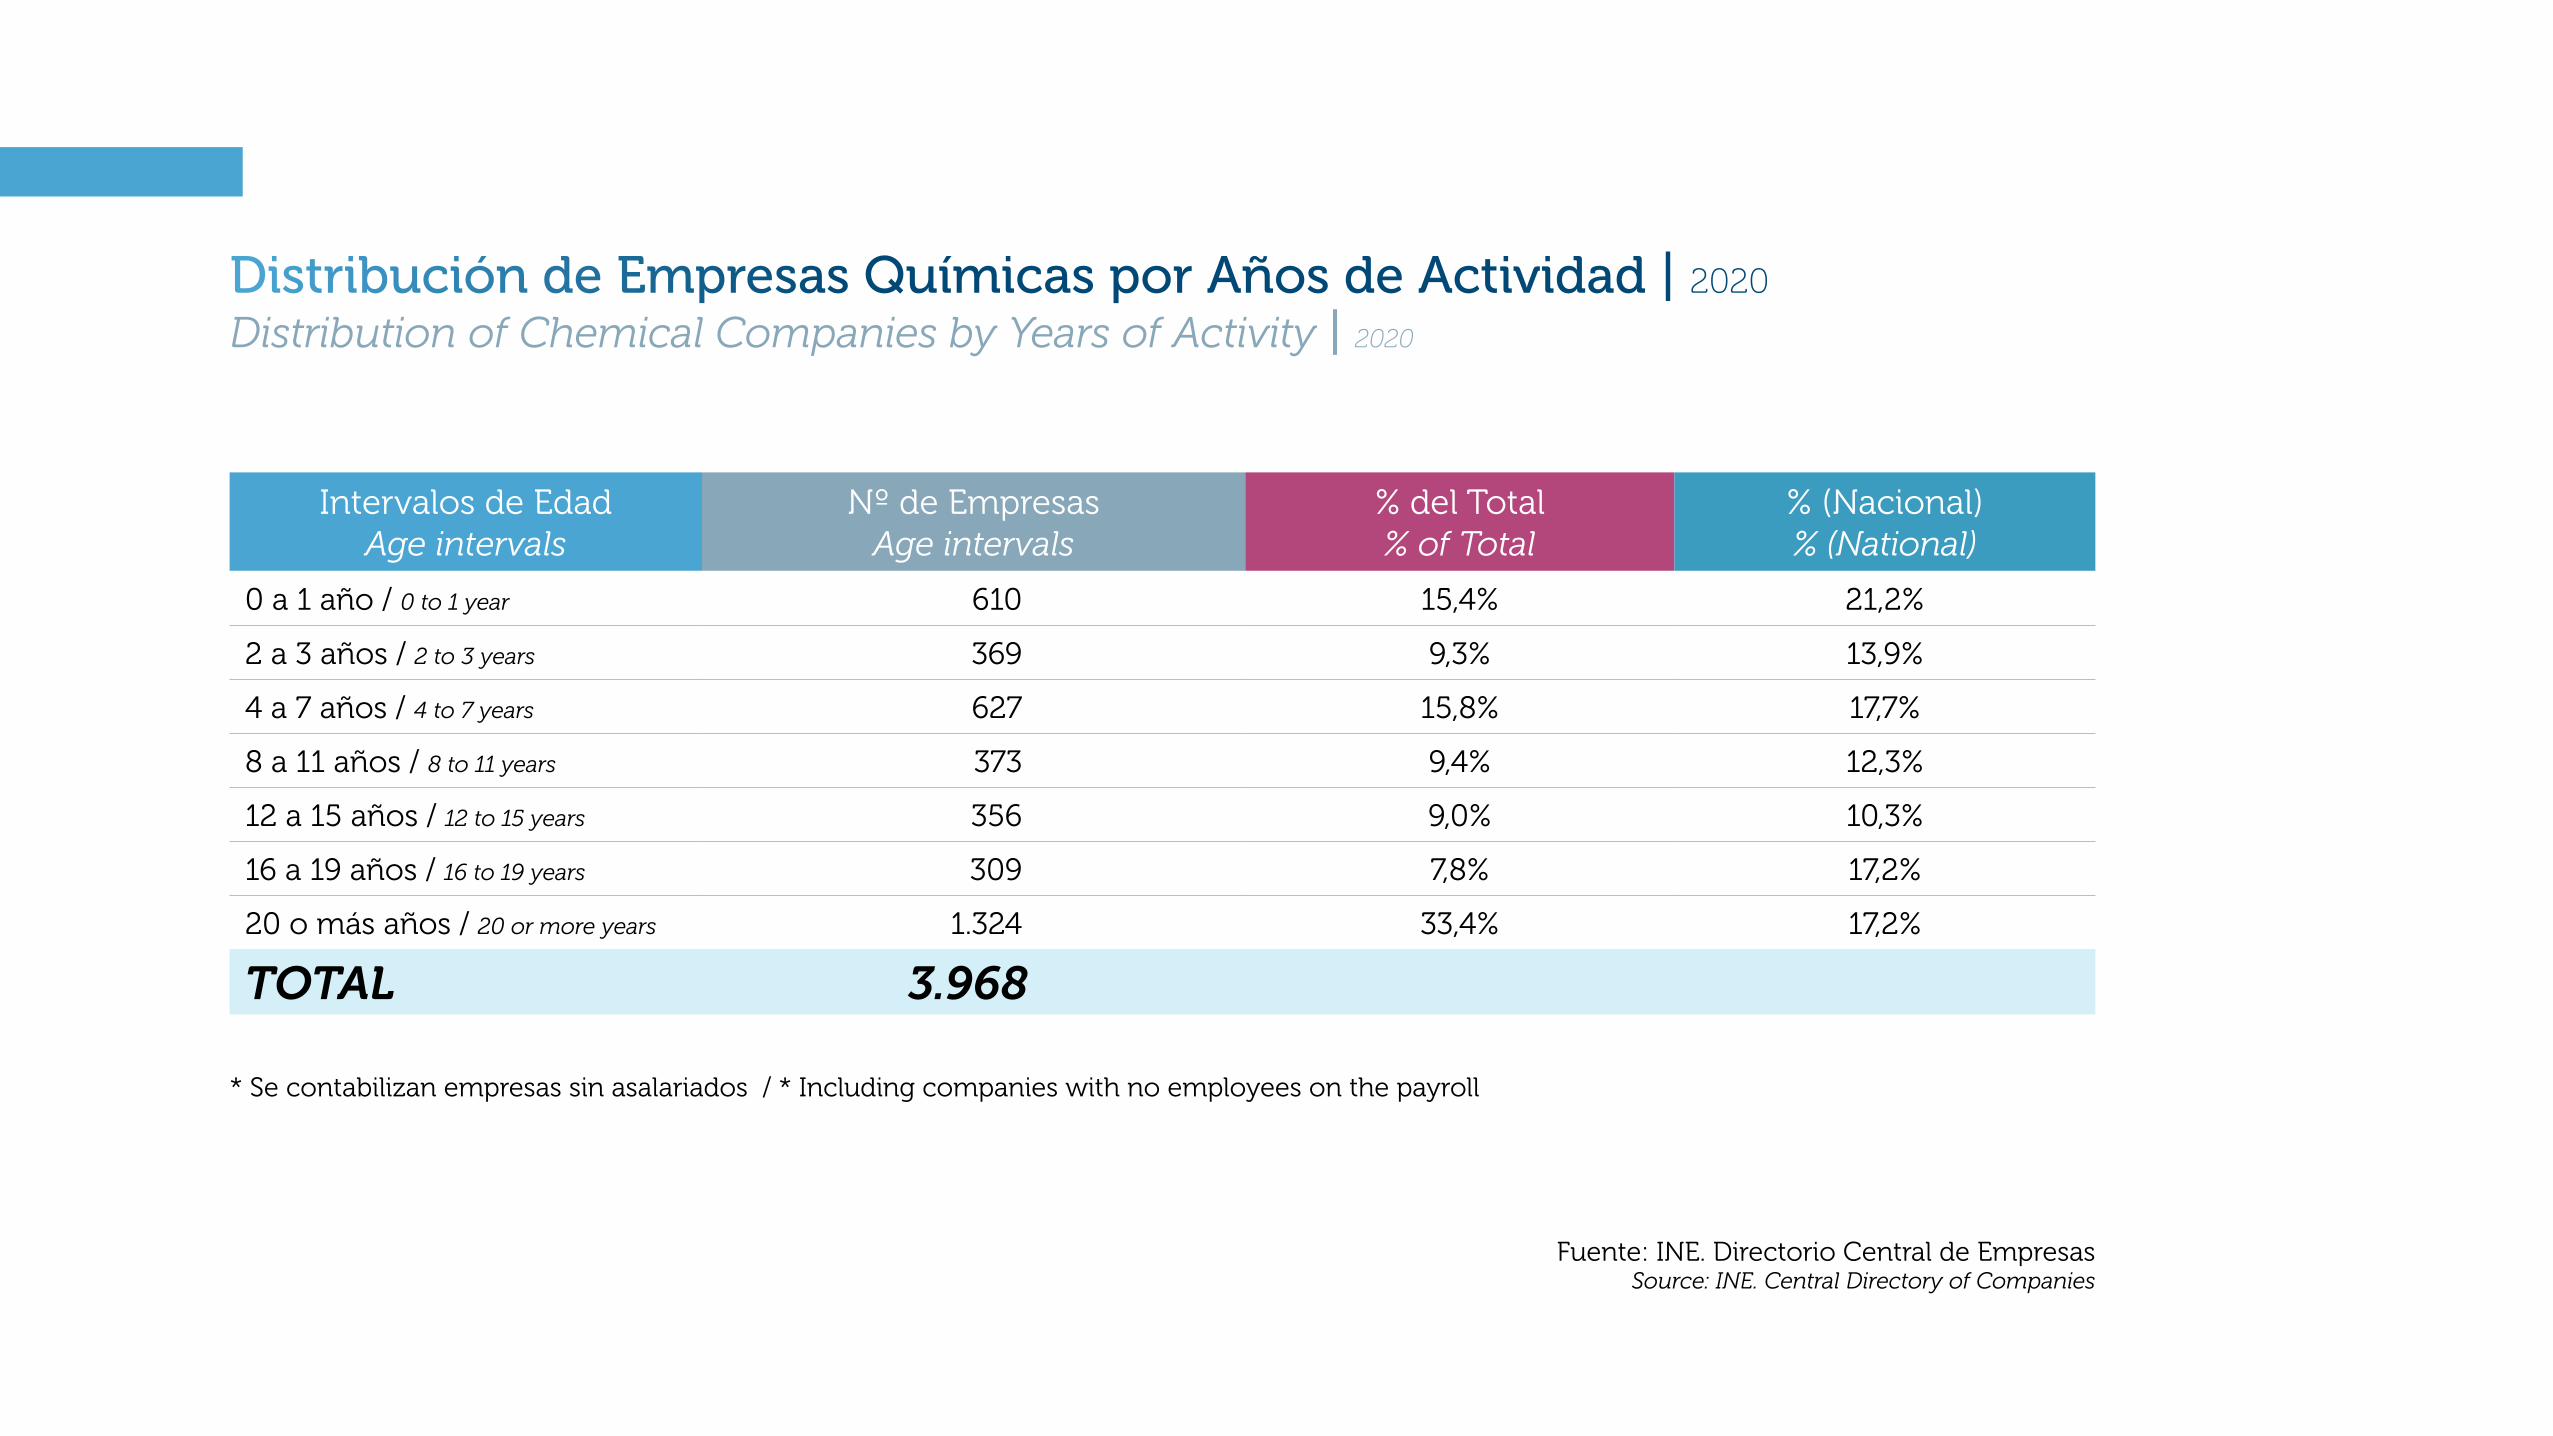
Distribución de Empresas Químicas por Años de Actividad | 2020
Distribution of Chemical Companies by Years of Activity | 2020
Intervalos de EdadAge intervals
Nº de EmpresasAge intervals
% del Total% of Total
% (Nacional)% (National)
0 a 1 año / 0 to 1 year 610 15,4% 21,2%
2 a 3 años / 2 to 3 years 369 9,3% 13,9%
4 a 7 años / 4 to 7 years 627 15,8% 17,7%
8 a 11 años / 8 to 11 years 373 9,4% 12,3%
12 a 15 años / 12 to 15 years 356 9,0% 10,3%
16 a 19 años / 16 to 19 years 309 7,8% 17,2%
20 o más años / 20 or more years 1.324 33,4% 17,2%
TOTAL 3.968
Fuente: INE. Directorio Central de Empresas Source: INE. Central Directory of Companies
* Se contabilizan empresas sin asalariados / * Including companies with no employees on the payroll

Implantación Territorial del Sector Químico Español | Principales zonas de producción
Geographic Location of the Spanish Chemical Sector | Main production areas
Zonas de alta concentración de industria química
Localización de otras zonas de
concentración de industria química
Areas with a high concentration of the chemical industry
Location of other areas with a high concentration of the chemical industry
AsturiasCantabria País Vasco
Barcelona
Tarragona
Castellón
Valencia
Cartagena
Algeciras
Huelva
Puertollano
Madrid
Aragón
Fuente: Elaboración propia Source: Feique

Cifra de Negociosdel Sector Químico
3
Turnover of the Chemical Sector

Evolución de la Producción en el Sector Químico | 2007-2020 (% Variación Acumulada)
Evolution of Production in the Chemical Sector | 2007-2020 (% cumulative variation)
30
20
10
0
-10
-20
-30
-402007 20152014201320122011201020092008 2016 2017 2018 2019 2020
QuímicaChemical
18,4
-28,8%
18,0%
IndustriaIndustry
-21,3%
Fuente: IPI + elaboración propiaSource: IPI and FEIQUE

Evolución de la Cifra de Negocios del Sector Químico | 2007-2020 (Millones €)
Evolution of Turnover of the Chemical Sector | 2007-2020 (Million €)
64.51966.433
70.000
65.000
60.000
55.000
50.000
45.000
40.0002007 2008 2009 2010 2011 2012 2013 2014 2015 2016 2017 2018 2019 2020
52.585
47.714
53.153
55.657
55.117
55.28256.386
58.056
49.743
59.020
63.100
65.647
-2,9%
80%Crecimiento AcumuladoCumulative Growth2000-2020
30%Crecimiento AcumuladoCumulative Growth2007-2020
Fuente: INE. Encuesta Industrial de Empresas + IPI, IPRI + Elaboración propiaSource: INE. Industrial Company Surveyt + IPI, IPRI and Feique

Cifra de Negocios por Comunidad Autónoma | 2020 (% y Millones €)
Turnover by Autonomous Region | 2020 (% and Million €)
Fuente: INE. Encuesta Industrial de Empresas + IPI, IPRI + elaboración propiaSource: INE. Industrial Company Surveyt + IPI, IPRI and Feique
43,0%
8,4% Comunidad ValencianaRegion of Valencia
12,7% AndalucíaAndalusia
13,5% Madrid
RestoRest22,4%
CataluñaCatalonia
Comunidad AutónomaAutonomous Region
% del Total% of Total
Andalucía / Andalusia 12,7
Aragón 3,3
Asturias 0,9
Islas Baleares / Balearic Islands 0,1
Canarias / Canary Islands 0,2
Cantabria 1,4
Castilla y León / Castile-Leon 3,2
Castilla-La Mancha / Castile-La Mancha 4,3
Cataluña / Catalonia 43,0
C. Valenciana / Region of Valencia 8,4
Extremadura 0,4
Galicia 1,3
Madrid 13,5
Murcia 3,0
Navarra / Navarre 1,3
País Vasco / Basque Country 2,8
La Rioja 0,2

Distribución Sectorial de la Cifra de Negocios | 2020 (% y Millones €)
Sector Distribution of Turnover | 2020 (% and Million €)
Fuente: INE. Encuesta Industrial de Empresas + IPI, IPRI + Elaboración propiaSource: INE. Industrial Company Surveyt + IPI, IPRI and Feique
Distribucion Sectorial Cifra de NegociosSector Distribution of Turnover
Peso Sobre Total (%)Weight Out of Total (%)
Cifra de Negocios (Mill. €)Turnover (Million €)
SECTOR QUÍMICO / CHEMICAL SECTOR - CNAE 20+21 100,0 64.519
20 Industria Química 70,0 45.195201 Química Básica 38,0 24.512
2011 Gases Industriales 2,8 1.793
2012 Colorantes y Pigmentos 1,3 824
2013 Química Inorgánica 2,5 1.631
2014 Química Orgánica 13,1 8.454
2015 Fertilizantes 2,5 1.619
2016 Materias Primas Plásticas 15,5 9.986
2017 Materias Primas del Caucho 0,3 205
202 Agroquímica 1,7 1.131
203 Pinturas, Barnices y Tintas 7,3 4.692
204 Detergencia, Perfumeria y Cosmética 14,4 9.349
2041 Detergencia 6,4 4.150
2042 Perfumería y Cosmética 8,0 5.199
205 Otros Productos Químicos 8,2 5.263
2051 Fabricación de Explosivos 0,5 311
2052 Fabricación de Colas 0,7 446
2053 Fabricación de Aceites Esenciales 1,5 977
2059 Otros Productos Químicos 5,5 3.530
206 Fibras Artificiales 0,4 247
21 Farmaquímica 30,0 19.324211 Materias Primas Farmacéuticas 5,9 3.816
212 Especialidades Farmcéuticas 24,1 15.508

Distribución Sectorial de la Cifra de Negocios | 2020 (% y Millones €)
Sector distribution of turnover | 2020 (% and Million €)
Gases Industriales / Industrial Gases 2,8%
Colorantes y Pigmentos / Dyes and Pigments 1,3%
Química Inorgánica / Inorganic Chemistry 2,5%
Química Orgánica / Organic Chemistry 13,1%
Fertilizantes / Fertilizers 2,5%
Materias Primas Plásticas / Plastics RM 15,5%
Materias Primas del Caucho / Rubber RM 0,3%
Agroquímica / Agrochemicals 1,7%
Pinturas, Barnices y Tintas / Paints and Inks 7,3%
Detergencia / Detergents 6,4%
Perfumería y Cosmética / Perfumes and Cosmetics 8,0%
Fabricación de Explosivos / Manufacture of Explosives 0,5%
Fabricación de Colas / Manufacture of Glues 0,7%
Fabricación de Aceites Esenciales / Manufacture of Essential Oils 1,5%
Otros Productos Químicos / Other Chemical Products 5,5%
Fibras Artificiales / Artificial Fibers 0,4%
Materias Primas Farmacéuticas / Pharmaceuticals RM 5,9%
Especialidades Farmacéuticas / Pharmaceutical Specialties 24,1%
2,8% 1,3%
2,5%
13,1%
2,5%
15,5%
0,3%
1,7%
7,3%6,4%8,0%
0,5%
24,1%
5,9%
1,5%
0,7%
5,5%
0,4%
Fuente: INE. Encuesta Industrial de Empresas + Elaboración propiaSource: INE. Industrial Company Survey and FEIQUE
Comercio Exterior4
Foreign Trade
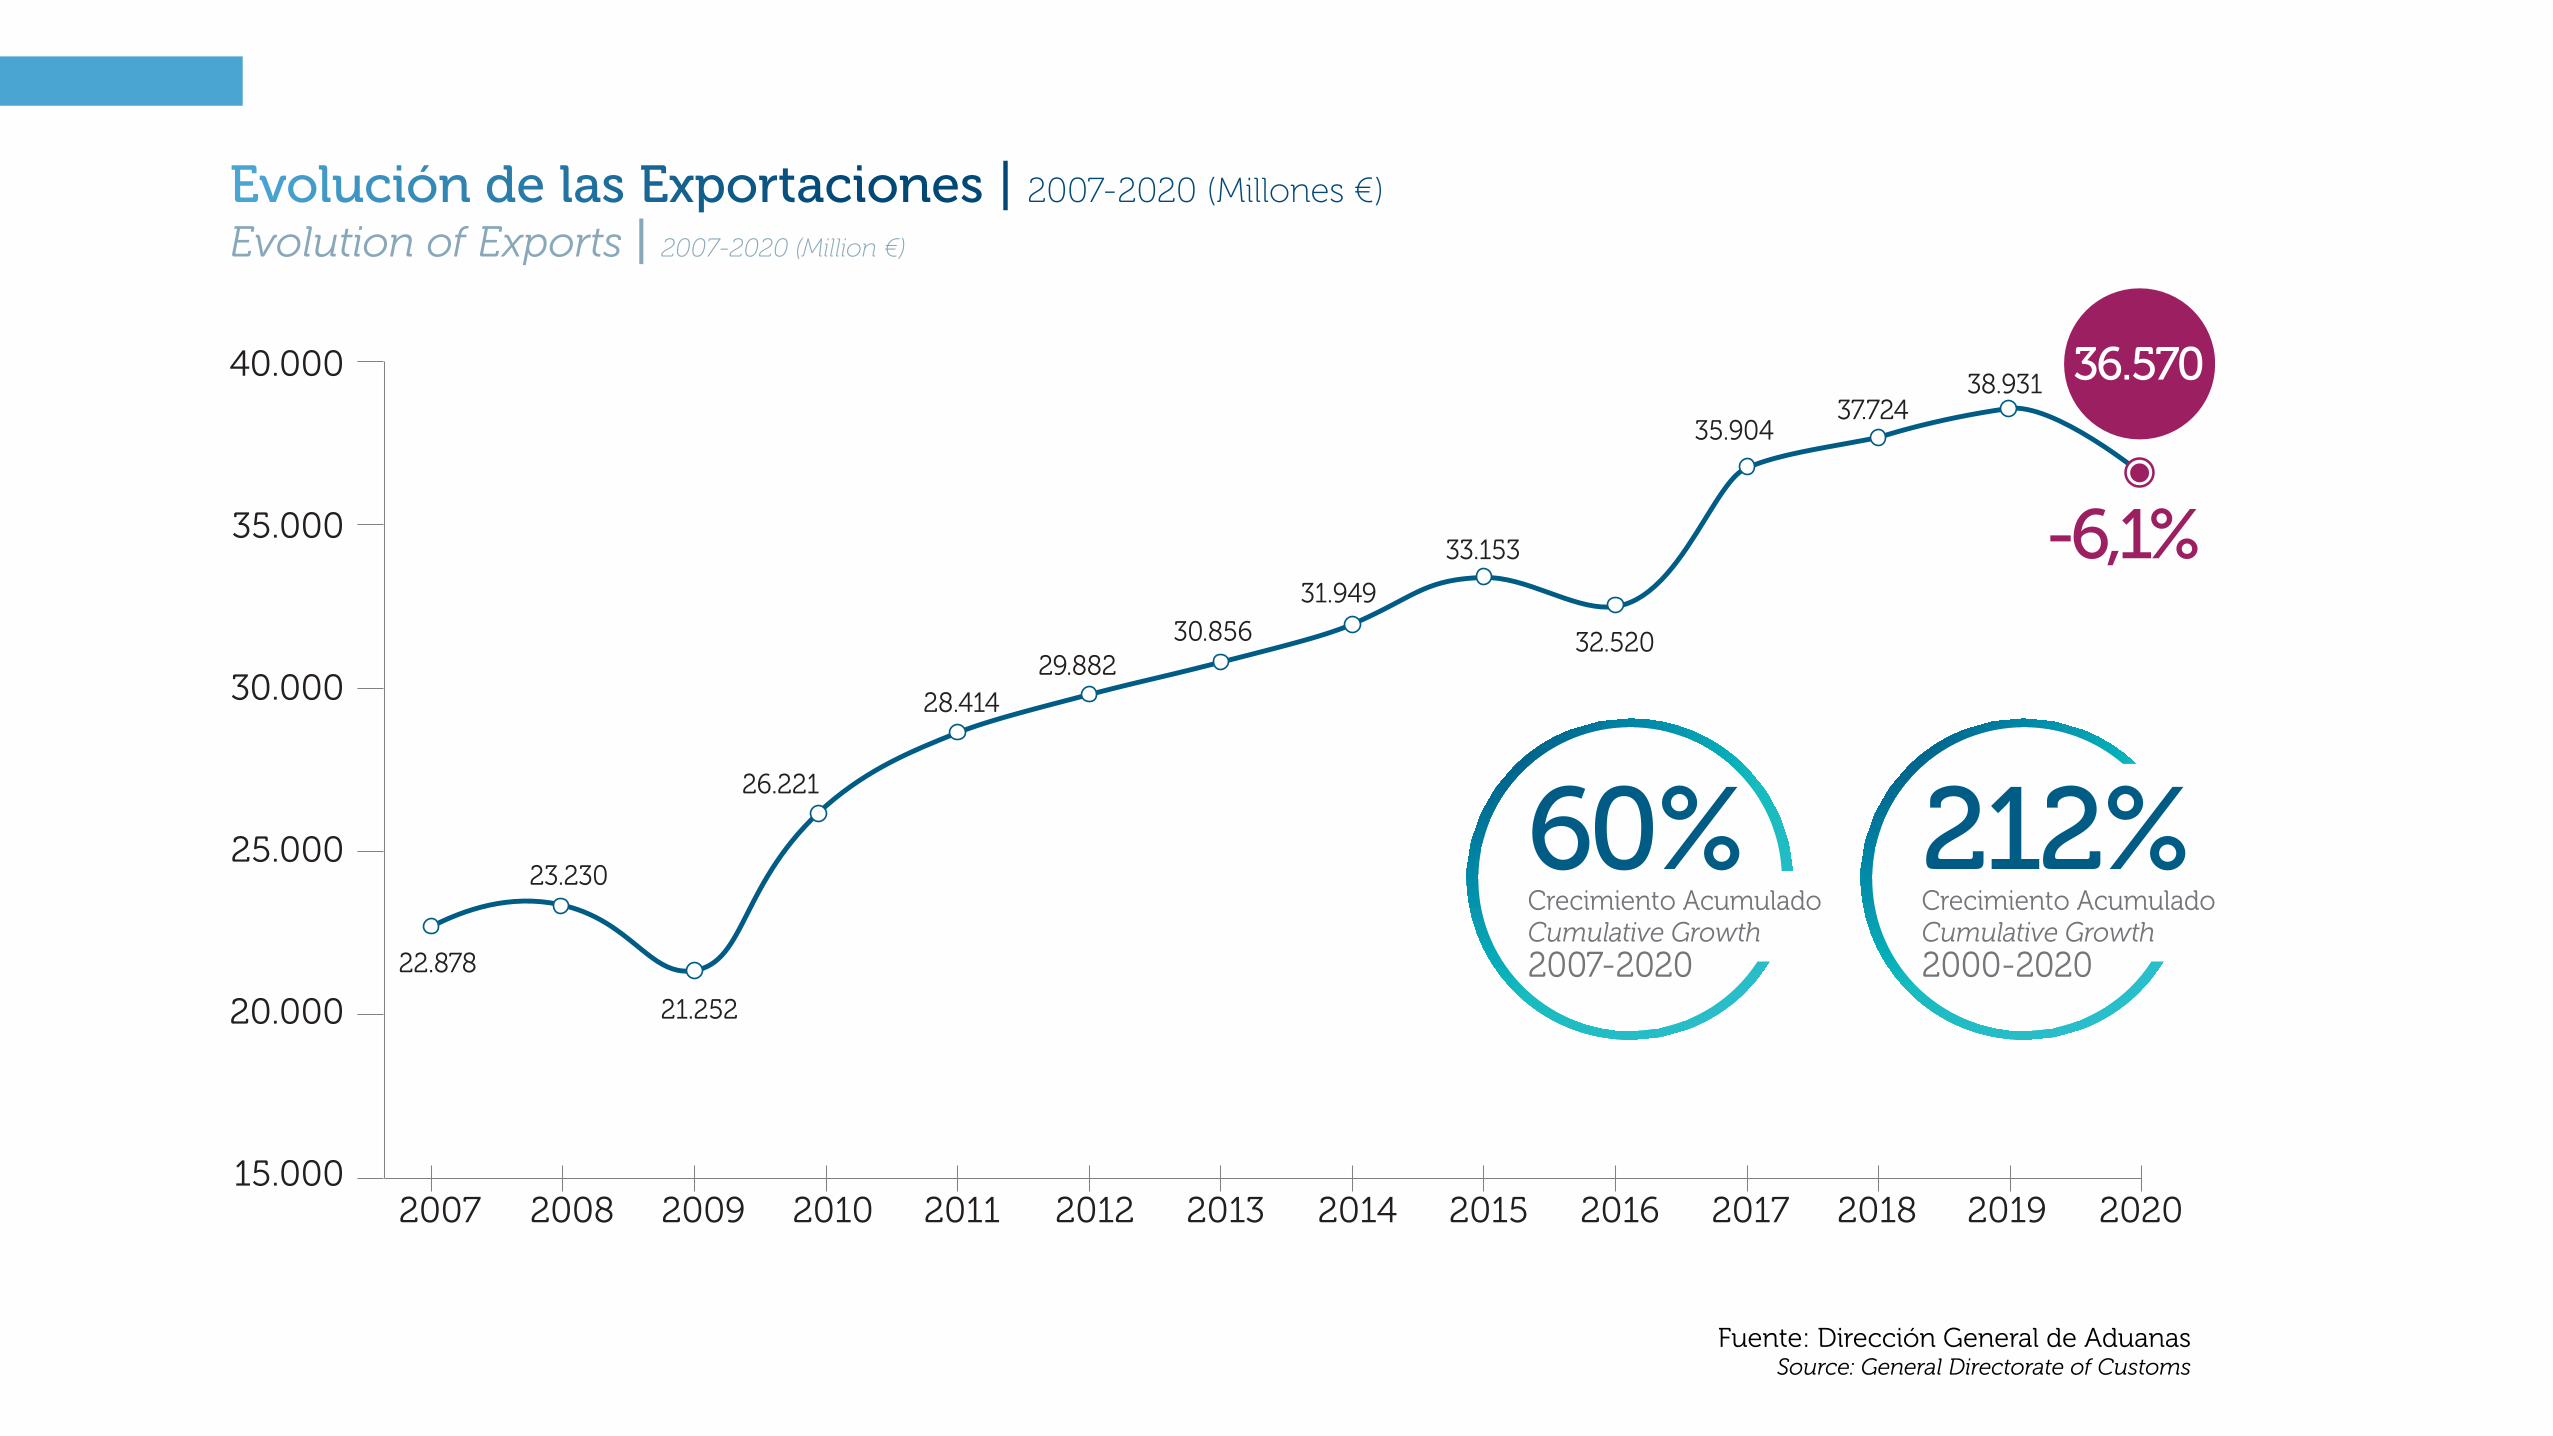
Evolución de las Exportaciones | 2007-2020 (Millones €)
Evolution of Exports | 2007-2020 (Million €)
36.57040.000
35.000
30.000
25.000
20.000
15.0002007 2008 2009 2010 2011 2012 2013 2014 2015 2016 2017 2018 2019 2020
22.878
23.230
21.252
26.221
28.41429.882
30.85631.949
33.153
32.520
35.90437.724
38.931
212%Crecimiento AcumuladoCumulative Growth2000-2020
60%Crecimiento AcumuladoCumulative Growth2007-2020
-6,1%
Fuente: Dirección General de AduanasSource: General Directorate of Customs

Exportaciones de los Sectores Industriales | 2020 (Millones €)
Exports of Industrial Sectors | 2020 (Million €)
CNAE Sector Millones € % sobre el total
29 Vehículos de Motor | Motor Vehicles 44.046 19,0
20, 21 Industria Química y Farmacéutica | Chemical and Pharmaceutical Industry 36.570 15,8
10, 11, 12 Alimentación, Bebidas y Tabaco | Food, Beverages and Tobacco 34.081 14,7
26, 27 Equipo Eléctrico, Electrónico y Óptico | Electrical, Electronic and Optical Equipment 18.551 8,0
13, 14, 15 Industria Textil, Confección y Calzado | Textile, Garment and Footwear Industry 17.432 7,5
28 Maquinaria y Equipo Mecánico | Machinery and Mechanical Equipment 14.961 6,4
24 Metalurgia | Metallurgy 13.699 5,9
19 Coquerías y Refino | Coke Manufacture and Refining 9.352 4,0
22 Transformación Plástico y Caucho | Plastic and Rubber Transformation 8.273 3,6
25 Productos Metálicos | Metal Products 8.257 3,6
30 Material de Transporte | Transport Material 7.994 3,4
23 Minerales no Metálicos | Non-metal Minerals 7.139 3,1
31, 32, 33 Industrias Manufactureras Diversas | Diverse Manufacturing Industries 5.915 2,5
17, 18 Papel y Artes Gráficas | Paper and Graphic Arts 4.204 1,8
16 Industrias de Madera y Corcho | Wood and Cork Industry 1.621 0,7
TOTAL INDUSTRIA MANUFACTURERA | TOTAL MANUFACTURING INDUSTRY 232.094 100,0
Fuente: Dirección General de AduanasSource: General Directorate of Customs

Cifra de Negocios en Mercados Internacionales | 2007-2020 (%)
Turnover in International Markets | 2007-2020 (%)
Fuente: Dirección General de AduanasSource: General Directorate of Customs
56,7%
73%Crecimiento AcumuladoCumulative Growth2000-2020
23%Crecimiento AcumuladoCumulative Growth2007-2020
60
58
56
54
52
50
48
46
44
422007 2008 2009 2010 2011 2012 2013 2014 2015 2016 2017 2018 2019 2020
46,0
44,5
49,3
51,1
54,2
55,8
56,7 57,1
55,1
56,957,5
44,2
58,6%
-3,3%
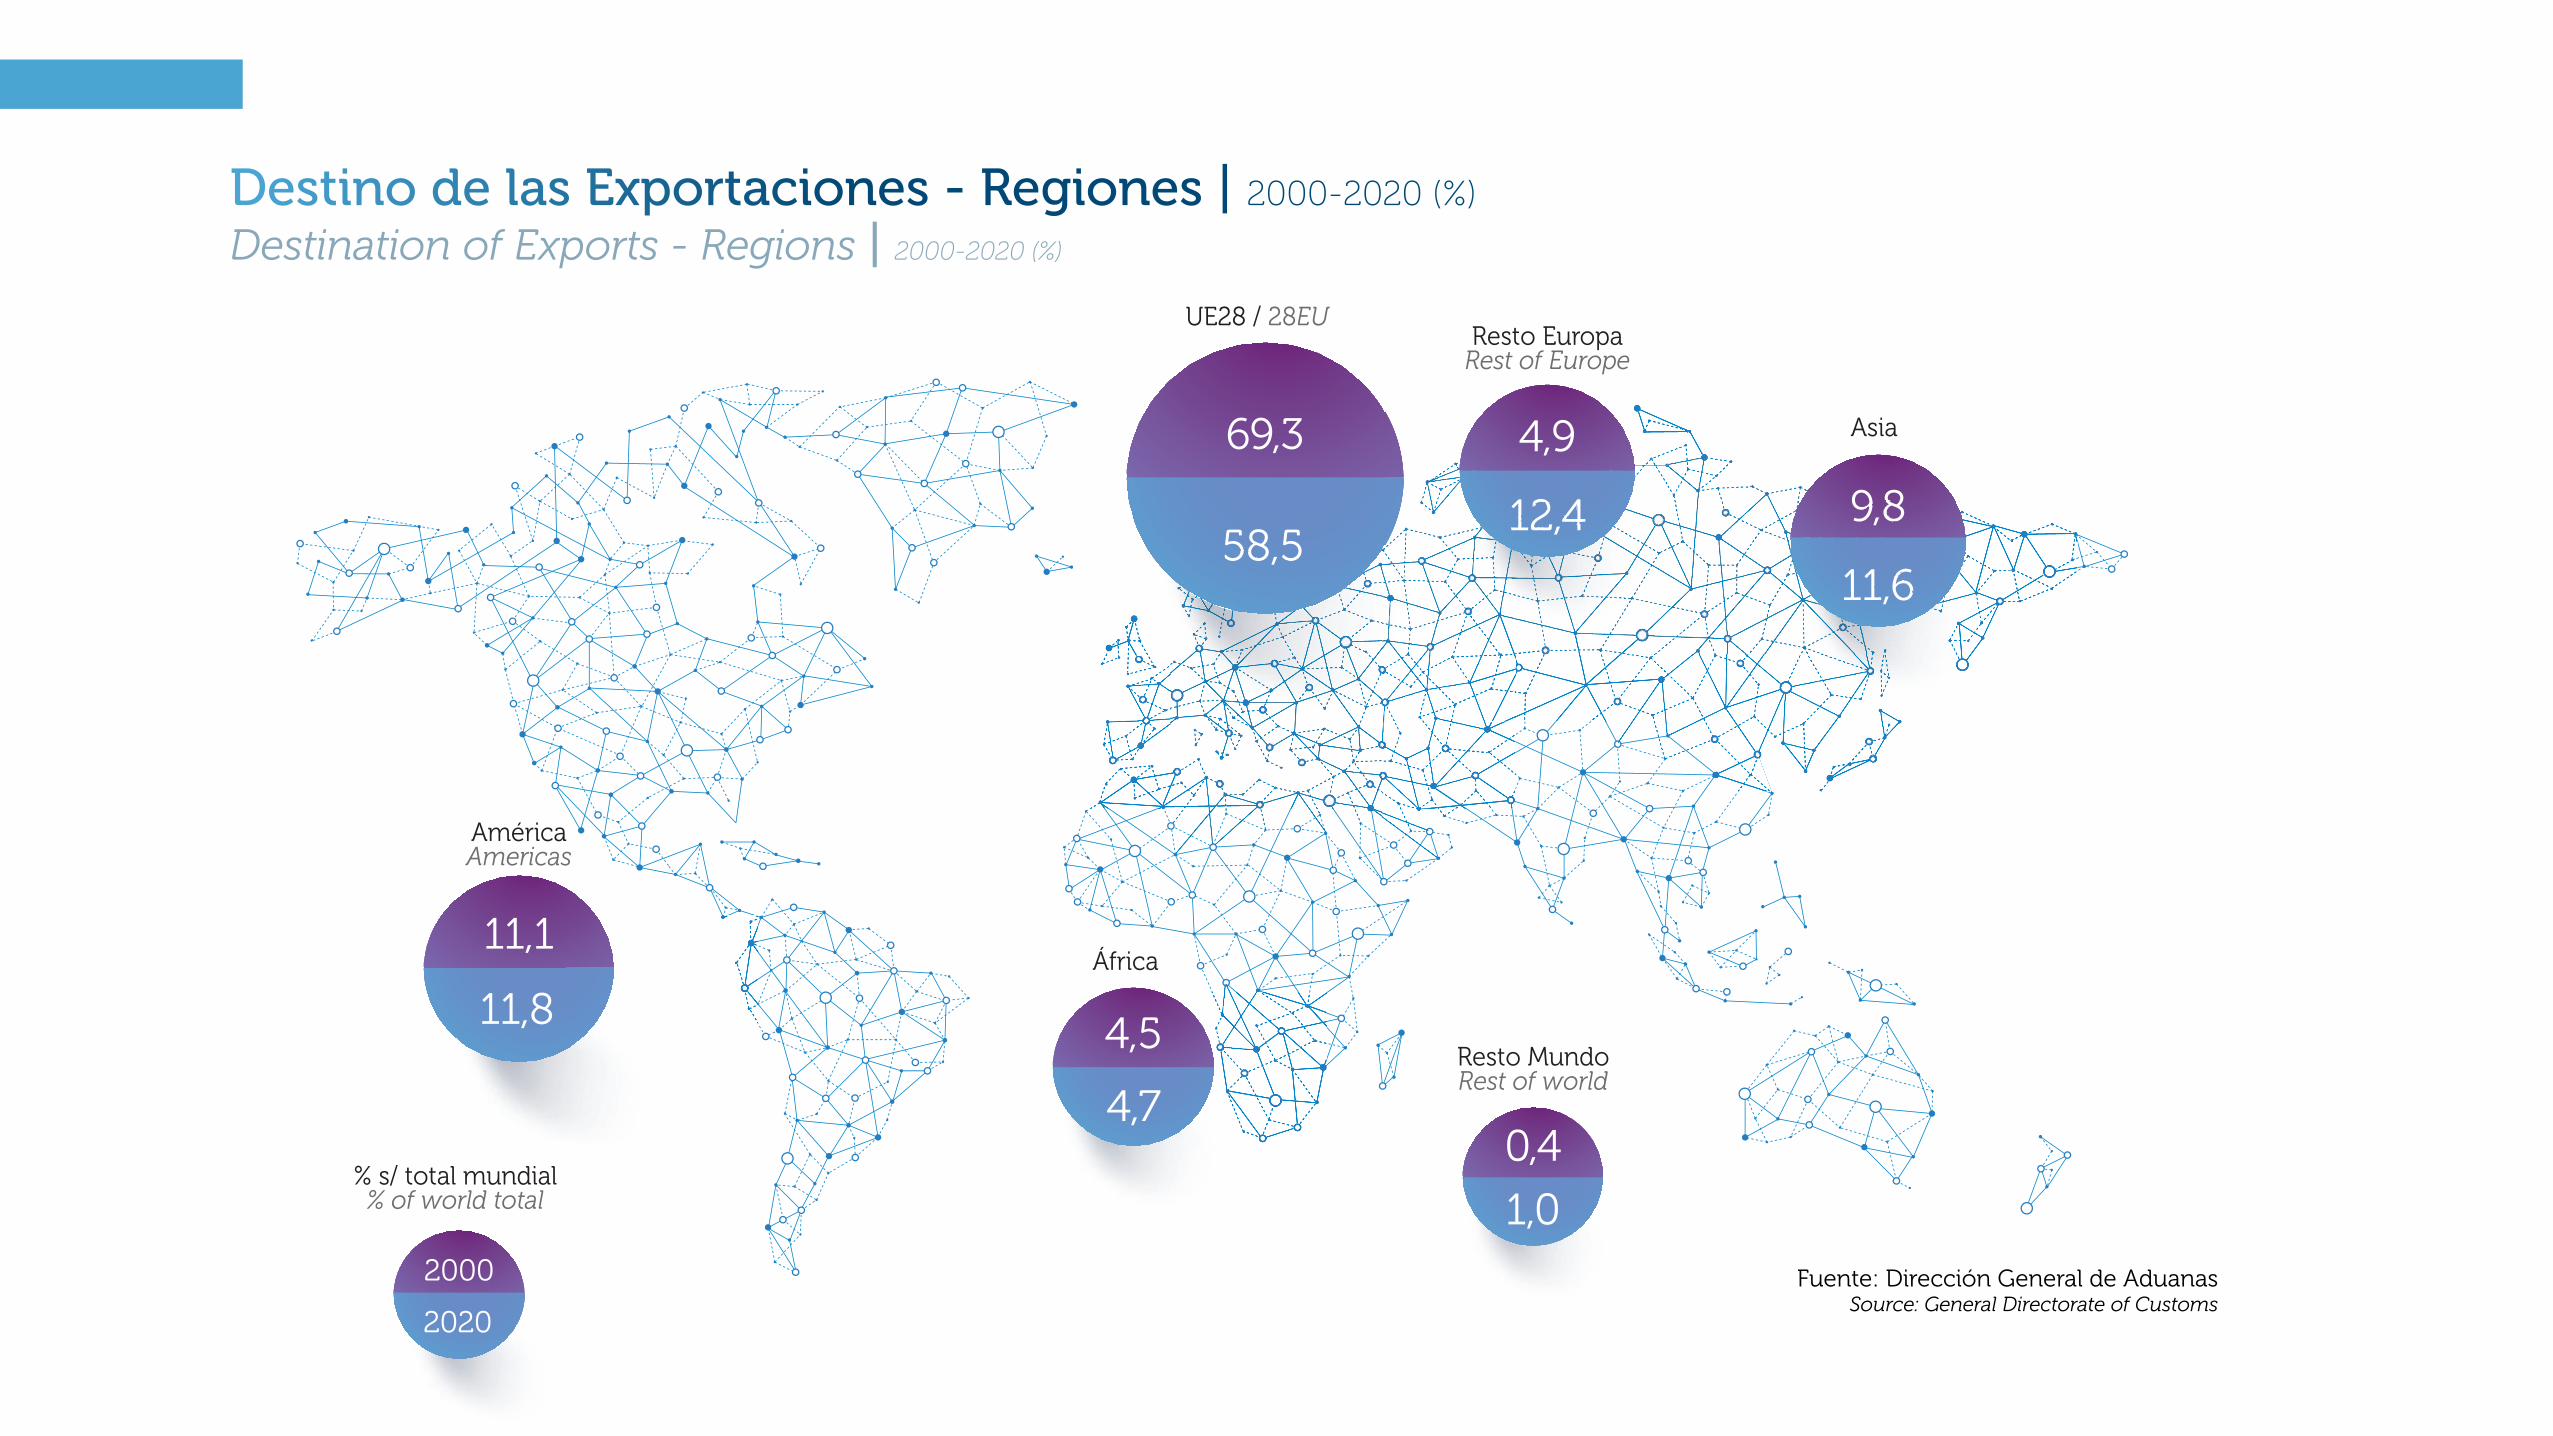
AméricaAmericas
11,1
11,8
UE28 / 28EU
69,3
58,5
% s/ total mundial% of world total
2000
2020
4,5
4,7
África
Resto MundoRest of world
0,4
1,0
Resto EuropaRest of Europe
4,9
12,4
Asia
9,8
11,6
Destino de las Exportaciones - Regiones | 2000-2020 (%)
Destination of Exports - Regions | 2000-2020 (%)
Fuente: Dirección General de AduanasSource: General Directorate of Customs

2000 2020 Variación (%)
Millones de € 2020/2000
1 Francia / France 1.460 3.934 169,5
2 Alemania / Germany 1.344 3.738 178,1
3 Italia / Italy 1.181 3.192 170,3
4 Suiza / Switzerland 229 2.980 1.201,3
5 Portugal 1.001 2.348 134,6
6 Estados Unidos / United States 462 1.609 248,3
7 Países Bajos / Netherlands 786 1.547 96,8
8 Reino Unido / United Kingdom 1.025 1.544 50,6
9 China 97 1.163 1.099,0
10 Bélgica / Belgium 435 936 115,2
2000 2020 Variación (%)
Millones de € 2020/2000
11 Turquía / Turkey 211 902 327,5
12 Polonia / Poland 93 687 638,7
13 Brasil / Brazil 151 674 346,4
14 Irlanda / Ireland 46 626 1.260,9
15 México 166 563 239,2
16 Japón / Japan 173 488 182,1
17 Grecia / Greece 110 458 316,4
18 Marruecos / Morocco 137 438 219,7
19 Argelia / Algeria 109 406 272,5
20 Austria 202 390 93,1
Destino de las Exportaciones - Países Top 20 | 2000-2020 (Millones €)
Destination of Export - Top 20 Countries | 2000-2020 (%)
Fuente: Dirección General de AduanasSource: General Directorate of Customs

Evolución de las Importaciones | 2007-2020 (Millones €)
Evolution of Imports | 2007-2020 (Million €)
Fuente: Dirección General de AduanasSource: General Directorate of Customs
157%Crecimiento AcumuladoCumulative Growth2000-2020
44%Crecimiento AcumuladoCumulative Growth2007-2020
45.156
-3%
50.000
45.000
40.000
35.000
30.000
25.000
20.000
15.0002007 2008 2009 2010 2011 2012 2013 2014 2015 2016 2017 2018 2019 2020
31.461
32.203
29.546
32.316
35.157
34.988 34.736
35.786
38.514
37.513
40.744
42.964
46.564

AméricaAmericas
7,7
11,8
UE28 / 28EU
77,2
65,7
1,3
1,3
África Resto MundoRest of world
0,1
0,1
Resto EuropaRest of Europe
5,5
7,2
Asia
8,2
13,9
% s/ total mundial% of world total
2000
2020
Origen de las Importaciones - Regiones | 2000-2020 (%)
Origin of Imports - Regions | 2000-2020 (%)

2000 2020 Variación (%)
Millones de € 2020/2000
1 Alemania / Germany 3.182 6.774 112,9
2 Francia / France 2.975 4.687 57,5
3 Estados Unidos / United States 1.113 4.186 276,1
4 Países Bajos / Netherlands 1.430 3.436 140,3
5 Italia / Italy 1.506 2.722 80,7
6 Bélgica / Belgium 1.151 2.716 136,0
7 Suiza / Switzerland 710 2.706 281,1
8 China 264 2.533 859,5
9 Reino Unido / United Kingdom 1.786 1.983 11,0
10 Irlanda / Ireland 763 1.352 77,2
2000 2020 Variación (%)
Millones de € 2020/2000
11 India 128 1.020 696,9
12 Portugal 401 822 105,0
13 Corea del Sur / South Korea 140 692 394,3
14 Dinamarca / Denmark 160 646 303,8
15 Polonia / Poland 40 497 1.142,5
16 Arabia Saudí / Saudi Arabia 135 430 218,5
17 Suecia / Sweden 264 362 37,1
18 Canadá 35 356 917,1
19 Austria 127 306 140,9
20 Japón / Japan 357 299 -16,2
Origen de las Importaciones - Países Top 20 | 2000-2020 (Millones €)
Origin of Imports - Top 20 Countries | 2000-2020 (Million €)
Fuente: Dirección General de AduanasSource: General Directorate of Customs

Evolución de la Tasa de Cobertura | (Exportación/Importación) 2007-2020 (%)
Evolution of the Coverage Rate | (Export/import) 2007-2020 (%)
Fuente: Dirección General de AduanasSource: General Directorate of Customs
81,0%
2007 2008 2009 2010 2011 2012 2013 2014 2015 2016 2017 2018 2019 2020
72,7 72,1 71,9
81,1 80,8
85,4
88,8 89,3
86,1 86,788,1
95
90
85
80
75
70
65
60
87,8%
83,6%
-3,1%
25%Crecimiento AcumuladoCumulative Growth2000-2020
11%Crecimiento AcumuladoCumulative Growth2007-2020

2000 2020
Millones de €
1 Francia / France 49,1% 83,9%
2 Alemania / Germany 42,2% 55,2%
3 Italia / Italy 78,4% 117,3%
4 Suiza / Switzerland 32,3% 110,1%
5 Portugal 249,6% 246,4%
6 Estados Unidos / United States 41,5% 38,4%
7 Países Bajos / Netherlands 55,0% 45,0%
8 Reino Unido / United Kingdom 57,4% 77,9%
9 China 36,7% 45,9%
10 Bélgica / Belgium 37,8% 34,5%
2000 2020
Millones de €
11 Turquía / Turkey 297,2% 337,8%
12 Polonia / Poland 232,5% 138,2%
13 Brasil / Brazil 201,3% 464,8%
14 Irlanda / Ireland 5,9% 46,3%
15 México 3.305,2% 356,3%
16 Japón / Japan 48,5% 163,2%
17 Grecia / Greece 687,5% 258,8%
18 Marruecos / Morocco 472,4% 209,6%
19 Argelia / Algeria 294,6% 278,1%
20 Austria 159,1% 127,5%
Fuente: Dirección General de AduanasSource: General Directorate of Customs
Tasa de Cobertura - Países Top 20 | Evolución 2000-2020 (%)
Coverage Rate - Top 20 Countries | Evolution 2000-2020 (%)

Consumo5
Consumption

Consumo de Productos Químicos | 2007-2020 (Millones €)
Fuente: INE. Encuesta Industrial de Empresas. Dirección General de Aduanas y Elaboración propiaSource: INE. Industrial Company Survey. General Directorate of Customs and Feique
73.105
75.000
70.000
65.000
60.000
55.000
50.000
58.326
61.558
56.060
59.248
62.400
60.22359.162
60.223
63.41764.013
2007 2008 2009 2010 2011 2012 2013 2014 2015 2016 2017 2018 2019 2020
67.940
70.887
74.066
-1,3%
73%Crecimiento AcumuladoCumulative Growth2000-2020
25%Crecimiento AcumuladoCumulative Growth2007-2020
Consumption of Chemical Products | 2007-2020 (Million €)
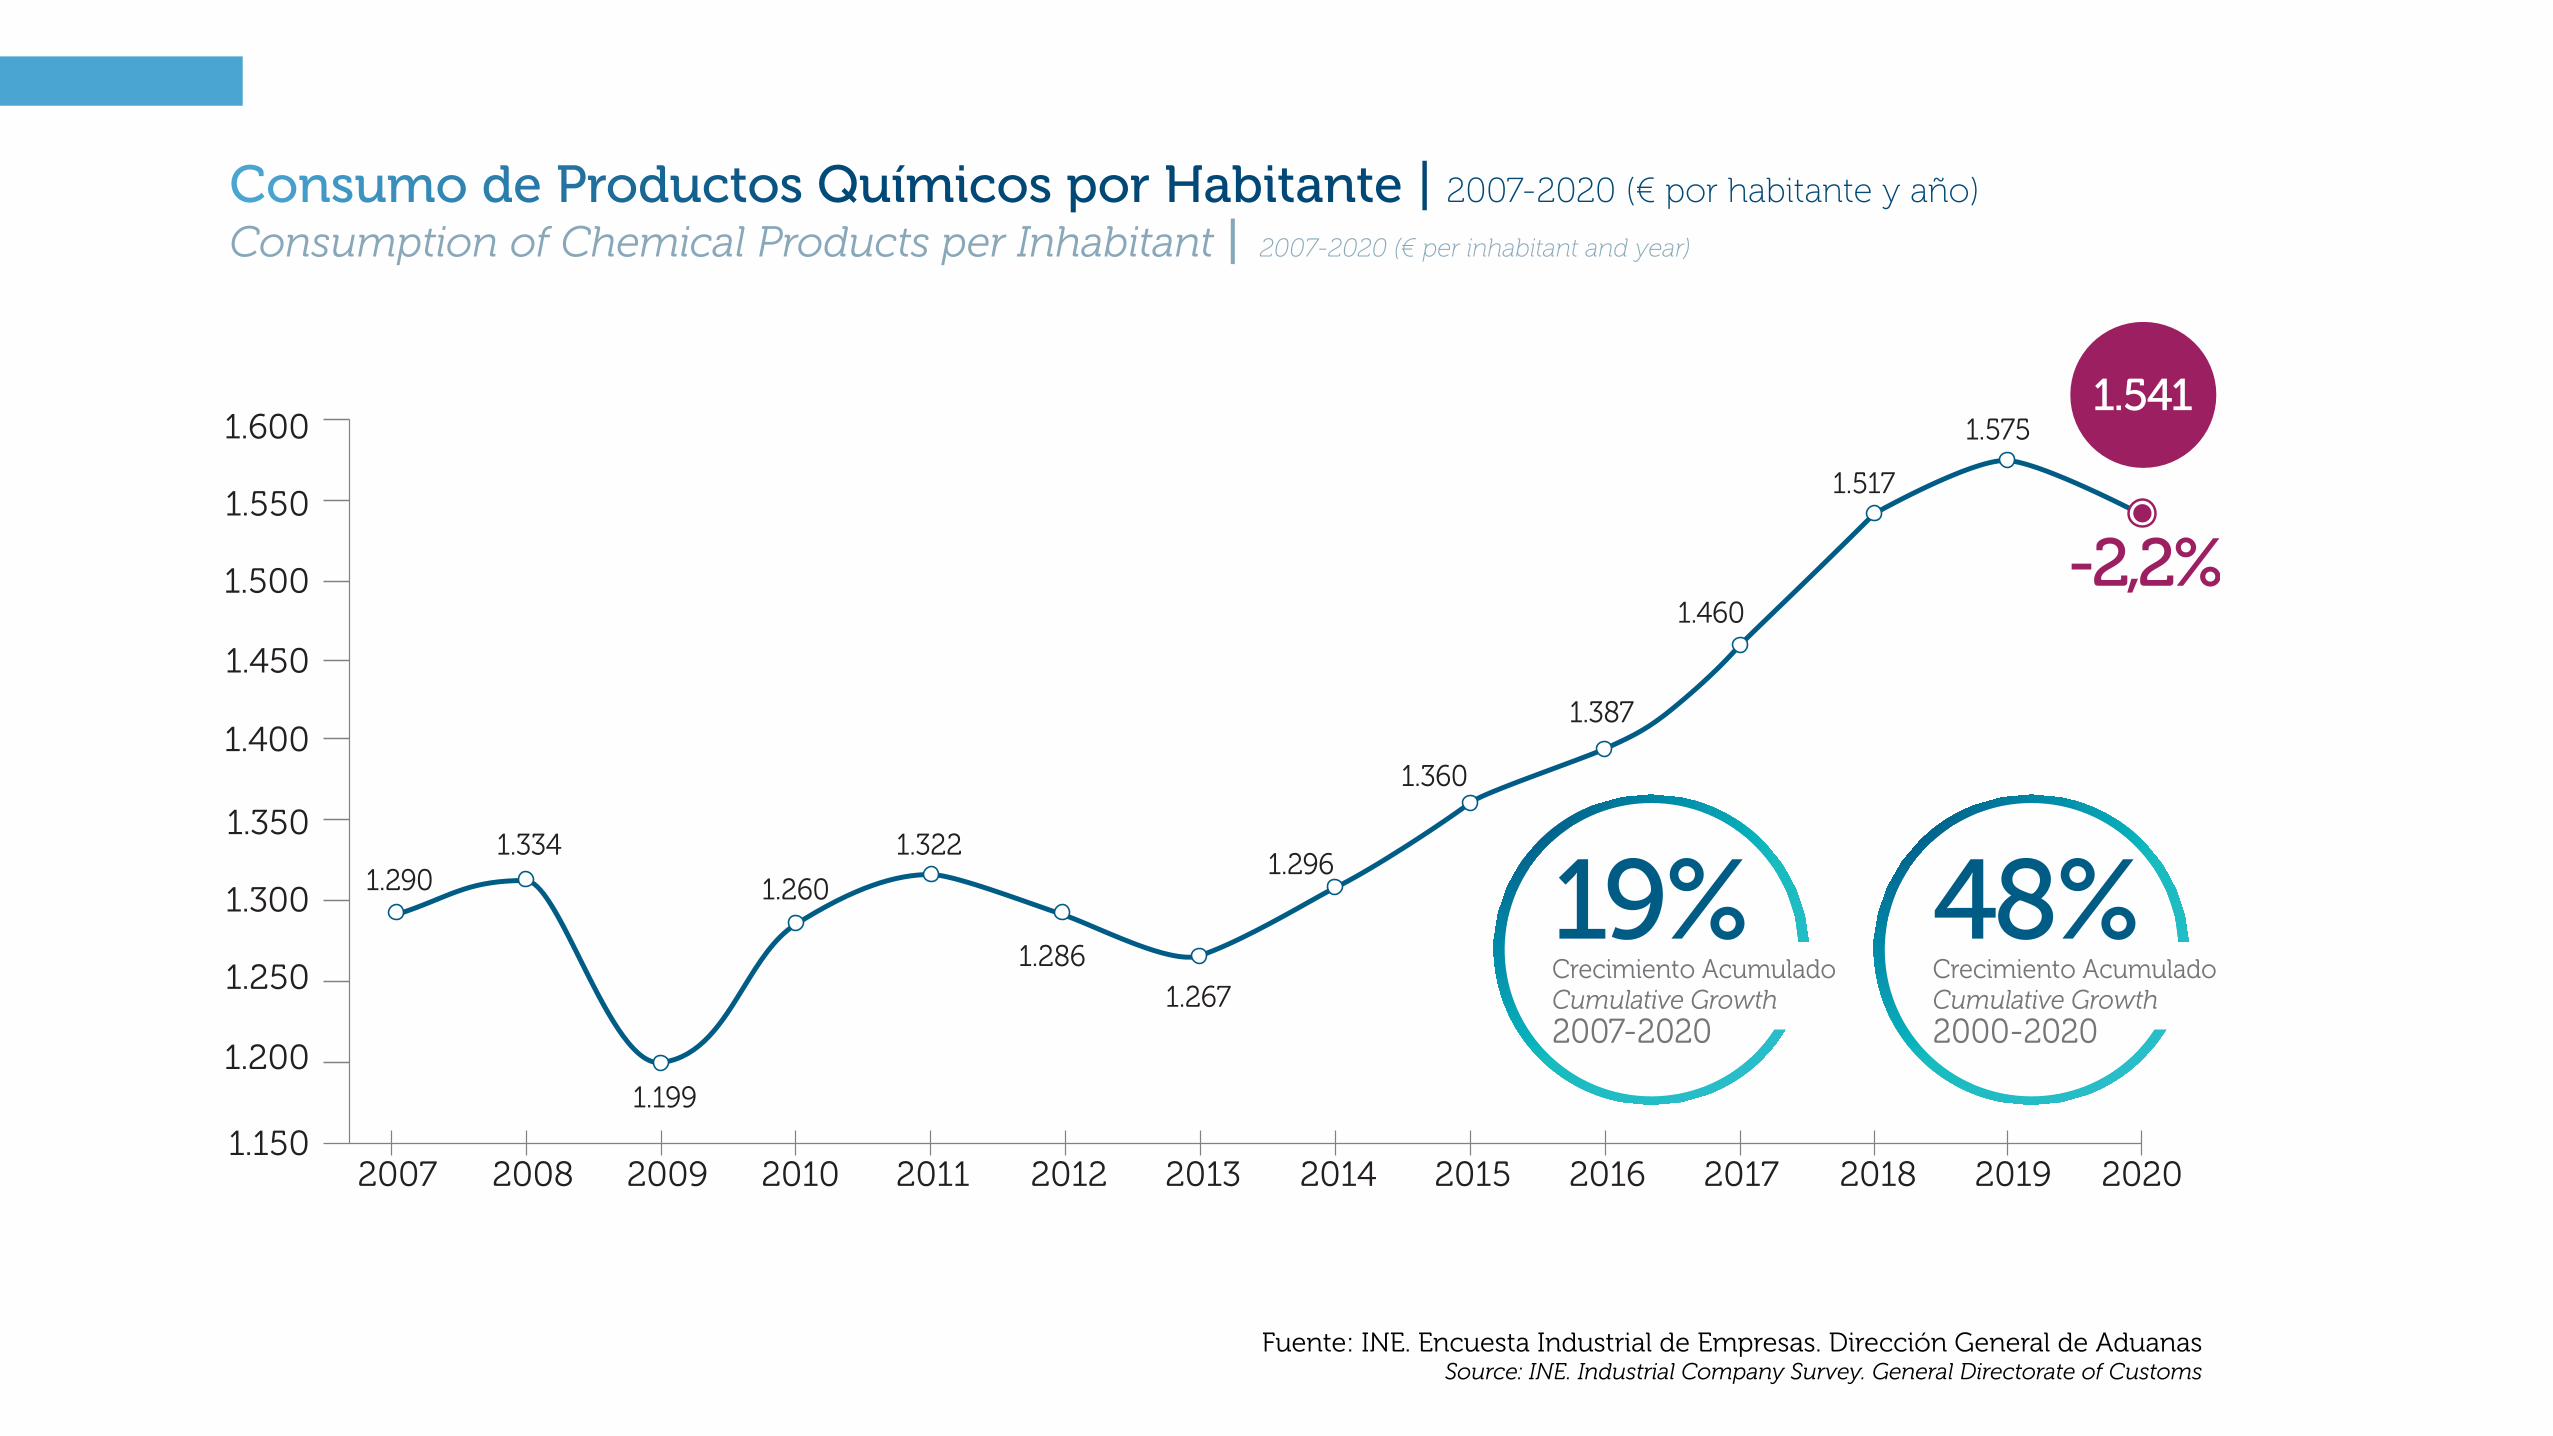
Consumo de Productos Químicos por Habitante | 2007-2020 (€ por habitante y año)
Consumption of Chemical Products per Inhabitant | 2007-2020 (€ per inhabitant and year)
Fuente: INE. Encuesta Industrial de Empresas. Dirección General de AduanasSource: INE. Industrial Company Survey. General Directorate of Customs
48%Crecimiento AcumuladoCumulative Growth2000-2020
19%Crecimiento AcumuladoCumulative Growth2007-2020
2007 2008 2009 2010 2011 2012 2013 2014 2015 2016 2017 2018 2019 2020
1.387
1.460
1.517
1.150
1.200
1.250
1.300
1.350
1.400
1.450
1.500
1.550
1.600
1.3341.290
1.199
1.260
1.286
1.322
1.267
1.296
1.360
1.5751.541
-2,2%

Empleo6
Employment

Empleo Total Generado | 2020
Total Employment Generated | 2020
Fuente: Encuesta de Población Activa. Coeficiente INPUT-OUTPUT (leontief)Source: Active population survey. INPUT-OUTPUT (leontief)
3,7%de la población activa ocupada
of the active occupied population
711.620Empleos Totales Generados
Total Jobs GeneratedAsalariados
Employees on the Payroll
Empleo Directo
209.300Direct Employment
AsalariadosEmployees on the Payroll
365.089
Empleo IndirectoIndirect Employment
AsalariadosEmployees on the Payroll
140.231
Empleo InducidoInduced Employment

Evolución del Empleo | 2007-2020 (Miles de Asalariados. Media Anual)
Evolution of Employment | 2007-2020 (Thousand of employees on the payroll. Annual Average)
Fuente: Encuesta de Población ActivaSource: Active population survey
209,3
196,8
220
200
180
160
140
120
100
194,7
196,1
169,4
172,0
2007 2008 2009 2010 2011 2012 2013 2014 2015 2016 2017 2018 2019 2020
193,5
162,1
161,2
164,3
174,6
191,4
179,5
205,2
27%Crecimiento AcumuladoCumulative Growth2000-2020
8%Crecimiento AcumuladoCumulative Growth2007-2020
+2%

Estabilidad Laboral por Sectores Económicos | 2020 (% Asalariados con Contrato Indefinido)
Labor Stability by Economic Sector | 2020 (% of employees on the payroll with permanent contracts)
Fuente: Encuesta de Población Activa (Asalariados con Contrato Indefinido sobre el total de asalariados). Encuesta Indicadores Responsible CareSource: Active population survey (employees with permanent contracts out of total employees). Responsible Care Indicators survey
Industria Química
Media Industrial
Servicios
Media Nacional
Construcción
Agricultura
Chemical industry
Industry average
Services
National average
Construction
Agriculture
20100 4030 60 7050 80 10090 %
29%
48%
63%
64%
75%
94%
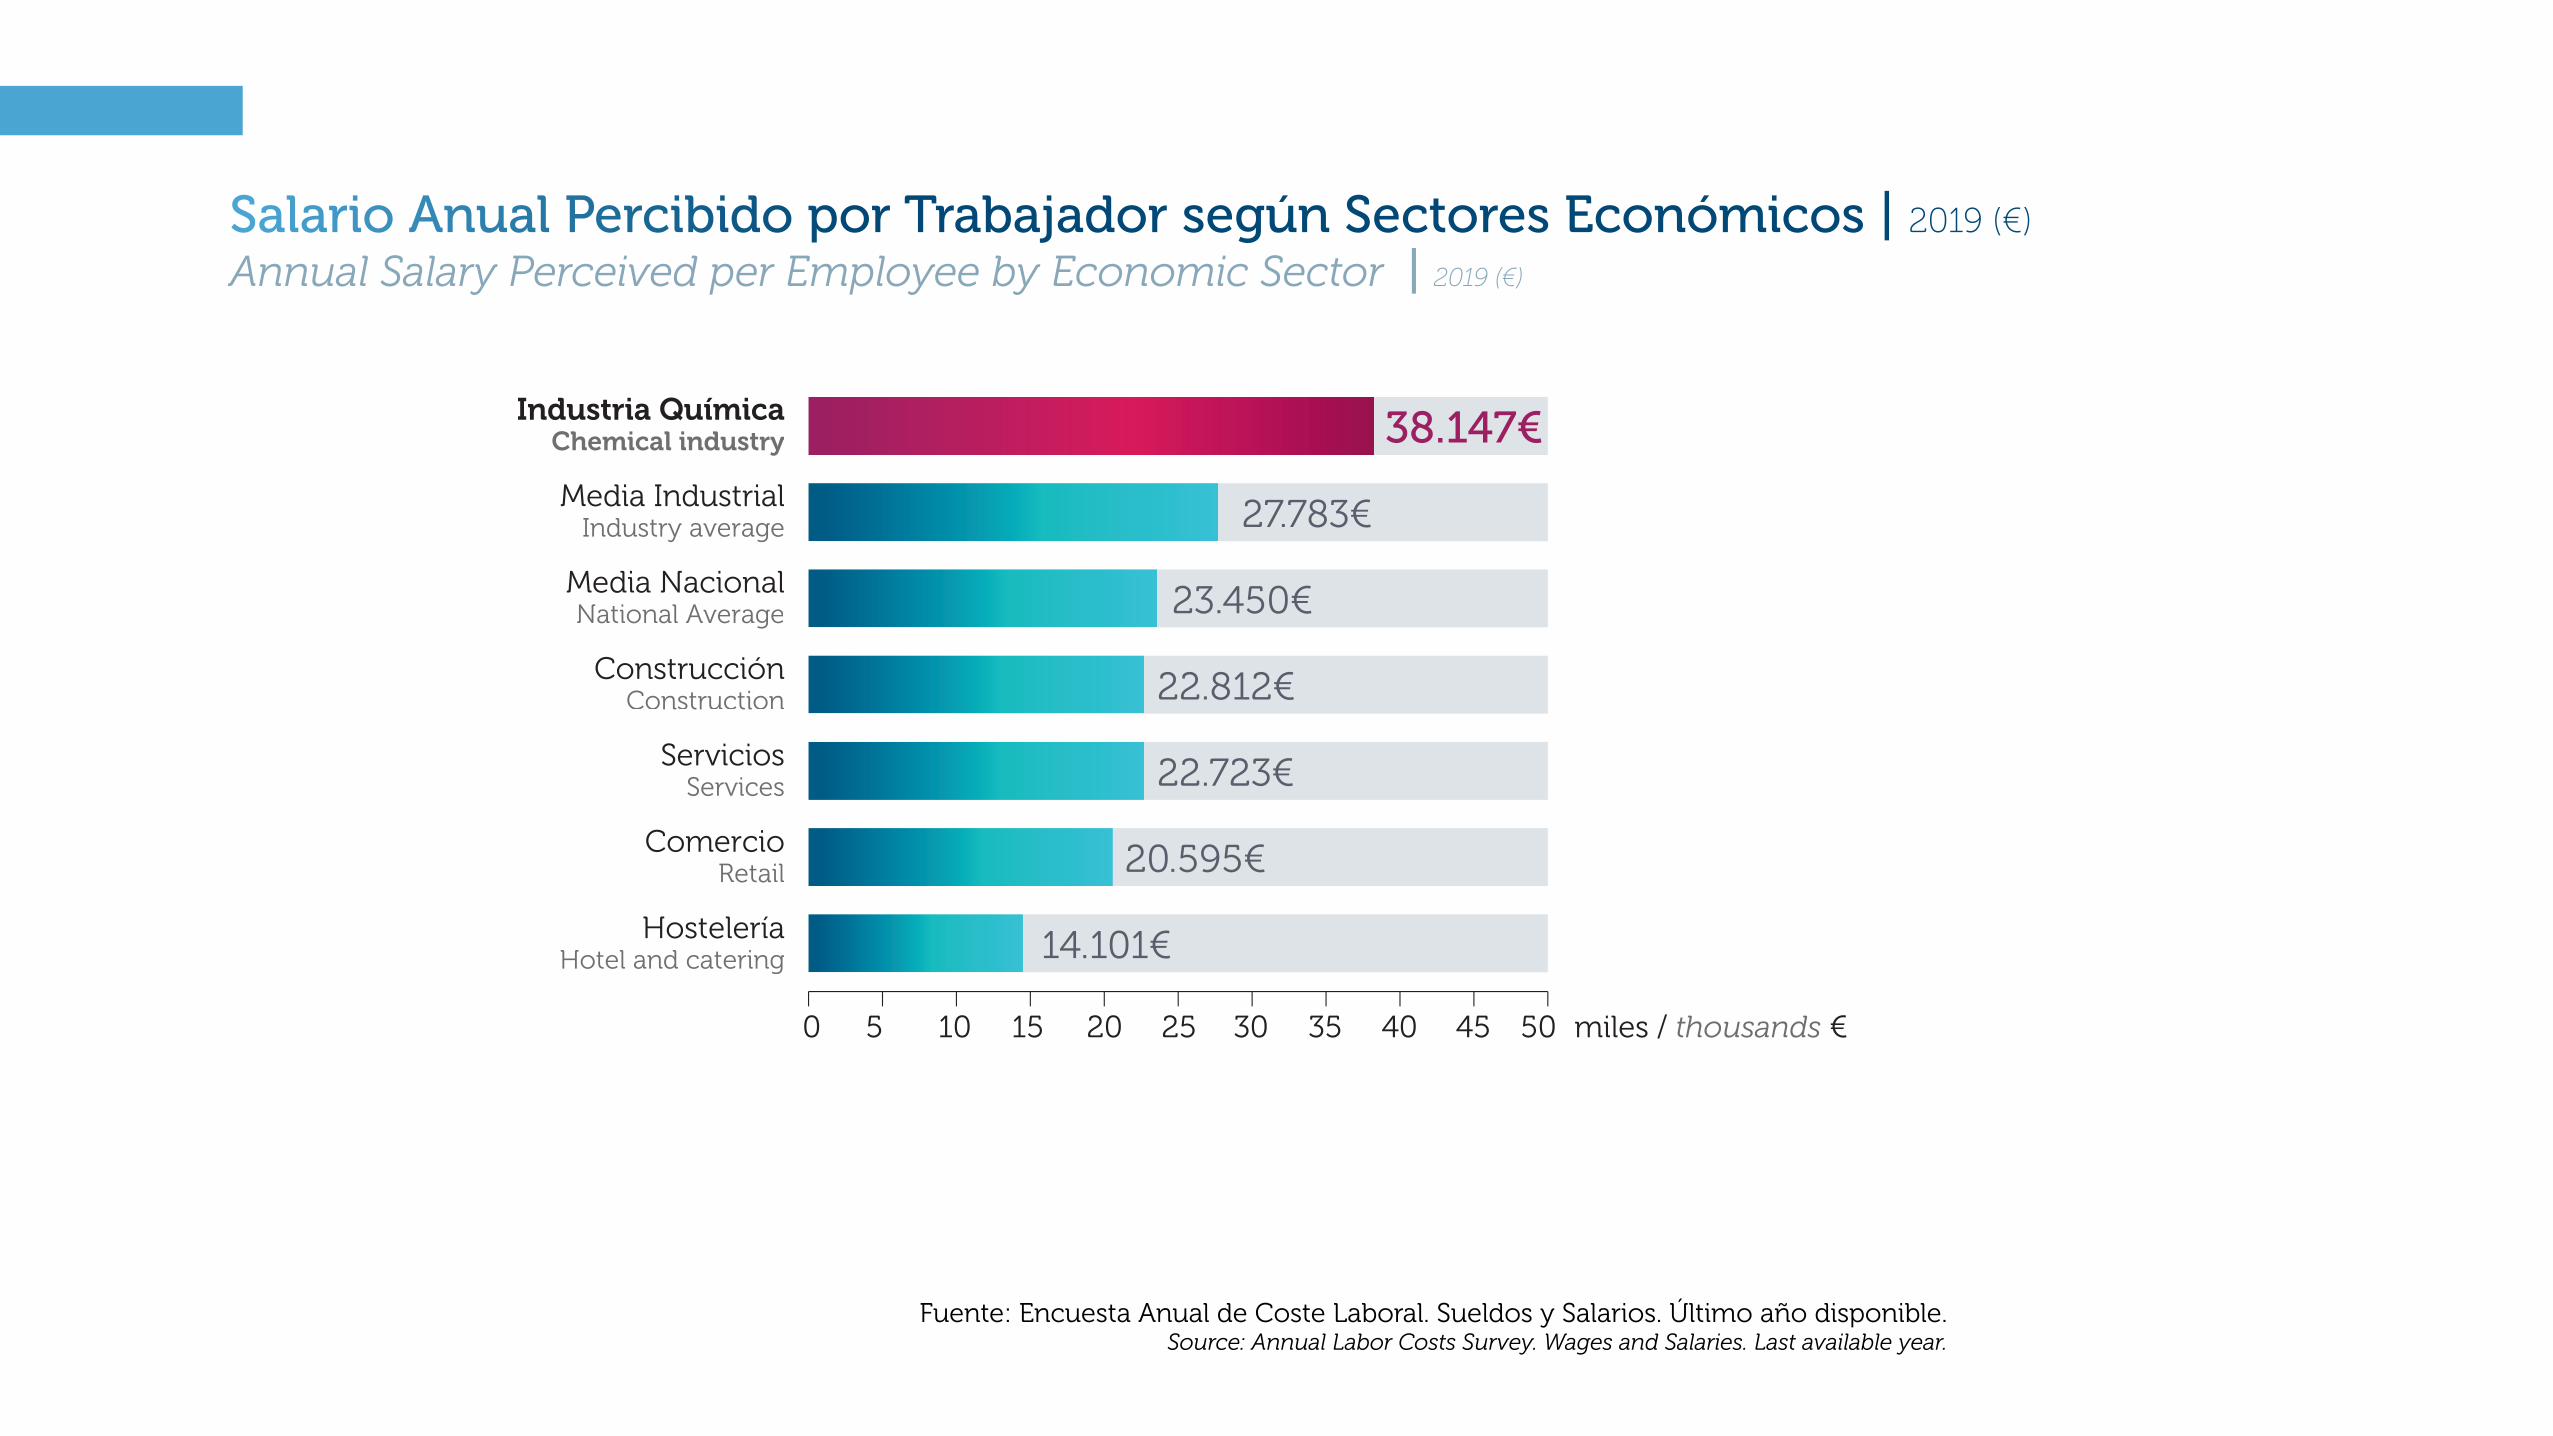
Salario Anual Percibido por Trabajador según Sectores Económicos | 2019 (€)
Annual Salary Perceived per Employee by Economic Sector | 2019 (€)
Industria Química
Media Industrial
Media Nacional
Construcción
Servicios
Comercio
Hostelería
Chemical industry
Industry average
National Average
Construction
Services
Retail
Hotel and catering
1050 2015 30 3525 40 5045 miles / thousands €
20.595€
14.101€
22.723€
22.812€
23.450€
27.783€
38.147€
Fuente: Encuesta Anual de Coste Laboral. Sueldos y Salarios. Último año disponible.Source: Annual Labor Costs Survey. Wages and Salaries. Last available year.

Gasto en Formación por Sectores Económicos | 2019 (€ por Asalariado y Año)
Expenditure on Training by Economic Sector | 2019 (€ per Employee and Year)
Fuente: Encuesta Anual de Coste Laboral. Gastos en Formación Profesional. Último año disponible.Source: Annual Labor Costs Survey. Expenditure on professional training. Last available year.
Industria Química
Media Industrial
Comercio
Construcción
Hostelería
Chemical industry
Industry average
Retail
Construction
Hotel and catering
50250 10075 150 175125 200 250 €225
22€
59€
62€
114€
229€

Cifra de Negocios por Empleado | 2007-2020 (Miles €)
Turnover per Employee | 2007-2020 (Thousand €)
Fuente: EPA. Encuesta Industrial de Empresas y elaboración propiaSource: EPA. Industrial Company Survey and FEIQUE
308
42%Crecimiento AcumuladoCumulative Growth2000-2020
21%Crecimiento AcumuladoCumulative Growth2007-2020
334 324
2007 2008 2009 2010 2011 2012 2013 2014 2015 2016 2017 2018 2019 2020
329
268255
280
309 342
343
337323
303
100
150
200
250
300
350
400
326
-2,9%

Inversión7
Investment

2.206
49%Crecimiento AcumuladoCumulative Growth2000-2020
16%Crecimiento AcumuladoCumulative Growth2007-2020
2007 2008 2009 2010 2011 2012 2013 2014 2015 2016 2017 2018 2019 2020
2.719
1.909
1.678
3.000
2.500
2.000
1.500
1.000
500
0
2.0801.820
1.586
1.9312.054
1.928
2.004
2.332
2.184 2.215
-0,4%
Inversión | 2007-2020 (Millones €)
Investment | 2007-2020 (Million €)
Fuente: INE. Encuesta Industrial de Empresas y elaboración propiaSource: INE. Industrial Company Survey and FEIQUE

Investigación, Desarrollo
e Innovación
8
Research, Developmentand Innovation

33%Crecimiento AcumuladoCumulative Growth2000-2019
12%Crecimiento AcumuladoCumulative Growth2007-2019
2007 2008 2009 2010 2011 2012 2013 2014 2015 2016 2017 2018 2019
25,1
26,0
24,0
24,8
27
26
25
24
23
22
21
20
25,8
24,224,0
24,624,9 24,9
25,826,0
26,8%
4,1%
Inversión y Gasto en I+D respecto al Total Industrial | 2007-2019 (% Sector Químico/Sector Industrial)
Investment and Expenditure on R&D compared to the Total Industry | 2007-2019 (% chemical sector/industrial sector)
Fuente: INE. Estadísticas sobre Actividades de I+D. Último año disponibleSource: INE. Statistics on R&D activities. Last available year
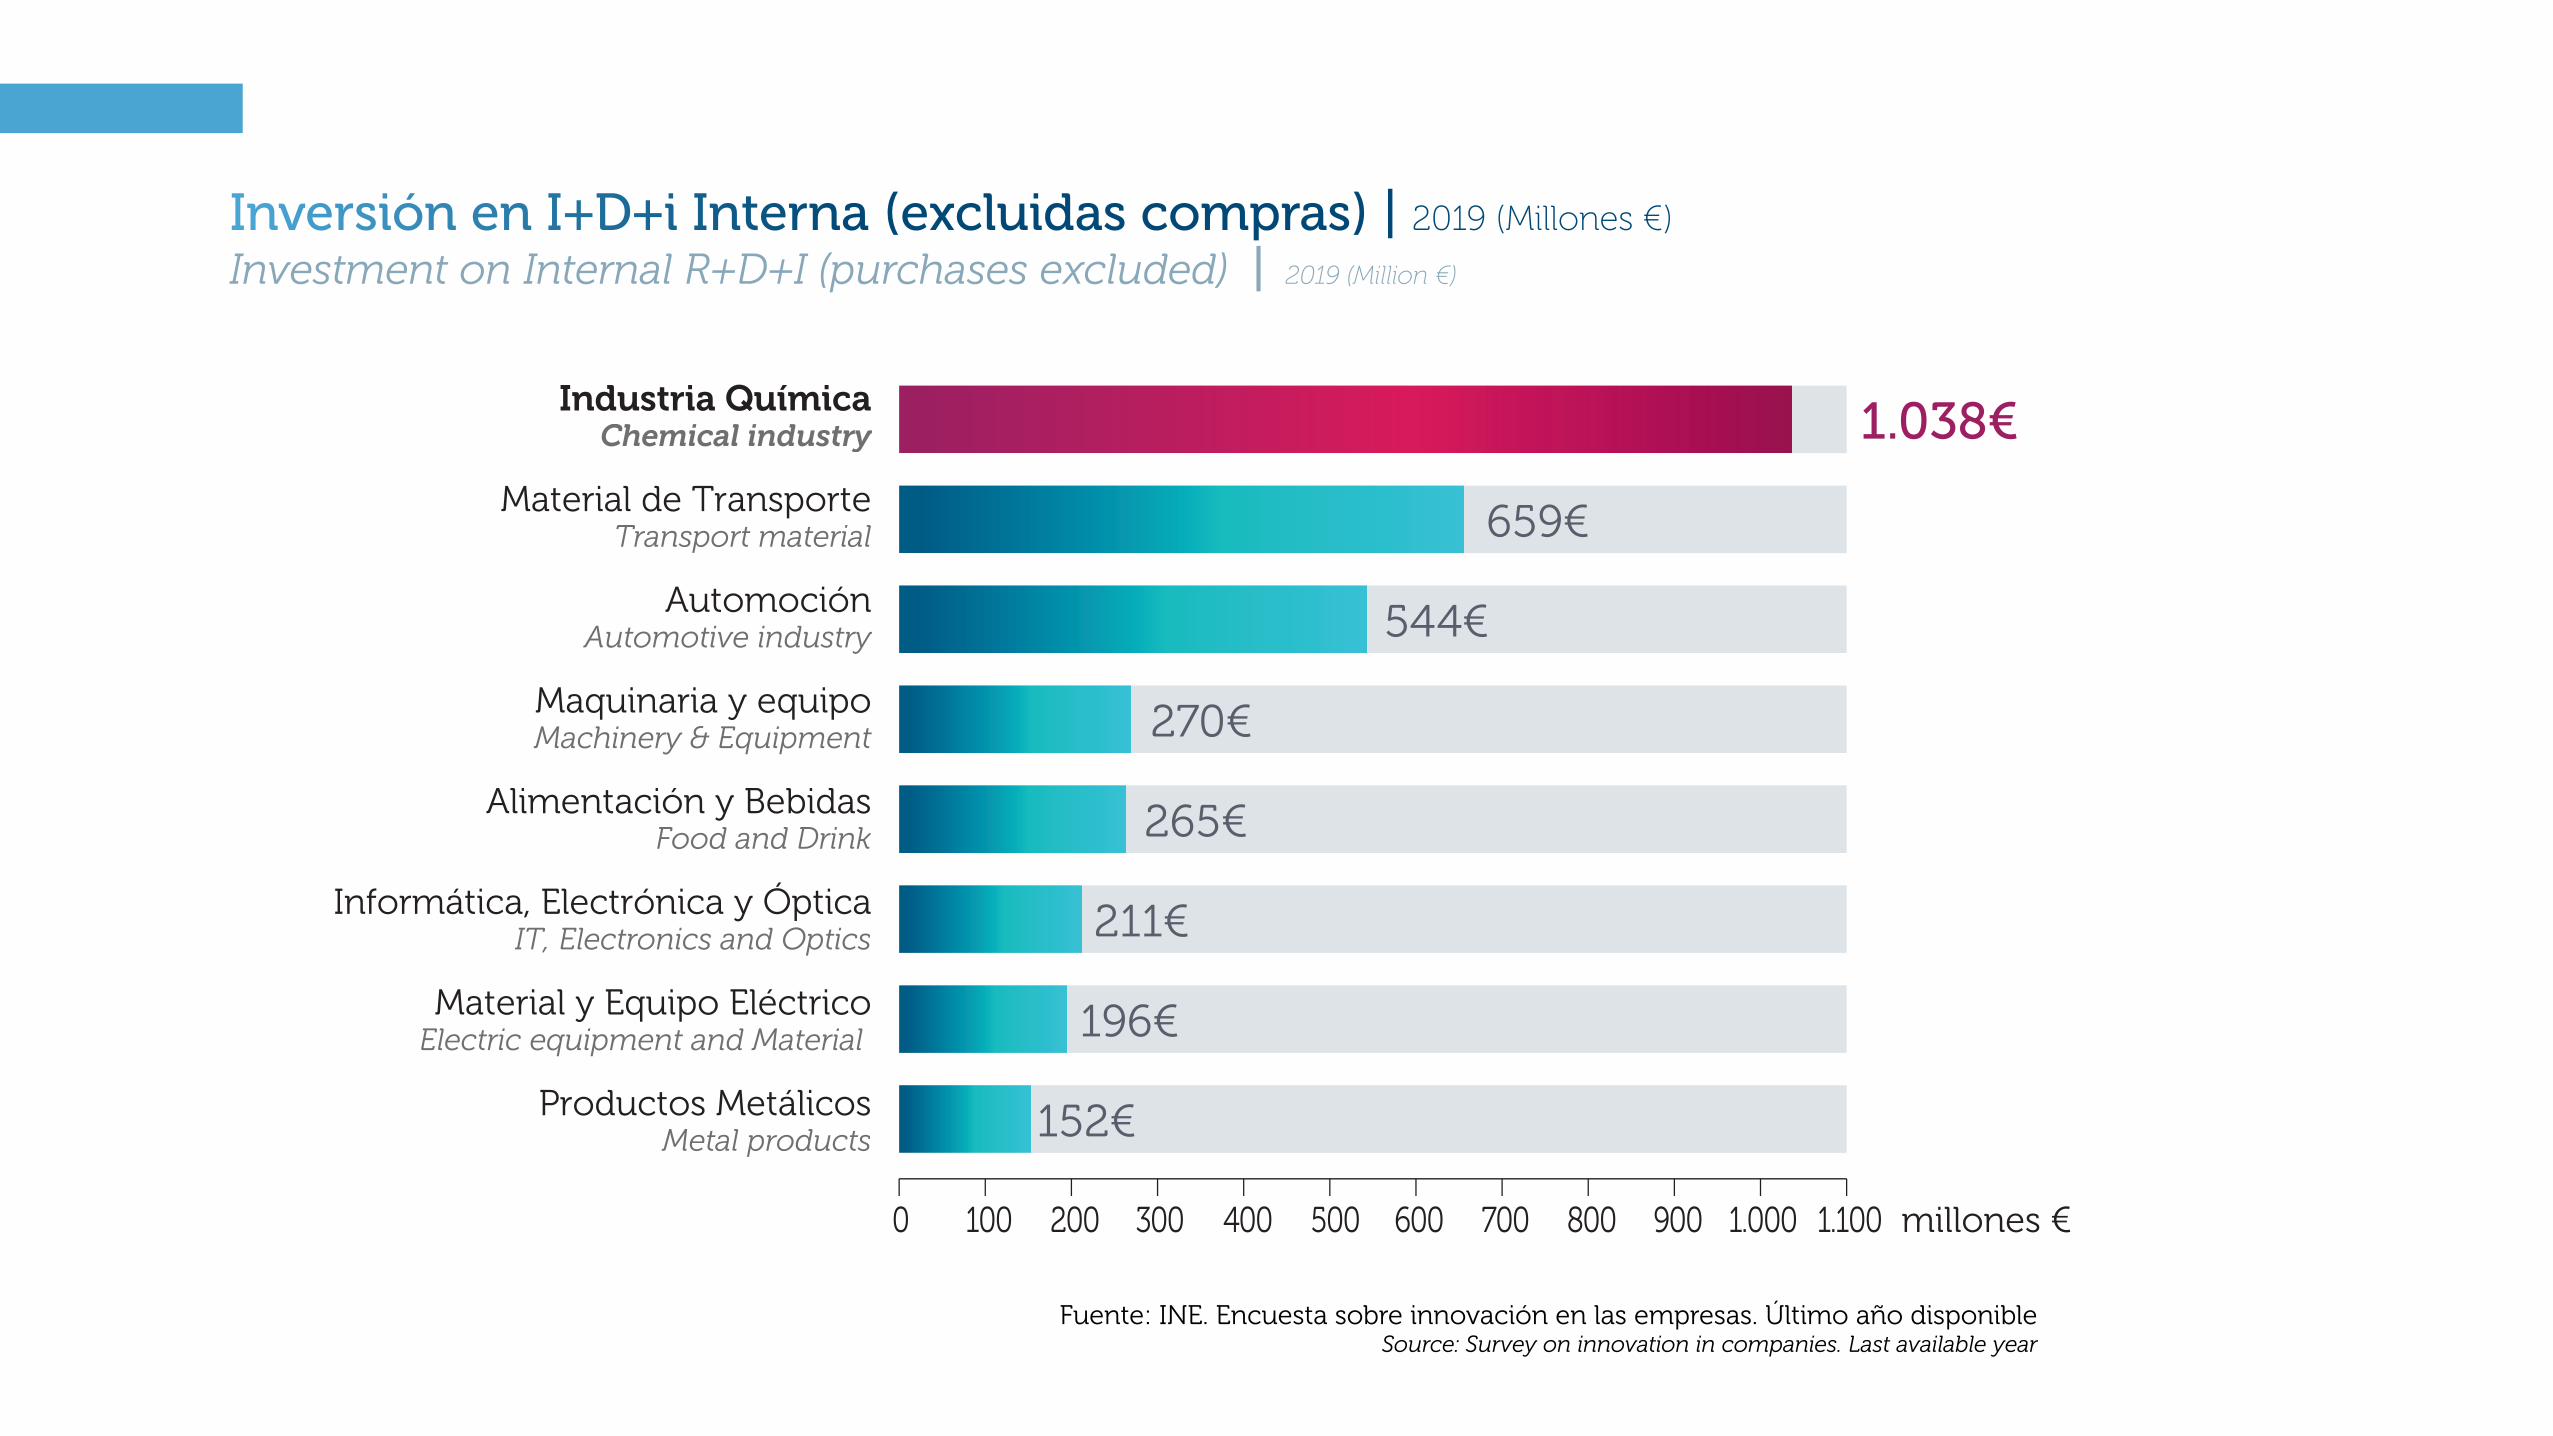
Inversión en I+D+i Interna (excluidas compras) | 2019 (Millones €)
Investment on Internal R+D+I (purchases excluded) | 2019 (Million €)
Industria Química
Material de Transporte
Automoción
Maquinaria y equipo
Alimentación y Bebidas
Informática, Electrónica y Óptica
Material y Equipo Eléctrico
Productos Metálicos
Chemical industry
Transport material
Automotive industry
Machinery & Equipment
Food and Drink
IT, Electronics and Optics
Electric equipment and Material
Metal products
2001000 400300 600 700500 800 1.000 1.100900 millones €
211€
196€
152€
265€
270€
544€
659€
1.038€
Fuente: INE. Encuesta sobre innovación en las empresas. Último año disponibleSource: Survey on innovation in companies. Last available year

Empresas Innovadoras | 2019 (% de empresas innovadoras sobre el total)
Innovative Companies | 2019 (% of innovative companies out of the total)
12,2%
11,3%
8,9%
14,5%
16,4%
25,5%
26,3%
62,1%Industria Química
Media Industrial
Energía y Agua
Media Nacional
Servicios
Agricultura
Construcción
Hostelería
Chemical industry
Industrial Average
Energy & Water
National Average
Services
Agriculture
Construction
Hotel and catering
20100 4030 60 7050 80 10090 %
Fuente: INE. Encuesta sobre innovación en las empresas. Último año disponibleSource: Survey on innovation in companies. Last available year

Investigadores contratados respecto al total Industrial | 2019 (%)
Research staff recruited of the total industry | 2019 (%)
Industria Química
Automoción
Maquinaria y Equipo
Alimentación y Bebidas
Construcción Aeronáutica
Informática, Electrónica y Óptica
Chemical industry
Automotive Industry
Machinery and equipment
Food and Drink
Aircraft Construction
IT, Electronics and Optics
420 86 12 1410 16 2018 %
6,7%
7,2%
10,0%
10,2%
11,4%
18,6%
Fuente: INE. Estadísticas sobre Actividades de I+D. Último año disponibleSource: INE. Statistics on R+D activities. Last available year

Intensidad de I+D+i | 2019 (% del valor añadido bruto invertido en I+D+I)
Intensity of R+D+i | 2019 (% of gross added value invested in R+D+I)
12
10
8
6
4
2
0
11,3%
QuímicaChemical
IndustriaIndustry
6,5%
Total NacionalNational Total
1,7%
Fuente: Encuesta sobre innovación en las empresas. Último año disponible.Source: Survey on innovation in companies. Last available year.

Horizonte 2030de la Industria
Química Española
9
2030 Horizon for the Spanish Chemical Industry

Industria Química
Transformación del Plástico y Caucho
Textil
Metal
Industria Manufacturera
Ingeniería Mecánica
Automoción
Cerámica y Vidrio
Papel
Industria Alimentaria
Chemical industry
Plastic and Rubber Transformation
Textile
Metal
Manufacturing Industry
Mechanical Engineering
Automotive Industry
Ceramic and Glass
Paper
Food Industry
210 43 5 %6
3,9%
3,5%
3,3%
2,9%
2,7%
4,0%
4,3%
4,4%
4,5%
4,5%
Perspectivas 2030 | Crecimiento Mundial previsto de los Sectores Industriales (variación media anual)
2030 Outlook | Global growth forecast for industrial sectors (annual average variation)
Fuente: VCI Prognos StudySource: VCI Prognos Study