snapshot of trends in 62 total displacement sites march 17, 2014 snapshot of trends in 62 total...
TRANSCRIPT

1
March 17, 2014 www.cccmphilippines.iom.int
Snapshot of Trends in 62 Total Displacement Sites
CCCM
66% of all sites are managed by the DSWD or LGU
89% of all sites have Site Management Committees (SMC)
100% of all sites have agencies providing camp management support services
SHELTER
56% of all sites have Safe On-Site Cooking Counters
39% of all sites are not vulnerable to natural hazards
42% of all sites have On-Site Electricity
FOOD and NUTRITION
15% of all sites have Supplementary Feeding for Children
6% of all sites have Supplementary Feeding for Breastfeeding Mothers
8% of all sites have malnutrition screening
WASH
53% of all sites have On-Site water sources
73% of all sites have person to latrine ratio of 1:20
42% of all sites do not have drainage problems
HEALTH
24% of all sites have health services being provided
16% of sites have psychosocial services available at their sites
53% of sites have a health referral system in place
EDUCATION
100% of all sites said their children are able to go to school
18% of all sites have informal education activities being conducted
18% of all sites that temporary learning spaces
PROTECTION
40% of all sites have 24-hour security in the displacement site
16% of all sites have women friendly spaces
24% of all sites have child friendly spaces

2
March 17, 2014 www.cccmphilippines.iom.int
Introduction
There will be two kinds of DTM narratives available to the CCCM Cluster and interested partners. One summary issue will cover all the displacement sites of the whole Haiyan Emergency Response. The individual hub DTM issues will present the details of the situation of the displacement sites found in each hub. Data for the March 27 summary and hub level issues were collected from March 10 – 13, 2014 and covers the period of March 3 – 9, 2014. This period is the 17th week since Typhoon Haiyan made landfall and swept through the Visayas region. The data provided in the DTM issues focus on demographic data and three key indicators for each of seven sectors namely CCCM, Shelter, Food, WASH, Health, Education, and Protection. These issues are all available in the CCCM Philippines Website and can be downloaded by cluster partners.
Trends for the Period
A big accomplishment for the Tacloban Hub for this period is the closure of five evacuation centers which in the last DTM had a total of 440 families. There are two transitional sites with bunkhouses that opened in the Tacloban Hub for this period namely the NHA Site and the Abucay Site and the population of these two in this DTM report is 450 families. One tent city in Barangay Magay, Tanauan was added to the list of displacement sites in the Tacloban Hub after its data was submitted by CCCM to the DSWD. One additional transitory site was opened in the Guiuan Hub at Barangay 3 at the Municipality of Balangkayan bringing to two the transitory sites in the municipality. The Ormoc Hub registered in this DTM the opening of two transitional sites with bunkhouses with a total population of 595 families and a new spontaneous settlement with 15 families. These bunkhouses were occupied with families that were carefully selected by the LGU and with the participation of the CCCM cluster members. The spontaneous settlement is found in the Municipality of San Isidro of Leyte Province. In the Roxas Hub, the spontaneous settlement in the Municipality of Batad was closed since it only
had 12 families in the past DTM issue and the population of the tent city in the Municipality of
Pontevedra also decreased.
In the Cebu Hub, preparations for the closure of the one existing tent city is on-going with
negotiations with partners and donors for transportation of the IDPs back to Leyte and Samar.
Typhoon Haiyan hit the Philippines on the 8th
of November 2013. It was one of the most powerful typhoons to
ever make landfall. Government estimates state that over 14 million people were affected by the typhoon
across 9 regions, 44 provinces and 574 municipalities. 1.1 million houses were damaged at the cost of 27
billion pesos and over 5,000 evacuation centers were activated in preparation for the typhoon. Bac
kgro
un
d
of
Situ
atio
n

3
March 17, 2014 www.cccmphilippines.iom.int
Section I. Master List of Displacement Sites in All Five Hubs
Population as of March 17, 2014
Province Municipality/City Site Name # of
Families # of
Persons
Guiuan Hub
Eastern Samar
Balangkayan Brgy. 1. (BH) TS 24 151
Brgy. 3 (BH) TS 24 92
Borongan Brgy. Sabang, Nabyawan(BH) TS 22 94
Brgy. Sabang, Suribao (BH) TS 24 100
Giporlos
Brgy. Biga (BH) TS 24 137
Brgy. Parena (BH) TS 47 225
Brgy. Paya (BH) TS 35 188
Guiuan
Brgy. 6 (BH) TS 36 181
Brgy. 12 (BH) TS 24 88
Brgy. Cagdara-o (BH) TS 24 106
Brgy. Campoyong (BH) TS 47 236
Brgy. Lupok (BH) TS 23 122
Brgy. Salug (BH) TS 27 125
Brgy. Salug, ESSU TC 112 508
Brgy. Sapao (BH) TS 48 220
Brgy. Sapao, San Roque (BH) TS 47 229
Brgy. Sto. Nino (BH) TS 17 65
Brgy. Surok (BH) TS 23 116
Hernani
Brgy. 3 (BH) TS 33 175
Brgy. 4 (BH) TS 59 331
Brgy. Batang (BH) TS 48 194
Brgy. Carmen, Lubang (BH) TS 24 108
Brgy. Carmen, Proper (BH) TS 24 106
Brgy. Garawon (BH) TS 40 202
Brgy. Padang (BH) TS 120 600
Maydolong Brgy. 4 (BH) TS 23 108
Mercedes Brgy. Busay ( BH) TS 23 129
Quinapondan
Brgy. 7 (BH) TS 24 112
Brgy. Bagte (BH) TS 24 97
Brgy. Naga (BH) TS 24 84
Salcedo Brgy. Asgad (BH) TS 24 93
Brgy. Jagnaya (BH) TS 24 99
Western Samar Marabut Brgy. Amambucale (BH) TS 59 279
Roxas Hub Capiz Pontevedra Roging Dadivas Civic Center TC 9 48
Concepcion Bakjawan (BH) TS 17 83
Estancia NIPSC TC 91 428
Cebu Hub Cebu Cebu Family Rebuilding Center TC 54 183
Ormoc Hub
Leyte Ormoc
Can-untog (BH) TS 252 1,027
Concepcion (BH) TS 343 1,522
San Isidro Biasong SS 15 74
Tacloban Hub
Leyte
Palo Government Center (BH) TS 87 457
Tacloban City
Street Light Building EC 18 75
Rizal Central School EC 38 170
Martinez Building EC 31 123

4
March 17, 2014 www.cccmphilippines.iom.int
Leyte
Tacloban City
San Fernando Central School EC 334 1,352
NHA (BH) TS 266 1,191
Brgy. 83- A Health Center EC 9 33
Brgy. 88 Alimasag TC 105 479
Brgy. 88 Baloc 1 TC 68 390
Brgy. 88 Baloc II TC 26 132
Brgy. 88 Costa Brava TC 74 336
Brgy. 88 Fisherman-Timex TC 265 1263
Brgy. 88 Mahusay Beach TC 90 416
Brgy. 88 San Jose Old Terminal TC 170 744
Brgy. 88 Sandy Beach TC 80 350
IPI (BH) TS 519 2129
Abucay (BH) TS 184 787
Tanauan
Our Lady of Assumption TC 28 138
Tanauan Cenral School II TC 104 413
Tanauan National High School TC 127 598
Brgy. Magay TC 170 489
Western Samar Basey San Vicente (BH) TS 191 868
Grand Total 4,966 21,998 EC – Evacuation Center; TC – Tent City; SS – Spontaneous Settlement; TS – Transitory Site
Sites that closed since the last DTM issue on March 3, 2014:
1. Tabunan Spontaneous Site, Batad, Roxas Hub
2. Kapangian Central School Evacuation Center, Tacloban City, Tacloban Hub
3. People’s Center Evacuation Center, Tacloban City, Tacloban Hub
4. Leyte National High School Evacuation Center, Tacloban City, Tacloban Hub
5. Tacloban City Convention Center, Tacloban City, Tacloban Hub
6. Anibong Elementary School Evacuation Center, Tacloban City, Tacloban Hub
Sites that opened since the last DTM issue on March 3, 2014:
1. Brgy. 3 (BH) Transitory Site,
Balangkayan, Guiuan Hub
2. NHA (BH) Transitory Site,
Tacloban City, Tacloban Hub
3. Abucay (BH) Transitory Site,
Tacloban City, Tacloban Hub
4. Brgy. Magay Tent City,
Tanauan, Tacloban Hub
5. Can-untog (BH) Transitory
Site, Ormoc, Ormoc Hub
6. Concepcion (BH) Transitory
Site, Ormoc, Ormoc Hub
7. Biasong Spontaneous
Settlement, San Isidro,
Ormoc Hub
IDPs that moved in to the newly opened Abucay (BH) Transitory Site came from Anibong Elementary School EC, People’s Center EC and Brgy.88 tent cities.

5
March 17, 2014 www.cccmphilippines.iom.int
Section II. Summary of DTM Results Across All Five Hubs
Number of Families by Site Type
Hub
Evacuation Centers
Tent City Spontaneous Settlement
Transitional Site
Total Sites
Total Families % of
Families # Sites
# Fams
# Sites
# Fams
# Sites
# Fams
# Sites
# Fams
# Sites
# Fams
1. Guiuan Hub 0 0 1 112 0 0 32 1,089 33 1,201 24%
2. Tacloban Hub 5 430 12 1,307 0 0 5 1,247 22 2,984 60%
3. Ormoc Hub 0 0 0 0 1 15 2 595 3 610 12%
4. Cebu Hub 0 0 1 54 0 0 0 0 1 54 1%
5. Roxas Hub 0 0 2 100 0 0 1 17 3 117 2%
Total 5 430 16 1,573 1 15 40 2,948 62 4,966 100%
Percentages 8% 9% 26% 32% 2% 0.30% 65% 59% 100% 100% Totals and Percentages from the Previous DTM Issue – March 3, 2014
Total 10 1,109 15 1,326 1 12 35 1,506 61 3,953 100%
Percentages 16% 28% 25% 34% 2% 0% 57% 38% 100% 100%
There are a total of 62 displacement sites covered by this report which has increased from 61 sites
since the previous report. Though the increase is only 1 site, there were actually 6 sites that closed
and 7 opened. This issue now also covers a total of five hubs, with the inclusion of Roxas Hub area of
operations.
There are 3,953 families in the 61 displacement sites with a total of 17,763 individuals.
Tacloban hub has 60% of the population or 2, 984 families in 22 sites mostly composed tent cities.
Guiuan hub has the most number of sites composed of 32 transitory sites and 1 tent city, holding
24% of the total population or 1,201 families.
Population of Persons with Special Needs
Hub
Population Persons with Special Needs
# Families # Individuals # of
Pregnant Women
# of Breastfeeding
Mothers
# of Persons
w/ Disability
# of Persons
w/ Chronic Diseases
# of Single
Headed Families
1. Guiuan Hub 1,201 5,700 59 170 67 50 180
2. Tacloban Hub 2,984 12,933 106 280 36 6 157 3. Ormoc Hub 610 2,623 22 37 13 2 7 4. Cebu Hub 54 183 0 4 1 0 12 5. Roxas Hub 117 559 1 5 3 0 0 Total 4,966 21,998 188 496 120 58 356
There are 4,966 families in the 62 displacement sites with a total of 21,998 individuals. There are a
total of 188 women who are pregnant and 496 who are breastfeeding. Also out of this population,
there are 120 persons with disabilities, and 58 identified with chronic illnesses. Out of 21,998
families, 356 are single headed families.

6
March 17, 2014 www.cccmphilippines.iom.int
CCCM and Shelter
Hub
CCCM Shelter
# of sites managed by the DSWD or
LGU
# of sites that have
Site Management Committees
(SMC)
# of sites with agencies
providing camp
management support services
# of sites with Safe On-Site Cooking Counters
# of sites that are not vulnerable to natural
hazards
# of sites that have On-Site
Electricity
Yes No Yes No Yes No Yes No Yes No Yes No
1. Guiuan Hub 33 0 33 0 33 0 22 11 13 20 17 16
2. Tacloban Hub 7 15 21 1 22 0 8 14 4 18 5 17
3. Ormoc Hub 0 3 0 3 3 0 2 1 3 0 2 1
4. Cebu Hub 1 0 1 0 1 0 1 0 1 0 1 0
5. Roxas Hub 0 3 0 3 3 0 2 1 3 0 1 2
Total 41 21 55 7 62 0 35 27 24 38 26 36
Percentage 66% 34% 89% 11% 100% 0% 56% 44% 39% 61% 42% 58%
In terms of site management, 41 sites or 66% are covered by the DSWD or the LGU. There are 55
sites or 89% who have site management
committees. All sites have agencies
providing camp management support
services.
Only 56% (35 sites) have safe on-site
cooking counters in locations not near the
living spaces of the IDPs. 61% (38 sites) are
considered vulnerable to natural hazards i.e.
located less than 40 meters from the sea,
located in low lying areas, or located in
landslide prone areas. Only 26 sites or 42%
have on-site electricity.
Food, Nutrition and Water and Sanitation and Hygiene (WASH)
Hub
Food and Nutrition WASH
# of sites that have
Supplementary Feeding for
Children
# of sites that have
Supplementary Feeding for
Breastfeeding Mothers
# of sites that have
malnutrition screening
# of sites that have On-Site water
sources
# of sites that have person to
latrine ratio of 1:20
# of sites that do not
have drainage problems
Yes No Yes No Yes No Yes No Yes No Yes No
1. Guiuan Hub 0 33 0 33 0 33 13 20 33 0 11 22
2. Tacloban Hub 8 14 3 19 4 18 17 5 8 14 11 11
3. Ormoc Hub 0 3 1 2 0 3 2 1 2 1 1 2
4. Cebu Hub 1 0 0 1 1 0 1 0 1 0 1 0
5. Roxas Hub 0 3 0 3 0 3 0 3 1 2 2 1
Total 9 53 4 58 5 57 33 29 45 17 26 36
Percentage 15% 85% 6% 94% 8% 92% 53% 47% 73% 27% 42% 58%
An open pit in IPI/Motocross Transitory Site needs to be filled/closed to avoid accidents and development of health problems due to poor sanitation.
7
March 17, 2014 www.cccmphilippines.iom.int
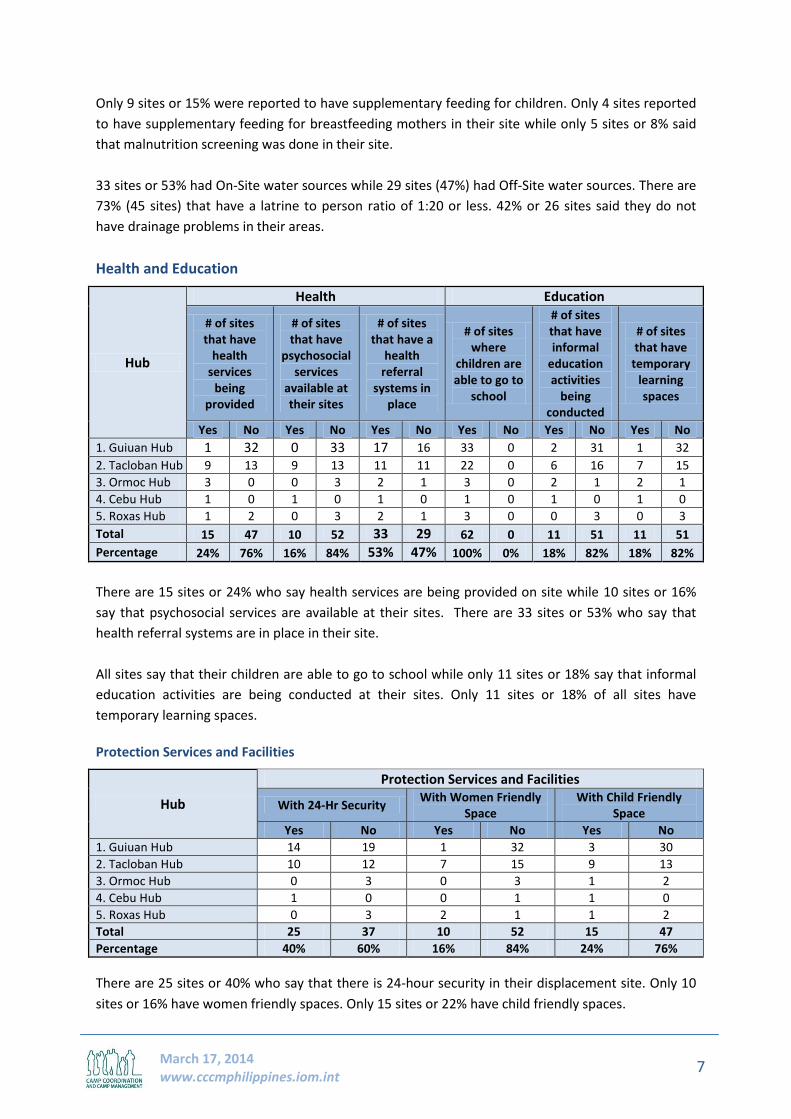
Only 9 sites or 15% were reported to have supplementary feeding for children. Only 4 sites reported
to have supplementary feeding for breastfeeding mothers in their site while only 5 sites or 8% said
that malnutrition screening was done in their site.
33 sites or 53% had On-Site water sources while 29 sites (47%) had Off-Site water sources. There are
73% (45 sites) that have a latrine to person ratio of 1:20 or less. 42% or 26 sites said they do not
have drainage problems in their areas.
Health and Education
Hub
Health Education
# of sites that have
health services
being provided
# of sites that have
psychosocial services
available at their sites
# of sites that have a
health referral
systems in place
# of sites where
children are able to go to
school
# of sites that have informal
education activities
being conducted
# of sites that have
temporary learning spaces
Yes No Yes No Yes No Yes No Yes No Yes No
1. Guiuan Hub 1 32 0 33 17 16 33 0 2 31 1 32
2. Tacloban Hub 9 13 9 13 11 11 22 0 6 16 7 15
3. Ormoc Hub 3 0 0 3 2 1 3 0 2 1 2 1
4. Cebu Hub 1 0 1 0 1 0 1 0 1 0 1 0
5. Roxas Hub 1 2 0 3 2 1 3 0 0 3 0 3
Total 15 47 10 52 33 29 62 0 11 51 11 51
Percentage 24% 76% 16% 84% 53% 47% 100% 0% 18% 82% 18% 82%
There are 15 sites or 24% who say health services are being provided on site while 10 sites or 16%
say that psychosocial services are available at their sites. There are 33 sites or 53% who say that
health referral systems are in place in their site.
All sites say that their children are able to go to school while only 11 sites or 18% say that informal
education activities are being conducted at their sites. Only 11 sites or 18% of all sites have
temporary learning spaces.
Protection Services and Facilities
Hub
Protection Services and Facilities
With 24-Hr Security With Women Friendly
Space With Child Friendly
Space
Yes No Yes No Yes No
1. Guiuan Hub 14 19 1 32 3 30
2. Tacloban Hub 10 12 7 15 9 13
3. Ormoc Hub 0 3 0 3 1 2
4. Cebu Hub 1 0 0 1 1 0
5. Roxas Hub 0 3 2 1 1 2
Total 25 37 10 52 15 47
Percentage 40% 60% 16% 84% 24% 76%
There are 25 sites or 40% who say that there is 24-hour security in their displacement site. Only 10
sites or 16% have women friendly spaces. Only 15 sites or 22% have child friendly spaces.

8
March 17, 2014 www.cccmphilippines.iom.int
Conclusions
The information for this DTM issue comes from the 17th week after the disaster event and among the priorities of the CCCM Cluster are the following basic concerns and services: Site Management Concerns
1. Helping the Health and Protection Cluster monitor their referral systems in the various displacement sites so that services could be provided.
Site Upgrade Concerns
1. Continue to monitor WASH Concerns so that all displacement sites will be provided with the needed facilities
2. Continue assessments in all displacement sites so that needs for improvements of basic facilities will be assigned to cluster members of the different sectors to answer.
Pyscho-Social Needs of Displacement Sites
1. Continue to work to ensure that the 84 % of displacement sites without psychosocial services will be given attention so that this need can be addressed.
Capacity Development
1. Providing CCCM orientation to all partners who provide camp management services 2. Providing trainor’s trainings to increase capacity of partners organizations to train their own
personnel
Cluster Coordination and Cluster Meetings 1. Strengthening of the CCCM Clusters in all the hubs so that partners can meet regularly and
all concerns are addressed.
Tapping the DTM to Push the CCCM Cluster Forward
The DTM hopes to become a complete information source and effective monitoring tool for the members of the CCCM Clusters who are in the frontlines and working to serve all the displacement sites. It wants to support the following key objectives of CCCM which include: providing trained and effective camp managers; conducting vulnerability assessment among IDPs to seek out the most in need of assistance particularly the landless; providing responsive Camp Care and Maintenance; uplifting the outlooks of the IDPS with settlement planning and involving them in the search for durable solutions; and providing them with skills in disaster preparedness.