so you want to be a (health) actuary daniel schnur wellcare health plans, inc. january 18, 2006
TRANSCRIPT

So You Want to be a (Health) ActuaryDaniel Schnur
WellCare Health Plans, Inc.January 18, 2006

2Healthy Families, Healthy Communities
About WellCare Health Plans, Inc.
• Founded in 1985• Headquarters in Tampa, FL• Highlights in 3Q 2006:
– Overall membership more than 2,100,000; 151% growth– Launched new health plans in Georgia, with over 475,000 members– PDP membership grew to over 910,000 members– Third quarter revenues grew 104% to $1.0 billion– Medicare Advantage membership grew nearly 34% year over year– Third quarter net income grew 166% year
over year
• Stock performance (NYSE: WCG)– IPO in 2004 = $17.00– 1/17/07 close= $75.25– High close on 1/16/07 = $76.36
3Healthy Families, Healthy Communities
About WellCare Health Plans, Inc.
• Actuarial Department– Located in Tampa Corporate HQ– Some actuarial staff located in Atlanta, GA– 20 full-time actuaries and students
• 7 FSA’s• Don Zhang VP of Corporate Actuarial
– Actuarial Development Program• Competitive exam assistance program• Sponsored study-time• Fees for books, exams, seminars• Compensation increases for successful results
– Currently recruiting for Spring 2007 full-time employment– Exam requirement – 1 SOA exam passed prior to consideration.
4Healthy Families, Healthy Communities
WellCare’s Vision/Mission
• Vision–To be the leader in government-sponsored healthcare programs in partnership with the members, governments, and communities we serve.
• Mission—WellCare will:– Enhance our members’ health and quality of life;– Partner with providers and governments to provide quality, cost-
effective healthcare solutions;– Create a rewarding and enriching environment for our associates.
5Healthy Families, Healthy Communities
Overview of Discussion
• Primary health insurance markets• Roles for actuaries in health insurance• Hot topics in health insurance• Health actuarial application - product development• Preparing to become a health actuary
6Healthy Families, Healthy Communities
Primary Health Insurance Markets
• “Commercial” (State)– Group coverage (i.e., through employer or association)– Individual
• Medicare (CMS)– Medicare Advantage (MA)– Prescription Drug (PDP)– Combination (MA-PD)– Group retiree
• Medicaid (State, CMS)– TANF– SSI– Dual-Eligibles
• CHP (State, CMS)• Special Products (generally State)

7Healthy Families, Healthy Communities
Roles for Actuaries in Health Insurance
• Product development• Experience monitoring and assessment• Financial reporting and reserving• Reinsurance• Provider contracting• Underwriting• Data warehouse and data integrity• Financial planning and forecasting• Corporate risk management• Strategic planning
8Healthy Families, Healthy Communities
Hot Topics in Health Insurance
• Risk Adjustment• Predictive Modeling• Consumer-driven plans and MSAs• Disease Management• Enterprise Risk Management• Sarbanes-Oxley compliance (SOX)

9Healthy Families, Healthy Communities
Hot Topics in Health Insurance
• Risk Adjustment– Reimbursement from Government payers was traditionally based
on a demographic rate table where rates vary by age/gender.– Medicare phased in a payment methodology that assigns a risk
score to each member based on the member’s health conditions identified in encounter data.
• More severe conditions contribute to a higher risk score.• A higher risk score means more revenue per member.• Therefore, it is very important for the insurer to obtain properly and to
submit accurate and complete diagnosis information to CMS since this impacts the revenue each health plan receives.
– Many State Medicaid agencies have followed suit by implementing similar risk-adjusted payment mechanisms.
– Risk adjustment data has shown to be a more accurate predictor of cost than demographics alone.
10Healthy Families, Healthy Communities
Hot Topics in Health Insurance
• Predictive Modeling– Utilizes data from prescription drug or medical diagnoses to
prospectively forecast the claim cost as a function of member health status.
– This becomes an important forecasting tool once entering into risk-adjusted payment methodology.
– Important to use predictive modeling across the entire population and not just to focus on high-cost claimants.
– Important to consider HIPAA, quality of data, and biases that may be in datasets.
– Also, forecasting tools vary and are still being enhanced. Many models still have relatively low R2.
11Healthy Families, Healthy Communities
Hot Topics in Health Insurance
• Consumerism and MSA’s– Consumerism movement focuses on transparency of health care
cost so that consumers can better manage their health care choices when choosing providers and plans.
– The high deductible plan/MSA is one mechanism that provides the consumer the ability to better manage their cost:
• Savings account with tax advantages to handle routine or manageable costs (i.e., known RX costs, periodic office visits) supplemented with high deductible coverage for unexpected medical costs.
• Similar to the “old days” before HMO’s began covering “first dollar” medical costs.
– Consumers beginning to negotiate with providers what they are “willing to pay” for services.

12Healthy Families, Healthy Communities
Hot Topics in Health Insurance
• Disease Management– Focused on a single disease category, which is generally a chronic
condition.– Common programs include: asthma, diabetes, congestive heart
failure.– Uses best-practices to pro-actively manage symptoms:
• Results in higher on-going treatment costs than traditional care delivery system.
• Trade-off is to mitigate periodic high-cost episodes that require very high costs.
• Successful if overall net cost of healthcare decreases with no decrease in quality of patient’s well-being.
• Not all programs are successful.– Such programs require long-term commitment, constant
monitoring, and implementation of evolving best-practices.– Insurers often use vendors to contract this service.

13Healthy Families, Healthy Communities
Hot Topics in Health Insurance
• Enterprise Risk Management– Must embed risk management in core management processes:
• Strategy• Product Development• Capital Planning• Performance Measurement
– View risk in the context of balancing risk vs. reward. – Look at the aggregate risk profile of the firm.– Alignment of incentives– Cost reduction through effective transfer/retention strategies.
• Assess, Control, Exploit, Finance, Monitor• Implement at all levels of organization
– Not a checklist!

14Healthy Families, Healthy Communities
Hot Topics in Health Insurance
•Sarbanes-Oxley (SOX or SOX404)– Legislation passed in July 2002.– Applies to GAAP financials filed with the SEC.– Goal is to ensure that there are adequate controls in place to
ensure company can prevent or detect material errors in any financial statements within a reasonable timeframe.
• Management must sign-off on effectiveness of internal controls.• External auditor tests processes to determine whether Management
attestation is correct.– Significant impact in cost and time spent on documentation to
processes such as reserve calculations (i.e., control should ensure Actuarial estimate of reserve appears correctly in financials).
– Impact on file access and protection, segregation of duties, version control, and back-up processes.

15Healthy Families, Healthy Communities
Health Actuarial Application
• Product Development– Work with cross-functional teams to support the strategic
positioning and development of products.– After development and launch, important to monitor experience
since this becomes input for renewal or new product development.
– Requires understanding of marketplace, regulatory requirements, and product’s contribution to overall company success.
16Healthy Families, Healthy Communities
Some terminology
• PMPM (per member per month)– for claims PMPM= (U x C)/12,000 where:
• U = annual utilization per 1,000 members• C = average cost per utilization
– for revenue PMPM= Total Dollars/Total Member Months• MBR (medical benefits ratio. AKA “loss ratio”)
– percent of revenue that is paid out in claim dollars– MBR = (claims/revenue)
• CF (completion factor)– percent of estimated ultimate claims that have been paid– used in reserving to estimate ultimate incurred claims
• incurred claims represent claims attributable as a liability for a particular time period
• different from paid claims which may be paid in a certain time period but are liabilities for multiple time periods

17Healthy Families, Healthy Communities
Illustration of incurred-vs.-paid claims
Incurred Months
Paid Months June July August Sept June 250 July 500 275 Aug 200 450 225 Sept 100 215 475 280
•The chart above is referred to “claims triangle” and illustrates the claim payment pattern observed over time.• The payment runout in the claims triangle will differ by type of service (i.e., hospital, physician, RX) and business characteristics of population (i.e., Medicare, Medicaid).• Paid claims for Aug are 875 (=200+450+225).• Incurred claims (paid so far) for Aug are 700 (=225+475).• Claims incurred and paid in Aug are 225.• Triangle construction is used in reserving.

18Healthy Families, Healthy Communities
Application – Product Development
• Actuaries play an integral role in product development by pricing the cost of medical benefits and understanding the underlying risk to the company.• In developing products, actuaries use prior claims experience and benchmark data (i.e., from consultants or government) to estimate the underlying costs of the proposed benefit coverage.• Benefit design is important to prevent adverse-selection from the member but must also be rich-enough to attract customers to chose the product.• Some benefits are mandated by State or Federal government.• Finding the balance between profitability and marketability is key!
– Actuaries may be conservative since they want to avoid under-pricing the product and costing the company too much.
– Marketing may want a lower price so it can sell more product.– Conflict must be worked through to achieve consensus among all
stakeholders to ensure a successful product launch.

19Healthy Families, Healthy Communities
Application – Product Development
• Key elements in pricing a product:– Underlying cost data (claims experience, benchmarks, etc.)– Benefit design (benefit limits, member cost-sharing)– Marketplace trends– Contracted cost structure (fee schedule, capitation)– Administrative costs
• Direct expenses• Allocation of corporate overhead costs• Distribution Costs (commissions and brokers fees)
– Profit and contingency load– Reserve and capital requirement costs (Risk Based Capital)
• Actuarial will be expected to price the product competitively enough to meet sales targets, since certain sales thresholds are necessary to spread administrative costs effectively-enough to lower price to be competitive. (Yes, that is circular sentence.)
20Healthy Families, Healthy Communities
Application – Product Development
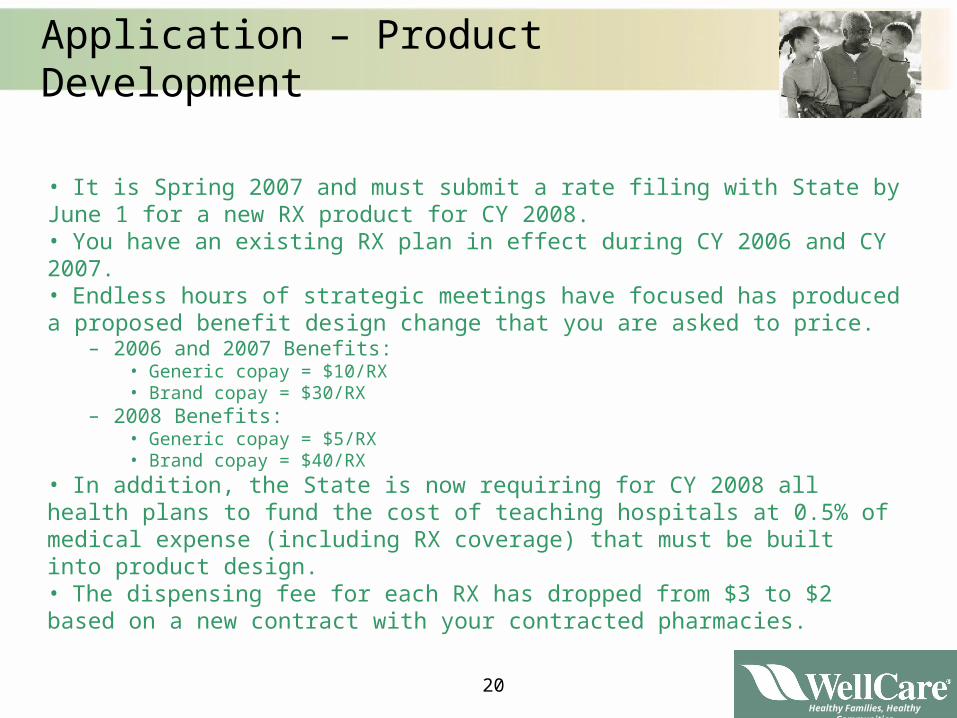
• It is Spring 2007 and must submit a rate filing with State by June 1 for a new RX product for CY 2008.• You have an existing RX plan in effect during CY 2006 and CY 2007.• Endless hours of strategic meetings have focused has produced a proposed benefit design change that you are asked to price.
– 2006 and 2007 Benefits:• Generic copay = $10/RX• Brand copay = $30/RX
– 2008 Benefits:• Generic copay = $5/RX• Brand copay = $40/RX
• In addition, the State is now requiring for CY 2008 all health plans to fund the cost of teaching hospitals at 0.5% of medical expense (including RX coverage) that must be built into product design.• The dispensing fee for each RX has dropped from $3 to $2 based on a new contract with your contracted pharmacies.
21Healthy Families, Healthy Communities
Application – Product Development
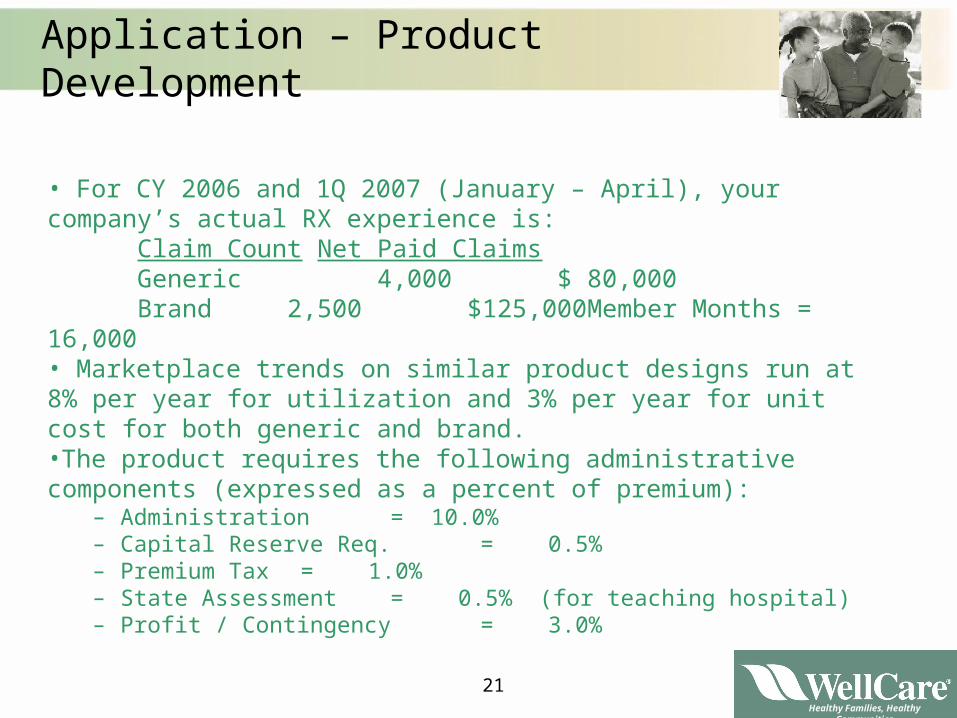
• For CY 2006 and 1Q 2007 (January – April), your company’s actual RX experience is:
Claim Count Net Paid ClaimsGeneric 4,000 $ 80,000Brand 2,500 $125,000Member Months = 16,000
• Marketplace trends on similar product designs run at 8% per year for utilization and 3% per year for unit cost for both generic and brand. •The product requires the following administrative components (expressed as a percent of premium):
– Administration = 10.0%– Capital Reserve Req. = 0.5%– Premium Tax = 1.0%– State Assessment = 0.5% (for teaching hospital) – Profit / Contingency = 3.0%

22Healthy Families, Healthy Communities
Application – Product Development
• First let’s assess the administration components:
– Administration = 10.0%– Capital Reserve Req. = 0.5%– Premium Tax = 1.0%– State Assessment = 0.5%– Profit / Contingency = 3.0%– TOTAL = 15.0%
so we will need to have 15% of premium to cover these expenses. • Therefore, whatever we determine the expected claim cost to be must be increased by a factor of (1/(1.00-0.15)) = 1/(0.85) = 1.1765 to determine the premium needed to cover expected claims and necessary administrative requirements to meet profitability target.• We call this a “retention load.”• This implies an MBR of 85.0%.
23Healthy Families, Healthy Communities
Application – Product Development
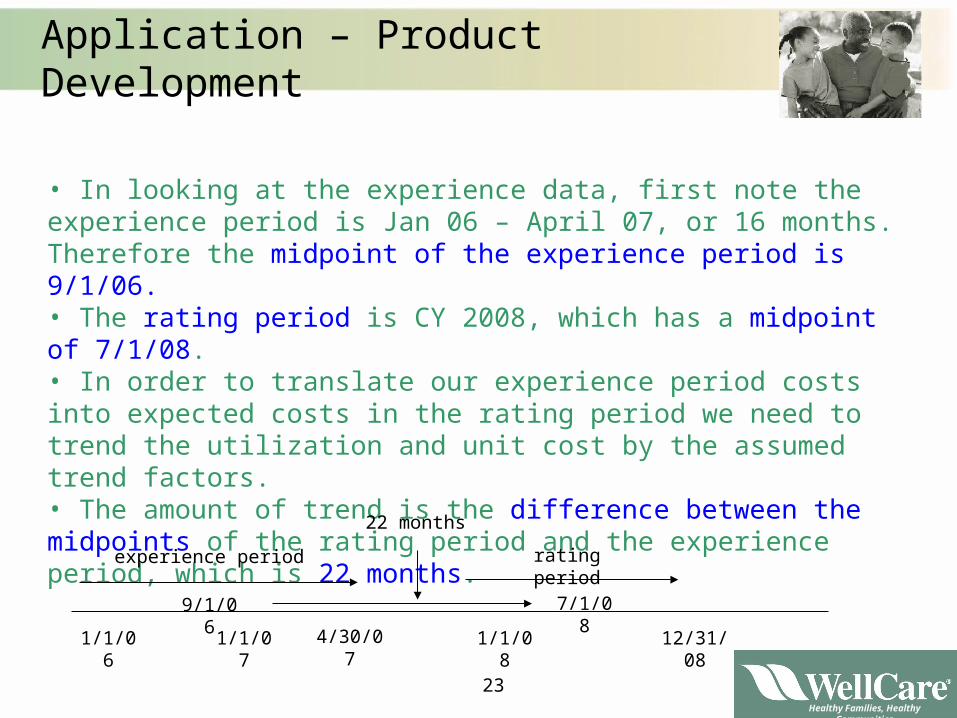
• In looking at the experience data, first note the experience period is Jan 06 – April 07, or 16 months. Therefore the midpoint of the experience period is 9/1/06.• The rating period is CY 2008, which has a midpoint of 7/1/08.• In order to translate our experience period costs into expected costs in the rating period we need to trend the utilization and unit cost by the assumed trend factors. • The amount of trend is the difference between the midpoints of the rating period and the experience period, which is 22 months.
1/1/06 1/1/081/1/07 12/31/084/30/07
9/1/06 7/1/08
experience period rating period
22 months

24Healthy Families, Healthy Communities
Application – Product Development
• The amount of trend is the difference between the midpoints of the rating period and the experience period, which is 22 months.• Given this, the trend factors to use would be:
– Utilization = (1.08) ^ (22/12) = 1.152– Unit Cost = (1.03) ^ (22/12) = 1.056
• In addition, it has been determined that 1% of claims may still be outstanding, so a completion factor (applied to claim count) of 99% is used.• Note— In practice RX claims complete very quickly.
1/1/06 1/1/081/1/07 12/31/084/30/07
9/1/06 7/1/08
experience period rating period
22 months

25Healthy Families, Healthy Communities
Application – Product Development
• Our projected utilization is:Claim Exper. Ann. Trend Completion Proj. Ann.Count Claims/1,000 Factor Factor Claims/1,000
Gen 4,000 3,000 1.152 0.99 3,4911
Br 2,500 1,875 1.152 0.99 2,182
• Our projected net unit cost is:Paid Net Unit Paid Gross Trend Proj.Gross New Proj. NetDollars Cost Copay Unit Cost Factor Unit Cost Copay Unit Cost
Gen 80,000 $20.002 $10.00 $30.003 1.056 $31.684 $ 5.00 $26.68 5
Br 125,000 $50.00 $30.00 $80.00 1.056 $84.48 $40.00 $44.48
•Our fee cost PMPM is: Proj. Ann. New RX FeeClaims/1,000 Fee/RX PMPM
Gen 3,491 $2.00 $0.58 6
Br 2,182 $2.00 $0.36
1 - 3491 = (3000 x 1.152 ) / 0.99
2 – 20.00 = (80000/4000)
3 – 30.00 = 20.00 + 10.00
4 – 31.68 = 30.00 x 1.056
5 – 26.68 = 31.68 - 5.00
6 – 0.58 = (3491 x 2.00) /12000
26Healthy Families, Healthy Communities
Application – Product Development
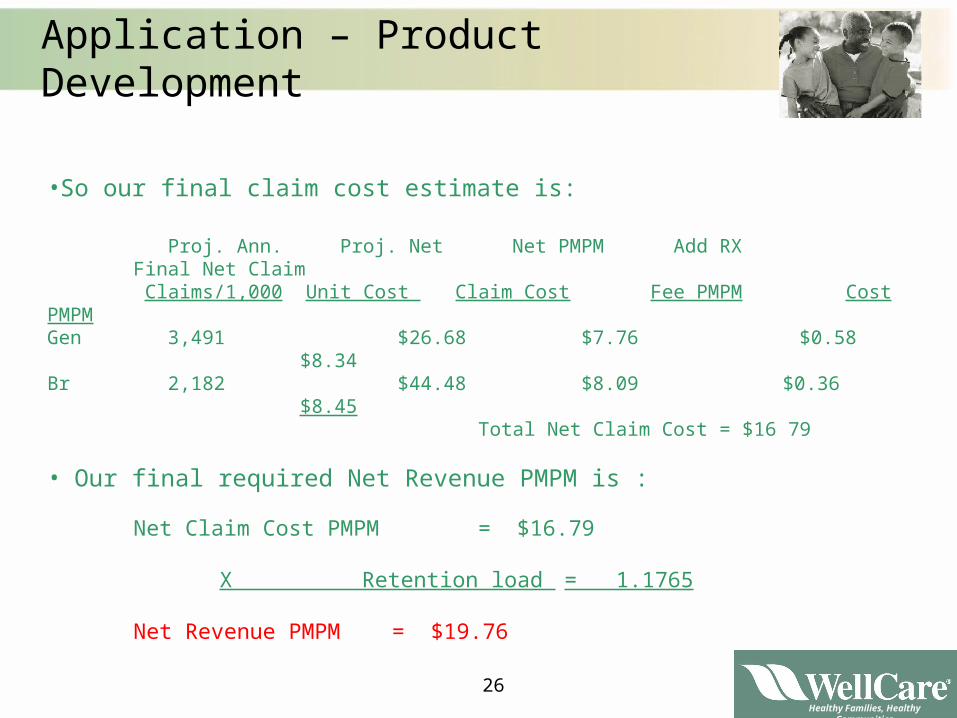
•So our final claim cost estimate is:
Proj. Ann. Proj. Net Net PMPM Add RX Final Net Claim Claims/1,000 Unit Cost Claim Cost Fee PMPM Cost PMPM
Gen 3,491 $26.68 $7.76 $0.58 $8.34Br 2,182 $44.48 $8.09 $0.36 $8.45
Total Net Claim Cost = $16 79
• Our final required Net Revenue PMPM is :
Net Claim Cost PMPM = $16.79
X Retention load = 1.1765
Net Revenue PMPM = $19.76
27Healthy Families, Healthy Communities
Application – Product Development
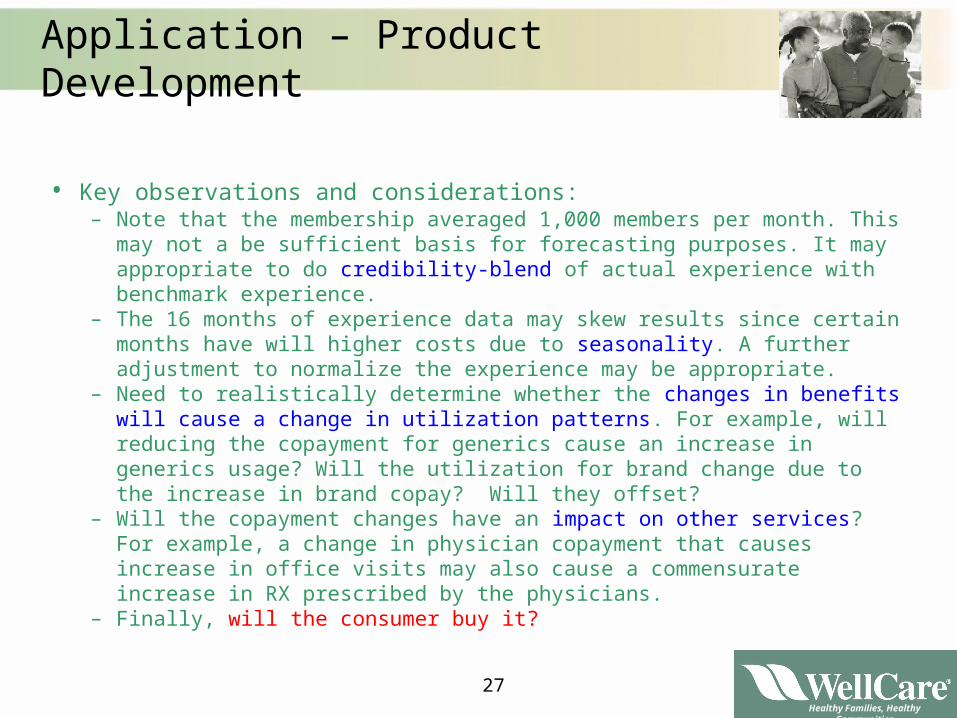
• Key observations and considerations:– Note that the membership averaged 1,000 members per month. This may
not a be sufficient basis for forecasting purposes. It may appropriate to do credibility-blend of actual experience with benchmark experience.
– The 16 months of experience data may skew results since certain months have will higher costs due to seasonality. A further adjustment to normalize the experience may be appropriate.
– Need to realistically determine whether the changes in benefits will cause a change in utilization patterns. For example, will reducing the copayment for generics cause an increase in generics usage? Will the utilization for brand change due to the increase in brand copay? Will they offset?
– Will the copayment changes have an impact on other services? For example, a change in physician copayment that causes increase in office visits may also cause a commensurate increase in RX prescribed by the physicians.
– Finally, will the consumer buy it?
28Healthy Families, Healthy Communities
So how do I get there?
• Explore the different types of actuarial disciplines (health, pension, P&C, life, create your own)• Technical skills • Business acumen• “Learn the business”• Communication skills• Exams

29Healthy Families, Healthy Communities
Questions?
• Comments or Questions?
• Contact: Daniel Schnur

So You Want to be a (Health) ActuaryDaniel Schnur
WellCare Health Plans, Inc.January 18, 2007