soalci insuanr ce in figures 2016 - forsakringskassan.se
TRANSCRIPT

Social Insurance in F
igures 2016
Social Insurance in Figures 2016
Social Insurance in Figures 2016Social insurance is an integral part of the lives of most people. It is of great importance, not just for peoples’ security and well-being, but also for the country’s economy. In 2015, the expenditure on the allow-ances and benefits administered by Försäkringskassan amounted to a total of SEK 225 billion, which corresponds to 5 per cent of Sweden’s gross domestic product (GDP).
Each year, Försäkringskassan publishes the report Social Insurance in Figures, which uses statistics and comments to present a number of allowances and benefits within the framework for the social insur-ance administered and paid by Försäkringskassan. These allowances and benefits are presented in tables, charts and diagrams based on the areas scope and financing of social insurance; registered insured persons; financial security for families and children; financial security in the event of disability; financial security in the event of illness; and other payments. Social Insurance in Figures 2016 also includes a thematic chapter about work injury insurance, which celebrates its centenary in 2016.
FK 141 ISBN 978-91-7500-393-1

Försäkringskassan (Swedish Social Insurance Agency) 2016ISSN: 2000-1703ISBN: 978-91-7500-393-1FK 141Design: Folke JohanssonGraphic production: Kristina MalmIllustrations: Lottie PetterssonPrinters: Lenanders Grafiska AB, 2016Translation: Språkservice Sverige AB, 2016Typeface: Neue Haas Grotesk, Chronicle
Försäkringskassan (Swedish Social Insurance Agency) SE-103 51 StockholmSwedenTel: +46 8 786 90 00E-mail: [email protected] further information about social insurance, please see www.forsakringskassan.se
Social Insurance in Figures 2016 can be ordered from the website www.forsakringskassan.se, and costs SEK 120 excluding VAT, postage and packing.

Foreword
Each year, Försäkringskassan publishes Social Insurance in Figures, which uses statistics and comments to present a number of allowances and benefits that are administered by Försäkringskassan.
Social insurance is an integral part of the lives of most people. It is of great importance, not just for peoples’ security and well- being, but also for the country’s economy. The total expenditure on the allowances and benefits administered by Försäkringskassan amounted to around SEK 225 billion in 2015, or 5 per cent of Sweden’s gross domestic product (GDP).
This year sees the anniversary of Sweden’s oldest social insurance, the work injury insurance. We want to commemorate this with a special thematic chapter that illustrates the development of work injury insurance during 100 years.
Many employees at Försäkringskassan have participated in the work with Social Insurance in Figures 2016. Erik Ahlmark and Olof Lundgren have written the chapter about the financial scope of social insurance, Vedrana Milosevic the chapters about financial security for families and children and financial security in the event of disability, and Ulrik Lidwall the chapters about registered insured persons, financial security in the event of illness and other payments. Fanny Jatko wrote this year’s thematic chapter on the centenary of work injury insurance and is the overall editor of the publication.
Stockholm, May 2016
Ann-Marie Begler Director-General


Contents
Thematic chapter – 100 years of Work Injury Insurance 8
Financial Scope of Social Insurance 26Social security expenditures 26Financing social insurance 30
Registered insured persons 32
Financial security for families and children 34Parental benefit 34Equality bonus 39Temporary parental benefit for care of children 40Temporary parental benefit in connection with birth or adoption 42Temporary parental benefit for contact days 43Temporary parental benefit in connection with the death of a child 44Pregnancy benefit 45Child allowance 46Maintenance support 48Housing allowance 50
Financial security in the event of disability 52Childcare allowance 52Disability allowance 56Attendance allowance 58Car allowance 60
Financial security in the event of illness 62Sickness cash benefit 62Vocational rehabilitation 66Activity compensation and sickness compensation 68Benefit for care of closely related persons 73Housing supplement for people receiving activity compensation or sickness compensation 74Work injury compensation 76
Other payments 78Dental care 78Activity grants and development allowance 82Introduction benefit, supplementary introduction benefit and introduction benefit for housing 84
SOCIAL INSURANCE IN FIGURES 2016
6
Introduction
Swedish social insurance aims to provide financial security during all stages of life and covers all persons who live or work in Sweden. The parts of social insurance administered by Försäkringskassan include mainly allowances and benefits paid to families with children, persons who are sick and persons with disabilities. As of January 2010, the Swedish Pensions Agency administers allowances and benefits paid to old age pensioners. These allowances and benefits are not included in this publication.
The total expenditures on social insurance in 2015 amounted to around SEK 225 billion, or 5 per cent of Sweden’s gross domestic product (GDP). Just over half of the expenditures were to persons who were sick and persons with disabilities, one third to children and families, and the remaining part to other payments, mainly within the labour market area and for administration.
Social Insurance in Figures 2016 provides an overall description of the allowances and benefits administered by Försäkringskassan. Social insurance is described in tables, charts and diagrams based on the areas scope and financing of social insurance, registered insured persons, financial security for families and children, financial security in the event of disability, financial security in the event of illness, and other payments. Among the indicators presented for many benefits and allowances are the number of recipients, the amount paid and average compensation. In order to put the statistics in context, each benefit and allowance is accompanied by a box that briefly describes the applicable rules. Social Insurance in Figures 2016 also includes a thematic chapter about work injury insurance, which celebrates its centenary this year.
Insured persons have varying needs of social insurance, and utilise it in different ways. For this reason, the statistics are reported by sex and age, and in some cases by region and county of birth.
A PDF version of Social Insurance in Figures 2016 and a diagram document with links to the underlying statistics may be downloaded from Försäkringskassan’s website, www.forsakringskassan.se. Further statistical information is also available on Försäkringskassan’s website for statistics and analysis, www.forsakringskassan.se/statistik. Questions about statistics may also be asked by email to [email protected].
SOCIAL INSURANCE IN FIGURES 2016
7
How to Read the Report
Each benefit and allowance included in Social Insurance in Figures 2016 is accompanied by a box that briefly describes the applicable rules. The box is intended to help readers to put the statistics into context and describes the rules for the year to which the statistics related, that is for the year 2015. In those cases where the rules have changed during the year, the rules that applied most recently during the year in question are shown. Further information about the rules is available on Försäkringskassan’s website, www.forsakringskassan.se.
The term “days” consistently refers to net days – for example, two days of 50 per cent compensation are regarded as one net day.
Income-related daily compensation for sickness benefit, pregnancy benefit, parental benefit, etc., is calculated by multiplying the compensation level (75 or 80 per cent) by a conversion factor (0.97 in 2015). The Riksdag sets the conversion factor. Thus, income-related daily compensation is just under 75 or 80 per cent of the sickness benefit qualifying income.
The way that daily compensation is calculated depends on whether it is based on the hour/day (such as temporary parental benefit) or calendar day (such as parental benefit). As a result, even though the maximum compensation is based on 7.5 times the price basic amount for temporary parental benefit and 10 times the price basic amount for parental benefit, the average daily amount for temporary parental benefit may exceed the average daily amount for parental benefit.
Data can change during the course of a particular matter for benefits and allowances that cover a longer period of time. For example, the diagnosis can change over time for ongoing cases of sickness benefit. Information about diagnosis comes from the most recent entries in Försäkringskassan’s systems.
Due to retroactive decisions, reassessments, withdrawals, etc., statistics downloaded at different times from Försäkringskassan’s data warehouse may differ slightly. Thus, information about the number of recipients reported may, for example, differ slightly from what is reported in other contexts.
The diagram entitled “Proportion of the population receiving sick-ness or activity compensation by region of birth in December 2015” has been age-standardised. Given that the occurrence of illness changes with age, the age structures of the various regions of birth are important to consider. Age standardisation involves adjusting the age structure such that it is independent of region of birth.
SOCIAL INSURANCE IN FIGURES 2016
8
Thematic chapter – 100 years of Work Injury Insurance – From industrialisation to service society
Work injury insurance is Sweden’s oldest social insurance. The Industrial Accident Insurance Act was instituted in 1916. The insurance arose from the changes and the insecurity that came with industrialisation, where hazardous working environments and accidents in the workplace were common. Pursuant to this act, employers were obliged to provide insurance for their employees, which meant that in principle all workers were insured for accidents at work.
Work injury insurance 1916–2016This chapter begins by describing the histor-ical development of work injury insurance, with particular focus on the societal changes that have influenced the policy design. Most
of the statistics in this chapter relate to annuities (see the fact box), which represent the most significant compensation paid from work injury insurance. As there are limitations on the information available in Försäkringskassan’s data warehouse, most of the statistics relate to data from the early 2000s until today.
Annuity
Annuity is compensation for loss of earnings that can be granted to individuals who have an approved work injury claim. There are two types of annuities paid from work injury insurance. Annuities as compensation in the event of work injury for loss of earnings, and survivor annuities to provide compensation to survivors if a person dies from a workplace injury.
SOCIAL INSURANCE IN FIGURES 2016
9
Emergence during industrialisationWhen the Industrial Accident Insurance Act was introduced in 1916, it was based on the employer’s insurance obligation and thus came to essentially encompass all workers. The act meant that a worker who was involved in an accident in the workplace received compensation equivalent to two thirds of their lost earnings. The act also included the reimbursement of medical expenses and compensation for survivors in the event of a work injury resulting in death. Employers were responsible for paying out sick pay for the first 35 days. This was motivated by the fact that a forthcoming general and compulsory sickness insurance
would provide compensation for shorter cases of sickness. A few years later, the insurance was expanded to include compensation for accidents occurring on the way to or from work, so-called commuting accidents. In 1929, accident insurance was supplemented with the Act on Insurance for Certain Occupational Diseases. The insurance thus came to encompass some of those diseases caused by hazardous substances such as arsenic, mercury and lead, which some work-ers at the time could frequently come into contact with during work.
National sickness insurance makes an entranceIt was not until 1955 that Sweden established a universal sickness insurance and a new occupational injury insurance (Occupational Injury Insurance Act). The new occupational injury insurance regulated accidents in the workplace, commuting accidents and certain work-related illnesses. Compensation under the Occupational Injury Insurance Act was calculated partly on the basis of the insured party’s annual earnings before the injury and also on the extent in reduction of work ability. In this way, financial compensation was given for both loss of earnings and for the medical disability caused by the work injury.
When occupational injury insurance was introduced, a coordination period was launched, which meant that the person who sustained the work injury received compen-sation according to the rules for sickness insurance during the first 90 days. This meant that a large proportion of the work injuries that had previously been regulated by work injury insurance now came to be regulated through the national sickness insurance. This system in which work injury insurance acts as a complement to public sickness insurance becomes established and will be further strengthened in later devel-opments within the emergence of various types of social insurance.
Insured through collective agreementsIn the early 1970s, the labour market par-ties reached an agreement on collectively agreed security insurances for employees that would complement the general work injury insurance. These insurances meant that workers who suffered injury through accidents at work, or on the way to or from
work, would be compensated according to tort law principles. This was true regard-less of whether it was the employer or the employee who had caused the injury. Later, these security insurances have been supple-mented with compensation for work-related diseases.

SOCIAL INSURANCE IN FIGURES 2016
10
More injuries classified as work injuriesIn 1977, the Work Injury Insurance Act was introduced. This new act contained a rule of evidence to the effect that accidents at work and other injuries caused by the harmful effects of the work should be seen as work injuries unless there were compelling reason not to do so. The idea was that the insurance and not the injured person should bear the cost in the event there was a lack of scientific evidence concerning causality within an area. Unlike previous legislation, compensa-tion was calculated solely on the basis of the claimant’s ability to earn income through gainful employment, and the compensation was equivalent to the loss of earned income up to an income threshold of 7.5 times the price basic amount. How the law should be interpreted was disputable, and in the 1980s, many work
injury claims were appealed to the insurance courts. Many of the insurance offices’ deci-sions were amended after judicial review, which meant a change in practice, which in turn led to a more generous interpretation of the work injury insurance regulations. In the 1980s, the number of approved work injuries increased and insurance costs rose. In the first half of the 1980s, work injury compensation accounted for approx-imately 0.2 percent of the gross domestic product (GDP), and in 1986 this ratio had increased to 0.8 per cent of the GDP. This development also affected the cost of sick-ness insurance due to the fact that the com-pensation from sickness insurance was paid out as underlying benefits in work injury cases, for example, as work injury sickness cash benefit.
The term work injury is more narrowly definedIn the early 1990s, Sweden experienced a sharp recession with high unemployment. As a consequence, the financial base for social insurance was affected, as there was a drop in taxes and fees being paid by fewer in gain-ful employment. In connection with this, the legislators elected to review the work injury insurance. In 1992, the coordination period with sickness insurance was extended, and 1993 saw the abolishment of compensation for medical care, medicine, medical treat-ments and the special work injury sickness cash benefit.
The term work injury was more nar-rowly defined and the new rule of evidence meant that there should be a high degree of probability that a factor in the work-place, a so-called harmful effect, could give rise to the disease of the insured party. Furthermore, there should be predominant grounds supporting the assertion that there was a causal link between the work injury and the harmful effect. Consequently, a requirement was introduced stipulating that a factor’s harmful basis should be able to be proven based on established research.
Fewer work injury cases examinedIn the early 2000s, the legislature assessed that the application of the 1993 law had been too restrictive and that the requirements for a disease to be accepted as a work injury were too stringent. Therefore an alleviation of the evidentiary requirement in assessing work injury was introduced in 2002. The evidentiary requirement was reduced from the previous level requiring a high degree of probability to it being sufficient that predom-inant grounds existed for the assertion that the injury or disease was caused by the work. In 2003, a requirement was introduced stipulating that, for an assessment to begin, a written application for compensation from work injury insurance must be submitted. The legislator had assumed that the alle-viation of the evidentiary requirement would lead to an increased number of applications
for compensation relating to work injury; instead, the trend has gone in the opposite direction with fewer applications since the early 2000s. 2008 saw a sickness insurance reform which had a further impact on the appli-cation of the work injury insurance. One change was that the time-limited sickness compensation was removed and the criteria for receiving permanent sickness com-pensation were tightened. Applications for compensation from work injury insurance in the form of an annuity have often been made in conjunction with individuals having been granted sickness compensation. As fewer people have been granted new sickness com-pensation since the regulatory changes in 2008, this has meant that fewer work injury cases have been assessed.

SOCIAL INSURANCE IN FIGURES 2016
11
Changes in regulations governing work injury insurance
1916 The Industrial Accident Insurance Act is instituted.
1920 Compensation is provided for accidents while travelling to and from work.
1929 The Act on Insurance for Certain Occupational diseases is instituted.
1955 The National Sickness Insurance Act and the Occupational Injury Insurance Act are instituted. In connection with this, a 90-day coordination period between sickness insurance and occupational injury insurance is introduced.
1977 The Work Injury Insurance Act is instituted. The new insurance entailed the introduc-tion of a general definition of injury and elevated levels of compensation.
1993 The term work injury is more closely defined and fewer benefits are included in the insurance. The right to work injury sickness cash benefit essentially no longer applies.
2002 An alleviation of the evidentiary requirement in assessing work injury is introduced.
2003 A requirement is introduced stipulating that a written application must be submitted for compensation from work injury insurance.
2008 Changes are implemented within sickness insurance and the regulations on who is entitled to sickness compensation are tightened.
2011 The Social Insurance Code is instituted and replaces the Work Injury Insurance Act.
A detailed description of regulatory changes is found in the publication Förändringar inom socialförsäkrings- och bidragsområdena 1968-01-01–2015-09-01 [Changes within social insurance 01/01/1968–01/09/2015] which is published at www.forsakringskassan.se/statistik.
Work injury insurance in transitionIn summary, the design of work injury insur-ance has undergone substantial changes in the hundred years since the insurance has existed. From having been an acci-dent insurance, a subsequent inclusion of work-related diseases broadened the scope of the insurance. The formulation of the evidentiary requirement in establishing the connection between the injury and the work has had a major impact on which claims have been approved as work injuries. According to the 1977 Act, an accident at work and other injuries caused by the harmful effects of the work should be seen as work injuries unless there is compelling reason not to do so. The act thus contained a presumption of causality, which meant that more illnesses and injuries could be viewed as work injuries. The pendulum then swung in the opposite direction with the 1993 legislation, which required the harmfulness of a factor to have been established based on scientific evidence. According to current legislation, there should be predominant grounds supporting the assertion that the injury or disease was caused by the work in order for compensation from work injury insurance to be considered.
The form of compensation from the insurance has also been changed. Occupational injury insurance provided compensation both for loss of earnings and based on the degree of medical disability caused by the work injury. Later on, insur-ance only provided compensation for eco-nomic loss of income. In the legislation from 1977, lost income due to work injury was also compensated in the event of shorter cases of sickness. Since the 1990s, work injury insur-ance is to a greater extent coordinated with sickness insurance. During the 2000s, there were several changes that affected how many work inju-ries Försäkringskassan came to investigate. Firstly, there was a requirement that a writ-ten application be submitted for compensa-tion from work injury insurance. Secondly, sickness insurance was reformed, which included more stringent requirements for the granting of sickness compensation, i.e. previously disability pension. Work injury insurance, which from the start was seen as a complement to sickness insurance, has in the course of time become increasingly coordinated with sickness insurance benefits.

SOCIAL INSURANCE IN FIGURES 2016
12
Reported work injuriesEmployers and self-employed individuals who become aware that a work injury has occurred are obligated to report this to Försäkringskassan in accordance with the provisions of the Social Insurance Code. The Swedish Work Environment Authority is responsible for the monitoring of reported work injuries and uses this data as a basis for the work to prevent illnesses and accidents in the workplace. Work injuries are divided into work accidents, work-related diseases and
accidents occurring on the way to or from work (so-called commuting accidents). Work accidents are injuries that have arisen in conjunction with a brief and unexpected event. Work-related diseases means that there have been harmful factors in the work environment that have given rise to disease. Some examples of such harmful factors include heavy or repetitive work, vibrations, noise, chemical substances or psychologi-cally stressful working conditions.
1 The data on the number of reported work accidents resulting in absence in 2014 is still preliminary, and the number is expected to rise by about 4 per cent.
Source: Occupational Injuries 2014, Statistical Report 2015:1, Swedish Work Environment Authority
� Reported work injuries per 1,000 gainfully employed persons 1980–2014, employees and self-employed personsThe number of work injuries has varied over time, and the development should be understood in terms of the structural trans-formation of the labour market that has been underway since the late 1980s. During this period the industrial structure has changed, with a fall in employment within goods pro-duction and increased employment within the service sector. Furthermore, there was a recession in the early 1990s that led to a declining number of hours being worked by gainfully employed individuals, which may have affected the number of work injuries. Changes to the work injury insurance and sickness insurance may in and of itself have influenced the propensity to report work-related injuries. A clear example is that the number of reported work-related diseases increasing sharply in 1993, which can be explained by the transitional rules
introduced in connection with the term work injury being more narrowly defined in 1993. Another example, occurring during the early 1990s, is the sharp reduction in the number of reported work accidents with sickness absence in relation to the number of gainfully employed women and men. This development can also be linked to the more stringent definition of work injury and to the fact that the right to work injury sickness cash benefit was essentially discontinued at this time. In recent years, the number of work accidents without sickness absence has increased for both women and men in rela-tion to the number of gainfully employed workers. The number of accidents on the way to or from work, so-called commuting acci-dents, has remained stable since the 1980s.
0
5
10
15
20
25
30
35
40
141005009590851980141005009590851980
Reported per 1,000Women Men
Work-related diseases Commuting accidentsWork accidents with absence
Work accidents without absence1

SOCIAL INSURANCE IN FIGURES 2016
13
Injury type Women Men Total
Work accidents with absence1 13,168 18,089 31,257
Work accidents without absence 34,394 26,869 61,263
Work-related diseases 7,208 4,809 12,017
Commuting accidents 6,431 3,268 9,699
Older cases2 431 495 926
Total 61,632 53,530 115,162
1 The data on the reported work accidents resulting in absence is still preliminary and is expected to rise by about 4 per cent.
2 This category includes those reports that concern occupational injuries that have occurred more than two years before the date the report was submitted.
Source: Occupational Injuries 2014, Statistical Report 2015:1, Swedish Work Environment Authority
� Reported work injuries in 2014In 2014, almost 115,200 work injuries were reported to Försäkringskassan. Of these reports, 53 per cent concerned work accidents not resulting in sickness absence and 27 per cent concerned work accidents resulting in sickness absence. Reports that concerned work-related diseases consti-tuted 10 per cent and commuting accidents represented 8 per cent of the incoming reports of work injuries in 2014. There are gender differences in reported work injuries. In 2014, reported work accidents without sickness absence were more common among
women (56 per cent) than men (44 per cent). Reported work accidents with sickness absence were more common among men (58 per cent) than women (42 per cent). There are no clear answers as to the cause of these gender differences in reported work injuries. It may partly reflect differences in the working environment that women and men work in. It can also be linked to differ-ences in the propensity of small and large workplaces to submit reports, and between different sectors and industries in which men and women are gainfully employed.

SOCIAL INSURANCE IN FIGURES 2016
14
Forms of compensation from work injury insuranceOnly a small portion of the work injuries reported to Försäkringskassan lead to the injured party then applying for compensa-tion from work injury insurance. However, a large proportion of people reporting work injury receive compensation from sickness insurance in the form of sickness cash bene-fit during the acute illness period. Under current legislation, work injury insurance encompasses individual life
annuities, reimbursement of dental expenses, costs for medical care abroad and compensation for special aids. The area of expenditure for work injury insurance also includes compensation for survivors and funeral assistance. As of 1 January 2010, these benefits are administered by the Swedish Pensions Agency.
� Work injury insurance expenditures excluding administration 2007–2015Work injury insurance expenditures are closely connected to the design of the insur-ance. Since the early 2000s, expenditures for work injury insurance have declined. Expenditures fell from SEK 5.3 billion in 2007 to SEK 3.1 billion in 2015, representing a decrease of 42 per cent. In 2015, work injury insurance expendi-tures constituted 1.4 per cent of the total social insurance expenditures. This year, the annuities under current legislation
accounted for 85 per cent of the total expenditures for work injury insurance. The annuities under the Work Injury Insurance Act and other older regulations accounted for 11 per cent of the expenditures. The group “Other forms of compensation” primarily includes reimbursement of dental expenses and costs for medical care abroad. These forms of compensation only constituted 4 per cent of work injury insurance expendi-tures in 2015.
SEK billion
0
1
2
3
4
5
6
201520142013201220112010200920082007
Annuities under current legislation
Annuities under older legislation
Other forms of compensation

SOCIAL INSURANCE IN FIGURES 2016
15
Individual life annuity – the most significant compensationThe largest compensation paid from work injury insurance is individual life annu-ity, which accounted for 96 per cent of the work injury insurance expenditure in 2015. This form of compensation first comes into question when the work injury has resulted in a reduction in the ability to earn income from employment that is experienced for more than one year (see the fact box). The purpose of this compensation is for the insured party who suffers a loss of income due to a work injury to receive compensation that allows them to be able to remain in the same financial situation as if the injury had not occurred. The level of compensation is determined by the income that the insured party had prior to the injury and the income they are expected to have after the injury. In many cases, the insured party has a diminished work capacity that has also entitled them to compensation from sickness insurance. The individual life annuity is then coordinated
with other social insurance benefits and the annuity is paid out for the difference. Individual life annuity can also be paid out if a person, due to a work injury, has switched to a job that gives them a lower income or has participated in vocational rehabilitation measures.
Individual life annuity
To be eligible for an individual life annuity, the ability to earn income through work must have been reduced by at least one fifteenth for at least one year. The loss of income must also be at least one quarter of the price basic amount for one year (SEK 11,075 in 2015). There is an upper limit, which means that the disbursed annuity may not exceed 7.5 times the price basic amount (equivalent to SEK 333,750 in 2015).
See the Regulations box on page 77 for more information on current regulations.
Individual life annuity is often paid over a long periodThe right to compensation from work injury insurance is assessed based on different statutory provisions, depending on when the injury occurred or when the disease first pre-sented itself. In order for the right to entitle-ment to be assessed under the Occupational Injury Insurance Act, the injury must have been sustained prior to 1977. According to the Occupational Injury Insurance Act, individual life annuity is a benefit paid out for life. Individual life annuity under current legislation (Work Injury Insurance Act and
after) is normally paid out until and includ-ing the month before the annuitant turn 65 years old. This means that an individual life annuity is a benefit that a person injured at work can receive for many years, and the majority of individual life annuities dis-bursed today were granted decades ago. The following section describes how the prevalence of individual life annuities has evolved over time, and their distribution based on current or older legislation and gender.

SOCIAL INSURANCE IN FIGURES 2016
16
Data is presented from 1986 because from this year statistics are available on the number of disbursed individual life annuities following coordination with other social insurance benefits. The statistics for individual life annuities under current legislation also include annuities based on national personal injury protection. These annuities regulate compensation for injuries during, for example, military or rescue service, and constitute a small part of the total individual life annuities.
zy Individual life annuities in December 1986–2015The number of individual life annuities under the Occupational Injury Insurance Act has decreased since the mid-1980s. In December 1986, 90,300 annuities were paid out, which can be compared to December 2015 when the number had decreased to 26,700. This decrease reflects the fact that this compensation can only apply for such occupational injuries incurred prior to 1977. The number of individual life annuities under current legislation (the Work Injury Insurance Act and subsequent legislation) increased sharply from the mid-1980s. During the period 1986–1991, there were a high number of work injury cases assessed with a high approval rate. The number of
annuities paid out peaked in December 1995 with 99,200 annuities. Since then the number has decreased. This reflects the tightening of legislation introduced in 1993, which led to fewer injuries being categorised as work injuries according to the insurance parameters. Between 2002 and 2003 there was a small increase of annuities, which can be attributed to the alleviation of the eviden-tiary requirement in the assessment of work injury, as introduced at that time. However, since 2003 the number has decreased again, and by December 2015 there were just under 37,000 disbursed individual life annuities under current legislation.
NumberWomen Men
0
20,000
40,000
60,000
80,000
100,000
120,000
1510050095901986 1510050095901986
Annuities under current legislation
Annuities under the Occupational Injury Insurance Act
SOCIAL INSURANCE IN FIGURES 2016
17
Gender differences in disbursed individual life annuitiesThere are gender differences in terms of how many individual life annuities that are paid out to women and to men. Of those individual life annuities under the older legislation (Occupational Injury Insurance Act) that were disbursed in December 2015, 90 per cent were paid to men. This percent-age has remained largely unchanged since the 1980s. The fact that the majority of the individ-ual life annuities linked to older legislation are paid to men should be understood in terms of what the labour market in Sweden was like when work injury insurance was under development. The Occupational Injury Insurance Act evolved from an accident insurance and mainly encompassed those accidents that could occur in hazard-ous working environments within industry. Only specific diseases were covered by the insurance. These were mainly diseases that could be linked to contact with hazardous substances (such as lead and mercury) or dangerous radiation. Sweden has, and has had, a gender-segregated labour market, and there has been a greater proportion of men working within industries with hazardous work environments that provided the basis for the earliest work injury insurance.
The individual life annuities linked to current legislation (Work Injury Insurance Act and after) are not character-ised by such extreme gender differences. Unlike previ-ous legislation the current legislation also encompasses work injuries in the form of work-related diseases to a greater extent. Women’s employment has increased significantly since the 1970s, but the labour market is still gender-segregated. A large proportion of today’s gainfully employed women work within professions where there may be a greater risk of work injury in the form of work-related diseases due to repet-itive and long-term exposure, rather than manifest accidents. Examples worth men-tioning in this context include those work injuries due to mental and physical strain that can occur within health and social care professions. Despite the fact that current legislation covers work injuries in the form of work acci-dents, work-related diseases and commuting accidents, there are still gender differences in the number of individual life annuities disbursed. In December 2015, 58 per cent of the individual life annuities under current legislation were paid out to men.

SOCIAL INSURANCE IN FIGURES 2016
18
Fewer decisions on individual life annuities When Försäkringskassan receives an application concerning an individual life annuity, it is first checked whether the injury or illness has involved a sufficiently large loss of income to qualify the insured party for compensation. If the insured party meets the requirements, there is then an assessment of whether there are predominant grounds to support the assertion that the accident or illness was caused by the work and is thus to be considered a work injury. There are statistics presented below on those applications concerning an individual
life annuity where Försäkringskassan has decided that the injury has involved a suffi-ciently large loss of income and that there are predominant grounds supporting the asser-tion that the injury was caused by the work and is thus to be considered a work injury. The statistics on approval decisions for an individual life annuity are broken down by injury type (work accidents, work-related diseases and commuting accidents) and diag-nosis group.
The statistics are based both on decisions in conjunction with the initial assessment of work injury and decisions relating to already approved work injuries. On the basis of the underlying statistical data, it is not possible to report all first-time decisions separately.
zy Approval decisions on individual life annuities by injury type 2005–2015Since the mid-2000s, the number of approval decisions in the assessment of an individual life annuity has decreased. In 2005, 7,300 approval decisions were made regarding an individual life annuity, which can be compared with 2015 when 1,200 approval decisions were registered. During the same period, the number of refusals in assessments of entitlement to an individual life annuity decreased from 12,600 (in 2005) to 900 (in 2015). The total number of assessments of entitlement to an individual life annuity have thereby decreased during the period in question. Since 2005, a larger proportion of the deci-sions on an individual life annuity in which the applicant is denied are connected to the fact that the formal requirements regarding reduced work ability and loss of income are not met, and thus a work injury assessment is not carried out. In 2005, there were 3,044 rejections where a work injury assessment
had not been carried out, and in 2015 this number had increased to 3,885. Over time, women have received a larger proportion of approval decisions than men with regard to applications concerning an individual life annuity connected to commuting accidents. In 2015, commut-ing accidents represented 23 per cent of the approval decisions issued to women, compared to the corresponding 11 per cent for men. Compared with women, men have received a larger proportion of approval deci-sions that have related to work accidents. In 2015, work accidents constituted 46 per cent of men’s approval decisions and 36 per cent of women’s approval decisions. The percentage of approval decisions that concern work-related diseases is almost equal for women and men. They represented 41 per cent of women’s and 42 per cent of men’s approval decisions in 2015.
0
1,000
2,000
3,000
4,000
151413121110090807062005 151413121110090807062005
Work-related diseases
Work accidents
Commuting accidents
NumberWomen Men
SOCIAL INSURANCE IN FIGURES 2016
19
Fewer people are applying for compensationThe main reason for the reduction in the number of approval decisions is that fewer and fewer people are applying for com-pensation from work injury insurance. A large decrease in the number of approval decisions is observed between 2007 and 2008, which can be linked to the changes in sickness insurance that were introduced in 2008. Fewer people have been granted new sickness compensation after 2008 and in the
long run this has meant a reduction in the number of work injury cases assessed, which in turn has led to fewer approval decisions. Between 2008 and 2010, the number of approval decisions per year has continued to decrease, but since 2011 a lesser downward trend in approval decisions for individual life annuities is noted within work injury insurance.
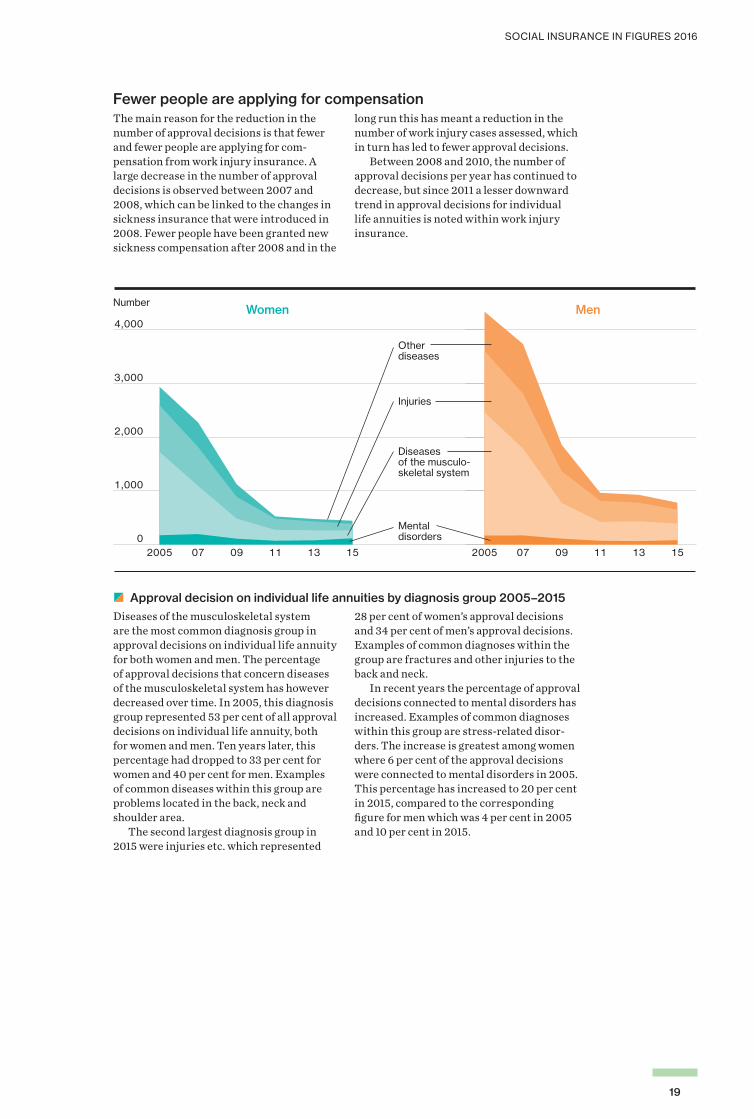
zy Approval decision on individual life annuities by diagnosis group 2005–2015Diseases of the musculoskeletal system are the most common diagnosis group in approval decisions on individual life annuity for both women and men. The percentage of approval decisions that concern diseases of the musculoskeletal system has however decreased over time. In 2005, this diagnosis group represented 53 per cent of all approval decisions on individual life annuity, both for women and men. Ten years later, this percentage had dropped to 33 per cent for women and 40 per cent for men. Examples of common diseases within this group are problems located in the back, neck and shoulder area. The second largest diagnosis group in 2015 were injuries etc. which represented
28 per cent of women’s approval decisions and 34 per cent of men’s approval decisions. Examples of common diagnoses within the group are fractures and other injuries to the back and neck. In recent years the percentage of approval decisions connected to mental disorders has increased. Examples of common diagnoses within this group are stress-related disor-ders. The increase is greatest among women where 6 per cent of the approval decisions were connected to mental disorders in 2005. This percentage has increased to 20 per cent in 2015, compared to the corresponding figure for men which was 4 per cent in 2005 and 10 per cent in 2015.
NumberWomen Men
0
1,000
2,000
3,000
4,000
15131109072005 15131109072005
Mentaldisorders
Injuries
Otherdiseases
Diseases of the musculo-skeletal system

SOCIAL INSURANCE IN FIGURES 2016
20
The proportion of approvals in work injury assessments has increasedDuring the period 2005–2015, the per-centage of approvals has increased in relation to the number of work injury
assessments carried out in total. In 2005, Försäkringskassan determined that 28 per cent of the assessed cases where women had applied for an individual life annuity fulfilled the requirements to be classified as work injuries. The correspond-ing proportion in 2015 was 50 per cent. For men, the corresponding trend for approval frequency indicates an increase from 46 per cent in 2005 to 64 per cent in 2015.
Approval rate for individual life annuity
The calculation of approval rate for individual life annuity only includes those decisions where Försäkringskassan has been able to determine that a sufficiently large loss of income can be linked to the injury. The ability to earn income through work must have been reduced by at least one fifteenth for at least one year. The loss of income must also be at least one quarter of the price basic amount for one year.
Largest percentage increase in approvals for mental disordersThe highest percentage of approvals in work injury assessments goes to women and men who apply for an individual life annuity due to injuries of external causes. In 2015, the approval rate was 75 per cent in those work injury assessments where women have applied for an individual life annuity in connection with injuries. The corresponding figure for men was 84 per cent. The greatest increase in approval rate is observed for the mental disorders. In 2015,
the approval rate was 55 per cent among those work injury assessments where women had applied for an individual life annuity in connection with these diagno-ses. This can be compared with 2005 when the corresponding approval rate was only 13 per cent. However, mental disorders only represent a small part of the total number of approval decisions for individual life annuity applications.

SOCIAL INSURANCE IN FIGURES 2016
21
Age distribution among persons with an individual life annuityThe following section describes those indi-viduals who have an individual life annuity, broken down by age and the legislation pursuant to which they were granted an individual life annuity. In a description of the age distribution among those persons with an individual life annuity it is relevant to consider whether the recipients have been granted annuity based on current or former legislation. Persons granted an individual life annu-ity under the Occupational Injury Insurance
Act receive this compensation for the rest of their life. For persons born 1938 or after, an individual life annuity is paid according to current legislation until and including the month before the annuitant turn 65 years old. In 2003, regulatory changes were made for persons born 1937 or before who had guaranteed annuity under the Work Injury Insurance Act. These individuals generally have low annuities and will get to keep their individual life annuities past the age of 65.
The statistics for persons with an individual life annuity under current legislation also include those persons who have annuities based on national personal injury protection. The majority of the persons over 65 who have an individual life annuity under current legislation have guaranteed annuity under the Work Injury Insurance Act.
zy Annuitants in December 2015 by age and legislationIn December 2015, there were over 26,100 persons who had an individual life annuity under former legislation. Among these, the majority were men (89 per cent) and only a small proportion of the annuitants were women (11 per cent). The persons who receive annuity under former legislation have incurred a work injury prior to 1977 and have often received this compensation for a long time. Over 25,800 persons had an individual life annuity under current legislation in December 2015. Among these recipients
there was a more even gender distribution, with 47 per cent women and 53 per cent men. A large proportion of the insured indi-viduals who have an annuity are older. Just under 8 per cent of those who have an indi-vidual life annuity under former legislation (Occupational Injury Insurance Act) were under 65 years old in 2015. Fifteen years ago (2001) the corresponding figure was 25 per cent. Only 4 per cent of the annuitants with compensation under current legislation were under 45 years old in December 2015. The corresponding proportion in 2001 was 10 per cent.
0
1,000
2,000
3,000
4,000
5,000
6,000
90–
85–89
80–84
75–79
65–74
60–64
55–59
50–54
45–49
–44
90–
85–89
80–84
75–79
70–74
65–69
60–64
55–59
50–54
45–49
–44
NumberFormer legislation* Current legislation
Women
Men
Age, year* Occupational Injury Injurance Act

SOCIAL INSURANCE IN FIGURES 2016
22
Many receive compensation from sickness insurance when they are granted an annuityWork injury insurance is in many ways a complement to public sickness insurance. A large proportion of the persons applying for compensation from work injury insurance in the form of an annuity have received benefits from sickness insurance after the work injury occurred. In direct connection to the work injury, they may have been sick-listed and received compensation from sickness insurance in the form of sickness cash ben-efit. If the injury has led to a sustained reduc-tion in work ability, they may have received compensation in the form of activity com-pensation or sickness compensation. If they
have been granted activity compensation or sickness compensation, this can be seen as a signal that it is time to apply for an annuity, based on the fact that this compensation first comes into question when the work injury has resulted in a reduction in the ability to earn income from employment. Sustained means that this reduction is experienced for more than one year. The following section presents statistics on the proportion of people who had received compensation from sickness insurance when they were granted an individual life annuity for the first time.
The data relates to individual life annuities under current legislation.
zy Proportion of annuitants who were receiving compensation from sickness insurance at the first time they were granted an individual life annuityThe graphs show the proportion of those people who were granted an individual life annuity for the first time and who, at the time of application, were receiving compen-sation from sickness insurance in the form of sickness cash benefit, sickness compen-sation or activity compensation. A large percentage of these persons were receiving compensation from sickness insurance at the time of application, but the percentage has decreased during the period 2005 to 2015. Prior to 2010, it was more common that the claimant was receiving compensation in the form of sickness compensation. The per-centage of persons who were receiving com-pensation in the form of sickness cash ben-efit when they applied for an individual life annuity decreased between 2005 and 2010 but has subsequently increased. This reflects the changes in sickness insurance that were introduced in 2008, wherein time limits on
sickness cash benefit were introduced, while at the same the criteria for receiving sickness compensation were tightened and temporary sickness compensation was abolished. Among women, 66 per cent received compensation from sickness insurance when they applied for an individual life annuity for the first time in 2015. Approximately the same number were receiving compensation from sickness insurance in the form of sick ness cash benefit (34 per cent) as were receiv ing activity compensation or sickness compen-sation (32 per cent). Among men there was 57 per cent receiving compensation from sickness insurance when they applied for an individual life annuity for the first time in 2015. A higher number were receiving compensation from sickness insurance in the form of sickness cash benefit (35 per cent) than were receiving compensation in the form of sickness compensation (23 per cent).
Per centWomen Men
0
20
40
60
80
100
151413121110090807062005 151413121110090807062005
Activity- or sickness compensation
Sickness cash benefit

SOCIAL INSURANCE IN FIGURES 2016
23
Persons who have an individual life annuity and are gainfully employedIndividuals who have a work injury that has resulted in a loss of income can be granted an individual life annuity. An individual life annuity may come into question if the injured party cannot work to the same extent as before or if they, due to the injury,
have been compelled to change job and the new job involves a lower income than the job in which they got injured. The following section presents statistics for persons who have an individual life annu-ity and are gainfully employed.
The statistics for persons with an individual life annuity under current legislation also include those persons who have annuities based on national personal injury protection. The estimate regarding occupational distribution is based on whether persons with an individual life annuity were registered in Statistics Sweden’s (SCB) Occupational Register (according to SSYK96) in November 2013
zy The occupational distribution between working annuitants and the total working population age 18–64, in January 2014According to one estimate, 45 per cent of men aged 18–64 with an individual life annu-ity (under current legislation) were gainfully employed in January 2014. The correspond-ing figure for women was 33 per cent. By comparing the occupational distribution between working annuitants and the occu-pational distribution of the entire working population, it is evident that certain profes-sions are over- or under-represented among those who have an individual life annuity. Of female annuitants who were gain-fully employed in January 2014, 35 per cent worked within the field of service, care and sales. This was a slightly higher percentage compared to all working women in Sweden (32 per cent). Other occupations that were more common for female annuitants than for working women in total were administra-tion and customer service work.
The most common occupational cate-gory for male annuitants in January 2014 was building and manufacturing work (28 per cent). The corresponding percentage among the total number of employed men was 17 per cent. Other occupations that were more common among annuitants than among the working population as a whole included work without the requirement of special vocational training, as well as mechanical manufacturing and transport work. Some professions were clearly overrepre-sented among annuitants, which may reflect differences in working conditions between different professions. The occupations that require higher levels of education are instead under-represented among gainfully employed people with an individual life annuity.
0 5 10 15 20 25 30
Work without the requirement of special vocational training
Mechanical manufacturing and transport workers, etc
Building and manufacturing workers
Agricultural, horticultural, forestry and fishery workers
Service, care and shop sales workers
Administration and customer service clerks
Occupations requiring higher education qualifications or equivalent
Occupations requiring advanced level of higher education
Managers
051015202530Per cent
Women Men
Working population
Working annuitants
Working population
Working annuitants

SOCIAL INSURANCE IN FIGURES 2016
24
Regional variations in the proportion of people with an individual life annuityThe following section presents statistics on the regions in Sweden with the largest proportion of persons with an individual life annuity in the 16–64 age group.
zy Annuitants per 1000 registered insured individuals in Sweden 16–64 years, in December 2015 by regionIn December 2015 there were 2.7 women and 3.9 men with an individual life annuity per 1,000 registered insured individuals in Sweden. There are regional variations in the proportion of those insured who have an individual life annuity under current legis-lation. Västerbotten, Dalarna and Värmland stand out as counties with a relatively higher percentage of people with an individual life annuity, both for women and men.
Stockholm County stands out with a lower percentage of people with an individual life annuity under current legislation. In most counties, there is a higher proportion of men than women who have an annuity. Some counties with a higher proportion of male annuitants include Norrbotten, Gotland and Kalmar. The counties of Jönköping and Östergötland instead have a higher propor-tion of female annuitants.
1.8–2.5
2.6–3.3
3.4–4.1
4.2–5.0
1.0–1.7
2.9–4.1
4.2–5.4
5.5–6.7
6.8–8.1
1.6–2.8
Women Men

SOCIAL INSURANCE IN FIGURES 2016
25
Possible explanations for geographical differencesThere are several possible explanations for these geographical differences in the propor-tion of people with an individual life annuity under current legislation. One such expla-nation could be differences in industrial structure and socio-economic composition between the counties. Another is that the labour market is and has been different in different parts of Sweden. It is therefore pos-sible that there have been more work injuries in certain geographical areas. Before Försäkringskassan became a government agency in 2005, work injury insurance was handled at various county insurance offices. Some of the geographical
differences may therefore be linked to possi-ble differences in the processing and assess-ment of the right to compensation between different insurance offices. However, it is important to remember that today’s regional variations in the proportion of those insured who have an individual life annuity reflects were in the country the people who currently have an individual life annuity now reside. This cannot be equated with an analysis of geo-graphical differences in the granting of work injury compensation. To investigate whether there have been such differences in granting requires additional analysis.

SOCIAL INSURANCE IN FIGURES 2016
26
Financial Scope of Social Insurance
Social security expendituresSocial insurance expenditures are defined here as expenditures on allowances and benefits administered by Försäkringskassan in 2015; that is mainly allowances and benefits paid to families with children, people who are sick and people with disabilities.
� Social insurance expenditures (excluding administration) adjusted to the CPI for 2015Social insurance expenditures for the benefits administered by Försäkringskassan in 2015 amounted to SEK 225 billion, while administration costs for these benefits were just over SEK 8 billion, giving total expendi-tures of just over SEK 233 billion. Since 1980, expenditures (at fixed prices) have increased by 49 per cent. Expenditures declined between 1992 and 1998, primarily due to amended rules, such as reduced compen-sation levels and the adoption of a sick pay period and waiting period. The increase in expenditures starting in 1999 was partially due to rapid increases in sickness cash ben-efit and sickness compensation. A national old age pension contribution – according to which the government pays pension entitle-ments for people with sickness cash benefit, parental benefit, etc. – was introduced in 1999. The decrease in expenditures after 2006 was due primarily to reductions in sickness cash benefit and sickness compen-sation. Expenditures on sickness cash ben-efit rose again during the period 2011–2015 while expenditures on sickness compensa-tion continued to decline.
� Social insurance expenditures (excluding administration) as a proportion of GDPSocial insurance payments represent a considerable proportion of GDP. In 2015, these payments corresponded to 5.4 per cent of GDP. Since 2011, no great changes have occurred and the level is the lowest in 35 years.
SEK billion
0
50
100
150
200
250
20152010200520001995199019851980
Per cent
0
2
4
6
8
10
20152010200520001995199019851980

SOCIAL INSURANCE IN FIGURES 2016
27
Expenditures per expense area/benefit, SEK million 2013 2014 2015
Financial security for families and childrenParental benefit 29,552 30,091 30,816
Temporary parental benefit 6,321 6,655 6,841
Pregnancy benefit 568 601 627
Equality bonus 280 307 343
Child allowance 24,723 25,220 25,764
Housing allowance 4,533 4,958 4,940
Childcare allowance 3,147 3,295 3,548
Maintenance support 3,283 3,258 3,492
Adoption allowance 15 14 15
Total 72,420 74,399 76,386
Financial security in the event of illness or disabilitySickness cash benefit 26,247 30,548 34,718
Rehabilitation allowance 1,363 1,426 1,568
Benefit for care of closely related persons 169 178 182
Supplementary housing allowance 105 89 88
High-cost protection for employers 55 60 78
Dental care 5,191 5,217 5,263
Healthcare abroad 781 489 457
Activity and sickness compensation 47,722 46,139 45,717
Housing supplement 4,517 4,689 4,832
Disability allowance 1,317 1,331 1,353
Work injury compensation1 3,831 3,610 3,397
Car allowance 368 315 280
Attendance allowance 27,107 28,589 29,784
Grants to county councils 1,000 978 681
Grants for the sick-listing process 2,297 2,077 2,063
Other forms of compensation2 43 40 38
Total 122,112 125,773 130,498
Other paymentsActivity grant 15,905 14,519 14,175
Introduction benefit 1,666 2,685 3,667
Family benefit for conscripts 21 20 20
Other 6 4 4
Total 17,598 17,228 17,866
Administration 8,171 8,285 8,293
Total 220,302 225,685 233,0441 Includes expenditures on claim SWEDINT.2 Includes expenditures on compensation within the state personal injury protection (formerly bodily injury)
and expenditures on disease carrier benefit.
� Social insurance expenditures 2012–2015 in SEK million (current prices)Despite a decrease in expenditures on sick-ness allowance, expenditures on financial security in the event of illness and financial security in the event of disability increased gradually between 2013 and 2015. The rea-son was a relatively large increase in sickness cash benefit paid. Expenditures on financial
security for families and children have increased throughout the period, due in part to a higher birth rate. Within the category other payments, expenditures on activity grants dominated. This benefit is paid to people who participate in labour market programmes.

SOCIAL INSURANCE IN FIGURES 2016
28
� Breakdown of expenditures 2015 (SEK million)Just over half of social insurance expendi-tures (56 per cent or around SEK 130 billion) was paid to people who were sick and people with disabilities. Families with children received one third of the expenditures
(33 per cent or around SEK 76 billion). In addition, there are some other benefits, pri-marily within the labour market area (SEK 18 billion). The remainder were expenditures on administration (SEK 8 billion).
� Expenditure areas as a proportion of GDPExpenditures on sickness and disabilities increased during the latter part of the 1980s, but then declined from just over 7 per cent of GDP in 1989 to just under 4 per cent of GDP in 1998. The decline was partly due to less sickness absence, the introduction of the sickness pay period, the reduction in compensation levels and the fact that the county council took over responsibility for the cost of medications. Expenditures
in relation to GDP rose between 1998 and 2003 due to increased sickness absence. Thereafter, expenditures have declined again. Compensation to families and chil-dren increased as a proportion of GDP at the beginning of the 1990s due to increases in the birth rate. During the second half of the 1990s, expenditures declined again as a proportion of GDP and have thereafter remained stable at around 2 per cent.
Administration , 8,293
Other payments, 17,866
Other sickness/disability, 10,134
Attendance allowance, 29,784
Work injury compensation, 3,397Housing allowance, 4,832
Activity/sickness compensation, 45,717 Sickness insurance2, 36,635
Other payments to families, 8,503
Maintenance support, 3,492
Child allowance, 25,764
Parental insurance1, 38,627
1 Parental insurance, equality bonus, temporary parental insurance and pregnancy allowance.2 Sickness benefit, rehabilitation benefit, benefit for care of closely related persons and high-cost protection for employers.
Sickness and disability Families and children Other payments Administration
Per cent
0
1
2
3
4
5
6
7
8
20152010200520001995199019851980
Families and children
Sickness and disability
Other payments

SOCIAL INSURANCE IN FIGURES 2016
29
� Public transfers as a proportion of GDP in 2013 in Sweden and other European countriesApart from social insurance, public transfers also include unemployment compensation and financial assistance. There are big differ-ences in how different countries use public transfers and direct services in order to meet
the needs within the social insurance sys-tem. Examples of direct services which are not included in this summary are tax credits and subsidised pre-school places.
Per cent
Social exclusion (social assistance)Sickness
UnemploymentFamilies and childrenDisability
Survivors
Old age
0 2 4 6 8 10 12 14 16 18 20
Italy*France*AustriaBelgiumDenmark*PortugalNetherlands*FinlandCyprusSpain*Germany*United Kingdom*SerbiaSlovenia*SwitzerlandSweden*LuxembourgHungaryNorwayCroatiaCzech RepublicIrelandMaltaIcelandBulgariaSlovakia*Lathvia*EstoniaRomaniaLithuania*
* Preliminary figuresGreece and Poland did not report statistics on public transfers for 2013. Source: Eurostat

SOCIAL INSURANCE IN FIGURES 2016
30
Financing social insuranceSocial insurance is financed by contributions, taxes, compensation from municipalities, etc.
� Social insurance income and expenditures in 2015 (SEK million)In 2015, the income from social insurance contributions was SEK 122 billion. In addi-tion, government funds (taxes) covered SEK 95 billion of the expenditures. Compensation from municipalities, child support debtors and similar financed just under 3 per cent of the expenditures. The amounts presented under payments in the table also include
government old age pension contributions. Among the types of insurance financed by contributions, work injury insurance, sickness cash benefit and sickness com-pensation generated a surplus of just under SEK 1 billion in 2015. Meanwhile, parental insurance and sickness insurance generated a deficit of just over SEK 11 billion.
Income Expenditures Surplus/ deficit Contrib- Statutory Other Total Pay- Admin- Total utions taxes ments and istration old age pension contribution
Parental insurance1 39,099 – – 39,099 38,000 1,036 39,036 63
Child allowance – 26,130 – 26,130 25,764 366 26,130 –
Housing allowance – 5,222 – 5,222 4,940 281 5,222 –
Childcare allowance – 3,803 – 3,803 3,548 255 3,803 –
Maintenance support – 2,612 1,236 3,847 3,492 356 3,847 –
Sickness insurance2 64,365 11,670 – 76,035 82,979 4,229 87,208 –11,173 3
Grants to county councils – 681 – 681 681 – 681 –
Grants for the sick-listing process – 2,063 – 2,063 2,063 – 2,063 –
Dental care – 5,406 – 5,406 5,263 144 5,406 –
Healthcare abroad – 559 – 559 457 102 559 –
Disability allowance – 1,469 – 1,469 1,353 116 1,469 –
Activity grant 14,175 662 – 14,838 14,175 662 14,838 –
Introduction benefit – 3,717 – 3,717 3,667 50 3,717 –
Work injury compensation 4,508 – – 4,508 3,397 191 3,588 920
Car allowance – 318 – 318 280 38 318 –
Attendance allowance – 25,213 4,894 30,107 29,784 323 30,107 –
Housing supplement – 4,971 – 4,971 4,832 139 4,971 –
Other forms of compensation – 82 – 81 77 5 82 –
Total 122,147 94,577 6,130 222,854 224,751 8,293 233,044 –10,190
1 Includes parental benefit and temporary parental benefit, but in this table, pregnancy benefit, which is usually included in parental insurance, is included in the sickness insurance as it is financed by the sickness insurance contribution.
2 Includes sickness cash benefit, rehabilitation benefit and other rehabilitation compensation, sickness and activity compensation, pregnancy benefit, benefit for care of closely related people and high-cost protection for employers.
3 The difference between sickness insurance contributions and the expenses that they are to finance by law.

SOCIAL INSURANCE IN FIGURES 2016
31
Contribution rate (%) 2006 2007 2008 2009 2010 2011 2012 2013 2014 2015
Old age pension contribution1 10.21 10.21 10.21 10.21 10.21 10.21 10.21 10.21 10.21 10.21
Survivor pension contribution1 1.7 1.7 1.7 1.7 1.7 1.17 1.17 1.17 1.17 1.17
Sickness insurance contribution
– Employer’s contribution 8.64 8.78 7.71 6.71 5.95 5.02 5.02 4.35 4.35 4.35
– Self-employed person’s social security contribution 9.61 9.61 7.93 6.93 6.04 5.11 5.11 4.44 4.44 4.44
Parental insurance contribution1 2.2 2.2 2.2 2.2 2.2 2.2 2.6 2.6 2.6 2.6
Work injury contribution1 0.68 0.68 0.68 0.68 0.68 0.68 0.3 0.3 0.3 0.3
Labour market contribution
– Employer’s contribution 4.45 4.45 2.43 2.43 4.65 2.91 2.91 2.91 2.91 2.64
– Self-employed person’s social security contribution 1.91 1.91 0.5 0.5 2.11 0.37 0.37 0.37 0.37 0.1
General payroll tax1 4.4 4.4 7.49 7.49 6.03 9.23 9.21 9.88 9.88 10.15
Total employer’s contribution 32.28 32.42 32.42 31.42 31.42 31.42 31.42 31.42 31.42 31.42
Total self-employed person’s social security contribution 30.71 30.71 30.71 29.71 28.97 28.97 28.97 28.97 28.97 28.97
1 Employer’s and self-employed person’s social security contribution have the same expenditure rate.
� Statutory contributions to social insurance in per cent of the contribution baseThe base for social insurance contributions consists of the payroll expense for employees and self-employed people. Employers and self-employed people pay the contributions. Certain changes in the contributions have been offset by corresponding changes to the general payroll tax (a contribution that is not linked to any special social insurance benefit or allowance). Total payroll taxes were thus
stable at just over 32 per cent until 2009. The sickness insurance contribution was lowered by one percentage point at that junc-ture, while other contributions remained unchanged. As a result, the total contribu-tion declined by one percentage point. The contribution rates were unchanged in 2015 compared to 2014.
SOCIAL INSURANCE IN FIGURES 2016
32
Registered insured persons
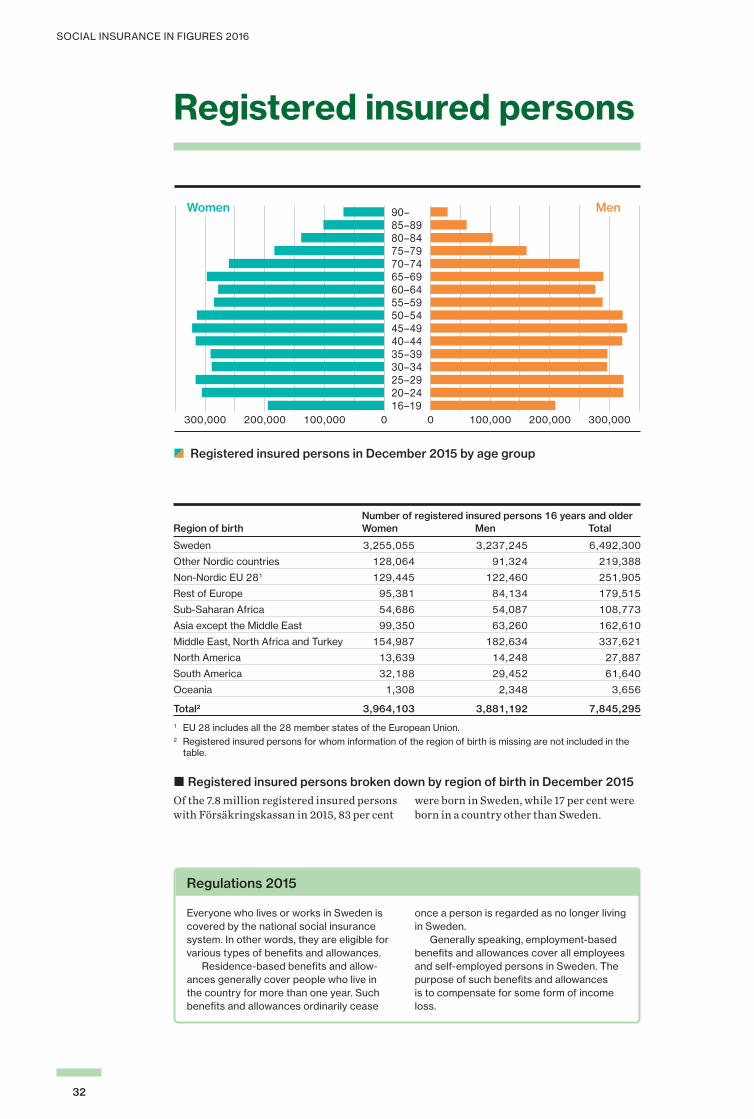
zy Registered insured persons in December 2015 by age group
Number of registered insured persons 16 years and older Region of birth Women Men Total
Sweden 3,255,055 3,237,245 6,492,300
Other Nordic countries 128,064 91,324 219,388
Non-Nordic EU 281 129,445 122,460 251,905
Rest of Europe 95,381 84,134 179,515
Sub-Saharan Africa 54,686 54,087 108,773
Asia except the Middle East 99,350 63,260 162,610
Middle East, North Africa and Turkey 154,987 182,634 337,621
North America 13,639 14,248 27,887
South America 32,188 29,452 61,640
Oceania 1,308 2,348 3,656
Total2 3,964,103 3,881,192 7,845,295
1 EU 28 includes all the 28 member states of the European Union.2 Registered insured persons for whom information of the region of birth is missing are not included in the
table.
� Registered insured persons broken down by region of birth in December 2015Of the 7.8 million registered insured persons with Försäkringskassan in 2015, 83 per cent
were born in Sweden, while 17 per cent were born in a country other than Sweden.
Regulations 2015
Everyone who lives or works in Sweden is covered by the national social insurance system. In other words, they are eligible for various types of benefits and allowances. Residence-based benefits and allow-ances generally cover people who live in the country for more than one year. Such benefits and allowances ordinarily cease
once a person is regarded as no longer living in Sweden. Generally speaking, employment-based benefits and allowances cover all employees and self-employed persons in Sweden. The purpose of such benefits and allowances is to compensate for some form of income loss.
0 100,000 200,000 300,00016–1920–2425–2930–3435–3940–4445–4950–5455–5960–6465–6970–7475–7980–8485–8990–
0100,000200,000300,000
MenWomen

SOCIAL INSURANCE IN FIGURES 2016
33
Number of registered insured persons Estimated percentage 19–64 years with sickness cash benefit Region of qualifying income birth Women Men Total Women Men Total
Sweden 2,220,021 2,322,348 4,542,369 90 89 90
Other Nordic countries 66,648 52,528 119,176 83 82 82
Non-Nordic EU 28 90,171 85,802 175,973 82 85 83
Rest of Europe 78,250 69,272 147,522 80 84 82
Sub-Saharan Africa 45,797 44,637 90,434 75 73 74
Asia except the Middle East 87,136 51,505 138,641 78 80 79
Middle East, North Africa and Turkey 129,041 152,182 281,223 70 75 73
North America 11,051 11,798 22,849 78 81 80
South America 27,542 25,343 52,885 83 85 84
Oceania 1,129 2,150 3,279 78 83 82
Total 2,756,786 2,817,565 5,574,351 88 88 88
The number of insured persons expected to have sickness cash benefit qualifying income is estimated here on those who have pensionable income that comes to at least 24 per cent of the price basic amount (excluding those who receive income-related activity or sickness compensation and those who do not have sickness cash benefit qualifying income but receive parental benefit at the guarantee level).
� Estimated proportion of insured people aged 19–64 with sickness cash benefit qualifying income at the beginning of 2015A larger proportion of those born in Sweden are expected to have sickness cash benefit qualifying income than those born abroad. Of those born in Sweden, 90 per cent were eligible for sickness cash benefit, pregnancy benefit, temporary parental benefit and other income-related daily compensation. A total of 70 per cent of women and 75 per cent of men born in the Middle East, North Africa and Turkey were entitled to sickness cash benefit qualifying income. The main reason that the proportion was lower for people born in certain regions of the world outside
Sweden is that they tend to have less of a foothold in the labour market. Figures for the proportion of insured people who were entitled to sickness cash benefit qualifying income are inexact; the reason being that the assessment was performed when a person applied for income-related daily compensa-tion. Thus, the data is based on an estimate that proceeds from information about pen-sionable income.
Regulations 2015
Insured people entitled to sickness cash benefit qualifying income are those expected to earn at least 24 per cent of the price basic amount every year from gainful employment. That corresponded to sickness cash benefit qualifying income of just under SEK 10,700
in 2015. Having the right to sickness cash benefit qualifying income is a basic prerequi-site for entitlement to sickness cash benefit, pregnancy benefit, temporary parental benefit and other income-related daily compensation.

SOCIAL INSURANCE IN FIGURES 2016
34
Financial security for families and children
Parental benefitThe purpose of parental benefit is to make it easier to combine parenthood with work or studies.
zy Parental benefit daysThe birth rate increased in the early 2000s, as did the number of parental benefit days. Quite a few changes occurred during the period with respect to the number of days and the amount of compensation. In 2015, parental benefit was paid for more than 53 million days, of which 74 per cent to women. Men accounted for an increased proportion of days during the period. From having received parental benefit for just over 14 per cent of the total days in 2001, by 2015 this amounted to 26 per cent.
zy Average number of parental benefit days at various ages for children born in 2007Most days of parental leave for children born in 2007 were during their first three years and were taken by women. After that age, there was no difference between women and men.
Number
0
10,000,000
20,000,000
30,000,000
40,000,000
2015201020052001
Women
Men
Number
Women
Men
Childs age, year
0
50
100
150
200
250
87654321

SOCIAL INSURANCE IN FIGURES 2016
35
� Proportion of days of parental benefit taken by men per county in 2015Men took 26 per cent of all parental ben-efit days in 2015. Men accounted for the most days (just short of 31 per cent) in Västerbotten County and fewest days (just short of 24 per cent) in Skåne County. The differences between the various munici-palities were quite large in many counties. For example, men accounted for a greater proportion of days in Umeå, Uppsala, Lund and other municipalities with large uni-versity towns than in sparsely populated municipalities. Men’s proportion of days of parental benefit is partially a function of the number of days taken by women. Thus, the men of two counties may differ in terms of their proportion of total days but not with respect to the average number of days per child, and the difference in proportions is then depend-ent on the number of days taken by women varying between counties.
zy Proportion of recipients of parental benefit at the basic level only in 2015The proportion of recipients who received parental benefit at the basic level only declined until the age of 50, and then began to rise again. A total of 12 per cent of women and 4 per cent of men received parental ben-efit at the basic level only because they did not meet the requirements for income-re-lated parental benefit.
A total of 92 per cent of women and 75 per cent of men aged 19 and younger received parental benefit at the basic level only in 2015. However, few recipients of parental benefit were in this age group.
25.3–26.6
23.9–25.2
26.7–28.0
28.1–29.4
29.5–30.9
Women
Men
Per cent
0
20
40
60
80
100
55–50–5445–4940–4435–3930–3425–2920–24–19Age, year

SOCIAL INSURANCE IN FIGURES 2016
36
Number of children Percentage of children for whom parental benefit was paid Age Girls Boys Girls Boys
0 45,699 48,901 82 82
1 54,911 57,958 96 96
2 41,977 44,351 74 74
3 31,787 33,570 56 55
4 30,299 32,011 53 53
5 31,927 33,805 54 54
6 33,104 35,338 57 58
7 34,035 36,622 60 61
8 32,119 33,990 57 57
Total 335,858 356,546 65 65
� Children whose parents received parental benefit in 2015The parents of 82 per cent of children born in 2015 (age 0 in the table) received parental benefit during the year. The proportion declined after the child’s second birthday.
Parental benefit was paid for just over 65 per cent of children aged 8 and younger in 2015.
Number of recipients Number of days Average amount, on average SEK per day Age Women Men Women Men Women Men
–19 1,173 57 178 77 224 255
20–24 21,494 4,414 152 46 322 484
25–29 79,811 33,891 127 44 438 592
30–34 124,582 81,221 101 45 523 655
35–39 120,839 104,474 74 40 545 669
40–44 68,703 81,515 51 34 523 650
45–49 16,597 34,904 36 32 462 620
50–54 1,856 11,119 38 33 439 593
55– 128 3,788 47 39 409 555
Total 435,183 355,383 90 39 487 643
� Parental benefit 2015Of the SEK 28 billion paid in parental benefit in 2015, 67 per cent went to women and 33 per cent to men. A total of 55 per cent of the recipients were women and 45 per cent were men. Due to gender differences with respect to income from employment and use of parental benefit, the average daily amount was 32 per cent higher for men than women. One reason was that women were more likely
than men to receive parental benefit at the basic level. The older the parents, the lower the average number of days. This is due in part to the fact that young parents are more likely to have young children and usually take most parental benefit days during a child’s early years.

SOCIAL INSURANCE IN FIGURES 2016
37
Percentage of recipients Average amount at the basic level only (regardless of compensation level), SEK per day Region of birth Women Men Women Men
Sweden 4.2 1.1 546 683
Other Nordic countries 8.7 3.0 532 668
Non-Nordic EU 28 18.8 4.9 453 623
Rest of Europe 22.4 5.6 417 572
Sub-Saharan Africa 62.0 24.4 278 426
Asia except the Middle East 38.2 11.8 352 547
MENA + Turkey (20 countries) 53.9 26.1 314 459
North America 19.8 8.9 464 567
South America 17.9 6.1 445 566
Oceania 18.1 6.5 514 621
Total 12.0 3.8 487 643
� Proportion of recipients of parental benefit at the basic level only and average compensation for all recipients irrespective of level in 201512 per cent of women and just under 4 per cent of men received parental benefit at the basic level only in 2015. The proportion was lowest among parents born in Sweden. Throughout, it was more common for women than for men to receive parental benefit at basic level only, irrespective of region of birth.
Parents born in Sweden received a higher average compensation per day compared to parents born in a country other than Sweden. Irrespective of region of birth, women received lower average compensation per day compared to men.
� Number of children for whom a parent took double days in 2015The number of children whose parents took double days increased with the age of the child, and days were paid for just over 6,500 children 12 months of age. Double days were paid for more than 35,000 children in 2015.
Number
0
1,000
2,000
3,000
4,000
5,000
6,000
7,000
121110987654321
Months

SOCIAL INSURANCE IN FIGURES 2016
38
Regulations 2015
Following either birth or adoption, parents can receive parental benefit for a total of 480 days per child. Compensation for 390 of the days is income-related. Parents who do not meet the requirements for income-re-lated compensation, or whose income is too low, receive basic parental benefit of SEK 225 per day. For the remaining 90 days, they receive the minimum benefit, which is SEK 180. Each parent who has joint custody of a child is entitled to half of all parental benefit days. A parent is free to waive their right to parental benefit in favour of the other parent, except for the 60 days that are reserved for each parent. The main rule is that parental benefit may not be paid to both parents for the same child and period. However, parents can receive parental benefit simultaneously for up to 30 days until a child’s first birthday. Försäkringskassan refers to that option as double days. The benefit can be paid for one-eighth, one-quarter, one-half, three-quarters or all of
a day. Parental benefit can generally be paid until a child turns 8 or completes their first year of school. Compensation is just under 80 per cent of sickness cash benefit quali-fying income and may not exceed 10 times the price basic amount per day. In 2015, this corresponded to a maximum compensation of SEK 946. From 1 January 2014, certain new provisions apply within the area of parental benefit. The provisions apply to children born in 2014 and after. The new provisions mean, for example, that the number of days on the different compensation levels are divided evenly between the parents. They also entail that the time frame within which parental benefit can be granted is extended until the child turns 12 years old, or until such later date as the child has finished year five of compulsory school. Another change is that parental benefit can only be paid out for a maximum of 96 days for children that have turned 4 years old.
Age Number of recipients
–19 88
20–24 4,769
25–29 19,547
30–34 23,819
35–39 14,629
40–44 5,103
45–49 1,137
50–54 328
55– 109
Total 69,529
� Number of recipients of double days in 2015Most recipients of double days were aged 25–39. A larger proportion of recipients were in this age group than was the case for ordinary parental benefit. The reason may be that double days can be taken only until a child is 1 year of age.

SOCIAL INSURANCE IN FIGURES 2016
39
Equality bonusThe purpose of the equality bonus is to increase the incentive for parents to share parental leave and participate in working life.
Number of recipients Number of days on average Age Women Men Women Men
–24 3,103 1,018 17.8 17.9
25–29 18,650 10,359 15.4 15.6
30–34 41,649 32,269 14.4 14.8
35–39 43,461 43,757 12.1 12.9
40–44 21,416 29,935 9.8 10.9
45–49 4,037 10,432 8.0 10.3
50– 353 3,859 8.5 11.1
Total 132,669 131,629 12.9 12.9
� Equality bonus 2015Just over SEK 340 million was paid in equality bonus for just over 147,000 chil-dren. Most recipients were 30–39, the same age at which the highest number of parents received parental benefit. Younger recip-ients averaged more days than older ones, partly because the highest number of days
of parental benefit, and thus also days with equality bonus, are paid before a child’s third birthday, and partly because older parents have older children. Approximately 264,000 parents received the equality bonus in 2015.
Regulations 2015
To be eligible for the bonus, parents must have joint custody when they receive parental benefit. The bonus is paid after the 60 days reserved for each parent have been taken. The bonus cannot be paid until the parent who has taken the fewest number of days receives parental benefit. The daily bonus is SEK 50 for each parent. Parents receive the maximum bonus when they each take 135 parental benefit
days at the sickness cash benefit or basic level, which corresponds to a maximum bonus of SEK 13,500 per set of parents. The bonus is tax-exempt. The 60 days reserved for each parent, the double days and the minimum level days are not bonus-qualifying. The bonus is available for children born after 30 June 2008.

SOCIAL INSURANCE IN FIGURES 2016
40
Temporary parental benefit for care of childrenTemporary parental benefit for care of children compensates parents for staying home from work with a sick child.
zy Temporary parental benefit days for care of children The number of temporary parental benefit days for care of children was rather uniform until 2013. In 2013, the number of days increased and has remained on roughly the same level since then. The relative number of days taken by women and men has changed somewhat since 2001. Women took 62 per cent of the more than 6 million temporary parental benefit days for care of children in 2015, while men took 38 per cent.
� Average number of temporary parental benefit days for care of children 2015The number of temporary parental benefit days for care of children per child in the total population (regardless of whether or not the parents used the benefit) was highest at the age of 2 and subsequently began to decline. The average number of temporary paren-tal benefit days for care of children born in 2015 (year 0 in the diagram) and for children aged 12 and older was low with respect to the total population of those children. On the other hand, the average number of days was high for those children for whom the benefit was used. The main reason was that the benefit was primarily used for children with severe illness.
* VAB stands for temporary parental benefit for care of children.
Number of children Percentage of each age group Age Girls Boys Girls Boys
0 3,320 4,397 6 7
1 21,859 24,116 38 40
2 37,815 40,701 66 67
3 36,499 39,246 64 65
4 35,569 37,681 62 63
5 36,643 39,109 62 62
6 34,483 37,257 60 61
7 32,354 34,773 57 58
8 30,832 32,749 55 55
9 29,010 30,724 52 52
10 26,009 27,539 48 48
11 22,881 24,733 42 43
Total 347,274 373,025 51 52
� Children aged 11 and younger for whom temporary parental benefit for care of children was paid in 2015Parents of just over 720,000 children aged 11 and younger received temporary paren-tal benefit for care of children in 2015. Most commonly, parents of two-year-olds received temporary parental benefit for care of children – 66 per cent of girls and 67 per cent of boys had a parent or other close relative who used the benefit. The corre-sponding figures for all children in the age group 0–11 years were 51 per cent of girls and 52 per cent of boys.
Number
0
500,000
1,000,000
1,500,000
2,000,000
2,500,000
3,000,000
3,500,000
4,000,000
2015201020052001
Women
Men
Number
0
5
10
15
20
25
30
17161514131211109876543210Age, year
Days, averageper child in population
Days, averageper child with VAB*

SOCIAL INSURANCE IN FIGURES 2016
41
Number of recipients Number of days Average amount, on average SEK per day Age Women Men Women Men Women Men
0–24 5,110 2,353 10.2 8.1 699 879
25–29 40,681 23,306 10.4 7.8 790 927
30–34 93,420 64,018 9.7 7.6 845 950
35–39 126,715 93,070 8.7 7.0 881 962
40–44 109,116 86,084 7.6 6.4 894 961
45–49 46,523 44,783 7.1 6.1 896 954
50–54 12,199 16,536 6.9 6.3 896 938
55–59 3,951 4,642 4.5 6.2 909 931
60–64 2,811 1,667 2.8 4.9 903 929
65– 441 275 2.6 5.1 865 940
Total 440,967 336,734 8.5 6.9 864 953
� Temporary parental benefit for care of children 2015Just under 778,000 parents, 57 per cent women and 43 per cent men, received tem-porary parental benefit for care of children in 2015. Approximately SEK 5.5 billion was
disbursed, of which 60 per cent to women and 40 per cent to men. Women averaged just under 9 days and men averaged just under 7 days over the year.
Regulations 2015
A parent who has to forgo gainful employ-ment due to the illness or infection of their child or their child’s regular minder, a preventive healthcare visit to a child health centre, etc. may be eligible for temporary parental benefit for care of children. This applies to children younger than 12 years, as well as older ones under certain circum-stances. Compensation can normally be paid for 60 days per child each year. Once those days have been used, an additional 60 days can be taken out if the child is ill or needs preventive health care. Under certain circumstances, a parent can transfer their right to temporary parental benefit for care
of children to another adult, who stays home from work in place of the parent in order to care for the child. Parents can receive an unlimited number of temporary parental benefit days for care of seriously ill children under the age of 18. In such situations, both parents can receive the benefit for the same child and period. The benefit, which amounts to just under 80 per cent of sick-ness cash benefit qualifying income, can be paid for one-eighth, one-quarter, one-half, three-quarters or all of a day. For employees, it is based on the number of days or hours worked. The maximum benefit is 7.5 times the price basic amount.

SOCIAL INSURANCE IN FIGURES 2016
42
Temporary parental benefit in connection with birth or adoptionTemporary parental benefit in connection with birth or adoption makes it possible for a father, second parent or other adult to be present during the birth and participate in the care of a child in conjunction with the birth or adoption of a child.
� Temporary parental benefit in connection with birth or adoptionBoth the birth rate and the number of par-ents taking advantage of this benefit rose in the 2000s. For approximately 75 per cent of children born or adopted in 2015, the father, second parent or other adult received tempo-rary parental benefit in conjunction with the birth or adoption.
Number of recipients Number of days Average amount, on average SEK per day Age Women Men Women Men Women Men
–24 23 2,857 9.0 9.6 820 892
25–29 103 17,467 8.9 9.7 887 939
30–34 177 29,097 9.0 9.7 942 959
35–39 192 21,729 8.5 9.6 982 962
40–44 177 9,654 8.3 9.5 935 957
45–49 106 2,928 7.8 9.5 944 939
50–54 121 866 7.7 9.3 900 933
55–59 112 234 7.4 9.0 872 921
60– 85 73 7.2 9.2 888 998
Total 1,096 84,905 8.2 9.6 925 952
� Temporary parental benefit in connection with birth or adoption 2015In 2015, temporary parental benefit in connection with birth or adoption was paid to 86,000 people. A total of 1.3 per cent of the recipients were women and 98.7 per cent
were men. All in all, approximately SEK 808 million was disbursed in the form of this benefit. Just over 1 per cent was paid to women.
Regulations 2015
While forgoing gainful employment, the father or second parent is entitled to temporary parental benefit for 10 days in connection with the birth of a child. Under certain circumstances, someone other than the father or second parent can use these days. Each parent is entitled to five days when adopting a child. The days may be
taken during a 60-day period after the child leaves hospital or is placed with its adoptive parents. The benefit amounts to just under 80 per cent of the sickness cash benefit qualifying income. For employees, it is based on the number of days or hours worked. The maximum benefit is 7.5 times the price basic amount.
Number
0
20,000
40,000
60,000
80,000
100,000
120,000
2015201020052001
Children born
Recipients

SOCIAL INSURANCE IN FIGURES 2016
43
Temporary parental benefit for contact daysTemporary parental benefit for contact days compensates parents of children covered by the Act on Support and Services to Certain Disabled People (LSS) while participating in parental training and the like.
zy Temporary parental benefit for contact days The number of contact days paid has risen since the beginning of the 2000s. Women accounted for 64 per cent and men for 36 per cent of the total days in 2015. The peaks in 2001 and 2006 were largely due to inaccurate records.
Number of recipients Number of days Average amount, on average SEK per day Age Women Men Women Men Women Men
0–29 89 40 2.1 1.9 817 871
30–34 332 174 2.4 2.1 840 954
35–39 869 468 2.4 2.1 891 951
40–44 1,219 727 2.3 2.2 911 965
45–49 789 506 2.4 2.3 906 960
50–54 322 264 2.5 2.1 892 977
55– 66 103 2.5 2.1 895 933
Total 3,686 2,282 2.4 2.1 894 959
� Temporary parental benefit for contact days 2015Almost 6,000 parents used parental benefit for children covered by LSS in 2015. A total of 62 per cent of the recipients were women and 38 per cent were men. Approximately
SEK 13 million was paid in temporary parental benefit for contact days, of which 62 per cent to women and 38 per cent to men.
Regulations 2015
Parents of a child up to the age of 16 years who is covered by LSS is entitled to 10 con-tact days a year. The days may be taken for parental training, orientation or a visit to the preschool or schoolchildren’s programme in which the child is participating. The benefit can be paid for one-eighth, one-quarter,
one-half, three-quarters or all of a day. The benefit amounts to just under 80 per cent of the sickness cash benefit qualifying income. For employees, it is based on the number of days or hours worked. The maximum benefit is 7.5 times the price basic amount.
Number
0
2,000
4,000
6,000
8,000
10,000
2015201020052001
Women
Men

SOCIAL INSURANCE IN FIGURES 2016
44
Temporary parental benefit in connection with the death of a childTemporary parental benefit in connection with the death of a child compensates a parent for staying home from work in such an eventuality.
Number of recipients Number of days Average amount, on average SEK per day Age Women Men Women Men Women Men
0–24 22 14 9.8 9.4 671 1,033
25–29 111 90 9.7 9.3 910 964
30–34 115 130 9.4 9.0 909 1,012
35–39 87 116 8.9 9.3 858 948
40–44 36 62 9.4 9.5 947 892
45–49 18 31 9.3 8.7 870 871
50– 8 29 8.3 9.2 962 945
Total 397 472 9.4 9.2 887 959
� Temporary parental benefit in connection with the death of a child 2015Just under 900 parents received temporary parental benefit in connection with the death of a child in 2015. A total of 46 per cent of the recipients were women and 54 per cent were men. Approximately SEK 7.5 million
was paid in temporary parental benefit in connection with the death of a child, of which 44 per cent to women and 56 per cent to men. Women used 9.4 days on average, while men used 9.2 days on average.
Regulations 2015
Parents of a child who has died can receive the benefit for 10 days while forgoing gainful employment. They may take the time until 90 days after the child’s death. The benefit, which amounts to just under 80 per cent of sickness cash benefit qualifying income, can
be paid for one-eighth, one-quarter, one-half, three-quarters or all of a day. For employees, it is based on the number of days or hours worked. The maximum benefit is 7.5 times the price basic amount.

SOCIAL INSURANCE IN FIGURES 2016
45
Pregnancy benefitPregnancy benefit gives expectant mothers who cannot continue their gainful employment the opportunity to take time off and rest.
� Pregnancy benefitMany women receive pregnancy, sickness or parental benefit to one degree or another during the third trimester. The birth rate has increased since the early 2000s, but the number of pregnancy benefit recipi-ents has not risen commensurately. One reason may be that the rules have not kept up with changing working conditions and other developments in the labour market. Approximately 22 per cent of expectant mothers received pregnancy benefit in 2015.
Number of Number of days Average amount, Age recipients on average SEK per day
–19 12 44 337
20–24 2,923 41 504
25–29 10,094 41 568
30–34 8,138 41 594
35–39 3,299 41 596
40–44 720 41 594
45– 42 41 600
Total 25,228 41 573
� Pregnancy benefit 2015Approximately SEK 570 million in preg-nancy benefit was paid to 25,200 women in 2015. Most recipients were 25–34 years old,
the age at which women are most likely to have children.
Regulations 2015
An expectant mother who has a physically demanding job can receive pregnancy ben-efit towards the end of the pregnancy if her employer is unable to assign her more suit-able tasks. Pregnancy benefit can be paid for up to 50 days during the last two months of pregnancy. If the Work Environment Act
prohibits a particular kind of work during pregnancy, the woman is entitled to preg-nancy benefit for every day covered by the prohibition (which might mean throughout the pregnancy) except for the ten days before the baby is due.
Number
0
20,000
40,000
60,000
80,000
100,000
120,000
2015201020052001
Children born
Recipients
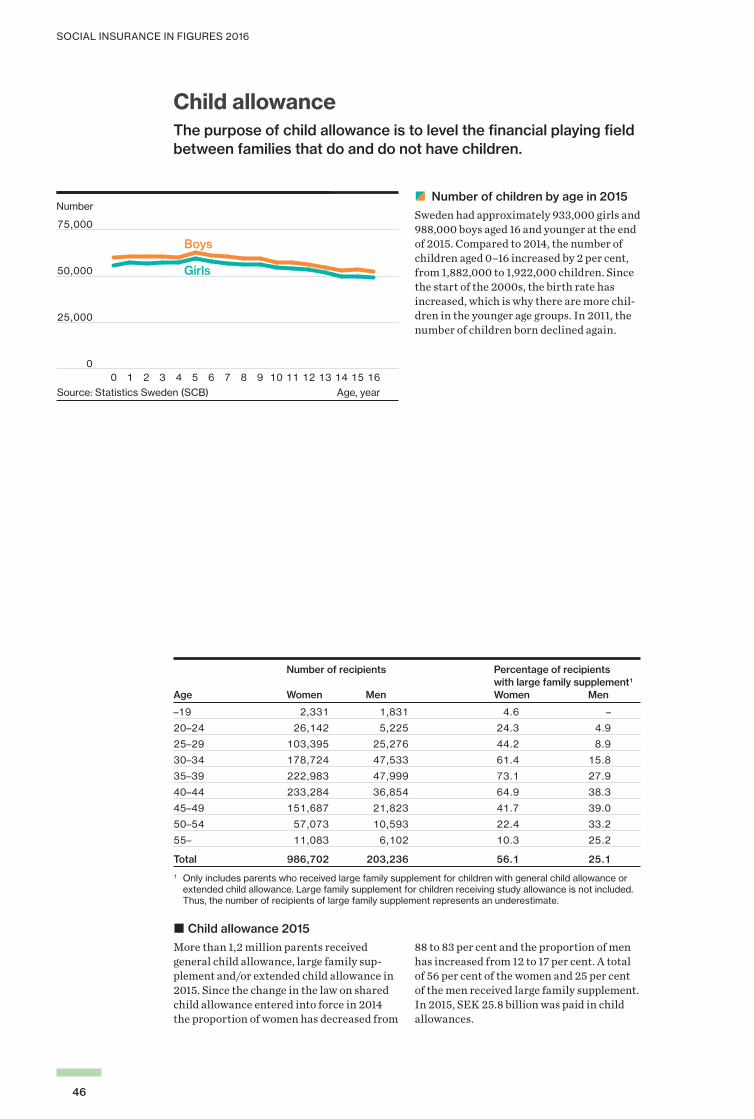
SOCIAL INSURANCE IN FIGURES 2016
46
Child allowanceThe purpose of child allowance is to level the financial playing field between families that do and do not have children.
zy Number of children by age in 2015 Sweden had approximately 933,000 girls and 988,000 boys aged 16 and younger at the end of 2015. Compared to 2014, the number of children aged 0–16 increased by 2 per cent, from 1,882,000 to 1,922,000 children. Since the start of the 2000s, the birth rate has increased, which is why there are more chil-dren in the younger age groups. In 2011, the number of children born declined again.
Number of recipients Percentage of recipients with large family supplement1 Age Women Men Women Men
–19 2,331 1,831 4.6 –
20–24 26,142 5,225 24.3 4.9
25–29 103,395 25,276 44.2 8.9
30–34 178,724 47,533 61.4 15.8
35–39 222,983 47,999 73.1 27.9
40–44 233,284 36,854 64.9 38.3
45–49 151,687 21,823 41.7 39.0
50–54 57,073 10,593 22.4 33.2
55– 11,083 6,102 10.3 25.2
Total 986,702 203,236 56.1 25.1
1 Only includes parents who received large family supplement for children with general child allowance or extended child allowance. Large family supplement for children receiving study allowance is not included. Thus, the number of recipients of large family supplement represents an underestimate.
� Child allowance 2015More than 1,2 million parents received general child allowance, large family sup-plement and/or extended child allowance in 2015. Since the change in the law on shared child allowance entered into force in 2014 the proportion of women has decreased from
88 to 83 per cent and the proportion of men has increased from 12 to 17 per cent. A total of 56 per cent of the women and 25 per cent of the men received large family supplement. In 2015, SEK 25.8 billion was paid in child allowances.
Number
0
25,000
50,000
75,000
161514131211109876543210
Girls
Boys
Age, yearSource: Statistics Sweden (SCB)

SOCIAL INSURANCE IN FIGURES 2016
47
Regulations 2015
The term child allowance refers to general child allowance, extended child allowance or large family supplement. Parents are entitled to general child allowance for children who lives in Sweden until the quarter they turn 16. The parent can subsequently receive extended child allowance as long as the child is in compulsory school or the equivalent. Parents of children born on or after 1 March 2014 who have joint custody share the child allowance. This means that they get SEK 525 each per month. If parents wish to change so that the whole child allowance is paid to one or the other of the parents, they must make a joint request. If the parents take turns having the child live with them, half of the child
allowance is paid to each parent following a request from either parent, provided the parent can show it is probable that the child has alternate residence. A parent who receives general child allowance, extended child allowance or study allowance for two or more children also receives large family supplement. Child allowance is tax-exempt. In 2015, the child allowance was SEK 1,050 per child and month. In 2015, large family supplement was SEK 150 per month for the second child, SEK 454 for the third child, SEK 1,010 for the fourth child and SEK 1,250 for each addi-tional child.
Monthly amount 2015, SEK Annual amount Child Large family 2015, SEK allowance supplement Total
1 child 1,050 – 1,050 12,6002 children 2,100 150 2,250 27,0003 children 3,150 604 3,754 45,0484 children 4,200 1,614 5,814 69,7685 children 5,250 2,864 8,114 97,368
For each additional child 1,050 1,250 2,300 27,600

SOCIAL INSURANCE IN FIGURES 2016
48
Maintenance supportMaintenance support provides for children whose parents are living apart even when the child support debtor is not meeting his/her obligation.
zy Children with maintenance supportThe number of children for whom main-tenance support was paid declined in the 2000s. Not only did Sweden have a low birth rate in the late 1990s and early 2000s, but alternate residence grew more common, so that child support was more likely to be paid directly. Furthermore, Försäkringskassan pursued an active policy of encouraging parents who had separated to settle child support between themselves.
Number of children Proportion of each age group Age Girls Boys Girls Boys
0–2 7,019 7,411 4.1 4.1
3–5 13,068 13,805 7.5 7.5
6–8 16,914 17,891 9.9 9.9
9–11 19,127 20,169 11.6 11.6
12–14 21,881 22,799 14.1 13.9
15–17 24,383 25,228 16.5 15.8
18–19 7,477 8,076 7.2 7.3
Total 109,869 115,379 10.1 10.0
� Children for whom maintenance support was paid in December 2015Parents of 225,000 children received main-tenance support in December 2015. This corresponds to 10 per cent of all girls and boys aged 19 or younger. Just over 16 per cent of 15–17 year-olds (the largest group) had a parent who received maintenance support from Försäkringskassan.
Number of recipients Age Women Men
–24 12,313 7,563
25–29 13,899 856
30–34 20,516 1,825
35–39 25,851 3,277
40–44 25,787 4,023
45–49 18,619 3,641
50–54 9,532 2,448
55–59 2,427 1,055
60– 439 740
Total 129,383 25,428
� Maintenance support in December 2015In 2015, just over SEK 2.3 billion was paid in maintenance support. A large percentage of the amount paid by Försäkringskassan was paid back by the child support debtors. A total of 84 per cent of the recipients were women and 16 per cent were men. Because extended maintenance support is often paid directly to children, they accounted for a large proportion of recipients age 24 or younger. Apart from that group, 87 per cent of the recipients were women and 13 per cent were men.
Number
0
25,000
50,000
75,000
100,000
125,000
150,000
175,000
2015201020052001
Girls
Boys

SOCIAL INSURANCE IN FIGURES 2016
49
Number of child support Number with debt Average debt1, debtors SEK in December Age Women Men Women Men Women Men
–24 304 2,328 14 265 3,699 5,569
25–29 1,157 7,231 196 1,758 6,633 6,950
30–34 2,332 12,456 529 3,771 7,098 10,806
35–39 3,574 18,292 947 5,726 8,058 13,034
40–44 4,099 22,279 1,284 7,325 8,091 14,452
45–49 3,108 21,330 1,076 7,416 9,020 15,634
50–54 1,614 15,588 581 5,728 6,837 14,318
55–59 453 7,951 162 2,911 9,233 14,196
60– 66 5,302 29 1,991 12,619 12,662
Total 16,707 112,757 4,818 36,891 8,025 13,537
1 The average debt is based on the proportion of child support debtors who owed money to Försäkringskassan. Thus, the table does not include any debt that had been passed on to the Enforcement Authority for collection.
� Child support debtors in December 2015A total of 13 per cent of the almost 129,500 child support debtors in December 2015 were women and 87 per cent men. A total of
29 per cent of the women and 33 per cent of the men owed money to Försäkringskassan.
Regulations 2015
Parents are obliged to provide for their children until they turn 18, or longer if they are still in school. If a child is living perma-nently with one parent, the other parent shall pay child support. The parents can agree to a suitable amount or base it on the provi-sions of the Children and Parents Code. The amount of child support is determined by the needs of the child and the parents’ financial capacity. Försäkringskassan can pay mainte-nance support if:• the child support debtor is not paying or
paying less than SEK 1,573 per month•paternity has not been established•a single parent has adopted a child from
abroad.
Monthly maintenance support is maximum SEK 1,573 per child. Extended maintenance support can be paid as long as the child is studying and is entitled to extended child allowance or study allow-ance, but not past June of the year the child turns 20. Maintenance support can be paid in the maximum amount, as a supplementary allowance or for alternate residence. If max-imum maintenance support is paid, the child support debtor shall reimburse all or part of it to Försäkringskassan. The reimbursement amount, which is based on the child support debtor’s income according to the latest final tax decision, is pro-rated based on the num-ber of children the debtor must provide for.

SOCIAL INSURANCE IN FIGURES 2016
50
Housing allowanceHousing allowance provides low income families with children and young people with the opportunity to live in adequate and sufficiently large enough homes.
� Number of households receiving housing allowance in DecemberThe number of households receiving housing allowance has decreased since the start of the 2000s. The decrease is due in part to the rule amendments made during the period, and in part to incomes rising while the upper limits for receiving an allowance remained unchanged. The number started rising again after 2011. Over 186,000 households received housing allowance in December 2015. Just under one-fifth of the recipients were young people without children.
Number of households by type Average amount per household, SEK in December
Single Single Cohabitees Cohabitees Age Women Men or spouses Women Men or spouses
–24 16,561 13,867 3,702 1,397 913 1,864
25–29 14,589 6,337 7,163 2,327 1,019 2,204
30–34 14,453 1,588 9,008 2,783 1,978 2,418
35–39 16,676 2,427 9,053 2,702 1,990 2,609
40–44 17,194 2,705 7,838 2,492 2,025 2,698
45–49 12,978 2,790 5,974 2,360 2,043 2,723
50–54 7,115 2,299 3,695 2,341 2,032 2,657
55–59 2,219 1,326 1,871 2,382 1,953 2,615
60– 451 1,001 1,180 2,651 2,152 2,662
Total 102,236 34,340 49,482 2,337 1,388 2,493
� Housing allowance in December 2015In December 2015, housing allowance was paid to just over 180,000 households. Housing allowance is paid primarily to sin-gle parents, usually women. A total of SEK 4.9 billion in housing allowance was paid
in 2015. Just under 55 per cent of the total was for households with a woman as the sole breadwinner, just over 18 per cent to house-holds with a man as the sole breadwinner and just under 27 per cent to cohabitees.
Number
0
25,000
50,000
75,000
100,000
125,000
150,000
175,000
2015201020052001
Single parents
Cohabiting parents
Youth without children

SOCIAL INSURANCE IN FIGURES 2016
51
Regulations 2015
Families with children can receive housing allowance. Childless young people aged 18–28 can also receive housing allowance. The amount of the allowance is deter-mined by the household composition, the housing expenses, the residence size and the applicants’ income. Housing allowance can be paid for at most 12 consecutive months. Applicants must estimate how much they will earn during the calendar year applied for. Preliminary housing allowance is calculated on the basis of this information. Once tax has been assessed for the year, the final allow-ance is established. Decisions concerning
final housing allowance for 2015 will be announced in 2017. Housing allowance for married couples and cohabitees with children is subject to individual means testing. The allowance is reduced if the annual income of each partner exceeds SEK 58,500. The allowance is reduced if the annual income of a single parent exceeds SEK 117,000. The allowance is reduced for a young childless person who lives alone and has an annual income of more than SEK 41,000 and for young childless couples whose combined income is more than SEK 58,000.
Max. housing Max. living Income limit above which allowance allowance, SEK space, is reduced, SEK per year per month sq.m Single Married/cohabiting
Families with children
Number of children living at home
1 3,400 80 117,000 58,500/applicant
2 4,200 100 117,000 58,500/applicant
3 5,200 120 117,000 58,500/applicant
4 5,200 140 117,000 58,500/applicant
5 or more 5,200 160 117,000 58,500/applicant
Households without children
18–28 years 1,300 60 41,000 58,000
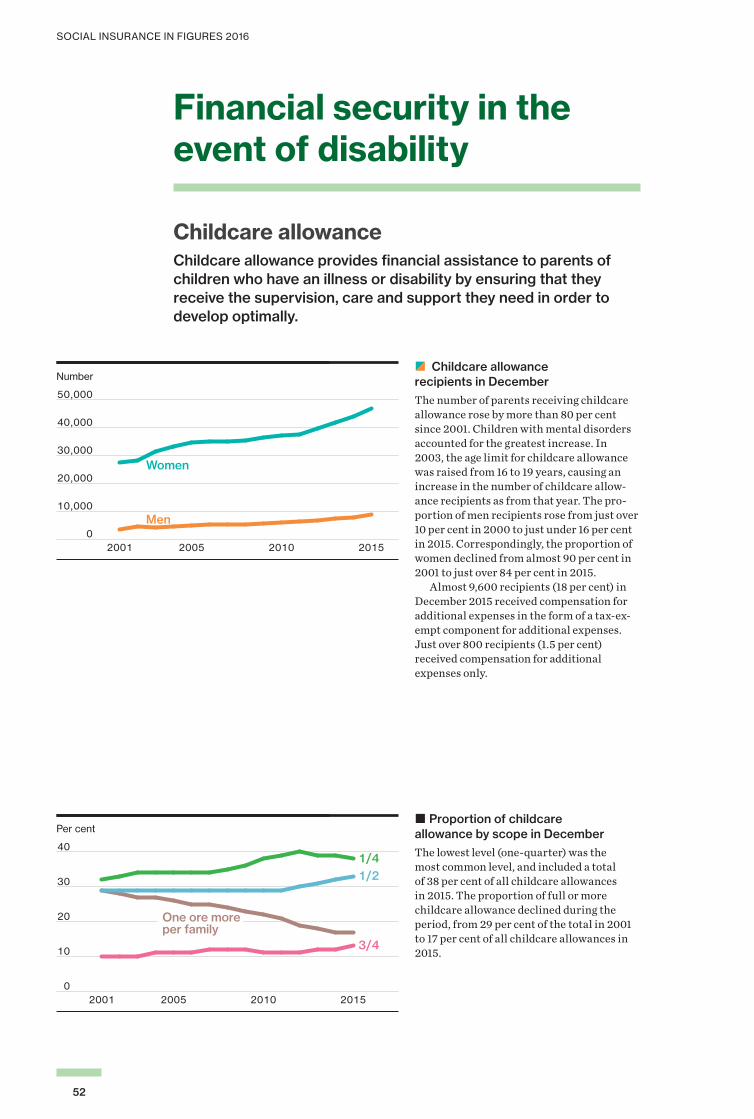
SOCIAL INSURANCE IN FIGURES 2016
52
Financial security in the event of disability
Childcare allowanceChildcare allowance provides financial assistance to parents of children who have an illness or disability by ensuring that they receive the supervision, care and support they need in order to develop optimally.
zy Childcare allowance recipients in DecemberThe number of parents receiving childcare allowance rose by more than 80 per cent since 2001. Children with mental disorders accounted for the greatest increase. In 2003, the age limit for childcare allowance was raised from 16 to 19 years, causing an increase in the number of childcare allow-ance recipients as from that year. The pro-portion of men recipients rose from just over 10 per cent in 2000 to just under 16 per cent in 2015. Correspondingly, the proportion of women declined from almost 90 per cent in 2001 to just over 84 per cent in 2015. Almost 9,600 recipients (18 per cent) in December 2015 received compensation for additional expenses in the form of a tax-ex-empt component for additional expenses. Just over 800 recipients (1.5 per cent) received compensation for additional expenses only.
� Proportion of childcare allowance by scope in DecemberThe lowest level (one-quarter) was the most common level, and included a total of 38 per cent of all childcare allowances in 2015. The proportion of full or more childcare allowance declined during the period, from 29 per cent of the total in 2001 to 17 per cent of all childcare allowances in 2015.
Number
0
10,000
20,000
30,000
40,000
50,000
2015201020052001
Women
Men
Per cent
0
10
20
30
40
2015201020052001
1/41/2
3/4
One ore more per family

SOCIAL INSURANCE IN FIGURES 2016
53
zy Newly granted childcare allowance by type of diagnosisThe number of mental disorders for which new childcare allowances were granted increased in the 2000s. In 2003, such diagnosis accounted for 31 per cent of all
new allowances in the case of girls and 48 per cent in the case of boys. The figures rose to 59 per cent for girls and 71 per cent for boys in 2015.
zy Children whose parents were receiving childcare allowance in December 2015 by age of the child34 per cent of children whose parents were receiving childcare allowance in December 2015 were girls and 66 per cent were boys. Boys predominated at all ages.
0
20
40
60
80
100
1514131211100908070605042003 1514131211100908070605042003
Per centGirls Boys
Endocrine, nutritional and metabolic diseases
Mental disorders
Diseases of thenervous system
Congenital mal-formations etc
Other conditions
Number
0
1,000
2,000
3,000
4,000
18–17161514131211109876543210
Girls
Boys
Age, year

SOCIAL INSURANCE IN FIGURES 2016
54
Number of recipients Average amount, SEK in December Age Women Men Women Men
–24 173 7 5,384 5,298
25–29 1,647 125 4,898 4,737
30–34 5,274 555 4,894 4,286
35–39 10,411 1,475 4,768 4,215
40–44 13,596 2,412 4,658 3,979
45–49 10,001 2,072 4,643 4,022
50–54 4,514 1,273 4,603 4,168
55– 1,218 743 4,810 4,324
Total 46,834 8,662 4,716 4,119
� Childcare allowance in December 2015In total, childcare allowance was paid to just over 55,000 people in December 2015. A total of 84 per cent of the recipients were women and 16 per cent were men. Most of the recipi-ents were in the age group 40–44 years. Just
over 3,000 of the recipients in December 2015 received shared childcare allowance. Approximately SEK 3.2 billion was paid as childcare allowance in 2015, of which 86 per cent to women and 14 per cent to men.
Number of children Percentage of children whose parents received childcare allowance for more than one child Age Girls Boys Girls Boys
0–2 542 793 13 14
3–5 1,916 3,190 19 19
6–8 2,846 5,808 23 21
9–11 3,946 8,576 25 22
12–15 6,620 13,719 25 22
16–19 4,201 7,754 21 21
Total 20,071 39,840 23 21
� Children whose parents were receiving childcare allowance in December 2015In December 2015, childcare allowance was received for almost 60,000 children. The parents of approximately one-fifth of the children were receiving childcare allowance for more than one child. A total of 20 per cent
of the children were aged 16–19, the group made eligible by the amended rules in 2003. Of all the children whose parents were receiving childcare allowance, 34 per cent were girls and 66 per cent were boys.

SOCIAL INSURANCE IN FIGURES 2016
55
Regulations 2015
Parents can receive childcare allowance if their child needs special care or supervision for at least six months. The eligibility lasts until June of the year that the child turns 19. Special care or supervision must be occa-sioned by the child’s illness or disability. A parent can also receive childcare allowance if the illness or disability entails additional expenses. If a parent is caring for more than one child with a disability in the age concerned, the right to childcare allowance is based on their total need for care and supervision and the amount of additional expenses. Childcare allowance can be one-quarter, one-half, three-quarters or the full maxi-mum amount. Full childcare allowance is
2.5 times the price basic amount, which in 2015 corresponded to SEK 9,271 per month. Childcare allowance is taxable and pen-sionable. A certain component of childcare allowance can be paid as compensation for additional expenses. This component for additional expenses is tax-exempt and non-pensionable. Under certain circumstances, compen-sation for additional expenses can be paid above and beyond the normal maximum childcare allowance. Childcare allowance may also be paid for additional expenses only. Depending on the amount of additional expenses, childcare allowance is either 36 per cent or 62.5 per cent of the price basic amount in such cases.

SOCIAL INSURANCE IN FIGURES 2016
56
Disability allowanceDisability allowance provides financial security for those who need the assistance of another person or incur additional expenses due to a disability.
zy People receiving disability allowance in DecemberThe number of people receiving disability allowance rose slightly in the early 2000s and then levelled off. The minimum age for receiving disability allowance was raised from 16 to 19 in 2003. More women than men received disability allowance throughout the period (53 per cent women and 47 per cent men in 2015).
zy Proportion of population receiving disability allowance in December 2015Of the entire population aged 19 or older, just under 1 per cent received disability allow-ance in December 2015. Disability allowance is generally more common among women than men, except in the younger age groups. The exception among younger men is due
to the fact that they are more likely to be granted an allowance for mental disorders associated with a congenital disability. The proportion of people receiving disability allowance is largest in the 60–69 age group.
Number
0
10,000
20,000
30,000
40,000
2015201020052001
Women
Men
Per cent
0.00
0.25
0.50
0.75
1.00
1.25
1.50
90–80–8970–7960–6950–5940–4930–3919–29
Men
Women
Age, year

SOCIAL INSURANCE IN FIGURES 2016
57
zy Disability allowance by compensation level and age in December 2015A total of 64 per cent of women and 62 per cent of men receiving disability allowance had the minimum level of
compensation (36 per cent of the price basic amount). The minimum level was also more common in older age groups.
Number of recipients Average amount, SEK in December Age Woman Men Women Men
19–29 3,066 3,762 1,691 1,701
30–39 3,495 3,819 1,683 1,705
40–49 5,375 5,044 1,699 1,748
50–59 7,184 6,254 1,726 1,742
60–69 8,045 6,537 1,674 1,718
70–79 5,130 3,400 1,615 1,622
80–89 1,694 889 1,565 1,549
90– 262 106 1,482 1,498
Total 34,251 29,811 1,676 1,707
� Disability allowance in December 2015In December 2015, disability allowance was received by just over 64,000 people. 53 per cent of the recipients of disability allowance were women and 47 per cent were
men. In total, approximately SEK 1.4 billion was paid in disability allowance in 2015, of which 53 per cent to women and 47 per cent to men.
Regulations 2015
A person who has been disabled for a considerable time and need the time-con-suming assistance of somebody else in order to manage at home or work can receive disability allowance. Disability allowance is also granted if a person has other significant additional expenses due to a disability. The allowance can be granted as of July of the year that a person turns 19, assuming they had a disability before they turned 65.
Depending on the kind of assistance needed and the additional expenses incurred, the compensation can be 36 per cent, 53 per cent or 69 per cent of the price basic amount per year. Those levels corresponded to SEK 1,335, SEK 1,965 and SEK 2,559 per month in 2015. People with blindness or severe hearing impairment always receive compensation if the disability developed before they turned 65.
0
20
40
60
80
100
80–70–7960–6950–5940–4930–3919–2980–70–7960–6950–5940–4930–3919–29
Per centWomen Men
69 %
53 %
36 %
Age, year
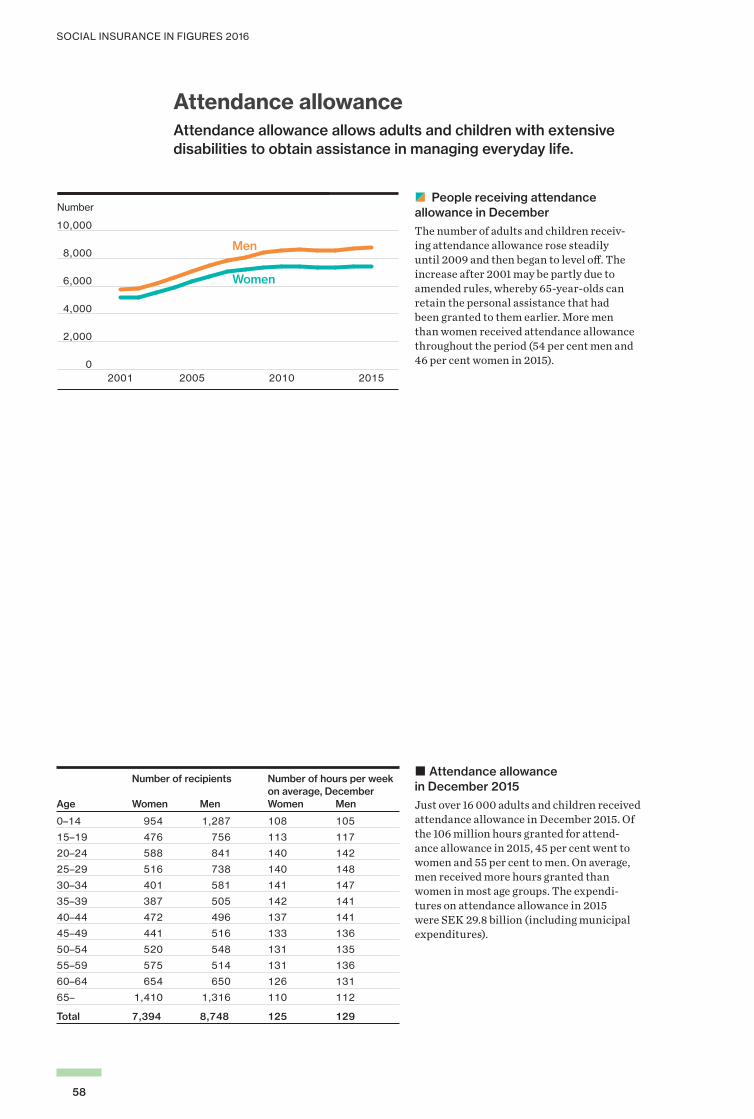
SOCIAL INSURANCE IN FIGURES 2016
58
Attendance allowanceAttendance allowance allows adults and children with extensive disabilities to obtain assistance in managing everyday life.
zy People receiving attendance allowance in DecemberThe number of adults and children receiv-ing attendance allowance rose steadily until 2009 and then began to level off. The increase after 2001 may be partly due to amended rules, whereby 65-year-olds can retain the personal assistance that had been granted to them earlier. More men than women received attendance allowance throughout the period (54 per cent men and 46 per cent women in 2015).
Number of recipients Number of hours per week on average, December Age Women Men Women Men
0–14 954 1,287 108 105
15–19 476 756 113 117
20–24 588 841 140 142
25–29 516 738 140 148
30–34 401 581 141 147
35–39 387 505 142 141
40–44 472 496 137 141
45–49 441 516 133 136
50–54 520 548 131 135
55–59 575 514 131 136
60–64 654 650 126 131
65– 1,410 1,316 110 112
Total 7,394 8,748 125 129
� Attendance allowance in December 2015Just over 16 000 adults and children received attendance allowance in December 2015. Of the 106 million hours granted for attend-ance allowance in 2015, 45 per cent went to women and 55 per cent to men. On average, men received more hours granted than women in most age groups. The expendi-tures on attendance allowance in 2015 were SEK 29.8 billion (including municipal expenditures).
Number
0
2,000
4,000
6,000
8,000
10,000
2015201020052001
Women
Men

SOCIAL INSURANCE IN FIGURES 2016
59
Number of people Number of hours on average Category Women Men Women Men
1 2,932 4,010 129 131
2 337 490 146 154
3 3,920 3,978 121 125
Total 7,394 8,748 125 129
Note that information about category is lacking for some people, and the data does thus not sum up to all. For an explanation of the various categories, please see the regulations box.
� Attendance allowance by category in December 2015The number of people with attendance allowance is largest in category 3, which corresponds to 53 per cent of all women and 45 per cent of all men receiving attendance allowance. The greatest number of hours per week is granted to people in category 2, due to this group having disabilities that on average require more comprehensive need for support and service than people in the other categories.
Regulations 2015
Attendance allowance can be granted to people with development disorders, autism or autism-like conditions (category 1), people with considerable and permanent intellectual disabilities following adult brain injury caused by external impact or a medical condition (category 2), or people with other perma-nent physical or psychological disabilities that are manifestly not due to normal ageing (category 3). To obtain compensation from Försäkringskassan, they must require assistance for more than 20 hours a week in order to meet their basic needs. If the need is for less time, the municipality shall ensure that they obtain the assistance required. People who live at assisted living facilities or are being cared for at an institution are not entitled to attendance allowance.
The attendance allowance may be used only to purchase personal assistance or to pay the costs of personal assistants. Purchase of personal assistance may be made from a municipality, a user coopera-tive or a private company. Users can also employ assistants themselves. User coop-eratives and private companies shall have a permit from the Health and Social Care Inspectorate (IVO) to carry on an operation with personal assistance; a municipality that carries on an operation with personal assis-tance shall have reported this to the IVO. Users employing assistants themselves shall also have reported this to the IVO. Attendance allowance is paid per hour, SEK 284 in 2015. People with special needs may apply for a higher rate. The maximum in 2015 was SEK 318.
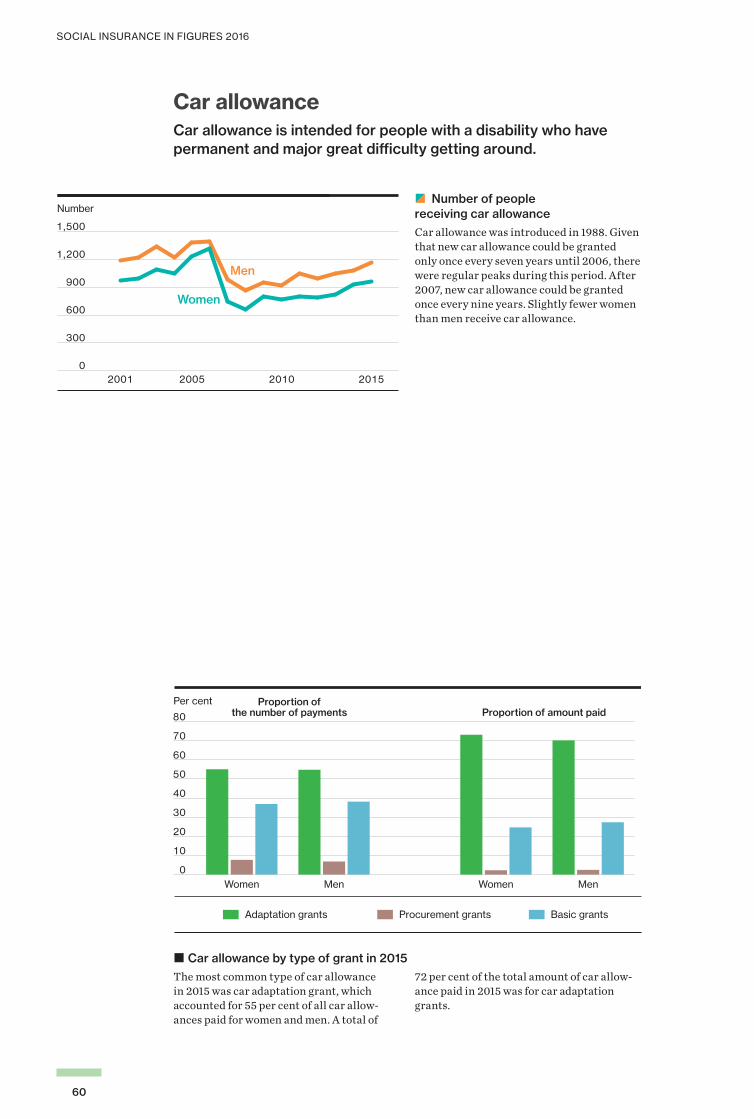
SOCIAL INSURANCE IN FIGURES 2016
60
Car allowanceCar allowance is intended for people with a disability who have permanent and major great difficulty getting around.
zy Number of people receiving car allowanceCar allowance was introduced in 1988. Given that new car allowance could be granted only once every seven years until 2006, there were regular peaks during this period. After 2007, new car allowance could be granted once every nine years. Slightly fewer women than men receive car allowance.
� Car allowance by type of grant in 2015The most common type of car allowance in 2015 was car adaptation grant, which accounted for 55 per cent of all car allow-ances paid for women and men. A total of
72 per cent of the total amount of car allow-ance paid in 2015 was for car adaptation grants.
Per cent
0
10
20
30
40
50
60
70
80
MenWomenMenWomen
Basic grantsAdaptation grants Procurement grants
Proportion ofthe number of payments Proportion of amount paid
Number
0
300
600
900
1,200
1,500
2015201020052001
Women
Men

SOCIAL INSURANCE IN FIGURES 2016
61
Number of recipients Average annual amount, SEK Age Women Men Women Men
0–14 286 343 69,278 76,195
15–19 80 120 89,370 79,728
20–24 94 102 102,415 88,937
25–29 64 84 82,749 71,534
30–34 90 74 52,962 119,254
35–39 87 120 125,594 69,034
40–44 151 185 99,320 110,334
45–49 211 210 80,076 88,094
50–54 145 174 95,780 68,421
55–59 122 126 92,897 58,817
60–64 135 186 104,513 83,784
65– 54 57 67,531 61,165
Total 1,519 1,781 87,196 81,522
� Car allowance in 201546 per cent of the recipients of car allowance were women and 54 per cent were men. Approximately SEK 280 million was paid in
car allowance in 2015, of which 48 per cent to women and 52 per cent to men.
Regulations 2015
People with disabilities that make it very diffi-cult to get around on their own or use public transport can obtain car allowance. The disability must last for at least nine years. Parents of children with disabilities can receive car allowance if they need a vehicle to get around with the child. Car allowance consists of several grants. There are two grants for purchasing a car – a basic grant and an acquisition grant. A basic grant to
purchase a car can be approved once every nine years. The availability of an acquisition grant depends on the person’s income. A car adaptation grant may also be available. Under certain circumstances, car allowance can be granted for driver’s training. While the allowance is intended mostly for cars, it is available for motorcycles, mopeds and other vehicles as well.

SOCIAL INSURANCE IN FIGURES 2016
62
Financial security in the event of illness
Sickness cash benefitSickness cash benefit is intended to provide financial security in the event of reduced working capacity due to illness.
zy Number of sickness cash benefitThe number of sickness cash benefit recip-ients rose rapidly until 2002, including increasing long-term sickness absence. Thereafter, the number of recipients declined up until 2010, and then started to rise again. In total, more than 610,000 people received sickness cash benefit at some stage during 2015, of which 64 per cent were women and 36 per cent men. This corresponds to 10 per cent of all registered insured persons aged between 16 and 64.
zy Proportion of partial sickness cash benefit daysThe proportion of partial sickness cash ben-efit days increased in the early 2000s. One reason may be that the Government made it clear at that point that Försäkringskassan was to use partial sick-listing to a greater extent. The proportion of partial days declined after 2007, but in recent years the proportion has increased again somewhat. Approximately 32 per cent of sickness cash benefit days for women and 25 per cent for men were partial in 2015. The phenom-enon is most common among people with mental disorders.
Number
0
100,000
200,000
300,000
400,000
500,000
600,000
2015201020052001
Women
Men
Per cent
0
10
20
30
40
2015201020052001
Women
Men
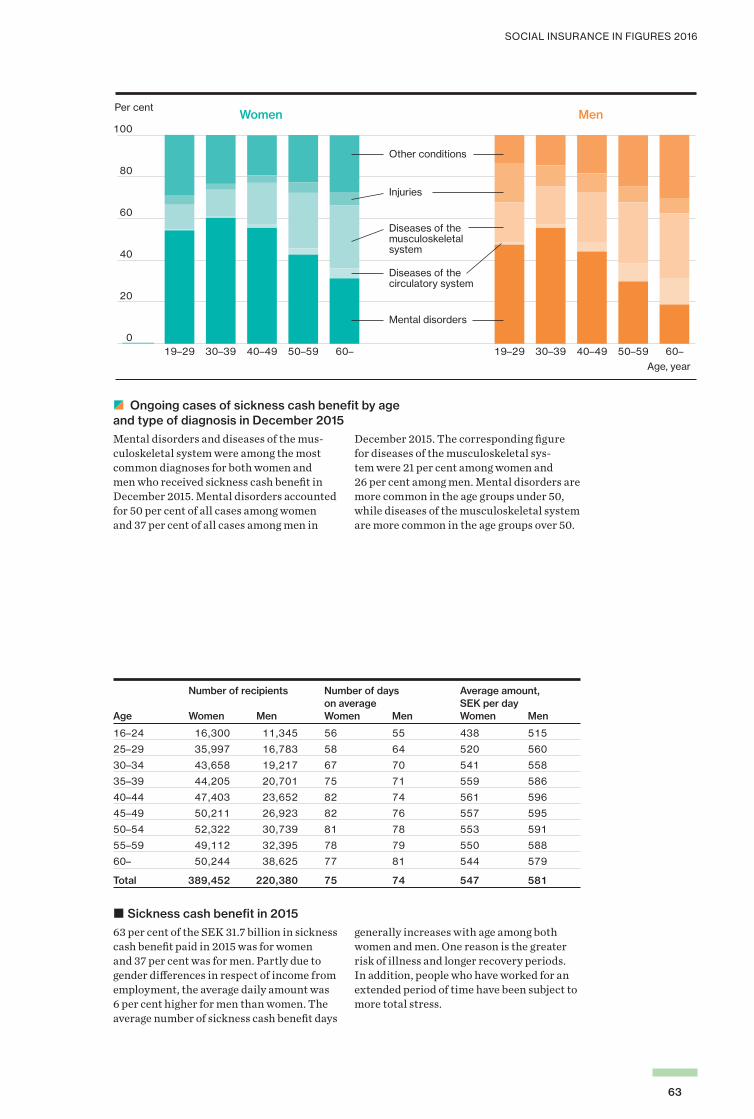
SOCIAL INSURANCE IN FIGURES 2016
63
zy Ongoing cases of sickness cash benefit by age and type of diagnosis in December 2015Mental disorders and diseases of the mus-culoskeletal system were among the most common diagnoses for both women and men who received sickness cash benefit in December 2015. Mental disorders accounted for 50 per cent of all cases among women and 37 per cent of all cases among men in
December 2015. The corresponding figure for diseases of the musculoskeletal sys-tem were 21 per cent among women and 26 per cent among men. Mental disorders are more common in the age groups under 50, while diseases of the musculoskeletal system are more common in the age groups over 50.
Number of recipients Number of days Average amount, on average SEK per day Age Women Men Women Men Women Men
16–24 16,300 11,345 56 55 438 515
25–29 35,997 16,783 58 64 520 560
30–34 43,658 19,217 67 70 541 558
35–39 44,205 20,701 75 71 559 586
40–44 47,403 23,652 82 74 561 596
45–49 50,211 26,923 82 76 557 595
50–54 52,322 30,739 81 78 553 591
55–59 49,112 32,395 78 79 550 588
60– 50,244 38,625 77 81 544 579
Total 389,452 220,380 75 74 547 581
� Sickness cash benefit in 201563 per cent of the SEK 31.7 billion in sickness cash benefit paid in 2015 was for women and 37 per cent was for men. Partly due to gender differences in respect of income from employment, the average daily amount was 6 per cent higher for men than women. The average number of sickness cash benefit days
generally increases with age among both women and men. One reason is the greater risk of illness and longer recovery periods. In addition, people who have worked for an extended period of time have been subject to more total stress.
0
20
40
60
80
100
60–50–5940–4930–3919–2960–50–5940–4930–3919–29
Per centWomen Men
Mental disorders
Diseases of the circulatory system
Diseases of the musculoskeletal system
Injuries
Other conditions
Age, year

SOCIAL INSURANCE IN FIGURES 2016
64
zy Ongoing cases of sickness cash benefit by county in December 2015In Sweden, there were 46 ongoing cases among 16–64 year-old women, and 23 ongo-ing cases among 16–64 year-old men, per 1,000 registered insured persons. A case of sickness cash benefit is defined as a consec-utive period during which sickness and/or rehabilitation cash benefit is paid. Västernorrland County had the most ongoing cases of sickness cash benefit per
1,000 registered insured women and men. Among women, that represented 62 ongoing cases and among men 29 ongoing cases per 1,000 registered insured persons. Some of the regional variation may be due to differences in age distribution or differences in health, living conditions and working conditions.
42.0–46.9
47.0–51.9
52.0–56.9
57.0–61.9
37.0–41.9
21.0–22.9
23.0–24.9
25.0–26.9
27.0–29.0
19.0–20.9
Women Men

SOCIAL INSURANCE IN FIGURES 2016
65
Regulations 2015
A person can receive one-quarter, one-half, three-quarters or full sickness cash benefit based on reduced working capacity due to illness. Sickness cash benefit can also be paid if a person is undergoing medical treat-ment or rehabilitation intended to prevent or shorten illness. An employee receives sick pay from their employer for the first 14 days of an illness, however the first day constituting a waiting period. An employee whose working capac-ity is still reduced after the period of sick pay expires can receive sickness cash benefit from Försäkringskassan. Försäkringskassan pays sickness cash benefit to unemployed people after a one-day waiting period. Self-employed people have a default waiting period of 7 days, but may also choose 1, 14, 30, 60 or 90 days. Just under 80 per cent (the normal level) of sickness cash benefit qualifying income can be paid for 364 days within a period of 450 days. Sickness cash benefit qualifying income may not exceed 7.5 times the price basic amount. In 2015, this corresponded to a maximum compensation of SEK 709 for full sickness cash benefit at the normal level. If working capacity is still reduced after 364 days, sickness cash benefit may be paid for another 550 days at the continuation level. The benefit in such cases is just under 75 per cent of sickness cash benefit qual-ifying income. In 2015, this corresponded to a maximum compensation of SEK 665 per day for full sickness cash benefit at continuation level. Seriously ill people can receive 80 per cent of their sickness cash benefit qualifying income at the normal level for an unlimited period of time. Unemployed people cannot receive more sickness cash
benefit than the maximum daily allowance from unemployment insurance. In 2015, this corresponded to SEK 486 for full sickness cash benefit for the unemployed (SEK 543 from September). Reduction of working capacity is assessed in accordance with the rehabili-tation chain. In the case of employees, the reduction for the first 90 days is assessed in relationship to their regular job. After 90 days, the assessment is also based on whether the person is able to do any kind of job for their employer. They are entitled to sickness cash benefit after 180 days only if they are unable to do any work that the labour market normally has to offer. That rule does not apply, how-ever, if Försäkringskassan concludes that they will most likely be able to work for their employer again within 365 days. In that case, the reduction of their working capacity is assessed in relation to a job with their employer after 180 days as well. If the person is able to do work normally offered by the labour market after 365 days but Försäkringskassan concludes that it is unreasonable to perform an assessment on that basis, it can continue to use their regular job as a yardstick. In the case of self-em-ployed people, an assessment is made in relation to their regular job until 180 days. The subsequent assessment is performed in relation to work normally offered by the labour market unless they are highly likely to be able to return to their regular job within 365 days or such an assessment is regarded as unreasonable. The reduction of work-ing capacity among unemployed people is always assessed in relation to work that is normally offered by the labour market.

SOCIAL INSURANCE IN FIGURES 2016
66
Vocational rehabilitation Various rehabilitation measures make it easier for people with a long-term illness to return to work.
zy Number of cases of sickness or rehabilitation cash benefit 60 days or longer in DecemberPeople who participate in an employability rehabilitation programme usually have a long-term illness. Cases of long-term illness here refer to people who have been receiv-ing sickness and/or rehabilitation cash benefit for 60 days or longer. The number of such cases declined by more than 170,000 between 2002 and 2010. Since 2010, the number of cases of sickness lasting 60 days or more has increased. In 2011, many people who had previously used the maximum number of days began receiving sickness or rehabilitation cash benefit again. In December 2015, there were 101,000 ongoing cases of long-term illness among women and 51,000 among men. Women accounted for approximately 67 per cent of cases of long-term illness (60 days or longer) and men for 33 per cent in December 2015.
Number of recipients Number of days Average amount, on average SEK per day Age Women Men Women Men Women Men
16–24 307 172 126 111 395 465
25–29 991 468 111 124 441 489
30–34 1,785 845 116 133 434 436
35–39 2,230 856 109 124 487 507
40–44 2,880 952 104 121 502 520
45–49 2,980 1,134 105 112 500 525
50–54 2,635 1,190 101 112 493 523
55–59 2,095 1,001 97 111 495 523
60– 1,353 747 80 98 515 544
Total 17,256 7,365 103 116 484 508
� Rehabilitation cash benefit in 201570 per cent of the recipients of rehabilita-tion cash benefit in 2015 were women and 30 per cent were men. Of the SEK 1.3 billion
paid in rehabilitation cash benefit in 2015, 67 per cent went to women and 33 per cent to men.
Number
0
50,000
100,000
150,000
200,000
2015201020052001
Women
Men

SOCIAL INSURANCE IN FIGURES 2016
67
Regulations 2015
Occupational training and education are among the measures that may fall within the framework of vocational rehabilitation. A person who participates in vocational rehabilitation can receive rehabilitation cash benefit if their working capacity has been reduced to the extent that they are unable to work because of the measure. A special ben-efit covering certain additional expenses that may arise in connection with rehabilitation (such as travel) can also be paid. Moreover, Försäkringskassan can subsidise the pur-chase of assistive devices and reimburse travel expenses to and from the job instead of paying sickness cash benefit. Rehabilitation cash benefit can be paid for one-quarter, one-half, three-quarters or
all of the day. Rehabilitation cash bene-fit, which is just under 80 per cent of the sickness cash benefit qualifying income, is included in the 364 days that the person can possibly receive sickness cash benefit at the normal level. In 2015, the maximum daily rehabilitation cash benefit at normal level was SEK 709. The rehabilitation cash benefit that the person can subsequently receive at the continuation level, just under 75 per cent of their sickness cash benefit qualifying income, is included in the 550 days that they can possibly receive sickness cash benefit at the continuation level. In 2015, the maximum daily benefit at continuation level was SEK 665.

SOCIAL INSURANCE IN FIGURES 2016
68
Activity compensation and sickness compensationActivity compensation and sickness compensation provide financial security in case of long-term reduction in work capacity.
zy Newly granted activity compensation (temporary disability pension and early retirement pension before 2003) for people younger than 30Before 2003, people younger than 30 could be granted both new early retirement pen-sion and new temporary disability pension, whereas after that point they could be granted new activity compensation only. New activity compensation was granted to approximately 8,700 people in 2015, which is 2.5 times as many as in 2001. One reason for the increase since 2003 was the greater number of people who received activity com-pensation for extended schooling.
zy Newly granted sickness compensation (temporary disability pension and early retirement pension before 2003) for people 30 years or olderBefore 2003, people who were 30 years or older could be granted both new early retire-ment pension and new temporary disability pension, but as of 2003 people of this age group can be granted sickness compensation only. The opportunity to receive temporary sickness compensation was eliminated in 2008 and the criteria for granting new sickness compensation became stricter. The number of people who were granted new sickness compensation has declined steadily since 2004 but began rising again in 2012, only to fall once more in 2015. In 2015, 11,700 people were granted new sickness compensation.
zy Proportion of partial activity compensation and sickness compensation (temporary disability and early retirement pension before 2003) in DecemberThe proportion of partial activity compen-sation and sickness compensation has varied over time, but has consistently been more common among women than men. A total of 30 per cent of women and 20 per cent of men were receiving partial compensation in December 2015.
Per cent
0
10
20
30
40
2015201020052001
Women
Men
Number
0
1,000
2,000
3,000
4,000
5,000
2015201020052001
Women
Men
Number
0
10000
20,000
30,000
40,000
2015201020052001
Women
Men
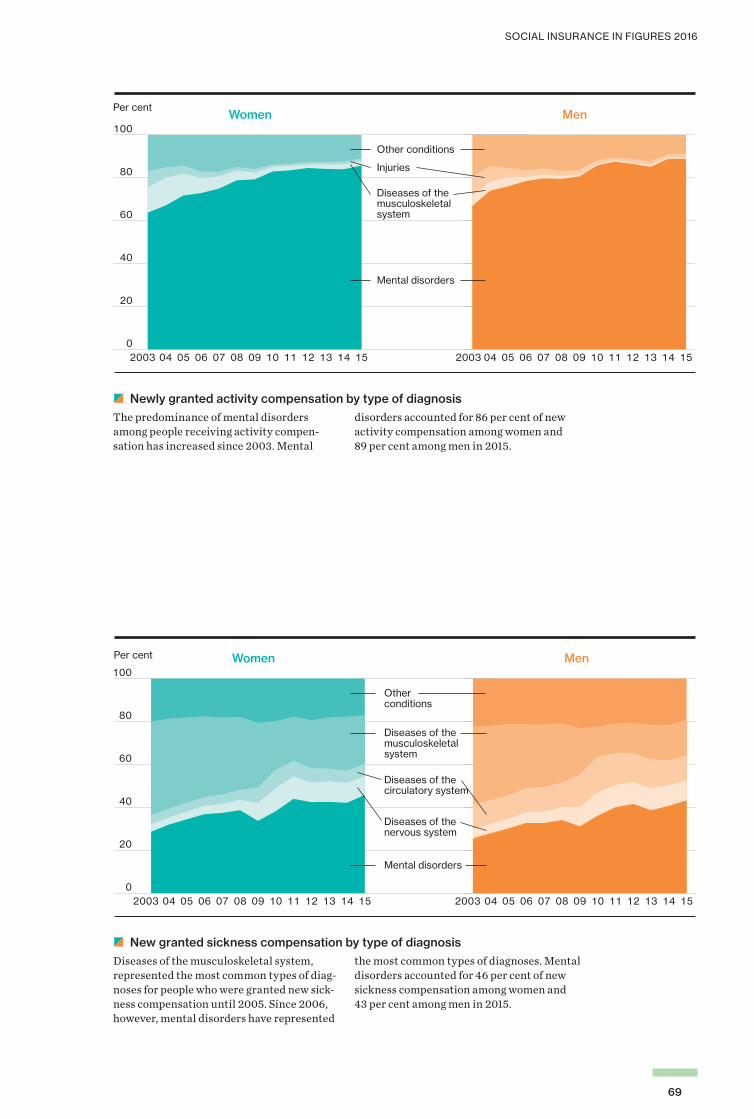
SOCIAL INSURANCE IN FIGURES 2016
69
zy Newly granted activity compensation by type of diagnosisThe predominance of mental disorders among people receiving activity compen-sation has increased since 2003. Mental
disorders accounted for 86 per cent of new activity compensation among women and 89 per cent among men in 2015.
zy New granted sickness compensation by type of diagnosisDiseases of the musculoskeletal system, represented the most common types of diag-noses for people who were granted new sick-ness compensation until 2005. Since 2006, however, mental disorders have represented
the most common types of diagnoses. Mental disorders accounted for 46 per cent of new sickness compensation among women and 43 per cent among men in 2015.
Per centWomen Men
0
20
40
60
80
100
1514131211100908070605042003 1514131211100908070605042003
Mental disorders
Other conditions
Diseases of the musculoskeletal system
Injuries
Per cent Women Men
0
20
40
60
80
100
1514131211100908070605042003 1514131211100908070605042003
Mental disorders
Otherconditions
Diseases of the musculoskeletal system
Diseases of the circulatory system
Diseases of the nervous system

SOCIAL INSURANCE IN FIGURES 2016
70
zy Proportion of the population that was receiving activity compensation or sickness compensation in DecemberApproximately 345,000 people received activity or sickness compensation in December 2015, of which 58 per cent were women and 42 per cent men. Approximately 6 per cent of 19–64 year-olds had left the labour market wholly or in part for health reasons to receive activity or sickness compensation, a figure that rose with
age. The corresponding figure for the age group 60–64 is 22 per cent for women and 14 per cent for men. Young men were more likely to receive compensation than young women, but starting at age 35–39, it was more common for women to receive compensation.
zy Newly granted activity compensation and sickness compensation by age and type of diagnosis in 2015For almost all age groups, mental disor-ders represented the most common type of diagnosis among both women and men in 2015. Activity compensation and sickness
compensation based on mental disorders have been granted most often for people in younger age groups.
0
20
40
60
80
100
60–50–5940–4930–3919–2960–50–5940–4930–3919–29
Per centWomen Men
Mental disorders
Diseases of the circulatory system
Diseases of the musculoskeletal system
Injuries
Other conditions
Age, year
Women Men
Per cent
0
5
10
15
20
25
60–6455–5950–5445–4940–4435–3930–3425–2920–2419
Age, year

SOCIAL INSURANCE IN FIGURES 2016
71
The proportions are standardised – see How to Read the Report for an explanation.
zy Proportion of the population that was receiving activity compensation or sickness compensation by region of birth in December 2015, age-standadisedPartly as a reflection of differences in health, living and working conditions, the propor-tion of the population receiving activity
compensation or sickness compensation varied by region of birth.
Number of recipients Average amount, Percentage of SEK per month population, per cent Age Women Men Women Men Women Men
19 1,193 1,752 7,754 7,765 2.3 3.2
20–24 8,368 9,640 7,732 7,827 2.7 3.0
25–29 8,047 8,599 8,014 8,176 2.5 2.7
Total 17,608 19,991 7,863 7,972 2.6 2.9
� Activity compensation in December 2015Of the SEK 3.2 billion paid in activity com-pensation in 2015, 47 per cent went to women and 53 per cent to men. A total of 47 per cent of the recipients were women and 53 per cent were men. Most of those receiving activity compen-sation have not had the ability to accumulate
additional insurance coverage through gainful employment and are thus receiving guarantee benefit only. A total of 89 per cent of women and 94 per cent of men with activ-ity compensation were receiving guarantee benefit only in December 2015.
0 2 4 6 8 10 12
Oceania
South Amerika
North Amerika
Middle East, North Africa and Turkey
Asia excluding Middle East
Sub-Saharan Africa
Rest of Europe
EU 28 excluding Nordic countries
Nordic countries excluding Sweden
Sweden
Per cent
WomenMen

SOCIAL INSURANCE IN FIGURES 2016
72
Regulations 2015
Activity compensation is granted to 19–29 year-olds whose working capacity has been reduced by at least one-quarter for one year or longer, due to medical reasons. Activity compensation is always time-limited. Activity compensation can be combined with participation in various activities for the purpose of exploiting the young person’s potential for personal and skills develop-ment. Young people who have not yet com-pleted their compulsory or upper secondary school studies due to disability are entitled to full activity compensation for extended schooling. Sickness compensation is granted to 30–64 year-olds whose working capacity has been reduced permanently – i.e. for the foreseeable future.
Activity compensation or sickness compensation can be one-quarter, one-half, three-quarters or all of the maximum amount. There is income-related compensa-tion and guarantee benefit. Income-related compensation is linked to income from employment. People with little or no income from employment receive guarantee benefit. Guarantee benefit for activity compensation varies according to age and other factors. The maximum monthly guarantee benefit for activity compensation in 2015 was SEK 8,715, or 2.35 times the price basic amount. The maximum monthly guarantee benefit for sickness compensation in 2015 was SEK 8,900, or 2.4 times the price basic amount.
Number of recipients Average amount, Percentage of SEK per month population, per cent Age Women Men Women Men Women Men
25–291 160 192 8,835 8,831 0.1 0.1
30–34 5,076 5,650 8,149 8,515 1.8 1.9
35–39 7,140 6,573 8,217 8,800 2.5 2.2
40–44 12,547 9,105 8,286 9,199 4.0 2.8
45–49 21,898 13,806 8,492 9,655 6.8 4.2
50–54 32,804 21,056 8,691 9,933 10.4 6.5
55–59 43,775 28,133 8,825 10,104 15.3 9.7
60–64 60,125 39,406 9,124 10,533 21.6 14.3
Total 183,525 123,921 8,780 9,951 7.6 5.1
1 Recipients of early retirement or temporary disability pension before 2003 were converted to sickness compensation, regardless of age. New sickness compensation has not been granted to people younger than 30 since 2003.
� Sickness compensation in December 2015Of the SEK 35.4 billion paid in sickness compensation in 2015, 57 per cent went to women and 43 per cent to men. 60 per cent of the recipients of sickness compensation were women and 40 per cent were men. Young people were more likely to receive full compensation, while older people were more likely to receive partial compensation. Thus, monthly sickness compensation was
higher among young people. Most older people receiving sickness compensation had, however, accumulated additional insurance coverage through gainful employment and were thus receiving higher income-related compensation. A total of 85 per cent of women and 76 per cent of men were receiving income-related compensation in December 2015.

SOCIAL INSURANCE IN FIGURES 2016
73
Benefit for care of closely related personsThis benefit enables someone to stay home from work in order to take care of a closely related person who is severely ill.
zy Number of recipients of benefit for care of closely related personsThe number of recipients of benefit for the care of closely related persons has increased over the period, in particular since 2008. Since 2008, the number of recipients has increased by 68 per cent. In 2014, the num-ber of recipients was just under 16,000.
Number of recipients Number of days Average amount, on average SEK per year Age Women Men Women Men Women Men
–24 126 65 11 10 8,185 7,651
25–29 352 176 11 14 8,918 11,397
30–34 561 271 12 12 9,997 10,824
35–39 830 403 12 13 9,810 10,824
40–44 1,376 580 12 12 9,578 9,932
45–49 1,904 777 12 12 10,172 10,214
50–54 2,273 732 12 13 9,844 10,649
55–59 2,264 694 13 14 10,380 11,778
60– 1,760 526 15 20 12,118 16,236
Total 11,446 4,224 12 13 10,281 11,365
� Benefit for care of closely related persons 2015Of the SEK 165 million paid as benefit for care of closely related persons in 2015, 71 per cent went to women and 29 per cent to
men. A total of 73 per cent of the recipients were women and 27 per cent were men.
Regulations 2015
Those who forgo gainful employment to take care of a severely ill, closely related person at home or a care facility can receive the benefit. Severely ill refers to a life-threaten-ing condition. The benefit can generally be paid for up to 100 days for each patient.
The benefit can be one-quarter, one-half or all of the maximum amount. The maximum amount is just under 80 per cent of the sick-ness cash benefit qualifying income, based on 7.5 times the price basic amount.
Number
0
2,000
4,000
6,000
8,000
10,000
12,000
2015201020052001
Women
Men

SOCIAL INSURANCE IN FIGURES 2016
74
Housing supplement for people receiving activity compensation or sickness compensationPeople who are receiving activity compensation or sickness compensation and have a low income can obtain a housing supplement to ensure that they have an adequate place to live without lowering their standard of living in other respects.
zy Proportion of population receiving activity compensation or sickness compensation with housing supplement in DecemberThe proportion of people receiving housing supplement has increased over the period 2003 to 2015. A total of 34 per cent of women receiving sickness or activity compensation, and 41 per cent of men, were receiving hous-ing supplement in December 2015.
Number of recipients Percentage of recipients Average amount, of activity compensation SEK per month or sickness compensation who had a housing supplement, per cent Age Women Men Women Men Women Men
19 220 331 18 19 2,527 2,527
20–24 4,367 4,923 52 51 3,249 3,240
25–29 5,446 6,186 66 70 3,428 3,474
30–34 3,341 4,102 66 73 3,449 3,548
35–39 3,880 4,290 54 65 3,247 3,377
40–44 5,450 5,101 43 56 3,072 3,240
45–49 7,804 6,328 36 46 2,904 3,009
50–54 10,849 8,475 33 40 2,887 2,929
55–59 12,479 9,356 29 33 2,902 2,868
60–64 13,626 10,095 23 26 2,845 2,761
Total 67,466 59,191 34 41 3,013 3,082
The table includes recipients of both housing supplement and special housing supplement.
� Housing supplement for people receiving activity compensation or sickness compensation in December 2015A total of 53 per cent of housing supple-ment recipients in 2015 were women
and 46 per cent were men. In 2015, SEK 4.8 billion was paid in housing supplement.
Per cent
0
10
20
30
40
201520102003
Women
Men
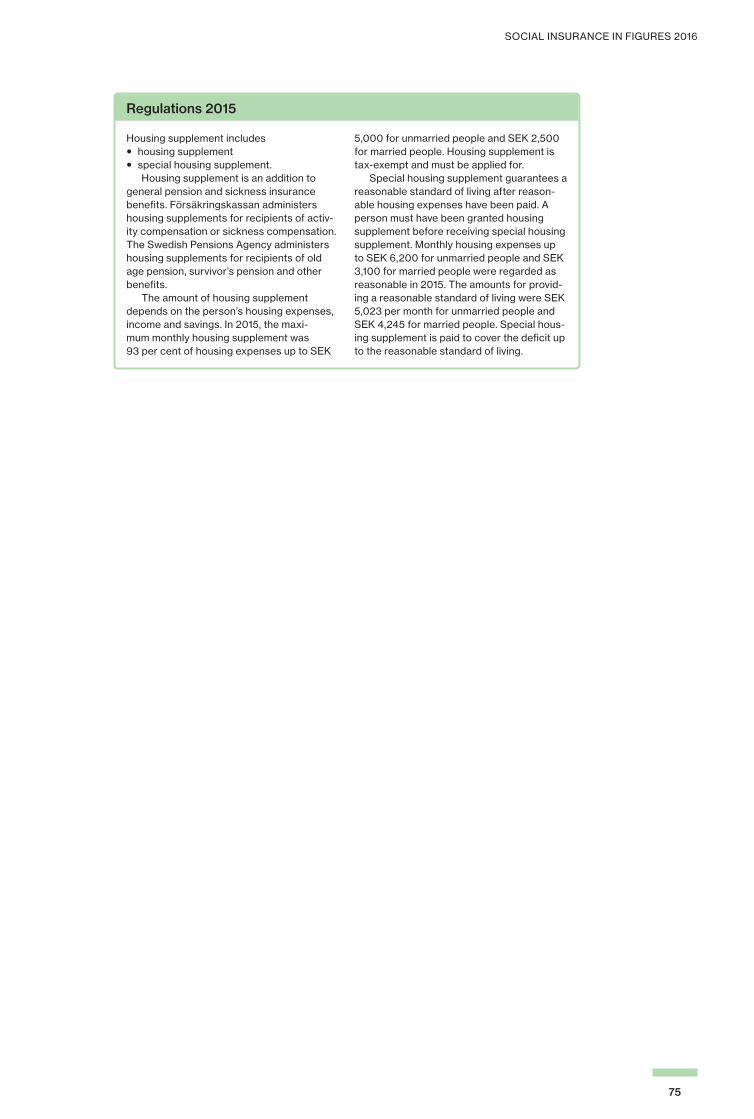
SOCIAL INSURANCE IN FIGURES 2016
75
Regulations 2015
Housing supplement includes •housing supplement• special housing supplement. Housing supplement is an addition to general pension and sickness insurance benefits. Försäkringskassan administers housing supplements for recipients of activ-ity compensation or sickness compensation. The Swedish Pensions Agency administers housing supplements for recipients of old age pension, survivor’s pension and other benefits. The amount of housing supplement depends on the person’s housing expenses, income and savings. In 2015, the maxi-mum monthly housing supplement was 93 per cent of housing expenses up to SEK
5,000 for unmarried people and SEK 2,500 for married people. Housing supplement is tax-exempt and must be applied for. Special housing supplement guarantees a reasonable standard of living after reason-able housing expenses have been paid. A person must have been granted housing supplement before receiving special housing supplement. Monthly housing expenses up to SEK 6,200 for unmarried people and SEK 3,100 for married people were regarded as reasonable in 2015. The amounts for provid-ing a reasonable standard of living were SEK 5,023 per month for unmarried people and SEK 4,245 for married people. Special hous-ing supplement is paid to cover the deficit up to the reasonable standard of living.

SOCIAL INSURANCE IN FIGURES 2016
76
Work injury compensationWork injury compensation provides financial security in cases of reduced working capacity due to work injury.
zy Number of individual life annuities in accordance with work injury insurance in DecemberDue partly to the stricter requirements for approval of a work injury that were adopted in 1993, the number of individual life annuities declined during the period. The adoption of more lenient evidence require-ments in 2002 regarding the assessment of work injury may explain the increase for that year. The assessment of the right to a work injury annuity is often carried out in conjunction with an assessment of the right to sickness compensation. One reason for the reduction in the number of individual annu-ities is therefore that the inflow to sickness compensation also declined between 2005 and 2010. Subsequently, the number of indi-vidual annuities has continued its decline. The reduction between 2005 and 2015 was 45 per cent.
Number of recipients Average amount, SEK per month Age Women Men Women Men
20–24 6 8 7,983 12,177
25–29 21 45 12,813 14,401
30–34 42 105 12,999 11,870
35–39 107 220 10,231 8,894
40–44 320 594 8,186 9,223
45–49 1,043 1,400 7,468 8,009
50–54 1,762 2,773 6,823 7,702
55–59 2,745 3,989 6,451 7,547
60–64 4,734 5,922 6,213 7,669
Total 10,780 15,056 6,633 7,806
� Work injury annuities in December 201542 per cent of the recipients of work injury annuities were women and 58 per cent were men. A total of SEK 3.1 billion in work injury annuities was paid in 2015. Of the amount paid, 38 per cent went to women and 62 per cent to men. Compensation paid to women was on average 15 per cent less than that to men, which corresponds to SEK 1,172 per month.
Number
0
10,000
20,000
30,000
40,000
50,000
2015201020052001
Women
Men
SOCIAL INSURANCE IN FIGURES 2016
77
Regulations 2015
Everyone who is gainfully employed in Sweden is insured against work injury. Work injury is the consequence of acci-dent or harmful impact in the workplace. Försäkringskassan can pay compensation for loss of income, dental care, health care abroad, sickness cash benefit in spe-cial cases and costs of special aids. The Swedish Pensions Agency has administered compensation for survivors and funeral expenses since 1 January 2010. Individual life annuities represent the larg-est compensation paid by work injury insur-ance. A person is eligible for an individual life annuity only if they have an approved work injury that results in a sustained reduction in their ability to earn income from employment. Sick-listing due to a work injury largely works the same way as ordinary sick-listing.
One difference is that sickness cash benefit is not time-limited. A person who has been sick-listed for more than 914 days can apply for additional sickness cash benefit days at the continuation level due to occupational injury. People who have a work injury that manifested itself on 1 January 2003 or later are also compensated for waiting periods when they are granted an individual life annuity. The annuity provides compensation for the entire loss of income. The calculation of the amount of the annuity is based on the difference between the person’s estimated earning potential before and after the injury. The annuity compensates the person for the entire difference, up to a maximum of 7.5 times the price basic amount per year, or SEK 27,812 per month in 2015.

SOCIAL INSURANCE IN FIGURES 2016
78
Other payments
Dental careNational dental care support encourages people to make regular dental appointments and enables them to obtain major dental work as needed.
� Amount paid for dental careExpenditures for dental care insurance increased rapidly after the rules were amended in 2002. The new rules adopted on 1 July 2008 raised subsidies for patients, thereby increasing the expenditures on den-tal care insurance. Since 2010, the expendi-tures on dental care support have been fairly stable, and totalled SEK 5.3 billion in 2015.
Note that the amount of the general dental care allowance is higher in the youngest and oldest age groups; for further information, please see the Regulations box.
zy Proportion of the population that used the general dental care allowance in 2015A total of 51 per cent of people aged 20 or older used the general dental care allowance
in 2015. Women predominated in all age groups up to the age of 74.
Women Men
Per cent
0
10
20
30
40
50
60
70
75–70–7465–6960–6455–5950–5445–4940–4435–3930–3420–29
Age, year
SEK billion
0
1
2
3
4
5
6
2015201020052001
2015 prices
Current prices

SOCIAL INSURANCE IN FIGURES 2016
79
� Dental procedures broken down by category in 2015The most common category of procedures consisted of examinations, risk assess-ments and health promoting procedures (44 per cent for women and 41 per cent for men). The purpose of such procedures is to assess the patient’s oral health and need for dental care procedures. The second most
common category consists of procedures to treat oral disease, followed by repair work. The remaining procedures are to prevent disease (such as fluoride treatment), insert prostheses (crowns, bridges, etc.), perform surgery (tooth extraction, etc.) and the like.
Women Men
44 %
3 %24 %
4 %
3 %
17 %
5 %
41 %
3 %24 %
5 %
3 %
19 %
6 %
Disease-preventive proceduresExamination, risk assessment and health-promoting procedures
Surgical measuresDisease-treatment procedures
Other proceduresProsthetic proceduresReparative procedures
SOCIAL INSURANCE IN FIGURES 2016
80
Number of completed Average amount in SEK, paid compensation periods by Försäkringskassan per completed compensation period Age Women Men Women Men
20–29 20,841 18,912 2,654 2,782
30–34 19,456 17,414 3,034 3,265
35–39 25,188 22,091 3,326 3,479
40–44 31,493 29,331 3,537 3,570
45–49 39,304 36,560 3,751 3,585
50–54 48,191 45,849 3,892 3,927
55–59 55,068 54,375 4,058 4,259
60–64 65,307 65,202 4,052 4,252
65–69 76,831 77,399 4,311 4,541
70–74 66,600 67,780 4,198 4,457
75– 90,715 77,660 4,012 4,324
Total 538,994 512,573 3,910 4,098
Only completed compensation periods under high-cost protection that led to payment are included (i.e. the compensation qualifying amount exceeded SEK 3,000)
� Completed compensation periods under high-cost protection in 2015More than 1 million compensation periods under high-cost protection during which the compensation qualifying amount exceeded SEK 3,000 were completed in 2015. Försäkringskassan paid an average of SEK
3,900 for women and SEK 4,100 for men per completed compensation period. The amount paid varied considerably, however, and a large proportion of the total went to a small number of recipients.

SOCIAL INSURANCE IN FIGURES 2016
81
Regulations 2015
Dental care is free for children up to and including the age of 19. The new dental care support that was adopted on 1 July 2008 for people aged 20 and older consists of three components: general dental care allowance, special dental care allowance and high-cost protection. General dental care allowance, which is intended to encourage regular dental appointments, is to be used primarily for examinations and prevention. The annual allowance is SEK 150 for 30–74 year-olds, as well as SEK 300 for 20–29 year-olds and those aged 75 and older. Special dental care allowance can be used in connection with certain illnesses or disabilities that can lead to poorer oral
health. The special dental care allow-ance, which amounts to SEK 600 every six months, may be applied to preventive procedures only, including check-ups and cleaning. High-cost protection ensures that patients do not have to pay the entire cost of major dental work. High-cost protection is subject to a compensation period of up to 12 months. If a patient’s cost during a compen-sation period does not exceed SEK 3,000, no compensation is payable from the high-cost protection. Försäkringskassan pays 50 per cent of the cost between SEK 3,000 and SEK 15,000. If the cost exceeds SEK 15,000, Försäkringskassan pays 85 per cent of the excess amount.

SOCIAL INSURANCE IN FIGURES 2016
82
Activity grants and development allowanceActivity grants and development allowance are paid to unemployed people who participate in labour market programmes.
zy Number of recipients of activity grants or development allowanceActivity grants and development allowance are decided on and paid by Försäkringskassan, but the liability for the cost lies with Arbetsförmedlingen (Sweden’s Public Employment Agency). Just over 296,000 people received development allow-ance or an activity grant in 2015, of which slightly more men than women.
Number of recipients Number of days Average amount, on average SEK per day Age Women Men Women Men Women Men
16–241 29,864 45,559 104 105 214 222
of which isdevelopment allowance 22,289 34,051 100 100 133 135
activity grants 9,306 14,133 95 97 418 438
25–29 14,919 20,348 105 110 325 360
30–34 12,449 14,266 102 111 343 378
35–39 12,476 12,456 110 119 384 424
40–44 14,277 12,139 119 125 417 457
45–49 14,893 12,835 126 131 449 489
50–54 14,217 13,949 135 138 470 525
55–59 12,351 13,660 144 148 498 548
60– 11,167 13,049 145 148 530 575
Total 136,613 158,261 119 121 391 409
1 For the 16–24 age group, the sum of those receiving development allowances or an activity grant does not equal the total. The reason is that a particular person may have received both development allowance and an activity grant during the year. The total for the 16–24 age group includes the number of unique individuals who received one of the two types of compensation during the year.
� Number of recipients of activity grants or development allowance in 201546 per cent of the recipients of an activity grant or development allowance were women and 54 per cent were men. SEK 14.2 billion
was paid in activity grants and development allowance in 2015, of which 45 per cent to women and 55 per cent to men.
Number
0
50,000
100,000
150,000
200,000
2015201020052001
WomenMen

SOCIAL INSURANCE IN FIGURES 2016
83
Regulations 2015
Development allowance and activity grants may be paid to unemployed people who participate in labour market programmes through Arbetsförmedlingen. Among the programmes are the job and development programme, work experience and support to start a business. Participants who met the requirements for unemployment compensa-tion received a daily activity grant of at most SEK 910 (SEK 760 after the first 100 days) and at least SEK 365 in 2015 for full-time programmes. Participants age 25 and older who did not meet the requirements for unem-ployment compensation received a daily
activity grant at the guarantee level of SEK 223 in 2015 for full-time programmes. Participants age 18–24 generally received development allowance instead of an activity grant at the guarantee level if they did not meet the requirements for unemployment compensation. Daily development allowance was either SEK 48 or SEK 142 in 2015. The lower amount, which is for people without an upper secondary school certificate, is paid until 30 June the year that the participant turns 20. As opposed to an activity grant, development allowance is tax-exempt.
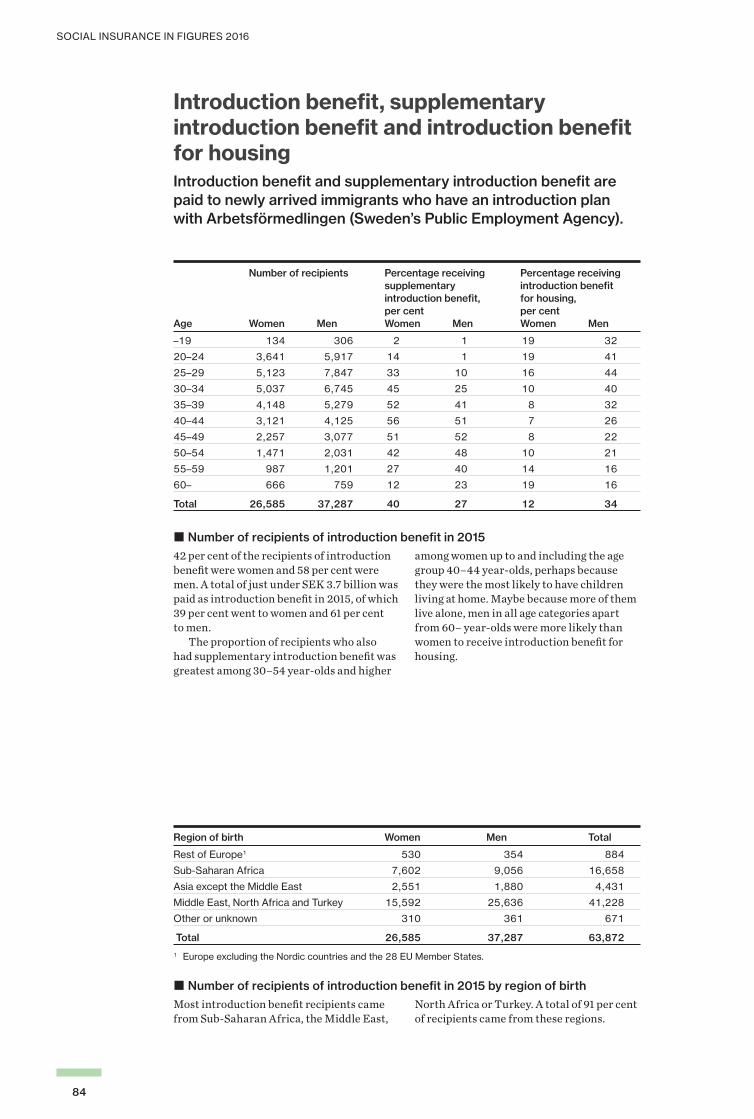
SOCIAL INSURANCE IN FIGURES 2016
84
Introduction benefit, supplementary introduction benefit and introduction benefit for housingIntroduction benefit and supplementary introduction benefit are paid to newly arrived immigrants who have an introduction plan with Arbetsförmedlingen (Sweden’s Public Employment Agency).
Number of recipients Percentage receiving Percentage receiving supplementary introduction benefit introduction benefit, for housing, per cent per cent Age Women Men Women Men Women Men
–19 134 306 2 1 19 32
20–24 3,641 5,917 14 1 19 41
25–29 5,123 7,847 33 10 16 44
30–34 5,037 6,745 45 25 10 40
35–39 4,148 5,279 52 41 8 32
40–44 3,121 4,125 56 51 7 26
45–49 2,257 3,077 51 52 8 22
50–54 1,471 2,031 42 48 10 21
55–59 987 1,201 27 40 14 16
60– 666 759 12 23 19 16
Total 26,585 37,287 40 27 12 34
� Number of recipients of introduction benefit in 201542 per cent of the recipients of introduction benefit were women and 58 per cent were men. A total of just under SEK 3.7 billion was paid as introduction benefit in 2015, of which 39 per cent went to women and 61 per cent to men. The proportion of recipients who also had supplementary introduction benefit was greatest among 30–54 year-olds and higher
among women up to and including the age group 40–44 year-olds, perhaps because they were the most likely to have children living at home. Maybe because more of them live alone, men in all age categories apart from 60– year-olds were more likely than women to receive introduction benefit for housing.
Region of birth Women Men Total
Rest of Europe1 530 354 884
Sub-Saharan Africa 7,602 9,056 16,658
Asia except the Middle East 2,551 1,880 4,431
Middle East, North Africa and Turkey 15,592 25,636 41,228
Other or unknown 310 361 671
Total 26,585 37,287 63,872
1 Europe excluding the Nordic countries and the 28 EU Member States.
� Number of recipients of introduction benefit in 2015 by region of birthMost introduction benefit recipients came from Sub-Saharan Africa, the Middle East,
North Africa or Turkey. A total of 91 per cent of recipients came from these regions.

SOCIAL INSURANCE IN FIGURES 2016
85
Regulations 2015
Newly arrived immigrants aged 20–64 who have been granted residence permits as refugees or quota refugees, as well as members of their families, can receive intro-duction benefit. Newly arrived immigrants aged 18–20 can also receive introduction benefit provided that their parents are not in Sweden. Introduction benefit is granted by Arbetsförmedlingen and paid by Försäkringskassan. The benefit amounts to SEK 308 per working day provided the per-son has an introduction plan and participates full-time. The benefit can be paid for up to two years. A person who is receiving introduction benefit can also apply for supplemen-tary introduction benefit or introduction
benefit for housing. Försäkringskassan processes and approves these applications. Supplementary introduction benefit can be paid to people with children up to age 20 who are living at home. The monthly benefit is SEK 800 per child younger than 11 and SEK 1,500 per child aged 11–20, provided the person participates in activities full-time. The maximum monthly supplementary introduction benefit is SEK 4,500. The sup-plementary introduction benefit is paid per household. A recipient of introduction benefit who lives alone can receive introduction benefit for housing. The maximum monthly introduction benefit for housing is SEK 3,900 provided the person participates in activities full-time.

Social Insurance in F
igures 2016
Social Insurance in Figures 2016
Social Insurance in Figures 2016Social insurance is an integral part of the lives of most people. It is of great importance, not just for peoples’ security and well-being, but also for the country’s economy. In 2015, the expenditure on the allow-ances and benefits administered by Försäkringskassan amounted to a total of SEK 225 billion, which corresponds to 5 per cent of Sweden’s gross domestic product (GDP).
Each year, Försäkringskassan publishes the report Social Insurance in Figures, which uses statistics and comments to present a number of allowances and benefits within the framework for the social insur-ance administered and paid by Försäkringskassan. These allowances and benefits are presented in tables, charts and diagrams based on the areas scope and financing of social insurance; registered insured persons; financial security for families and children; financial security in the event of disability; financial security in the event of illness; and other payments. Social Insurance in Figures 2016 also includes a thematic chapter about work injury insurance, which celebrates its centenary in 2016.
FK 141 ISBN 978-91-7500-393-1

Table of contents
Social Insurance in Figures 2016
Thematic chapter -100 years of Work Injury Insurance PageReported work injuries per 1,000 gainfully employed persons 1980-2014, employees and self- employed persons 12;1Work injury insurance expenditures excluding administration 2007-2015 14;1Individual life annuities in December 1986-2015 16;1Approval decisions on individual life annuities by injury type 2005-2015 18;1Approval decisions on individual life annuities by diagnosis group 2005-2015 19;1Annuitants in December 2015 by age and legislation 21;1Proportion of annuitants who were receiving compensation from sickness insurance at the first time they were granted an individual life annuity 22;1The occupational distribution between working annuitants and the total working population age 18-64, in Januari 2014 23;1Annuitants per 1,000 registered insured individuals in Sweden 16-64 years, in December 2015, by region 24;1
Financial Scope of Social InsuranceSocial insurance expenditures (excluding administration) adjusted to the CPI for 2015 26;1Social insurance expenditures (excluding administration) as a proportion of GDP 26;2Breakdown of expenditures 2015 (SEK million) 28;1Expenditure areas as a proportion of GDP 28;2Public transfers as a proportion of GDP in 2013 in Sweden and other European countries 29;1
Registered insured personsRegistered insured persons in December 2015 by age group 32;1
Financial security for families and childrenParental benefit days 34;1Avarege number of parental benefit days at various ages for children born in 2007 34;2Proportion of days of parental benefit taken by men per county in 2015 35;1Proportion of recipients of parental benefit at the basic level only in 2015 35;2Number of children for whom a parent took double days in 2015 37;1Temporary parental benefit days for care of children 40;1Average number of temporary parental benefit days for care of children 2015 40;2Temporary parental benefit in connection with birth or adoption 42;1Temporary parental benefit for contact days 43;1Pregnancy benefit 45;1Number of children by age in 2015 46;1Children with maintenance support 48;1Number of households receiving housing allowance in December 50;1
1
The diagram statistics are also available as an Excel file. Click on the paperclip symbol at the left margin of the screen and open
the file from there, or go via View/Navigation Panels/Attachments.

Table of contents
Financial security in the event of disabilityChildcare allowance recipients in December 52;1Proportion of childcare allowance by scope in December 52;2Newly granted childcare allowances by type of diagnosis 53;1Children whose parents were receiving childcare allowance in December 2015 by age of the child 53;2People receiving disability allowance in December 56;1Proportion of population receiving disability allowance in December 2015 56;2Disability allowance by compensation level and age in December 2015 57;1People receiving attendance allowance in December 58;1Number of people receiving car allowance 60;1Car allowance by type of grant in 2015 60;2
Financial security in the event of illnessNumber of sickness cash benefit recipients 62;1Proportion of partial sickness cash benefit days 62;2Ongoing cases of sickness cash benefit by age and type of diagnosis in December 2015 63;1Ongoing cases of sickness cash benefit by county in December 2015 64;1Number of cases of sickness or rehabilitation cash benefit 60 days or longer in December 66;1Newly granted activity compensation (temporary disability pension and early retirement pension before 2003) for people younger than 30 68;1Newly granted sickness compensation (temporary disability pension and early retirement pension before 2003) for people 30 years or older 68;2Proportion of partial activity compensation and sickness compensation (temporary disability pension and early retirement pension before 2003) in December 68;3Newly granted activity compensation by type of diagnosis 69;1Newly granted sickness compensation by type of diagnosis 69;2Newly granted activity compensation and sickness compensation by age and type of diagnosis in 2015 70;1Proportion of the population that was receiving activity compensation or sickness compensation in December 2015 70;2Proportion of the population that was receiving sickness compensation or activity compensation by region of birth in December 2015, age-standardised 71;1Number of recipients of benefit for care of closely related persons 73;1Proportion of population receiving activity compensation or sickness compensation with housing supplement in December 74;1Number of individual life annuities in accordance with work injury insurance in December 76;1
Other paymentsAmount paid for dental care 78;1Proportion of the population that used the general dental care allowance in 2015 78;2Dental procedures broken down by category in 2015 79;1Number of recipients of activity grants or development allowance 82;1
2
The diagram statistics are also available as an Excel file. Click on the paperclip symbol at the left margin of the screen and open
the file from there, or go via View/Navigation Panels/Attachments.

12;1
Reported work injuries per 1,000 gainfully employed persons 1980-2014, employees and self- employed persons
Women Men
Year
Work accidents with absence
Work accidents without absence
Work-related diseases
Commuting accidents
Year
Work accidents with absence
Work accidents without absence
Work-related diseases
Commuting accidents
1980 11,3 4,7 4,4 4,6 1980 39,3 5,2 6 2,51981 10,4 4,8 3,9 4,7 1981 36,2 5,4 5,7 2,71982 11,3 5,8 3,8 4,4 1982 35,4 6,4 5,8 2,61983 11,0 6 4,5 4,4 1983 35,3 6,7 6,1 2,61984 11,8 7 5,6 4,6 1984 35,7 7,2 7,6 2,71985 12,0 7,3 5,8 5 1985 34,6 7,4 8,9 31986 12,6 7,4 7 4,7 1986 34,7 7,1 10 2,71987 13,0 9,5 9,8 5,3 1987 34,1 8,4 11,6 31988 13,1 9,5 13 6 1988 33,6 7,9 13,3 3,11989 12,3 9 13 4,9 1989 31,5 7,5 12,1 2,71990 11,2 9,6 11,9 4,7 1990 27,8 8 10,7 2,41991 8,9 8,9 9,2 4,5 1991 21,3 7,4 9,1 2,31992 7,2 10,7 7,6 4 1992 14,7 9 8,7 1,91993 6,3 11,8 17,6 4,6 1993 12,3 10,1 16,6 21994 6,3 12,8 4,6 4,4 1994 11,2 10 4 1,91995 5,8 13,8 4,2 4,6 1995 9,8 11,7 3,2 1,91996 6,0 12,9 3,7 4,1 1996 9,4 10,4 2,8 1,61997 5,8 13,3 3,8 3,9 1997 8,5 10,2 2,8 1,61998 6,5 14,6 5,1 4,1 1998 9,2 10,6 3,4 1,71999 6,7 14,2 5,9 4,3 1999 9,6 10,2 3,8 1,82000 6,9 13,1 6,8 3,4 2000 9,8 9,3 4,6 1,52001 6,2 11,7 7,4 3,7 2001 9,5 8,6 5,1 1,72002 6,8 13,6 6,1 4,2 2002 10,0 10 4,4 2,12003 6,7 13,5 7 4 2003 9,5 10,1 5,1 22004 6,5 14,1 5,7 4,4 2004 8,9 9,7 4,2 22005 6,3 14 4,6 4,3 2005 8,5 9,5 3,4 1,92006 6,4 13,9 3,8 4 2006 8,3 9 2,8 1,72007 5,6 13,7 3 3,7 2007 7,6 9,1 2,2 1,72008 5,3 13,9 2,6 3,8 2008 7,2 9,1 2 1,72009 5,3 14,3 2,3 3,7 2009 6,4 8,7 1,7 1,52010 5,7 14,6 2,4 4,5 2010 7,0 9,3 1,7 1,82011 5,5 14,6 2,5 4,6 2011 7,1 9,7 1,7 1,92012 5,8 15,6 2,7 3,9 2012 7,5 10,8 1,8 1,72013 6,0 15,8 3 3,5 2013 7,4 11,1 1,9 1,52014 6,0 16,0* 3,2 3 2014 7,3 11,2* 1,9 1,4
*The data on the reported work accidents resulting in absence in 2014 is still preliminary and is expected to rise by about 4 per cent.Source: Occupational Injuries 2014, Statistical Report 2015:1, Swedish Work Environment Authority
3
The diagram statistics are also available as an Excel file. Click on the paperclip symbol at the left margin of the screen and open
the file from there, or go via View/Navigation Panels/Attachments.

14;1
Work injury insurance expenditures excluding administration 2007-2015
Year
Annuities under current legislation
Annuities under older legislation
Other forms of compensation
Total expenditure
2007 4,55 0,58 0,20 5,322008 4,17 0,55 0,18 4,912009 4,00 0,53 0,17 4,702010 3,56 0,49 0,16 4,212011 3,30 0,46 0,14 3,902012 3,14 0,43 0,15 3,722013 3,02 0,40 0,14 3,572014 2,82 0,38 0,14 3,332015 2,64 0,34 0,13 3,11
4
The diagram statistics are also available as an Excel file. Click on the paperclip symbol at the left margin of the screen and open
the file from there, or go via View/Navigation Panels/Attachments.

16;1
Individual life annuities in December 1986-2015
Women Men
Year
Annuities under the Occupational Injury Insurance Act
Annuities under current legislation
Year
Annuities under the Occupational Injury Insurance Act
Annuities under current legislation
1986 9 097 4 245 1986 81 194 9 3171987 8 970 7 796 1987 81 347 13 7521988 8 837 14 474 1988 81 681 20 5571989 8 661 22 706 1989 81 415 28 2271990 8 471 28 162 1990 81 281 29 3021991 8 288 35 384 1991 81 178 35 2321992 8 119 41 443 1992 80 163 40 7731993 7 865 47 497 1993 78 244 46 8891994 7 639 49 423 1994 76 228 49 6561995 7 384 49 226 1995 73 840 50 0141996 7 099 48 896 1996 70 868 50 2291997 6 841 47 927 1997 68 132 49 4501998 6 584 46 928 1998 65 221 48 8041999 6 300 44 612 1999 62 009 46 3812000 6 072 43 854 2000 59 436 45 9372001 5 819 43 268 2001 56 679 45 4792002 5 758 42 170 2002 53 984 44 8972003 5 363 43 132 2003 51 375 45 2002004 5 114 41 686 2004 48 859 44 1452005 4 871 40 146 2005 46 254 42 8632006 4 635 37 690 2006 43 671 41 1342007 4 405 35 440 2007 41 239 39 2602008 4 158 32 631 2008 38 811 36 1052009 3 918 30 202 2009 36 445 33 3532010 3 713 27 630 2010 34 191 30 3952011 3 517 25 015 2011 31 964 27 4502012 3 301 22 816 2012 29 807 24 9172013 3 124 20 883 2013 27 684 22 9062014 2 961 19 144 2014 25 745 21 1102015 2 783 17 501 2015 23 870 19 449
5
The diagram statistics are also available as an Excel file. Click on the paperclip symbol at the left margin of the screen and open
the file from there, or go via View/Navigation Panels/Attachments.

18;1
Approval decisions on individual life annuities by injury type 2005-2015
Women
YearWork-related diseases
Work accidents Commuting
accidents
2005 1 281 847 7942006 1 039 775 6922007 902 693 6812008 389 405 3972009 364 377 3812010 205 311 2792011 144 203 1762012 128 162 1482013 173 156 1472014 190 165 1432015 182 160 101
Women
YearWork-related diseases
Work accidents Commuting
accidents
2005 2 123 1 694 5052006 1 699 1 515 4782007 1 708 1 524 5052008 742 822 2622009 658 933 2682010 409 682 2182011 346 476 1412012 296 438 1122013 320 489 1172014 328 450 1022015 330 362 88
6
The diagram statistics are also available as an Excel file. Click on the paperclip symbol at the left margin of the screen and open
the file from there, or go via View/Navigation Panels/Attachments.

19;1
Approval decisions on individual life annuities by diagnosis group 2005-2015
Women
YearMental disorders
Diseases of the musculo-skeletal system
InjuriesOther diseases
2005 172 1 555 870 3432007 194 897 725 4602009 108 374 406 2342011 70 202 211 402013 78 186 165 472015 115 147 125 56
Men
YearMental disorders
Diseases of the musculo-skeletal system
InjuriesOther diseases
2005 167 2 297 1 146 7322007 169 1 619 1 026 9242009 109 667 591 4922011 69 352 394 1482013 63 369 348 1462015 80 308 261 131
7
The diagram statistics are also available as an Excel file. Click on the paperclip symbol at the left margin of the screen and open
the file from there, or go via View/Navigation Panels/Attachments.

21;1
Annuitants in December 2015 by age and legislation
Former legislation*Age Women Men-44 0 045-49 0 050-54 .. ..55-59 140 35260-64 317 1 22965-69 402 2 66770-74 411 4 05875-79 416 4 81780-84 410 4 51785-89 352 3 74190- 325 1 984
Currant legislationAge Women Men
-44 496 97245-49 1 043 1 40050-54 1 762 2 77355-59 2 745 3 98960-64 4 734 5 91165-74 3 1175-79 936 92480-84 2 725 1 92785-89 2 559 1 25790- 432 168
*Occupational Injury Injurance Act..Cells containing small numbers have been surpressed due to risk of disclosure.
8
The diagram statistics are also available as an Excel file. Click on the paperclip symbol at the left margin of the screen and open
the file from there, or go via View/Navigation Panels/Attachments.

22;1
Proportion of annuitants who were receiving compensation from sickness insurance at the first time they were granted an individual life annuity
Women
Year
Per cent with activity- or sickness compensation
Per cent with sickness cash benefit
2005 59 352006 69 252007 75 202008 78 142009 83 82010 79 72011 57 142012 39 252013 34 302014 34 352015 32 34
Men
Year
Per cent with activity- or sickness compensation
Per cent with sickness cash benefit
2005 45 402006 54 292007 56 282008 66 182009 67 132010 62 122011 44 162012 28 222013 24 322014 22 352015 23 35
9
The diagram statistics are also available as an Excel file. Click on the paperclip symbol at the left margin of the screen and open
the file from there, or go via View/Navigation Panels/Attachments.

23;1
The occupational distribution between working annuitantsand the total working population age 18-64, in January 2014
Women
Occupational category
Per cent among working annuitants
Per cent among working population
Managers 1 4Occupations requiring advanced level of higher education 9 20Occupations requiring higher education qualifications or equivalent 15 22Administration and customer service clerks 17 10Service, care and shop sales workers 35 32Agricultural, horticultural, forestry and fishery workers 2 1Building and manufacturing workers 2 1Mechanical manufacturing and transport workers, etc 7 3Work without the requirement of special vocational training 12 7
Men
Occupational category
Per cent among working annuitants
Per cent among working population
Managers 2 8Occupations requiring advanced level of higher education 6 17Occupations requiring higher education qualifications or equivalent 12 18Administration and customer service clerks 7 5Service, care and shop sales workers 11 11Agricultural, horticultural, forestry and fishery workers 5 2Building and manufacturing workers 28 17Mechanical manufacturing and transport workers, etc 17 15Work without the requirement of special vocational training 11 6
10
The diagram statistics are also available as an Excel file. Click on the paperclip symbol at the left margin of the screen and open
the file from there, or go via View/Navigation Panels/Attachments.

24;1
Annuitants per 1,000 registered insured individuals in Sweden 16-64 years, in December 2015, by region
Counties Women Men01 Stockholms län 1,0 1,703 Uppsala län 2,3 3,704 Södermanlands län 3,7 4,005 Östergötlands län 3,7 3,506 Jönköpings län 4,8 4,207 Kronobergs län 2,2 3,108 Kalmar län 2,5 4,509 Gotlands län 2,2 4,510 Blekinge län 3,4 4,112 Skåne län 2,5 4,013 Hallands län 2,7 4,514 Västra Götalands län 2,9 3,717 Värmlands län 4,9 7,418 Örebro län 2,0 3,119 Västmanlands län 3,8 3,820 Dalarnas län 4,9 7,521 Gävleborgs län 3,3 5,422 Västernorrlands län 3,7 5,923 Jämtlands län 4,2 6,124 Västerbottens län 4,5 7,425 Norrbottens län 3,8 8,0
11
The diagram statistics are also available as an Excel file. Click on the paperclip symbol at the left margin of the screen and open
the file from there, or go via View/Navigation Panels/Attachments.

26;1
Social insurance expenditures (excluding administration) adjusted to the CPI for 2015
Year SEK billions
1980 1491981 1441982 1421983 1431984 1411985 1611986 1671987 1791988 1981989 2071990 2141991 2161992 2101993 1951994 1921995 1871996 1711997 1641998 1551999 1802000 1922001 2052002 2122003 2202004 2252005 2292006 2322007 2182008 2112009 2152010 2112011 2032012 2052013 2122014 2182015 225
12
The diagram statistics are also available as an Excel file. Click on the paperclip symbol at the left margin of the screen and open
the file from there, or go via View/Navigation Panels/Attachments.

26;2
Social insurance expenditures (excluding administration) as a proportion of GDP
Year Per cent of GDP
1980 8,81981 8,71982 8,51983 8,31984 7,91985 8,91986 8,71987 9,01988 9,71989 9,71990 9,81991 10,11992 10,11993 9,61994 9,11995 8,41996 7,51997 7,01998 6,31999 6,92000 7,02001 7,42002 7,52003 7,72004 7,52005 7,42006 7,12007 6,52008 6,32009 6,62010 6,12011 5,82012 5,82013 5,92014 5,62015 5,4
13
The diagram statistics are also available as an Excel file. Click on the paperclip symbol at the left margin of the screen and open
the file from there, or go via View/Navigation Panels/Attachments.

28;1
Breakdown of expenditures 2015 (SEK million)
Insurance SEK millionParental insurance 38 627Child allowance 25 764Maintenance support 3 492Other payments to families 8 503Sickness insurance 36 635Activity-/ sickness compensation 45 717Housing allowance 4 832Work injury compensation 3 397Attendance allowance 29 784Other sickness/disability 10 134Other payments 17 866Administration 8 293
Distribution between expenditure areas Per centFamilies and children 32,8Sickness and disability 56,0Other payments 7,7Administration 3,6
14
The diagram statistics are also available as an Excel file. Click on the paperclip symbol at the left margin of the screen and open
the file from there, or go via View/Navigation Panels/Attachments.

28;2
Expenditure areas as a proportion of GDP
Procent av BNPYear Families and
childrenSickness and
disabilityOther
paymentsTotal
1980 1,9 6,3 0,6 8,81981 2,0 6,2 0,5 8,71982 1,9 6,1 0,5 8,51983 1,8 6,0 0,5 8,31984 1,7 5,7 0,5 7,91985 2,0 6,5 0,5 8,91986 1,9 6,4 0,5 8,71987 2,1 6,5 0,4 9,01988 2,1 7,1 0,4 9,71989 2,1 7,2 0,4 9,71990 2,5 7,0 0,4 9,81991 2,8 6,8 0,5 10,11992 3,0 6,1 1,0 10,11993 3,1 5,5 1,0 9,61994 3,0 5,1 0,9 9,11995 2,8 4,8 0,8 8,41996 2,3 4,5 0,7 7,51997 2,1 4,3 0,6 7,01998 2,1 3,7 0,5 6,31999 2,1 4,4 0,5 6,92000 2,1 4,6 0,4 7,02001 2,1 4,9 0,4 7,42002 2,1 5,0 0,5 7,52003 2,1 5,2 0,4 7,72004 2,0 5,1 0,4 7,52005 2,0 5,0 0,4 7,42006 2,0 4,7 0,4 7,12007 2,0 4,3 0,2 6,52008 1,9 4,1 0,2 6,32009 2,1 4,2 0,3 6,62010 2,0 3,7 0,5 6,12011 1,9 3,4 0,4 5,82012 2,0 3,4 0,5 5,82013 2,0 3,4 0,5 5,92014 1,9 3,2 0,4 5,62015 1,8 3,1 0,4 5,4
15
The diagram statistics are also available as an Excel file. Click on the paperclip symbol at the left margin of the screen and open
the file from there, or go via View/Navigation Panels/Attachments.

29;1
Public transfers as a proportion of GDP in 2013 in Sweden and other European countries
Per cent of GDPCountry Old age Disability Families/
childrenUnemploy-
mentSurvivors Sickness Social
exclusionTotal
Lithuania* 6,3 1,2 0,8 0,3 0,4 0,5 0,4 9,9Romania 7,2 1,0 0,8 0,2 0,7 0,2 0,2 10,2Estonia 6,4 1,5 1,6 0,3 0,1 0,4 0,1 10,3Latvia* 7,3 0,9 0,9 0,5 0,2 0,6 0,1 10,5Slovakia* 6,6 1,3 1,6 0,6 0,9 0,5 0,4 11,8Bulgaria 7,6 1,1 1,2 0,5 1,0 0,4 0,1 11,9Iceland 5,3 2,8 1,2 0,9 0,5 1,5 0,3 12,5Malta 7,6 0,5 1,0 0,4 1,7 1,3 0,1 12,6Ireland 5,3 1,1 2,4 2,9 0,4 0,8 0,2 13,2Czech Republic 8,3 1,2 1,6 0,6 0,7 0,6 0,3 13,3Croatia 5,9 3,4 1,4 0,5 2,1 1,0 0,0 14,2Norway 6,3 3,5 1,2 0,4 0,3 2,3 0,3 14,3Hungary 9,0 1,3 1,9 0,5 1,2 0,4 0,0 14,4Luxembourg 6,7 1,3 2,7 1,5 1,8 1,2 0,4 15,6Sweden* 10,2 1,4 1,4 0,9 0,4 1,3 0,3 16,0Switzerland 10,1 1,7 1,2 0,8 1,2 1,0 0,4 16,4Slovenia* 10,2 1,2 1,4 0,8 1,6 1,0 0,5 16,7United Kingdom* 11,3 1,3 2,3 0,5 0,1 0,7 0,7 16,8Serbia 10,4 1,6 1,1 0,7 2,2 0,5 0,4 16,8Germany* 9,0 1,5 2,0 1,1 1,9 1,7 0,1 17,3Spain* 9,0 1,6 0,5 3,1 2,4 0,7 0,1 17,5Cyprus 10,4 0,6 1,2 1,8 1,4 1,4 1,1 17,9Finland 10,5 2,2 1,6 2,0 0,9 1,2 0,5 18,7Netherlands* 10,0 2,0 0,7 1,6 1,2 2,0 1,4 18,9Portugal 12,3 1,9 0,8 1,8 1,9 0,3 0,2 19,2Denmark* 9,5 2,8 1,4 1,5 2,1 0,9 1,1 19,3Belgium 9,3 1,8 1,8 3,3 2,0 0,8 0,6 19,8Austria 12,2 1,6 2,0 1,2 1,8 1,1 0,2 20,0France* 12,3 1,3 1,6 1,9 1,7 0,8 0,6 20,2Italy* 14,4 1,5 0,9 1,7 2,7 0,4 0,0 21,5* Preliminary figuresGreece and Poland did not report statistics on public transfers for 2013. Source: Eurostat
16
The diagram statistics are also available as an Excel file. Click on the paperclip symbol at the left margin of the screen and open
the file from there, or go via View/Navigation Panels/Attachments.

32;1
Registered insured persons in December 2015 by age group
Age Women Men16-19 194 861 209 23220-24 305 547 323 02525-29 315 937 323 77230-34 288 953 295 99635-39 290 955 296 55240-44 315 996 321 33245-49 321 849 329 31250-54 313 919 322 07855-59 285 361 288 57260-64 278 309 276 24765-69 297 120 289 69570-74 260 222 249 87275-79 183 903 161 08080-84 138 950 104 16185-89 101 648 60 58190- 68 057 28 679
17
The diagram statistics are also available as an Excel file. Click on the paperclip symbol at the left margin of the screen and open
the file from there, or go via View/Navigation Panels/Attachments.

34;1
Parental benefit days
Year Women Men1990 44 851 315 3 440 7011991 49 600 570 4 145 5321992 50 801 232 4 793 1601993 50 030 342 5 299 5431994 48 459 832 5 901 4701995 42 519 211 4 507 1011996 37 713 386 4 463 1731997 34 151 144 3 754 0071998 32 552 062 3 775 3541999 31 869 907 4 166 2792000 31 225 746 4 435 4812001 31 458 797 5 042 3192002 32 210 665 5 917 7612003 33 235 019 6 911 2392004 34 407 652 7 901 5132005 34 338 735 8 320 0782006 34 524 796 8 957 8982007 35 856 090 9 434 5382008 37 117 288 10 143 0622009 37 169 343 10 669 8222010 38 228 681 11 489 9452011 38 363 061 11 921 0672012 38 370 595 12 407 0722013 38 706 268 12 741 6972014 39 923 865 13 343 1622015 39 256 182 13 921 298
18
The diagram statistics are also available as an Excel file. Click on the paperclip symbol at the left margin of the screen and open
the file from there, or go via View/Navigation Panels/Attachments.

34;2
Avarege number of parental benefit days at various ages for children born in 2007
Childrens age Mother Father1 224 202 67 363 10 84 8 75 7 66 7 77 8 88 14 13
19
The diagram statistics are also available as an Excel file. Click on the paperclip symbol at the left margin of the screen and open
the file from there, or go via View/Navigation Panels/Attachments.

35;1
Proportion of days of parental benefit taken by men per county in 2015
County Per cent01 Stockholms län 2803 Uppsala län 2904 Södermanlands län 2405 Östergötlands län 2606 Jönköpings län 2407 Kronobergs län 2508 Kalmar län 2509 Gotlands län 2910 Blekinge län 2512 Skåne län 2413 Hallands län 2614 Västra Götalands län 2617 Värmlands län 2418 Örebro län 2619 Västmanlands län 2620 Dalarnas län 2621 Gävleborgs län 2422 Västernorrlands län 2623 Jämtlands län 2824 Västerbottens län 3125 Norrbottens län 27
20
The diagram statistics are also available as an Excel file. Click on the paperclip symbol at the left margin of the screen and open
the file from there, or go via View/Navigation Panels/Attachments.

35;2
Proportion of recipients of parental benefit at the basic level only in 2015
Age Women Men-19 92,0 75,420-24 43,6 15,025-29 19,0 5,430-34 10,8 3,635-39 7,2 3,140-44 5,3 3,045-49 5,1 4,150-54 5,4 5,455- 10,2 10,1
Per cent
21
The diagram statistics are also available as an Excel file. Click on the paperclip symbol at the left margin of the screen and open
the file from there, or go via View/Navigation Panels/Attachments.

37;1
Number of children for whom a parent took double days in 2015
Age Number of children1 mån 4 0102 mån 5 3163 mån 5 3814 mån 5 2975 mån 5 2476 mån 5 3047 mån 5 2898 mån 5 4409 mån 5 72110 mån 6 17411 mån 6 73512 mån 6 546
22
The diagram statistics are also available as an Excel file. Click on the paperclip symbol at the left margin of the screen and open
the file from there, or go via View/Navigation Panels/Attachments.

40;1
Temporary parental benefit days for care of children
Year Women Men1994 3 323 666 1 671 9371995 3 325 023 1 565 1441996 3 117 461 1 398 2851997 3 096 279 1 393 1121998 3 023 516 1 444 4151999 2 962 929 1 497 6782000 2 888 055 1 515 1642001 3 198 243 1 732 6382002 3 071 677 1 704 8142003 3 055 349 1 691 2972004 2 793 796 1 560 6532005 2 830 380 1 613 5502006 3 134 444 1 822 2062007 2 937 030 1 633 6862008 3 005 810 1 658 6032009 2 898 916 1 590 4622010 3 002 288 1 654 3802011 3 238 400 1 805 4502012 3 162 339 1 796 8992013 3 593 496 2 124 9292014 3 702 292 2 217 7372015 3 758 944 2 310 419
23
The diagram statistics are also available as an Excel file. Click on the paperclip symbol at the left margin of the screen and open
the file from there, or go via View/Navigation Panels/Attachments.

40;2
Average number of temporary parental benefit days for care of children 2015
Age Days, averageper child with VAB
Days, averageper child in population
0 26,0 1,71 9,0 3,52 11,7 7,93 10,0 6,44 8,5 5,35 7,7 4,86 6,8 4,17 6,2 3,68 5,9 3,29 5,7 3,010 5,6 2,711 5,5 2,312 4,5 1,313 6,9 0,514 9,8 0,515 12,1 0,516 12,2 0,417 20,4 0,3
24
The diagram statistics are also available as an Excel file. Click on the paperclip symbol at the left margin of the screen and open
the file from there, or go via View/Navigation Panels/Attachments.

42;1
Temporary parental benefit in connection with birth or adoption
YearChildren born Recipients
1994 112 257 87 0761995 103 422 77 3331996 95 297 69 7451997 90 502 65 2721998 89 028 64 4311999 88 173 64 4692000 90 441 66 3512001 91 466 68 6442002 95 815 71 8232003 99 157 77 1262004 100 928 80 1322005 101 346 76 4232006 105 913 78 5582007 107 421 81 8612008 109 301 83 5882009 111 801 82 5242010 115 641 84 0762011 111 770 83 8852012 113 177 83 3172013 113 593 83 2782014 114 907 86 2842015 114 870 86 001
Source children born: Statistics Sweden (SCB)
25
The diagram statistics are also available as an Excel file. Click on the paperclip symbol at the left margin of the screen and open
the file from there, or go via View/Navigation Panels/Attachments.

43;1
Temporary parental benefit for contact days
Year Women Men1996 5 566 3 5011997 5 332 3 3181998 5 713 3 5291999 5 713 3 4922000 5 535 3 4262001 7 381 4 4322002 5 883 3 5452003 6 145 3 6242004 6 904 3 9752005 6 779 4 0632006 8 731 4 7772007 7 208 3 8102008 7 819 4 4882009 7 636 4 2902010 8 004 4 3832011 8 428 4 6442012 8 465 4 2342013 8 283 4 4932014 8 825 4 6422015 8 729 4 901
26
The diagram statistics are also available as an Excel file. Click on the paperclip symbol at the left margin of the screen and open
the file from there, or go via View/Navigation Panels/Attachments.

45;1
Pregnancy benefit
YearChildren born Recipients
1994 112 257 25 1011995 103 422 23 1691996 95 297 21 5801997 90 502 20 3961998 89 028 20 6401999 88 173 20 7252000 90 441 21 1282001 91 466 21 3062002 95 815 22 5452003 99 157 22 1992004 100 928 22 4292005 101 346 21 9582006 105 913 22 9622007 107 421 24 4302008 109 301 24 3732009 111 801 24 0072010 115 641 23 6002011 111 770 21 8152012 113 177 23 1432013 113 593 23 6622014 114 907 24 7772015 114 870 25 228
27
The diagram statistics are also available as an Excel file. Click on the paperclip symbol at the left margin of the screen and open
the file from there, or go via View/Navigation Panels/Attachments.

46;1
Number of children by age in 2015
Age Girls Boys0 55 884 59 9941 57 292 60 6402 56 834 60 2923 57 297 60 6624 57 127 60 1965 59 253 62 6866 57 748 61 0647 56 851 60 4458 56 272 59 5729 56 038 59 18910 54 402 57 07611 53 989 57 22412 53 410 56 21813 52 088 54 68714 49 783 52 93015 49 781 53 28716 48 995 52 338
Source: Statistics Sweden (SCB)
28
The diagram statistics are also available as an Excel file. Click on the paperclip symbol at the left margin of the screen and open
the file from there, or go via View/Navigation Panels/Attachments.

48;1
Children with maintenance support
Year Girls Boys Total1994 306 0471995 310 7711996 316 0791997 162 586 171 286 333 8721998 167 894 176 960 344 8541999 169 782 179 201 348 9832000 160 733 169 718 330 4512001 162 442 171 190 333 6322002 159 722 167 510 327 2322003 154 016 161 109 315 1252004 147 808 154 426 302 2342005 141 040 147 390 288 4302006 139 708 146 104 285 8122007 134 509 141 160 275 6692008 127 679 134 156 261 8352009 123 993 130 613 254 6062010 120 045 125 927 245 9722011 115 606 121 475 237 0812012 112 788 118 111 230 8992013 111 208 116 871 228 0792014 110 075 115 377 225 4522015 109 869 115 379 225 248
29
The diagram statistics are also available as an Excel file. Click on the paperclip symbol at the left margin of the screen and open
the file from there, or go via View/Navigation Panels/Attachments.

50;1
Number of households receiving housing allowance in December
Year Single parents Cohabiting parents
Youth without children
1999 170 778 57 762 43 1162000 161 548 47 622 36 2142001 151 093 40 319 31 0322002 140 856 36 184 31 5502003 135 431 34 438 33 9352004 134 059 35 461 37 9582005 133 837 38 264 42 3092006 127 094 39 171 40 4992007 115 313 36 468 34 9432008 106 776 36 057 32 4962009 105 520 39 749 38 8522010 100 079 40 057 40 4762011 94 321 37 502 37 7472012 99 129 39 737 39 2002013 101 885 42 969 39 5962014 103 820 46 124 38 6782015 102 270 48 293 35 519
30
The diagram statistics are also available as an Excel file. Click on the paperclip symbol at the left margin of the screen and open
the file from there, or go via View/Navigation Panels/Attachments.

52;1
Childcare allowance recipients in December
Year Women Men1994 19 536 1 1411995 20 852 1 5851996 22 018 1 8271997 23 004 2 0471998 24 373 2 2951999 25 873 2 6612000 26 854 3 0072001 27 452 3 2532002 28 357 4 5842003 31 395 4 0622004 33 353 4 4982005 34 575 4 8152006 35 155 5 1032007 34 876 5 1762008 35 305 5 3622009 36 347 5 7462010 37 001 5 9832011 37 619 6 2092012 39 705 6 7872013 41 713 7 2982014 44 110 7 9032015 46 834 8 662
31
The diagram statistics are also available as an Excel file. Click on the paperclip symbol at the left margin of the screen and open
the file from there, or go via View/Navigation Panels/Attachments.

52;2
Proportion of childcare allowance by scope in December
Per cent
Year 1/4 1/2 3/4One or more
per family1994 24 31 6 391995 26 30 7 361996 27 30 8 351997 29 30 8 341998 29 30 9 321999 30 30 9 312000 31 29 10 302001 32 29 10 292002 33 29 10 282003 34 29 10 272004 34 29 11 272005 34 29 11 262006 34 29 11 252007 34 29 12 252008 35 29 12 242009 36 29 12 232010 38 29 11 222011 39 29 11 212012 40 30 11 192013 39 31 12 182014 39 32 12 172015 38 33 13 17
32
The diagram statistics are also available as an Excel file. Click on the paperclip symbol at the left margin of the screen and open
the file from there, or go via View/Navigation Panels/Attachments.

53;1
Newly granted childcare allowances by type of diagnosis
Girls Per cent
Type of diagnosis 2003 2004 2005 2006 2007 2008 2009 2010 2011 2012 2013 2014 2015Mental disorders 31 34 36 38 41 43 45 47 51 51 54 56 59Endocrine, nutritional and metabolic diseases 17 16 16 17 16 14 13 12 12 11 11 10 9Diseases of the nervous system 8 6 6 6 5 5 5 5 4 4 4 4 3Congenital malformations etc 9 9 8 10 8 8 8 6 6 5 7 5 5Other conditions 36 34 33 29 29 30 29 30 28 29 24 24 24
Boys Per cent
Type of diagnosis 2003 2004 2005 2006 2007 2008 2009 2010 2011 2012 2013 2014 2015Mental disorders 48 51 53 55 58 59 61 63 66 64 70 68 71Endocrine, nutritional and metabolic diseases 11 11 11 12 11 9 9 8 7 6 6 6 5Diseases of the nervous system 6 5 4 5 4 4 3 3 3 2 3 3 3Congenital malformations etc 7 7 6 6 6 5 5 4 4 4 3 4 4Other conditions 28 25 26 22 21 22 22 23 21 24 17 19 18
33
The diagram statistics are also available as an Excel file. Click on the paperclip symbol at the left margin of the screen and open
the file from there, or go via View/Navigation Panels/Attachments.

53;2
Children whose parents were receiving childcare allowance in December 2015 by age of the child
Age Girls Boys0 31 401 202 2952 309 4583 496 6724 668 1 0855 752 1 4336 874 1 6627 897 1 9648 1 075 2 1829 1 175 2 55810 1 298 2 87311 1 473 3 14512 1 657 3 51813 1 645 3 52914 1 618 3 32215 1 700 3 35016 1 470 2 76417 1 367 2 56418- 1 364 2 426
34
The diagram statistics are also available as an Excel file. Click on the paperclip symbol at the left margin of the screen and open
the file from there, or go via View/Navigation Panels/Attachments.

56;1
People receiving disability allowance in December
Year Women Men1994 28 551 24 6431995 28 873 24 8841996 29 344 25 2351997 29 694 25 5111998 30 306 25 9621999 30 870 26 4242000 31 533 26 8352001 31 945 27 2292002 32 743 27 9212003 33 078 28 0572004 33 218 27 9702005 33 309 27 7922006 33 398 27 9012007 33 321 27 9722008 33 323 28 0622009 33 349 28 3122010 33 199 28 3102011 33 027 28 3632012 33 157 28 5712013 33 592 29 2542014 34 021 29 6052015 34 251 29 811
35
The diagram statistics are also available as an Excel file. Click on the paperclip symbol at the left margin of the screen and open
the file from there, or go via View/Navigation Panels/Attachments.

56;2
Proportion of population receiving disability allowance in December 2015
Per centAge Women Men19-29 0,5 0,530-39 0,6 0,640-49 0,8 0,850-59 1,2 1,060-69 1,4 1,270-79 1,2 0,880-89 0,7 0,590- 0,4 0,4
36
The diagram statistics are also available as an Excel file. Click on the paperclip symbol at the left margin of the screen and open
the file from there, or go via View/Navigation Panels/Attachments.

57;1
Disability allowance by compensation level and age in December 2015
Women Per cent
Level 19-29 30-39 40-49 50-59 60-69 70-79 80-36 62 64 62 60 63 69 7553 18 16 17 18 18 17 1469 20 20 21 23 18 14 11
Men Per cent
Level 19-29 30-39 40-49 50-59 60-69 70-79 80-36 62 62 58 59 60 69 7753 18 16 16 17 17 15 1269 21 22 25 25 22 16 11
37
The diagram statistics are also available as an Excel file. Click on the paperclip symbol at the left margin of the screen and open
the file from there, or go via View/Navigation Panels/Attachments.

58;1
People receiving attendance allowance in December
Year Women Men1994 2 836 3 3051995 3 338 3 9511996 3 551 4 1391997 3 704 4 2191998 3 991 4 4891999 4 242 4 8412000 4 584 5 1192001 5 171 5 7822002 5 207 5 8282003 5 543 6 2162004 5 915 6 6292005 6 335 7 0582006 6 688 7 4582007 7 043 7 8532008 7 195 8 0792009 7 369 8 3792010 7 411 8 5212011 7 373 8 5942012 7 335 8 5572013 7 319 8 5472014 7 430 8 7282015 7 394 8 748
38
The diagram statistics are also available as an Excel file. Click on the paperclip symbol at the left margin of the screen and open
the file from there, or go via View/Navigation Panels/Attachments.

60;1
Number of people receiving car allowance
Year Women Men1994 762 8331995 855 9841996 1 394 1 6501997 1 110 1 3021998 1 074 1 2001999 1 150 1 1582000 1 030 1 0992001 971 1 1932002 993 1 2162003 1 090 1 3402004 1 090 1 3402005 1 232 1 3822006 1 313 1 3912007 743 9792008 663 8612009 792 9472010 771 9162011 796 1 0462012 795 9902013 826 1 0462014 933 1 0842015 964 1 167
39
The diagram statistics are also available as an Excel file. Click on the paperclip symbol at the left margin of the screen and open
the file from there, or go via View/Navigation Panels/Attachments.

60;2
Car allowance by type of grant in 2015
Type of grant Women Men Women MenAdaptation grants 55 55 73 70Procurement grants 8 7 2 2Basic grants 37 38 25 27
Proportion ofthe number of payments
Proportion of amount paid
40
The diagram statistics are also available as an Excel file. Click on the paperclip symbol at the left margin of the screen and open
the file from there, or go via View/Navigation Panels/Attachments.

62;1
Number of sickness cash benefit recipients
Year Women Men1994 439 321 325 8311995 412 887 294 9901996 368 496 258 9361997 296 856 200 2621998 361 233 235 5581999 425 797 274 8552000 477 936 302 7342001 516 414 324 1742002 529 177 333 1422003 491 118 304 4252004 442 497 267 3622005 432 266 266 4612006 413 263 256 8182007 376 197 233 8472008 334 507 209 8472009 298 057 190 7022010 289 899 180 5922011 297 234 177 3232012 317 233 186 5152013 336 927 195 5232014 358 372 205 3202015 389 452 220 380
41
The diagram statistics are also available as an Excel file. Click on the paperclip symbol at the left margin of the screen and open
the file from there, or go via View/Navigation Panels/Attachments.

62;2
Proportion of partial sickness cash benefit days
Per centYear Women Men1994 26,7 21,21995 27,3 22,21996 27,4 22,61997 27,4 23,01998 27,2 22,21999 27,2 22,02000 27,4 22,32001 28,2 22,72002 30,1 23,72003 34,0 27,22004 37,1 30,22005 39,0 31,52006 39,1 31,62007 39,7 32,22008 39,0 30,92009 35,4 27,12010 32,2 24,72011 32,0 24,82012 30,5 23,92013 30,4 23,62014 31,2 23,92015 32,0 24,7
42
The diagram statistics are also available as an Excel file. Click on the paperclip symbol at the left margin of the screen and open
the file from there, or go via View/Navigation Panels/Attachments.

63;1
Ongoing cases of sickness cash benefit by age and type of diagnosis in December 2015
Women Per cent
Diagnosis 16-29 30-39 40-49 50-59 60-Mental disorders 54 60 56 43 31Diseases of the circulatory system 1 1 2 3 5Diseases of the musculoskeletal system 12 13 20 27 30Injuries 4 3 4 5 6Other conditions 29 23 19 23 27
Men Per cent
Diagnosis 16-29 30-39 40-49 50-59 60-Mental disorders 48 56 44 30 19Diseases of the circulatory system 1 2 4 9 12Diseases of the musculoskeletal system 19 19 24 29 31Injuries 19 10 9 8 7Other conditions 13 15 18 24 30
43
The diagram statistics are also available as an Excel file. Click on the paperclip symbol at the left margin of the screen and open
the file from there, or go via View/Navigation Panels/Attachments.

64;1
Ongoing cases of sickness cash benefit by county in December 2015
County Women Men01 Stockholms län 39,7 19,603 Uppsala län 44,6 23,104 Södermanlands län 50,4 24,405 Östergötlands län 37,3 19,106 Jönköpings län 47,2 24,607 Kronobergs län 46,6 24,408 Kalmar län 47,1 26,209 Gotlands län 43,4 20,010 Blekinge län 43,1 20,912 Skåne län 40,7 21,013 Hallands län 42,3 21,414 Västra Götalands län 52,5 26,617 Värmlands län 48,8 23,818 Örebro län 55,7 26,619 Västmanlands län 51,1 25,320 Dalarnas län 52,1 26,421 Gävleborgs län 50,4 25,122 Västernorrlands län 61,7 29,023 Jämtlands län 58,8 28,624 Västerbottens län 58,9 26,925 Norrbottens län 47,1 21,5
44
The diagram statistics are also available as an Excel file. Click on the paperclip symbol at the left margin of the screen and open
the file from there, or go via View/Navigation Panels/Attachments.

66;1
Number of cases of sickness or rehabilitation cash benefit 60 days or longer in December
Year Women Men1994 71 300 54 2001995 64 200 46 6001996 63 600 44 4001997 67 000 44 6001998 85 600 54 3001999 109 100 66 4002000 133 835 77 2752001 153 716 88 0442002 159 368 91 5002003 154 073 87 1482004 133 820 75 5272005 111 469 63 0872006 102 036 58 1012007 85 270 48 8232008 65 148 39 0462009 50 719 31 8522010 50 282 30 0582011 61 009 33 8002012 68 246 37 3822013 77 795 41 2922014 90 767 46 8332015 101 056 50 871
45
The diagram statistics are also available as an Excel file. Click on the paperclip symbol at the left margin of the screen and open
the file from there, or go via View/Navigation Panels/Attachments.

68;1
Newly granted activity compensation (temporary disability pension and early retirement pension before 2003)for people younger than 30
Year Women Men1994 1 107 1 0921995 999 9321996 1 004 9701997 1 042 1 0091998 1 199 1 1471999 1 232 1 2552000 1 535 1 4542001 1 734 1 7382002 2 031 2 0242003 1 942 1 8482004 2 528 1 9932005 2 548 2 1582006 2 972 3 0542007 3 248 3 3962008 3 008 3 2042009 2 969 3 3852010 2 829 3 3002011 3 014 3 5662012 3 057 3 5942013 3 434 3 8942014 4 006 4 3952015 4 090 4 608
46
The diagram statistics are also available as an Excel file. Click on the paperclip symbol at the left margin of the screen and open
the file from there, or go via View/Navigation Panels/Attachments.

68;2
Newly granted sickness compensation (temporary disability pension and early retirement pension before 2003) for people 30 years or older
Year Women Men1994 24 013 22 3271995 19 568 17 7151996 19 941 17 3421997 20 142 19 0391998 17 383 14 7691999 20 694 16 3392000 26 381 19 8302001 30 842 22 7762002 35 170 24 5242003 36 411 25 1642004 41 513 27 1272005 33 423 22 1792006 24 843 17 3072007 24 119 16 9202008 17 354 12 2982009 8 622 7 2762010 4 052 3 8722011 4 100 3 6892012 5 536 4 5332013 6 482 5 2152014 7 460 5 7012015 6 469 5 197
47
The diagram statistics are also available as an Excel file. Click on the paperclip symbol at the left margin of the screen and open
the file from there, or go via View/Navigation Panels/Attachments.

68;3
Proportion of partial activity compensation and sickness compensation (temporary disability pension and early retirement pension before 2003) in December
Per centYear Women Men1994 26 181995 27 191996 28 201997 28 201998 28 201999 28 202000 28 202001 27 202002 27 202003 28 202004 29 212005 30 222006 31 232007 32 232008 32 232009 32 232010 32 222011 32 222012 32 222013 32 212014 31 202015 30 20
48
The diagram statistics are also available as an Excel file. Click on the paperclip symbol at the left margin of the screen and open
the file from there, or go via View/Navigation Panels/Attachments.

69;1
Newly granted activity compensation by type of diagnosis
Women Per cent
Type of diagnosis 2003 2004 2005 2006 2007 2008 2009 2010 2011 2012 2013 2014 2015Mental disorders 66 68 73 74 75 80 80 84 85 84 84 84 86Diseases of the musculoskeletal system 12 13 10 7 6 5 3 2 2 2 2 2 2Injuries 8 5 4 3 2 2 2 1 1 1 1 1 1Other conditions 14 14 13 16 17 14 15 12 12 14 13 12 11
Men Per cent
Type of diagnosis 2003 2004 2005 2006 2007 2008 2009 2010 2011 2012 2013 2014 2015Mental disorders 69 75 77 79 80 80 81 86 88 85 85 89 89Diseases of the musculoskeletal system 5 4 4 2 2 1 1 1 1 1 1 1 1Injuries 9 7 4 3 3 2 2 2 1 2 2 1 2Other conditions 16 13 14 16 15 16 16 11 10 12 12 9 9
49
The diagram statistics are also available as an Excel file. Click on the paperclip symbol at the left margin of the screen and open
the file from there, or go via View/Navigation Panels/Attachments.

69;2
Newly granted sickness compensation by type of diagnosis
Women Per cent
Type of diagnosis 2003 2004 2005 2006 2007 2008 2009 2010 2011 2012 2013 2014 2015Mental disorders 29 32 34 37 37 39 34 38 44 40 43 42 46Diseases of the nervous system 3 3 4 4 4 5 8 11 10 9 10 9 9Diseases of the circulatory system 4 4 4 4 5 5 7 9 7 7 6 6 6Diseases of the musculoskeletal system 44 42 40 38 36 34 30 23 21 24 24 25 23Other conditions 20 19 18 18 18 18 21 20 18 21 18 18 17
Män Per cent
Diagnosgrupp 2003 2004 2005 2006 2007 2008 2009 2010 2011 2012 2013 2014 2015Mental disorders 26 28 30 33 33 34 31 36 40 40 39 41 43Diseases of the nervous system 4 4 5 5 5 6 9 11 10 10 10 10 9Diseases of the circulatory system 12 11 11 11 12 11 15 17 15 13 14 12 12Diseases of the musculoskeletal system 36 35 33 30 29 28 22 14 14 15 16 16 17Other conditions 22 22 21 21 21 21 23 22 21 22 22 22 19
50
The diagram statistics are also available as an Excel file. Click on the paperclip symbol at the left margin of the screen and open
the file from there, or go via View/Navigation Panels/Attachments.

70;1
Newly granted activity compensation and sickness compensation by age and type of diagnosis in 2015
Women Procent
Type of diagnosis 19-29 30-39 40-49 50-59 60-64Mental disorders 86 61 51 43 34Diseases of the circulatory system 0 11 10 8 8Diseases of the musculoskeletal system 1 2 3 7 9Injuries 2 13 21 25 27Other conditions 8 14 15 17 22
Men Procent
Type of diagnosis 19-29 30-39 40-49 50-59 60-64Mental disorders 89 76 56 39 25Diseases of the circulatory system 3 6 8 10 10Diseases of the musculoskeletal system 1 1 7 13 19Injuries 1 4 14 19 21Other conditions 7 12 15 19 24
51
The diagram statistics are also available as an Excel file. Click on the paperclip symbol at the left margin of the screen and open
the file from there, or go via View/Navigation Panels/Attachments.

70;2
Proportion of the population that was receiving activity compensation or sickness compensation in December 2015
Per centAge Women Men19 2,3 3,220-24 2,7 3,025-29 2,6 2,730-34 1,8 1,935-39 2,5 2,240-44 4,0 2,845-49 6,8 4,250-54 10,4 6,555-59 15,3 9,760-64 21,6 14,3
52
The diagram statistics are also available as an Excel file. Click on the paperclip symbol at the left margin of the screen and open
the file from there, or go via View/Navigation Panels/Attachments.

71;1
Proportion of the population that was receiving sickness compensation or activity compensation by region of birthin December 2015, age-standardised
Per centRegion Women MenSweden 7,0 4,8Nordic countries excluding Sweden 7,9 7,1EU 28 excluding Nordic countries 7,5 4,9Rest of Europé 12,6 9,5Sub-Saharan Africa 7,3 4,9Asia excluding Middle East 6,6 5,6Middle East, North Africa and Turkey 12,1 8,9North America 5,1 3,7South America 8,5 5,4Oceania 4,5 3,2
53
The diagram statistics are also available as an Excel file. Click on the paperclip symbol at the left margin of the screen and open
the file from there, or go via View/Navigation Panels/Attachments.

73;1
Number of recipients of benefit for care of closely related persons
Year Women Men1994 3 870 1 4851995 4 666 1 7381996 4 746 1 7721997 4 745 1 8731998 5 308 2 1111999 5 447 2 1782000 5 873 2 5052001 6 238 2 5892002 6 592 2 8322003 6 641 2 9092004 6 912 2 9272005 7 049 2 9312006 7 036 2 8552007 7 121 2 7222008 6 820 2 5712009 7 783 2 8162010 8 369 2 9132011 9 703 3 5482012 10 264 3 7572013 10 975 4 0532014 11 338 4 2822015 11 446 4 224
54
The diagram statistics are also available as an Excel file. Click on the paperclip symbol at the left margin of the screen and open
the file from there, or go via View/Navigation Panels/Attachments.

74;1
Proportion of population receiving activity compensation or sickness compensation with housing supplement in December
Per centYear Women Men2003 23,9 26,32004 23,2 25,82005 23,1 26,32006 23,3 27,02007 23,4 27,52008 24,3 28,62009 25,7 30,42010 26,8 31,52011 28,5 33,72012 28,8 34,32013 30,2 35,92014 32,9 39,32015 33,5 41,1
55
The diagram statistics are also available as an Excel file. Click on the paperclip symbol at the left margin of the screen and open
the file from there, or go via View/Navigation Panels/Attachments.

76;1
Number of individual life annuities in accordance with work injury insurance in December
Year Women Men1994 49 423 49 6561995 49 226 50 0141996 48 896 50 2291997 47 927 49 4501998 46 928 48 8041999 44 564 46 2782000 43 795 45 8192001 43 191 45 3432002 42 088 44 7212003 43 040 45 0142004 41 592 43 9612005 40 051 42 6702006 37 690 41 1342007 35 440 39 2602008 32 631 36 1052009 30 202 33 3532010 27 629 30 3952011 25 015 27 4502012 22 816 24 9172013 20 883 22 9062014 19 144 21 1102015 17 497 19 446
56
The diagram statistics are also available as an Excel file. Click on the paperclip symbol at the left margin of the screen and open
the file from there, or go via View/Navigation Panels/Attachments.

78;1
Amount paid for dental care
Year Current prices 2015 prices1994 3,3 4,21995 2,4 3,01996 2,5 3,11997 2,0 2,51998 1,8 2,11999 1,4 1,72000 1,5 1,82001 1,5 1,82002 1,6 1,82003 2,6 2,92004 3,1 3,52005 2,4 2,72006 3,0 3,32007 3,3 3,52008 3,9 4,02009 5,5 5,82010 4,9 5,12011 5,0 5,02012 4,9 4,92013 5,2 5,22014 5,2 5,22015 5,3 5,3
SEK million
57
The diagram statistics are also available as an Excel file. Click on the paperclip symbol at the left margin of the screen and open
the file from there, or go via View/Navigation Panels/Attachments.

78;2
Proportion of the population that used the general dental care allowance in 2015
Per centAge group Women Men20-29 47 4030-34 45 3735-39 48 4040-44 52 4445-49 54 4750-54 57 5055-59 60 5360-64 62 5765-69 64 6070-74 63 6075- 51 54
58
The diagram statistics are also available as an Excel file. Click on the paperclip symbol at the left margin of the screen and open
the file from there, or go via View/Navigation Panels/Attachments.

79;1
Dental procedures broken down by category in 2015
Per centCategory Women MenExamination, risk assessment and health-promoting procedures 44 41Disease-preventive procedures 3 3Disease-treatment procedures 24 24Surgical measures 4 5Reparative procedures 17 19Prosthetic procedures 5 6Other procedures 3 3
59
The diagram statistics are also available as an Excel file. Click on the paperclip symbol at the left margin of the screen and open
the file from there, or go via View/Navigation Panels/Attachments.

82;1
Number of recipients of activity grants or development allowance
Year Women Men1994 178 329 224 9511995 169 023 197 1421996 167 355 177 3371997 166 561 173 0921998 151 031 161 1541999 142 014 155 9922000 120 362 135 9912001 109 885 123 5732002 107 809 124 9442003 83 013 97 9202004 95 365 115 4002005 112 324 123 2612006 125 641 128 9062007 70 830 73 0742008 67 937 73 7652009 98 475 123 7822010 169 294 189 0082011 160 996 166 6102012 158 910 166 3902013 163 153 178 6562014 145 402 166 0732015 137 311 158 969
60
The diagram statistics are also available as an Excel file. Click on the paperclip symbol at the left margin of the screen and open
the file from there, or go via View/Navigation Panels/Attachments.