social and economic performance of tilapia farming in brazil · abstract . tilapia is the most...
TRANSCRIPT
FAO Fisheries and
Aquaculture Circular
FIAA/C1181 (En)
ISSN 2070-6065
SOCIAL AND ECONOMIC PERFORMANCE OF TILAPIA FARMING IN BRAZIL

Cover photographs: © A.E.P. Muñoz and © D. Webber

FAO Fisheries and Aquaculture Circular No. 1181 FIAA/C1181 (En)
SOCIAL AND ECONOMIC PERFORMANCE OF TILAPIA FARMING IN BRAZIL By Renata Melon Barroso Analyst Embrapa Fisheries and Aquaculture Brazilian Agricultural Research Corporation (EMBRAPA) Palmas/TO, Brazil Andrea Elena Pizarro Muñoz Researcher in Socioeconomics Embrapa Fisheries and Aquaculture Brazilian Agricultural Research Corporation (EMBRAPA) Palmas/TO, Brazil and Junning Cai Aquaculture Officer Fisheries and Aquaculture Department FAO Rome, Italy
FOOD AND AGRICULTURE ORGANIZATION OF THE UNITED NATIONS Rome, 2019

Required citation: Barroso, R.M., Muñoz, A.E.P. and Cai, J. 2019. Social and economic performance of tilapia farming in Brazil. FAO Fisheries and Aquaculture Circular No. 1181. Rome, FAO. Licence: CC BY‐NC‐SA 3.0 IGO.
The designations employed and the presentation of material in this information product do not imply the expression of any opinion whatsoever on the part of the Food and Agriculture Organization of the United Nations (FAO) concerning the legal or development status of any country, territory, city or area or of its authorities, or concerning the delimitation of its frontiers or boundaries. The mention of specific companies or products of manufacturers, whether or not these have been patented, does not imply that these have been endorsed or recommended by FAO in preference to others of a similar nature that are not mentioned. The views expressed in this information product are those of the author(s) and do not necessarily reflect the views or policies of FAO. ISBN 978-92-5-131619-1 © FAO, 2019
Some rights reserved. This work is made available under the Creative Commons Attribution-NonCommercial-ShareAlike 3.0 IGO licence (CC BY-NC-SA 3.0 IGO; https://creativecommons.org/licenses/by-nc-sa/3.0/igo/legalcode). Under the terms of this licence, this work may be copied, redistributed and adapted for non-commercial purposes, provided that the work is appropriately cited. In any use of this work, there should be no suggestion that FAO endorses any specific organization, products or services. The use of the FAO logo is not permitted. If the work is adapted, then it must be licensed under the same or equivalent Creative Commons licence. If a translation of this work is created, it must include the following disclaimer along with the required citation: “This translation was not created by the Food and Agriculture Organization of the United Nations (FAO). FAO is not responsible for the content or accuracy of this translation. The original [Language] edition shall be the authoritative edition.” Disputes arising under the licence that cannot be settled amicably will be resolved by mediation and arbitration as described in Article 8 of the licence except as otherwise provided herein. The applicable mediation rules will be the mediation rules of the World Intellectual Property Organization http://www.wipo.int/amc/en/mediation/rules and any arbitration will be conducted in accordance with the Arbitration Rules of the United Nations Commission on International Trade Law (UNCITRAL). Third-party materials. Users wishing to reuse material from this work that is attributed to a third party, such as tables, figures or images, are responsible for determining whether permission is needed for that reuse and for obtaining permission from the copyright holder. The risk of claims resulting from infringement of any third-party-owned component in the work rests solely with the user. Sales, rights and licensing. FAO information products are available on the FAO website (www.fao.org/publications) and can be purchased through [email protected]. Requests for commercial use should be submitted via: www.fao.org/contact-us/licence-request. Queries regarding rights and licensing should be submitted to: [email protected].

iii
PREPARATION OF THIS DOCUMENT The document is a technical report under the FAO Fisheries and Aquaculture Department’s World Aquaculture Performance Indicators (WAPI). The goal of the document is to provide a comprehensive and balanced assessment of the technical, economic and social dimensions of tilapia farming in Brazil with a focus on its socio-economic impacts. The document is based on local data and information (including field data) provided by government agencies and research institutes (e.g. Embrapa) in Brazil and incorporates the latest FAO statistics on global fishery and aquaculture production and fisheries commodities trade. The document follows the structure of a previous FAO publication on the social and economic performance of tilapia farming in five African countries (i.e. FAO Fisheries and Aquaculture Circular No. 1130), as well as one on the social and economic dimensions of seaweed farming in six countries worldwide (i.e. FAO Fisheries and Aquaculture Technical Paper No. 580). PingSun Leung and Rodrigo Roubach are acknowledged for their highly valuable review of the document. Maria Giannini and Marianne Guyonnet are acknowledged for their assistance in editing and formatting.
iv
ABSTRACT
Tilapia is the most popular aquaculture species item farmed in over 120 countries or territories worldwide. Global tilapia aquaculture production grew 11 percent annually (or 13 percent in terms of farmgate value) over the past three decades, from 0.3 million tonnes (USD 304 million) in 1987 to 5.9 million tonnes (USD 11 billion) in 2017. Aquaculture production in Brazil increased 14 percent annually (or 12 percent in terms of farmgate value), from 13 000 tonnes (USD 56 million) in 1987 to 595 000 tonnes (USD 1.5 billion) in 2017, making it a regional aquaculture powerhouse contributing to 20 percent of Latin America and the Caribbean’s aquaculture production in 2017. In Brazil, tilapia has been the largest aquaculture item, contributing to nearly half of the country’s aquaculture production tonnage in 2017. This document assesses tilapia farming and the value chain in Brazil by examining tilapia farming technology and practices, dissecting the tilapia value chain, evaluating the sector’s social and economic performance, discussing the importance of proper governance to the sector development, and highlighting potentials, issues, constraints and challenges in the development of tilapia farming or aquaculture in general in Brazil.

v
ABBREVIATIONS AND ACRONYMS CEAGESP Companhia de Entrepostos e Armazéns Gerais de São Paulo DNOCS National Department of Works against Droughts EOC effective operating cost FAO Food and Agriculture Organization of the United Nations FCR feed conversion ratio GIFT genetically improved farmed tilapia HS Harmonized Commodity Description and Coding Systems IBGE Brazilian Institute of Geography and Statistics IPCA Extended Consumer Price Index IRR internal rate of return ISSCAAP International Standard Statistical Classification of Aquatic Animals and Plants LAC Latin America and the Caribbean SMSF Sub-middle São Francisco USD United States dollar WAPI World Aquaculture Performance Indicators


vii
CONTENTS PREPARATION OF THIS DOCUMENT iii ABSTRACT iv ABBREVIATIONS AND ACRONYMS v 1. INTRODUCTION 1 2. TILAPIA AQUACULTURE PRODUCTION AND VALUE CHAIN 3
2.1 Farmed tilapia production 4 2.2 Tilapia farming as a technology and knowledge-intensive business 7 2.3 Farming systems 7 2.4 Seed 13 2.5 Feed 14 2.6 Outgrowing 15 2.7 Fish health management 16 2.8 Processing 17 2.9 Domestic fish market 18 2.10 Consumption and price 19 2.11 Dissecting tilapia value chains 23 2.12 Export 24
3. SOCIAL AND ECONOMIC PERFORMANCE OF TILAPIA FARMING 25 3.1 Technical and economic performance 26 3.2 Social performance 31 3.3 Legal and regulatory framework 35 3.4 Farmer organizations 35
4. DISCUSSION 36 4.1 Technology 36 4.2 Environmental challenges 38 4.3 Processing 38 4.4 Markets 39 4.5 Concluding remarks 40
REFERENCES 41


1
1. INTRODUCTION
Over the past three decades, global tilapia1 aquaculture production grew 11 percent annually (13 percent in terms of farmgate value), from 0.3 million tonnes (USD 304 million) in 1987 to 5.9 million tonnes (USD 11 billion) in 2017 (FAO, 2019a).2 Compared to average growth in other farming species, the growth in tilapia farming was faster. Accordingly, the share of tilapia in global aquaculture production (including all species measured in tonnage)3 has increased, in terms of quantity, from 1.9 percent in 1987 to 5.3 percent in 2017, and in terms of value, from 1.5 percent to 4.4 percent. The lower share in value than in quantity indicates that tilapia has generally been a low-valued species in global aquaculture, yet the faster annual growth rate in terms of value (13 percent) than volume (11 percent) during 1987–2017 indicates that world average farmed tilapia price (in terms of United States dollars) has generally increased. In 2017, tilapia was a top 10 aquaculture species group (ranked #4) in terms of both production quantity and value (FAO, 2019b). Its 5.3 percent quantity share in global aquaculture was only lower than carps (25 percent), red seaweeds (15 percent) and brown seaweeds (12 percent); and its 4.4 percent value share was only smaller than carps (25 percent), marine shrimps and prawns (14 percent) and salmons/trouts/smelts (8.9 percent). This paper examines the technical, economic and social performance of tilapia farming in Brazil.4 Aquaculture production in Brazil increased 14 percent annually (12 percent in terms of farmgate value), from 13 000 tonnes (USD 56 million) in 1987 to 595 000 tonnes (USD 1.5 billion) in 2017. The faster aquaculture growth in Brazil (than the world average) has increased the country’s share in global aquaculture, in terms of volume, from 0.1 percent in 1987 to 0.5 percent in 2017, and in terms of value, from 0.3 percent to 0.6 percent. Despite its less than 1 percent share in global aquaculture, Brazil is nevertheless a regional aquaculture powerhouse. Its 595 000 tonnes of aquaculture production in 2017 was the second largest (next only to Chile) in Latin America and the Caribbean (LAC), and the country’s quantity share in aquaculture production in LAC has doubled, from 10 percent in 1987 to 20 percent in 2017. Considering its abundant natural resource endowments (e.g. 6 percent of world total land area, including inland water surface area; 4 percent of world total surface area of inland waterbodies; and 16 percent of world total renewable water resources)5 and status as one of the largest soybean producers, Brazil’s current contribution of less than 1 percent to global aquaculture may be far below its potential as regards fish farming. The rapid aquaculture growth in Brazil reflects the emergence of fish farming as a viable economic activity for rural farmers since the 1990s, strengthened by the establishment of the Special Fishing and Aquaculture Secretariat in 2003 and the Ministry of Fisheries and Aquaculture in 2009. The Ministry of 1 Unless specified otherwise, tilapia in this document includes tilapias and other cichlids (i.e. species of the family Cichlidae). 2 Unless specified otherwise, FAO (2019a) is the source of aquaculture production statistics used in this document. 3 Unless specified otherwise, the scope applies to aquaculture production in this document. 4 Similar assessments have been conducted on five major tilapia farming countries in Africa (FAO, 2017). 5 Calculated by WAPI Natural Resources Module, a data analysis tool developed by FAO based on various data sources, including the FAO AQUASTAT Main Database and FAOSTAT Land Cover Database, among others; www.fao.org/fishery/statistics/software/wapi/en

2
Fisheries and Aquaculture has designed and implemented a series of public policies to promote aquaculture development in the country, such as specific loans for fish farmers, production regulations for aquaculture in public reservoirs, and financial support for fish processing plants and cold trucks. The efforts have resulted in more resources being allocated to the sector, increased the public perception of aquaculture as a non-trivial food production sector, and inspired appreciation of its contribution to job creation and social development programmes. The enabling environment has motivated the entry of large enterprises in the sector and the emergence of auxiliary industries around the aquaculture production centres to form aquaculture clusters. According to the latest statistics available at the time of writing, 2 910 out of the total 5 570 municipalities in Brazil have registered aquaculture production. Tilapia has been the largest aquaculture item in Brazil, with its share in the country’s aquaculture production quantity increased from 19 percent in 1997 to 49 percent in 2017. Brazil’s share in the global tilapia aquaculture production quantity has increased from 1.9 percent in 1997 to 4.9 percent in 2017, making it the fifth largest farmed tilapia producers among the 127 countries (or territories)6 that have tilapia aquaculture production in 2017 recorded in the FAO statistics (FAO, 2019a). Brazil has been constantly trying to modernize its aquaculture sector over the past two decades through sustainably intensifying traditional farming systems (primarily earthen pond farming and cage culture). Productivity gain in these systems through more experienced and efficient farming practices has been the main driving force behind the country’s rapid growth in aquaculture production. Since the end of the 1990s, fish farmers in Brazil have been paying increasing attention to cost reduction, improvement of the quality and competitiveness of their products, and interactions between fish farming activities and the environment and natural resources. The auxiliary industries (e.g. aquafeed production) increasingly appreciate the potential of aquaculture and devote more efforts to serving the sector. The instatement of the right to using public spaces (including the federal and state lands) has facilitated adoption of new farming systems or practices. For example, farming fish in floating cages was very rare in the 1990s, in spite of the country’s abundant natural resources for cage farming. With the right to using public reservoirs for aquaculture established, cage farming has become increasingly popular. However, various legal or regulatory hindrances (e.g. restrictive or cumbersome environmental licensing and permit procedures) are one of the main constraints over aquaculture development in Brazil. The unstable administrative environment (e.g. the closing of the Ministry of Fisheries and Aquaculture in 2015) has also caused disturbance to the fledgling sector. This paper assesses the tilapia sector in Brazil with a focus on its social and economic performance. Section 2 discusses tilapia aquaculture and value chain in Brazil. Section 3 assesses the social and economic performance of tilapia farming in Brazil and discusses the role of governance in aquaculture development in Brazil. Section 4, the last section, concludes the paper with further discussion of some key issues.
6 Unless specified otherwise, in this document the term country includes non-sovereign territory.

3
2. TILAPIA AQUACULTURE PRODUCTION AND VALUE CHAIN
Brazil’s 595 000 tonnes of aquaculture production in 2017 is composed of primarily finfish (86.4 percent), whereas the rest, 13.6 percent, is composed of 10.1 percent of crustaceans (primarily marine shrimp, Penaeus vannamei, and a small amount of freshwater prawn, Macrobrachium rosenbergii); 3.5 percent of molluscs (primarily South American rock mussel, Perna perna, and a small amount of cupped oysters, Crassostrea spp.); and 0.03 percent of miscellaneous aquatic animals (frogs and turtles). Freshwater fishes dominate finfish aquaculture in Brazil. Tilapias are the largest species group, accounting for nearly half of Brazil’s aquaculture production in 2017 (Figure 1). Characins are the second largest group. The 179 260 tonnes of farmed characins account for 30 percent of production, including primarily tambaqui aka cachama (Colossoma macropomum; 105 000 tonnes), its hybrids such as tambacu hybrid (Piaractus mesopotamicus × C. macropomum; 35 800 tonnes) and tambatinga hybrid (C. macropomum × P. brachypomus; 6 500 tonnes), and Pacu (P. mesopotamicus; 13 200 tonnes). Carps, catfishes and bonytongues (primarily Arapaima) are other major freshwater fishes in the top 10 groups, accounting for, respectively, 3.2 percent, 2.7 percent and 0.7 percent of the total production (Figure 1). Carps used to be the largest aquaculture item in Brazil with 55 000 tonnes of production in 2000, which nevertheless declined to 19 000 tonnes in 2017 (Figure 2).
Figure 1: Top 10 aquaculture species groups in Brazil, 2017
Data source: FAO Global Fishery and Aquaculture Production Statistics v2019.1.0, published through FishStatJ (March 2019; www.fao.org/fishery/statistics/software/fishstatj/en). Notes: For clarity, small slides in the pie chart may not be labelled. Constructed by the FAO WAPI Aquaculture Production Module (WAPI-AQPRN); see Figure 1.2 in WAPI-AQPRN v.2018.1 for an example (www.fao.org/fishery/statistics/software/wapi/en); see FAO (2019b) for more information. Most species groups are the same as ISSCAAP groups under the International Standard Statistical Classification of Aquatic Animals and Plants (ISSCAAP). Marine shrimps and prawns is the same as the ISSCAAP group “shrimps, prawns”. Characins, catfishes and bonytongues are three subgroups of the ISSCAAP group “miscellaneous freshwater fishes”; their taxonomic scope noted in parenthesis. Freshwater fishes nei is an ASFIS species item (its scientific name in parenthesis) reported in FAO statistics; more information about the ASFIS list of aquatic species can be found at www.fao.org/fishery/collection/asfis/en. Species not included in the top 10 groups are grouped into “other species”.
290 075
179 260
60 000
18 900
18 200
16 000
4 200
3 330
2 700
2 000
335
1. Tilapias and other cichlids (ISSCAAP group)
2. Characins (Characiformes)
3. Marine shrimps and prawns (ISSCAAP group)
4. Carps, barbels and other cyprinids (ISSCAAP group)
5. Mussels (ISSCAAP group)
6. Catfishes (Siluriformes)
7. Bony tongues (Osteoglossiformes)
8. Freshwater fishes nei (Osteichthyes)
9. Oysters (ISSCAAP group)
10. Salmons, trouts, smelts (ISSCAAP group)
Other species
tonn
es
Aquaculture production in 2017: 595 000 tonnes
48.8%
30.1%
10.1%
3.2%3.1% 2.7% 0.7%

4
Driven by strong foreign demand, shrimp farming in Brazil (predominantly whiteleg shrimp, Penaeus vannamei) grew rapidly, from 2 000 tonnes in 1995 to 90 000 tonnes in 2003, yet started declining in 2004 due to the negative impact of the appreciation of the Real (the Brazilian currency) on its shrimp export. Combined with other problems such as diseases, the country’s shrimp farming production decreased to 60 000 tonnes in 2017 (Figure 2), mostly consumed by the domestic market (Rocha and Mendonça, 2015; Rezende and Mataveli, 2017). In contrast, molluscs aquaculture in the country (mostly South American rock mussel Perna perna) has gradually grown, from 3 000 tonnes in 1995 to 21 000 tonnes in 2017 (Figure 2). 2.1 Farmed tilapia production
In the 1950s, redbreast tilapia (Tilapia rendalli) was introduced in Brazil as a restocking species for capture fisheries. In the 1970s, the National Department of Works against Droughts (DNOCS) introduced Nile tilapia (Oreochromis niloticus) and Zanzibar tilapia (O. urolepis hornorum) in Ceará State reservoirs, located in the northeast region, to increase local fisheries output. In the 1980s, tilapia, along with other native species, was farmed for fee-fishing and has become better known to big markets near large states (e.g. São Paulo). However, the problem of off-flavor due to inappropriate farming practices has been a negative factor deterring consumers’ acceptance of farmed tilapia. In FAO statistics, tilapia has been recorded as a distinct species group in Brazil’s aquaculture production from 1995 onwards.7 The data indicate that, on average, tilapia aquaculture production in Brazil grew
7 It is recorded implicitly as part of “miscellaneous freshwater fishes” prior to 1995.
Figure 2: Status and trends of aquaculture production in Brazil by major species groups
Data source: FAO Global Fishery and Aquaculture Production Statistics v2019.1.0, published through FishStatJ (March 2019; www.fao.org/fishery/statistics/software/fishstatj/en). Notes: Constructed by the FAO WAPI Aquaculture Production Module (WAPI-AQPRN); see Figure 4.1 in WAPI-AQPRN v.2018.1 for a prototype (www.fao.org/fishery/statistics/software/wapi/en). Tilapia represents the ISSCAAP group “Tilapias and other cichlids”. Characins is a subgroup of the ISSCAAP group “miscellaneous freshwater fishes”, including freshwater fishes of the order Characiformes. Marine shrimps and prawns represents the ISSCAAP group “shrimps, prawns”. Carps represents the ISSCAAP group “Carps, barbels and other cyprinids”. Molluscs is an ISSCAAP division.
12 32
68
155
290
6 27
56
120
179
2
25
63 69 60
17
55 42
28 19 3
13 15 16 21
0
50
100
150
200
250
300
350
1995 2000 2005 2010 2017
Thou
sand
tonn
es
Tilapia Characins Marine shrimps and prawns Carps Molluscs

5
5 400 tonnes annually, from 12 000 tonnes in 1995 to 71 000 tonnes in 2006, then followed a steeper upward trend to grow, on average, 20 000 tonnes annually to 290 000 tonnes in 2017 (Figure 3).8 In 1995, Brazil’s farmed tilapia production was less than captured tilapia production and accounted for only 40 percent of the country’s total farmed and wild tilapia production, yet the share was increased to over 90 percent since 2015 (Figure 3). At the same time, the share of farmed tilapia in total aquaculture production increased from 26 percent in 1995 to 49 percent in 2017, and the share of farmed tilapia in total aquaculture and fisheries production increased from 2 percent to 22 percent (Figure 3).
Several driving forces have contributed to the rapid development of tilapia aquaculture in Brazil (Kubitza, 2015). First, the improvement of seed quality through the use of fast-growing genetically improved farmed tilapia (GIFT) strains and monosex farming technology has shortened the grow-out phase, increased productivity, and allowed for the harvest of large-size tilapias that are favoured by local consumers over smaller wild tilapia captured in reservoirs. Second, the adoption of low-volume, high-density (LVHD) cage farming technology has facilitated rapid expansion of tilapia cage farming in the southeastern states (São Paulo and Minas Gerais) and northeast states (Ceará, Bahia and Pernambuco). Third, the development of the animal feed industry in Brazil has provided a stable supply of good quality feed for tilapia and fish farming in general. Lastly, the large domestic market has absorbed most farmed tilapia production in Brazil.
8 In Brazil, the statistical methodology as well as the organizations responsible for measuring fish production have been changed several times. While the FAO statistics on fish production in Brazil are consistent with the official data in Brazil, they are lower than some estimations of the private sector. According to data of the Brazilian Aquaculture Association – Peixe BR – tilapia aquaculture production in Brazil was 275 000 tonnes in 2014, 315 000 tonnes in 2015, and 330 00 tonnes in 2016.
Figure 3: Contribution of tilapia to aquaculture and fisheries production in Brazil
Data source: FAO Global Fishery and Aquaculture Production Statistics v2019.1.0, published through FishStatJ (March 2019; www.fao.org/fishery/statistics/software/fishstatj/en). Notes: Constructed by the FAO WAPI Aquaculture Production Module (WAPI-AQPRN); see Figure 5.2 in WAPI-AQPRN v.2018.1 for an example. www.fao.org/fishery/statistics/software/wapi/en
0
10
20
30
40
50
60
70
80
90
100
0
30 000
60 000
90 000
120 000
150 000
180 000
210 000
240 000
270 000
300 000
Shar
e (%
)
Prod
uctio
n (t
onne
s)
Farmed tilapia production (tonnes) Wild tilapia production (tonnes)% of farmed tilapia in total farmed and wild tilapia production % of farmed tilapia in total aquaculture production% of farmed tilapia in total aquaculture and fisheries production

6
In Brazil, tilapia farming is forbidden by law in the Brazilian Amazon region. Therefore, tilapia aquaculture production in Brazil is concentrated in the south, the east and the northeastern part of the country (Figure 4), where tilapia farmers and other players on the tilapia value chain are clustered into different tilapia production centres. Tilapia farming technologies and practices vary across different tilapia production centres and within a centre.
Figure 4: Regional distribution of tilapia aquaculture production in Brazil
Source: Adapted from the Brazilian Institute of Geography and Statistics (IBGE). Brazilian Federative States are the following: AC – Acre; AL – Alagoas; AM – Amazônia; AP – Amapá; BA – Bahia; CE – Ceará; ES – Espirito Santo; GO – Goiás; MA – Maranhão; MG – Minas Gerais; MS – Mato Grosso do Sul; MT – Mato Grosso; PA – Pará; PB – Paraíba; PE – Pernambuco; PI – Piauí; PR – Paraná; RJ – Rio de Janeiro; RN – Rio Grande do Norte; RO – Rondônia; RR – Roraima; RS – Rio Grande do Sul; SC – Santa Catarina; SE – Sergipe; SP – São Paulo; TO – Tocantins.
0°
30°S
20°S
10°S
70°W 60°W 50°W 40°W
Farmed tilapia production (tonnes)
20–100
101–500
501–1 000
1 001–5 000
5 001–15 000
15 001–50 000
50 001–100 000

7
2.2 Tilapia farming as a technology and knowledge-intensive business
In Brazil, technological solutions or advancements have been constantly adopted to facilitate production and improve productivity in tilapia farming. High-quality commercial feed, improved strains, vaccines, aerators, automatic fish counters, automatic sorters for grading juveniles (e.g. grading tables), automatic feeders, mechanical harvesting equipment and management software have been commonly adopted in every production centre, whereas in mid- or large-volume cage farms, feed silos and solar panels have become increasingly popular (Table 1). Compared to expansion of the production scale, knowledge and innovation have become more important to productivity and competitiveness, and the industry has been moving towards an increasingly technological and knowledge-intensive business. Table 1: Examples of technologies commonly adopted in tilapia farming in Brazil
Technology Main impacts
Mid-volume cages Economies of scale through reducing labour costs and increasing production and logistics optimization
Grading table Labour cost reduction; efficiency gain in fish handling
Aerator Increasing the carrying capacity of pond or cage systems (e.g. higher stocking density or larger harvest size)
Automatic feeders Reduction of labour costs; efficiency gain in feed management
Feed silo Greater feed cost reduction by purchasing bulk feed; mostly found in southern and southeastern centres
Mechanical harvesting Labour cost reduction and logistical optimization
Management software Better farm management, such as feeding optimization, waste reduction and optimal harvesting scheme
Source: Barroso et al. (2018). 2.3 Farming systems
Earthen ponds and floating cages are two main tilapia farming systems in Brazil, thanks to abundant land and water resources suitable for aquaculture in the country. As tilapia is a relatively low-valued species, more sophisticated, expensive farming systems (e.g. greenhouses for overwintering, recirculation aquaculture systems or bioflocs) are usually adopted in places with less conducive farming environments (e.g. cold weather or lack of water resources) or for special purposes (e.g. maintenance of broodstock and/or germplasm). Earthen ponds The earthen pond is the traditional fish farming system in Brazil. In western Paraná, the largest tilapia production centre contributing 32 percent of Brazil’s tilapia production in 2016, is mostly pond based. A neighbouring southern state, Santa Catarina, also has substantial tilapia production from pond-based operations (Figure 4). A key factor behind the long-term success of tilapia pond culture in the two southern states is the existence of effective farmer organizations (including rural cooperatives) in the states for decades, which provide material inputs (fingerlings, feed, etc.), services (farm construction, harvesting, transport, documentation and licensing, etc.) and technical assistance (extension) to member farmers.
8
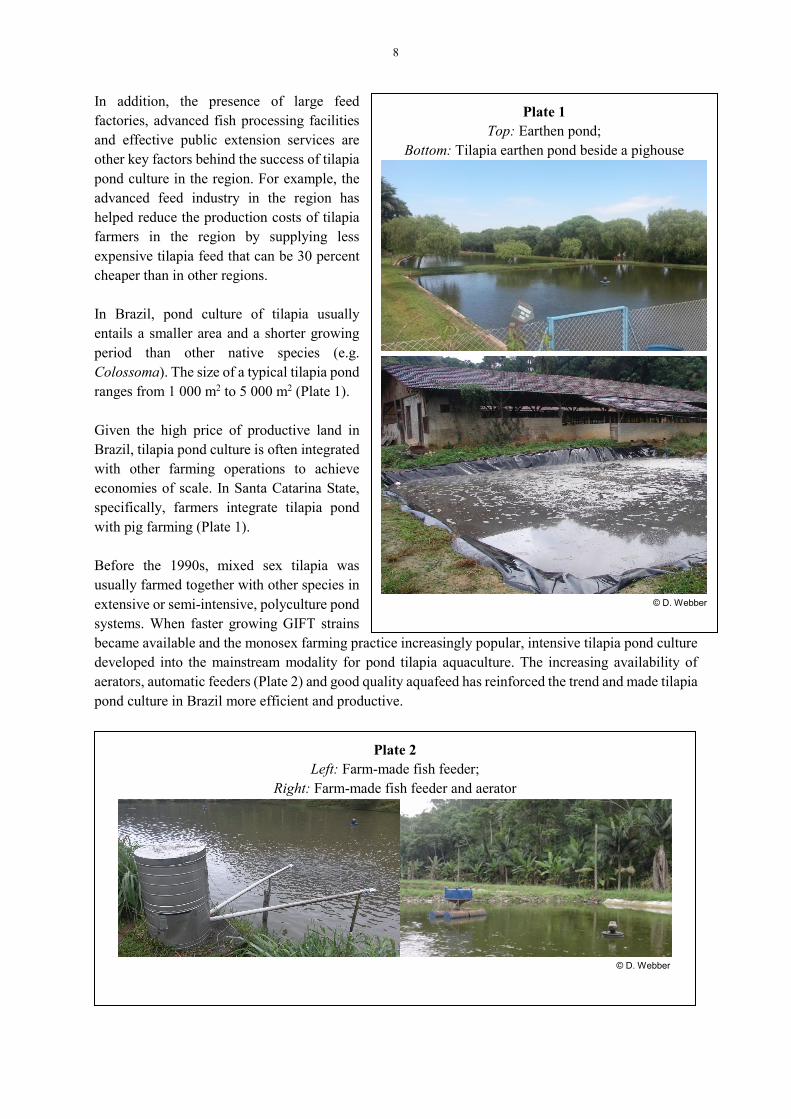
In addition, the presence of large feed factories, advanced fish processing facilities and effective public extension services are other key factors behind the success of tilapia pond culture in the region. For example, the advanced feed industry in the region has helped reduce the production costs of tilapia farmers in the region by supplying less expensive tilapia feed that can be 30 percent cheaper than in other regions. In Brazil, pond culture of tilapia usually entails a smaller area and a shorter growing period than other native species (e.g. Colossoma). The size of a typical tilapia pond ranges from 1 000 m2 to 5 000 m2 (Plate 1). Given the high price of productive land in Brazil, tilapia pond culture is often integrated with other farming operations to achieve economies of scale. In Santa Catarina State, specifically, farmers integrate tilapia pond with pig farming (Plate 1). Before the 1990s, mixed sex tilapia was usually farmed together with other species in extensive or semi-intensive, polyculture pond systems. When faster growing GIFT strains became available and the monosex farming practice increasingly popular, intensive tilapia pond culture developed into the mainstream modality for pond tilapia aquaculture. The increasing availability of aerators, automatic feeders (Plate 2) and good quality aquafeed has reinforced the trend and made tilapia pond culture in Brazil more efficient and productive.
Plate 1 Top: Earthen pond;
Bottom: Tilapia earthen pond beside a pighouse
© D. Webber
Plate 2 Left: Farm-made fish feeder;
Right: Farm-made fish feeder and aerator
© D. Webber

9
The productivity of tilapia pond culture varies in different states. Small-scale pond tilapia culture can be found in many states; the operations are often extensive in nature with a low yield of usually no more than 10 tonnes per ha per crop. However, semi-intensive or intensive tilapia pond culture in the southern states can have a higher yield, up to 40 tonnes per ha per crop. The productivity of tilapia pond culture can vary in the same place because of different farming practices. As indicated in Table 2, the productivity of tilapia farming in Santa Catarina varies across three common pond culture systems, from an average of 5 tonnes per ha per year for extensive tilapia pond culture integrated with pig farming with no supplement feeds, to an average of 13 tonnes per ha per year for the MAVIPI9 system (Tamassia, 2011) and to 22 tonnes per ha per year for semi-intensive monoculture of tilapia with commercial feed. It is worth noting that while the less intensive systems produce at a lower yield, their unit production costs could also be lower (i.e. USD 0.43 for the extensive system, USD 0.63 for MAVIPI and USD 0.93 for the semi-intensive system; Table 2). Table 2: Three common tilapia pond culture systems in Santa Catarina, Brazil
Indicators
Integrated with pig farming
with no supplement
feeding
Integrated tilapia-pig
farming with supplement
feed (the MAVIPI system)
Semi-intensive system with commercial
feed
Average productivity (tonnes/ha/year) 5 13 22 Average growing period (months) 14 10 7 Average unit production cost aka break-even price (USD/kg of production)
0.43 0.63 0.93
Source: Silva et al., 2017 Note: Based on 2015 data. Floating cages Farming fish in floating cages has become increasingly popular in Brazil, and the share of cage culture in the country’s tilapia aquaculture production has increased to 30 percent in the past five years. Two major driving forces behind the trend are the availability of a large number of public reservoirs and increasingly expensive land resources in Brazil. Brazil has numerous public reservoirs that are primarily used for generation of hydroelectric power. The Brazilian legal framework allows the usage of up to 1 percent of the reservoir surface for aquaculture activities. Thus, federal reservoirs would have the capacity to produce 3.8 million tonnes of farmed fish; there are also a number of state and municipal reservoirs available for aquaculture. The areas that have been requested for cage farming are enough to produce 1.8 million tonnes of farmed fish.
9 MAVIPI – acronym in Portuguese for Modelo de Alto Vale do Itajaí de Pisicultura Integrada – is an integrated fish farming model, a symbiotic tilapia-pig farming system in ponds with supplementary fish feed adopted in family farms in Santa Catarina State.
10
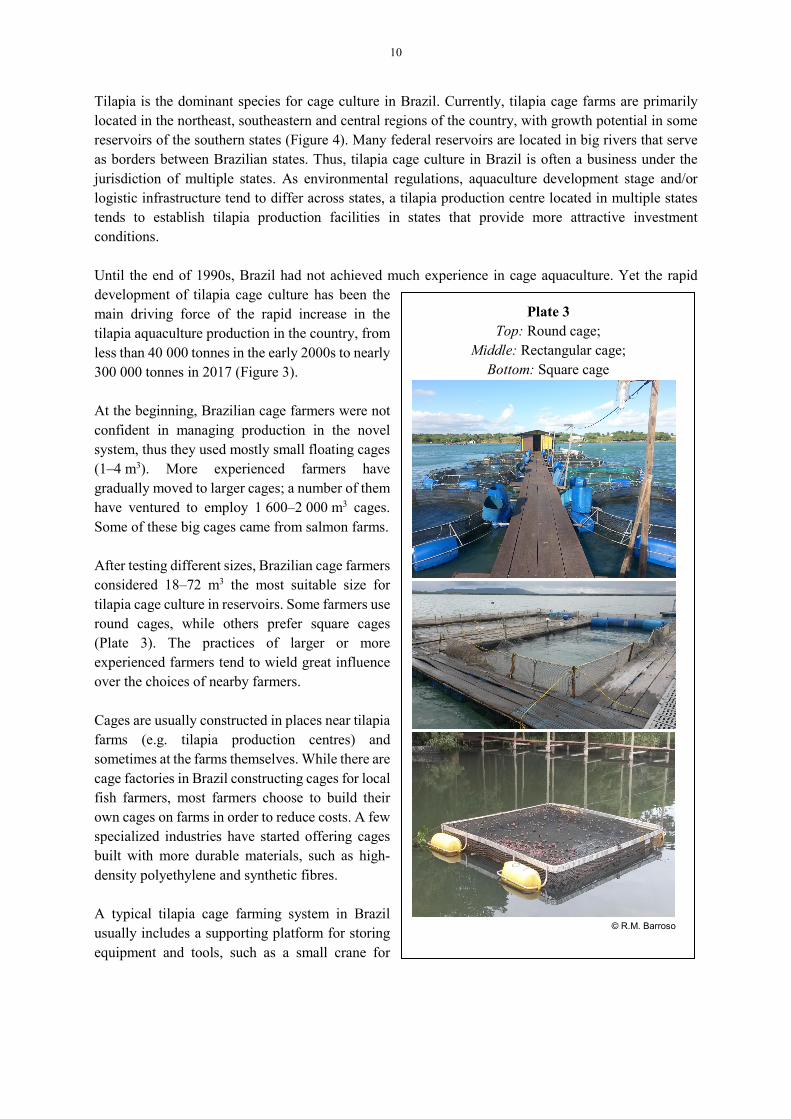
Tilapia is the dominant species for cage culture in Brazil. Currently, tilapia cage farms are primarily located in the northeast, southeastern and central regions of the country, with growth potential in some reservoirs of the southern states (Figure 4). Many federal reservoirs are located in big rivers that serve as borders between Brazilian states. Thus, tilapia cage culture in Brazil is often a business under the jurisdiction of multiple states. As environmental regulations, aquaculture development stage and/or logistic infrastructure tend to differ across states, a tilapia production centre located in multiple states tends to establish tilapia production facilities in states that provide more attractive investment conditions. Until the end of 1990s, Brazil had not achieved much experience in cage aquaculture. Yet the rapid development of tilapia cage culture has been the main driving force of the rapid increase in the tilapia aquaculture production in the country, from less than 40 000 tonnes in the early 2000s to nearly 300 000 tonnes in 2017 (Figure 3). At the beginning, Brazilian cage farmers were not confident in managing production in the novel system, thus they used mostly small floating cages (1–4 m3). More experienced farmers have gradually moved to larger cages; a number of them have ventured to employ 1 600–2 000 m3 cages. Some of these big cages came from salmon farms. After testing different sizes, Brazilian cage farmers considered 18–72 m3 the most suitable size for tilapia cage culture in reservoirs. Some farmers use round cages, while others prefer square cages (Plate 3). The practices of larger or more experienced farmers tend to wield great influence over the choices of nearby farmers. Cages are usually constructed in places near tilapia farms (e.g. tilapia production centres) and sometimes at the farms themselves. While there are cage factories in Brazil constructing cages for local fish farmers, most farmers choose to build their own cages on farms in order to reduce costs. A few specialized industries have started offering cages built with more durable materials, such as high-density polyethylene and synthetic fibres. A typical tilapia cage farming system in Brazil usually includes a supporting platform for storing equipment and tools, such as a small crane for
Plate 3 Top: Round cage;
Middle: Rectangular cage; Bottom: Square cage
© R.M. Barroso

11
lifting cages, a small boat or canoe, automatic fish counters, grading tables, harvest nets, scales and buckets. The supporting platform can be anchored nearshore beside the cages (Plate 3 – top photo) or settled on the shore (Plate 4) when the farmer has access to the land in front of the farm. A common way for Brazilian farmers to get access to land is through land leases from other farmers, with the rentals paid in kind year-round through harvested crops (e.g. corn or soy). Cage farming in Brazil has been undergoing a trend of automation and mechanization (Plate 5), and the use of high-volume cages, grading tables, automatic feeders, solar panels, mechanic harvesting equipment, management software, etc., has been increasingly popular, especially for large-scale commercial farms with stronger financial capacities (Table 3).
Table 3: Technology trends for floating cage system
Technology adopted in cage systems Estimated cost (value in 2015)
High-volume cages 2 000 m3 (20 m × 20 m × 5 m); USD 37 356 per cage
Grading table USD 11 494
Automatic feeders USD 862/cage
Solar panels USD 431
Management software USD 2 011 (usually with an initial installation cost and a monthly fee)
In 2016, the average price of an 18-m3 floating cage in Brazil was R$ 1 200 (USD 400). Cage quality varies for different regions, depending upon accessibility to cage suppliers, availability of technical assistance, or farmers’ economic condition. Some regions have more uniform and better manufactured cages (Plate 5), whereas other regions have irregular shapes or sizes (Plate 6). Cages in the same area are often of the same shape and size, which indicates knowledge dissemination through peer learning. Cage quality is generally not a major factor affecting the performance of cage farming. What matters more is the efficiency and effectiveness of cage tilapia farming practices at different phases of tilapia growth. A typical tilapia cage farmer in Brazil has 7 to 12 years of experience in the business. The farmer grows tilapia in 18–108 m3 cages from an average 35 g fingerling (from a range of 25–45 g) to 700–1 000 g market-size tilapia (average 850 g) in 6 months in the northeast regions, or in 9 months in the southern states, with the average yield of 70–150 kg per m3 and 1.7 feed conversion ratio (FCR), depending on environmental factors (e.g. water quality) and technical factors (e.g. the farmer’s experience and skills). In 2016, a Brazilian average small-scale farmer could harvest 10–30 tonnes of tilapia per month from a 1 000–2 500 m3 cage system. The productivity of a medium farmer is 30–80 tonnes/month with a 2 500–5 000 m3 cage system, and a large farmer could harvest over 80 tonnes per month from a cage system over 5 000 m3 (Barroso et al., 2018).
Plate 4 A supporting platform for tilapia cage
farming in Ilha Solteira reservoir
© R.M. Barroso

12
Compared to pond systems, the advantages of cage tilapia culture in Brazil include: (i) relatively low construction cost (no need to dig ponds in productive land that has become increasingly expensive); (ii) no need to draw water to fill ponds; and (iii) no need to treat effluent water. However, cage tilapia culture in Brazil faces several environmental issues, including the following: (i) unbecoming weather conditions (e.g. high water temperature during the summer in the northeast and low water temperature during the winter in the southern and southeastern states); (ii) prolonged drought; (iii) water pollution such as eutrophication; and (iv) golden mussel (Limnoperna fortunei) infestations that reduce the productivity, increase the difficulties in maintenance, and reduce the lifespan of net cages. With the continuing trend of intensification, good farming practices have become increasingly important to keep fish healthy throughout the farming cycle.
Plate 5 Automation and mechanization in large-scale farms
© R.M. Barroso

13
2.4 Seed
In 2016, the fish seed industry in Brazil produced 1.1 billion fingerlings; the value of the fingerlings (USD 76 million) was 8 percent of the country’s finfish farming production value. The production of shrimp seeds (larvae and juveniles) was 12.7 billion in number and USD 33 million in value (13 percent of the shrimp farming production value); and that of molluscs seeds was 20.8 billion in number and USD 500 000 in value (3 percent of the molluscs farming production value) (IBGE, 2017).10 Tilapia species The introduction of tilapias to Brazil dates back to the 1950s when Oreochromis mossambicus and Tilapia rendalli were imported from Africa for restocking hydroelectric reservoirs. Afterwards, more tilapia species, including O. angolensis, O. niloticus, O. aureus and O. urolepis hornorum, were introduced as restocking species for improving the livelihood of the fishing community (especially small-scale fishers). With the help of the Centre for Research in Aquatic Animals (CPAA) of the Environmental Institute of Paraná and the Federal Rural University of Pernambuco in Recife, tilapia was introduced to Paraná State in the late 1970s. Success in the farming of the species has led to a booming tilapia aquaculture industry and the establishment of Brazil’s first tilapia processing plant in Paraná in the late 1980s. However, in the mid-1990s, the lack of broodstock together with poor tilapia seed production management culminated in a high rate of inbreeding for most commercial tilapia stocks in Paraná State (Zimmermann, 1999). In 1996, an Oreochromis niloticus strain from the Asian Institute of Technology (AIT) in Bangkok, Thailand, was introduced in Paraná (Zimmermann, 1999). The strain, known as
10 It should be noted that in the past 15 years the statistical methodology for measuring fish production in Brazil has changed three times because the responsibility for official data has been transferred among several Brazilian organizations.
Plate 6 Artisanal cage for tilapia farming
© R.M. Barroso

14
Chitralada, had several favourable traits (e.g. better domesticated, more cold-resistant and higher-fillet yield) and, therefore, rapidly became widespread (Zimmermann, 2000). Since the late 1990s, a variety of GIFT strains have been introduced in Brazil by private hatcheries or research institutes, including GIFT, GIFT Supreme, GIFT Spring and GIFT Aquamérica. Nowadays, the GIFT strains and Chitralada have become the major tilapia species farmed in Brazil. Hybridization There have been efforts in Brazil to produce monosex tilapia strain through hybridization (Greenfield, Lira and Jensen, 1973; Meschkat, 1975). In the early 1980s, researchers in DNOCS succeeded in producing a hybrid species (Oreochromis niloticus × O. urolepis hornorum), yet the fecundity was too low to meet the market demand. The use of pure specimens of O. urolepis hornorum and O. niloticus helped improve performance. Yet, with the increasing popularity of the GIFT strains and the maturity of the technology of hormone-induced sex reversal, the hybrid species has not become commercially established. Tilapia genetic improvement programmes One of the bottlenecks hindering tilapia farming in Brazil is the lack of diversified strains adapted to different farming conditions. While there have been genetic improvement programmes for tilapia in Brazil (led by a few specialists), the efforts have not resulted in commercial tilapia strains widely adopted in Brazil. One factor behind the lack of success is inadequate communication or coordination on the tilapia value chain in the country. Hatcheries do not properly advise outgrowers about the specific farming protocols or technical requirements needed to manage an improved strain; outgrowers have few ideas about the expected growth performance of the improved strain; and processing plants have difficulties in specifying a proper expected fillet yield for the improved strain. While the focus has been primarily on increasing weight gain and fillet yield, genetic improvement activities in Brazil should concentrate efforts regarding other factors, such as cold resistance, disease resistance, and suitability to specific farming systems or arrangements. The shortage of tilapia seed is another factor that aggravates the lack of genetic management in commercial tilapia farming in Brazil. Facing inadequate, irregular supply of tilapia seed (particularly in the cold season), farmers tend to source tilapia fry or fingerlings from different hatcheries in order to maintain a stable seed supply. Therefore, as many tilapia farmers in Brazil use more than one tilapia strains, the resulting genetic mixture makes it difficult to analyse the performance of each lineage. 2.5 Feed
Feed is usually the greatest cost item for tilapia farming. Brazil is no exception – the feed cost generally accounts for 70 percent of the total cost of tilapia cage farming and 60 percent pond culture in Brazil. Therefore, the price and quality of tilapia feed is a major factor affecting the performance of tilapia farming in the country. In 2017, tilapia farming in Brazil consumed 500 000 tonnes of aquafeed, which corresponds to around 90 percent of aquafeed produced in Brazil for omnivorous fish species (SINDIRAÇÕES, 2017). Most of the 500 000 tonnes of aquafeed (around 300 000 tonnes) were consumed in the tilapia production centres (Table 4). Feed production in regions with a cold winter is subject to seasonality, as feeding is reduced drastically during the over-winter period.

15
Tilapia feed prices vary across different tilapia production centres. For tilapia production centres in the south (e.g. western Paraná, northern Paraná, Ilha Solteira or Santa Catarina) where most tilapia feed in Brazil are produced, the feed prices tend to be cheaper, whereas tilapia feed prices in the northeastern centres (e.g. Sub-middle São Francisco or Ceará) could be 22 to 42 percent higher because of transport and other logistic costs (Table 4). Table 4: Utilization and prices of aquafeed used in tilapia production centres
Source: Barroso et al. (2018). Notes: Prices in 2016; USD 1 = R$ 3.48. Soybean and corn products are two main ingredients of tilapia feed used in Brazil. As the two feed ingredients can be suitable for human consumption, substantially using them to produce aquafeed could constitute competition for human food, which could create a negative impact on the food security of certain stakeholders. Controlling the quality of feed ingredients (e.g. avoiding fungus contamination in storage) is another challenge. Some tilapia pond farms in the southern and southeastern centres use feed silos to store feed purchased in bulk so as to reduce the feed cost (Plate 7). 2.6 Outgrowing
The growth performance of tilapia farming in Brazil has increased over time; e.g. the FCR of tilapia farming has dropped from 1.5–1.8 in the 1990s to 1.2–1.5 in the early 2010s (Table 5). Improved strains, better feed quality and better farming practices are key factors contributing to the performance improvement. Brazilian consumers in general prefer relatively large tilapia (average 800 g); 900–1200 g tilapia also have a
Tilapia production centre
Monthly aquafeed
consumption (tonnes)
Percentage produced within the
centre
Average aquafeed price (32 percent
crude protein)
Percentage higher than the lowest
benchmark (%) R$/kg USD/kg
South Western Paraná 10 000 100
0.85 0.24 Bulk price
1.40 0.45 Lowest benchmark
Northern Paraná 1 800 100 1.45 0.50 11 Ilha Solteira 4 500 100 1.44 0.51 13
North
Sub-middle São Francisco (SMSF)
3 500 35 1.68 0.55 22
Ceará 5 000 30 1.88 0.64 42
Plate 7 Feed silo on a tilapia pond farm in
western Paraná
© R.M. Barroso

16
strong local demand. Most processing plants in Brazil usually require at least 700 g whole fish for production of tilapia fillets. Therefore, tilapia farmers (both pond culture and cage culture) tend to rear tilapia in a relatively long period for a large harvest size (Table 6). The average FCR is 1.4 for pond culture and 1.5–1.6 for cage culture. The performance is compatible with experiences in other major tilapia farming countries, considering the intensive farming systems and relatively long growing period (which tend to negatively affect feed efficiency). Table 5: Growth performance of tilapia farming in Brazil (Nile tilapia, Oreochromis niloticus)
Year Farming system
Fingerling size (g)
Harvest size (g)
Growing period (days)
Feed conversion
ratio References
1998 Earthen pond n.a. 400 n.a. n.a. Ostrensky
and Boeger, 1998
1999 Raceways or cages 100 600 130 1.5 to 1.8 Kubitza,
1999
2000 Earthen pond n.a. 500 150 1.8 Kubitza, 2003
2000 Earthen pond 30 420 196 n.a. Jory, Alceste and Cabrera,
2000
2000–2004 Earthen pond n.a. 450 150 1.34 Hein and Brianese,
2004
2003 Cages n.a. 500 n.a. n.a. Kubitza, 2006
2009 Cages n.a. 600 160 n.a. Costa et al., 2009
2010 Cages 50 500 126 1.24 to 1.50 Mainardes Pinto et al.,
2011 Notes: n.a. = not available. Table 6: Common practices and performance of tilapia farming in Brazil, 2015
Region Average size (g) Growing
period (days)
Feed conversion
ratio
Production system Stocking Harvest
Western Paraná 0.5–3 750 270 1.4 Earthen pond Santa Catarina 0.5–3 650 250 1.4 Earthen pond Ilha Solteira 10–35 800 240 1.6 Cage Sub-middle São Francisco 20–40 > 1 000 210 1.6 Cage Castanhão 10–35 850 195 1.5 Cage
2.7 Fish health management
Tilapia is the only farmed fish species in Brazil with a specific vaccine and medication. This reflects the tendency of animal pharmaceutical companies to focus on fish commodities with a large market potential (e.g. salmons and tilapias). Because animal pharmaceutical companies in Brazil place great
17
confidence in the market prospect of tilapia, they devote resources to developing new veterinary products for facilitating fish health management in tilapia aquaculture. In Brazil, fingerling vaccination is generally a cost-effective way of tilapia health measurement. The cost of vaccination (including the material and labour costs) is around R$ 0.3 per fingerling (around 5 percent of the cost of production), while the effect is a 7 to 15 percent increase in the survival rate – vaccination administered before summer (from May to October) would tend to be more effective in that this helps protect the fish from bacterial blooms during the summer. Vaccination could also help improve the feed efficiency (e.g. reducing the FCR from 1.7 to 1.5–1.65). However, there is still ample room for improvement in fish health management in Brazil’s tilapia farming industry. Good aquaculture practices (footbath, quarantine, health certificate, etc.) are yet to be adopted in many farms. More disease-resistant strains would need to be developed. In light of the trend of intensification in tilapia farming, which would increase fish stress and reduce disease resistance, and the perennial occurrence of new tilapia diseases internationally, tilapia health management (or fish health management in general) should be included in the agendas of public policies as well as research and technological development. 2.8 Processing
Tilapia processing plants are common in all tilapia production centres. There are 22 tilapia processing plants in western Paraná (the production centre with the highest concentration of tilapia processing plants) that handle 68 000 tonnes of tilapia per year (average 3 000 tonnes per plant per year). Small processing plants have a much lower capacity, yet they are favoured by small-scale farmers because they tend to procure small quantities in high frequency. In Brazil, whole tilapia is usually sold fresh, gutted and head-on, whereas tilapia fillets usually are sold frozen with the skin, dark parts and spine residues removed. The fillet yield is between 28 percent and 35 percent (average 32 percent). This means that the production of 1 kg of tilapia fillets entails over 3 kg of raw tilapia material fish. Given the R$ 4.5 tilapia farmgate price and the 32 percent average fillet yield, the total production cost of tilapia fillet would be R$ 18.5/kg. The raw fish material accounts for 76 percent of the cost; the processing cost (mostly labour cost) 16 percent; packing 4.9 percent; and transport 2.7 percent (Table 7). This means that whole tilapia price is the main factor affecting the fillet price – a 100 percent increase of the tilapia farmgate price from R$ 4.5/kg to R$ 9/kg would raise the fillet production cost by 76 percent. Fillet yield is another major factor affecting the fillet cost (Table 7). An increase of the fillet yield by 1 percent above the average (i.e. from 32 percent to 33 percent) would reduce the fillet production cost by 2.3 percent. As larger and thicker fish fillets tend to render a better quality of dish in Brazilian cuisine, increasing the tilapia fillet size has become a notable trend in the Brazilian market (particularly in the northeastern and, to a lesser extent, in the southeastern regions). The trend has motivated tilapia farmers to alter farming arrangements towards the production of large-size tilapia. Farmers who can do so with a

18
relatively small increase in the production cost would enjoy the price premium for large-size tilapia awarded by the local market. Table 7: Cost structure of tilapia fillets in Brazil
Cost item
Fillet yield 28% 32% 35%
R$/kg
Share of total
cost (%)
R$/kg
Share of total
cost (%)
R$/kg
Share of total
cost (%)
Raw fish material (R$ 4.5/kg) 16.1 78.5 14.1 76.2 12.9 74.5 Processing 3.0 14.7 3.0 16.2 3.0 17.4 Packing 0.9 4.4 0.9 4.9 0.9 5.2 Transport 0.5 2.4 0.5 2.7 0.5 2.9 Total cost 20.5 100 18.5 100 17.3 100
2.9 Domestic fish market
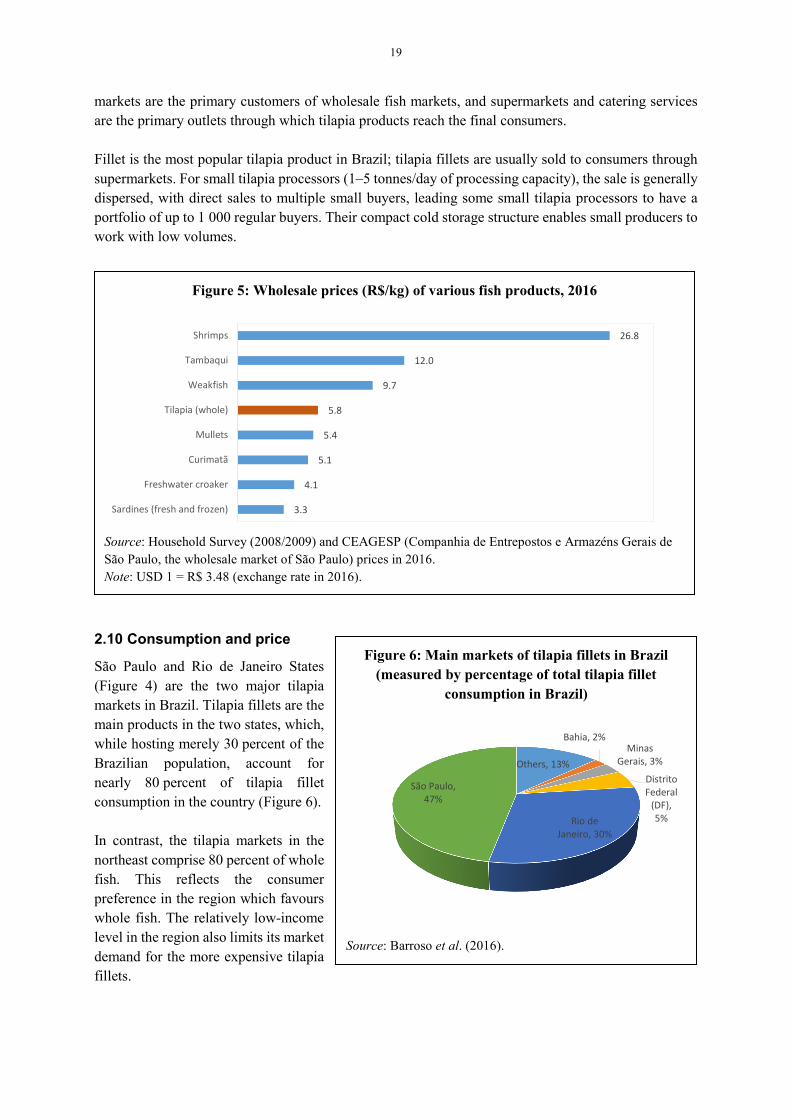
While generally well accepted in domestic markets, tilapia competes with a variety of other fish species (marine or freshwater; farmed or wild) for the purchasing power of Brazilian consumers. For whole tilapia, main competing species include weakfish (Cynoscion regalis or C. leiarchus), tucunaré (Cichla spp.), snapper (Pagrus), whitemouth croaker (Micropogonias furnieri) and dourada (Brachyplatystoma flavicans). For the tilapia fillet, main competing species include pollock, Pangasius catfishes, weakfish, sharks, cobia (Rachycentron canadum) and flatfishes. Based on the results of a survey conducted by Embrapa (Barroso, Pincinato and Muñoz, 2017) through interviewing fish retailers (including supermarkets and fishmongers), Table 8 shows the main substitutes for tilapia products in the retail markets of metropolitan regions (main seafood consumption centres), including Santa Catarina, Paraná, São Paulo, Rio de Janeiro, Ceará and Distrito Federal. The results indicate that tilapia competes with both low-valued species (e.g. weakfish, whitemouth croaker and sardines) and expensive fishes (e.g. flatfishes, sandperch, snapper and dourada) (Figure 5).
Table 8: Main substitutes of tilapia in retail markets in metropolitan regions of the main state capitals
State Main substitutes
Santa Catarina Pollock; weakfish and flatfish fillets
Paraná Weakfish and pollock fillets; sardines
São Paulo Weakfish and pollock fillets; sardines; mullets; snapper; flatfish
Rio de Janeiro Pollock and weakfish fillets
Ceará Pollock; weakfish; snapper
Distrito Federal Pollock; weakfish; flatfish; dourada; sand perch Tilapia products are distributed to markets all over Brazil through intermediate companies, including small-scale intermediaries, specialized seafood dealers and large chain retailers (Grupo Pão de Açucar, or GPA, Walmart, Carrefour, among others). Restaurants and fish vendors in farmers’ markets or small
19
markets are the primary customers of wholesale fish markets, and supermarkets and catering services are the primary outlets through which tilapia products reach the final consumers. Fillet is the most popular tilapia product in Brazil; tilapia fillets are usually sold to consumers through supermarkets. For small tilapia processors (1–5 tonnes/day of processing capacity), the sale is generally dispersed, with direct sales to multiple small buyers, leading some small tilapia processors to have a portfolio of up to 1 000 regular buyers. Their compact cold storage structure enables small producers to work with low volumes.
2.10 Consumption and price
São Paulo and Rio de Janeiro States (Figure 4) are the two major tilapia markets in Brazil. Tilapia fillets are the main products in the two states, which, while hosting merely 30 percent of the Brazilian population, account for nearly 80 percent of tilapia fillet consumption in the country (Figure 6). In contrast, the tilapia markets in the northeast comprise 80 percent of whole fish. This reflects the consumer preference in the region which favours whole fish. The relatively low-income level in the region also limits its market demand for the more expensive tilapia fillets.
Figure 5: Wholesale prices (R$/kg) of various fish products, 2016
Source: Household Survey (2008/2009) and CEAGESP (Companhia de Entrepostos e Armazéns Gerais de São Paulo, the wholesale market of São Paulo) prices in 2016. Note: USD 1 = R$ 3.48 (exchange rate in 2016).
3.3
4.1
5.1
5.4
5.8
9.7
12.0
26.8
Sardines (fresh and frozen)
Freshwater croaker
Curimatã
Mullets
Tilapia (whole)
Weakfish
Tambaqui
Shrimps
Figure 6: Main markets of tilapia fillets in Brazil (measured by percentage of total tilapia fillet
consumption in Brazil)
Source: Barroso et al. (2016).
Others, 13%
Bahia, 2%Minas
Gerais, 3%
Distrito Federal
(DF), 5%Rio de
Janeiro, 30%
São Paulo, 47%

20
Farmgate price In 2016, the average farmgate price of tilapia in Brazil was around R$ 4.50/kg (USD 1.29).11 The price appeared to be 16 percent lower than the USD 1.53 farmgate price in China (Fitzsimmons, 2016), yet it could give a productive farmer a 10 percent profit margin (equal to profit divided by revenue) (Barroso and Muñoz, 2017). This statistic differs from that of a decade ago when the profit margins of farmers were close to zero and much lower than the margins of processing plants or supermarkets (Kubitza, 2007). Even with better margins nowadays, tilapia farmers usually have little market power to pass a cost increase onto downstream players (e.g. processing plants or wholesalers) in the short term. The tilapia farmgate price in Brazil varies across regions due to not only the production cost but also the distribution cost. In 2016, the tilapia farmgate price varied from R$ 3.60 in Paraná to R$ 6.00 in Ceará. The farmgate price of tilapia sold to processing plants is generally lower than that sold to intermediate fish vendors (by 5 percent on average). In addition, processing plants tend to be less flexible in negotiations. Wholesale price CEAGESP in São Paulo is the largest wholesale fish market in Brazil and primarily supplies fish products to local restaurants and farmers’ markets that serve 40 million consumers. In 2016, the price of whole tilapia in CEAGESP varied from R$5.38 to R$ 6.03 per kg; and the average price (R$ 5.77 per kg) made it a medium-valued fish in the market (Figure 5). Retail prices In Brazil, the average retail price of whole tilapia in 2016 was R$ 13.62 (10 percent higher than the R$ 12.41 in 2015), whereas the average retail price of frozen tilapia fillet increased 20 percent, from R$ 30.02 in 2015 to R$ 35.94 in 2016 (Table 9).12 The increases in the retail prices of both products were higher than Brazil’s 6.3 percent inflation, measured by the Extended Consumer Price Index (IPCA), in 2016. The moderate 6.3 percent inflation (contributed by the economic recession in Brazil) was within the limits set by the National Monetary Council (CMN), i.e. 4.5 percent plus or minus 2 percent. Considering a more extended time frame, from the beginning of the price collections by Embrapa (4th quarter of 2014) until the end of 2016, the average retail price of whole tilapia increased 12 percent, whereas that of frozen tilapia fillet increased 64 percent. During the same time period, Brazil’s IPCA increased 19 percent. Tilapia retail prices fluctuate throughout the year and are usually higher in the first half of the year, especially during Holy Week (Easter) when the highest sales volumes occur (Table 9; Figure 7). Both the whole and fillet prices have much larger seasonal variation than the consumer price index (IPCA) (Figure 7).
11 US$ 1 = R$ 3.48 (exchange rate in 2016). 12 Based on the Market Information of Tilapia produced by Embrapa Fisheries and Aquaculture.

21
Table 9: Tilapia retail prices in Brazil
Region Product
Tilapia retail price in Brazil (R$/kg)
2014 2015 2016
Q3 Q4 Q1 Q2 Q3 Q4 Average Q1 Q2 Q3 Q4 Average
Santa Catarina (SC)
Whole fish
9.00 9.80 12.00 11.33 11.70 13.23 12.07 13.23 10.99 n.a. n.a. 12.11
Ceará (CE) 9.76 10.91 10.54 11.51 11.70 11.63 11.35 11.92 12.53 14.69 13.81 13.24
São Paulo (SP) 11.74 13.08 12.09 14.43 12.94 14.11 13.39 13.35 14.51 16.55 14.34 14.69
Rio de Janeiro (RJ) 11.97 11.82 12.60 12.91 13.99 12.04 12.89 10.33 14.01 13.12 17.77 13.81
Paraná (PR) 17.95 17.68 10.87 14.98 12.50 14.61 13.24 9.90 19.45 n.a. 15.75 15.03
Distrito Federal (DF) n.a. 11.11 11.56 10.55 11.52 12.44 11.52 10.99 13.60 11.64 11.64 11.97
Brazil average 12.08 12.40 11.61 12.62 12.39 13.01 12.41 11.62 14.18 14.00 14.66 13.62 Santa Catarina (SC)
Frozen fillet
26.57 24.37 25.00 28.43 27.81 32.45 28.42 39.89 34.35 34.73 32.30 35.32
Ceará (CE) 25.36 29.22 31.70 26.08 24.31 25.09 26.80 27.50 28.13 29.17 37.35 30.54
São Paulo (SP) 28.99 31.51 30.76 32.99 30.49 42.65 34.22 48.24 44.74 40.75 34.91 42.16
Rio de Janeiro (RJ) 21.81 27.39 27.61 33.16 32.57 36.11 32.36 38.85 37.61 36.27 35.86 37.15
Paraná (PR) 28.54 26.77 23.35 31.14 25.46 32.15 28.03 33.47 33.06 33.98 33.35 33.47
Distrito Federal (DF) n.a. 29.04 26.49 32.00 28.98 33.60 30.27 40.29 36.91 36.95 33.79 36.98
Brazil average 21.88 28.05 27.49 30.63 28.27 33.68 30.02 38.04 35.80 35.31 34.59 35.94 Source: Based on the Market Information of Tilapia produced by Embrapa Fisheries and Aquaculture. Notes: USD 1 = R$ 3.48 (exchange rate in 2016). n.a. = not available.

22
Figure 7: Seasonal fluctuations of tilapia retail prices in Brazil
Sources: Tilapia price indices calculated based on Table 9; IPCA from the Brazilian Institute of Geography and Statistics (IBGE). Notes: SC – Santa Catarina; CE – Ceará; SP – São Paulo; RJ – Rio de Janeiro; PR – Paraná; DF – Distrito Federal. The whole tilapia price (or frozen tilapia fillet price) in 2015 Q1 in each state is set as the benchmark price (i.e. the price index being 100) for the state, based on which each state’s price indices in other quarters are calculated.
-
50
100
150
200
250
SC CE SP RJ PR DF IPCA
(a) Whole tilapia
2015Q1 (benchmark = 100) 2015Q2 2015Q3 2015Q4
-
50
100
150
200
250
SC CE SP RJ PR DF IPCA
(b) Frozen tilapia fillet
2015Q1 (benchmark = 100) 2015Q2 2015Q3 2015Q4
23
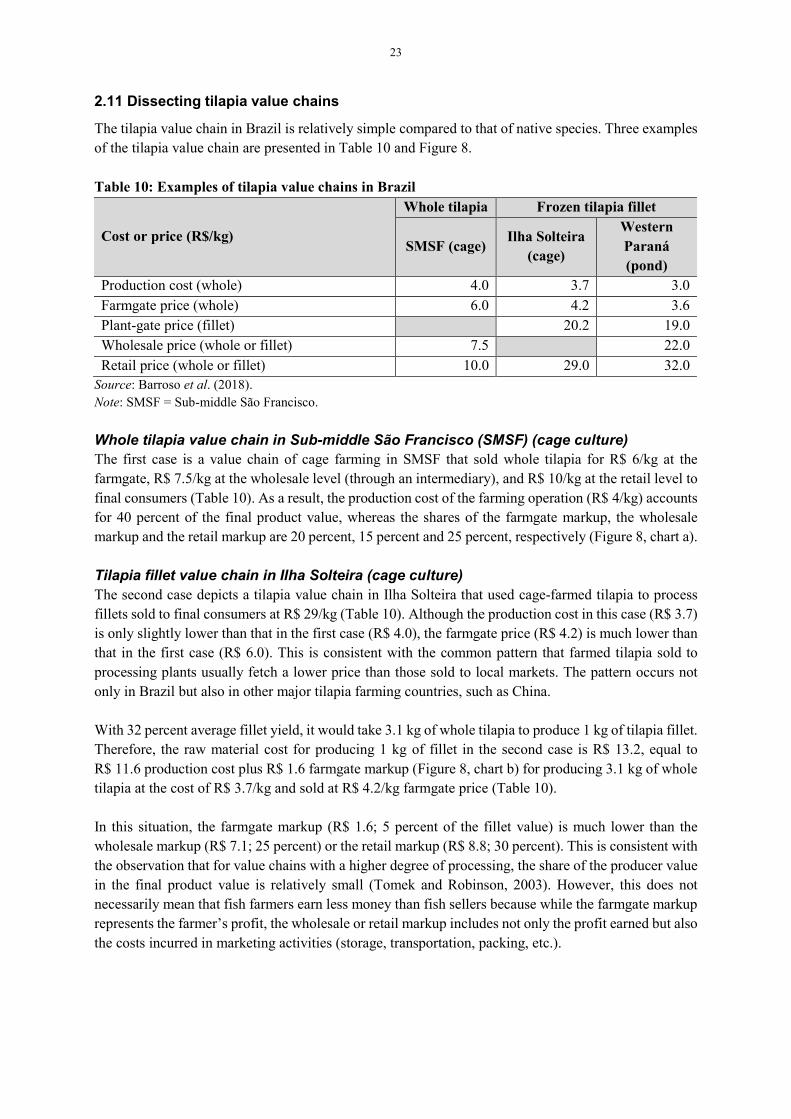
2.11 Dissecting tilapia value chains
The tilapia value chain in Brazil is relatively simple compared to that of native species. Three examples of the tilapia value chain are presented in Table 10 and Figure 8. Table 10: Examples of tilapia value chains in Brazil
Cost or price (R$/kg)
Whole tilapia Frozen tilapia fillet
SMSF (cage) Ilha Solteira
(cage)
Western Paraná (pond)
Production cost (whole) 4.0 3.7 3.0 Farmgate price (whole) 6.0 4.2 3.6 Plant-gate price (fillet) 20.2 19.0 Wholesale price (whole or fillet) 7.5 22.0 Retail price (whole or fillet) 10.0 29.0 32.0
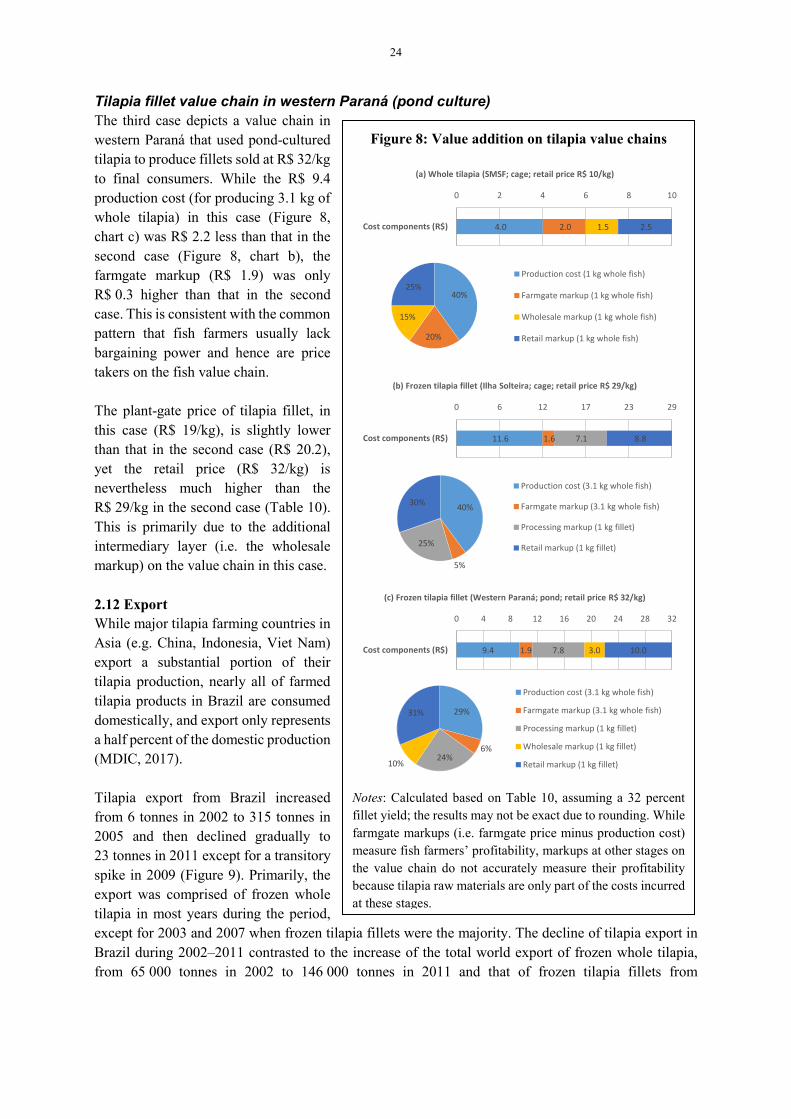
Source: Barroso et al. (2018). Note: SMSF = Sub-middle São Francisco. Whole tilapia value chain in Sub-middle São Francisco (SMSF) (cage culture) The first case is a value chain of cage farming in SMSF that sold whole tilapia for R$ 6/kg at the farmgate, R$ 7.5/kg at the wholesale level (through an intermediary), and R$ 10/kg at the retail level to final consumers (Table 10). As a result, the production cost of the farming operation (R$ 4/kg) accounts for 40 percent of the final product value, whereas the shares of the farmgate markup, the wholesale markup and the retail markup are 20 percent, 15 percent and 25 percent, respectively (Figure 8, chart a). Tilapia fillet value chain in Ilha Solteira (cage culture) The second case depicts a tilapia value chain in Ilha Solteira that used cage-farmed tilapia to process fillets sold to final consumers at R$ 29/kg (Table 10). Although the production cost in this case (R$ 3.7) is only slightly lower than that in the first case (R$ 4.0), the farmgate price (R$ 4.2) is much lower than that in the first case (R$ 6.0). This is consistent with the common pattern that farmed tilapia sold to processing plants usually fetch a lower price than those sold to local markets. The pattern occurs not only in Brazil but also in other major tilapia farming countries, such as China. With 32 percent average fillet yield, it would take 3.1 kg of whole tilapia to produce 1 kg of tilapia fillet. Therefore, the raw material cost for producing 1 kg of fillet in the second case is R$ 13.2, equal to R$ 11.6 production cost plus R$ 1.6 farmgate markup (Figure 8, chart b) for producing 3.1 kg of whole tilapia at the cost of R$ 3.7/kg and sold at R$ 4.2/kg farmgate price (Table 10). In this situation, the farmgate markup (R$ 1.6; 5 percent of the fillet value) is much lower than the wholesale markup (R$ 7.1; 25 percent) or the retail markup (R$ 8.8; 30 percent). This is consistent with the observation that for value chains with a higher degree of processing, the share of the producer value in the final product value is relatively small (Tomek and Robinson, 2003). However, this does not necessarily mean that fish farmers earn less money than fish sellers because while the farmgate markup represents the farmer’s profit, the wholesale or retail markup includes not only the profit earned but also the costs incurred in marketing activities (storage, transportation, packing, etc.).
24
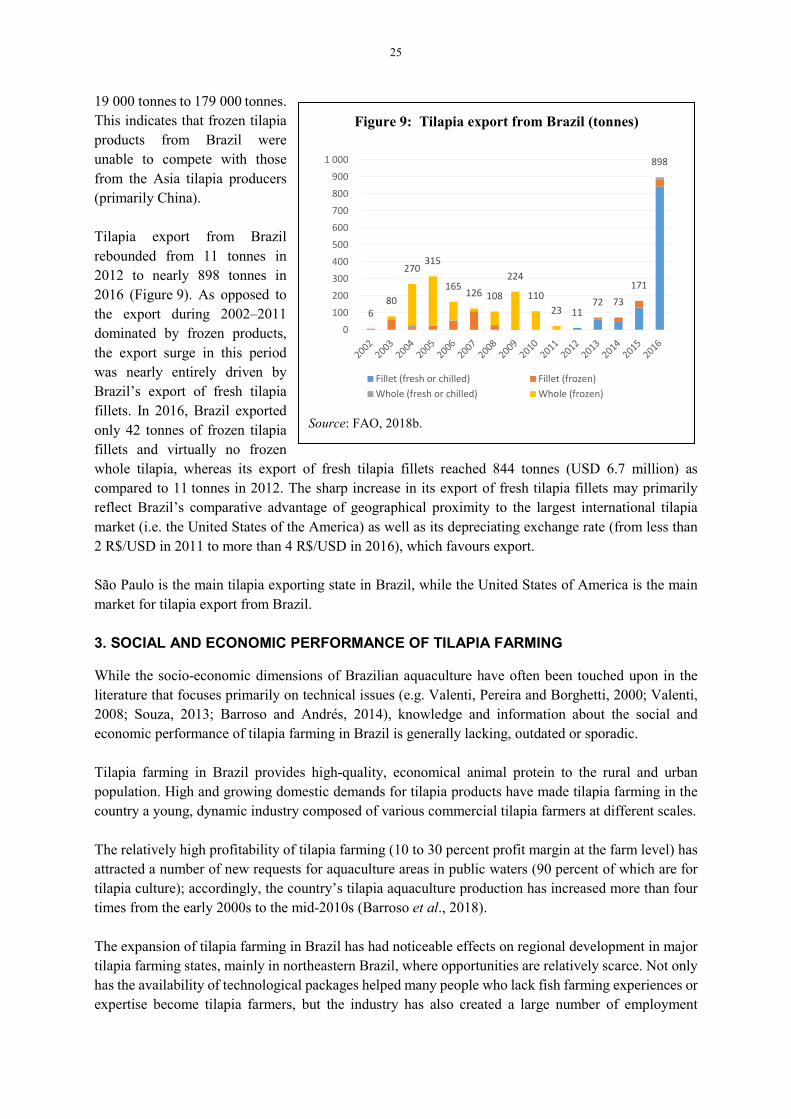
Tilapia fillet value chain in western Paraná (pond culture) The third case depicts a value chain in western Paraná that used pond-cultured tilapia to produce fillets sold at R$ 32/kg to final consumers. While the R$ 9.4 production cost (for producing 3.1 kg of whole tilapia) in this case (Figure 8, chart c) was R$ 2.2 less than that in the second case (Figure 8, chart b), the farmgate markup (R$ 1.9) was only R$ 0.3 higher than that in the second case. This is consistent with the common pattern that fish farmers usually lack bargaining power and hence are price takers on the fish value chain. The plant-gate price of tilapia fillet, in this case (R$ 19/kg), is slightly lower than that in the second case (R$ 20.2), yet the retail price (R$ 32/kg) is nevertheless much higher than the R$ 29/kg in the second case (Table 10). This is primarily due to the additional intermediary layer (i.e. the wholesale markup) on the value chain in this case. 2.12 Export While major tilapia farming countries in Asia (e.g. China, Indonesia, Viet Nam) export a substantial portion of their tilapia production, nearly all of farmed tilapia products in Brazil are consumed domestically, and export only represents a half percent of the domestic production (MDIC, 2017). Tilapia export from Brazil increased from 6 tonnes in 2002 to 315 tonnes in 2005 and then declined gradually to 23 tonnes in 2011 except for a transitory spike in 2009 (Figure 9). Primarily, the export was comprised of frozen whole tilapia in most years during the period, except for 2003 and 2007 when frozen tilapia fillets were the majority. The decline of tilapia export in Brazil during 2002–2011 contrasted to the increase of the total world export of frozen whole tilapia, from 65 000 tonnes in 2002 to 146 000 tonnes in 2011 and that of frozen tilapia fillets from
Figure 8: Value addition on tilapia value chains
Notes: Calculated based on Table 10, assuming a 32 percent fillet yield; the results may not be exact due to rounding. While farmgate markups (i.e. farmgate price minus production cost) measure fish farmers’ profitability, markups at other stages on the value chain do not accurately measure their profitability because tilapia raw materials are only part of the costs incurred at these stages.
4.0 2.0 1.5 2.5
0 2 4 6 8 10
Cost components (R$)
(a) Whole tilapia (SMSF; cage; retail price R$ 10/kg)
Production cost (1 kg whole fish)
Farmgate markup (1 kg whole fish)
Wholesale markup (1 kg whole fish)
Retail markup (1 kg whole fish)
40%
20%
15%
25%
11.6 1.6 7.1 8.8
0 6 12 17 23 29
Cost components (R$)
(b) Frozen tilapia fillet (Ilha Solteira; cage; retail price R$ 29/kg)
Production cost (3.1 kg whole fish)
Farmgate markup (3.1 kg whole fish)
Processing markup (1 kg fillet)
Retail markup (1 kg fillet)
40%
5%
25%
30%
9.4 1.9 7.8 3.0 10.0
0 4 8 12 16 20 24 28 32
Cost components (R$)
(c) Frozen tilapia fillet (Western Paraná; pond; retail price R$ 32/kg)
Production cost (3.1 kg whole fish)
Farmgate markup (3.1 kg whole fish)
Processing markup (1 kg fillet)
Wholesale markup (1 kg fillet)
Retail markup (1 kg fillet)
29%
6%24%
10%
31%
25
19 000 tonnes to 179 000 tonnes. This indicates that frozen tilapia products from Brazil were unable to compete with those from the Asia tilapia producers (primarily China). Tilapia export from Brazil rebounded from 11 tonnes in 2012 to nearly 898 tonnes in 2016 (Figure 9). As opposed to the export during 2002–2011 dominated by frozen products, the export surge in this period was nearly entirely driven by Brazil’s export of fresh tilapia fillets. In 2016, Brazil exported only 42 tonnes of frozen tilapia fillets and virtually no frozen whole tilapia, whereas its export of fresh tilapia fillets reached 844 tonnes (USD 6.7 million) as compared to 11 tonnes in 2012. The sharp increase in its export of fresh tilapia fillets may primarily reflect Brazil’s comparative advantage of geographical proximity to the largest international tilapia market (i.e. the United States of the America) as well as its depreciating exchange rate (from less than 2 R$/USD in 2011 to more than 4 R$/USD in 2016), which favours export. São Paulo is the main tilapia exporting state in Brazil, while the United States of America is the main market for tilapia export from Brazil. 3. SOCIAL AND ECONOMIC PERFORMANCE OF TILAPIA FARMING
While the socio-economic dimensions of Brazilian aquaculture have often been touched upon in the literature that focuses primarily on technical issues (e.g. Valenti, Pereira and Borghetti, 2000; Valenti, 2008; Souza, 2013; Barroso and Andrés, 2014), knowledge and information about the social and economic performance of tilapia farming in Brazil is generally lacking, outdated or sporadic. Tilapia farming in Brazil provides high-quality, economical animal protein to the rural and urban population. High and growing domestic demands for tilapia products have made tilapia farming in the country a young, dynamic industry composed of various commercial tilapia farmers at different scales. The relatively high profitability of tilapia farming (10 to 30 percent profit margin at the farm level) has attracted a number of new requests for aquaculture areas in public waters (90 percent of which are for tilapia culture); accordingly, the country’s tilapia aquaculture production has increased more than four times from the early 2000s to the mid-2010s (Barroso et al., 2018). The expansion of tilapia farming in Brazil has had noticeable effects on regional development in major tilapia farming states, mainly in northeastern Brazil, where opportunities are relatively scarce. Not only has the availability of technological packages helped many people who lack fish farming experiences or expertise become tilapia farmers, but the industry has also created a large number of employment
Figure 9: Tilapia export from Brazil (tonnes)
Source: FAO, 2018b.
680
270315
165 126 108
224
11023 11
72 73171
898
0
100
200
300
400
500
600
700
800
900
1 000
Fillet (fresh or chilled) Fillet (frozen)Whole (fresh or chilled) Whole (frozen)

26
opportunities. This has helped enhance the perception of tilapia farming as an option for income diversification for small-scale farmers or as an employment creation mechanism for regions with inadequate job opportunities. The expansion of tilapia farming has also attracted large rural investors that usually play key roles in market expansion and value chain modernization. Given the great technological and socio-economic heterogeneity among farmers at different scales or across different regions, it is imperative to understand the underlying factors that affect the technical, economic and social performance of the sector so that performance can be improved in specific ways that benefit all stakeholders. 3.1 Technical and economic performance
An evaluation of the technical and economic performance of tilapia farming operations provides knowledge about the possibilities of improvement in tilapia culture, including the influence on productive systems and markets (Macedo, 2004). It is important to emphasize that advanced technology does not guarantee good performance. Poor technical or economic performance in tilapia farming may be caused by inappropriate combinations of productive factors that lead to a lack of cost-effectiveness and hence low competitiveness or comparative advantage compared to the same product from other regions or different products in the same region (Brunetta, 2004). Based on economic analyses in the literature (e.g. Muñoz et al. 2015; Muñoz et al. 2016; Muñoz and Barroso, 2016), Table 11 compares the average technical and economic performance of tilapia cage farming in four different production centres. Production Centre I is located in the Itaparica reservoir at Sub-middle São Francisco (SMSF) in the northeast region. Production Centre II is located in the Castanhão and Orós reservoirs in Ceará State in the northeast region. Production Centre III is located in the Ilha Solteira/Jupiá reservoir in Ilha Solteira (São Paulo and Mato Grosso do Sul States) in the southeast region. Production Centre IV is located in the Paranapanema reservoir in the north of Paraná State, in the southern region. Rows 5–10 in the table are technical indicators, whereas rows 11–32 are economic indicators at different levels. Technical performance of cage tilapia farming The results in Table 11 indicate that tilapia cage farming in Production Centre I (SMSF) has the fastest fish growth (reaching an average of 1 100 g in 5.7 months), followed by Production Centre II (Ceará; 1 000 g in 6.8 months), Production Centre III (Ilha Solteira; 850 g in 7 months), and the slowest in Production Centre IV (north of Paraná; 800 g in 7.5 months). The warmer, more suitable water temperature for tilapia farming in the northeast than in the south is the primary factor affecting the different fish growth rates in the four centres. The fastest fish growth also gives Production Centre I (SMSF) the highest yield (row 9; 25.26 kg/m3/month). However, while the fish growth is faster in Production Centre II (Ceará) than Production Centre III (Ilha Solteira), the yield in the former (10.29 kg/m3/month) is nevertheless lower than the latter (11.24 kg/m3/month). This is because the number of tilapia harvested in Production Centre III (Ilha Solteira; 93 fish/m³/crop) is greater than that in Production Centre II (Ceará; 70 fish/m³/crop). This indicates that compared to Production Centre II (Ceará), the higher stocking density in Production Centre III (Ilha Solteira) has resulted in a higher yield despite the negative impact of high stocking density on fish growth.

27
Table 11: Technical and economic performance of cage tilapia farming in different production centres Technical and economic indicators Formula Production Centre I Production Centre II Production Centre III Production Centre IV
1 Location Northeast Northeast Southeast South 2 Production centre SMSF Ceará Ilha Solteira North of Paraná 3 Reservoir Itaparica Castanhão and Orós Ilha Solteira/Jupiá Paranapanema 4 Tilapia species GIFT and Chitralada GIFT and Chitralada GIFT GIFT
Technical performance 5 Crop length (months/crop) 5.70 6.80 7.00 7.50 6 Average harvest weight (g) 1 100 1 000 850 800 7 Biomass harvested (kg/m³/crop) 144 70 79 53 8 Number of fish harvests (#/m³/crop) Row 7 × 1 000 / Row 6 131 70 93 66 9 Yield (kg/m3/month) Row 7 / Row 5 25.26 10.29 11.24 7.07
10 Feed conversion ratio (FCR) 1.61 1.60 1.55 1.79 Economic performance (measured by per unit of production) 11 Share of feed in effective operating cost (%) 76.95 78.03 72.00 79.38 12 Effective operating cost (USD/kg) 1.16 1.34 1.22 1.48 13 Total cost (USD/kg) aka break-even price 1.20 1.46 1.28 1.90 14 Capital cost (USD/kg) Row 13 - Row 12 0.04 0.12 0.06 0.42 15 Farmgate price (USD/kg) 1.78 1.78 1.31 1.44 16 Gross profit (USD/kg) Row 15 - Row 12 0.63 0.43 0.09 -0.04 17 Net profit (USD/kg) Row 15 - Row 13 0.58 0.32 0.03 -0.46
Economic performance (measured by per unit of cage volume per month) 18 Effective operating cost (USD/m³/month) Row 9 × Row 12 29.31 13.79 13.72 10.46 19 Total cost (USD/m³/month) Row 9 × Row 13 30.32 15.03 14.39 13.43 20 Capital cost (USD/m³/month) Row 9 × Row 14 1.01 1.24 0.67 2.97 21 Revenue (USD/m³/month) Row 9 × Row 15 44.97 18.32 14.73 10.18 22 Gross profit (USD/m³/month) Row 9 × Row 16 15.92 4.43 1.01 -0.28 23 Net profit (USD/m³/month) Row 9 × Row 17 14.65 3.29 0.34 -3.25
Economic performance (measured by per unit of cage volume per crop) 24 Effective operating cost (USD/m³/crop) Row 5 × Row 18 167.04 93.80 96.01 78.44 25 Total cost (USD/m³/crop) Row 5 × Row 19 172.80 102.20 100.74 100.70 26 Capital cost (USD/m³/crop) Row 5 × Row 20 5.76 8.40 4.72 22.26 27 Revenue (USD/m³/crop) Row 5 × Row 21 256.32 124.60 103.10 76.32 28 Gross profit (USD/m³/crop) Row 5 × Row 22 90.72 30.10 7.08 -2.12 29 Net profit (USD/m³/crop) Row 5 × Row 23 83.52 22.40 2.36 -24.38
Investment performance (measured by internal rate of return) 30 Farm area needed for 1 tonne of annual production (m2/tonne/year) 83 53 23 n.a. 31 Initial investment needed for one unit of production (USD/kg/year) 0.57 0.56 0.37 n.a. 32 Internal rate of return (%; 10-year investment period) 98 68 22 n.a.
Source: Adapted from Muñoz et al. (2016) with modification and expansion. Notes: GIFT = genetically improved farmed tilapia. SMSF = Sub-middle São Francisco. n.a. = not available.
28
It is important to note that it may not be appropriate to use the monthly yields (row 9 in Table 11) to calculate the corresponding yearly yields because the performance may not be replicable in the previous or following crop that tends to be subject to a different farming environment (e.g. water temperature). The FCR in Production Centre I (SMSF) is slightly higher than that in Production Centre II (Ceará), which is higher than that in Production Centre III (Ilha Solteira). This pattern is consistent with the stylized fact that the FCR tends to increase with the harvest size. Yet, even with the smallest harvest size, Production Centre IV (north of Paraná) has the highest FCR, which indicates that feed efficiency in Production Centre IV is lower than for the other three centres. This may reflect the reduced feeding rate of tilapia in Production Centre IV (north of Paraná) as a result of relatively low water temperature. Economic performance of cage tilapia farming While the economic performance of a farming operation is closely related to its technical performance, the two can occasionally deviate from each other. A farming arrangement that increases productivity could nevertheless reduce profitability (Cai et al., 2018). For example, tilapia cage farming in Production Centre III (Ilha Solteira) has a higher yield yet lower profitability than Production Centre II (Ceará) (Table 11). While profit is the ultimate measure of the economic performance of a farming operation, it is important to understand the factors that affect the profit. Capital cost As indicated in rows 12 and 13 of Table 11, it takes USD 1.16 effective operating cost (EOC) and USD 1.2 total cost to produce 1 kg of tilapia in Production Centre I (SMSF). EOC includes variable costs (e.g. feed, labour, fingerlings, electricity, vaccines, fertilizers, maintenance) and some fixed costs (e.g. taxes, labour charges, union contribution) (Matsunaga et al., 1976). This means that the capital cost (mostly the depreciation of fixed assets) of producing 1 kg of tilapia in Production Centre I (SMSF) is USD 0.04 (row 14; the difference between the EOC and total cost). The unit capital cost (i.e. capital cost per unit of production) in Production Centre III (Ilha Solteira; USD 0.06) is similar to that in Production Centre I (USD 0.04), even though the yield in the former (11.24 kg/m3/month) is less than half of the latter (25.26 kg/m3/month). In contrast, while the yields in Production Centre II (Ceará) and Production Centre III (Ilha Solteira) are similar (10.29 kg/m3/month and 11.24 kg/m3/month, respectively), the former’s unit capital cost (USD 0.12/kg) is twice as much as the latter (USD 0.06/kg). Thus, the cage farming operation in Production Centre III (Ilha Solteira) is the least capital intensive, mainly due to the property size, including water and land areas which impact on stock of capital. For comparison, while the total area of the modal property is around 3 ha in Production Centre I (SMSF), it is 1.2 ha in Production Centre III (Ilha Solteira). Also, the cage systems employed in each centre are different. Production Centres I (SMSF) and IV (north of Paraná) use primarily 6 m³ cages, whereas 36 m3 cages are used in Production Centre II (Ceará) and 108 m³ used in Production Centre III (Ilha Solteira). Other equipment used, such as boats, weighing scales, nets and ropes, do not differ much among the production centres, except for quantities consumed in each centre, proportional to crop sizes. As indicated in rows 20 and 26, the capital cost in Production Centre III (Ilha Solteira) is USD 0.67/m3/month or USD 4.72/m3/crop, lower than that in Production Centre I (SMSF; USD 1.01/m3/month or USD 5.76/m3/crop) and Production Centre II (Ceará; USD 1.24/m3/month or USD 8.4/m3/crop).
29
Production Centre IV (north of Paraná) has the highest unit capital cost (USD 0.42/kg). This partly reflects its low yield (7.07 kg/m3/month), yet also indicates its high capital cost (USD 2.97/m3/month or USD 22.26/m3/crop), which is more than four times as high as that in Production Centre III (Ilha Solteira). In addition, the land price in the region of Production Centre IV (north of Paraná) is generally higher than the others, which impacts capital cost and, consequently, unit capital cost. Effective operating cost As indicated in row 12 of Table 11, the unit EOC (i.e. EOC per unit of production) of tilapia farming varies slightly, from USD 1.16/kg in Production Centre I (SMSF) to USD 1.48/kg in Production Centre IV (north of Paraná). The feed cost accounts for 70–80 percent of the EOC (row 11). Despite the need for importing 70 percent of tilapia feed from southern regions, the EOC of the two northeastern production centres (i.e. Production Centre I–SMSF and Production Centre II–Ceará) do not have an apparently higher EOC because tilapia tend to growth faster in the warmer climate in the northeast.
Total cost Total cost is equal to the sum of EOC and capital cost. As indicated in row 13, the unit total cost (i.e. total cost per unit of production) of tilapia farming varies from USD 1.2/kg in Production Centre I (SMSF) to USD 1.9/kg in Production Centre IV (north of Paraná). This indicates that tilapia cage culture operations in Production Centre I (SMSF) would break even, i.e. earning a positive profit, when the tilapia farmgate price is above USD 1.2/kg, whereas Production Centre IV (north of Paraná) entails a higher break-even price (USD 1.9/kg). The break-even prices for Production Centre II (Ceará) and III (Ilha Solteira) are, respectively, USD 1.46/kg and USD 1.28/kg. The total cost in terms of per unit cage volume per month is reported in row 19. This measure is equal to the unit total cost (row 13) multiplied by the yield (row 9). The total cost in terms of per unit cage volume per crop is reported in row 25, and the measure is equal to the total cost per unit volume per month (row 19) multiplied by the crop length (row 5). These total cost measures are used to calculate measures of net profit based on measures of revenue. Price and revenue The farmgate tilapia price (row 15) varies from USD 1.31/kg in Production Centre III (Ilha Solteira) to USD 1.78/kg in Production Centre I (SMSF) and II (Ceará), whereas the farmgate price in Production Centre IV (north of Paraná; USD 1.44/kg) is in the middle (Table 11; row 15). The higher farmgate price in the northeast region (Production Centre I (SMSF) and II (Ceará)) reflects the higher demand comparatively to the supply in the region. While the market size in the southern and southeastern regions (in terms of the number of consumers) is larger than the northeast, the rapid increase of tilapia supply in these regions has kept the farmgate prices down. Also, the size of tilapia harvest is different across regions: the harvest size varies from 1 000 g to 1 100 g for Production Centre I (SMSF) and III (Ilha Solteira), and from 800 g to 850 g for Production Centre II (Ceará) and IV (north of Paraná). With a higher farmgate price and a higher yield, Production Centre I (SMSF) has the highest revenue per month (USD 44.97/m3/month) and per crop (USD 256/m3/crop), followed by Production Centre II (Ceará), III (Ilha Solteira) and IV (north of Paraná) (row 21 and row 27).
30
Profit Profit is equal to revenue minus cost. More specifically, gross profit is equal to revenue minus EOC, where net profit is equal to revenue minus total cost. Net profit is the measure of profitability, whereas gross profit sets a benchmark for evaluating whether to continue a farming operation. Even with a negative net profit, a farm operation with a positive gross profit could be undertaken because the positive gross profit can help the farm cover some fixed costs that would be incurred even if the operation were not undertaken. Production Centre I (SMSF) has the highest net profit per unit of production (USD 0.58 /kg), net profit per month (USD 14.64/m3/month), and net profit per crop (USD 83.52/m3/crop), whereas Production Centre IV (north of Paraná) has a negative net profit. The profitability in Production Centre II (Ceará) and III (Ilha Solteira) is in between (row 17, row 23 and row 29). It is important to note that the net profit per month (row 23) should not be used to estimate the net profit per year because the economic performance of the current crop may not be replicable in the previous or following crop that tends to be subject to a different farming environment (e.g. water temperature). Similarly, the net profit per unit of production (row 17) is for the specific operation and may not be appropriate for estimating the profitability under other arrangements. For example, the USD 0.58 net profit per kilogram of production in Production Centre I (SMSF) should not be used to estimate its profit per month or per crop when the production centre increases a harvest through a higher stocking density. Internal rate of return to investment It takes Production Centre I (SMSF) 83 m2 of the total farm area, including water surface and land area, to produce 1 tonne of tilapia per year. This is higher than that of Production Centre II (Ceará) (53 m2), whereas that of Production III is the lowest (23 m2). Consequently, Production Centre III (Ilha Solteira) has the lowest initial investment per unit of annual production (0.37 USD/kg/year), much lower than that of Production Centre I (SMSF; 0.57 USD/kg/year) or Production Centre II (Ceará; 0.56 USD/kg/year). However, when measured by the internal rate of return (IRR) (10-year investment period), the IRR for Production Centre III (Ilha Solteira; 22 percent) is much lower than Production Centre I (SMSF) and II (Ceará) – 98 percent and 68 percent, respectively. This reflects the relatively low profitability of Production Centre III (Ilha Solteira) compared to the other two centres (Table 11). Technical and economic performance: pond versus cage tilapia farming Table 12 compares the technical and economic performance of pond versus cage tilapia culture in the south of Brazil. The results indicate that the 1.4 FCR in the earthen pond farm in western Paraná is lower than the cage farm in Ilha Solteira (1.55) or north of Paraná (1.79). This reflects the general advantage of pond tilapia culture in having the ability to increase the natural productivity through fertilization. The lower FCR for the pond farm has contributed to its lower break-even price (USD 0.82/kg) compared to the cage farm in Ilha Solteira (USD 1.28/kg) or that in the north of Paraná (USD 1.9 /kg).

31
Table 12: Technical and economic performance: pond versus cage tilapia farming
Performance indicators Floating cage
Earthen pond
Ilha Solteira
North of Paraná
Western Paraná
Feed conversion ratio 1.55 1.79 1.40 Cost per unit of production also known as break-even price (USD/kg) 1.28 1.90 0.82 Farm area per unit of annual production (m2/tonne/year) 23.00 n.a. 156.00 Initial investment per unit of production (USD/kg/year) 0.37 n.a. 1.79 Farmgate price (USD/kg) 1.31 1.44 1.12 Internal rate of return (%; 10-year investment period) 22.00 n.a. 4.00
Source: Brazilian Confederation of Agriculture and Livestock/Embrapa Fisheries and Aquaculture – Project Campo Futuro; the cage farms correspond to those in the same areas in Table 11 (i.e. Production Centres III and IV, respectively). Notes: Total farm area includes pond or cage area plus other farm areas (e.g. for buildings and other facilities). n.a. = not available. However, while it takes the cage farm in Ilha Solteira only 23 m2 of farm area to produce 1 tonne of tilapia per year, it needs 156 m2 for the pond farm in western Paraná. Consequently, it cost the pond farm USD 1.79 of initial investment for 1 kg of annual tilapia production, which is much higher than the USD 0.37 for the cage farm in Ilha Solteira. This primarily reflects the relatively high stock density allowed in cage farming in a large waterbody with good water flow. The farmgate price of the pond farm (USD 1.12/kg) was lower than that of the cage farm in Ilha Solteira (USD 1.31/kg) or the cage farm in north of Paraná (USD 1.44/kg). This is consistent with the common situation that pond-cultured tilapia is less favoured by consumers because of off-flavours. In addition, the low farmgate price may also reflect western Paraná tilapia farmers’ low bargaining power on the tilapia value chain, which includes a large number of tilapia farmers yet a relatively lesser number of processing plants. Overall, the pond farm in western Paraná had a much lower IRR (4 percent) than the cage farm in Ilha Solteira (22 percent). 3.2 Social performance
Contribution to food and nutrition Meat products contributed nearly two-thirds of Brazil’s animal protein intake in 2013, and milk and egg products accounted for nearly 30 percent, whereas the share of fish was only 5.5 percent (Figure 10). While bovine meat (i.e. beef) was still the number one contributor to Brazil’s animal protein, yet its share was reduced from 33.3 percent in 1993 to 27.9 percent in 2013. In contrast, the share of poultry meat, mostly chicken, was increased from 17.6 percent to 27.7 percent, and the share of fish increased from 4.5 percent to 5.5 percent during the period (Figure 10). Brazil’s per capita fish consumption was 9.6 kg/year in 2013, much lower than the world average (nearly 20 kg/year) and slightly lower than the Latin America and the Caribbean (LAC) average (10.1 kg/year) and the South American average (9.8 kg/year). However, the 3 percent annual growth rate of the country’s per capita fish consumption from 1993 to 2013 is much higher than the world average (1.7 percent), the LAC average (1.0 percent) and the South American average (1 percent) (FAO, 2018a). Tilapia farming has had a substantial contribution to the fish consumption growth in Brazil. In 1995, 160 million Brazilians consumed, on average, 0.07 kg farmed tilapia per person, 40 percent lower than

32
the world average of 0.12 kg. In 2017, Brazil’s average consumption of farmed tilapia was increased to 1.39 kg/capita/year, nearly 80 percent higher than the world average of 0.78 kg/capita/year (Figure 11).
Figure 10: Contribution of fish to animal protein intake in Brazil – 1993 versus 2013
Data source: FAOSTAT Food Balance Sheets (January 2018; www.fao.org/faostat/en/#data/FBS). Note: Constructed by the FAO WAPI Fish Consumption Module (WAPI-FISHCSP); see Figure 1.5 in WAPI-FISHCSP v.2018.1 for an example (www.fao.org/fishery/statistics/software/wapi/en).
Meat59.5%
Milk & eggs32.7%
Bovine meat33.3%
Pigmeat7.6%
Mutton & goat meat1.0%
Poultry meat17.6%
Other meat0.1%
Milk26.3%
Eggs6.4%
Finfish4.2%
Shellfish0.3%
Others3.3%
Animal protein intake
(1993): 31.35
g/capita/day Meat62.5%
Milk & eggs29.7%
Bovine meat27.9%
Pigmeat6.3%
Mutton & goat meat0.4%
Poultry meat27.7%
Other meat0.1%
Milk25.0%
Eggs4.7%
Finfish5.1%
Shellfish0.4%
Others2.3%
Animal protein intkae
(2013): 52.60
g/capita/day
Figure 11: Farmed tilapia consumption in Brazil
Source: Authors’ calculation based on tilapia production and population. Data on tilapia production from FAO Global Fishery and Aquaculture Production Statistics v2019.1.0, published through FishStatJ (March 2019; www.fao.org/fishery/statistics/software/fishstatj/en). Population data from World Population Prospects 2017 (United Nations Population Division; https://esa.un.org/unpd/wpp/Download/Standard/Population). Note: Nearly all farmed tilapia in the world are for human consumption; nearly all Brazilian tilapia production is for domestic consumption; and Brazil has little tilapia import. Therefore, the per capita consumption of farmed tilapia in the world and Brazil can be estimated by their production divided by their population, respectively.
0.07 0.10 0.10 0.14 0.16 0.19 0.20
0.320.36 0.37 0.36 0.38
0.500.58
0.68
0.790.84
0.920.84
0.981.07
1.16
1.39
0.12
0.78
0.0
0.2
0.4
0.6
0.8
1.0
1.2
1.4
1995 1996 1997 1998 1999 2000 2001 2002 2003 2004 2005 2006 2007 2008 2009 2010 2011 2012 2013 2014 2015 2016 2017
Live
wei
ght (
kg/c
apita
/yea
r)
Brazil World

33
Contribution to income and employment Aquaculture contributed USD 1.4 billion (farmgate production value) to the Brazilian economy in 2017, of which more than one-third (USD 509 million) was from tilapia farming. Tilapia farming and aquaculture in general also contribute to the Brazilian economy through fee-fishing (Kitamura et al., 2002). According to IBGE (2017), the entire aquaculture value chain in Brazil has created 3.5 million job opportunities, 1 percent of which are jobs in tilapia farming. Yet the labour requirement tends to increase with the complexity of the activities and technology adopted in a farm, and the use of labour in an earthen pond system differs from that in a cage system. Employment opportunities provided by tilapia farming have helped mitigate the issues of rural emigration and rural emptiness. Agricultural development in Brazil has changed its rural areas in many ways. The increasing mechanization and technological complexity in modern agriculture has shifted the labour demand from a large amount of manual labour to a fewer number of specialized workers. The decrease in employment opportunities, and the consequent decline in quality of life, has motivated rural emigration, especially from inland areas, to the capital or other large cities and to nearby areas. The trend that women usually emigrated before men has led to the “masculinization” of Brazil’s rural areas in recent decades; the resulting lower fertility has caused rural emptiness, which is a major issue in Brazilian inland areas. As a relatively new activity, tilapia farming has a multiplier effect on employment generation by attracting auxiliary industries (equipment manufacturers, feed manufacturers, hatcheries, processing plants, distributors, etc.) to form industrial clusters. For example, it entails, on average, 1 worker day to process 120 kg of tilapia, 1 worker month to produce 20 tonnes of tilapia feed, and 1 worker month to produce 100 000 fingerlings. By providing livelihood opportunities to the rural population that otherwise might have few income options, tilapia farming and other industries on the tilapia value chain generate jobs that tend to be decent. Brazil has rigorous labour laws and standards that are widely publicized and championed by active trade unions. As a result, workers on the tilapia value chain are paid wages higher than the national minimum wage and enjoy benefits that they are entitled to according to the labour laws and standards. Many companies, particularly tilapia farms in the south and southeast, offer extra benefits such as salary progression, year-end bonuses and other benefits negotiated between the company and employees. The decent employment conditions have helped foster the loyalty of employees and boosted their productivity. While the large labour demand created by tilapia processing plants and the aquafeed industry contributes to social amenities, it has resulted in a shortage of skilled labour, especially in regions with more competition for skilled labour within the tilapia sector or from other industries. The labourious and tedious work features (e.g. heavy duties in feed mills, intensive and repetitive duties in processing plants) make it more difficult for the tilapia farming or aquaculture sector in general to attract workers. The trend of increasing automation in the tilapia sector has helped ease the labour constraints on the tilapia value chain. For example, a highly automated aquafeed factory (with the capacity to produce 3 000 tonnes per day) launched in 2016 in the State of Mato Grosso do Sul recruited only seven direct full-time employees, much fewer than the 120 employees in another feed plant in the State of São Paulo.

34
Despite the high investment cost, automation tends to reduce the operating cost of a feed factory through the reduction of labour cost13 and continuing production for 24 hours a day. A similar automation trend also occurs in tilapia farming operations. The use of fish graders and fish counters helps grading fingerlings faster and better. An automated solar power control system experimented with by some farmers can reduce the number of employees needed in an intensive farming system from 3 to 1. While increasing automation on the tilapia value chain helps large businesses overcome the labour shortage and reduce their operating costs, it nevertheless tends to reduce potential employment opportunities in rural areas. In contrast, cooperative systems that consolidate and coordinate small-scale operators may be an alternative way to improve efficiency on the tilapia value chain with a less negative impact on rural employment. However, while the trend of automation has been mostly driven by the private sector, the establishment and maintenance of effective and sustainable cooperative systems would entail the facilitation of the public sector (see discussion in section 3.4). Women on tilapia value chain Field data indicate that the participation of Brazilian women in tilapia farming operations is generally limited and sporadic on a temporary basis, usually in group performing a specific task (Plate 8). Yet, the tilapia processing industry (with women labour accounting for 50–90 percent of the work force), followed by the aquafeed industry (20–40 percent) and hatcheries (10–30 percent) provide ample opportunities for women’s participation in the tilapia value chain. Because the importance of human development has been increasingly recognized in the tilapia sector, social issues such as gender equality and women’s empowerment are increasingly incorporated in companies’ values and practices (Silva, 2014).
13 The wage offered by a feed factory is usually 1.5 to 2.5 times the national minimum wage.
Plate 8 Women farmers’ association, Jatobá
© R.M. Barroso

35
3.3 Legal and regulatory framework
Cumbersome and uncertain aquaculture regulatory requirements in Brazil have been a primary factor hindering the development of tilapia farming (or aquaculture in general) in the country. Obtaining environmental licences and water grants for aquaculture operations in Brazil has been generally difficult, and institutional changes since 2015 (with the close of the Ministry of Fisheries and Aquaculture) tend to aggravate the situation. Regulatory complexity or uncertainty tends to discourage Brazilian fish farmers from expanding their operations to seize market opportunities and hinders their business activities. For example, without proper licences, it is difficult for a fish farmer to secure loans from financial institutions. On the other hand, the lack of proper regulatory mechanisms on some key part of the tilapia value chain poses another challenge to the sustainable development of the sector. For example, according to cold storage owners interviewed by the authors, a large amount of (approximately 40 percent) of tilapia produce that they handled did not undergo proper food sanitation and safety control mechanisms. 3.4 Farmer organizations
Farmer organizations can help fish producers (especially smallholder producers) gain market power through collective bargaining in input purchases or marketing outputs. Farmer organizations could also facilitate aquaculture extension in various aspects (e.g. technical training, business training and technology transfer). There have been various modalities of fish farmer organizations in different states in Brazil. All of them underwent a learning period before becoming mature in their mandates and modi operandi. The Young Fish Farmers Associations at the SMSF Pole have succeeded in forming 13 associations after much persistent effort by the founder (Barroso and Andrés, 2014). It has now become a modality followed by many smallholder fish farmers in the region; the associations have helped farmers achieve results that they cannot realize individually. The integration system (adapted from Horn, Shikida and Staduto, 2009), implemented by cooperatives and other farmer organizations, uses a modality that has been adopted by poultry or pig farmer organizations. Under the integration system, the leading company supplies fingerlings, feed, technical assistance, harvest service and logistics to fish farmers who provide farming area and infrastructure, electric power and labour. The fish farmers are rewarded by the leading company according to their farming performance. Therefore, it is important for them to adopt proper technologies and good farming practices (water quality management, efficient feed management and regular note taking and bookkeeping). The farmers usually need to have proper investments in equipment and machinery (e.g. aerators) and facilities (e.g. nurseries) in order to achieve good performance. A leading company selects its integrators based on multiple factors: distance of farm location, nursery condition, water supply and condition of farm facilities, among others. Even with the demanding selection criteria, there is strong interest among farmers to become integrated in order to gain various benefits enjoyed by a member (e.g. extension and other services, stable material inputs, and market access).

36
Generally, an integration system covers fish farmers within a small area (with the radius distance at most 120 km). As some integrated farmers may not be able to stay in business due to a lack of expertise or experience, the farmer composition of an integration system could alter from time to time. 4. DISCUSSION
Population growth and increasing consumer preference for fish as a health food in Brazil, the Americas and the entire world bestow a great market potential for tilapia farming in Brazil. Yet there are major constraints to overcome in order to realize the potential (Table 13). The trend of increasing intensification in tilapia farming requires: (i) better technical and financial management (e.g. better feed management) adopted by farmers; (ii) breeding programmes established according to regional characteristics and needs, and with improved communication of the expected benefits of strains produced under the programmes; (iii) advancements in the fish processing industry (e.g. improvement in the self-management of small-scale processing plants, better utilization of fish processing by-products and more balanced geographic distribution of processing plants); (iv) increased and more coordinated efforts in water management by farmers and government; (v) more formally, strategically established farmer organizations; (vi) improvement in technical assistance and rural extension; (vii) streamlined legal and regulatory frameworks for governing tilapia farming and other activities on the tilapia value chain; and (viii) better marketing strategies to promote tilapia consumption. 4.1 Technology
Innovations have played a crucial role in the agricultural revolution in Brazil in the past decades, and technological advancements in the field have made the country one of the largest food producers in the world. Characterized by a recent increase in rural land investment (e.g. large investors acquiring farmlands for potential appreciation in the land value), the current agricultural expansion in Brazil has become increasingly dependent upon agro-industrial inputs, as well as the support of science, technology and knowledge. Institutions in general (government agencies, development agencies and business agencies in the private sector) have become increasingly fundamental to the field, for example, for road construction, for strengthening rural extension services, and for providing capital for farming operations (Buainain et al., 2014). Tilapia farming has become a basic platform for aquaculture development and diversification in Brazil. Most technological advances in the tilapia industry have helped establish farming protocols and practices that provide guidance for the farming of other species (including native species). The tilapia industry also supplies well-trained personnel that are essential to new aquaculture ventures. While increasing automation and other technical advancements have helped enhance the productivity of tilapia farming in Brazil, its potential impact on the social exclusion of smallholder farmers (particularly those with the lowest financial or technical capacity and hence more difficulties in accessing or applying expensive, sophisticated technologies) warrants more attention (Navarro, 2016; Alves e Souza, 2015). Further studies are needed to better understand the social impacts of tilapia aquaculture development against the background of key rural issues in Brazil, such as persistent rural poverty, social asymmetry or inequality, and steady reduction of rural population.

37
Table 13: Constraints over the development of tilapia farming in Brazil
Constraints Causes Impacts
Lack of adequate or proper monitoring of water quality
Lack of technical assistance Inaccurate measurement or estimation of carrying capacity; unfavourable farming environment
Inadequate technical assistance
Lack of technician in rural areas; absence of effective rural extension services for fish farming
Low technical know-how and capacities of fish farmers
Inadequate processing or other post-harvest facilities
Less organized fish farmers; lack of good management in processing plants
Lack of product differentiation; lack of value addition; lack of access to new markets
Lack of competitiveness in international markets
Lack of certification; lack of value addition; lack of market studies
Low export; low profit margin; low economic viability; little information about fish consumption markets; lack of effective means to improve access to new market channels
Lack of effective/efficient governance
Lengthy licensing process; unclear regulations; institutional instability; lack of technical assistance on the production level
Delayed new projects; discouraging large businesses from establishing new operations; limited opportunities for obtaining financial loans
Limited access to credits
Insecure business status because of the lack of proper licences; demanding collateral or guarantee requirements
Constraints over the expansion of the existing operation or establishment of new operations; constraints over technological improvements
Inadequate, inaccurate or unstable data and statistics
Frequent changes of the statistical methodology; lack of primary data
Lack of sound information/knowledge about the status and trends of aquaculture development in the country; constraints over evidence-based policy and planning
Inadequate infrastructure No or low-quality roads to reservoirs No or limited access to potential
farming sites
Low or negative profitability
Increasing input prices; decreasing sales prices; farmers’ lack of capacity for good business/financial management
Disruption of farming operations or aquaculture businesses; existing farmers leaving the industry; potential farmers discouraged from joining the industry
Seasonality of fingerling supplies
Cold winter unsuitable for seed production; lack of facilities for seed production in cold season; lack of cold-resistant strains
Delayed stocking resulting in suboptimal growth and/or undesirable harvest size
Theft Difficult to guard cage farming in open waters, resulting in frequent stealing of crops and/or equipment
Production losses; increased security expenses
Technology Lack of genetic improvement Low efficiency; low competitiveness
Deterioration of farming environments
Inappropriate zoning or site selection for cage farming in reservoirs; lack of appropriate monitoring of water quality; prolonged droughts; weak sector organization or coordination
Low farming performance (diseases, low yield, etc.)

38
4.2 Environmental challenges
Brazil has abundant, suitable natural resources and environment (land, water and climate) for tilapia farming. However, as tilapia production becomes more intensive (in term of both the scale and the technologies adopted), environmental issues have become increasingly pronounced. Irrespective of cage farming or pond culture, the large amount of organic wastes caused by intensive feeding poses a major challenge to the environment. Brazilian farmers are required by environmental laws/regulations to treat pond culture effluents to the extent that the water maintains the original quality; non-compliance could result in non-renewal of the environmental licence. This compels fish farmers to set aside some area for sedimentation and treatment purposes, which is particularly costly for smallholder farmers with insufficient land resources. Although cage farming in open waters is not required by environmental regulations to treat effluents, these cages may actually generate more wastes than pond culture because of intensive feeding and relatively high FCRs. When water flow is not strong enough to dissipate the effluents, the farming area can quickly become eutrophic with low dissolved oxygen, ultimately unfit for fish farming. In this situation, cage farming should have areas available for productive rotation, which demands constant management of the quality of the water used. It is important to raise fish farmers’ awareness of the importance of water quality to fish farming performance, which will increase their willingness to improve the feeding efficiency and adopt farming systems or practices that maintain good quality of water. Prolonged droughts have become a major environmental challenge to tilapia farming in Brazil in recent years. As indicated in Table 14, water availability for tilapia farming declined severely from 2015 to 2017, which affected several major tilapia production centres. Strategic and effective planning is needed to mitigate the negative impacts of this cyclic climate issue on tilapia farming. Table 14: Useful volume of northeastern reservoirs important to tilapia aquaculture
Reservoirs Percentage of water available to be used for any purpose (%) January 2015 January 2016 January 2017
Orós (CE) 47 33 12 Castanhão (CE) 25 11 5 Itaparica (BA) 22 15 18
Note: Useful volume of a reservoir could be measured by the volume or percentage of water available to be used for any purpose. 4.3 Processing
Fillet is the main tilapia product in Brazil. While the lack of quality raw material is an issue encountered by some tilapia processors, there is a general lack of processing capacity for Brazil’s tilapia industry as a whole. This indicates that there are inefficiencies to be addressed in the tilapia value chain (including the unbalanced geographic distribution of tilapia processing facilities). For example, financial support (e.g. credit lines) provided by the government has achieved little success in stimulating the establishment of new processing facilities throughout the country. A primary reason is the lack of an efficient management modality that makes tilapia processing a lucrative business. In
39
order to increase profitability, the tilapia processing industries should increase efficiency in utilizing processing by-products and invest in innovations, such as new products, packaging and branding. 4.4 Markets
Export markets Despite being one of the largest tilapia farming countries with a great potential in tilapia aquaculture, Brazil has yet to become a major tilapia exporting country. While trade barriers such as cumbersome documentation requirements and sanitary/safety issues are factors that hinder tilapia export from Brazil, a deeper look at the tilapia value chain in Brazil is needed to understand why its products have been outcompeted by other countries in spite of its various advantages in tilapia production (e.g. abundant supply of tilapia feed ingredients, advanced farming systems and technologies) and marketing (i.e. geographic proximity to the United States of America, the largest international tilapia fillet market). Domestic market The 10 kg/year (live weight equivalent) per capita fish consumption in Brazil in the early 2010s is only half of the world average (FAO, 2018a). While this reflects the general pattern of relatively low fish consumption in Latin America, compared to other places such as Asia and Europe, fish consumption in Brazil is also hindered by consumers’ lack of information and knowledge about the large number of fish varieties available in the market (the types or names of seafood cuts, their nutrition value, etc.). Critical issues affecting consumers’ choices for fish products include the source (farmed or wild), environment (marine or freshwater), origins (region where the fish was farmed or caught), distance from farm to market, transport conditions, and time spent after harvest (Felippe, 2015). With continuing improvement of the product quality, tilapia has prevailed over other species to become one of the most popular fish species in Brazil. However, more marketing efforts are needed to increase the domestic and international demand for tilapia products. The water crisis in 2014 (Barroso et al., 2015) has opened tilapia markets in affected regions to tilapia producers in non-affected regions, yet few actions have been taken to open up new domestic markets. In domestic markets, tilapia faces increasing competition from imported products. For example, Brazil’s import of hake and pangasius fillets increased 26 percent between 2011 and 2013 (Barroso, Pincinato and Muñoz, 2017). In 2016, Brazil imported 364 000 tonnes (USD 1.2 billion) of fish and fishery products, including 118 000 tonnes (USD 179 million) of frozen whole fish (HS0303), 109 000 tonnes (USD 289 million) of fish fillets (HS0304), 66 000 tonnes (USD 438 million) of fresh/chilled whole fish (HS0302), and 34 000 tonnes (USD 167 million) of dried/salted/smoked fish (HS0305) (FAO, 2018b).14 The major species include salmons (primarily fresh whole and frozen fillet), cods/hakes/haddocks (primarily fillets, frozen or salted), pangasius and other catfish fillets. The dependence of the domestic market on imported white fish products indicates the great potential of tilapia farming through import substitution. Fish imports, in general, present more stable and competitive supply than domestic production. While some imported products may be of lower quality than domestically produced tilapia fillets (in terms of organoleptic properties, consistency and freshness), their price advantages allow them to attract consumers who pay more attention to price than quality. Thus, domestic producers need a more efficient production and value chain. Standardization, updated technology, economy of scale, easy access to inputs and efficient transport logistics are aspects to be developed not only by each firm, but also by the 14 HS = Harmonized Commodity Description and Coding Systems

40
industry as a whole. Given that tilapia is part of the global market (Norman-Lopez and Bjørndal, 2009), the domestic industry increasing competitiveness towards imports is also increasing competitiveness towards exports. The increasing demand for fish in Brazil in the past few decades, in addition to the limited supply from capture fisheries, tends to drive up fish prices. This may create incentives for both fish farming and imports. Competition among different sources of fish supply tends to keep prices relatively low for consumers. However, for fish farmers, this means that profits depend on cost reduction rather than higher sale prices. Thus, increased productivity not only at the production level, but also through other value chain components is needed for the sustainable development of the domestic industry. Fostering or expanding local markets for tilapia is not only beneficial to the local communities with affordable, high-quality protein, but also remains important for increasing the market inclusion of smallholder tilapia farmers. Local markets are usually served by small retailers (e.g. small fish markets, fishmongers or fish stalls) that help link smallholder farmers to the market. An effort in increasing the market inclusion of smallholder farmers is important to maintain or increase the social responsibility of the tilapia industry.
4.5 Concluding remarks
Agribusiness in Brazil has undergone profound changes in the past few decades, and technological innovations have elevated the country into one of the largest food exporters in the world. For the country, this promises a bright future for tilapia farming or aquaculture in general. Yet, institutional instability and regulatory uncertainties pose a great challenge to the development of the tilapia industry. Improving the situation would entail the public sector and the private industries working together to create an enabling environment for Brazil to fully harness its great comparative advantages in tilapia farming. In addition, the social dimensions of aquaculture development deserve more attention. In-depth, participatory communication and consultation involving all stakeholders in the tilapia value chain are needed to delineate a road map to help Brazil’s tilapia aquaculture, or fish farming in general, develop into an economically viable, environmentally sustainable and socially responsible sector.

41
REFERENCES
Alves, E. & Souza, G.S. 2015. Pequenos estabelecimento em termos de área também enriquecem? Pedras e tropeços. Revista de Política Agrícola, 24(3): 7–21.
Barroso, R.M. & Andrés, M.P. 2014. A tilápia e o desenvolvimento do Sertão de Itaparica/PE: análise econômica para investimentos de desenvolvimento na região. Palmas, TO: Embrapa Pesca e Aquicultura, 2014. 42 pp. Embrapa Pesca e Aquicultura. Documentos, 4.
Barroso, R.M., Evangelista, B.A., Tahim, E.F., Tenório, R.A., Carmo, F.J. & Sabbag, O.J. 2015. A importância da organização da cadeia de valor da tilápia na gestão da crise hídrica. Palmas, TO: Embrapa Pesca e Aquicultura. 48 pp.
Barroso, R.M., Muñoz, A.E.P., Tahim, E.F., Webber, D.C., Albuquerque Filho, A. da C., Pedroza Filho, M.X., Tenório, R.A., Carmo, F.J. do, Barreto, L.E.G. de S., Muehlmann, L.D., Silva, F.M. & Hein, G. 2018. Diagnóstico da cadeia de valor da tilapicultura no Brasil. Brasília, DF: Embrapa.181 pp. (also available at www.embrapa.br/busca-de-publicacoes/-/publicacao/1093842/diagnostico-da-cadeia-de-valor-da-tilapicultura-no-brasil).
Barroso, R.M., Pincinato, R.B.M. & Muñoz, A.E.P. 2017. Informativo de Mercado da Tilápia: O mercado da tilápia – 2° trimestre de 2017. Embrapa Pesca Aquicultura. Palmas, TO. 20 pp. (also available at www.embrapa.br/busca-de-publicacoes/-/publicacao/1072746/o-mercado-da-tilapia---2-trimestre-de-2017-e-analise-da-estrutura-do-preco-da-tilapia-no-varejo).
Barroso, R.M., Tenório, R.A., Pedroza Filho, M.X., Webber, D.C., Belchior, L.S., Tahim, E.F., Carmo, F.J. & Muehlmann, L.D. 2016. Gerenciamento genético da tilápia nos cultivos comerciais. Palmas, TO: Embrapa Pesca e Aquicultura, 2015. 64 pp. (Documentos/Embrapa Pesca e Aquicultura, ISSN 2318-1400; 23).
Barroso, R.M. &Muñoz, A.E.P. 2017. A cadeia de valor da tilápia. Revista Panorama da Aquicultura, ed. 160. Maio de 2017. (also available at https://panoramadaaquicultura.com.br/a-cadeia-de-valor-da-tilapia).
Brunetta, M.R. 2004. Avaliação da eficiência técnica e de produtividade usando análise por envoltória de dados: um estudo de caso aplicado a produtores de leite. 101 f. Dissertação (Mestrado em Métodos Numéricos em Engenharia) – Universidade Federal do Paraná, Curitiba.
Buainain, A.M., Alves, E., Silveira, J.M. da & Navarro, Z., ed. 2014. O mundo rural no Brasil do século 21: a formação de um novo padrão agrário e agrícola. Brasília, DF: Embrapa. 1182 pp.
Cai, J.N., Leung, P.S., Luo, Y.J., Yuan, X.H. & Yuan, Y.M. 2018. Improving the performance of tilapia farming under climate variation: perspective from bioeconomic modelling. FAO Fisheries and Aquaculture Technical Paper No. 608. Rome, FAO. (also available at www.fao.org/3/i8442en/I8442EN.pdf).
Costa, A.C., Reis Neto, R.V., Freitas, R.T.F., Freato, T.A., Lago, A.A. & Santos, V.B. 2009. Avaliação do crescimento de tilápias de diferentes linhagens através de modelos não lineares. Arch. Zootec., 58 (Supl. 1): 561–564.
FAO. 2017. Social and economic performance of tilapia farming in Africa, edited by J. Cai, K.K. Quagrainie & N. Hishamunda. FAO Fisheries and Aquaculture Circular No. 1130. Rome. (also available at www.fao.org/3/a-i7258e.pdf).
FAO. 2018a. World Aquaculture Performance Indicators (WAPI) – Fish Consumption Module (WAPI-FISHCSP v.2018.1). In: FAO Fisheries and Aquaculture Department [online]. Rome. Updated 2018. www.fao.org/fishery/statistics/software/wapi/en
FAO. 2018b. FAO Global Fishery and Aquaculture Commodities Statistics 1976–2016 v2018.1.0, published through FishStatJ (July 2018; www.fao.org/fishery/statistics/software/fishstatj/en).

42
FAO. 2019a. FAO Global Fishery and Aquaculture Production Statistics 1950–2017 v2019.1.0, published through FishStatJ (March 2019; www.fao.org/fishery/statistics/software/fishstatj/en).
FAO. 2019b. Top 10 species groups in global aquaculture 2017. WAPI factsheet (June 2019). Rome. (also available at http://www.fao.org/3/ca5224en/ca5224en.pdf).
Felippe, M. 2015. Desafios e oportunidades e mercado. Aquishow. Santa Fé do Sul. (also available at http://aquishow.org.br/wp-content/uploads/2015/09/Desafios-e-oportunidades-de-mercado-Meg-Felippe.pdf).
Fitzsimmons, K. 2016. Tilapia aquaculture 2016 and where will we be in 2026. Seminar presented at the Eleventh International Symposium on Tilapia in Aquaculture, 26–29 April 2016, Surabaya, Indonesia. (also available at https://cals.arizona.edu/azaqua/ista/ISTA11/ISTA11.htm).
Greenfield, J.E., Lira, E.R & Jensen, J.W. 1973. Anteprojeto econômico da criação intensiva de híbrido de tilapia nilótica x tilapia honorum. Diretoria de Pesca e Piscicultura, Centro de Pesquisa Ictioloticas, Servico de Economia e Producao Pesqueira, Fortaleza, Ceara, Brasil. 20 pp.
Hein, G. & Brianese, R.H. 2004. Modelo Emater de produção de tilápia. 2004. (also available at www.emater.pr.gov.br/arquivos/File/Biblioteca_Virtual/Premio_Extensao_Rural/1_Premio_ER/ModeloEmaterProd_Tilapia.pdf).
Horn, C., Shikida, P. & Staduto, J. 2009. O ambiente competitivo e as estratégias da Copacol (PR): o caso da produção da tilápia. Revista Extensão Rural, 16(17): 5–24, jan/jun 2009. (also available at http://coralx.ufsm.br/extensaorural/art1ed17.pdf).
IBGE (Instituto Brasileiro de Geografia E Estatística). 2017. Produção Pecuária Municipal 2016. V.44. Brasilia, Brasil. (also available at https://biblioteca.ibge.gov.br/visualizacao/periodicos/84/ppm_2016_v44_br.pdf).
Jory, D.E., Alceste, C. & Cabrera, T.R. 2000. Mercado y comercialización de tilapia en los Estados Unidos de Norte américa. Panorama Acuicola, 5(5): 50–53.
Kitamura, C.P., Queiroz, J.F.de., Lopes, R.B., Castro, F.G.de. & Boyd, C.E. 2002. Environmental and economic assessment of fee-fishing in São Paulo State, Brazil. Journal of Applied Aquaculture, 12(4): 23–41. doi: 10.1300/J028v12n04_03
Kubitza, F. 1999. Nutrição e alimentação de tilapia. Panorama da Aquicultura, maio/junho, 1999: 14–49.
Kubitza, F. 2003. A evolução da tilapicultura no Brasil: produção e mercado. Panorama da Aquicultura, 13(76): 25–35.
Kubitza, F. 2006. Questões frequentes dos piscicultores sobre a qualidade dos alevinos de tilapia. Panorama da Aquicultura, setembro/outubro: 14–22.
Kubitza, F. 2007. Tilapias na bola de cristal. Panorama da Aquicultura, Janeiro/Fevereiro: 14–21. Kubitza, F. 2015. Aquicultura no Brasil: principais espécies, áreas de cultivo, rações, fatores limitantes
e desafios. Panorama da Aquicultura, Rio de Janeiro, 25(150): jul./ago. Macedo, M.A.S. 2004. A utilização da Análise Envoltória de Dados (DEA) na consolidação de medidas
de desempenho organizacional. In: Congresso Brasileiro de Custos, 11, 2004, Porto Seguro. Anais. Porto Seguro: ABC, 2004.
Mainardes Pinto, C.S.R, Paiva, P., Verani, J.R., Scorvo Filho, J.D. & Silva, A.L. 2011. Desempenho produtivo da tilápia tailandesa e da tilápia vermelha da flórida estocadas em diferentes densidades, em tanques-rede instalados em viveiros. Bol. Inst. Pesca, São Paulo, 37(3): 225–234.
Matsunaga, M., Bemelmans, P.F., Toledo, P.E.N., Dulley, R.D., Okawa, H. & Pedroso, I.A. 1976. Metodologia de custo de produção utilizada pelo IEA. Agricultura em São Paulo, São Paulo, 23(1): 123–39.
Meschkat, A. 1975. Aquicultura e pesca em aguas interiores no Brasil. Programa de Pesquisa de Desenvolvimento Pesqueiro do Brasil, PNUD/FAO – Ministério da Agricultura/SUDEPE, 1975. Documentos Técnicos, n. 9. 47 pp.
43
MDIC (Ministério da Indústria, Comércio Exterior e Serviços). 2017. Aliceweb: Sistema de Análise das Informações de Comércio Exterior. http://aliceweb2.mdic.gov.br/ (access on February 2017).
Muñoz, A.E.P., Flores, R.M.V., Pedroza Filho, M.X., Barroso, R.M., Rodrigues, A.P.O. & Mataveli, M. 2015. Piscicultores e técnicos discutem sobre os custos de produção de tilápia em Paulo Afonso-BA. Palmas: Embrapa Pesca e Aquicultura, 2015. Informativo Campo Futuro, 7.
Muñoz, A.E.P., Mataveli, M., Freitas, L.E.L. de & Routledge, E.A.B. 2016. Piscicultores e técnicos discutem os custos de produção de tilápia em viveiro escavado em Joinville – SC. Palmas, TO: Embrapa Pesca e Aquicultura, 2016. 6 p. Informativo campo futuro, 22. (also available at http://ainfo.cnptia.embrapa.br/digital/bitstream/item/131687/1/pauloafonso.pdf).
Muñoz, A.E.P. & Barroso, R.M. 2016. Piscicultores e demais agentes da cadeia produtiva discutem os custos de produção da tilápia em Santa Fé do Sul – SP. Palmas: Embrapa Pesca e Aquicultura, 2016. Informativo Campo Futuro, 24. (also available at http://ainfo.cnptia.embrapa.br/digital/bitstream/item/155531/1/465.pdf).
Navarro, Z.S. de. 2016. O mundo rural no novo século (um ensaio de interpretação). In: Vieira Filho, J.E.R., Gasques, J.G. & Carvalho, A.X.Y. de. Agricultura, transformação produtiva e sustentabilidade. Brasília, DF: Ipea, 2016. pp. 25–63.
Norman-Lopez, A. & Bjørndal, T. 2009. Is tilapia the same product worldwide or are markets segmented? Aquac. Econ. Manag., 13: 138–154. doi:10.1080/13657300902885360
Ostrensky, A. & Boeger, W.A. 1998. Piscicultura Fundamentos e Técnicas de Manejo. Guaíba, Agropecuária, ed. 211 pp.
Rezende, F. & Mataveli, M. 2017. Impactos da mancha branca nos custos de produção do camarão no Nordeste. Brasília, DF: CNA, 2017. pp. 8–12. CNA. Boletim ativos da aquicultura, 12. (also available at http://ainfo.cnptia.embrapa.br/digital/bitstream/item/157944/1/CNPASA-2017-aa.pdf).
Rocha, I. & Mendonça, C. 2015. Domestic market for farmed shrimp in Brazil. Improved practices, rising demand alter industry. Global Aquaculture Advocate.
Silva, S.S. 2014. A piscicultura na perspectiva de gênero: Um estudo de caso no reservatório Moxotó, Rio São Francisco, Brasil. 2014b. 40 f. Trabalho de Conclusão de Curso (Bacharelado em Engenharia de Pesca). Universidade do Estado da Bahia – Paulo Afonso (BA).
Silva, B.C. da, Giustina, E.G.D., Marchiori, N. da C., Massago, H. & Silva, F.M. 2017. Desempenho produtivo da piscicultura catarinense em 2015. Florianópolis: Epagri, 17 pp. (Epagri. Documentos, 268). (also available at http://abccam.com.br/site/wp-content/uploads/2015/03/ARTIGO-REVISTA-GLOBAL-AQUACULTURE.pdf).
SINDIRAÇÕES. 2017. Boletim informativo do setor de alimentação animal. May 2017. http://sindiracoes.org.br/produtos-e-servicos/boletim-informativo-do-setor/ (access on June 2017).
Souza, D.S. 2013. Desenvolvimento de software em linguagem C Sharp como ferramenta para o gerenciamento do modelo de pisciculturas associativas implantadas no reservatório de Moxotó, rio São Francisco. 2013. 54 f. Dissertação (Bacharelado em Engenharia de Pesca), Universidade do Estado da Bahia, Paulo Afonso.
Tamassia, S.T.J. 2011. Indicadores técnico-econômicos para o gerenciamento do modelo alto Vale do Itajaí de piscicultura integrada (MAVIPI). Tese de Doutorado em Aquicultura, Universidade Estadual Paulista, Jaboticabal.
Tomek, W.G. & Robinson, K.L. 2003. Agricultural product prices, 4th ed. New York, Cornell University.
Valenti, W.C. 2008. A aqüicultura brasileira é sustentável? Aqüicultura & Pesca, 34(4): 36–44.

44
Valenti, W.C., Pereira, J.A. & Borghetti, J.R. 2000. Aquicultura no Brasil: bases para um desenvolvimento sustentável. Brasília, DF: CNPq; Ministério da Ciência e Tecnologia. 399 pp.
Zimmermann, S. 1999. Incubação artificial. Tecnica Permite a Produção de Tilapias do Nilo Genaticamente Superiores. Panorama da Aquicultura, 54(9): 15–21.
Zimmermann, S. 2000. O bom desempenho das Chitraladas no Brasil. Panorama da Aquicultura, julho/agosto: 15–17.

