social and health-system factors that affect …these studies all organize the factors that affect...
TRANSCRIPT

SOCIAL AND HEALTH-SYSTEM FACTORS THAT AFFECT HEALTH:
What’s Known and Knowable?A Review of Literature
Kate Raphael, Research Assistant
Austin Frakt, Principal Investigator
Ashish Jha, Committee Co-Chair
Sherry Glied, Committee Co-Chair
DRIVERS of HEALTH DRIVERSofHEALTH
DRIVERS OFHEALTH
DRIVERS OFHEALTH
DRIVERS OFHEALTH
DRIVERSofHEALTH

DRIVERS OF HEALTH2
Committee
Co-ChairsAshish Jha, MD, MPH
Dean for Global Strategy, K.T. Li Professor of Global Health, Director of Harvard
Global Health Institute
Sherry Glied, PhD, MA
Dean of Robert F Wagner Graduate School of Public Service, New York University
MembersMarshall Chin, MD, MPH
Professor of Healthcare Ethics, University of Chicago Department of Medicine
Heather Howard, JD
Lecturer in Public Affairs, Woodrow Wilson School of Public & International
Affairs, Princeton University; Director, State Health and Value Strategies
James S. Jackson, PhD
Distinguished Professor of Psychology, College of Literature, Science, and the
Arts, University of Michigan
Sachin Jain, MD, MBA
President and CEO of CareMore Health, Los Angeles
Paula Lantz, PhD, MS, MA
Associate Dean for Academic Affairs, Professor of Public Policy, Gerald R. Ford
School of Public Policy, University of Michigan
David Nerenz, PhD
Director of the Center for Health Policy and Health Services Research, Henry
Ford Health System, Detroit, Michigan
Michael D Stein, MD
Chair of Department of Health Law, Policy, & Management, Boston University
School of Public Health
Gail Wilensky, PhD
Economist, Senior Fellow at Project HOPE, Bethesda, MD

DRIVERS OF HEALTH3
Table of Contents
Committee 2
Executive Summary 4
Section 1: Historical Background 5
Section 2: Literature that Quantifies the Distribution of Health Impact 7
Section 3: Draft Framework 13
Section 4: The Effect of the Health System on Health 16
Section 5: Social Determinants 18
Section 6: Conclusion 23
Appendix 24
References 28

DRIVERS OF HEALTH4
Executive SummaryWhile there is widespread understanding that the health system and other factors — social determinants — affect health, we know relatively little about their precise contributions to health differences across a population at a point in time or differences in health of a fixed population over time. Section 1 of this literature review provides brief historical background on the work done in the last forty years to quantify the contributions of various factors to health; while several attempts were made, many of them were not evidence based and are now outdated, motivating revisiting this topic.
Section 2 reviews the literature that attempts to quantify the contribution of key factors that affect health: behaviors, social circumstances, environment, genetics, and medical care. The studies reviewed converge in estimating that behaviors largely affect health (30-50%) while environmental factors are relatively small contributors to overall health (3-10%). This literature varies widely in how much the health system and social circumstances affect health, and few studies provided insight into the genetic contribution to health. Several problems emerge in this subset of studies: the domains considered include a mix of proximate and distal factors; the studies do not illuminate the interactions among them; estimates range widely in some categories; and all of the studies are either outdated or inconsistent with more recent evidence.
In part to address some of these issues, in Section 3 we propose new, draft frameworks to guide thinking about drivers of health. One of our frameworks include proximal and distal factors explicitly, and, for the proximate ones, focuses on those that are modifiable, beginning to suggest pathways to health. The other framework focuses on policy interventions. While these frameworks are subject to the input of the committee, they will serve as starting points for deliberation and refinement.
Section 4 explores some of the literature on the effect of the health system on health, suggesting that up to half of measured health outcomes may be attributable to medical care. In particular, health care since the mid-20th century can be credited for a large contribution to decreases in deaths due to coronary heart disease and infant mortality. However, even if medical care is responsible for half of these gains, an enormous, growing body of literature suggests strong associations between social determinants and health, with a few studies providing strong evidence of causality. Section 5 reviews literature on how education, income/wealth, social status, and racial identity affect health through complex, multidirectional pathways.
DRIVERS OF HEALTH5
Section 1: Historical BackgroundA common view among many policymakers and health care policy experts is that the U.S. spends too much on health care, and might better serve the health of its citizens by investing more in factors outside of the health care system that affect health. This sentiment motivates investments in social determinants of health among public health programs and health systems. However, we lack reliable evidence to indicate where and how much to invest, leaving policymakers, payers, and health systems largely flying blind. Teasing out how much of our health (either across a population at a point in time or within a population over time) is attributable to access to and quality of the health care system versus other factors like health behaviors, genetics, or the environment better enables us to determine where to invest our efforts to maximize the health of the American people.
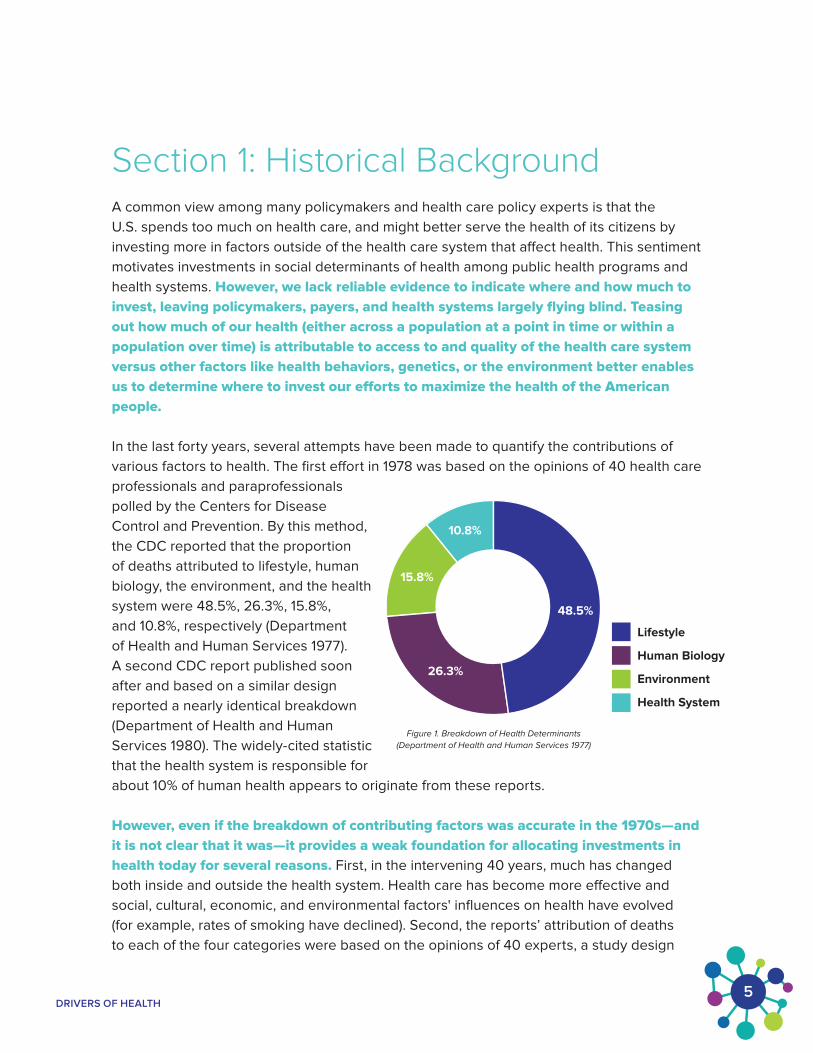
In the last forty years, several attempts have been made to quantify the contributions of various factors to health. The first effort in 1978 was based on the opinions of 40 health care professionals and paraprofessionals polled by the Centers for Disease Control and Prevention. By this method, the CDC reported that the proportion of deaths attributed to lifestyle, human biology, the environment, and the health system were 48.5%, 26.3%, 15.8%, and 10.8%, respectively (Department of Health and Human Services 1977). A second CDC report published soon after and based on a similar design reported a nearly identical breakdown (Department of Health and Human Services 1980). The widely-cited statistic that the health system is responsible for about 10% of human health appears to originate from these reports.
However, even if the breakdown of contributing factors was accurate in the 1970s—and it is not clear that it was—it provides a weak foundation for allocating investments in health today for several reasons. First, in the intervening 40 years, much has changed both inside and outside the health system. Health care has become more effective and social, cultural, economic, and environmental factors' influences on health have evolved (for example, rates of smoking have declined). Second, the reports’ attribution of deaths to each of the four categories were based on the opinions of 40 experts, a study design
26.3%
15.8%
10.8%
48.5%
Lifestyle
Human Biology
Environment
Health System
Figure 1. Breakdown of Health Determinants
(Department of Health and Human Services 1977)

DRIVERS OF HEALTH6
few would accept as definitive today. Third, the breakdown stemmed from a consideration of mortality, which is only one aspect of health. Finally, even knowing that, say, nearly half of health is due to lifestyle does not indicate what specific policies to adopt to effect change; even if it is accurate, the breakdown is not actionable.
Several years after these reports were published, the National Academy of Medicine identified areas and opportunities for research on the effects of behavior on health. This opened the door to more research that would shape our understanding of social determinants of health. NAM attempted to update this 1982 report in 2001, convening a committee to review and summarize the available research on links between biological, psychosocial, and behavioral factors and health, but it found the evidence inadequate to address these links (Committtee on Health and Behavior 2001). Unable to sufficiently evaluate the evidence that did exist, much of which was not truly evidence-based, the committee failed to come up with actionable strategies to move forward.
Nearly two decades later, it is time to revisit the question of what affects health and how to quantify the impact of relevant factors. This draft survey of the literature is intended as introductory background for such an effort. Over the next year, it will be revised with guidance from a committee we have convened as part of a Robert Wood Johnson Foundation-funded project to assess what is known and knowable about the factors that affect health.
The remainder of this document is organized as follows. In Section 2, we survey the literature that quantifies the distribution of health impact, reviewing nine prominent studies that divide the contribution of health into five categories: behaviors, social circumstances, environment, genetics, and medical care.
In Section 3, we outline our draft, proposed framework as an alternative way of capturing the many factors and pathways that affect health, and a method of guiding the project and our focus on the literature. (The appendix includes a survey of other organizations’ frameworks of factors that affect health.)
In Section 4, we survey some of the literature that has already been published on how the health system affects health, summarizing some of the most salient studies.Section 5 includes a broad overview of the literature on social determinants of health, which often include education, income/wealth, racial identity, and social status/rank. In this section, we begin to explore some proposed paths of causality between these factors and health, mechanisms which we plan to explore throughout the course of this project. Section 6 concludes.

DRIVERS OF HEALTH7
Section 2: Literature that Quantifies the Distribution of Health ImpactORGANIZATION AND BACKGROUND. The body of literature on social determinants and other health-connected factors is vast and growing. However, a smaller body of literature has attempted to quantify the extent to which several factors affect health outcomes. In this section, we summarize ten such studies (see Table 1) that are prominently cited. Our literature review did not return any additional studies of this type.
These studies all organize the factors that affect health into five categories: behaviors, social circumstances, environment, genetics, and medical care, though not every study provides estimates of the impact of every category. In explaining their methodology for selecting these factors, numerous studies reference the seminal McGinnis et al. (2002) paper, which relied on this breakdown, arriving at these five domains by “drawing on the power of the extensive studies of the past generation” and a 2001 report from the Institute of Medicine (Committee on Health and Behavior 2001) which summarizes recent literature on these factors. GoInvo, the developers of a recent visual framework for the breakdown of social determinants explained their use of these same five determinants by referencing their appearance in the work published by eight prominent health organizations: The National Center for HIV/AIDS, Viral Hepatitis, STD, and TB Prevention, World Health Organization, Healthy People, Kaiser Family Foundation, New England Journal of Medicine, Health Affairs, Institute of Medicine, New South Wales Department of Health (Choi and Sonin 2017). Choi and Sonin (2017) describe their methodology for compiling and comparing these lists of health determinants, saying that there was no standard in terms of number of determinants, hierarchical organization of importance or weight, or the terminology used to refer to different factors; however, the report from the Institute of Medicine was deemed to be the most thorough, and the source from which the 95 determinants included in the graphic originated.
Though these five categories have become standard, they are not equivalent to one another in several respects. For example, some are reasonably considered proximate, directly affecting health, such as medical care, while others are likely more distal, affecting health through more indirect pathways, like social circumstances. The more distal factors affect health through multiple pathways not conveyed by the categorization framework. For example, social circumstances can degrade health through diminished physical access (distance, transportation), reduced resources (income, health insurance), poor health literacy, or direct discrimination, to name a few possible pathways. Additionally, medical care affects health through purposeful interventions (treatments and preventive care) while social factors are largely static or, in some cases, not modifiable (e.g., though age changes, its pace of change is unalterable).

DRIVERS OF HEALTH8
Studies we surveyed do not all examine the same health outcomes. While we group these studies for the purpose of comparison, their different methodologies, definitions, parameters, and timespans all influence their estimates. They are arguably not comparable for these reasons, which we point out below. For example, some studies examine health through the lens of mortality, attributing number of deaths to specific causes (Ford et al. 2007; Hunink et al. 1997; McGinnis and Foege 1993; McGinnis, Williams-Russo, and Knickman 2002; Mokdad et al. 2004, U.S. Department of Health and Human Services 1980), while Booske et al. (2010) defined health as the combination of health outcomes (both length and quality of life) and the WHO (2009) report defined “health risk” as “a factor that raises the probability of adverse health outcomes.” Park et al. (2015) defined health as a combination of morbidity and mortality metrics in combination with self-reported health status and other indicators of health. The United Health Foundation (2016) centered their study around a calculated “overall health score” assigned to each U.S. state as the aggregate of their identified social determinants as well as health outcomes.
BEHAVIORS. Though not every study estimated the effect of every factor on health, patterns emerge across the body of work. All studies report an estimate of the contribution of behaviors to overall health (while defining health differently as noted above and in Table 1). “Behaviors” can encompass a huge range of human habits and patterns that affect health; these studies tend to arrive at their estimates of behavioral contribution to health by summing the approximate contributions of
DHHS (1980)
United Health Foundation (2016)
Park et al. (2015)
McGinnis et al. (2002)
Hunink et al. (1997)
Ford et al. (2007)
Booske et al. (2010)
Figure 2. Range of Empirical Estimates for Factors that A�ect Health
49% 41% 11%
25% 60% 15%
27% 46% 26%
40% 50% 10%
50% 7% 43%
44% 9% 47%
30% 50% 20%
0% 20% 40% 60% 80% 100% 10% 30% 50% 70% 90%
Behaviors Social Circumstances, Environment, Genetics Medical Care
DRIVERS OF HEALTH9
discrete behaviors, frequently including diet, physical activity, and tobacco, alcohol, and other substance use (McGinnis and Foege 1993). A significant feature of these factors is that they are all modifiable and a substantial body of research links them to health, disease prevalence, and mortality, as well as the many socioeconomic and other social factors that drive specific health behaviors (Braveman & Gottlieb 2014). For example, socioeconomically disadvantaged neighborhoods with a higher concentration of convenience stores, which are the biggest retailers of tobacco products and are linked to increased tobacco use, tended to have higher rates of individual smoking (Chuang et al. 2005). This indicates the interaction across categories: social circumstances and health behaviors in particular, though there are others.
The studies we reviewed quantify health behaviors as responsible for 25-50% of health outcomes they examined, despite the fact that they used different methods and focused on different populations and time spans (the latter two indicated in the table). Though a full review of methodological differences is beyond the scope of this survey, a few examples illustrate the range. At the low end, the United Health Foundation (2016) estimated that 25% of health is attributed to behaviors. They arrived at this estimate, and others, through “a unique methodology developed and reviewed annually by a panel of leading public health scholars. This methodology balances the contributions of various factors to state health such as smoking, obesity, physical inactivity, binge drinking, high school graduation rates, children in poverty, access to care, and incidence of preventable disease” (United Health Foundation 2016).
Authors on the highest end of the range (50%; Hunink et al. 1997) arrived at their estimate using a Markov cohort model of patients with coronary heart disease with which they compared the difference in observed versus expected deaths. They claim that primary and secondary risk factors determined by behavior explain 50% of the reduction in coronary heart disease from 1980 to 1990. A similar approach was used by in the study by Ford et al. (2007): they used the US IMPACT model which has been used and verified previously (Capewell et al. 1999; Capewell et al. 2000; Critchley et al. 2004) to examine how changes in treatment and risk factor trends affect mortality from coronary heart disease in US adults aged 25-84; mortality rates were calculated using ICD-9 codes and expected mortality rates were projected for 2000 using 1980 mortality rates. The difference between the number of expected and observed deaths represents the total deaths prevented or postponed.
SOCIAL CIRCUMSTANCES. Only three studies explicitly examined the contribution of social circumstances. Booske et al. (2010), with a mixed-methods approach informed by prior literature that included similar weighting efforts, as well as stakeholder engagement, estimated that 40% of health is due to social circumstances. McGinnis et al. (2002) claim that 15% of early deaths are due to social circumstances. Their estimates are informed by research from 1980-2002, but no specific methods are articulated in their study. Park et al. (2015) used 2010-2013 County Health Rankings & Roadmaps data to estimate the contribution of each identified domain using three statistical
DRIVERS OF HEALTH10
models (ordinary least squares, structural equation modeling, and hierarchical linear modeling); taking the average of their three estimates (which range from 36-47%), their figure for social circumstances is 41% (Park et al. 2015). The estimates of Booske et al. (2010), McGinnis et al. (2002) and Park et al. (2015) may be so different in part because of their underlying methodological differences and because of different definitions of “health” (McGinnis et al. (2002) used early death while Booske et al.’s (2010) definition is broader and Park et al. (2015) used a combination of health outcomes and health indicators—see Table 1).
ENVIRONMENT. Eight of the ten studies examined provide estimates for the category of “environment,” responsible for 3-22.5% of health outcomes. Several studies divide the category up into “microbial agents” and “toxic agents”; while both of these categories have significant health impacts, they may not encompass other dimensions of how the environment affects health, such as extreme weather events, built environment, proximity to healthy food and other resources, etc. The WHO (2009) estimates 8.7% of health is attributable to the environment globally (this is the only study we reviewed that takes a global focus and reports on health outside of the United States); the authors report that five major risks (indoor smoke from solid fuels, unsafe water, urban outdoor air pollution, global climate change, and lead exposure) are responsible for 8.7% of deaths in the world, 2.6% in high income countries, and 9.6% in low- and middle-income countries. The highest estimate—22.5%—comes from the United Health Foundation (2015), using a methodology of statistical modeling for health in different US states based on a variety of measures and informed by a panel of public health experts to develop the model and assign health scores, as noted previously. This estimate may be higher than the others in part because the United Health Foundation (2016) included measures of community and built environment while most of the other studies defined environmental factors as toxic and microbial agents.
GENETICS. Only two studies we reviewed provided estimates of the genetic contribution to health: McGinnis et al. (2002) estimating the genetic contribution at 30%, the Department of Health and Human Services (1980) at 26.30%. One reason this factor is frequently excluded may stem from the fact that, to date, genetics are not modifiable, whereas the other categories are, whether directly or indirectly. The two studies that did make these estimates use different methodologies, neither of which are adequately articulated. Both McGinnis et al. (2002) and the Department of Health and Human Services (1980) use “early death” or mortality data to inform their estimates, yet lack a more rigorous justification for their arrival at these estimates. Other literature attempts to quantify the contribution of genetic factors to health, while explaining the large majority of the time, genetics alone do not cause disease; the risk of acquiring chronic diseases is influenced by a person’s genetics, exposures received during life, and the interactions between the two (Rappaport 2016). In the same study, Rappaport (2016) used data from Western European monozygotic twins to estimate population attributable fractions for 28 chronic diseases, and when linked to Western European mortality statistics, found that of 1.53 million Western European deaths in 2000, 0.25 million were attributed to genetics plus shared exposure, equating to 16.4%.

DRIVERS OF HEALTH11
MEDICAL CARE. The greatest range of estimates of responsibility for health outcomes emerged in the category of medical care, ranging from 10%-47% across seven studies. Two studies (McGinnis et al. 2002; U.S. Department of Health and Human Services 1980) made estimates of approximately 10%, employing similar methodologies of examining US mortality data. Although these two studies were published 25 years apart, McGinnis et al. (2002) cite the “long-standing estimate by the Centers for Disease Control and Prevention” as a reference for this 10% figure (Department of Health and Human Services 1980), which, as noted, was based on expert opinion. Two studies (Ford et al. 2007; Hunink et al. 1997) estimate that medical care accounts for about 45% of health; these two studies examined deaths specifically attributable to coronary disease, suggesting that improvements in medical care were largely responsible for the decrease in deaths due to coronary heart disease in the decades following 1980. Three studies estimated that medical care was responsible for between 15% and 26% of health, yet each employed significantly different methodologies to arrive at these estimates. The United Health Foundation (2016) estimates that medical care is responsible for 15% of health while Booske et al. (2010) estimated that medical care was responsible for 20% of health using a noticeably different methodology. This method combined deaths and Disability-Adjusted Life Years (a metric that attempts to capture years of “healthy life” lost and is calculated as the sum of Years of Life Lost and Years Lost due to Disability), relying on a variety of sources but with a methodology not fully articulated.
CONCLUSION. While the estimates in Table 1 and summarized above provide a good starting place, there are several reasons why more work is needed. First, only one study provides estimates across all categories; many of the studies we reviewed do not consider contributions from the health system, genetics, and social circumstances. Second, it is not clear that these factors are the “right” ones; these five domains include a mix of proximate and distal factors and the studies do not clarify the pathways between them and their potential health outcomes. Third, estimates range widely in some categories, suggesting we do not have a firm grasp on how much these factors affect health. In part, this could be due to varying methodology, period and population of focus, and outcomes selected. Fourth, some studies rely on methods that are of low rigor, such as the Department of Health and Human Services (1980) study, which used limited 1977 mortality data and relied on the opinions of 40 professionals. In the next section, we propose different frameworks (subject to revision by the committee) that may help address some of these issues.

DRIVERS OF HEALTH12
Source Domain of Factors that Affect Health Definition of Health?
Behaviors Social Circumstances
Environment Genetics Medical Care
Booske B. et al. (2010)Time span: 2008
30% 40% 10% 20%
Model of population health including: health outcomes (equal weighting of length and quality of life) and health factors (weighted scores for behaviors, clinical care, social and economic factors, environment)
Ford ES, Ajani UA, Croft JB, et al. (2007)Time span: 1980-2000
44%Breakdown:
Cholesterol: 24%
Blood
pressure: 20%
Physical
activity: 5%
47% Mortality from coronary heart disease
Hunink MG, Goldman L, Tosteson AN, et al. (1997)Time span: 1980-1990
50% 43% Mortality from coronary heart disease
McGinnis JM and Foege WH. (1993)Time span: 1977-1993
38%Breakdown:
Tobacco: 19%
Diet/activity: 14%
Alcohol: 5%
7%Breakdown:
Microbial agents: 4%
Toxic
agents: 3%
Deaths attributable to major external (nongenetic) factors
McGinnis JM, Williams-Russo P, Knickman JA. (2002)Time span: 1980-2001
40% 15% 5% 30% 10% "Early deaths" attributed to various categories of factors
Mokdad A et al. (2004)Time span: 1980-2002
39%Breakdown:
Tobacco: 18%
Diet/activity: 17%
Alcohol: 3.5%
7%Breakdown:
Microbial agents: 3.1%
Toxic agents: 2.3%
US Mortality
Park et al. (2015)Time span: 2010-2013 27.4% 41% 5.3% 26.3%
Health outcomes of mortality and morbidity including the following measures: premature death, self-reported health, poor physical and mental health days, and low birthweight
United Health Foundation (2016)Time span: 2015-2016
25% 22.5% 15%
Overall health score assigned as the aggregate of four categories of determinants (behaviors, community & environment, policy, and clinical care) and health outcomes
U.S. Department of Health and Human Services. (1980)Time span: 1977
48.5% 15.8% 26.3% 10.8% US Mortality
World Health Organization (2009)Time span: 2004
45%Breakdown:
Diet/activity: 25%
Tobacco: 17%
Alcohol/drug
use: 2%
3-10%“Health risk” is defined as “a factor that raises the probability of adverse health outcomes”

DRIVERS OF HEALTH13
Section 3: Draft FrameworksOVERVIEW. As the foregoing section demonstrates, there is already a significant body of literature that aims to tease apart and quantify the various components contributing to health. However, there are significant limitations in these decompositions. Some of these were noted at the conclusion of the previous section, but there are others. For example, most approaches are not attuned to the extent to which health-determining factors are modifiable through policy intervention (e.g., genetics are not modifiable; some features of the environment are).
For these and other reasons, we propose two alternative frameworks. The first, illustrated just below, includes proximal and distal factors explicitly and, for the proximate ones, focuses on those that are modifiable. This begins to illuminate some of the pathways between distal factors and health outcomes, but does not completely indicate all of them (which would be unwieldy). While this framework is subject to the input of the committee, it will serve as a starting place for guiding the course of the project.
This framework takes into account many previously published frameworks for social determinants of health, and reflects the strongest aspects of the visual frameworks we have gathered (for a complete list of the visual frameworks we have compiled and evaluated to create our working framework, see the appendix). Below, we clarify the methodology for structuring the framework and articulate some additional considerations to help guide discussion and refinement.
INDIRECT FACTORS
DIRECT FACTORS
HEALTH OUTCOMES
Indirect Factors
Direct Factors
Health Outcomes
OF H
EALTH
CARE
ENVIRONMENT ACCESS & Q
UA
LITY
OCC
UPA
TIO
N
G
ENETICS
HEALTH BEHAVIORS SOCIAL
CIRCUMSTANCES
FUN
CTIONAL AGE-ADJUSTED
STA
TUS MORTALITY
WELL BEING
QU
ALITY
OF LIFE/
EXPECTANCY
LIFE
Healthy Food
Predisp
osition to Disease Water Quality Schools
Sex
Air Quality Roads
SUCH AS SUCH AS
Household S
ocial Support
Exercise Diet Sleep
SUCH AS
SUCH AS
Smoking Alcohol Drug Use
Structure
&
Isolation

DRIVERS OF HEALTH14
DISTAL FACTORS VS. MODIFIABLE, PROXIMATE FACTORS. In this framework, we focus heavily on the distinction between distal factors, and modifiable, proximate, health-related factors. “Modifiable” refers to something changeable by means of policy intervention (e.g. focused policy efforts can improve air quality and other environmental factors, while we cannot currently modify genetics with policy). It is important to note that particular distal factors may still be modifiable, as these two classifications are not mutually exclusive (e.g. certain policies can increase access to education), but we have grouped government/policy, income/wealth, education, racial identity, gender identity, and genetics in the distal category because they generally only affect health through intermediary proximate factors. The classification of factors as “proximate” means that there is no intermediate factor or step between the identified proximate factor and health outcomes. For example, a health behavior like smoking cigarettes has a direct effect on a number of health outcomes, while a factor like education affects health outcomes through its effect on occupation, social circumstances, etc.
HEALTH OUTCOMES. Many possible health outcomes can be measured to help quantify the weight of various factors. We selected four categories—age-adjusted mortality, life expectancy, quality of life/well-being, and functional status—because they are commonly studied, prevalent in the literature, and reflect the kinds of issues people care most about. To be sure there are certainly other possible health outcomes, but many are along the pathway to ones included in this framework. For example, blood pressure is a measurable health outcome, but it is only important to the extent it effects mortality and quality of life, for example.
HISTORICAL VS. CURRENT, MARGINAL EFFECTS. When attempting to quantify the impact of modifiable, proximate health-related factors, it is important to make a distinction between how much of our current health is related to (or caused by) these factors versus how much of our current health can be improved by interventions that target particular factors. Grasping this distinction is critical so that we know where our dollars are best spent to maximize health improvement. In other words, how much have each of these factors affected our health in the past through today (historical effect or change over time) versus how much could they affect health today if policy was immediately changed (current, marginal effect, or addressing variation of health within a fixed population)?
For example, a disease like smallpox has a huge direct effect on health outcomes, but it has essentially been eradicated. So an additional investment in eradicating smallpox has virtually no marginal gains, even though the disease is closely linked to health outcomes. On the other hand, Alzheimer’s disease has an enormous, current impact on health and quality of life today. Development of a cure would have huge implications.
TIMESPAN. It is also relevant to consider the timespan on which we see certain effects taking place, especially when considering policy intervention. For example, with an environmental change such as improving the air quality, it would take a significant amount of time for all measurable changes in health outcomes to manifest; other interventions, such as dramatically increasing flu vaccination rates, could have significant health outcomes that would be observable on a much shorter timescale.

DRIVERS OF HEALTH15
CORRELATIONS VS. CAUSATION. When considering the available literature on links between various factors and measurable health outcomes, it is critical to clarify whether what we are observing or seeking is a correlation or causation. Correlations can guide hypothesis generation, but only causation is actionable in terms of policy. On the other hand, many areas of investigation are not readily accessible by the most rigorous methods for inferring causation (e.g. randomized trials). We may need to rely on a compelling body of observational work in some cases.
INTERVENTIONS. Finally, it is worth considering how a framework like this relates to policy intervention. The specific interventions that might be effective within a category (e.g., health behaviors) could change over time. For example, promotion of wearing motor vehicle seat belts was an important area for policy interventions in the 1970s and 1980s, but is less so now because doing so has become commonplace. Though health behaviors remain relevant to health today, the class of interventions that would have the largest impact are different.
Above is a second framework that focuses more explicitly on policy intervention. Though visually simple, it mirrors the conceptual model that governs clinical studies, with health outcomes as output and interventions as input. (As explained in the next section, studies of clinical interventions are the foundation of modern estimates of the effect of the health system on health.)
A key question that this framework calls to mind is: what are the specific interventions that have the largest effect on health? These could be in the domains of health care (treatments) or in other areas that principally target other needs (like housing, education, or income) but that may also have health effects.
A second question is, what are the important effect modifiers that regulate the degree to which an intervention affects health? (Possible examples include classic social determinants like racial identity, socio-economic status, and education.) The strength of such modifications need not be fixed over time.
Mortality
Quality of Life
Life Expectancy
HEALTH OUTCOME
HealthProductionFunction
INTERVENTIONClinical
Education
Income
Behavioral
Environmental
Housing

DRIVERS OF HEALTH16
Section 4: The Effect of the Health System on HealthDetermining the extent to which various social determinants and the health system affect health is a difficult problem that may never be fully and convincingly solved. Nevertheless, a great deal is known about some of the effects of some of the relevant factors. Because it is informed by clinical trials with hard outcomes (often including mortality), the effect of the health system on health may be the easiest to quantify. In this section we review some of the literature that does so, with the conclusion that 40-50% of improvements in measured health outcomes may be attributed to the health system, though with the caveat that these are estimates from the past and not necessarily current today.
Much of the literature in this area focuses on the latter half of the 20th century, during which great strides were made in reducing infant mortality and mortality from disease, including most prominently cardiovascular disease. One of the earliest efforts by Goldman and Cook (1984) focused on the latter and estimated that 40 percent of the decline in ischemic heart disease mortality between 1968 and 1976 is attributable to medical treatments. Capewell et al. (1999) arrived at a similar figure for 1994.
Bunker and Frazier (1994) examined the mortality reduction of medical interventions for common diseases and conditions (including cervical and colorectal cancer, peptic ulcer, ischemic heart disease, hypertension, kidney failure, infant respiratory failure, appendicitis, diabetes, pregnancy, pneumonia and influenza, tuberculosis, and trauma), estimating that of the 7.5 years of life expectancy gained between 1950 and the early 1990s, three years (or 40 percent) could be attributed to health care, the vast majority of which was due to reduced infant mortality and death from cardiovascular disease.
Bunker and Frazier (1994) also considered the effect of these interventions on broader well-being and quality of life, although this can be quantified in various ways, and it is unclear how to aggregate it across diseases and treatments. The study found that health care could relieve patients of the majority of quality of life impairment (as measured by a set of basic components of global quality of life including social functioning, physical mobility, capacity for self-care, mental health, and pain, adding in condition-specific measures when necessary) associated with a wide variety of conditions.1 But it did not provide an overall estimate of how much of changes in quality of life between 1950 and 1990 is due to health interventions.
1These included unipolar depression, heart disease and angina, osteoarthritis and joint dysfunction, pain
accompanying terminal cancer, peptic ulcers, gallstones with biliary colic, migraines, postoperative pain,
hypertrophy, osteoporosis and fracture, poliomyelitis and paralysis, nonfatal stroke, asthma, vision and
hearing impairments, cataract, trauma, cavities, periodontal disease, and edentulism and malocclusion.

DRIVERS OF HEALTH17
Evidence suggests that medical care plays a huge role in reducing mortality from cardiovascular disease; one study reports that modern medical and surgical interventions have prevented or postponed about 25,805 deaths, translating to 42% of the total decrease in coronary heart
disease deaths England and Wales between 1981 and 2000 (Unal, Critchley, and Capewell 2005). Bajekal et al. (2012) examined the years immediately following this two-decade decrease in an attempt to explain the accelerated reductions in annual coronary heart disease death rates. Examining the years from 2000-2007, they report that about half (52%) of the fall in coronary heart disease mortality is due to improvements in the uptake of medical and surgical treatments (Bajekal et al. 2012).
Evidence suggests that medical care is largely responsible for reductions in infant mortality as well. Williams and Chen (1982) examined the rapid decline in infant mortality from 1960 to 1977 in California and found that the biggest contributors to the decrease in perinatal mortality stemmed from the advent of two major medical technologies: neonatal intensive care and increased rate of cesarean section. Richardson et al. (1998) found that infant mortality decreased nearly 50% in 5 years for infants weighing less than 1500g and that all of this decline could be attributed to medical care. A third of the decline was attributable to improved condition on admission (reflecting better obstetric and delivery rom care) and two thirds of the decline was attributable to better intensive care (Richardson et al. 1998).
One limitation to attributing health improvement to health care is that as patients are treated they may also make lifestyle changes. Thus, some of the improvement in longevity and quality of life attributed to health care could be due to behavioral changes. Another limitation is that lifestyle, environmental, and genetic factors play a role in causing some of the conditions that are subsequently successfully treated by the health system. Just as the health system may cure disease, other factors outside it may be to blame for causing disease in the first place.
Another limitation of work in this area is that the effect of the health system on health changes over time. For example, its effect on patients with AIDS in the 1980s is very different than today’s AIDS patients. Finally, effects can vary over populations, perhaps modified by social determinants. For example, more educated individuals may be better able to avail themselves of health information than less educated ones. Social determinants and health care interact.
60%
50%
40%
30%
20%
10%
0%
Figure 3. Estimated reduction in CHD mortality attributable to medical
interventions in the latter half of the 20th century
Red
uctio
n in
CH
D m
orta
lity
due
to m
edic
al c
are
40%42%
40%
52%
40%
Goldman and Cook (1984)
Bunker and Frazier (1994)
Capewell et al. (1999)
Unal, Critchley, Capewell
(2005)
Bajekal et al. (2012)

DRIVERS OF HEALTH18
Section 5: Social DeterminantsOVERVIEW. As the previous section demonstrates, up to half of improvements in health outcomes may be attributable to medical care and the health system. Still, this leaves a great deal to be potentially explained by other factors. An enormous, growing body of literature suggests strong associations between social determinants and health; in some cases, evidence is strong enough to suggest pathways of causality between these factors and health outcomes.
One classic categorization of social determinants includes education, income, racial identity, and social class. A review by Cutler, Lleras-Muney, and Vogl (2011) examines two decades of research on each of these broad factors. Using mortality measures as well as self-reported health status (which aims to capture quality of life and is closely linked to objective measures of health), they describe the complex, multi-directional relationship between these SES measures.
EDUCATION. Cutler et al. (2011) look first at the way SES affects health from the perspective of the individual in the domains of education and wealth, where these factors affect a person’s ability to navigate the world and participate in economic life. They report that “education is strongly related to health, with both reverse causality and direct effects.” For example, people in poor health from a young age may be unable to pursue education to the extent of those with better health, and better education can lead to higher earning power, which can facilitate a wide range of health behaviors that may promote health.
The authors acknowledge the deep complexity of these pathways. Indeed, concern about one's long-term interest may both motivate higher education and the maintenance of good health, by a variety of means. Yet the mechanisms by which education affects these health outcomes, though plausible, are poorly understood. Grimard and Parent's (2007) finding provides insight about one possible mechanism through which education may improve health: it reduces people’s engagement in risky behaviors because increased education lowers the “discount rate” and individuals with lower discount rates tend to be more “future-oriented” and invest more in long term benefits (Farrell and Fuchs 1982); because more educated people are paid more, going to college may lower the discount rate and disincentivize individuals to engage in risky behaviors that may jeopardize their future health and earning power.
Nevertheless, it is well documented that education is associated with better health outcomes. People with at least some college education have mortality rates that are half those of people with at most a high school diploma (Woolf et al. 2007). In addition, more educated people exhibit less anxiety and depression, have fewer

DRIVERS OF HEALTH19
functional limitations, and are less likely to have a serious health condition like diabetes, cardiovascular disease, or asthma (Mackenbach 2006).
Many other factors besides education can affect health and can be difficult to control for (e.g. higher education and higher income have both been shown to be associated with health and could be affecting health independently and in tandem (Cutler et al. 2011)). However, some studies have taken advantage of natural experiments where policy changes are plausibly exogenous, allowing for causal inference. One study relied on the state compulsory education laws enacted between 1915 and 1939 (Lleras-Muney 2005). Because of these education policies, some children received more education than they likely would have otherwise and experienced longer lifespans, suggesting that education has a causal impact on mortality (Lleras-Muney 2005), though follow up studies indicate considerable variation in this effect (Meghir, Palme, and Simeonova 2018; Philip Oreopoulos 2006; van Kippersluis, O’Donnell, and van Doorslaer 2011; Lager and Torssander 2012; Clark and Royer 2013; Behrman et al. 2011). Other studies relied on the incentives to pursue more education inherent in a poor labor market, when the opportunity cost of spending more time in school is low (Arkes 2003) or as a means to avoid the Vietnam War draft (Grimard and Parent 2007); both studies found that greater education was highly associated with better health (Arkes 2003) and higher likelihood of never smoking (Grimard and Parent 2007). (Another study by Cutler, Deaton, and Lleras-Muney (2006), found that behaviors like reduced smoking rates and other “external causes,” such as motor vehicle accidents, account for approximately 21% of the nearly eight year increase in longevity between 1960 and 2000.)
Still, only a fraction of the correlation between education and mortality is attributable to health behaviors (Cutler et al. 2011). Education may provide the information and skills necessary to tackle complex problems that require advanced critical thinking and decision-making abilities (Cutler and Lleras-Muney 2006), the same skills needed to navigate our complex health system and address chronic diseases. Indeed, the hypothesis that more educated people are better equipped to access and benefit from technological advances in medicine than the less educated is supported by evidence that education gradients are steeper for diseases with more innovation (Glied and Lleras-Muney 2003).
700
600
500
400
300
200
100
0
Dea
ths
per
100
,00
0
657.0
404.2
Less than high school diploma or GED
689.5
421.1
High school diploma or GED
245.8
165.3
Some college or collegiate degree
Male Female
Age-Adjusted Mortality by Education, 2016
700
600
500
400
300
200
100
0
Figure 4. Age-Adjusted Mortality for People Ages 25-64 by Education, 2007 and 2016
Dea
ths
per
100
,00
0
665.2
387.4
Less than high school diploma or GED
600.9
336.8
High school diploma or GED
238.9
156.8
Some college or collegiate degree
Male Female
Age-Adjusted Mortality by Education, 2007

DRIVERS OF HEALTH20
INCOME/WEALTH. Better health is also associated with higher income and greater wealth. Again, reverse causality is at play. One must be reasonably healthy to keep a job, for example. But higher income also often comes with better health insurance and easier access to health care.
Income’s effect on health may be predominantly concentrated in childhood and early development (Case, Lubotsky, and Paxson 2002). A significant amount of evidence suggests that children of wealthier parents experience better health (perhaps because of better access to prenatal care and nutrition or due to living in less polluted environments); conversely, children who grow up in poverty and low-income settings experience worse health and child development outcomes (Case, Lubotsky, and Paxson 2002; Chaudry and Wimer 2016; Condliffe and Link 2012). Insults to health experienced in childhood can persist and even augment throughout a lifespan, so a healthier childhood tends to result in a healthier adulthood. Furthermore, because children born to higher income parents are more likely to obtain more education and have higher incomes themselves, the cyclic income-health relationship can translate across generations.
90
85
80
75
70
Figure 5. Expected Age at Death with respect to Household Income,
United States, 2001-2014 (Chetty et al. 2016)
Expe
cted
Age
at D
eath
for
40-Y
ear-
Old
s, y
Expected age at death, yWomen by household income percentile Bottom 1%: 78.8 (95% CI, 78.7-78.9) Top 1%: 88.9 (95% CI, 88.7-89.1)
Men by household income percentile Bottom 1%: 72.7 (95% CI, 72.6-72.9) Top 1%: 88.9 (95% CI, 87.2-87.5)
0 20 40 60 80 100
Women
Men

DRIVERS OF HEALTH21
SOCIAL STATUS. Greater education and wealth may also result in greater social status or rank, which has been linked to health (Cutler et al. 2011). The first Whitehall study, published in 1978 found that British civil servants of the highest employment grade (i.e., administrators) had lower CHD mortality rates than did civil servants of the lowest employment grade (i.e., messengers). Additionally, lower ranked civil servants were more likely to smoke and to be heavier with higher blood pressure and blood sugar (Marmot et al. 1978). This rank-health relationship has been replicated in numerous subsequent studies (Wilkinson and Marmot 2003).
Figure 6. Trends in remaining life expectancy (upper panels) and life disparity* (lower panels) at age 31
by sex and occupational class, Finland, 1971-2010 (van Raalte, Martikainen, and Myrskylä 2014)
*Life disparity is the sum of remaining life expectancy at each age, weighted by the number of
deaths at that age (van Raalte, Martikainen, and Myrskylä 2014)
Upper nonmanual
Lower nonmanual
Manual worker
Other
A: Males
C: Males
B: Females
D: Females
Rem
aini
ng L
ife E
xpec
tanc
y at
Age
31
(yea
rs)
55
50
45
40
35
YEAR1975 1985 1995 2005
55
50
45
40
35Rem
aini
ng L
ife E
xpec
tanc
y at
Age
31
(yea
rs)
YEAR1975 1985 1995 2005
Life
Dis
pari
ty a
t A
ge 3
1 (y
ears
)
11
10
9
8
YEAR1975 1985 1995 2005
Life
Dis
pari
ty a
t A
ge 3
1 (y
ears
)
11
10
9
8
YEAR1975 1985 1995 2005
DRIVERS OF HEALTH22
One hypothesis that links rank and health is that people of lower status lead more stressful lives. Stress has been shown to negatively change blood flow and trigger hormonal pathways that damage tissue and suppress the immune system (Seeman et al. 2001). According to both human and animal studies, the cumulative “allostatic load” of psychological and physiological stress increases the risk of cardiovascular events and raises mortality risk (Mcewen and Gianaros 2010; Melin et al. 1999).
RACIAL IDENTITY. Health also varies by racial and ethnic identities. African Americans have higher rates of mortality than white Americans, even after adjusting for income and education ( Cutler et al. 2011). Here too, there are childhood origins—African American infants are more likely to be born pre-term and with lower birth weights (Rawlings, Rawlings, and Read 1995; Branum and Schoendorf 2002). One reason may be that African Americans have less access to prenatal care. African American patients are also less likely to receive preventive health care (Gornick et al. 1996) and more likely to live in regions where the quality of health care and care providers is lower (Chandra and Skinner 2003). Disadvantages and stress stemming from a history of discrimination and community segregation may also play a role (Ahmed, Mohammed, and Williams 2007). Furthermore, a legacy of harm inflicted on black Americans within the health system has contributed to mistrust in health care institutions. Even today, this mistrust is not unfounded. For example, Bach et al. (2004) found that 80% of visits to physicians by black Medicare beneficiaries were accounted for by only 22% of physicians; the physicians who cared for black patients were less likely to be board certified and disproportionately reported practicing in resource-constrained settings compared to the physicians who cared for white patients (Bach et al. 2004). The authors report that the rates of screening for most diseases are lower among black patients than among white patients and that black patients, more often than white patients, receive diagnoses when diseases have progressed to advanced stages. One hypothesis for these disparities in care is that physicians, who are disproportionately not black, lack the cultural competency to adequately treat their black patients (Smedley et al 2003). Regardless of the causes of these disparities in care, they underscore the legitimacy of mistrust in the medical system.
Genetics may still play an important role, evidenced, for example, in the disproportionate prevalence of different genetic diseases among different ethnic groups. For example, significantly higher rates of sickle cell disease are observed among black people than among white or Hispanic people as more people of African ancestry carry the gene (Brousseau et al. 2010), which has been shown to confer a possible protective effect against malaria when carried in its heterozygous form (Williams et al. 2005). Cutler et al. (2011) do not discount that genetics is involved, but state that, “Even if genetics alone play some role, the current consensus is that the interaction of genes and environment is much more important in explaining outcomes—thus, racial and ethnic differences in health likely result in part from nongenetic sources, such as differences in behavior, access to care, social and cultural norms, and discrimination.”

DRIVERS OF HEALTH23
Section 6: ConclusionThere is a broad sense that a multitude of factors outside of the health system affect health. The studies we reviewed, though prominent, represent only a small fraction of the large body of literature that documents the significance of other factors—social determinants—and the pathways through which they affect health.
Still, the literature remains insufficient with respect to how much of health each of these factors contributes to health. There have been some estimates, but they have significant limitations. Almost none of them provide estimates across all the identified domains of factors that affect health. Even within the categories in which many estimates were proposed, the estimates range widely, indicating our understanding is incomplete and uncertain. Furthermore, some of these studies are founded on methods of low rigor. Finally, it is unclear that these domains of factors are the “right” ones. The five domains of behaviors, environment, medical care, social circumstances, and genetics appear frequently in the literature, yet they include both proximate and distal factors without clarifying the mechanisms through which they interact with each other and effect health outcomes. This historical breakdown among these five domains may not be the most useful categorization for some purposes, including policy development.
For these reasons, other frameworks may be warranted, and we proposed two in Section 3, informed by a survey of other, prominent frameworks (see Appendix) and an examination of the literature. Though no framework can capture every nuance of this complex space, highlighting some features may be more helpful for certain purposes. For example, clarifying proximate, modifiable factors versus the distal factors may help illuminate causal pathways that are amenable to policy intervention.
Despite the vast amount still unknown about how to influence health through policy, a great deal is known about some of the factors that affect health. A body of literature has developed since the mid-1990s that indicates up to half of modifiable health outcomes since the mid-20th century (principally mortality reduction) may be due to the health system. Social determinants of health are, therefore, still potentially responsible for a large proportion of health. For example, level of education has a strong association with health outcomes through a variety of pathways. More work is needed to illuminate those mechanisms to inform policy to affect change. The project this literature review informs will provide a starting point for that work.

DRIVERS OF HEALTH24
AppendixInstitution/Organization
Framework Published report
World Health Organization
Divided into structural (societal, economic, political context that dictate socioeconomic position) and intermediary determinants (material circumstances, psychosocial circumstances, behavior/biology, and health system). Key strengths: (1) Recognizes that some socioeconomic factors affect health through their effects on material circumstances and behavior, (2) shows the bidirectional causality. Socioeconomic factors affect health, but health affects some of those socioeconomic factors too (like income and education).Key weakness: Is not clear on which factors are modifiable.
Solar and Irwin, 2010.
National Academy of Medicine
Strength: separates determinants into structural and more direct (“intermediary”) determinants.
Weakness: the intermediate determinants are not completely delineated.
A Framework for Edu-cating Health Profes-sionals to Address the Social Determinants of Health:Publication that reviews a number of frameworks and comes up with this one. “A diverse com-mittee of experts was tasked with developing a high-level framework for educating health professionals to address the social determinants of health.”

DRIVERS OF HEALTH25
Institution/Organization
Framework Published report
GoInvo
Strengths: relies heavily on the available, and most current literature. Identifies and incorporates a LARGE number of factors. (Gives the impression of being exhaustive). Provides some reasoning for their respective percentages and gives a detailed explanation of their methodology.
Weakness: Assigns numerical figures to everything (how much can we trust/believe these exact percentages) and categorizes each factor as a microdeterminant or macrodeterminant
GoInvo: cites relevant social determinants literature and some basic mathematical calculations to create a composite visual.
Let’s Get Healthy California
Strength: Visually appealing and easy to parse. Captures a lot of relevant SDoH and other factors.
Weakness: organization could be improved/needs better distinction between direct and indirect factors.
Bay Area Regional health Inequities Initiative developed this framework which has been formally adopted by the California Dept. of Public Health.
They do not provide a report or justification for this particular framework.
National Collaborating Centre for Healthy Public Policy’s
Strength: Relatively streamlined figure (adapted from WHO figure).
Weakness: Incorporates sociopolitical factors, but doesn’t outline what these are, or how they differ from SDoH. Implies that all SDoH are direct influencers of health outcomes. Also does not include the health system.
Figure adapted from the National Collaborating Centre for Healthy Public Policy’s simplified representation of Solar & Irwin’s (2010) CSDH WHO Conceptual Framework (Morrison, 2017).
Appendix (continued)

DRIVERS OF HEALTH26
Institution/Organization
Framework Published report
Centers for Disease Control and Prevention: National Breast and Cervical Cancer Early Detection Program
Systems model with multiple bands of influence.
Weakness: Very unclear what the direct, modifiable factors are.
Social Ecological Model (represents the National Breast and Cervical Cancer Early Detection Program’s multi-level approach to breast and cervical cancer prevention.
Healthy People 2020
Strength: clean visual.
Weakness: Identifies five categories of SDoH but does nothing to explain interaction, relative weight, or effects on health.
“A “place-based” organizing framework, reflecting five (5) key areas of social determinants of health (SDOH), was developed by Healthy People 2020. The organizing framework has been used to identify an initial set of evidence-based resources and other examples of how a social determinants approach is or may be implemented at a state and local level.”
The Frieden Framework
Strength: Strength: Takes into account interventions rather than just correlation and causation and also suggests that “interventions focusing on lower levels of the pyramid tend to be more effective because they reach broader segments of society and require less individual effort. Implementing interventions at each of the levels can achieve the maximum possible sustained public health benefit."
Weakness: forcing the framework into a pyramid shape may not best explain SDoH.
Frieden, T. R. 2010. A framework for public health action: The health impact pyramid. American Journal of Public Health 100(4):590-595.
Appendix (continued)

DRIVERS OF HEALTH27
Institution/Organization
Framework Published report
The Danaher Framework, Wellesley Institute
Strength: Emphasis on community’s role and engagement with reducing health disparities.
Weakness: framework doesn’t identify specific SDoH, but may still be helpful in framing the discussion.
Danaher, A. 2011. Re-ducing disparities and improving population health: The role of a vibrant community sector. Toronto, ON: Wellesley Institute.
Appendix (continued)

DRIVERS OF HEALTH28
ReferencesAhmed, Ameena T., Selina A. Mohammed, and David R. Williams. 2007. “Racial Discrimination & Health: Pathways & Evidence.” Indian Journal of Medical Research.
Arkes, Jeremy. 2003. “Does Schooling Improve Adult Health?” Rand, DRU-3051.
Bach, Peter B., Hoangmai H. Pham, Deborah Schrag, Ramsey C. Tate, and J. Lee Hargraves. 2004. “Primary Care Physicians Who Treat Blacks and Whites.” New England Journal of Medicine 351 (6): 575–84. https://doi.org/10.1056/nejmsa040609.
Bajekal, Madhavi, Shaun Scholes, Hande Love, Nathaniel Hawkins, Martin O’Flaherty, Rosalind Raine, and Simon Capewell. 2012. “Analysing Recent Socioeconomic Trends in Coronary Heart Disease Mortality in England, 2000-2007: A Population Modelling Study.” PLoS Medicine 9 (6): 12. https://doi.org/10.1371/journal.pmed.1001237.
Behavior, Committee on Health and. 2001. Health and Behavior: The Intperplay of Biological, Behavioral, and Societal Influences. National Academies Press. https://doi.org/10.1007/978-3-319-89315-0_6.
Behrman, Jere R., Hans-Peter Kohler, Vibeke Myrup Jensen, Dorthe Pedersen, Inge Petersen, Paul Bingley, and Kaare Christensen. 2011. “Does More Schooling Reduce Hospitalization and Delay Mortality? New Evidence Based on Danish Twins.” Demography 48 (4): 1347–75. https://doi.org/10.1007/s13524-011-0052-1.
Booske, Bridget C, Jessica K Athens, David a Kindig, and Patrick L Remington. 2010. “Different Perspectives for Assigning Weights to Determinants of Health.” University of Wisconsin Population Health Institute, no. February: 1–20.
Branum, Amy M, and Kenneth C Schoendorf. 2002. “Changing Patterns of Low Birthweight and Preterm Birth in the United States, 1981-98.” Paediatric and Perinatal Epidemiology 16: 8–15.
Brousseau, David C., Julie A. Panepinto, Mark Nimmer, and Raymond G. Hoffmann. 2010. “The Number of People with Sickle-Cell Disease in the United States: National and State Estimates.” American Journal of Hematology 85 (1): 77–78. https://doi.org/10.1002/ajh.21570.
Bunker, John P, and Howard S Frazier. 1994. “Improving Health: Measuring Effects of Medical Care.” Milbank Quarterly.
Capewell, Simon, Robert Beaglehole, Mary Seddon, and J McMurray. 2000. “Explanation for the Decline in Coronary Heart Disease Mortality Rates in Auckland, New Zealand, between 1982 and 1993.” Circulation 102 (13): 1511–16. http://ovidsp.ovid.com/ovidweb.cgi?T=JS&PAGE=reference&D=emed5&NEWS=N&AN=2000343487.
Case, Anne, Darren Lubotsky, and Christina Paxson. 2002. “Economic Status and Health in Childhood: The Origins of the Gradient.” American Economic Review, no. 5: 1308–34.
Chandra, Amitabh, and Jonathan Skinner. 2003. “Geography and Racial Health Disparities.” National Bureau of Economic Research.
Chaudry, Ajay, and Christopher Wimer. 2016. “Poverty Is Not Just an Indicator: The Relationship between Income, Poverty, and Child Well-Being.” Academic Pediatrics 16 (3): S23–29. https://doi.org/10.1016/j.acap.2015.12.010.
Choi, Edwin, and Juhan Sonin. 2017. “Determinants of Health.” GoInvo. 2017. https://www.goinvo.com/vision/determinants-of-health/.
DRIVERS OF HEALTH29
References (continued)
Chuang, Ying-Chih, Catherine Cubbin, David Ahn, and Marilyn A. Winkleby. 2005. “Effects of Neighbourhood Socioeconomic Status and Convenience Store Concentration on Individual Level Smoking.” Journal of Epidemiology and Community Health 59 (7): 568–73. https://doi.org/10.1136/jech.2004.029041.
Clark, Damon, and Heather Royer. 2013. “The Effect of Education on Adult Mortality and Health: Evidence from Britain.” American Economic Review 103 (6): 2087–2120.
Condliffe, Simon, and Charles R Link. 2012. “American Economic Association The Relationship between Economic Status and Child Health : Evidence from the United States Author ( s ): Simon Condliffe and Charles R . Link The Relationship between Economic Status and Child Health : Evidence from the Unit” 98 (4): 1605–18.
Critchley, Julia, Jing Liu, Dong Zhao, Wang Wei, and Simon Capewell. 2004. “Explaining the Increase in Coronary Heart Disease Mortality in Beijing between 1984 and 1999.” Circulation 110: 1236–44. https://doi.org/10.1161/01.CIR.0000140668.91896.AE.
Cutler, David, Angus Deaton, and Adriana Lleras-Muney. 2006. “The Determinants of Mortality.” Journal of Economic Perspectives 20 (3): 97–120. https://doi.org/10.1257/jep.20.3.97.
Cutler, David M, and Adriana Lleras-muney. 2006. “Education and Health: Evaluating Theories and Evidence.” National Bureau of Economic Research.
Cutler, David M, Adriana Lleras-Muney, Tom Vogi, and Tom Vogl. 2011. “Socioeconomic Status and Health: Dimensions and Mechanisms.” The Oxford Handbook of Health Economics. https://doi.org/DOI: 10.1093/oxfordhb/9780199238828.013.0007.
Farrell, Phillip, and Victor R. Fuchs. 1982. “Schooling and Health: The Cigarette Connection.” Journal of Health Economics 1: 217–30. https://doi.org/10.1016/0167-6296(82)90001-7.
Ford, Earl S, Umed A Ajani, Janet B Croft, Julia Alison Critchley, Darwin R Labarthe, Thomas E Kottke, Wayne H Giles, and Simon Capewell. 2007. “Explaining the Decrease in U.S. Deaths from Coronary Disease, 1980–2000.” New England Journal of Medicine 356: 2388–98.
Glied, Sherry, and Adriana Lleras-Muney. 2003. “Health Inequality, Education and Medical Innovation.” National Bureau of Economic Research, 1–56.
Goldman, L., and E. F. Cook. 1984. “The Decline in Ischemic Heart Disease Mortality Rates. An Analysis of the Comparative Effects of Medical Interventions and Changes in Lifestyle.” Annals of Internal Medicine. https://doi.org/10.7326/0003-4819-101-6-825.
Gornick, Marian E., Paul W. Eggers, Thomas W. Reilly, Renee M. Mentnech, Leslye K. Fitterman, Lawrence E. Kucken, and Bruce C. Vladeck. 1996. “Effects of Race and Income on Mortality and Use of Services among Medicare Beneficiaries.” New England Journal of Medicine 335 (11): 791–99. https://doi.org/10.1056/nejm199609123351106.
Grimard, Franque, and Daniel Parent. 2007. “Education and Smoking: Were Vietnam War Draft Avoiders Also More Likely to Avoid Smoking?” Journal of Health Economics 26 (5): 896–926. https://doi.org/10.1016/j.jhealeco.2007.03.004.
Hunink, Maria G M, Lee Goldman, Anna N A Tosteson, Murray A Mittleman, Paula A Goldman, Lawrence W Williams, Joel Tsevat, and Milton C Weinstein. 1997. “The Recent Decline in Mortality from Coronary Heart Disease, 1980-1990.” JAMA: Journal of the American Medical Association 277 (7): 535–42.
Kippersluis, Hans van, Owen O’Donnell, and Eddy van Doorslaer. 2011. “Public Access NIH Public Access.” Journal of Human Resources 46 (4): 695–721. https://doi.org/10.1038/mp.2011.182.doi.

DRIVERS OF HEALTH30
References (continued)
Lager, Anton Carl Jonas, and Jenny Torssander. 2012. “Causal Effect of Education on Mortality in a Quasi-Experiment on 1.2 Million Swedes.” Proceedings of the National Academy of Sciences 109 (22): 8461–66. https://doi.org/10.1073/pnas.1105839109.
Lleras-Muney, Adriana. 2005. “The Relationship between Education and Adult Mortality in the United States.” The Review of Economic Studies 72 (1): 189–221. https://doi.org/10.1111/0034-6527.00329.
Marmot, M. G., G. Rose, M. Shipley, and P. J.S. Hamilton. 1978. “Employment Grade and Coronary Heart Disease in British Civil Servants.” Journal of Epidemiology and Community Health 32 (4): 244–49. https://doi.org/10.1136/jech.32.4.244.
Mcewen, Bruce S., and Peter J. Gianaros. 2010. “Central Role of the Brain in Stress and Adaptation: Links to Socioeconomic Status, Health, and Disease.” Annals of the New York Academy of Sciences 1186: 190–222. https://doi.org/10.1111/j.1749-6632.2009.05331.x.
Mcginnis, J Michael, and William H Foege. 1993. “Actual Causes of Death in the United States.” JAMA 270 (18): 2207–12.
Mcginnis, J Michael, Pamela Williams-Russo, and James R Knickman. 2002. “The Case For More Active Policy Attention To Health Promotion.” https://doi.org/10.1377/hlthaff.21.2.78.
Meghir, Costas, Marten Mårten Marten Palme, and Emilia Simeonova. 2018. “Education, Health and Mortality: Evidence from a Social Experiment.” American Economic Journal: Applied Economics 10 (2): 234–56. http://www.nber.org/papers/w17932.pdf%5Cnhttp://search.ebscohost.com/login.aspx?direct=true&db=ecn&AN=1291944&site=ehost-live%0Ahttp://www.nber.org/papers/w17932.
Melin, Bo, Ulf Lundberg, Jens Söderlund, and Marianne Granqvist. 1999. “Psychological and Physiological Stress Reactions of Male and Female Assembly Workers : A Comparison between Two Different Forms of Work Organization Linked References Are Available on JSTOR for This Article : Reactions of Male and Female Psychological And.” Journal of Organizational Behavior 20: 47–61.
Mokdad, Ali H, James S Marks, Donna F Stroup, and Julie L Gerberding. 2004. “Actual Causes of Death in the United States, 2000.” JAMA 291 (10): 1238–45.
Park, Hyojun, Anne M. Roubal, Amanda Jovaag, Keith P. Gennuso, and Bridget B. Catlin. 2015. “Relative Contributions of a Set of Health Factors to Selected Health Outcomes.” American Journal of Preventive Medicine 49 (6): 961–69. https://doi.org/10.1016/j.amepre.2015.07.016.
Philip Oreopoulos. 2006. “Estimating Average and Local Average Treatment Effects of Education When Compulsory Schooling Laws Really Matter.” American Economic Review 96 (1): 152–75. http://ideas.repec.org/a/aea/aecrev/v96y2006i1p152-175.html.
Raalte, Alyson A. van, Pekka Martikainen, and Mikko Myrskylä. 2014. “Lifespan Variation by Occupational Class: Compression or Stagnation Over Time?” Demography 51: 73–95. https://doi.org/10.1007/s13524-013-0253-x.
Rappaport, Stephen M. 2016. “Genetic Factors Are Not the Major Causes of Chronic Diseases.” PLoS ONE 11 (4): e0154387. https://doi.org/10.1371/journal.pone.0154387.
Rawlings, James S, Virginia B Rawlings, and John A Read. 1995. “Prevalence of Low Birth Weight and Preterm Delivery in Relation To The.” The New England Journal of Medicine 332 (2): 69–74.
Richardson, Douglas K., James E. Gray, Steven L. Gortmaker, Donald A. Goldmann, DeWayne M. Pursley, and Marie C. McCormick. 1998. “Declining Severity Adjusted Mortality: Evidence of Improving Neonatal Intensive Care.” Pediatrics 102 (4): 893–99. https://doi.org/10.1542/peds.102.4.893.

DRIVERS OF HEALTH31
References (continued)
S., Capewell, Morrison C.E., and McMurray J.J. 1999. “Contribution of Modern Cardiovascular Treatment and Risk Factor Changes to the Decline in Coronary Heart Disease Mortality in Scotland between 1975 and 1994.” Heart 81 (4): 380–86. http://ovidsp.ovid.com/ovidweb.cgi?T=JS&PAGE=reference&D=emed4&NEWS=N&AN=1999128563.
Seeman, T. E., B. S. McEwen, J. W. Rowe, and B. H. Singer. 2001. “Allostatic Load as a Marker of Cumulative Biological Risk: MacArthur Studies of Successful Aging.” Proceedings of the National Academy of Sciences 98 (8): 4770–75. https://doi.org/10.1073/pnas.081072698.
U.S. Department of Health and Human Services. 1977. “Ten Leading Causes of Death in the United States, 1975.”
———. 1980. “Ten Leading Causes of Death in the United States, 1977,” no. July. http://www.ncbi.nlm.nih.gov/entrez/query.fcgi?cmd=Retrieve&db=PubMed&dopt=Citation&list_uids=16434624.
Unal, Belgin, Julia Alison Critchley, and Simon Capewell. 2005. “Modelling the Decline in Coronary Heart Disease Deaths in England and Wales, 1981-2000: Comparing Contributions from Primary Prevention and Secondary Prevention.” British Medical Journal 331 (7517): 614–17. https://doi.org/10.1136/bmj.38561.633345.8F.
WHO. 2009. “Global Health Risks.” Who, 9–27. https://doi.org/10.2471/BLT.09.070565.
Wilkinson, Richard, and Michael Marmot. 2003. “Social Determinants of Health: The Solid Facts.”
Williams, Ronald L., and Peter M. Chen. 1982. “Identifying the Sources of the Recent Decline in Perinatal Mortality Rates in California.” Obstetrical and Gynecological Survey 306 (4): 207–14. https://doi.org/10.1097/00006254-198207000-00003.
Williams, Thomas N., Tabitha W. Mwangi, Sammy Wambua, Neal D. Alexander, Moses Kortok, Robert W. Snow, and Kevin Marsh. 2005. “Sickle Cell Trait and the Risk of Plasmodium Falciparum Malaria and Other Childhood Diseases.” The Journal of Infectious Diseases 192 (1): 178–86. https://doi.org/10.1086/430744.