social development budget south africa 2017/2018 · social development budget south africa...
TRANSCRIPT
1
© U
NIC
EF/
Hea
rfiel
d
Social development BUdGet SOUTH AFRICA
2017/2018
South africa

2
prefacethis budget brief is one of four that explore the extent to which the national budget and social services sector budgets address the needs of children under 18 years in South africa. the briefs analyse the size and composition of budget allocations for fiscal year 2017/18 as well as offer insights into the efficiency, effectiveness, equity and adequacy of past spending. their main objectives are to synthesise complex budget information so that it is easily understood by stakeholders and to present key messages to inform financial decision-making processes.
Key messages and Recommendationsoverall spending trends: expenditure on social development programmes as a share of total government expenditure appears stable and averages around 13 per cent. nonetheless, more work is required to reach all eligible social grant recipients and extend much-needed services to targeted beneficiaries. the government is encouraged to:1. expedite the process of developing a single overarching
legislative framework; 2. implement the widely accepted and cabinet-backed ‘Social
protection Floor’; 3. Finalise the core set of services that will be funded as integral
to the Social protection Floor.
composition of spending: the government has done well to maintain the real value of children-specific grants such as the child support, the foster and care dependency grants. the government is encouraged to:1. convince the national treasury that further expenditure
reductions over the new 2017 medium-term expenditure
Framework (mteF) baseline are not an option; 2. protect the real spending power of social grants for children
such that these grants can meet children’s nutrition and food diversity requirements;
3. develop its legislative agenda to include service delivery norms and standards that can be used by provincial social development departments to anchor bids for additional funding for social welfare services.
equity of spending: provincial departments of Social development (dSd) budgets are projected to grow at a real average annual rate of 0.2 per cent, which is not enough to cope with increasing demands for children’s services. the government is encouraged to:1. Support the full spending of available resources on the early
childhood development (ecd) conditional grant so as to increase the number of qualifying ecd centres and young children accessing the ecd subsidy;
2. publish service delivery norms and standards for key children’s programmes such as the children and Families programme to eliminate large disparities in per-child spending;
3. Urgently introduce much-needed stability and certainty in the transfers to non-profit organisations (npos) to avoid any disruptions to key social welfare services.
Financing: the government’s review of the provincial allocation formula holds promise for the better funding of the social development portfolio. nonetheless, the government is encouraged to:1. promote the introduction of a social development component
in the provincial equitable shares formula (peS); 2. Build understanding among stakeholders that changes in
national allocation formulae do not automatically translate into better funding for provincial social welfare services.
Real average annual rate projected growth of dSd budgets
0.2%
© U
NIC
EF/
Bar
t d
e R
uig
h

3
Social protection involves the delivery of goods
and services across a range of departments,
which include the delivery of social assistance
(social grants), education, interventions in health,
the expanded public works programme, water
and sanitation services, the provision of basic
services at local government and various labour
market interventions. In this budget brief, we
restrict our focus to the ten social development
departments and examine their contribution to
social protection 1 in South Africa.
South Africa has nine subnational (provincial) departments of social development, and a national Department of Social Development that leads policy-making and coordination in the sector. the mandate of the social development sector has been established through several laws and policies and these include:• The1997WhitePaperforSocialWelfare,whichsetsoutthe
broad principles for a developmental social welfare system in South africa;
• TheSocialAssistanceAct(2004),whichprovidesthelegislative framework for providing social assistance (the social grants system);
• TheChildren’sAct(2005),whichsetsouttheprinciplesrelating to the care and protection of children;
• TheOlderPersonsAct(2006),whichprovidesaframeworkfor empowering and protecting older persons;
• TheNon-profitOrganisation’sAct(1997),whichestablishes
an administrative and regulatory framework for npos;• TheSocialServicesProfessionsAct(1978),amended
1995,1996and1998,whichprovidesfortheestablishmentofa South african council for Social Service professions and for establishing control over the various social work professions;
• ThePreventionofandTreatmentforSubstanceAbuse(2008)(act no. 70 of 2008), which provides for a comprehensive response for the combating of substance abuse and for mechanisms aimed at demand and harm reduction in relation to substance abuse through prevention, early intervention, treatment and re-integration programmes.
In terms of the government’s Outcomes Framework,2 the social development sector takes ownership of Outcome 13, which calls for an “inclusive and responsive social protection system”(RSAGovernment,MTSF,2014–19).
The high-level targets for social development (and their corresponding share of the social protection commitments) are articulated in the country’s National Development Plan 2030 3 and confirmed in the sector’s Medium Term Strategic Framework (MTSF). these include: • By2030,SouthAfricashouldhaveacomprehensive
system of social protection that includes social security grants, mandatory retirement savings, risk benefits (such as unemployment, death and disability benefits) and voluntary retirement savings.
• Socialwelfareservicesshouldbeexpanded,withmoreeducation and training for social work practitioners (social workers, auxiliary social workers, child and youth care workers, and community development practitioners) and a review of funding for non-profit organisations;
• Ensuringthatindividualsandhouseholdsthatareeligibletoreceive social grants receive the support they need to access much-needed grants.
Section 1.introduction
© U
NIC
EF/
Bar
t d
e R
uig
h
4
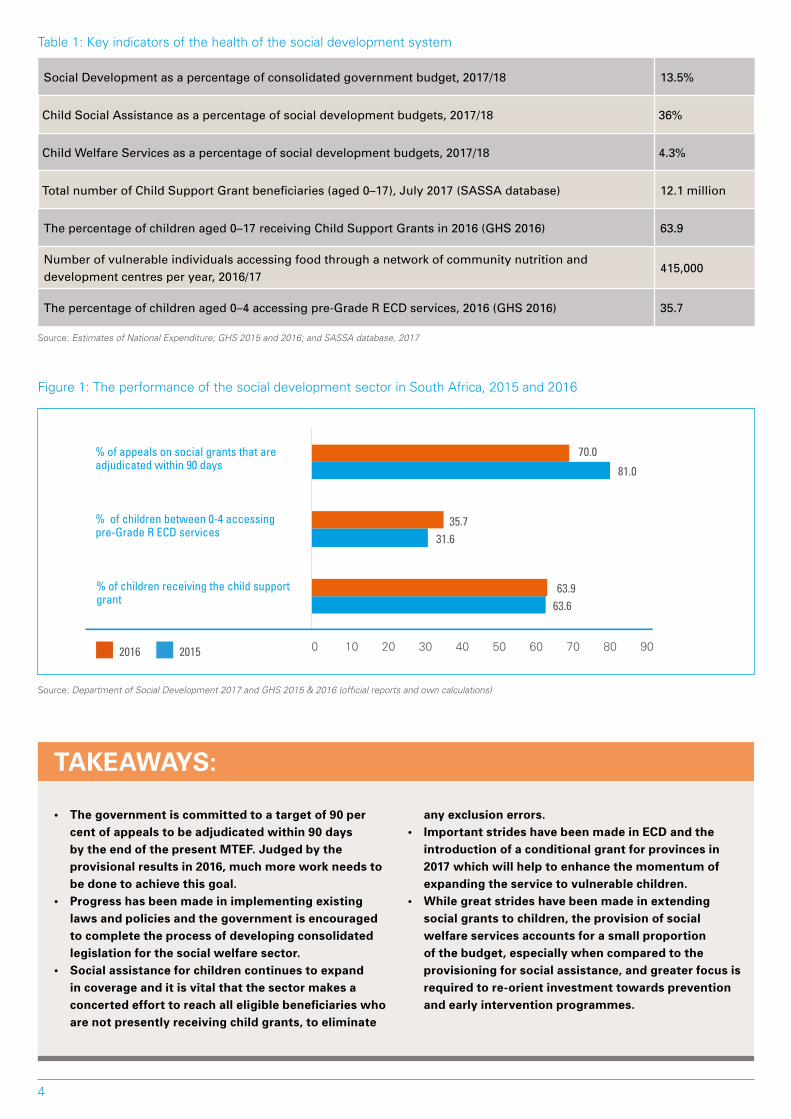
table 1: Key indicators of the health of the social development system
Social Development as a percentage of consolidated government budget, 2017/18 13.5%
Child Social Assistance as a percentage of social development budgets, 2017/18 36%
Child Welfare Services as a percentage of social development budgets, 2017/18 4.3%
Total number of Child Support Grant beneficiaries (aged 0–17), July 2017 (SASSA database) 12.1 million
The percentage of children aged 0–17 receiving Child Support Grants in 2016 (GHS 2016) 63.9
Number of vulnerable individuals accessing food through a network of community nutrition and development centres per year, 2016/17
415,000
The percentage of children aged 0–4 accessing pre-Grade R ECD services, 2016 (GHS 2016) 35.7
Source: Estimates of National Expenditure; GHS 2015 and 2016; and SASSA database, 2017
Figure1:TheperformanceofthesocialdevelopmentsectorinSouthAfrica,2015and2016
Source: Department of Social Development 2017 and GHS 2015 & 2016 (official reports and own calculations)
• Thegovernmentiscommittedtoatargetof90percentofappealstobeadjudicatedwithin90daysby the end of the present MTEF. Judged by the provisional results in 2016, much more work needs to be done to achieve this goal.
• Progresshasbeenmadeinimplementingexistinglaws and policies and the government is encouraged to complete the process of developing consolidated legislation for the social welfare sector.
• Socialassistanceforchildrencontinuestoexpandin coverage and it is vital that the sector makes a concerted effort to reach all eligible beneficiaries who are not presently receiving child grants, to eliminate
anyexclusionerrors.• ImportantstrideshavebeenmadeinECDandthe
introduction of a conditional grant for provinces in 2017 which will help to enhance the momentum of expandingtheservicetovulnerablechildren.
• Whilegreatstrideshavebeenmadeinextendingsocial grants to children, the provision of social welfare services accounts for a small proportion of the budget, especially when compared to the provisioning for social assistance, and greater focus is required to re-orient investment towards prevention and early intervention programmes.
TakEaWayS:
63.6
31.6
81.0
63.9
35.7
70.0
0 10 20 30 40 50 60 70 80 90 2016 2015
% of appeals on social grants that are adjudicated within 90 days
% of children receiving the child support grant
% of children between 0-4 accessing pre-Grade R ECD services
5
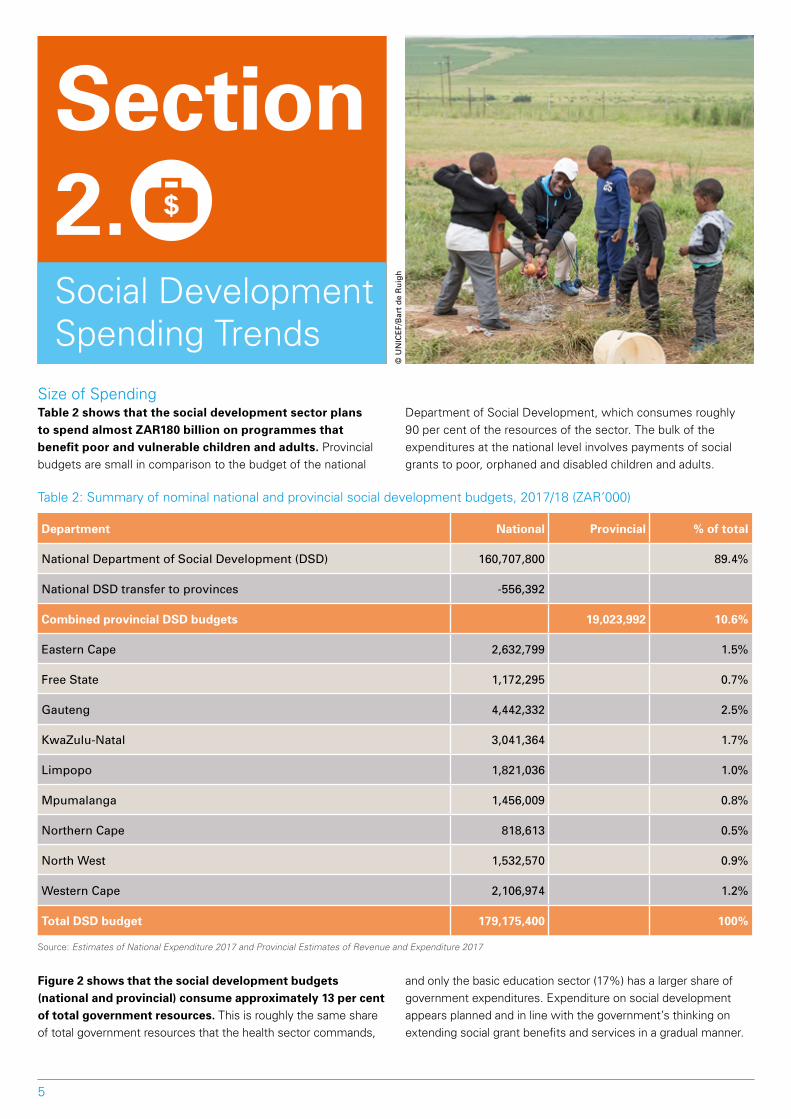
Size of SpendingTable 2 shows that the social development sector plans to spend almost ZAR180 billion on programmes that benefit poor and vulnerable children and adults. provincial budgets are small in comparison to the budget of the national
department of Social development, which consumes roughly 90percentoftheresourcesofthesector.Thebulkoftheexpenditures at the national level involves payments of social grants to poor, orphaned and disabled children and adults.
table 2: Summary of nominal national and provincial social development budgets, 2017/18 (ZaR’000)
Department National Provincial % of total
National Department of Social Development (DSD) 160,707,800 89.4%
National DSD transfer to provinces -556,392
Combined provincial DSD budgets 19,023,992 10.6%
Eastern Cape 2,632,799 1.5%
Free State 1,172,295 0.7%
Gauteng 4,442,332 2.5%
KwaZulu-Natal 3,041,364 1.7%
Limpopo 1,821,036 1.0%
Mpumalanga 1,456,009 0.8%
Northern Cape 818,613 0.5%
North West 1,532,570 0.9%
Western Cape 2,106,974 1.2%
Total DSD budget 179,175,400 100%
Source: Estimates of National Expenditure 2017 and Provincial Estimates of Revenue and Expenditure 2017
Figure 2 shows that the social development budgets (nationalandprovincial)consumeapproximately13percentof total government resources. this is roughly the same share of total government resources that the health sector commands,
and only the basic education sector (17%) has a larger share of government expenditures. expenditure on social development appears planned and in line with the government’s thinking on extending social grant benefits and services in a gradual manner.
Section 2. Social development Spending trends
© U
NIC
EF/
Bar
t d
e R
uig
h
6
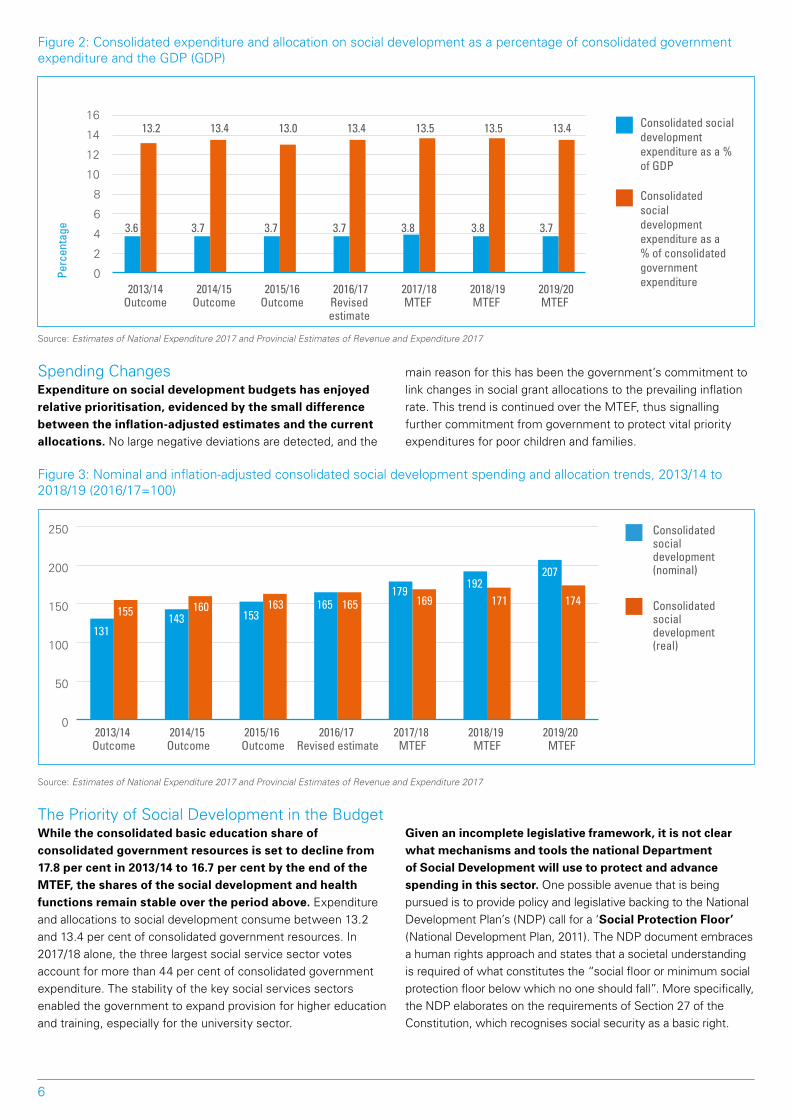
Figure 2: consolidated expenditure and allocation on social development as a percentage of consolidated government expenditure and the Gdp (Gdp)
Source: Estimates of National Expenditure 2017 and Provincial Estimates of Revenue and Expenditure 2017
Spending changesExpenditureonsocialdevelopmentbudgetshasenjoyedrelative prioritisation, evidenced by the small difference between the inflation-adjusted estimates and the current allocations. no large negative deviations are detected, and the
main reason for this has been the government’s commitment to link changes in social grant allocations to the prevailing inflation rate. this trend is continued over the mteF, thus signalling further commitment from government to protect vital priority expenditures for poor children and families.
Figure3:Nominalandinflation-adjustedconsolidatedsocialdevelopmentspendingandallocationtrends,2013/14to2018/19(2016/17=100)
Source: Estimates of National Expenditure 2017 and Provincial Estimates of Revenue and Expenditure 2017
the priority of Social development in the BudgetWhiletheconsolidatedbasiceducationshareofconsolidated government resources is set to decline from 17.8percentin2013/14to16.7percentbytheendoftheMTEF, the shares of the social development and health functions remain stable over the period above. expenditure and allocations to social development consume between 13.2 and13.4percentofconsolidatedgovernmentresources.In2017/18 alone, the three largest social service sector votes accountformorethan44percentofconsolidatedgovernmentexpenditure. the stability of the key social services sectors enabled the government to expand provision for higher education and training, especially for the university sector.
Given an incomplete legislative framework, it is not clear what mechanisms and tools the national Department of Social Development will use to protect and advance spending in this sector. one possible avenue that is being pursued is to provide policy and legislative backing to the national development plan’s (ndp) call for a ‘SocialProtectionFloor’ (national development plan, 2011). the ndp document embraces a human rights approach and states that a societal understanding is required of what constitutes the “social floor or minimum social protection floor below which no one should fall”. more specifically, the ndp elaborates on the requirements of Section 27 of the constitution, which recognises social security as a basic right.
Perc
enta
ge
0
2
4
6
8
10
12
14
16
3.6
13.2
3.7
13.4
3.7
13.0
3.7
13.4
3.8
13.5
3.8
13.5
3.7
13.4
2013/14Outcome
2014/15Outcome
2015/16Outcome
2016/17Revised estimate
2017/18MTEF
2018/19MTEF
2019/20MTEF
Consolidated social development expenditure as a % of GDP
Consolidated social development expenditure as a % of consolidated government expenditure
0
50
100
150
200
250
2019/20 MTEF
2018/19 MTEF
2017/18 MTEF
2016/17 Revised estimate
2015/16 Outcome
2014/15 Outcome
2013/14 Outcome
131143 153
165179
192207
155 160 163 165 169 171 174
Consolidated social development (nominal)
Consolidated social development (real)

7
Figure4:Socialservicesectorsasapercentageofconsolidatedgovernmentexpenditure,2013/14to2018/19
Source: Estimates of National Expenditure 2017 and Estimates of Provincial Revenue and Expenditure 2017
The response of the national Department of Social Developmentwastoinitiateareviewofthe1997WhitePaperforSocialWelfare(DepartmentofSocialDevelopment, 2016 4), and one of its recommendations endorsedtheadoptionofaSocialProtectionFloor. it argues that the establishment of a Social protection Floor will require additional resources and the re-prioritisation of expenditure. However, the document is less clear on the details of the re-prioritisation of expenditure.
Thecombinedsocialdevelopmentexpenditurestranslateinto a share of 3.6 per cent of the country’s Gross Domestic Product(GDP). South africa’s spending on social development (excluding other social protection expenditures) is high when compared with other middle-income countries. its share of the country’s Gdp is almost three times the spending in comparable countries such as argentina, Senegal and ethiopia.
Figure5:Socialassistanceasa%oftheGDP,2013,2014and2015
Source: World Bank ASPIRE Social Expenditure Indicators (accessed July 2017) and Estimates of National Expenditure, 2017 5
note: The Social Assistance definition used by the World Bank is not consistent with the South African estimates represented above because the South African figure excludes school feeding, public works and other social expenditures not under the control of the Department of Social Development.
Other
Health
Economic affairs
Basic education
Social development
Public order and safety
17.8
13.2
13.4
11.2
10.0
34.4
17.7
13.4
13.5
11.2
9.8
34.3
17.1
13.0
13.4
12.6
9.3
34.6
17.7
13.4
14.1
10.6
9.3
35.0
17.4
13.5
13.8
10.2
9.3
35.7
17.1
13.5
13.6
10.1
9.2
36.5
16.7
13.4
13.4
10.1
9.0
37.3
2013/14Outcome
2014/15Outcome
2015/16Outcome
2016/17Revised estimate
2017/18MTEF
2018/19MTEF
2019/20MTEF
0
10
20
30
40
50
60
70
80
90
100 Pe
rcen
tage
of c
onso
lidat
ed
gove
rnm
ent e
xpen
ditu
re
0
0.5
1
1.5
2
2.5
3
3.5
4
Soci
al a
ssis
tanc
e as
a %
of G
DP
3.7 South Africa 3.4 Namibia
2.9 Belarus
1.5 Argentinia
0.5 Tunisia
1.1 Ethiopia 1.0 Senegal
TakEaWayS:
• Comparedtoothersocialservicesectors,expenditureonsocialdevelopmenthasperformedwelloverthesix-year period considered in this budget brief.
• Expenditureonsocialdevelopmentprogrammesasashareoftotalgovernmentexpenditureappearsstableand averages around 13 per cent.
• Thelackofcomprehensivesocialdevelopmentlegislation,theexistenceofunevenservicedelivery
trends among subnational government and continued exclusionsofsomevulnerableindividualsandfamiliesinvariably mean that the social development budget is far from ‘adequate’.
• Recommendationsforasocialprotectionfloorarepromising, but it is unclear how the introduction of this practice will be accommodated in a cash-strapped spending environment.
8
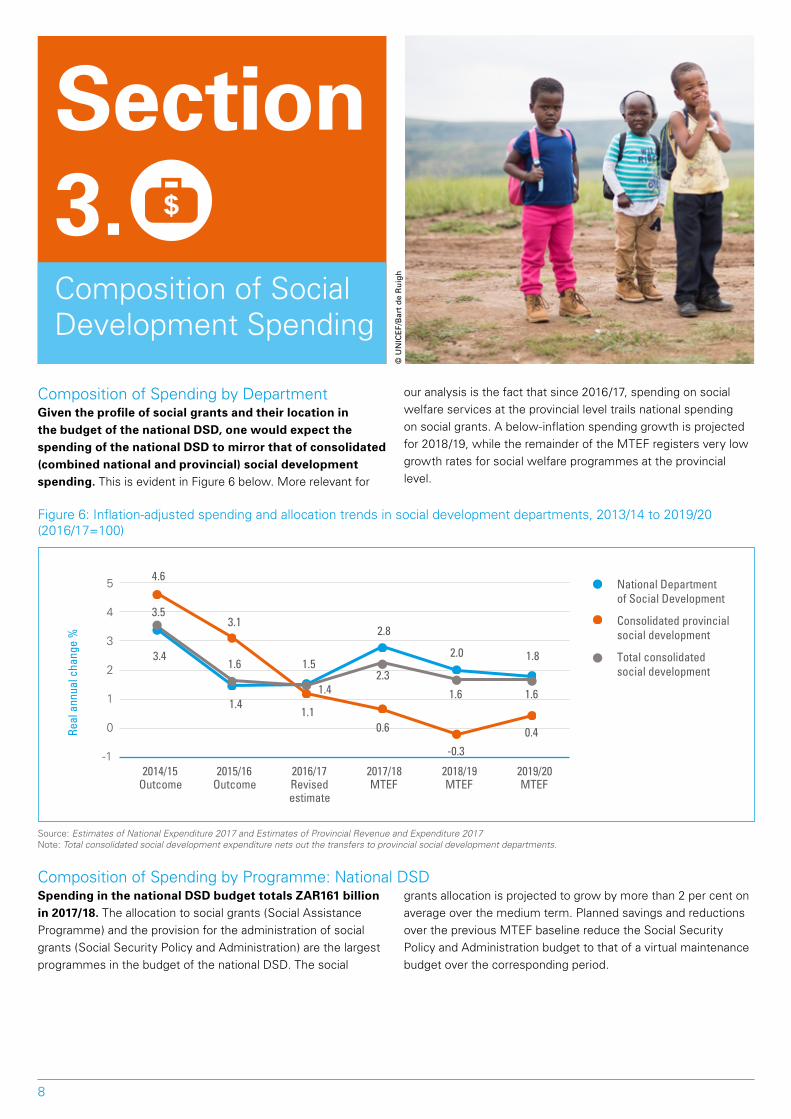
Section 3.
composition of Spending by departmentGiven the profile of social grants and their location in thebudgetofthenationalDSD,onewouldexpectthespending of the national DSD to mirror that of consolidated (combined national and provincial) social development spending.ThisisevidentinFigure6below.Morerelevantfor
ouranalysisisthefactthatsince2016/17,spendingonsocialwelfare services at the provincial level trails national spending on social grants. a below-inflation spending growth is projected for2018/19,whiletheremainderoftheMTEFregistersverylowgrowth rates for social welfare programmes at the provincial level.
Figure6:Inflation-adjustedspendingandallocationtrendsinsocialdevelopmentdepartments,2013/14to2019/20(2016/17=100)
Source: Estimates of National Expenditure 2017 and Estimates of Provincial Revenue and Expenditure 2017note: Total consolidated social development expenditure nets out the transfers to provincial social development departments.
composition of Spending by programme: national dSdSpending in the national DSD budget totals ZAR161 billion in 2017/18. the allocation to social grants (Social assistance programme) and the provision for the administration of social grants (Social Security policy and administration) are the largest programmes in the budget of the national dSd. the social
grants allocation is projected to grow by more than 2 per cent on average over the medium term. planned savings and reductions over the previous mteF baseline reduce the Social Security policy and administration budget to that of a virtual maintenance budget over the corresponding period.
composition of Social development Spending
Consolidated provincial social development
Total consolidated social development
National Department of Social Development
4.6
3.1
1.1 0.6
-0.3
0.4
3.5
1.6
1.4 2.3
1.6 1.6
-1
0
1
2
3
4
5
Real
ann
ual c
hang
e %
2014/15Outcome
2015/16Outcome
2016/17Revised estimate
2017/18MTEF
2018/19MTEF
2019/20MTEF
3.4
1.4
1.5
2.8
2.0 1.8
© U
NIC
EF/
Bar
t d
e R
uig
h
9
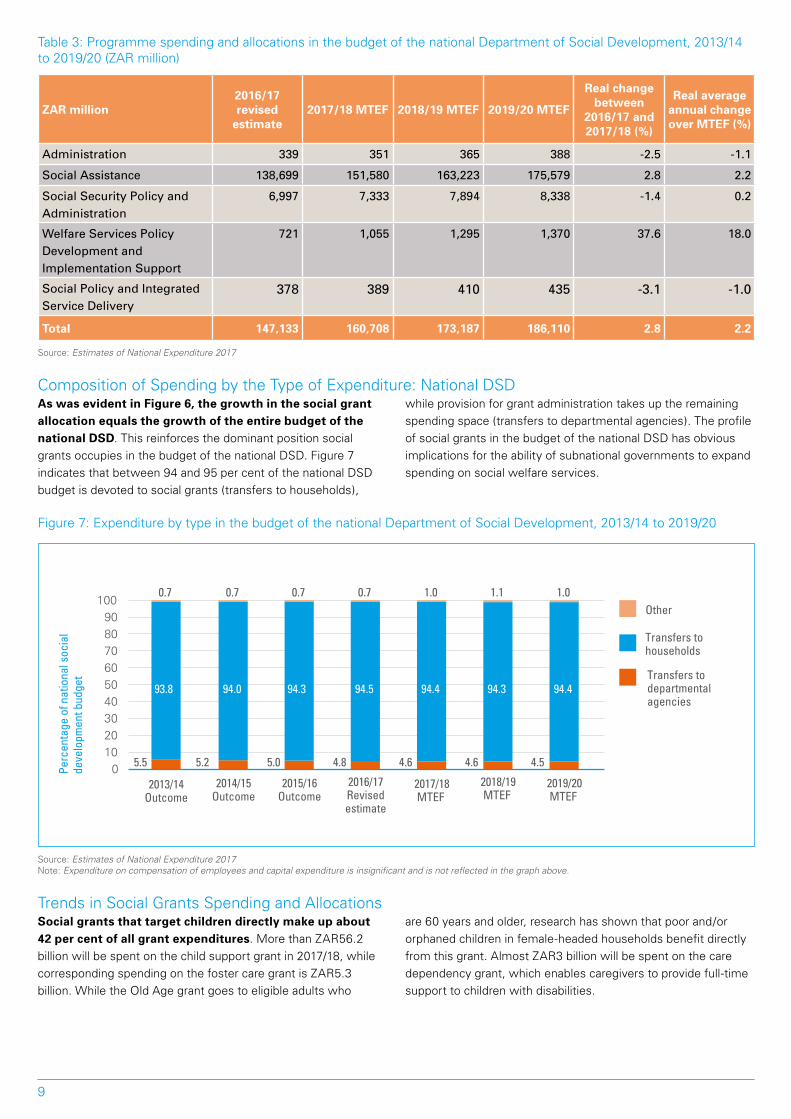
Table3:ProgrammespendingandallocationsinthebudgetofthenationalDepartmentofSocialDevelopment,2013/14to2019/20(ZARmillion)
ZAR million2016/17 revised
estimate2017/18 MTEF 2018/19MTEF 2019/20MTEF
Real change between
2016/17 and 2017/18 (%)
Real average annual change over MTEF (%)
Administration 339 351 365 388 -2.5 -1.1
Social Assistance 138,699 151,580 163,223 175,579 2.8 2.2
Social Security Policy and Administration
6,997 7,333 7,894 8,338 -1.4 0.2
Welfare Services Policy Development and Implementation Support
721 1,055 1,295 1,370 37.6 18.0
Social Policy and Integrated Service Delivery
378 389 410 435 -3.1 -1.0
Total 147,133 160,708 173,187 186,110 2.8 2.2
Source: Estimates of National Expenditure 2017
composition of Spending by the type of expenditure: national dSdAs was evident in Figure 6, the growth in the social grant allocation equals the growth of the entire budget of the national DSD. this reinforces the dominant position social grants occupies in the budget of the national dSd. Figure 7 indicatesthatbetween94and95percentofthenationalDSDbudget is devoted to social grants (transfers to households),
while provision for grant administration takes up the remaining spending space (transfers to departmental agencies). the profile of social grants in the budget of the national dSd has obvious implications for the ability of subnational governments to expand spending on social welfare services.
Figure7:ExpenditurebytypeinthebudgetofthenationalDepartmentofSocialDevelopment,2013/14to2019/20
Source: Estimates of National Expenditure 2017note: Expenditure on compensation of employees and capital expenditure is insignificant and is not reflected in the graph above.
trends in Social Grants Spending and allocationsSocial grants that target children directly make up about 42percentofallgrantexpenditures.MorethanZAR56.2billion will be spent on the child support grant in 2017/18, while correspondingspendingonthefostercaregrantisZAR5.3billion.WhiletheOldAgegrantgoestoeligibleadultswho
are60yearsandolder,researchhasshownthatpoorand/ororphaned children in female-headed households benefit directly from this grant. almost ZaR3 billion will be spent on the care dependency grant, which enables caregivers to provide full-time support to children with disabilities.
Fig 7
Other
5.5 5.2 5.0 4.8 4.6 4.6 4.5
93.8 94.0 94.3 94.5 94.4 94.3 94.4
0.7 0.7 0.7 0.7 1.0 1.1 1.0
0 10 20 30 40 50 60 70 80 90
100
2013/14Outcome
2014/15Outcome
2015/16Outcome
2016/17Revised estimate
2017/18MTEF
2018/19MTEF
2019/20MTEF
Perc
enta
ge o
f nat
iona
l soc
ial
deve
lopm
ent b
udge
t
Transfers to households
Transfers to departmental agencies
10
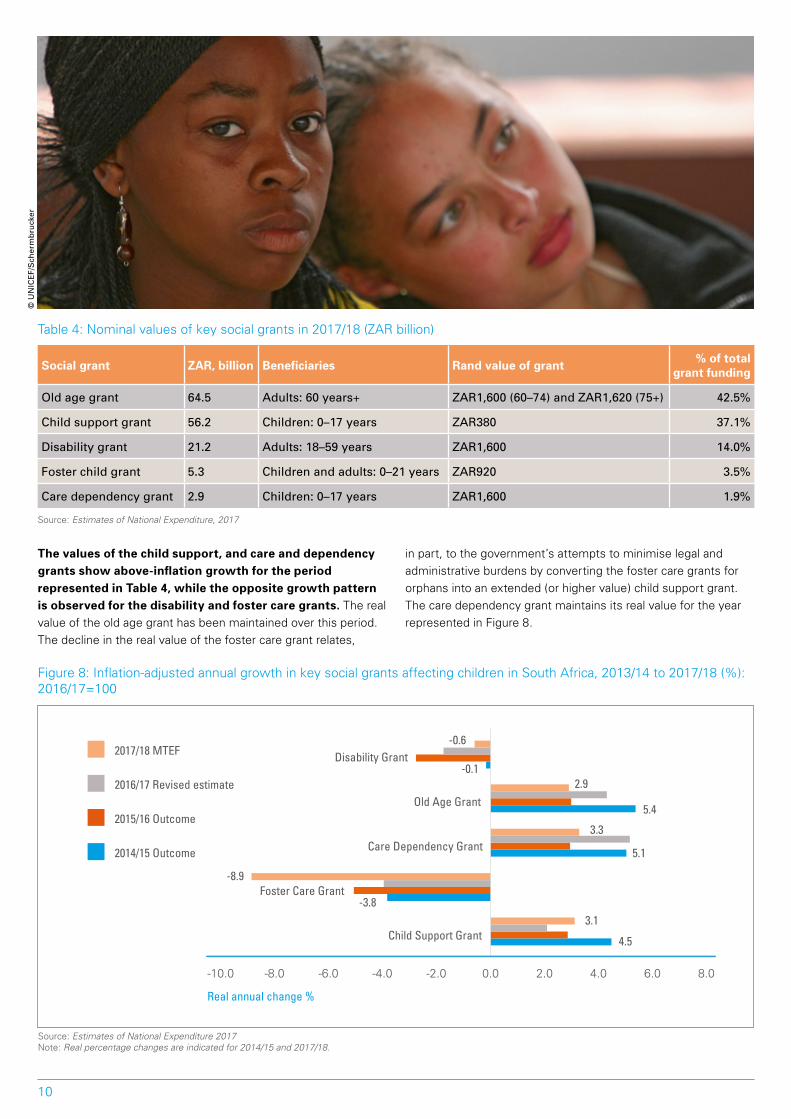
Table4:Nominalvaluesofkeysocialgrantsin2017/18(ZARbillion)
Social grant ZAR, billion Beneficiaries Rand value of grant % of total grant funding
Old age grant 64.5 Adults: 60 years+ ZAR1,600 (60–74) and ZAR1,620 (75+) 42.5%
Child support grant 56.2 Children: 0–17 years ZAR380 37.1%
Disability grant 21.2 Adults: 18–59 years ZAR1,600 14.0%
Foster child grant 5.3 Children and adults: 0–21 years ZAR920 3.5%
Care dependency grant 2.9 Children: 0–17 years ZAR1,600 1.9%
Source: Estimates of National Expenditure, 2017
The values of the child support, and care and dependency grants show above-inflation growth for the period representedinTable4,whiletheoppositegrowthpatternis observed for the disability and foster care grants. the real value of the old age grant has been maintained over this period. the decline in the real value of the foster care grant relates,
in part, to the government’s attempts to minimise legal and administrative burdens by converting the foster care grants for orphans into an extended (or higher value) child support grant. the care dependency grant maintains its real value for the year represented in Figure 8.
Figure8:Inflation-adjustedannualgrowthinkeysocialgrantsaffectingchildreninSouthAfrica,2013/14to2017/18(%):2016/17=100
2017/18 MTEF
2016/17 Revised estimate
2015/16 Outcome
2014/15 Outcome
Real annual change %
4.5
-3.8
5.1
5.4
-0.1
3.1
-8.9
3.3
2.9
-0.6
-10.0 -8.0 -6.0 -4.0 -2.0 0.0 2.0 4.0 6.0 8.0
Child Support Grant
Foster Care Grant
Care Dependency Grant
Old Age Grant
Disability Grant
Source: Estimates of National Expenditure 2017note: Real percentage changes are indicated for 2014/15 and 2017/18.
© U
NIC
EF/
Sch
erm
bru
cker

11
Figure9showsthatalmost64percentofchildrenreceivedthechildsupportgrantin2015,and1.5percentofchildrenreceived the foster care grant during the same period. these estimates were calculated from the General Household
Survey (GHS) and as indicated below, the percentage of children who have accessed the foster child grant might be lower than corresponding data provided by the South african Social Security agency (SaSSa).
Figure9:PercentageofchildrenwithchildsupportandfosterchildgrantsinSouthAfricain2016(childrenaged0–17)
Source: General Household Surveys 2016 (own calculations)note: The actual number of foster child grant recipients reported by SASSA is much larger than the estimated numbers from the GHS 2016. At the end of 2015, SASSA 6 reported 427,928 grant recipients against an estimated 284,455 recipients in GHS 2016.
• Thegovernmenthassucceededinmaintainingthereal value of social grants over the medium term, thus continuing a long-standing practice to protect spending on social grants.
• Spendingonsocialgrantsaccountsforapproximately95percentofthespendinginthebudgetofthenationalDSD,whileroughly5percentofexpenditureprovides for allocations on the administration of the grant.
• keychild-specificgrantssuchasthechildsupportandthe care dependency grants maintain their positive real value, while grant spending that indirectly benefit children (spending on the old age grant) also grew above inflation.
• Therealdeclineinthefostercaregrantrelatesto
attempts to remove orphaned children from this grant and introduce a new ‘child support top up’ grant, which minimises the administrative and legal burden on the system, while still maintaining an allocation value in linewiththeexistingfostercaregrant.
• asubstantialnumberofpoorchildrenarereceivingthechildsupportgrantandmorechildrenareexpectedtobe covered over the medium term.
• TheDepartmentofSocialDevelopmenthascommittedto reducing overall social grant transaction costs, in line with reduced budgets over the previous MTEF baseline.
• Whilestrongspendingonsocialgrantsoffersprotection to poor and vulnerable children, this has oftencomeattheexpenseofspendingonservicesthatare developmental and preventative in orientation.
TakEaWayS:
Fig 9
76.0 67.8
41.6
73.0 74.7 70.2 72.2
66.4
47.3
63.9
0.0
0.5
1.0
1.5
2.0
2.5
3.0
0
10
20
30
40
50
60
70
80
Eastern Cape
Free State
Gauteng
KwaZulu-Natal
Limpopo
Mpumalanga
Northern Cape
North W
est
Weste
rn Cape
South Africa
Perc
enta
ge o
f chi
ldre
n re
ceiv
ing
FCG
Perc
enta
ge o
f chi
ldre
n re
ceiv
ing
CSG
CSG
FCG
12
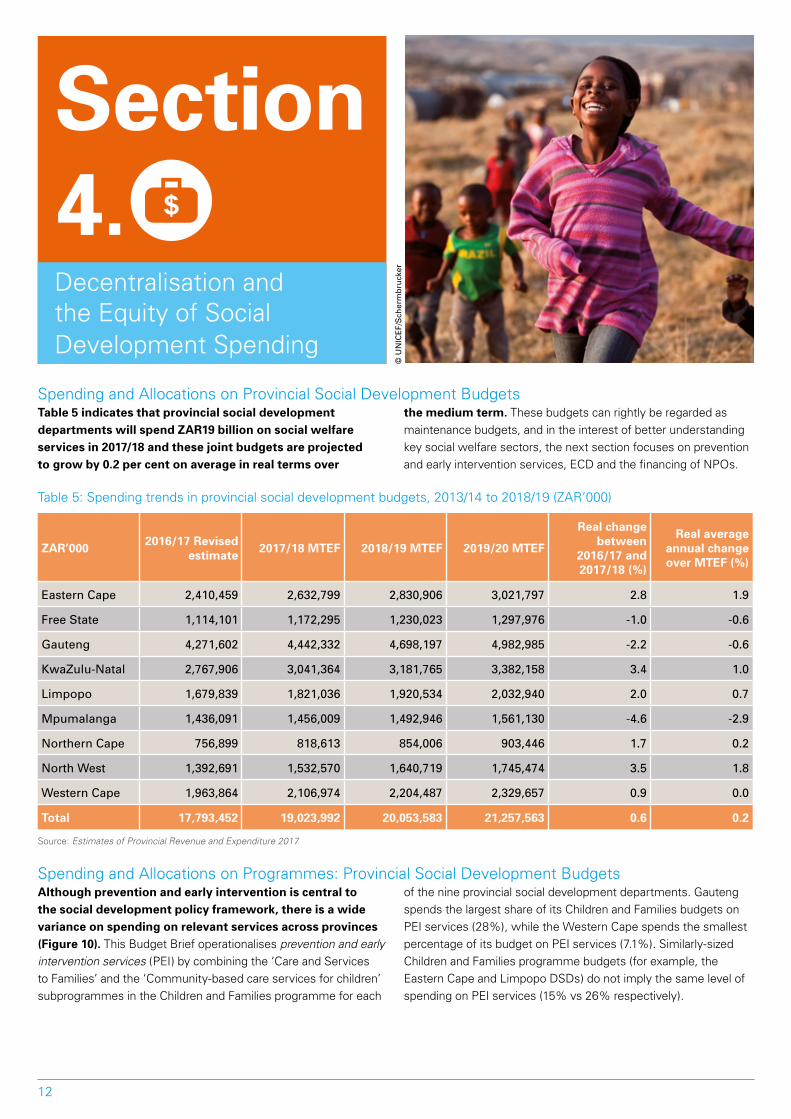
Spending and allocations on provincial Social development BudgetsTable5indicatesthatprovincialsocialdevelopmentdepartmentswillspendZaR19billiononsocialwelfareservices in 2017/18 and these joint budgets are projected to grow by 0.2 per cent on average in real terms over
the medium term. these budgets can rightly be regarded as maintenance budgets, and in the interest of better understanding key social welfare sectors, the next section focuses on prevention and early intervention services, ecd and the financing of npos.
Table5:Spendingtrendsinprovincialsocialdevelopmentbudgets,2013/14to2018/19(ZAR’000)
ZAR’000 2016/17 Revised estimate 2017/18 MTEF 2018/19MTEF 2019/20MTEF
Real change between
2016/17 and 2017/18 (%)
Real average annual change over MTEF (%)
Eastern Cape 2,410,459 2,632,799 2,830,906 3,021,797 2.8 1.9
Free State 1,114,101 1,172,295 1,230,023 1,297,976 -1.0 -0.6
Gauteng 4,271,602 4,442,332 4,698,197 4,982,985 -2.2 -0.6
KwaZulu-Natal 2,767,906 3,041,364 3,181,765 3,382,158 3.4 1.0
Limpopo 1,679,839 1,821,036 1,920,534 2,032,940 2.0 0.7
Mpumalanga 1,436,091 1,456,009 1,492,946 1,561,130 -4.6 -2.9
Northern Cape 756,899 818,613 854,006 903,446 1.7 0.2
North West 1,392,691 1,532,570 1,640,719 1,745,474 3.5 1.8
Western Cape 1,963,864 2,106,974 2,204,487 2,329,657 0.9 0.0
Total 17,793,452 19,023,992 20,053,583 21,257,563 0.6 0.2
Source: Estimates of Provincial Revenue and Expenditure 2017
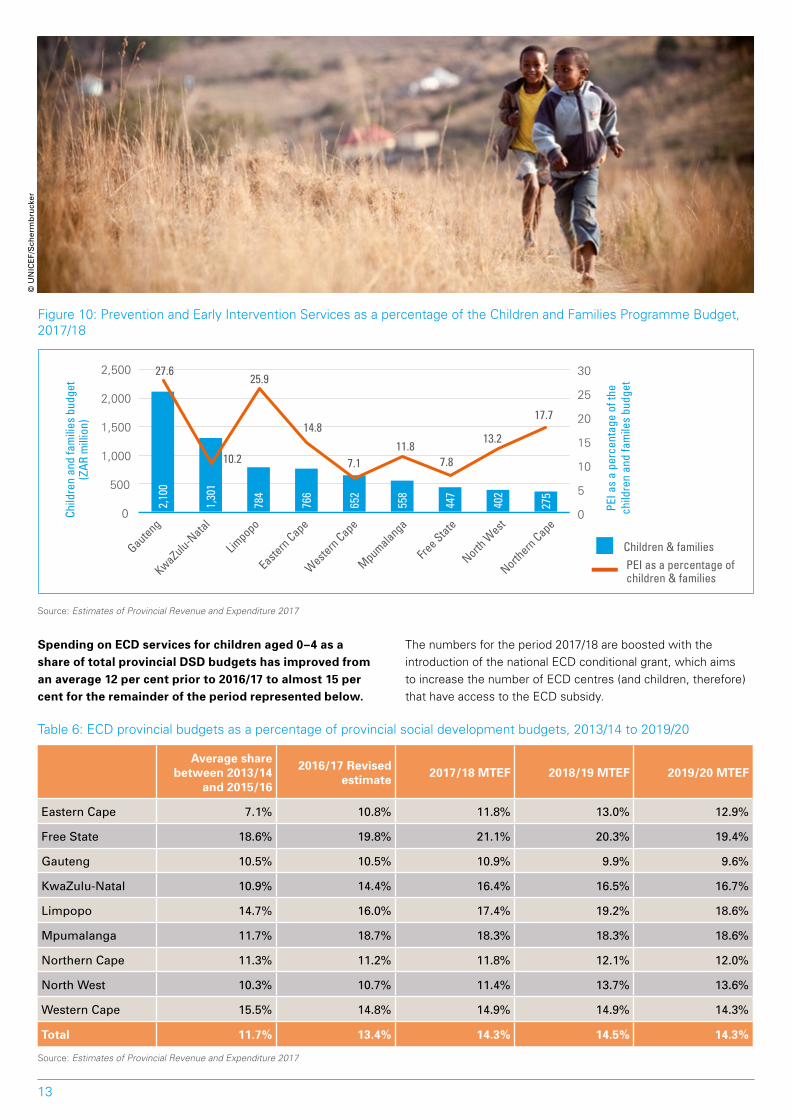
Spending and allocations on programmes: provincial Social development BudgetsAlthough prevention and early intervention is central to the social development policy framework, there is a wide variance on spending on relevant services across provinces (Figure 10). this Budget Brief operationalises prevention and early intervention services (pei) by combining the ‘care and Services to Families’ and the ‘community-based care services for children’ subprogrammes in the children and Families programme for each
of the nine provincial social development departments. Gauteng spends the largest share of its children and Families budgets on PEIservices(28%),whiletheWesternCapespendsthesmallestpercentage of its budget on pei services (7.1%). Similarly-sized children and Families programme budgets (for example, the eastern cape and limpopo dSds) do not imply the same level of spendingonPEIservices(15%vs26%respectively).
decentralisation and the equity of Social development Spending
Section 4.
© U
NIC
EF/
Sch
erm
bru
cker
13
Figure 10: prevention and early intervention Services as a percentage of the children and Families programme Budget, 2017/18
Source: Estimates of Provincial Revenue and Expenditure 2017
SpendingonECDservicesforchildrenaged0–4asashare of total provincial DSD budgets has improved from anaverage12percentpriorto2016/17toalmost15percent for the remainder of the period represented below.
the numbers for the period 2017/18 are boosted with the introduction of the national ecd conditional grant, which aims to increase the number of ecd centres (and children, therefore) that have access to the ecd subsidy.
Table6:ECDprovincialbudgetsasapercentageofprovincialsocialdevelopmentbudgets,2013/14to2019/20
Average share
between2013/14and2015/16
2016/17 Revised estimate 2017/18 MTEF 2018/19MTEF 2019/20MTEF
Eastern Cape 7.1% 10.8% 11.8% 13.0% 12.9%
Free State 18.6% 19.8% 21.1% 20.3% 19.4%
Gauteng 10.5% 10.5% 10.9% 9.9% 9.6%
KwaZulu-Natal 10.9% 14.4% 16.4% 16.5% 16.7%
Limpopo 14.7% 16.0% 17.4% 19.2% 18.6%
Mpumalanga 11.7% 18.7% 18.3% 18.3% 18.6%
Northern Cape 11.3% 11.2% 11.8% 12.1% 12.0%
North West 10.3% 10.7% 11.4% 13.7% 13.6%
Western Cape 15.5% 14.8% 14.9% 14.9% 14.3%
Total 11.7% 13.4% 14.3% 14.5% 14.3%
Source: Estimates of Provincial Revenue and Expenditure 2017
Fig 10
Children & families PEI as a percentage of children & families
2,10
0
1,30
1
784
766
652
558
447
402
275
27.6
10.2
25.9
14.8
7.1 11.8
7.8
13.2
17.7
0
5
10
15
20
25
30
0
500
1,000
1,500
2,000
2,500
Gauteng
KwaZulu-Natal
Limpopo
Eastern Cape
Weste
rn Cape
Mpumalanga
Free State
North W
est
Northern Cape Ch
ildre
n an
d fa
mili
es b
udge
t (Z
AR
mill
ion)
PEI a
s a
perc
enta
ge o
f the
ch
ildre
n an
d fa
mile
s bu
dget
© U
NIC
EF/
Sch
erm
bru
cker
14
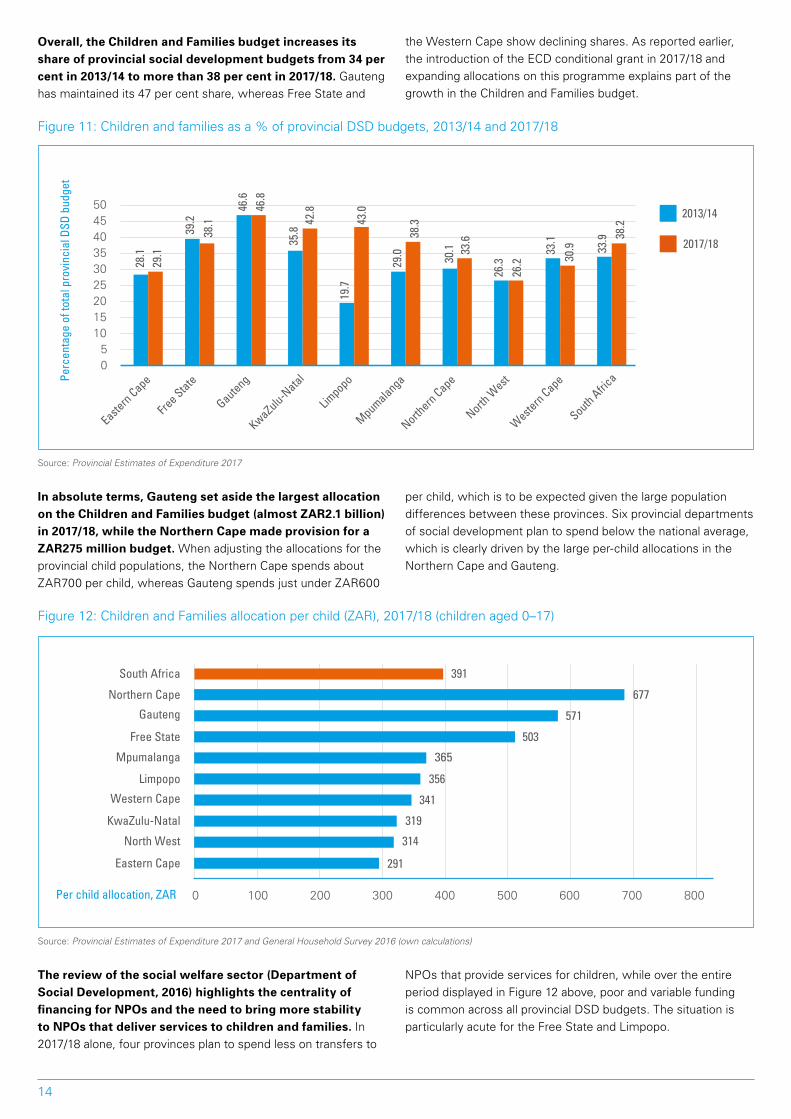
Overall, the Children and Families budget increases its shareofprovincialsocialdevelopmentbudgetsfrom34percentin2013/14tomorethan38percentin2017/18. Gauteng hasmaintainedits47percentshare,whereasFreeStateand
theWesternCapeshowdecliningshares.Asreportedearlier,the introduction of the ecd conditional grant in 2017/18 and expanding allocations on this programme explains part of the growth in the children and Families budget.
Figure11:Childrenandfamiliesasa%ofprovincialDSDbudgets,2013/14and2017/18
Source: Provincial Estimates of Expenditure 2017
In absolute terms, Gauteng set aside the largest allocation on the Children and Families budget (almost ZAR2.1 billion) in 2017/18, while the Northern Cape made provision for a ZaR275millionbudget.Whenadjustingtheallocationsfortheprovincial child populations, the northern cape spends about ZAR700perchild,whereasGautengspendsjustunderZAR600
per child, which is to be expected given the large population differences between these provinces. Six provincial departments of social development plan to spend below the national average, which is clearly driven by the large per-child allocations in the northern cape and Gauteng.
Figure12:ChildrenandFamiliesallocationperchild(ZAR),2017/18(childrenaged0–17)
Source: Provincial Estimates of Expenditure 2017 and General Household Survey 2016 (own calculations)
The review of the social welfare sector (Department of Social Development, 2016) highlights the centrality of financingforNPOsandtheneedtobringmorestabilitytoNPOsthatdeliverservicestochildrenandfamilies. in 2017/18 alone, four provinces plan to spend less on transfers to
npos that provide services for children, while over the entire period displayed in Figure 12 above, poor and variable funding is common across all provincial dSd budgets. the situation is particularly acute for the Free State and limpopo.
Fig 11
Perc
enta
ge o
f tot
al p
rovi
ncia
l DSD
bud
get
2017/18
2013/14
0 5
10 15 20 25 30 35 40 45 50
Eastern Cape
Free State
Gauteng
KwaZulu-Natal
Limpopo
Mpumalanga
Northern Cape
North W
est
Weste
rn Cape
South Africa
28.1
39.2
46.6
35.8
19.7
29.0
30.1
26.3
33.1
33.9
29.1
38.1
46.8
42.8
43.0
38.3
33.6
26.2
30.9
38.2
Fig 12
Per child allocation, ZAR
291
314
319
341
356
365
503
571
677
391
0 100 200 300 400 500 600 700 800
Eastern Cape
North West
KwaZulu-Natal
Western Cape
Limpopo
Mpumalanga
Free State
Gauteng
Northern Cape
South Africa
15
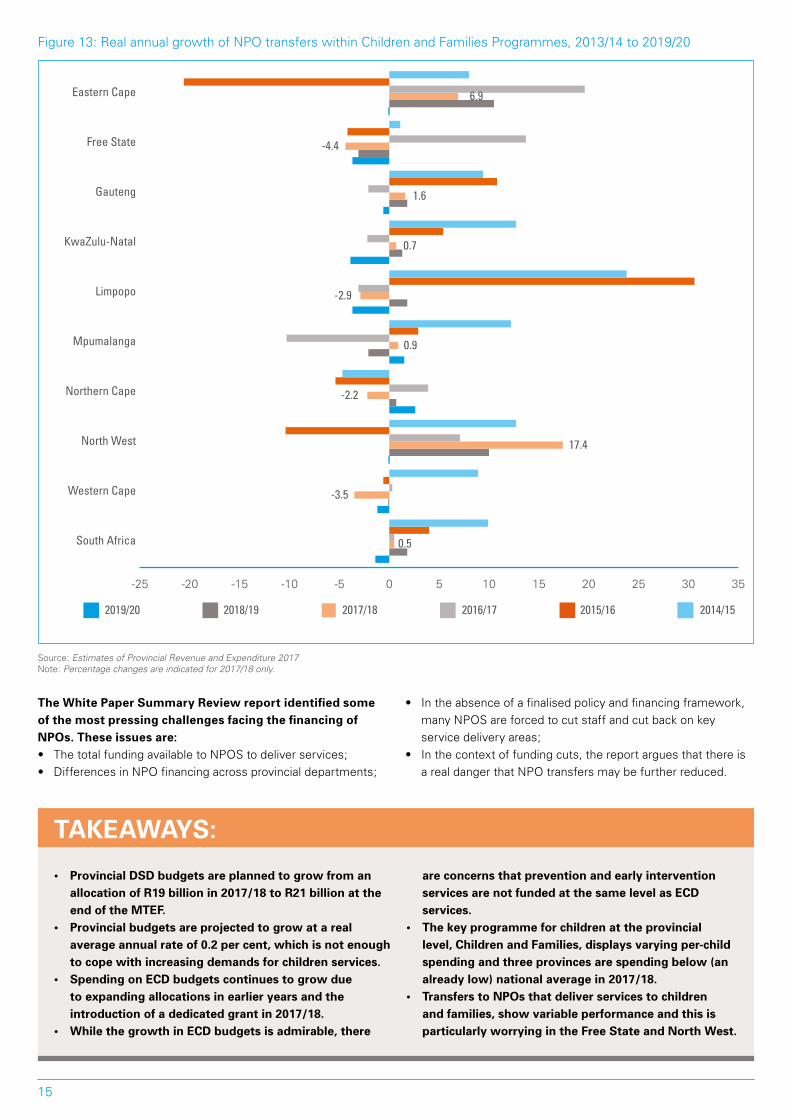
Figure13:RealannualgrowthofNPOtransferswithinChildrenandFamiliesProgrammes,2013/14to2019/20
Source: Estimates of Provincial Revenue and Expenditure 2017note: Percentage changes are indicated for 2017/18 only.
TheWhitePaperSummaryReviewreportidentifiedsomeof the most pressing challenges facing the financing of NPOs.Theseissuesare:• ThetotalfundingavailabletoNPOStodeliverservices;• DifferencesinNPOfinancingacrossprovincialdepartments;
• Intheabsenceofafinalisedpolicyandfinancingframework,many npoS are forced to cut staff and cut back on key service delivery areas;
• Inthecontextoffundingcuts,thereportarguesthatthereisa real danger that npo transfers may be further reduced.
2019/20 2018/19 2015/16 2017/18 2014/15 2016/17
-25 -20 -15 -10 -5 0 5 10 15 20 25 30 35
South Africa
Western Cape
North West
Northern Cape
Mpumalanga
Limpopo
KwaZulu-Natal
Gauteng
Free State
Eastern Cape 6.9
-4.4
1.6
0.7
-2.9
0.9
-2.2
17.4
-3.5
0.5
• ProvincialDSDbudgetsareplannedtogrowfromanallocationofR19billionin2017/18toR21billionattheend of the MTEF.
• Provincialbudgetsareprojectedtogrowatarealaverage annual rate of 0.2 per cent, which is not enough to cope with increasing demands for children services.
• SpendingonECDbudgetscontinuestogrowduetoexpandingallocationsinearlieryearsandtheintroduction of a dedicated grant in 2017/18.
• WhilethegrowthinECDbudgetsisadmirable,there
are concerns that prevention and early intervention services are not funded at the same level as ECD services.
• Thekeyprogrammeforchildrenattheprovinciallevel, Children and Families, displays varying per-child spending and three provinces are spending below (an already low) national average in 2017/18.
• TransferstoNPOsthatdeliverservicestochildrenand families, show variable performance and this is particularlyworryingintheFreeStateandNorthWest.
TakEaWayS:

16
BOx 1 Let’s imagine how this formula works in practice. If R100 billion was available to be spent on provinces, then the EasternCapeprovincialgovernmentshouldreceive14%ofR100billion(orR14billion).almosthalfofthismoney(48%)wouldhavebeendecidedusingtheeducationcomponent.ThatmeansoftheR48billiondecidedthroughtheeducationcomponent,theEasternCapegovernmentwouldhavereceived15.1%ofR48billion(orR7.2billion).Forthehealthcomponent,theEasternCapeisentitledto13.5%oftheR27billion(orR3.6billion).Theformulaassumesthatthecostof running government is the same for all provinces and the Eastern Cape will receive 11.1% of R11.1 billion (or R1.2 billion). The same calculation is made for all the components; these are tallied and the final shares will be paid over in quarterly instalments during the financial year.
In terms of the financing of provincial governments, Section214(a-c)oftheConstitution7 makes provision for three revenue sources. these include a vertical division of revenue (among the three spheres of government), a horizontal
division of revenue (using a formula to divide resources among provinces), and through special allocations (conditional grants that have strict conditions for their use). table 7 presents the components and corresponding weights of the provincial revenue-sharing formula.
table 7: distributing the equitable shares by provinces, 2017
Education (48%) Health (27%) Basic share
(16%) Poverty(3%)Economic
activity (1.0%)
Institutional (5%)
Weightedaverage
eastern cape 15.1% 13.5% 12.6% 16.3% 7.6% 11.1% 14.0%
Free State 5.3% 5.3% 5.1% 5.2% 5.0% 11.1% 5.6%
Gauteng 18.0% 21.8% 24.1% 17.3% 34.3% 11.1% 19.8%
KwaZulu-natal 22.3% 21.7% 19.8% 22.2% 16.1% 11.1% 21.1%
limpopo 13.0% 10.3% 10.4% 13.6% 7.1% 11.1% 11.7%
mpumalanga 8.4% 7.3% 7.7% 9.1% 7.5% 11.1% 8.1%
northern cape 2.3% 2.1% 2.1% 2.2% 2.1% 11.1% 2.7%
NorthWest 6.5% 6.7% 6.8% 8.0% 6.5% 11.1% 6.9%
WesternCape 9.1% 11.3% 11.3% 6.1% 13.6% 11.1% 10.1%
Total 100% 100% 100% 100% 100% 100% 100%
Source: Budget Review 2017note: Green represents the highest value, while red represents the lowest value for each component and the total weighted share by province.
Financing the Social development Sector
Section 5.
© U
NIC
EF/
Pir
ozz
i
17
TheWhitePaperSummaryReportarguesthatthechallenges in social development funding could be addressed through a revision of the provincial equitable shares formula.TheWhitePaperSummaryReportacknowledges that a change to the formula does not compel provincial treasuries to better fund social welfare services at the subnational level, but provincial dSd could anchor budget bids for better funding of social welfare services by citing the broader intent of the prevised provincial allocation formulae. two options were presented, namely: (i) increase the existing poverty component because of the implied correlation between poverty and social development expenditures; or (ii) introduce a new social development component (akin to education and health) that allows for some dimension of poverty (such as ‘rurality’) to beconsideredmoreexplicitly.TheWhitePaperSummaryReportargues for the second option and it is believed that these options are under discussion with the national treasury.
All these options will have to be discussed against a background of fiscal space for programmes and services that benefit children. a UniceF-commissioned study into fiscal space in South africa 8 has highlighted several issues. Some of the salient findings include: (i) levying taxes on the consumption of luxury goods and introducing the much-discussed sugar tax could lead to a sizeable amount of new revenue that could be used to finance priority expenditures in the social services sector; and (ii) building on the ongoing efforts to achieve cost-savings, such as by reducing unnecessary travel, curbing the use of external consultants and generally decreasing spending on non-priority areas that have a poor spending record. this could lead to the better application of resources currently available in the social development sector for the education of children.
• Thepolicyoptiontoincludeasocialdevelopmentcomponent in the government’s allocation formula holds promise, but advocacy by national and provincial DSD for better funding of social welfare services is still required at the provincial level.
• Thelong-assumedfiscalspacethatexistedfortheexpansionofpriorityexpendituresisconstrainedand
this will force social development authorities to be more effective at delivering key social welfare services.
• ThereareseveraloptionsthatcanbepursuedbytheSouth African government to increase fiscal space for priorityexpendituressuchaschildwelfare,butitisunclear how local political dynamics will affect such deals and inevitable compromises.
TakEaWayS:
© U
NIC
EF/
Pir
ozz
i
18
1 according to the medium term Strategic Framework (mtSF) document (http://www.gov.za/sites/www.gov.za/files/MTSF_2014-2019.pdf),thegovernmentdefinessocialprotection as an umbrella concept that includes: • Socialassistanceandsocialwelfareservicesprovidedby
the ten social development departments;• Accesstobasicservicesatthelocalgovernmentlevel;• Freebasiceducationin60percentofthecountry’s
poorest schools;• Freehealthcareforpregnantwomenandchildrenunder
six;• Statutorysocialinsurancepolicies(suchasthe
Unemployment insurance Fund);• Schoolnutritionandschooltransport;• Activelabourmarketpolicestofacilitateentryintothe
labour market;• Incomesupportfortheworking-agepoorthroughpublic
works programmes; • Theredressofinequalitiesthatareinherentinthesystem
due to apartheid. 2 the government has adopted an outcomes Framework that
is based on key issues addressed in the country’s national development plan and the government’s electoral mandate. Thereare14outcomes(includingOutcome13thatinvolvesthe Social development ministry) and the responsible minister is required to report to the president of the Republic
of South africa on progress made in achieving the relevant outcome.
3 the presidency. The National Development Plan 2030: Our future – make it work. pretoria, Government printers, 2011.
4 TheDepartmentofSocialDevelopment.Summary report on the review of the White Paper for Social Welfare, 1997 Ministerial Committee September 2013 to March 2016. Pretoria,GovernmentPrinters,2016.
5 ThedataweredownloadedfromthesocialindicatorwebsiteoftheWorldBank.<http://datatopics.worldbank.org/aspire/indicator/social-expenditure> [accessed 20 July 2017].
6 DataweredownloadedfromtheSASSAwebsite:Fact sheet: Issue no 12 of 2015 – 31 December 2015 A statistical summary of social grants in South Africa:<http://www.sassa.gov.za/index.php/statistical-reports?start=18>[accessed13august 2017].
7 legally, these constitutional provisions find expression in the annual Division of Revenue Bill/Act that accompanies the main budget documentation at the start of the new financial cycle. the Division of Revenue Bill/Act is particularly helpful in listing in detail the conditions under which conditional grant funding should be used, including reporting requirements and the duration or lifespan of the grant.
8 UniceF, National political economy analysis and fiscal space profiles of countries in Eastern and Southern Africa: fiscal space analysis – South Africa. Rotterdam, UniceF, 2017.
Endnotes©
UN
ICE
F/S
cher
mb
ruck
er

United Nations Children’s Fund
Equity House 659 Pienaar Street Brooklyn Pretoria0181
www.unicef.org/southafrica