social, economic and environmental impacts of the promotion of renewable energies in spain. ex post...
TRANSCRIPT
67th SEMI-ANNUAL ETSAP MEETING
Abu Dhabi, 1st-2nd June 2015
Social, economic and environmental impacts of the promotion of renewable energies in
Spain
Ex Post and Prospective Analysis
H.Cabal, Y.Lechón, N.Caldés, C.de la Rúa, D.García-Gusano, E.López-Bernabé, I.López-Dóriga and M.Santamaría

• INER project, Spanish R+D Plan • PER 2005-2010. Objectives: 12.1% Gross energy consumption
30.3% electricity production; and 5.83% biofuels of the consumption in transport
Instruments: fiscal support, tax exemptions and FIT
Background
Evolution of the Spanish electricity system from 2005 to 2013
40% in 2013

1. Ex Post analysis Cost assessment of the most recent energy policies in Spain not only considering the private costs of electricity production but also the environmental and socioeconomic costs 2. Prospective analysis
Optimal electricity system in the medium and long term under different scenarios
Scope

Steps 1. Levelised Electricity Costs (LEC)
2. Environmental externalities (LCA and ExternE)
3. Socioeconomic externalities (I-O, WIOD)
Ex Post analysis- Methodological approach
Total (LEC+CA+SEB) costs by technology in 2010

Partial Cost Benefit Analysis
Relevant factor Cost or benefit for
society Measurement
indicators
Monetized
(method)
Electricity generation costs Private cost LEC Yes
Economic activity Socio-econ externality Value Added Yes
Local environ effects Environ externality Various environ impact
indicators/Kwh
Yes
(Extern-E & Cases)
Global environ effects Environ externality CO2 equivalent
emiss/khwh
Yes
(Extern-E & Cases)
RES Support expenditures Public cost Feed in
Tariff expenses Yes
Ex Post analysis- Methodological approach
Not considered: employment, tax revenues, fossil fuel imports, other renewable support policies, transaction costs, merit order effects, increase in RES exports, rural development
7
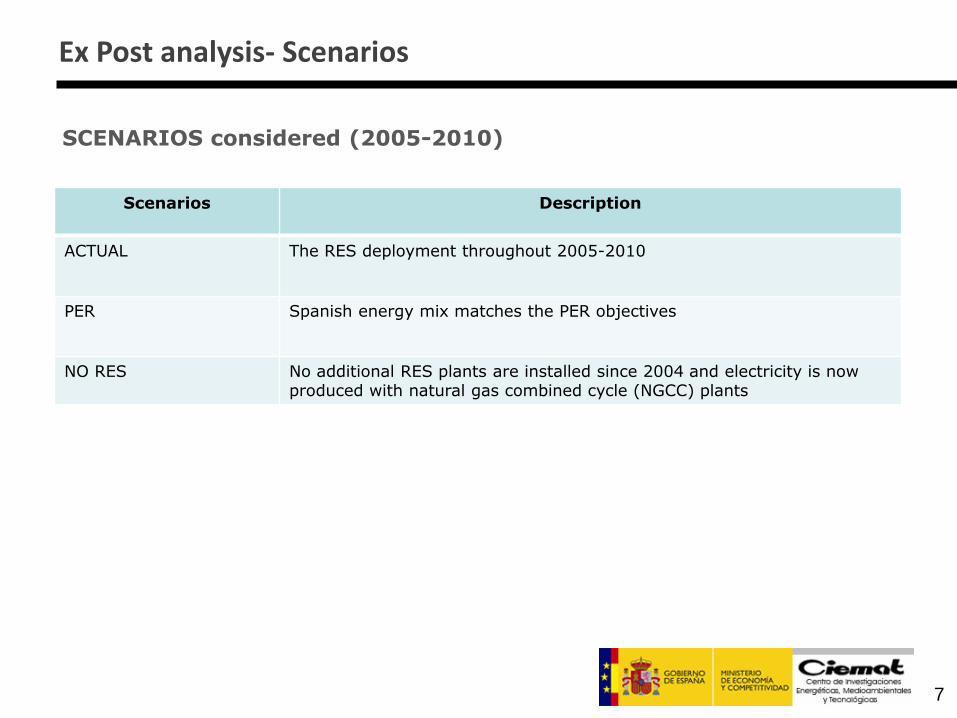
Ex Post analysis- Scenarios
SCENARIOS considered (2005-2010)
Scenarios Description
ACTUAL The RES deployment throughout 2005-2010
PER Spanish energy mix matches the PER objectives
NO RES No additional RES plants are installed since 2004 and electricity is now produced with natural gas combined cycle (NGCC) plants

8
Total costs (private + social)
Ex Post analysis- Results
RES support expenditures vs avoided external costs
The costs of FIT exceeded the net environmental and socioeconomic externalities
Huge installation of solar PV technologies from 2007 led to higher cost in ACTUAL scenario

Prospective analysis- Methodological approach
TIMES- Spain National energy model built in the framework of the NEEDS project and improved in RES2020, COMET and INER projects. Part of the PET model One region Time horizon 2050. In this study, 2035 Twelve time slices: four seasons and day/night/peak Five demand and two supply sectors Demand scenarios: energy demand driver projections from the GEM-E3 updated with national data Trade: electricity exchange with France, Portugal and Morocco Recently recalibrated to 2005 and updated

10
Prospective analysis- Scenarios
SCENARIOS considered
Scenarios considered Description
BASE National and international energy and environmental policies and commitments
ZERO No restrictions or targets to emissions and renewable technologies penetration
INTER Internalization of the environmental and socioeconomic external costs for all the technologies
PER 2011-2020 objectives
GWh 2015 2020
Hydro 31,371 32,814
Solar PV 9,060 12,356
CSP 8,287 14,379
Wind onshore 55,538 70,734
Wind offshore 66 1,822
Biomass 7,142 12,200

11
Prospective analysis- Results
Fossil and renewable technologies production

12
Prospective analysis- Results
BASE scenario vs PER 2011-2020 objectives
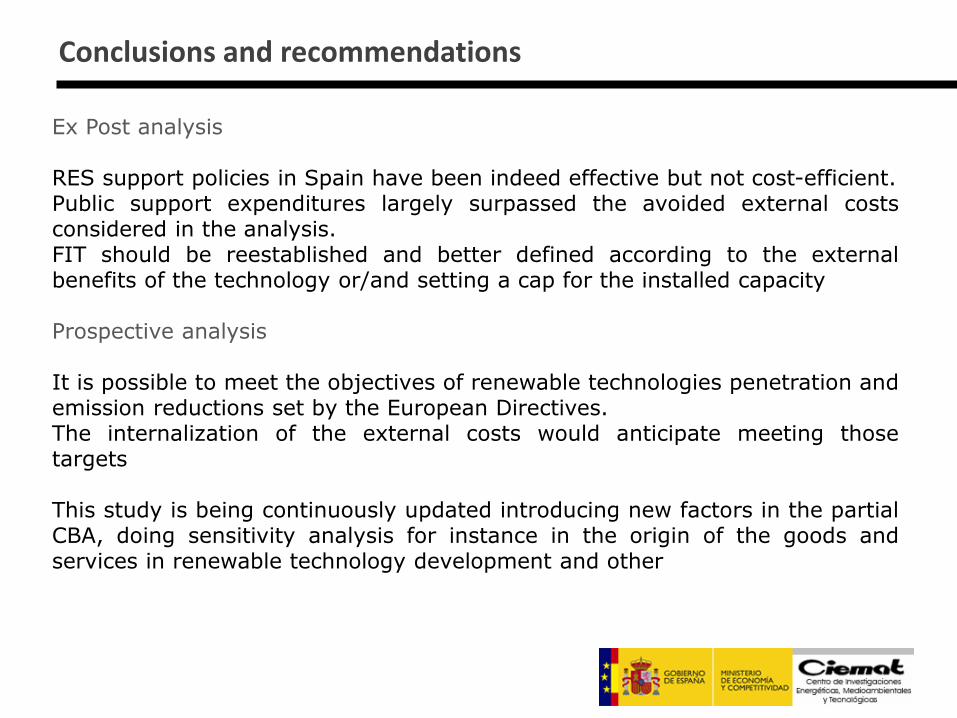
Conclusions and recommendations
Ex Post analysis RES support policies in Spain have been indeed effective but not cost-efficient. Public support expenditures largely surpassed the avoided external costs considered in the analysis. FIT should be reestablished and better defined according to the external benefits of the technology or/and setting a cap for the installed capacity Prospective analysis It is possible to meet the objectives of renewable technologies penetration and emission reductions set by the European Directives. The internalization of the external costs would anticipate meeting those targets This study is being continuously updated introducing new factors in the partial CBA, doing sensitivity analysis for instance in the origin of the goods and services in renewable technology development and other
67th SEMI-ANNUAL ETSAP MEETING
Abu Dhabi, 1st-2nd June 2015
Social, economic and environmental impacts of the promotion of renewable energies in
Spain
Ex Post and Prospective Analysis
H.Cabal, Y.Lechón, N.Caldés, C.de la Rúa, D.García-Gusano, E.López-Bernabé, I.López-Dóriga and M.Santamaría
Thank you

Anexes

CBA data sources and working assumptions
Costs and benefits What? Methodology Data
Private costs Electricity generation costs (c €/Kwh)
LEC Spanish data International data (OECD, others)
Socio-economic externalities
Value added I-O Spanish I-O (WIOD) Investment and O&M cost vectors (final demand)
Environmental externalities
CO2 and other local pollutants
LCA & Extern-E CASES Intern. literature review
Res Support expend FIT expenditures Official figures APPA (autoproducers)
17
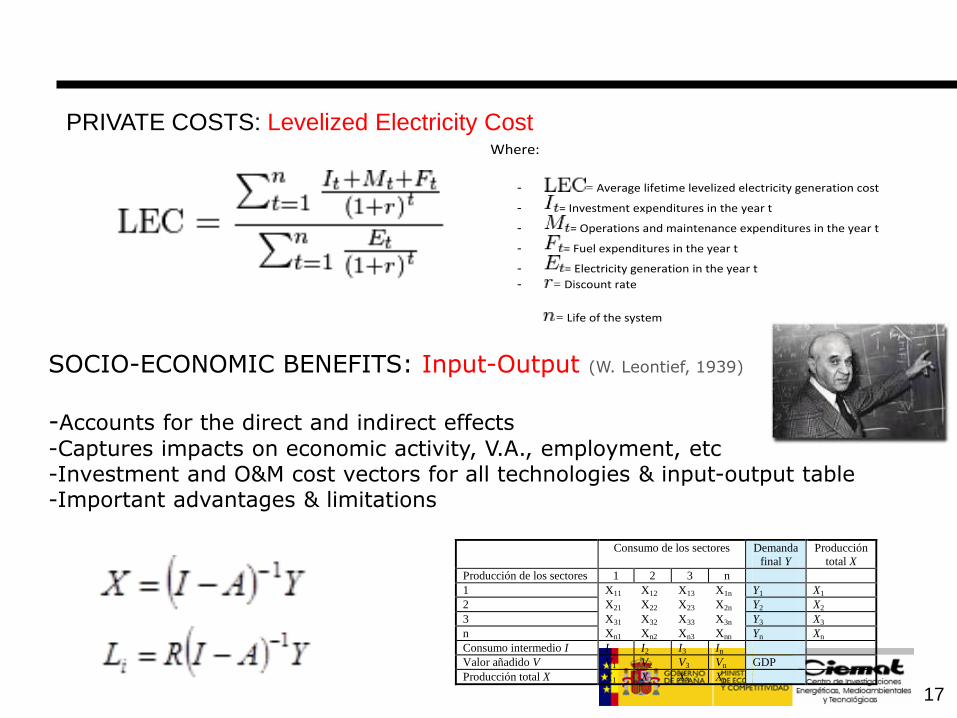
PRIVATE COSTS: Levelized Electricity Cost
Where:
- = Average lifetime levelized electricity generation cost
- = Investment expenditures in the year t
- = Operations and maintenance expenditures in the year t
- = Fuel expenditures in the year t
- = Electricity generation in the year t
- = Discount rate
= Life of the system
SOCIO-ECONOMIC BENEFITS: Input-Output (W. Leontief, 1939)
-Accounts for the direct and indirect effects
-Captures impacts on economic activity, V.A., employment, etc -Investment and O&M cost vectors for all technologies & input-output table -Important advantages & limitations
Consumo de los sectores Demanda
final Y
Producción
total X
Producción de los sectores 1 2 3 n
1 X11 X12 X13 X1n Y1 X1
2 X21 X22 X23 X2n Y2 X2
3 X31 X32 X33 X3n Y3 X3
n Xn1 Xn2 Xn3 Xnn Yn Xn
Consumo intermedio I I1 I2 I3 In
Valor añadido V V1 V2 V3 Vn GDP
Producción total X X1 X2 X3 Xn

Life Cycle Assessment. LCA.
Other wastes
INPUTS
Raw materials
Energy
OUTPUTS
Atmospheric emissions
Liquid effluents
Solid wastes
Co-products
Raw materials procurement
Production
Use/Reuse/ Maintenance
Recycling Waste management

ExternE. Impact pathway approach Starting from the emission of a
pollutant, the ExternE methodology
simulate the transport and
transformation in the atmosphere using
atmospheric dispersion models
Impacts in physical terms are then
calculated using dose response
functions
Monetary valuation of different impacts
is used to estimate externalities in
monetary units

LEC projection
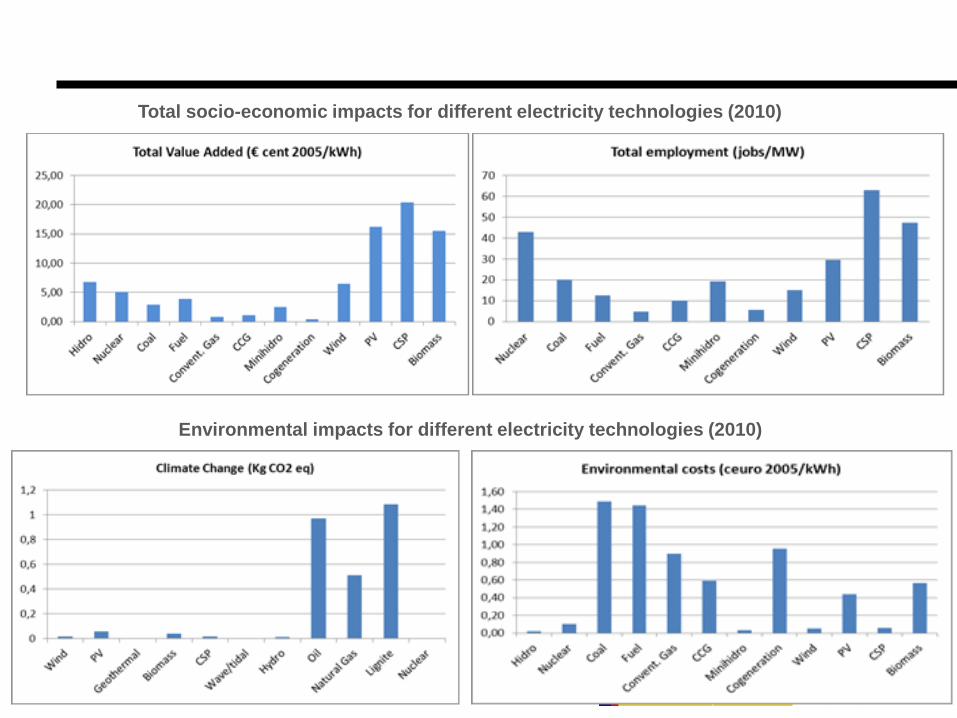
Total socio-economic impacts for different electricity technologies (2010)
Environmental impacts for different electricity technologies (2010)