social inclusion health indicators
DESCRIPTION
ÂTRANSCRIPT
i n c l u s i v e
c i t i e s������commu
nity
A POLICY AND PRACTICE PAPER
Social Inclusion Health Indicators: A Framework forAddressing the Social Determinants of Health
By Philip O’Hara
OCTOBER 2006
Edmonton Social Planning Council http://www.inclusivecities.ca

Paper copies of this report are available from:
Edmonton Social Planning Council Suite 220 10010 107A Ave Edmonton AB T5H 4H8
Phone: (780) 423 2031 Fax: (780) 425 6244 E-mail: [email protected]
Copies of the report can also be downloaded
from the Inclusive Cities Canada website at: http://www.inclusivecities.ca
A POLICY AND PRACTICE PAPER
Social Inclusion Health Indicators: A Framework for Addressing the Social Determinants of Health
By Philip O’Hara
Philip O’Hara has over 20 years experience in the community health and human service sectors, within government, health organizations and not-for-profit organi-zations. He holds a Master of Science degree in Health Promotion. Previously he was the research and social policy analysis coordinator for the Edmonton Social Planning Council and the regional coordinator for Inclusive Cities Canada – Ed-monton. As a consultant, he is currently Coordinator of the Alberta Healthy Living Network’s Social Determinants of Health Project. Mr. O’Hara can be reached at [email protected]
Published by: Inclusive Cities Canada www.inclusivecities.ca and the Edmonton Social Planning Council (ESPC) www.edmspc.com
Series editor: Christa Freiler, National Coordinator, Inclusive Cities Canada
Acknowledgements
Inclusive Cities Canada: A Cross-Canada Civic Initiative (ICC) gratefully acknowl-edges the financial support of Human Resources and Social Development Canada which provided multi-year funding for ICC from 2003 to 2006, and which made the policy and practice papers possible.
Special thanks to ICC consultants Peter Clutterbuck and Marvyn Novick; to national coordinator, Christa Freiler; and to ESPC staff John Kolkman and Susan Morrissey for their invaluable comments and feedback.
Disclaimer
The views expressed in this paper reflect those of the author and not necessarily those of Inclusive Cities Canada, the Edmonton Social Planning Council or Human Resources and Social Development Canada.

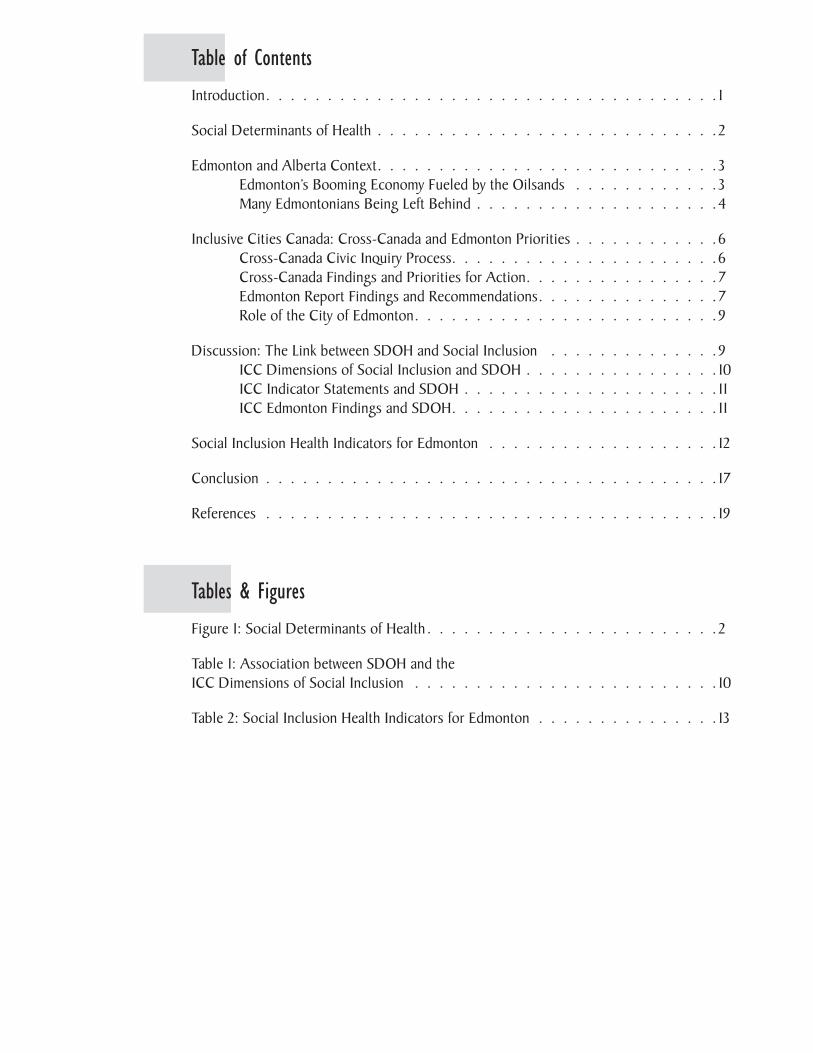
Table of Contents
Introduction . . . . . . . . . . . . . . . . . . . . . . . . . . . . . . . . . . . . . 1
Social Determinants of Health . . . . . . . . . . . . . . . . . . . . . . . . . . . .2
Edmonton and Alberta Context . . . . . . . . . . . . . . . . . . . . . . . . . . . . 3Edmonton’s Booming Economy Fueled by the Oilsands . . . . . . . . . . . . 3Many Edmontonians Being Left Behind . . . . . . . . . . . . . . . . . . . .4
Inclusive Cities Canada: Cross-Canada and Edmonton Priorities . . . . . . . . . . . .6Cross-Canada Civic Inquiry Process . . . . . . . . . . . . . . . . . . . . . .6Cross-Canada Findings and Priorities for Action . . . . . . . . . . . . . . . .7Edmonton Report Findings and Recommendations . . . . . . . . . . . . . . .7Role of the City of Edmonton . . . . . . . . . . . . . . . . . . . . . . . . .9
Discussion: The Link between SDOH and Social Inclusion . . . . . . . . . . . . . .9ICC Dimensions of Social Inclusion and SDOH . . . . . . . . . . . . . . . . 10ICC Indicator Statements and SDOH . . . . . . . . . . . . . . . . . . . . . 11ICC Edmonton Findings and SDOH . . . . . . . . . . . . . . . . . . . . . . 11
Social Inclusion Health Indicators for Edmonton . . . . . . . . . . . . . . . . . . . 12
Conclusion . . . . . . . . . . . . . . . . . . . . . . . . . . . . . . . . . . . . . 17
References . . . . . . . . . . . . . . . . . . . . . . . . . . . . . . . . . . . . . 19
Tables & Figures
Figure 1: Social Determinants of Health . . . . . . . . . . . . . . . . . . . . . . . .2
Table 1: Association between SDOH and the ICC Dimensions of Social Inclusion . . . . . . . . . . . . . . . . . . . . . . . . . 10
Table 2: Social Inclusion Health Indicators for Edmonton . . . . . . . . . . . . . . . 13

1
Introduction
Social inclusion has been widely recognized as a key social determinant of health. The concept of social inclusion provides a useful means of better understanding how the social determinants of health (SDOH), such as low income, poor housing and food insecurity, are interrelated and negatively affect health (Raphael, 2003). Decades of research have shown that social exclusion impacts health and is aggravated by health status (World Health Organization, 2005). Social exclusion and a lack of participation in decision-making arising from deficits in the SDOH are major contributors to premature morbidity and death from chronic diseases, such as heart disease, stroke and diabetes (Wilkinson and Marmot, 1998).
Research undertaken on behalf of the Laidlaw Foundation identi-fied social inclusion as a normative, values-based concept. It is a way of identifying what kind of society we want to live in and what needs to change to build that society. These changes make up a transformative agenda in society as they require funda-mental changes in attitudes, public policies and institutional practices. Since social inclusion is conceptually grounded in the real life experiences of people, it can be utilized to identify strategies that create bonds among people of varying identities and conditions (Freiler, 2001).
The Inclusive Cities Canada (ICC) initiative developed five dimensions of social inclusion – institutional recognition of diversity, opportunities for human development, quality of civic engagement, cohesiveness of living conditions, and adequacy of community services. Based on these dimensions, the five partner cities1 conducted social inclusion inquiries which documented local residents’ experiences and perceptions of inclusion. The partner cities then developed recommendations to strengthen their capacity to create and sustain inclusive communities.
Social inclusion is being examined in this paper from a population health perspective for practi-cal and strategic reasons. Social inclusion is a key SDOH and focusing on inclusion is critically important in addressing social and health inequalities which also negatively affect health. There is growing public recognition of the need to increase our public investment in disease prevention and health promotion. This presents an opportunity to reframe social inclusion and SDOH as public health issues and advocate for public policies and the necessary resources to effectively address them.
This paper will explore the close conceptual link between the five ICC dimensions of social inclusion and SDOH. It will draw on the national ICC research and the results of the social inclusion inquiry in Edmonton. The paper will show the degree to which the ICC dimensions and SDOH are integrated and mutually supportive. In essence, the ICC dimensions provide a framework for both clustering and addressing the SDOH. The paper ends with suggested social inclusion health indicators for Edmonton that are based on the ICC research and our knowledge about the SDOH. Key outcomes and lead indicators will be identified for each of the ICC dimensions of social inclusion, which will point to recommendations for public policy and community practice.
...focusing on inclusion is critically important in
addressing social and health inequalities which also negatively affect health.
1 Burlington, Edmonton, Saint John, Toronto, Vancouver/North Vancouver

2
Social Determinants of Health
The relationship between socio-economic status and health outcomes is one of the most persistent themes in the epidemiological literature. The strong and growing evidence that higher social and economic status is associated with better health leads to the conclusion that these factors are fundamentally important to health (Canadian Council of Social Development, 2001). These key factors, or social determinants of health (Figure 1), are the primary influencers on population health (Health Canada, 2004). The SDOH are multiple social, economic, environmental and personal factors that affect health and well-being. Each of these factors is important on its own, but the factors are also interrelated and they interact in complex ways that are difficult to isolate. What is understood is that it is the combined influ-ence of these factors that determine the health status of populations (Health Canada, 2002).
The most important SDOH is income inequality – the actual income gap between people – rather than absolute income. Evidence shows that there are differences in health status across the entire socio-economic gradient, not just between the rich and poor. The larger the gap is, the lower the health status of the overall population (Marmot and Wilkin-son, 1999). Population health studies have shown that societies with lower levels of disparity have longer life expectancies, less crime, stronger patterns of civic engagement, and even more robust economic vitality. In essence, the key to health is relative income and social status rather than absolute income and living standards (Wilkinson, 1996). Novick (2001) argues that this finding has profound implications for the setting of our national priorities. A primary focus on economic growth and more wealth does not lead to improved health and well-being if the social results are more polarization and greater disparities in relative circumstances and prospects. In fact, it will produce just the opposite.
This suggests that there are limits on what an individual can do to improve his/her health. The emphasis on traditional adult risk factors (e.g. cholesterol, diet, physical activity, and tobacco use) is misguided given that these factors are poor predictors of heart disease, stroke and adult-onset diabetes (Raphael, 2004). Significantly improving health status requires taking a population health approach – focusing on the health of populations, addressing the SDOH, applying multiple strategies/interventions, collaborating across sectors/levels, engaging the public, etc. These strategies are also integral to addressing social inclusion and are reflected in the recommendations of the inclusion inquiries in the five cities. Given the limits on the effectiveness of individual action, collaborative, broad structural action through public policies and changes in institutional practices is essential in focusing efforts on the SDOH and building socially inclusive communities.
Figure 1: Social Determinants of Health• Early life
• Education
• Employment and working condi-tions
• Food security
• Health services
• Housing
• Income and its distribution
• Social exclusion
• Social safety net
• Unemployment/employment security
(Raphael, 2004a; SDOH Across the Life-Span Conference, 2002)

3
Edmonton and Alberta Context
Edmonton is Canada’s fifth largest city with a growing population of over 720,000 (a seven per cent increase since 2001). However, with the city’s rapid growth, its population has become more diverse and its social needs more pressing. At the same time, a legacy of the Alberta government’s policies of restraint and cutbacks in the 1990s is a growing social deficit, espe-cially in Alberta’s cities. The gap between the haves and the have-nots in Edmonton is expand-ing and there is real concern about whether Edmonton will be an inclusive or exclusive city (Edmonton Social Planning Council, 2004; 2005).
Edmonton’s Booming Economy Fueled by the OilsandsEdmonton’s economic ascent over the past decade has been largely sustained by the development of the oilsands near Fort McMurray, about 435 kilometres northeast of Edmonton. The Conference Board of Canada estimated that Edmonton’s annual economic growth rate from 1997 to 2005 was 4.3 per cent. During that period, Edmonton’s annual unemployment rates have dropped faster than the national rates (the 2005 rate was just 4.2 per cent). Paul Tsounis, the City of Edmonton’s chief economist, predicts that within 5-10 years, oil sands construction and opera-tions will account for 10 per cent of the city’s economy (Edmonton Journal, 2006).
Every day one million barrels of oil are recovered from the oilsands and the estimated total value of the oil resource at
today’s oil prices is a staggering $10 trillion (CBC News, 2006). The magnitude of the oilsands development and its impact on Edmonton is dramatic. Over the next decade, oilsands projects will generate $60 billion in direct spending which will multiply several times in indirect spend-ing, and much of this economic activity will occur in Edmonton. The city will also benefit from provincial energy royalties estimated at $95 billion over the next 20 years if the price of oil averages only $40 (US) a barrel or $133.4 billion if it averages $50 (Edmonton Journal, 2006).
The daunting challenge for Alberta is to manage this incredible resource in ways that are envi-ronmentally sustainable and provide for long term prosperity and social well-being. Memories of past booms and busts haunt Albertans despite the current promise of decades of prosperity. Paradoxically, these memories feed both a save and spend mentality, but mostly the later. Alberta government spending since 1999-2000 has increased by an average of 10 per cent an-nually (although it will increase by a more moderate four per cent in 2006-07) (TD Economics, 2006). Meanwhile Albertans are increasing their personal spending at an alarming rate. Retail spending in Edmonton has surpassed the national average for the past four years, rising almost eight per cent annually. High salaries and low interest rates are fueling this spending spree rais-ing concerns that many consumers could become bankrupt if interest rates rise. Prices are also skyrocketing: in August 2006 the average selling price of a house in Edmonton was $318,942, an increase of over 30 per cent from the previous August (Edmonton Journal, 2006a).
The anticipated shortage of 100,000 skilled workers over the next decade could slow down the $107 billion worth of expected capital projects in the province. In response, the province adopted a new immigration policy in 2005 with a goal of attracting at least 24,000 immigrants
The daunting challenge for Alberta is to
manage this incredible resource in ways that
are environmentally sustainable and provide
for long term prosperity and social well-being.
4
to Alberta each year, up from the nearly 16,500 immigrants who moved to the province in 2004 (Alberta Human Resources and Employment, 2004). Recent proposals to address Edmonton’s labour shortages also suggested that immigrants and Aboriginal people could be targeted for skills upgrading and that employers could be better sensitized to making workplaces friendlier to immigrant and Aboriginal workers.
Many Edmontonians Being Left BehindDespite the boom and a low jobless rate, the Alberta Advantage is not being shared equally. Nearly 35,000 workers earn minimum wage, $7/hour, and 36.2 per cent of these workers are employed full-time (Alberta Minimum Wage Profile, 2006). Many Albertans not employed in the energy sector work two jobs just to pay their bills as prices rise in the booming economy. The poverty rate (LICO, the low-income cut-off) in Alberta increased to 14.6 per cent in 2003 and from 1980 to 2003 the poverty rate in the province declined by a paltry 1.3 per cent. The value of welfare benefits for single Albertans decreased by nearly 50 per cent since 1986 and lone parents received just $12,326 a year in 2005 – only 48% of the poverty line as defined by Statistics Canada for Alberta (National Council of Welfare, 2006).
The low income rate in Edmonton declined significantly from 26 per cent in 1996 to 20 per cent in 2001 (Community Services Consulting, 2004), but income inequality – the actual income gap between people – has increased. Since income inequality is the most important SDOH (Marmot and Wilkinson, 1999), this has serious implications for the health status of all Edmontonians. There is an enormous gap between household incomes in Edmonton: in 2001, the bottom 10 per cent averaged $11,900; the median household income was $60, 817; and the top 10 per cent earned $184,600 (Statistics Canada, 2004). According to the Federation of Canadian Munici-palities (2004), the gap between the rich and poor in Edmonton is among the worst third of 21 Canadian cities.
Poverty is particularly persistent among some populations. In 2001, the poverty or low income rate among the general Edmonton population was 20 per cent, but was 44 per cent among Ab-original people. Immigrants to Edmonton prior to 1986 had a low income rate of 15.6 per cent, but among more recent immigrants (1995-2001), the rate was 40.6 per cent (City of Edmonton, 2005). Based on statistics from the Edmonton Food Bank, the gains by low income earners may have stalled. In 1996, the food bank distributed an averaged of 18,038 hampers per month and that figure fell every year through 2001, when it bottomed out at 11,877. However, since then the number has climbed back to an average monthly distribution of 13,709 in 2005 (Edmonton Journal, 2006).
The lack of affordable housing also poses a serious threat to the quality of life in Edmonton. According to the Edmonton Community Plan on Housing and Support Services 2005-2009 (Edmonton Joint Planning Committee on Housing (EJPCOH), 2005), a minimum of 4,700 diverse types of housing units need to be built to effectively address homelessness, low income housing and the need for related support services. Six counts of homeless persons in Edmonton have been conducted in Edmonton from 1999-2004 and the reported number of absolute and sheltered homeless has increased from 836 to 2,184 (EJPCOH, 2004). In particular, the housing needs of the Aboriginal population are not being met as 43 per cent of residents with hous-ing and homeless needs are Aboriginal people. The Edmonton Joint Planning Committee on Housing was created to bring together government, public and private sectors, and community organizations to coordinate joint affordable housing initiatives and the allocation of resources for housing projects.

5
At one time, Edmonton and Calgary attracted the same number of newcomers annually, but in 2004, 56.5 per cent of all immigrants to Alberta went to Calgary, while only 29.2 per cent came to Edmonton (Derwing, Krahn, Foote, and Diepenbroek, 2005). There are important economic and social reasons for attracting more immigrants to Edmonton. A shortage of skilled workers will undermine the city’s capacity for taking advantage of the oilsands development. There is also a clear connection between a city’s vibrancy and its immigrant population. Vibrant cities are more appealing to highly skilled immigrants and Edmonton is currently not a preferred destina-tion for valued immigrants according to a City of Edmonton commissioned report, The Attrac-tion and Retention of Immigrants to Edmonton (Derwing et al., 2005). The report affirmed that
Edmonton needs to become a more inclusive city in which newcomers feel accepted in the workplace, in classrooms and in neighbourhoods. In response, the City of Edmonton has launched a more targeted and aggressive promotional campaign to attract prospective immigrants and enhanced efforts to make Edmonton a more welcoming city.
The Aboriginal population in Edmonton is the second largest (after Winnipeg) in Canada, with 30,365 Aboriginal residents in 2001 (Statistics Canada, 2004). Members of the community self-identify as 52 per cent Métis and 44 per cent North American Indians, with the balance being Inuit or multi-ethnic. The Aboriginal population is growing at 2.5 times the rate of the city’s population due to a relatively high birth rate and net migration into Edmonton. If the
Aboriginal community continues to grow at the rate it did from 1996 to 2001 (20 per cent), the Aboriginal population in Edmonton will be over 55,000 people in 2017 (Edmonton Urban Aboriginal Accord Initiative, 2005).
The average earnings and medium incomes of Aboriginal people are much lower than the general population, likely as a result of high unemployment and lower-paying jobs, which reflect their relatively lower levels of educational attainment. Aboriginal people make up about 4.6 per cent of the Edmonton population, but 44 per cent of people living with low incomes (Statistics Canada, 2004). One of the greatest strengths of Aboriginal Edmonton is the potential of its youthful population: nearly one-third are under 15 years of age compared to one-fifth of the total population. The level of educational attainment by Aboriginal youth has significantly improved. Between 1981 and 2001, the percentage of Aboriginal youth attending school increased by two-thirds to over 50 per cent, only slightly lower than the general population. However, fewer than six per cent of Aboriginal people had a university degree in 2001 compared with 16.1 per cent of the general population (Edmonton Urban Aboriginal Accord Initiative, 2005). In 2006, Aboriginal Elders and the City of Edmonton signed a historic Edmonton Urban Aboriginal Ac-cord. It seeks to improve relations and build community capacity, increase the hiring/retention of Aboriginal staff, enhance services for Aboriginal people and create a joint leadership council. Both the federal and provincial governments are also partners in the initiative.
It is clear that Edmonton - with its growing social and economic pressures fueled by a booming economy - faces significant challenges in building a more socially inclusive community. As a result, the city was an ideal partner for the cross-Canada Inclusive Cities Canada (ICC) initiative, discussed below.
One of the greatest strengths of Aboriginal
Edmonton is the potential of its youthful
population... The level of educational attainment by Aboriginal youth has
significantly improved.
6
Inclusive Cities Canada: Cross-Canada and Edmonton Priorities
Cross-Canada Civic Inquiry ProcessInclusive Cities Canada began in 2003 as a collaborative venture of five social planning organi-zations2 and the Federation of Canadian Municipalities. Each city created a civic panel which directed a local inquiry process to document the inclusiveness of their city. The process was framed by five dimensions of social inclusion which were developed specifically for the ICC project as foundations of inclusion. These dimensions were informed by previous research by the Laidlaw Foundation, a review of Canadian and international literature and ongoing dialogues with the ICC partners.
The ICC dimensions of social inclusion are:
1. Institutional recognition of diversity The adoption and implementation of policies, plans and concrete actions by key public institutions that provide valued recognition to individuals and groups and reflect and respond to the full diversity of the population.
2. Opportunities for human development A focus on the development of talents, skills and capacities of everyone from early childhood through the transition years into and including adulthood.
3. Quality of civic engagement Strategies and actions to promote participation of individuals and groups in the full range of civic and community life to enhance social interaction, harmonious neighbourhoods and active citizenship.
4. Cohesiveness of living conditions Provisions for personal and family security (food/nutrition, income and employ-ment, housing, community safety) that minimize disparities in community living conditions within the population.
5. Adequacy of community services A well-coordinated system of public and community support services connected to strong networks of informal and personal support to address the diverse circumstances of vulnerable people.
As will be discussed later, these dimensions of social inclusion encompass the social deter-minants of health (Table 1). The close association between these dimensions and SDOH has important implications for public policy and community practice.
2 Community Development Halton (Burlington), Community Social Planning Council of Toronto, Edmonton Social Planning Council, Saint John Human Development Council, Social Planning and Research Council of B.C.

7
Cross-Canada Findings and Priorities for ActionThe five partner cities released local reports in March 2005 which assessed the state of social inclusion in their cities and identified needed policy and program changes. In November 2005, ICC released a national report, Meeting the Civic Challenges of Social Inclusion: Cross-Canada Findings and Priorities for Action (Clutterbuck, Freiler and Novick, 2005). The report analyzed and synthesized the local findings and issues that cut across the five cities and identified key challenges and priorities for action.
The national report observed that an inclusive Canada will be grounded in cities that reduce economic disparities, value cultural differences, promote community initiatives, and strengthen mutual trust. It noted that social inclusion is both a promise of common membership and of equal opportunity in our cities and throughout Canada. While the recommendations in each local report are specific to that city, there were cross-cutting issues that indicate areas of commonality. These issues form the basis of an inclusive social agenda for cities and include political priorities at the civic, provincial and federal levels. The common thematic issues were framed as four civic challenges and missions to civic governments and communities:
1. Make local democracy work – Promote civic citizenship
2. Affirm urban diversity – Secure human dignity
3. Reduce disparities in living conditions – Create common prosperity
4. Invest in social infrastructures – Build strong communities
Edmonton Report Findings and RecommendationsFar too many people in Edmonton who are viewed as being different in some way face genuine and often painful barriers to social inclusion. All too often institutional, community and per-sonal barriers work against people feeling a sense of belonging, acceptance and recognition in their own city. The resulting erosion of social cohesion undermines the quality of life and health of all Edmontonians. These are some of the findings contained in the report, Inclusive Cities Canada: Edmonton Community Voices, Perspectives and Priorities (2005).
The report emphasized that addressing social inclusion in Edmonton requires a long-term, multi-sector commitment to building civic partnerships, fostering public engagement and facilitating institutional and cultural shifts. The City of Edmonton was perceived as the logical catalyst for collaborative efforts aimed at increasing social cohesion, rebuilding the city’s social infrastructure and developing and sustaining civic capacity to build social inclusion. Participants believed that cohesiveness of living conditions, which includes such issues as income, employ-ment and housing, presented the biggest challenge to the city becoming more inclusive. (In fact, this was the biggest barrier to inclusion in all five cities.)
Identifying the key social inclusion issues in Edmonton was an important step in analyzing the knowledge and experiences shared by over 200 people in the inquiry process. These overarching issues are a summary of the themes and concerns raised by participants. The five issues were:
...social inclusion is both a promise of common
membership and of equal opportunity in our cities and throughout Canada.
8
1. A solid community-based foundation for inclusion is at risk in Edmonton.
2. The Alberta political culture challenges a social inclusion perspective.
3. Cohesion, rather than divisions, needs to be promoted in an increasingly diverse city.
4. Pressures on the non-profit sector impede its contribution to the building of a more inclusive Edmonton.
5. There is an unresolved debate in Alberta about the two models of human service delivery – public/equitable versus private/for profit.
The key recommendations3 developed by the Edmonton Civic Panel address these overarching social inclusion issues. The recommendations and associated outcomes and benchmarks were based on an analysis of the data from the inquiry process and a review of the relevant literature. The 19 recommendations were categorized by theme and divided into foundational and developmental recommendations. The foundational recommenda-tions, which are considered essential to Edmonton becoming a more inclusive city, provide direction to achieve the following outcomes:
• Fostering institutional readiness – Institutional change in Edmonton fosters inclu-sion.
• Income and employment – All Edmonton residents have a living income (i.e. provides for basic needs).
• Affordable housing – All Edmonton residents have affordable and physically accessible housing.
• Child development – All Edmonton families have the capacity and supports to nurture their children in child friendly communities.
• Public transit – Edmonton has a public transit system that is safe, accessible and affordable to everyone.
The developmental recommendations, which will support a culture of inclusion through institu-tional change, provide direction to achieve the following outcomes:
• Justice system and crime prevention – Edmontonians have a justice system they have confidence in.
• Quality of life – All Edmontonians have a high quality of life in a community that is enriched by the arts, culture and recreation.
• Education – All Edmontonians have access to a high quality education that meets their lifelong learning needs.
...the City of Edmonton was perceived as the catalyst for collaborative efforts to develop and sustain civic capacity to build social inclusion.
3 The recommendations are discussed in more detail in the ICC Edmonton Report. The recom-mendation outcomes and benchmarks were adapted for the Social Inclusion Health Indicators for Edmonton (Table 2).
9
Role of the City of EdmontonAs noted earlier, the City of Edmonton was perceived as the catalyst for collaborative efforts to develop and sustain civic capacity to build social inclusion. Consistent with the recommenda-tions of the ICC Edmonton Report, the City of Edmonton has undertaken several major initia-tives to enhance social inclusion, including:
• Establishing an Office of Diversity and Inclusion in January 2005 to increase the diversity of the City’s workforce and deliver city services in a more culturally sensitive manner.
• Signing the Edmonton Urban Aboriginal Accord with Aboriginal Elders to improve relations and enhance Aboriginal people’s participation in civic and community life.
• Conducting a comprehensive analysis of ICC Edmonton recommendations and exploring strategies to implement recommendations with government and com-munity partners.
• Adopting a policy and committing the resources to increase the access of low income Edmontonians to the City’s cultural and recreation facilities.
• Creating the Office of Public Involvement and adopting a comprehensive public participation policy.
• Adopting a five-year affordable housing policy with resources to build affordable housing in collaboration with governments and private and non-profit sectors.
• Commissioning The Attraction and Retention of Immigrants to Edmonton report and enhancing efforts to attract and retain immigrants
Discussion: The Link between SDOH and Social Inclusion
Population health research has taught us that social and health inequality hurts everyone, not just those at the bottom. Similarly, everyone is hurt by social exclusion - the groups and individuals who are marginalized and everyone collectively through the resulting deterioration in social cohesion. People’s experience of exclusion can also be seen through the complex interaction of the social determinants. Each linkage between the determinants deepens a person’s negative experience of exclusion, and over an individual’s entire life cycle, the depth of exclusion is reinforced (Health Canada, 2001). The key association between social inclusion and the social determinants is social and health inequities. Research shows that the causal direction from social inequities to social exclusion to health inequities is multidirectional and mutually reinforcing in feedback loops (World Health Organization, 2005). As the Health Council of Canada (2006:89) reported, “The biggest health problem in Canada is inequality. The overall improvement in our health status masks the grim reality that health inequalities among social classes are growing – as they are in the most highly developed countries”.
10
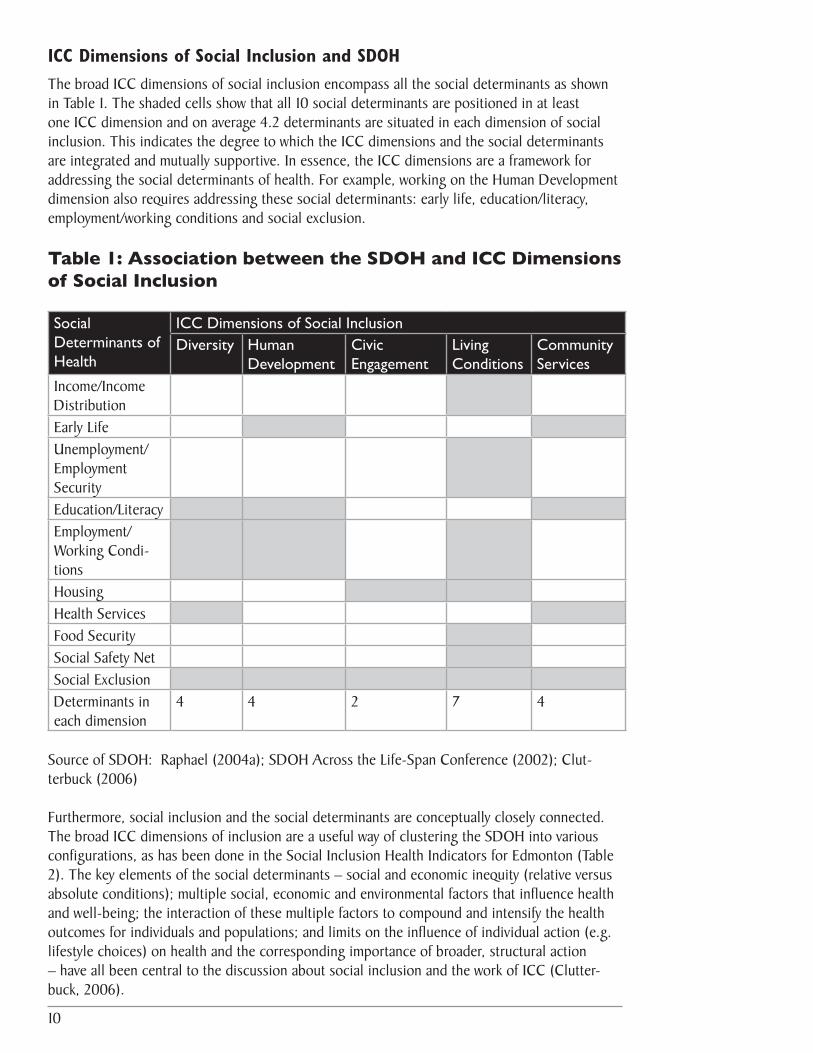
ICC Dimensions of Social Inclusion and SDOHThe broad ICC dimensions of social inclusion encompass all the social determinants as shown in Table 1. The shaded cells show that all 10 social determinants are positioned in at least one ICC dimension and on average 4.2 determinants are situated in each dimension of social inclusion. This indicates the degree to which the ICC dimensions and the social determinants are integrated and mutually supportive. In essence, the ICC dimensions are a framework for addressing the social determinants of health. For example, working on the Human Development dimension also requires addressing these social determinants: early life, education/literacy, employment/working conditions and social exclusion.
Table 1: Association between the SDOH and ICC Dimensions of Social Inclusion
Social Determinants of Health
ICC Dimensions of Social Inclusion Diversity Human
Development Civic Engagement
Living Conditions
Community Services
Income/Income Distribution Early LifeUnemployment/Employment SecurityEducation/LiteracyEmployment/Working Condi-tionsHousingHealth ServicesFood SecuritySocial Safety NetSocial ExclusionDeterminants in each dimension
4 4 2 7 4
Source of SDOH: Raphael (2004a); SDOH Across the Life-Span Conference (2002); Clut-terbuck (2006)
Furthermore, social inclusion and the social determinants are conceptually closely connected. The broad ICC dimensions of inclusion are a useful way of clustering the SDOH into various configurations, as has been done in the Social Inclusion Health Indicators for Edmonton (Table 2). The key elements of the social determinants – social and economic inequity (relative versus absolute conditions); multiple social, economic and environmental factors that influence health and well-being; the interaction of these multiple factors to compound and intensify the health outcomes for individuals and populations; and limits on the influence of individual action (e.g. lifestyle choices) on health and the corresponding importance of broader, structural action – have all been central to the discussion about social inclusion and the work of ICC (Clutter-buck, 2006).
11
This close association between the ICC dimensions of social inclusion and the SDOH has important implica-tions for public policy and community practice. The limited actions individuals can take to improve their health and sense of being socially included increases the need for collaborative, broader structural action, particularly through population health approaches.
ICC Indicator Statements and SDOHAs part of the local inquiry process to document the inclusiveness of their city, the ICC partners used inclusion indicator statements in focus groups to assess participants’ experiences and perspectives with aspects of inclusion. These indicator statements
were presented as benchmarks of an inclusive community (i.e. high standards) and participants ranked their agreement with the statements prior to any discussion of inclusion. (For more on the inclusion indicator statements see the national ICC report Meeting the Civic Challenges of Social Inclusion: Cross-Canada Findings and Priorities for Action.)
There is a close association between the 60 ICC indicator statements and the SDOH as all of the indicator statements are applicable to one or more SDOH. For example, the indicator state-ment “Parents of all social and cultural backgrounds are actively encouraged and supported to be involved in both governance and advisory roles in the local education system”, encompasses these social determinants – social exclusion, early life, education/literacy and income/income distribution. Another indicator statement, “Local schools are “hubs” or centres of community activity and are well connected to and used for many community purposes”, encompasses social exclusion, education/literacy, and possibly early life and income/income distribution.
Generally speaking, a table showing the association between the ICC indicator statements and the SDOH would look very similar to Table 1. The indicator statements in the Civic Engage-ment dimension would have slightly fewer associations with various SDOH, while the indicator statements in the Human Development and Community Services dimensions would have more associations with various social determinants. The indicator statements in the Diversity and Living Conditions dimensions would have the most associations with various SDOH.
The relationship between the indicator statements and the SDOH reveals the extent to which the practice of building social inclusion has many features in common with addressing the social determinants. This association also suggests that people’s experiences of social inclusion/exclu-sion and their experiences with the negative affects of the social determinants have common features. The most important common feature is social and health inequality.
ICC Edmonton Findings and SDOH When participants in the Edmonton inquiry process shared their knowledge and experiences with social inclusion/exclusion, they were also sharing their perceptions of the influence of the SDOH on social inclusion. People rarely used the term, “social determinants of health”. How-ever, a review of the findings and quotes from the focus groups confirms that participants were very concerned about issues identified as SDOH in Table 1. This was particularly evident in the
...people’s experiences of social inclusion/exclusion
and their experiences with the negative affects of the social determinants have
common features. The most important common feature
is social and health inequality.

12
focus groups for the living conditions dimension, in which the areas of inquiry were income/em-ployment, housing and community safety.
A participant made the link between income, health and inclusion this way: “Income inequity is enormous. There’s a strong correlation between mortality rates and the degree of income inequality – not just poor people dying, but the overall health of the population is affected by income (in)equalities.” Another participant linked income and housing to social exclusion: “There are neighbourhoods for the rich and neighbour-hoods for the poor and we’ve planned it that way.” Another person linked his experience with inequity in employment to social exclusion: “I have a PhD and I’ve been teaching for most of my life and they won’t let me teach high school. Professional as-sociations are there to protect their own, and there is a deliberate attempt to keep out foreign-trained professionals.” There were also concerns expressed about other social determinants, including health services (“It’s common knowledge that if you’re admitted into hospital, you better have a caregiver with you to monitor the quality of care you get because nurses are really stretched.”), housing/social exclusion (“The thing that makes me feel most left out is the lack of wheelchair accessible housing. It extremely limits my choices on where I live and who I interact with.”) and early life (“Society in general, and politicians in particular, need to fundamentally recognize the value of children. We know children are our future, but this is not reflected in policy.”).
The recommendations in the ICC Edmonton Report confirm the association between social inclusion and the social determinants. Four of the eight thematic areas for the recommendations – income/employment, housing, child development and education are explicitly social deter-minants and the other four thematic areas share important elements of the SDOH. Of the 19 recommendations developed by the Edmonton Civic Panel to build a more inclusive community, 15 were specifically linked to the social determinants.
Social Inclusion Health Indicators for Edmonton
The Social Inclusion Health Indicators for Edmonton (Table 2) were largely developed from the outcomes and benchmarks of the ICC Edmonton recommendations. These indicators provide a framework to help focus policy, programming and service delivery efforts and measure progress in addressing SDOH and increasing social inclusion in Edmonton. The intention was to develop a valid and practical measurement tool framed within a population health lens that would help to enhance community practice. This concise framework of expected results and evaluation criteria provides a blueprint for what kind of society we want and how we will recognize it when we have succeeded. Other communities can readily adapt the tool to assist in developing their strategies to build a more inclusive community and measuring progress towards achieving their outcomes.
The tool builds on the ICC dimensions of social inclusion – institutional recognition of diver-sity, opportunities for human development, quality of civic engagement, cohesiveness of living conditions and adequacy of community services. To enhance the tool’s suitability for community
“Society in general, and politicians in particular, need to fundamentally recognize the value of children. We know children are our future, but this is not reflected in policy.”

13
practice, it contains a manageable number of indicators – a key outcome and lead indicator for each social inclusion dimension supplemented by other important outcomes and indicators. The indicators are measurable and applicable to the general population rather than being population specific.
Table 2 – Social Inclusion Health Indicators for EdmontonInstitutional Recognition of Diversity
Outcomes Indicators
Key OutcomeInstitutions foster social inclusion in Edmon-ton through shifts in established practice and organizational culture.
Lead IndicatorNumber, types and perceived effectiveness of new diversity and anti-racist policies, initiatives and education/training programs adopted by governments, organizations and public institutions.
Other Important OutcomesInstitutional readiness for inclusion is fostered through a City funded, independent Edmon-ton Inclusion Office.
City of Edmonton’s workforce reflects the diversity in Edmonton, especially in manage-rial positions.
Edmontonians feel safe in their communities
Edmontonians identify strategies to build stronger, safer neighbourhoods.
Edmontonians have confidence in a justice system that integrates diversity practices and wisdom into policies and practices.
Other Important IndicatorsResults from indicators used by the Edmonton Inclusion Office to evaluate progress towards a more inclusive Edmonton.
Number and diversity among the City of Edmonton’s workforce, especially the number of managers in proportion to the diversity in the general population.
Perceptions of citizens about community safety.
Resources and number of police offers dedicated to crime prevention (e.g., focus on community policing, addressing root social causes, and improving relationships with ethno-cultural communities).
Percentage of citizens that report increased confidence in the justice system. Number, types and perceived effectiveness of policies/ practices formally implemented that reflect diversity values (e.g., community sentencing, role of Aboriginal Elders, alterna-tive sentencing).
14
Opportunities for Human Development Outcomes Indicators
Key OutcomeAll Edmontonians have access to a high qual-ity education that meets their lifelong learning needs.
Lead IndicatorResources for public schools and perceived quality of public school environment (e.g., teaching resources, extracurricular activities, etc.), especially among vulnerable popula-tions.
Other Important OutcomesEducational institutions foster social inclusion through institutionalized cultural competence and shifts in established practice and organi-zational culture.
Edmonton is a child-friendly community in which all families have the capacity and supports to nurture their children.
All Edmontonians have a high quality of life in a community that is enriched by the arts, culture and recreation.
Other Important IndicatorsNumber of students attending/graduat-ing from high school, and post-secondary education, and adults returning to schools, especially among vulnerable populations.
Number, types and perceived effectiveness of policies and programs implemented to foster a sense of cultural competence among teach-ers and a culture of inclusion throughout the public education system.
Number of families that have access to quality (e.g., fees/ affordability, subsidies, number of spaces) child care that meets their needs and integrates early childhood develop-ment practices.
Number of previously excluded Edmontonians now participating in the arts, culture and recreation.
Number, types and perceived effectiveness of policies implemented to recognize and support diversity creation/participation in the arts, culture and recreation.
Quality of Civic Engagement Outcomes Indicators
Key OutcomeCitizens participate actively and meaningfully in civic decision-making processes.
Lead IndicatorNumber, types and perceived effectiveness of public participation processes based on shared decision-making versus simply consul-tation.
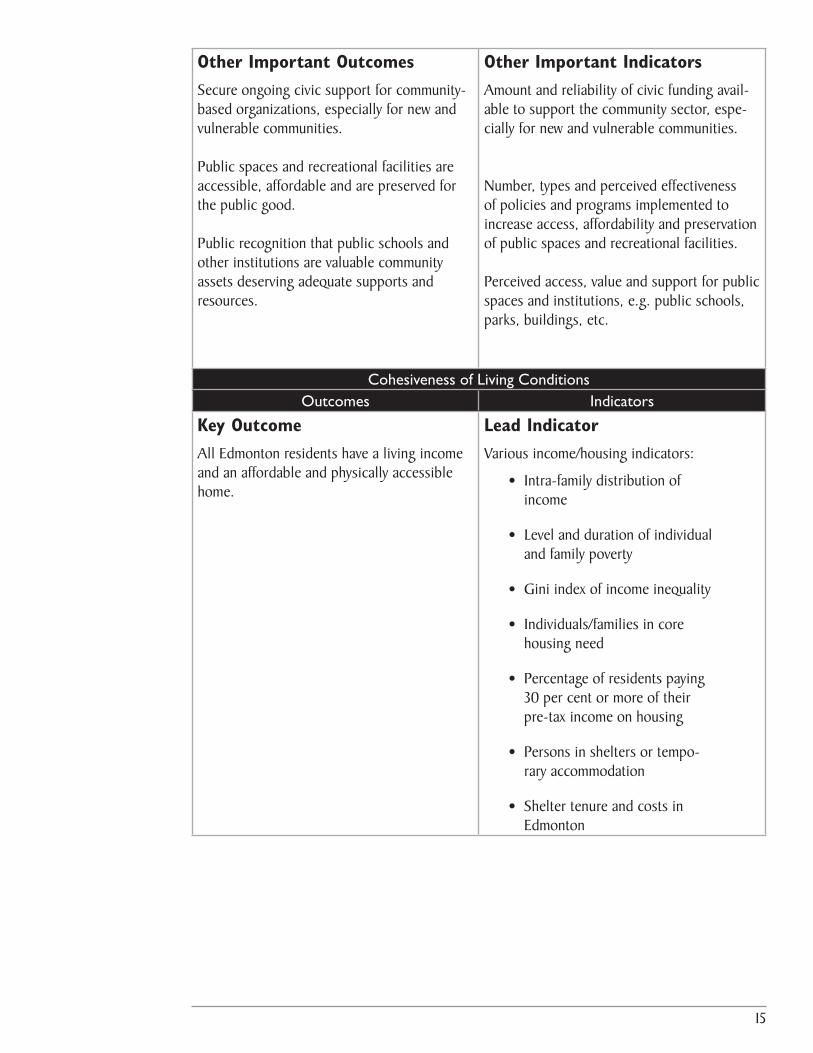
15
Other Important OutcomesSecure ongoing civic support for community-based organizations, especially for new and vulnerable communities.
Public spaces and recreational facilities are accessible, affordable and are preserved for the public good.
Public recognition that public schools and other institutions are valuable community assets deserving adequate supports and resources.
Other Important IndicatorsAmount and reliability of civic funding avail-able to support the community sector, espe-cially for new and vulnerable communities.
Number, types and perceived effectiveness of policies and programs implemented to increase access, affordability and preservation of public spaces and recreational facilities.
Perceived access, value and support for public spaces and institutions, e.g. public schools, parks, buildings, etc.
Cohesiveness of Living Conditions Outcomes Indicators
Key OutcomeAll Edmonton residents have a living income and an affordable and physically accessible home.
Lead IndicatorVarious income/housing indicators:
• Intra-family distribution of income
• Level and duration of individual and family poverty
• Gini index of income inequality
• Individuals/families in core housing need
• Percentage of residents paying 30 per cent or more of their pre-tax income on housing
• Persons in shelters or tempo-rary accommodation
• Shelter tenure and costs in Edmonton
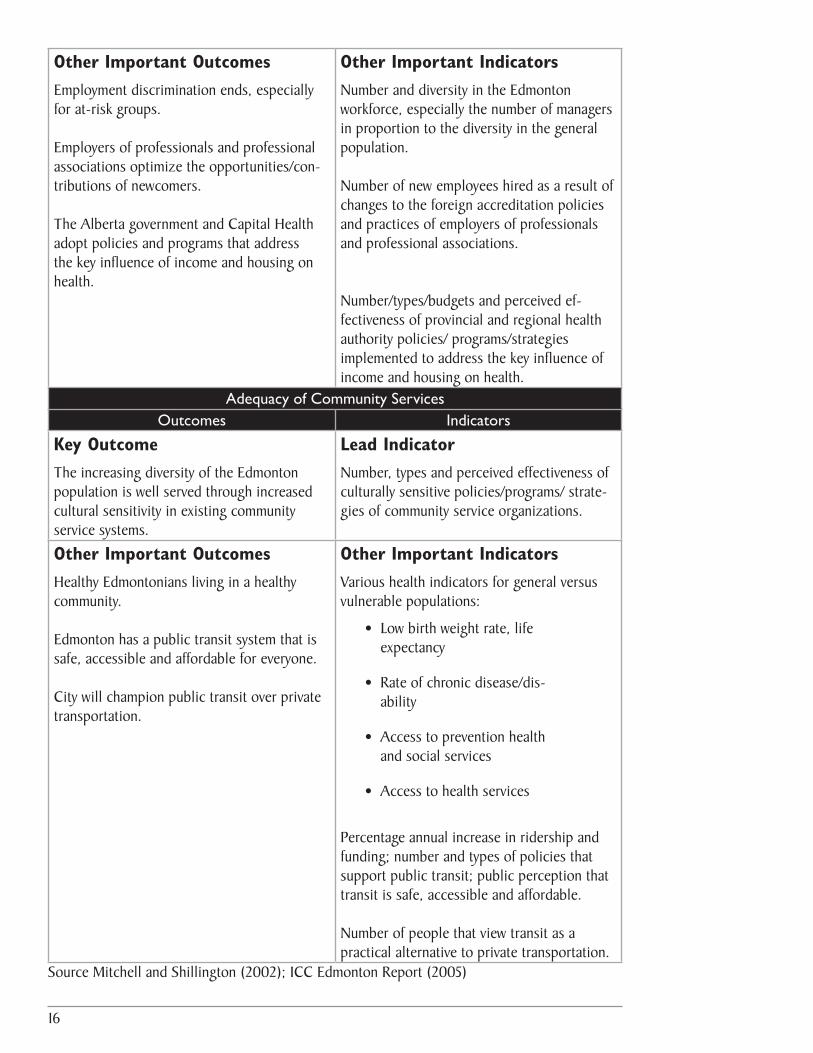
16
Other Important OutcomesEmployment discrimination ends, especially for at-risk groups. Employers of professionals and professional associations optimize the opportunities/con-tributions of newcomers.
The Alberta government and Capital Health adopt policies and programs that address the key influence of income and housing on health.
Other Important IndicatorsNumber and diversity in the Edmonton workforce, especially the number of managers in proportion to the diversity in the general population.
Number of new employees hired as a result of changes to the foreign accreditation policies and practices of employers of professionals and professional associations.
Number/types/budgets and perceived ef-fectiveness of provincial and regional health authority policies/ programs/strategies implemented to address the key influence of income and housing on health.
Adequacy of Community Services Outcomes Indicators
Key OutcomeThe increasing diversity of the Edmonton population is well served through increased cultural sensitivity in existing community service systems.
Lead IndicatorNumber, types and perceived effectiveness of culturally sensitive policies/programs/ strate-gies of community service organizations.
Other Important OutcomesHealthy Edmontonians living in a healthy community.
Edmonton has a public transit system that is safe, accessible and affordable for everyone.
City will champion public transit over private transportation.
Other Important IndicatorsVarious health indicators for general versus vulnerable populations:
• Low birth weight rate, life expectancy
• Rate of chronic disease/dis-ability
• Access to prevention health and social services
• Access to health services
Percentage annual increase in ridership and funding; number and types of policies that support public transit; public perception that transit is safe, accessible and affordable.
Number of people that view transit as a practical alternative to private transportation.
Source Mitchell and Shillington (2002); ICC Edmonton Report (2005)

17
Conclusion
An important outcome of the ICC initiative in Ed-monton was to support and reinforce efforts by the City of Edmonton to shift its established practices and organizational culture towards building a more socially inclusive city. The booming local economy and accompanying shortage of skilled workers provides further incentive to increase efforts to attract newcomers and create a more welcoming city. Community stakeholders and the City of Edmonton recognize that the local civic government must be the catalyst for collaborative efforts to develop and sustain civic capacity to build social inclusion. This requires political will to act decisively in areas of municipal jurisdiction and to advocate on issues outside its mandate to other levels of government. In August 2006, the City of Edmonton and other major cities in Alberta recommended to a provincial govern-ment committee that the province and municipalities undertake coordinated and collaborative efforts to address homelessness.
At the same time, Edmontonians and Albertans need to better understand that everyone is negatively affected by the social and economic costs of social exclusion, particularly during an economic boom. While the media focuses on the acute labour shortage, little attention is being paid to the social deficit that accompanies social exclusion. This social deficit in Alberta has increased as a result of dramatic cuts to provincial programs that could have reduced the negative affects of social exclusion. Recently Premier Klein admitted that the provincial govern-ment had no plan for managing the booming economy. The negative consequences of the boom have caused some Albertans to call for a managed approach to the oil sands development that is environmentally sustainable and provides for the long term prosperity and social well-being of all Albertans.
The ICC dimensions of social inclusion and these social inclusion health indicators support our better understanding of the negative effects of social exclusion and the close association between social inclusion and SDOH. The effective application of these indicators can improve community practice by helping to focus efforts and measure progress towards building healthy and inclusive communities. In Alberta, for example, the tool may be useful in a number of current initiatives. The Alberta Healthy Living Network is undertaking a project to increase the capacity of health practitioners and community stakeholders to better understand the key influ-ence of the SDOH on health and develop action plans to address the SDOH. This tool may be useful in supporting municipalities and regional health authorities in setting local priorities and measuring their progress in addressing the SDOH. The tool may be a practical resource for the City of Edmonton and community stakeholders in priorizing and measuring their collaborative efforts to enhance social inclusion in Edmonton. Capital Health and community stakeholders developing the proposed New Canadians Health Centre in Edmonton may also find the tool helpful in integrating the delivery of clinical health services and community-based services into their joint efforts to address SDOH.
While the media focuses on the acute labour shortage,
little attention is being paid to the social deficit that
accompanies social exclusion. This social deficit in Alberta has increased as a result of dramatic cuts to provincial programs that could have
reduced the negative affects of social exclusion.
18
Despite these local examples of building social inclusion and addressing the SDOH, and the clear evidence that the SDOH affect health, the health sector has for the most part been reluctant to champion policies that improve social conditions. This is because areas of social and economic policy largely fall outside the mandate of health departments. Accompanying this has been a reluctance to “step on toes” and collaborate across sectors (Raphael 2004a; SDOH Across the Life-Span Conference, 2002). Williamson (2001) notes that studies show some health practitioners believe they lack the requisite knowledge and skills to address poverty, while others fear they will experience repercussions at work if they engage in political strategies addressing poverty. To move forward in addressing health disparities, the Health Disparities Task Group of the Federal/Provincial/Territorial Advisory Committee on Population Health and Health Security (2005:6) concluded that “The health sector needs to strengthen its commitment to making health disparities reduction a priority for action and put in place the mechanisms that will facilitate building this perspective into relevant aspects of its work.” Recently the Sudbury and District Health Unit released a discussion paper urging that the mandate for the Ontario public health system be expanded to include specific program requirements to either mitigate or address the underlying social and economic risks to health (Lefebre, Warren, Lacle and Sutcliffe, 2006).
The capacity of health practitioners in Alberta to work with community stakeholders on social inclusion and the other SDOH varies significantly among the health regions. Health practitio-ners affirm many of the barriers and challenges listed above, particularly in working with sectors outside of health. With the many mandated health care programs and services, some health practitioners report there is little time or resources to work with other community stakeholders on building social inclusion in their communities (O’Hara, 2006). Given the clear evidence linking the SDOH to health outcomes, community stakeholders look to the health sector to provide leadership and take decisive action to address the SDOH. Broadening the mandate of health regions in Alberta to include addressing the SDOH would support the capacity of health practitioners to increase their collaboration with other sectors in building social inclusion and addressing social and health inequities.
Broadening the mandate of health regions in Alberta to include addressing the SDOH would support the capacity of health practitioners to increase their collaboration with other sectors in building social inclusion and addressing social and health inequities.

19
References
Alberta Human Resources and Employment. (2004). Supporting Immigrants and Immigra-tion to Alberta.www.hre.gov.ca
Alberta Human Resources and Employment. (2006). Minimum Wage Profile 12-Month Average (July 2005-June 2006). www.hre.gov.ca
Bernier, N. (2005). Public Health Policy and the New Public Health: Approaches to Improving the Population’s Health in Canada. Paper presented at The Price of Life: Welfare Systems, Social Nets and Economic Growth Conference. Organized by the Phoenix Thematic Network on Health and Social Welfare Policy in Catania, Italy, June 2005. Depart. of Social and Preventative Medicine, Univ. of Montreal.
Canadian Council on Social Development. (2001). Equity, Inclusion and the Health of Canadians. Submission to the Commission on the Future of Health Care in Canada.
CBC News. (2006). The National, August 23, 2006.
City of Edmonton. (2005). Edmonton Social Plan. Poverty – Low-Income. www.edmon-ton.ca/socialplan
Clutterbuck, P. (2003). Social and Economic Inclusion and Population Health. Social and Economic Inclusion Initiative – “Closing the Distance”.
Clutterbuck, P. and Novick, M. (2003). Building Inclusive Communities: Cross-Canada Perspectives and Strategies. Toronto: Laidlaw Foundation.
Clutterbuck, P. Freiler, C and Novick, M. (2005). Meeting the Civic Challenges of Social Inclusion: Cross- Canada Findings and Priorities for Action. Prepared for the national symposium Building a New Canada: Meeting the Civic Challenges of Social Inclusion. Inclusive Cities Canada. Social Developme0nt Canada.
Clutterbuck, P. (2006). Personal correspondence.
Community Services Consulting Ltd. (2004). Making Ends Meet: A profile of Urban Pov-erty in Alberta. Inter-City Forum on Social Policy. Author: P. Faid. www.edmonton.ca./socialplan
Derwing, T., Krahn, H., Foote, J. and Diepenbroek, L. (2005). The Attraction and Retention of Immigrants to Edmonton. Prairie Centre of Excellence for Research on Immigra-tion& Integration, The University of Alberta.
Edmonton Aboriginal Accord Initiative. (2005). Fast Facts: Aboriginal Edmonton – A Statistical Profile of the Aboriginal Population of the City of Edmonton. www.edmonton.ca
Edmonton Joint Planning Committee on Housing. (2004). A Count of Homeless Persons in Edmonton – October 2004. www.moresafehomes.net
20
Edmonton Joint Planning Committee on Housing. (2005). Edmonton Community Plan on Housing and Support Services 2005-2009. www.moresafehomes.net
Edmonton Journal. (2006). Edmonton Boom Times – Special Five-Part Series. April 24-28, 2006.
Edmonton Journal. (2006a). ‘Skyrocketing house prices create own problems’. August 26, 2006. Page B1.
Edmonton Social Planning Council. (2004). Social policy and the 2004 civic election. Elec-tion Bulletin October 2004. www.edmspc.com
Edmonton Social Planning Council. (2005). Inclusive Cities Canada: Edmonton Community Voices, Perspectives and Priorities. Inclusive Cities Canada: A Cross-Canada Civic Initia-tive. Author, P. O’Hara. www.inclusivecities.ca
Federation of Canadian Municipalities. (2004). The FCM Quality of Life. Highlights Report 2004 Quality of Life in Canadian Municipalities: Benchmarking Edmonton’s Progress 2004.
Freiler, C. (2001). Towards a Vision of Social Inclusion for Children, Families and Commu-nities: What needs to change? Concept paper prepared for the Laidlaw Foundation.
Freiler, C. (2003). The Laidlaw Foundation’s Approach to Social Inclusion; Developed for the Social Inclusion Indicators Meeting March 5, 2003. Laidlaw Foundation. www.laidlawfdn.org
Freiler, C. (2003a). Notes from Social Inclusion Index Meeting. Convened by Laidlaw Foundation, the Roeher Institute, and the Canadian Council on Social Development. March 5, 2003.
Galabuzi, G-E. and Labonte, R. (2002). Social Inclusion as a Determinant of Health. Sum-mary of presentations at The Social Determinants of Health Across the Life-Span Conference. Toronto.
Guildford, J. (2000). Making the Case for Social and Economic Exclusion. Population and Public Health Branch, Atlantic Regional Office, Health Canada, Halifax.
Hancock, T., Labonte, R. and Edwards, R. (1999). Indicators that Count! Measuring Popula-tion Health at the Community Level. Canadian Journal of Public Health. Vol. 90, Supple-ment 1: S22-26.
Health Canada. (2001). Social Capital, Social Cohesion, Social Inclusion/Exclusion. Popula-tion Health Newsletter. Ottawa.
Health Canada. (2002). Determinants of Health. Health Canada, Population and Public Health Branch AB/NWT. Slide presentation.
Health Council of Canada. (2006). Annual Report to Canadians 2005. Health Care Re-newal in Canada: Clearing the Road to Quality.
21
Health Canada. (2004). What Determines Health? www.phac-aspc.gc.ca
Health Dispaities Task Group of the Federal/Provincial/Territorial Advisory Committee on Population Health and Health Security. (2005). Reducing Health Disparities – Roles of the Health Sector: Recommended Policy Directions and Activities.
Hyndman, B. (2006). Inclusion: A New Approach to Public Health Practice. Ontario Inclu-
sion Learning Network. Larry Hershfield and Associates.
Jackson, A. (2001). Social Inclusion/Exclusion of Children: Conceptual Framework and Indicators. Prepared by the Canadian Council on Social Development for the Laid-law Foundation.
Kawachi, I. and Kennedy, B. (2002). The Health of Nations: Why Inequality is Bad for Your Health. New York: New Press.
Kawachi, I. Wilkinson, R. and Kennedy, B. (1999). “Introduction”, in I. Kawachi, B. Kennedy, and R. Wilkinson (Editors). The Society and Population Health Reader. Volume I: Income Inequality and Health: New York, The New Press.
Lefebvre,S., Warren,C., Lacie, S., & Sutcliffe, P. (2006) A framework to integrate social and economic determinants of health into the Ontario public health mandate: A discus-sion paper. Sudbury, Ontario: Sudbury & District Health Unit.
Marmot, M. and Wilkinson, R. (1999). Editors. Social Determinants of Health. Oxford; Oxford Univ. Press
Mitchell, A. and Shillington, R. (2002). Poverty, Inequality and Social Inclusion. Perspectives on Social Inclusion. Working Paper Series. Laidlaw Foundation. www.laidlawfdn.org
National Council of Welfare. (2006). National Council of Welfare Reports. Poverty Profile
2002 and 2003.
Novick, M. (2001). Social Inclusion: The Foundation of a National Policy Agenda. Laidlaw Foundation. http://www.ccsd.ca/subsites/inclusion/bp/mn.htm
O’Hara, P. (2005). Creating Social and Health Equity: Adopting an Alberta Social Determi-nants of Health Framework. Discussion paper from the Edmonton Social Planning Council. www.who.int/social_determinants/resources/paper_ca.pdf
O’Hara, P. (2006). Discussions with health practitioners and community stakeholders. Alberta Healthy Living Network presentations on SDOH.
Provincial Advisory Group. (2003). Working Criteria for Indicator Development. Social and Economic Inclusion Project. Ontario Prevention Clearinghouse.
Raphael, D. (2003). Social Inclusion and the Health of Canadians: Where are the Gaps? Recognizing the Political Barriers to a Healthy Inclusive Society: The Case of the Social Determinants of Health. ‘What Do We Know and Where Do We Go?’ Build-ing a Social Inclusion Agenda. 2003 Social Inclusion Research Conference. Ottawa.

22
Raphael, D. (2003). Addressing the Social Determinants of Health in Canada: Bridging the Gap Between Research Findings and Public Policy. Policy Options. March: 35-40.
Raphael, D. (2004). Recognizing the Political Barriers to a Healthy Inclusive Society: The Case of the Social Determinants of Health. www.ccsd.ca
Raphael, D. (editor) (2004a) Social Determinants of Health: Canadian Perspectives. Chapter 1- Introduction to the Social Determinants of Health. Canadian Scholar’s Press Inc. Toronto.
Roeher Institute. (2003). Towards a Common Understanding of Social Inclusion. Toronto.
Sen, A. (2000). Inequality Re-examined. Harvard University Press, 1992; Development as Freedom, Anchor Books. Cambridge, MA.
Sharpe, A. (2000). CPRN Survey of Social Indicators of Well-being. Background paper by Canadian Policy Research Network: Ottawa.
Shaw, M., Dorling, D., & Davey-Smith, G. (1999). Poverty, social exclusion and minorities. In R.G. Wilkinson (Ed.), Social Determinants of Health. Oxford, U.K.: Oxford University
Shookner, M. (2000). An Inclusion Lens: Workbook for Looking at Social and Economic Inclusion. Population Health Branch, At5lantic Regional Office, Health Canada.
Stafford, M. & Marmot, M. (2003). Neighborhood deprivation and health: does it affect us all equally? International Journal of Epidemiology, 32, 357-366.
Statistics Canada. (2004). 2001 Census Community Profiles. www.12statscan.ca
TD Economics. The 2006 Alberta Budget. TD Financial Group. March 22, 2006. www.td.com/economics
The Social Determinants of Health across the Life-Span Conference. (2002). Toronto.
Wilkins, R. (1995). Mortality by Neighbourhood Income in Urban Canada, 1986-91”. Paper presented at the Conference of the Canadian Society for Epidemiology and Biostatistics, St. John’s, NFD.
Wilkinson, R. (1996). Unhealthy Societies – The Afflictions of Inequality. Routledge. London
Wilkinson, R. and Marmot, M. (1998). Social Determinants of Health: The Solid Facts. Copenhagen: World Health Organization.
Williamson, D. (2001) The Role of the Health Sector in Addressing Poverty. Canadian Journal of Public Health. Vol. 92, No. 3:178-182.
World Health Organization. (2005). Knowledge Network on Social Exclusion. Commis-sion on the Social Determinants of Health Regional Consultation. Presentation. www.who.int/social-determinants