social indices in the sadc context saspen psp fes. · pdf filesocial indices in the sadc...
TRANSCRIPT

SED 1
Social Indices in the SADC ContextThe Case of the Basic Needs
Basket (BNB) and BNB Trends
Measuring Inequality – Monitoring Resource Distribution –Promoting Justice
SIMPASA Andrew, [email protected]
Jesuit Centre for Theological ReflectionSocio-economic Development Programme
2
OUTLINE
• Objectives• Definition• Methodology • Contextual Analysis• BNB Trends• Conclusion
Objectives of the Conversation
To introduce JCTR, Our values, aims and objectives.To present the Basic Needs Basket.To account for the social indices of the Basic Needs basket.To benefit from stakeholder engagement.To generate possible additional BNB Improvement indices.
4
What is the Urban Basic Needs Basket (BNB)
A tool that tracks prices for basic household commodities in urban areas on a monthly basis Evidence gathering tool on the living conditions of families
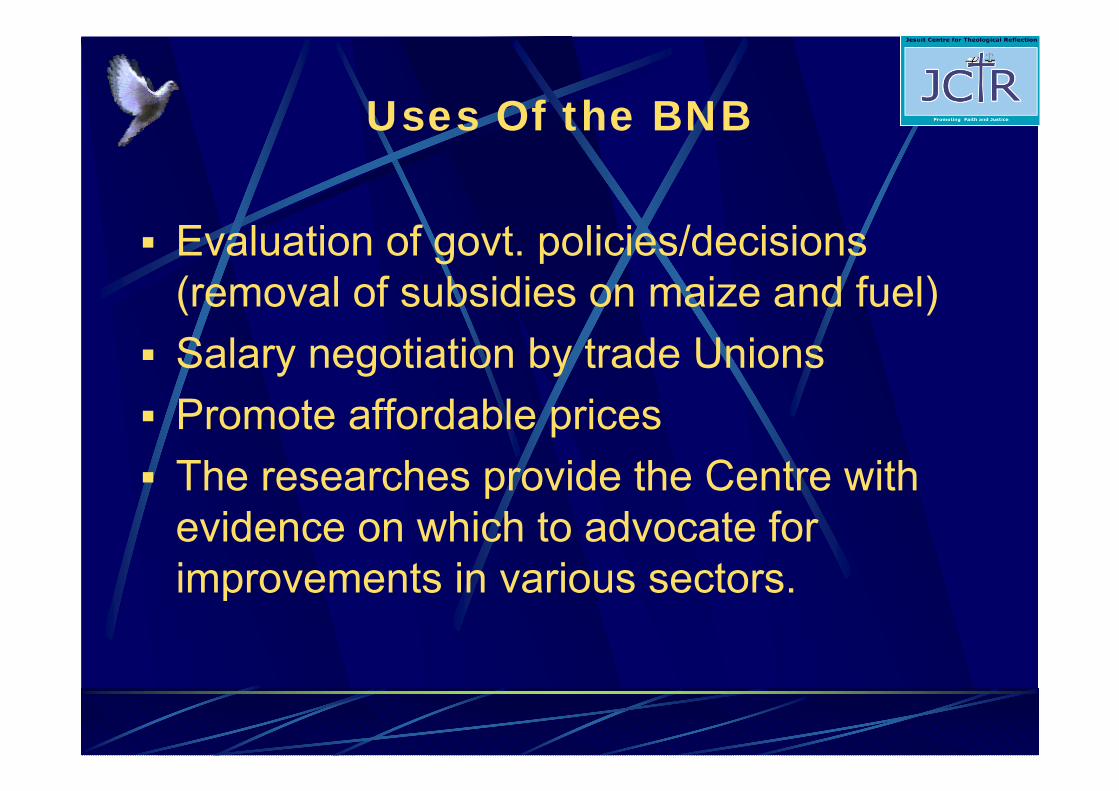
Uses Of the BNB
Evaluation of govt. policies/decisions (removal of subsidies on maize and fuel)Salary negotiation by trade Unions Promote affordable prices The researches provide the Centre with evidence on which to advocate for improvements in various sectors.

Indicators / Users of the BNBChurch: Communication tool on Church Social Teachings’ Key Values eg Dignity of every human personCommunity: Challenge to promote proactiveness as active citizens before seeking assistanceEmployers: Inspiration to take a hand in fighting poverty Government: Policy guide
just minimum wage, a fair tax code, strategic fuel reserves, loans for entrepreneurship, subsidized utilities, etc.
Households: An inspiration to fight povertyHousehold budget
NGOs: Advocacy and informative toolTrade Unions: Advocacy tool
improved conditions of service i.e. wages etc.
7
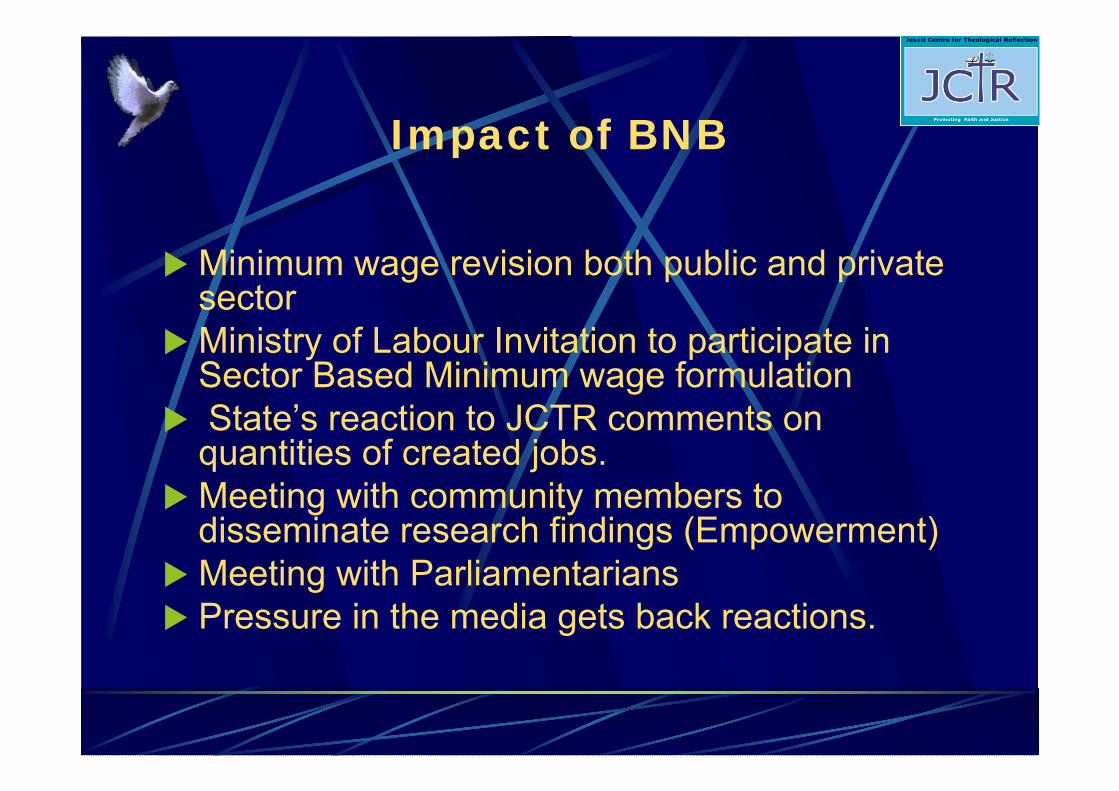
Impact of BNB
Minimum wage revision both public and private sectorMinistry of Labour Invitation to participate in Sector Based Minimum wage formulation State’s reaction to JCTR comments on quantities of created jobs.Meeting with community members to disseminate research findings (Empowerment)Meeting with ParliamentariansPressure in the media gets back reactions.
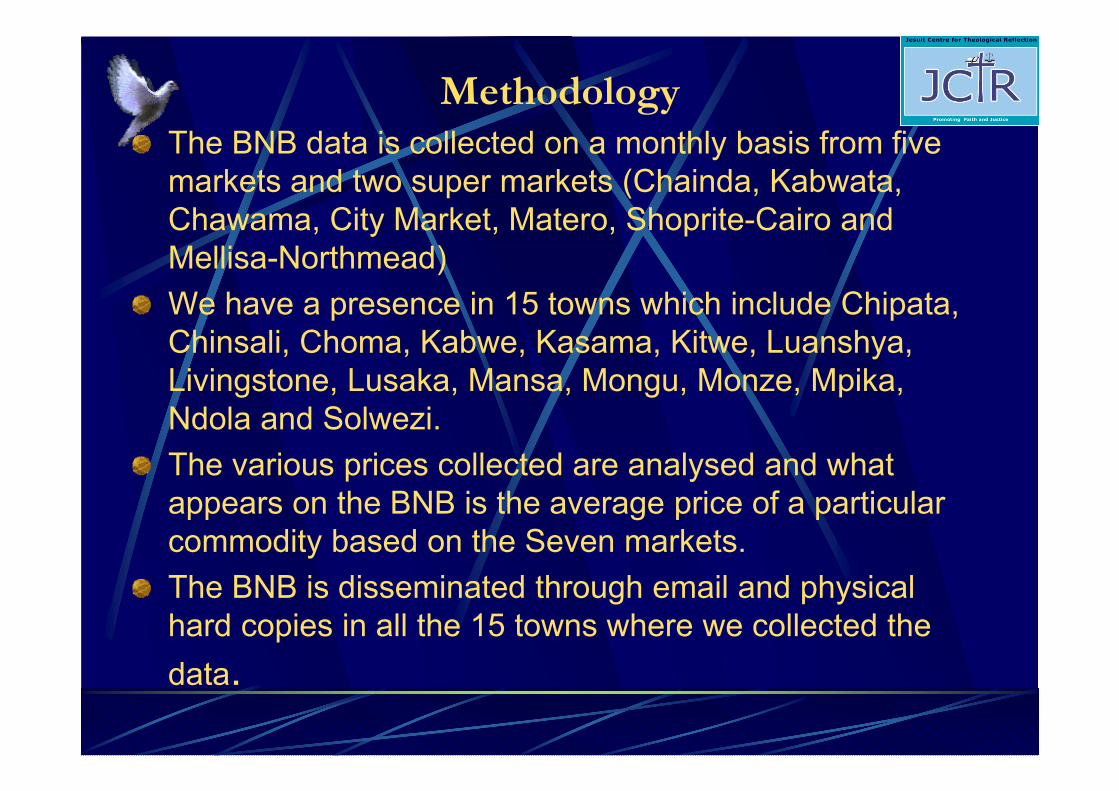
MethodologyThe BNB data is collected on a monthly basis from five markets and two super markets (Chainda, Kabwata, Chawama, City Market, Matero, Shoprite-Cairo and Mellisa-Northmead)We have a presence in 15 towns which include Chipata, Chinsali, Choma, Kabwe, Kasama, Kitwe, Luanshya, Livingstone, Lusaka, Mansa, Mongu, Monze, Mpika, Ndola and Solwezi.The various prices collected are analysed and what appears on the BNB is the average price of a particular commodity based on the Seven markets.The BNB is disseminated through email and physical hard copies in all the 15 towns where we collected the data.
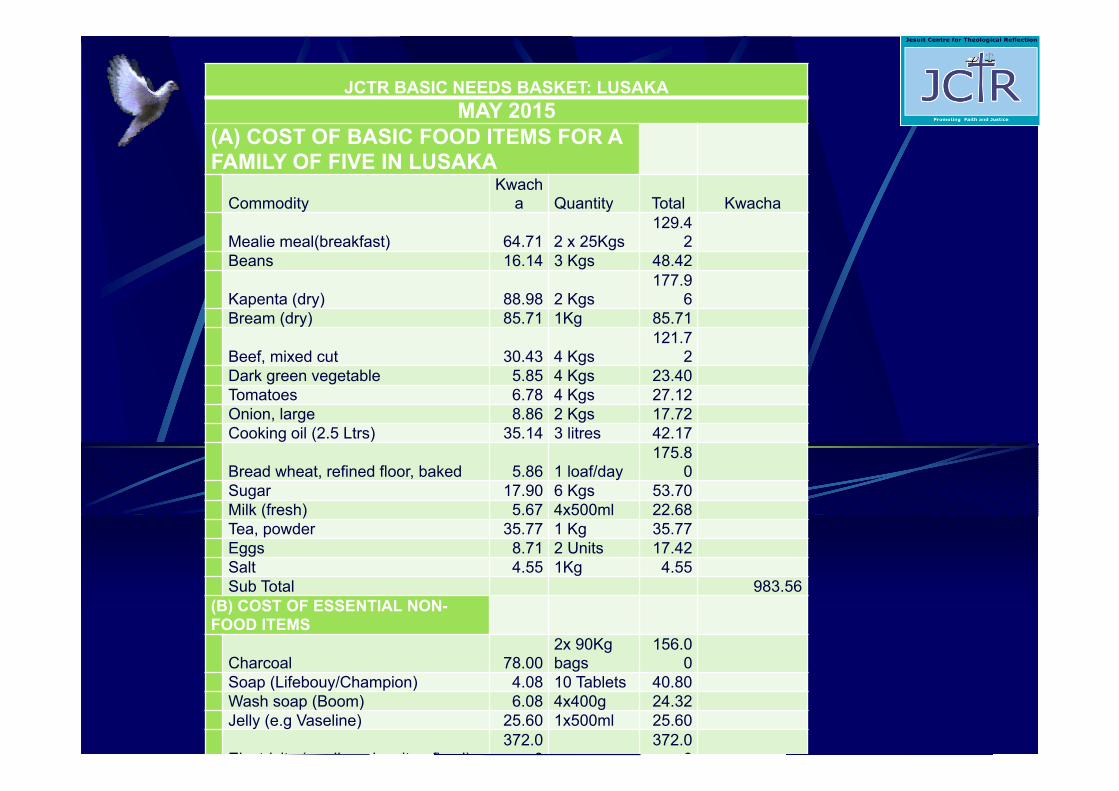
JCTR BASIC NEEDS BASKET: LUSAKAMAY 2015
(A) COST OF BASIC FOOD ITEMS FOR A FAMILY OF FIVE IN LUSAKA
CommodityKwach
a Quantity Total Kwacha
Mealie meal(breakfast) 64.71 2 x 25Kgs129.4
2Beans 16.14 3 Kgs 48.42
Kapenta (dry) 88.98 2 Kgs177.9
6Bream (dry) 85.71 1Kg 85.71
Beef, mixed cut 30.43 4 Kgs121.7
2Dark green vegetable 5.85 4 Kgs 23.40Tomatoes 6.78 4 Kgs 27.12Onion, large 8.86 2 Kgs 17.72Cooking oil (2.5 Ltrs) 35.14 3 litres 42.17
Bread wheat, refined floor, baked 5.86 1 loaf/day175.8
0Sugar 17.90 6 Kgs 53.70Milk (fresh) 5.67 4x500ml 22.68Tea, powder 35.77 1 Kg 35.77Eggs 8.71 2 Units 17.42Salt 4.55 1Kg 4.55Sub Total 983.56
(B) COST OF ESSENTIAL NON-FOOD ITEMS
Charcoal 78.002x 90Kg bags
156.00
Soap (Lifebouy/Champion) 4.08 10 Tablets 40.80Wash soap (Boom) 6.08 4x400g 24.32Jelly (e.g Vaseline) 25.60 1x500ml 25.60
El t i it ( di d it fi d)372.0
0372.0
0

Our VisionJCTR’s vision is “A just Zambian Society Guided by Faith, where Everyone Enjoys Fullness of Life”Our aspirations shared by government…. How?In the VISION 2030 ;
“The Zambian people’s vision is to become “A ProsperousMiddle Income Nation by 2030”. By 2030, Zambians, aspireto live in a strong and dynamic middle-income industrialnation that provides opportunities for improving the wellbeing of all, embodying values of socioeconomic justice,underpinned by the principles of: (i) gender responsivesustainable development; (ii) democracy; (iii) respect forhuman rights; (iv) good traditional and family values; (v)positive attitude towards work; (vi) peaceful coexistenceand; (vii) private-public partnerships.”
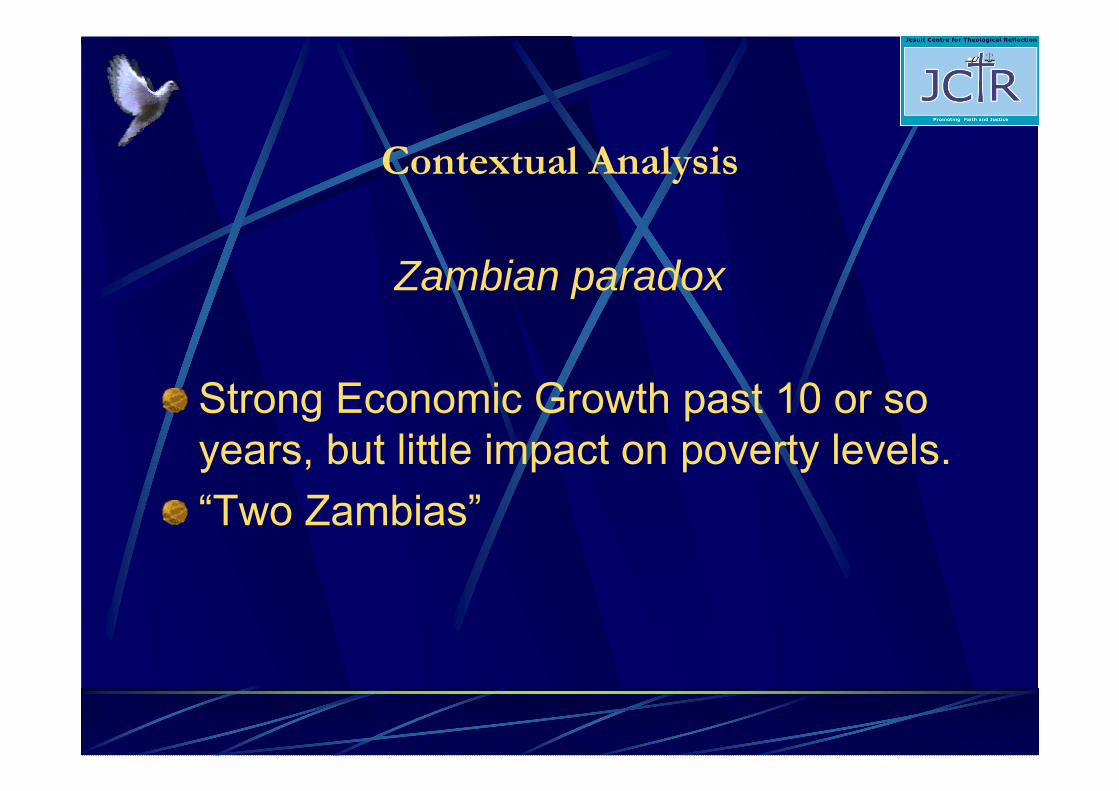
Contextual Analysis
Zambian paradox
Strong Economic Growth past 10 or so years, but little impact on poverty levels.“Two Zambias”

Contextual Analysis Cont’d….
Zambia assigned middle-income status by the World Bank in 2011
Macro-economic Indicators GDP projection –about 6% July 2014 Inflation-8.0 %change rate – K7 (middle rate) per USD (Stable?)Growing construction sector (public and private)Huge Foreign Direct investment (DangoteGroup of Companies)
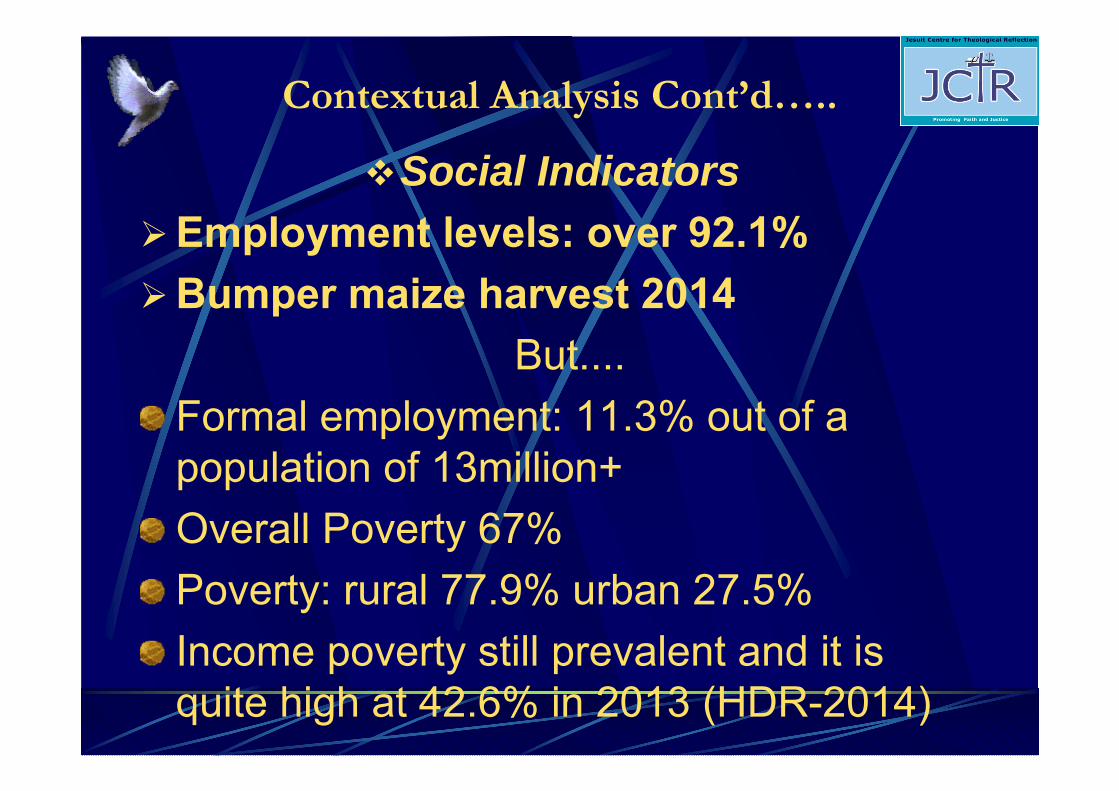
Contextual Analysis Cont’d…..
Social Indicators Employment levels: over 92.1%Bumper maize harvest 2014
But....Formal employment: 11.3% out of a population of 13million+Overall Poverty 67%Poverty: rural 77.9% urban 27.5% Income poverty still prevalent and it is quite high at 42.6% in 2013 (HDR-2014)
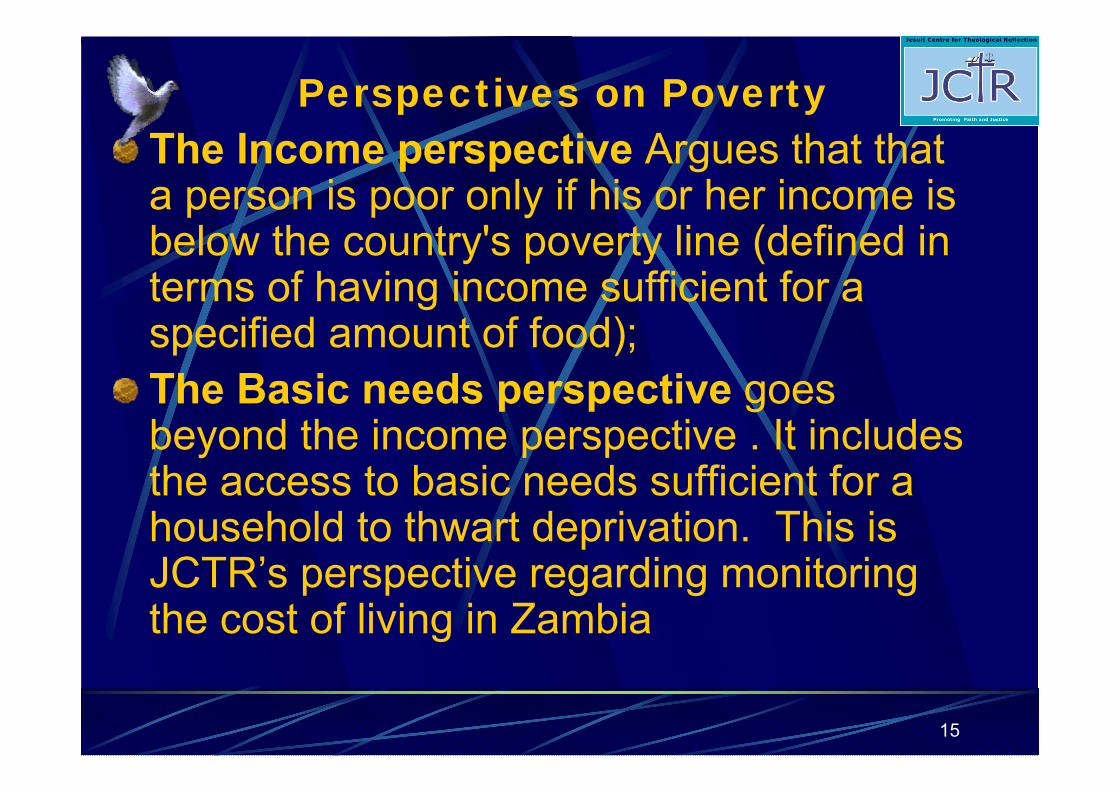
Perspectives on PovertyThe Income perspective Argues that that a person is poor only if his or her income is below the country's poverty line (defined in terms of having income sufficient for a specified amount of food); The Basic needs perspective goes beyond the income perspective . It includes the access to basic needs sufficient for a household to thwart deprivation. This is JCTR’s perspective regarding monitoring the cost of living in Zambia
15
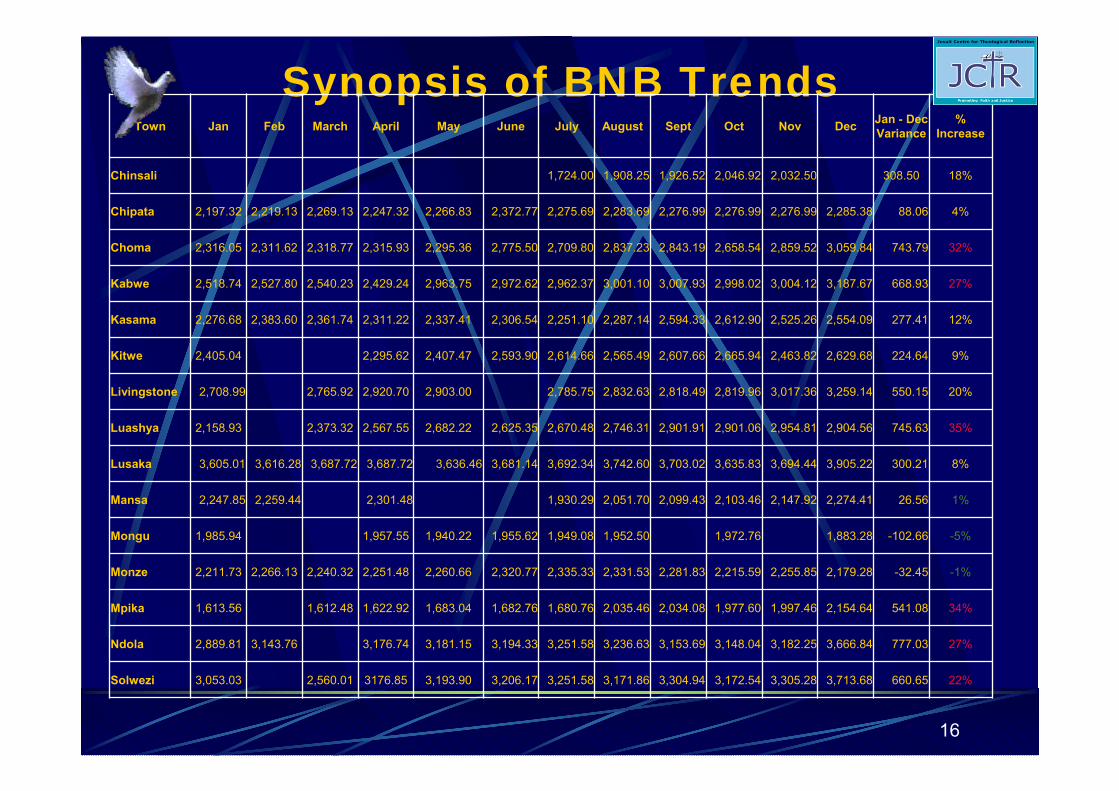
Synopsis of BNB Trends
16
Town Jan Feb March April May June July August Sept Oct Nov Dec Jan - Dec Variance
% Increase
Chinsali 1,724.00 1,908.25 1,926.52 2,046.92 2,032.50 308.50 18%
Chipata 2,197.32 2,219.13 2,269.13 2,247.32 2,266.83 2,372.77 2,275.69 2,283.69 2,276.99 2,276.99 2,276.99 2,285.38 88.06 4%
Choma 2,316.05 2,311.62 2,318.77 2,315.93 2,295.36 2,775.50 2,709.80 2,837.23 2,843.19 2,658.54 2,859.52 3,059.84 743.79 32%
Kabwe 2,518.74 2,527.80 2,540.23 2,429.24 2,963.75 2,972.62 2,962.37 3,001.10 3,007.93 2,998.02 3,004.12 3,187.67 668.93 27%
Kasama 2,276.68 2,383.60 2,361.74 2,311.22 2,337.41 2,306.54 2,251.10 2,287.14 2,594.33 2,612.90 2,525.26 2,554.09 277.41 12%
Kitwe 2,405.04 2,295.62 2,407.47 2,593.90 2,614.66 2,565.49 2,607.66 2,665.94 2,463.82 2,629.68 224.64 9%
Livingstone 2,708.99 2,765.92 2,920.70 2,903.00 2,785.75 2,832.63 2,818.49 2,819.96 3,017.36 3,259.14 550.15 20%
Luashya 2,158.93 2,373.32 2,567.55 2,682.22 2,625.35 2,670.48 2,746.31 2,901.91 2,901.06 2,954.81 2,904.56 745.63 35%
Lusaka 3,605.01 3,616.28 3,687.72 3,687.72 3,636.46 3,681.14 3,692.34 3,742.60 3,703.02 3,635.83 3,694.44 3,905.22 300.21 8%
Mansa 2,247.85 2,259.44 2,301.48 1,930.29 2,051.70 2,099.43 2,103.46 2,147.92 2,274.41 26.56 1%
Mongu 1,985.94 1,957.55 1,940.22 1,955.62 1,949.08 1,952.50 1,972.76 1,883.28 -102.66 -5%
Monze 2,211.73 2,266.13 2,240.32 2,251.48 2,260.66 2,320.77 2,335.33 2,331.53 2,281.83 2,215.59 2,255.85 2,179.28 -32.45 -1%
Mpika 1,613.56 1,612.48 1,622.92 1,683.04 1,682.76 1,680.76 2,035.46 2,034.08 1,977.60 1,997.46 2,154.64 541.08 34%
Ndola 2,889.81 3,143.76 3,176.74 3,181.15 3,194.33 3,251.58 3,236.63 3,153.69 3,148.04 3,182.25 3,666.84 777.03 27%
Solwezi 3,053.03 2,560.01 3176.85 3,193.90 3,206.17 3,251.58 3,171.86 3,304.94 3,172.54 3,305.28 3,713.68 660.65 22%
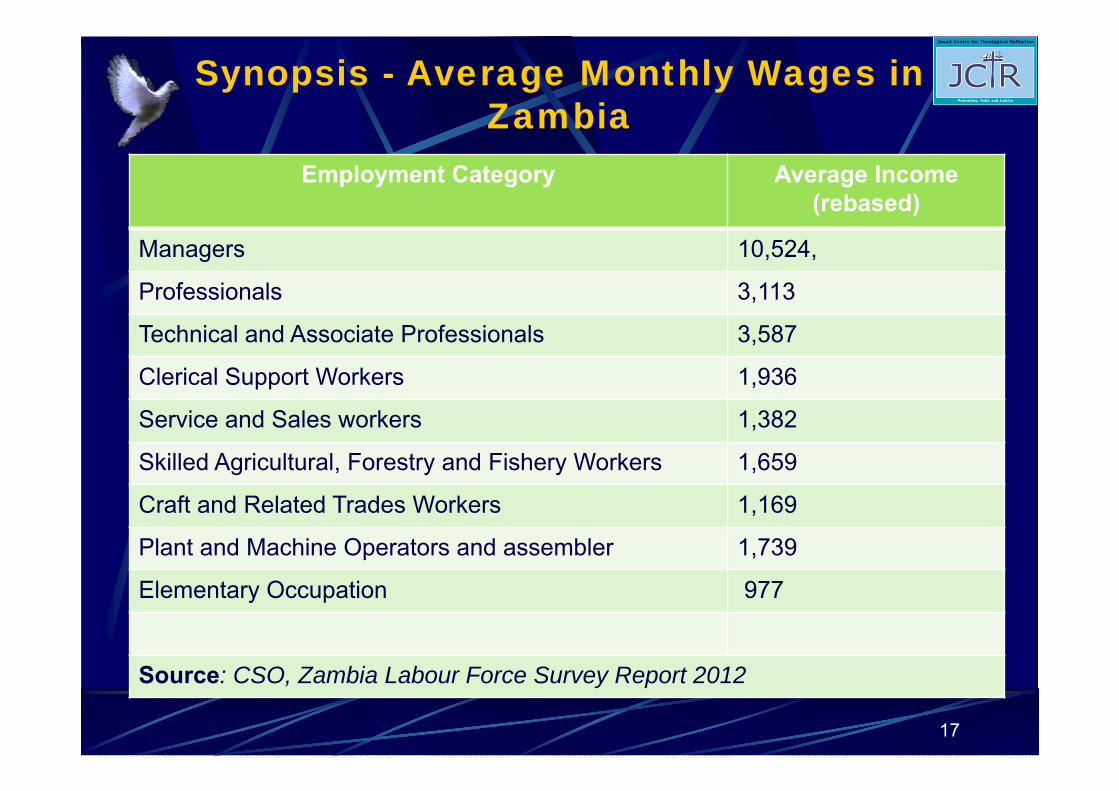
Synopsis - Average Monthly Wages in Zambia
Employment Category Average Income (rebased)
Managers 10,524,
Professionals 3,113
Technical and Associate Professionals 3,587
Clerical Support Workers 1,936
Service and Sales workers 1,382
Skilled Agricultural, Forestry and Fishery Workers 1,659
Craft and Related Trades Workers 1,169
Plant and Machine Operators and assembler 1,739
Elementary Occupation 977
Source: CSO, Zambia Labour Force Survey Report 2012
17
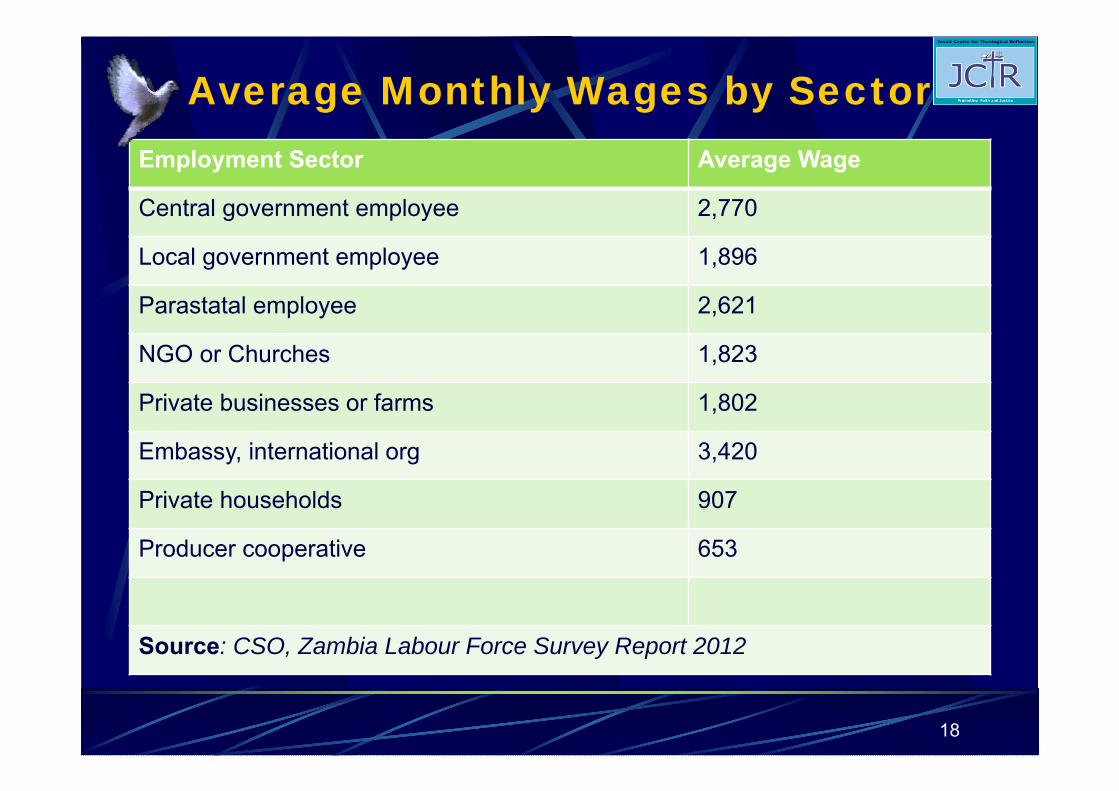
Average Monthly Wages by SectorEmployment Sector Average Wage
Central government employee 2,770
Local government employee 1,896
Parastatal employee 2,621
NGO or Churches 1,823
Private businesses or farms 1,802
Embassy, international org 3,420
Private households 907
Producer cooperative 653
Source: CSO, Zambia Labour Force Survey Report 2012
18

BNB TRENDS BY RESEARCH TOWN
19
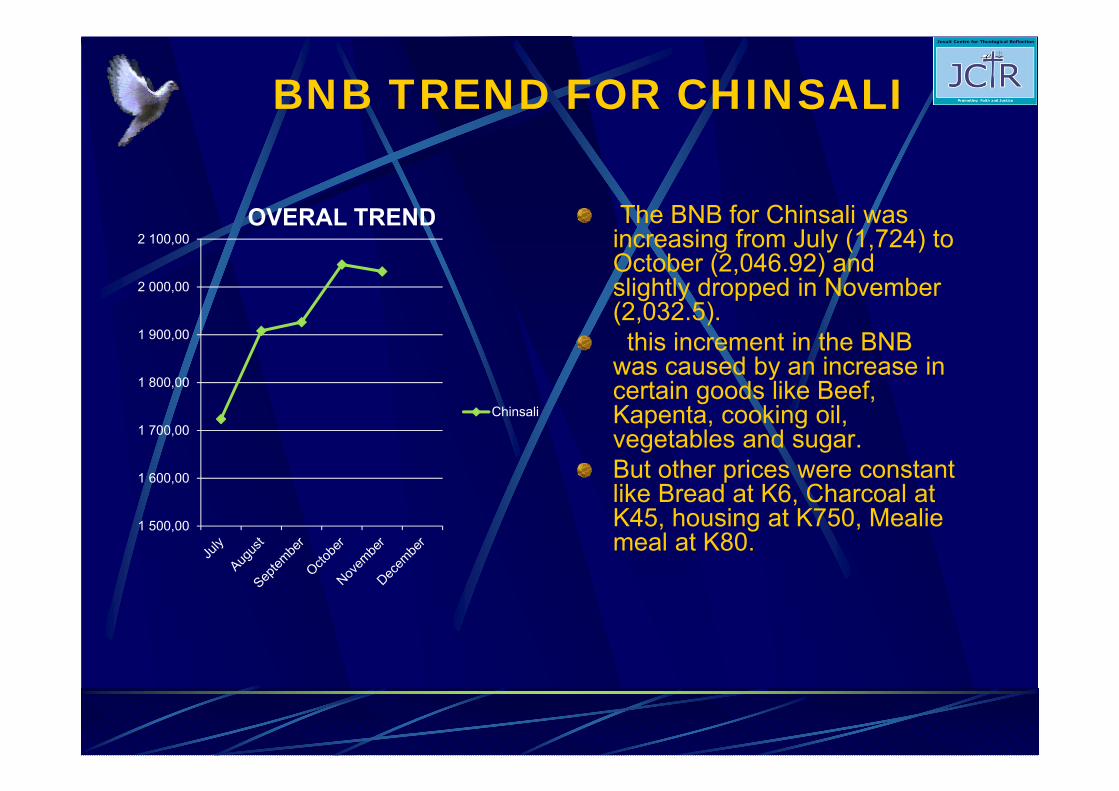
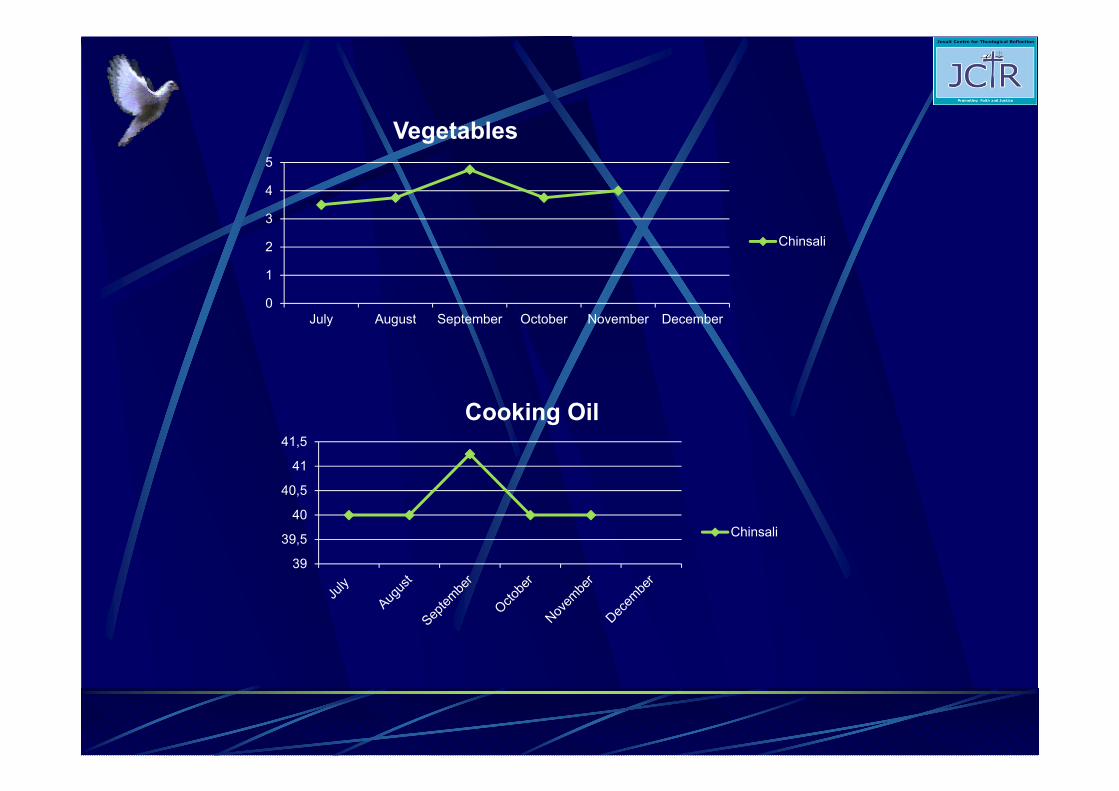
BNB TREND FOR CHINSALI
The BNB for Chinsali was increasing from July (1,724) to October (2,046.92) and slightly dropped in November (2,032.5).this increment in the BNB
was caused by an increase in certain goods like Beef, Kapenta, cooking oil, vegetables and sugar.But other prices were constant like Bread at K6, Charcoal at K45, housing at K750, Mealie meal at K80.
1 500,00
1 600,00
1 700,00
1 800,00
1 900,00
2 000,00
2 100,00OVERAL TREND
Chinsali
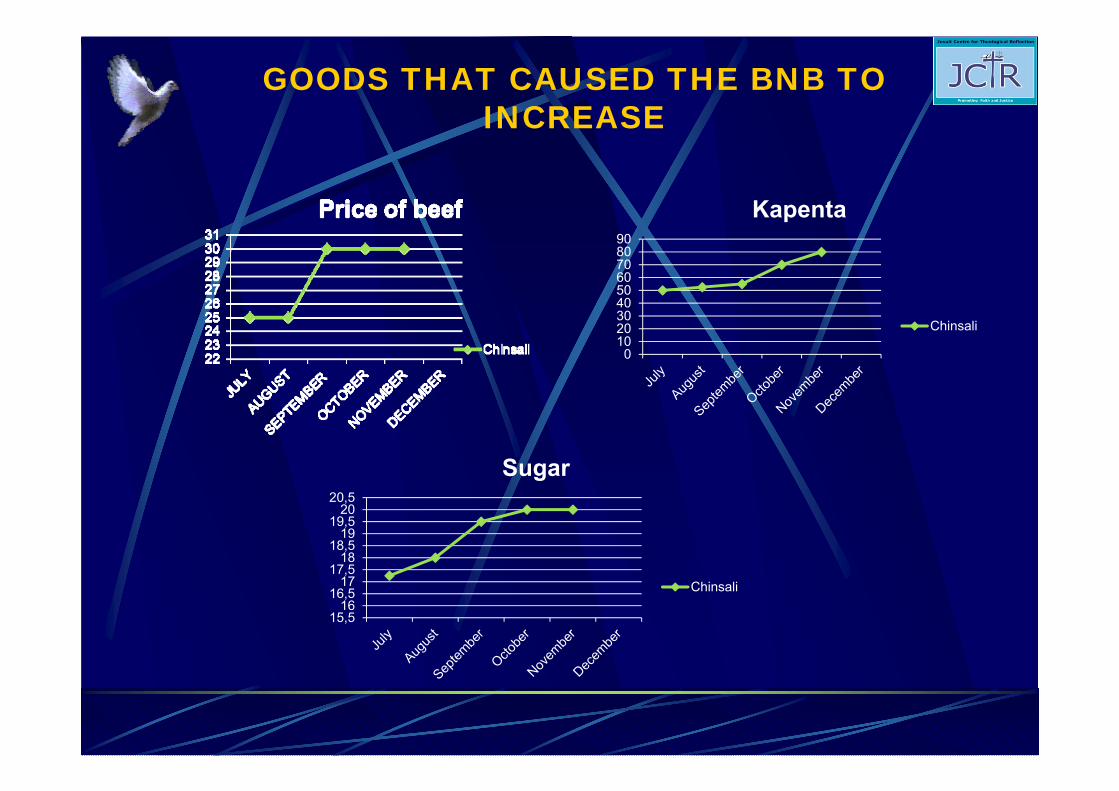
GOODS THAT CAUSED THE BNB TO INCREASE
0102030405060708090
Kapenta
Chinsali
15,516
16,517
17,518
18,519
19,520
20,5
Sugar
Chinsali
0
1
2
3
4
5
July August September October November December
Vegetables
Chinsali
39
39,5
40
40,5
41
41,5
Cooking Oil
Chinsali
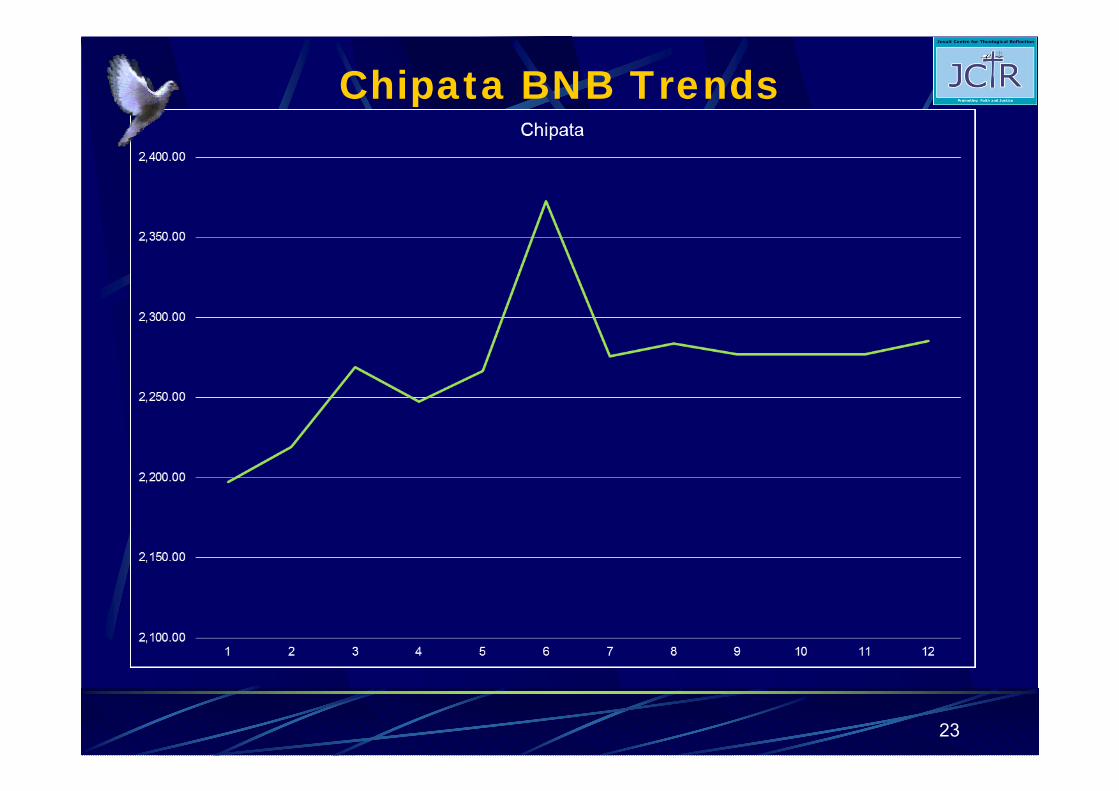
Chipata BNB Trends
23
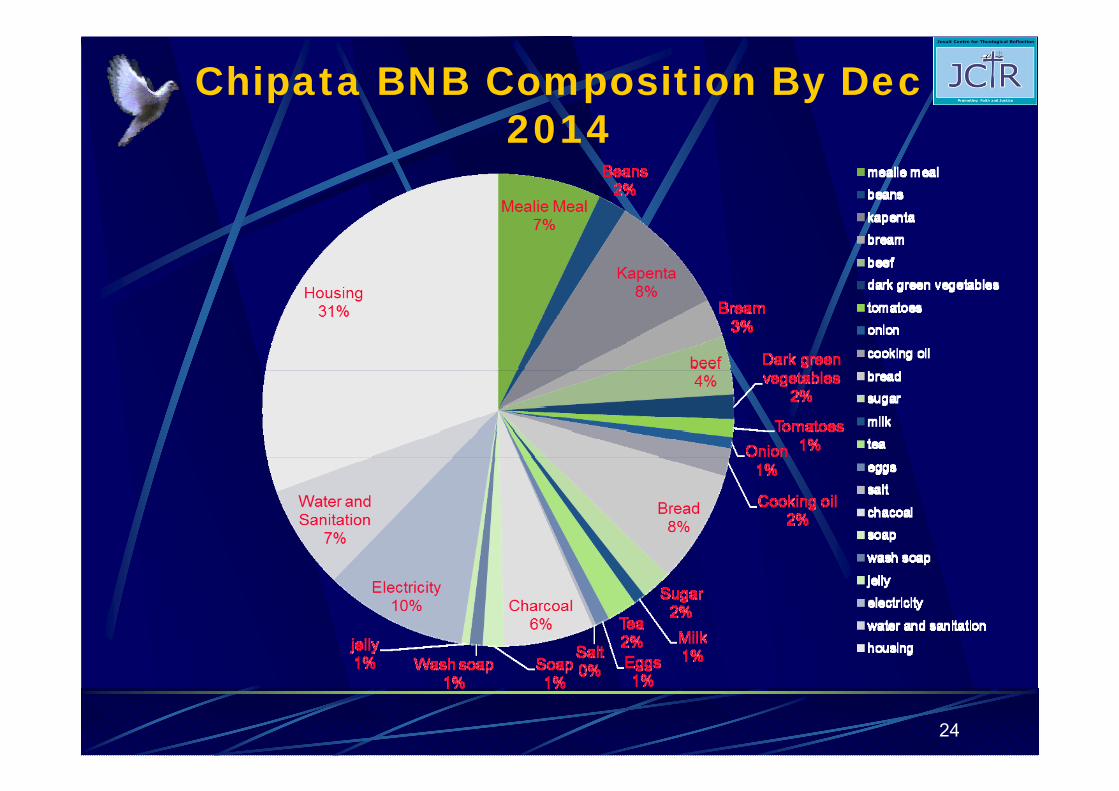
Chipata BNB Composition By Dec 2014
24
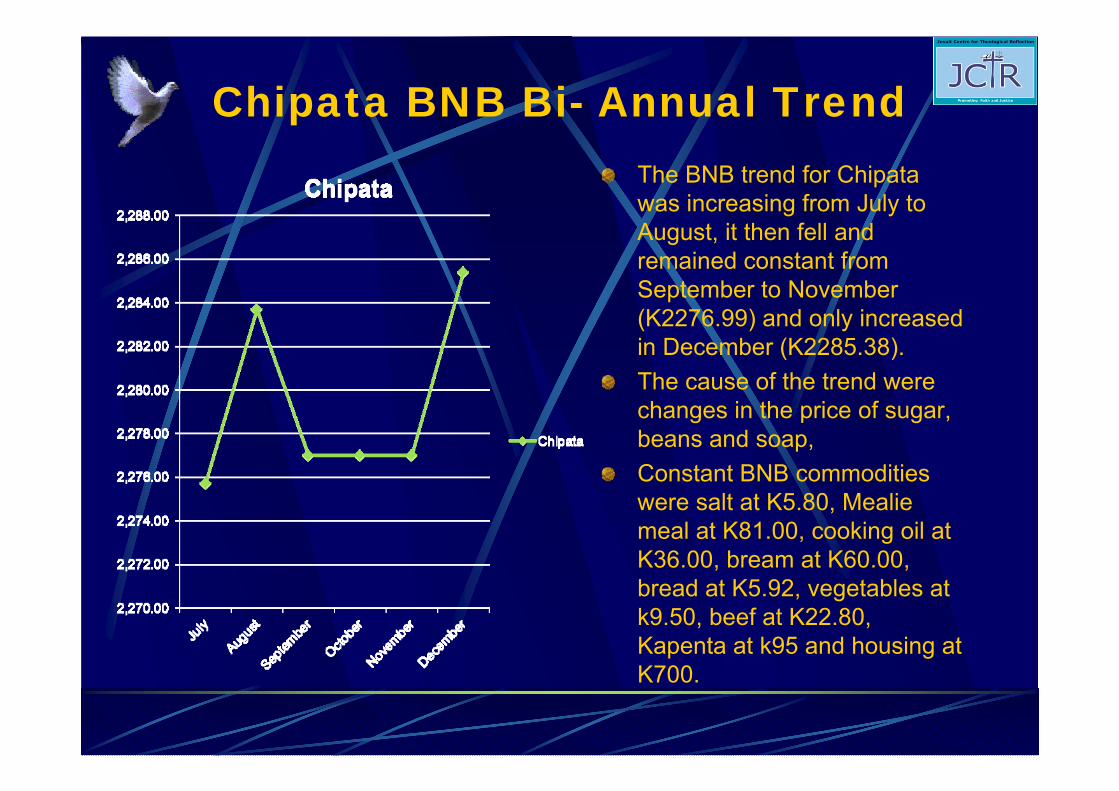
Chipata BNB Bi- Annual Trend The BNB trend for Chipata was increasing from July to August, it then fell and remained constant from September to November (K2276.99) and only increased in December (K2285.38).The cause of the trend were changes in the price of sugar, beans and soap,Constant BNB commodities were salt at K5.80, Mealie meal at K81.00, cooking oil at K36.00, bream at K60.00, bread at K5.92, vegetables at k9.50, beef at K22.80, Kapenta at k95 and housing at K700.
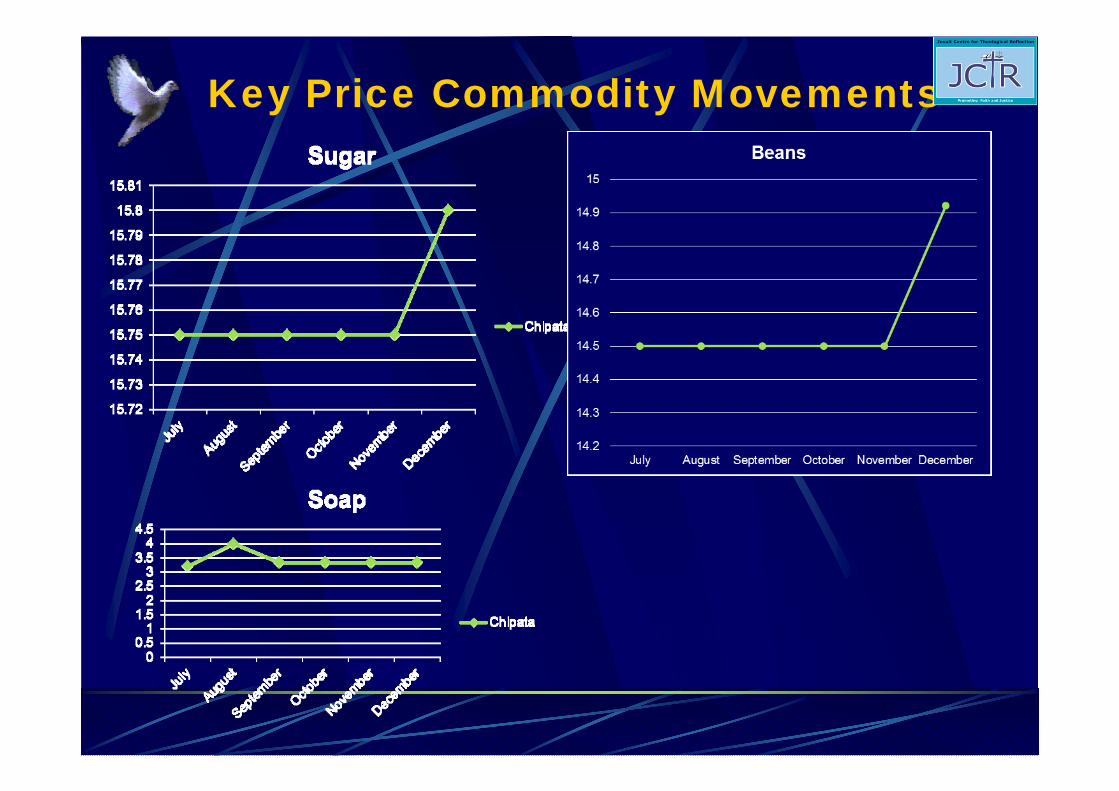
Key Price Commodity Movements
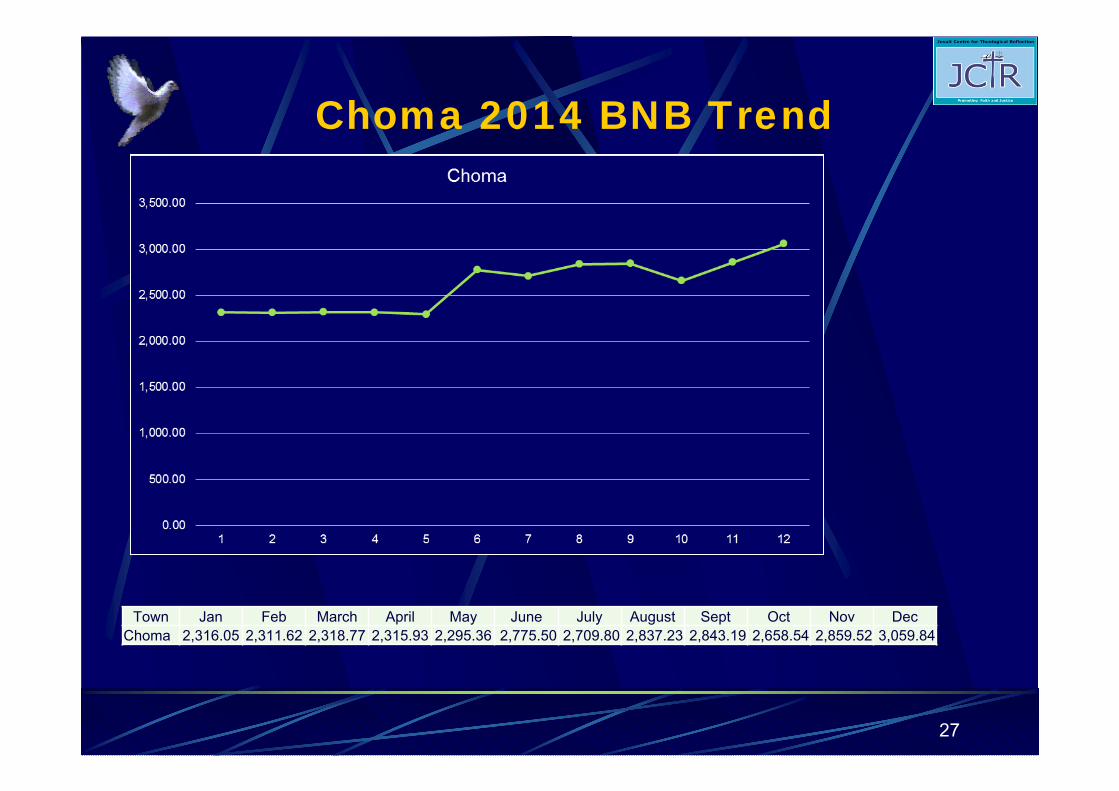
Choma 2014 BNB Trend
27
Town Jan Feb March April May June July August Sept Oct Nov DecChoma 2,316.05 2,311.62 2,318.77 2,315.93 2,295.36 2,775.50 2,709.80 2,837.23 2,843.19 2,658.54 2,859.52 3,059.84
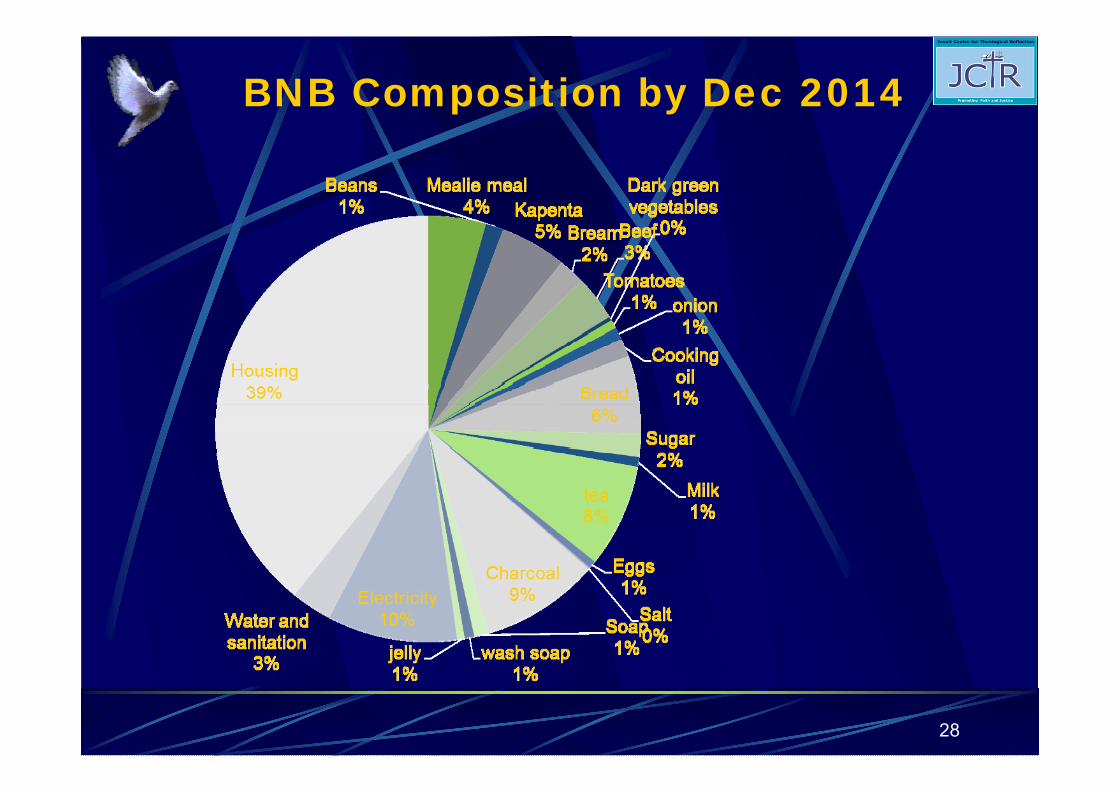
BNB Composition by Dec 2014
28
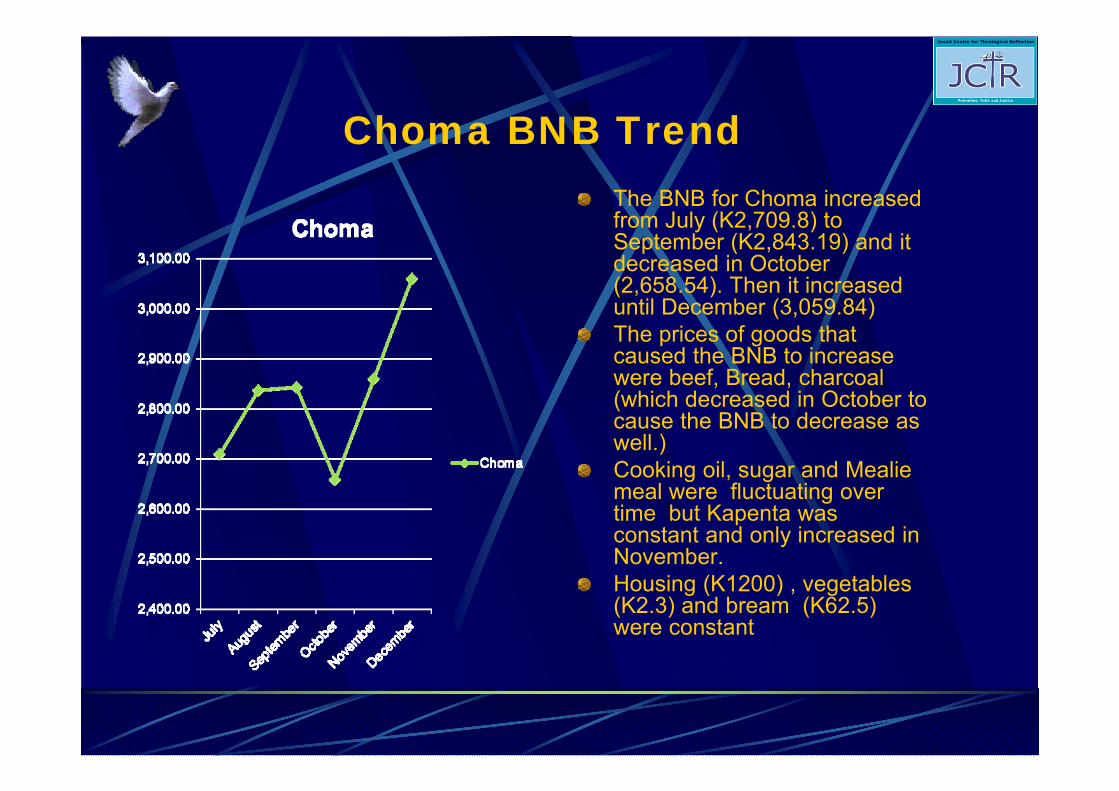
Choma BNB TrendThe BNB for Choma increased from July (K2,709.8) to September (K2,843.19) and it decreased in October (2,658.54). Then it increased until December (3,059.84)The prices of goods that caused the BNB to increase were beef, Bread, charcoal (which decreased in October to cause the BNB to decrease as well.) Cooking oil, sugar and Mealie meal were fluctuating over time but Kapenta was constant and only increased in November. Housing (K1200) , vegetables (K2.3) and bream (K62.5) were constant
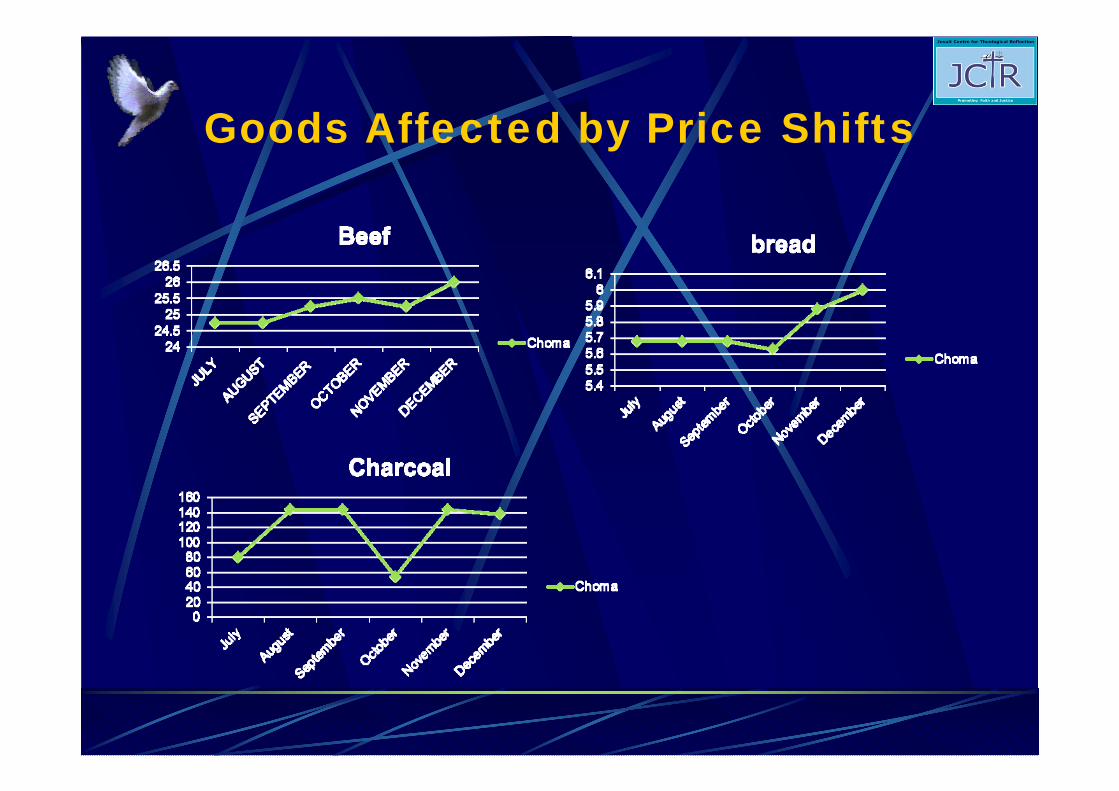
Goods Affected by Price Shifts
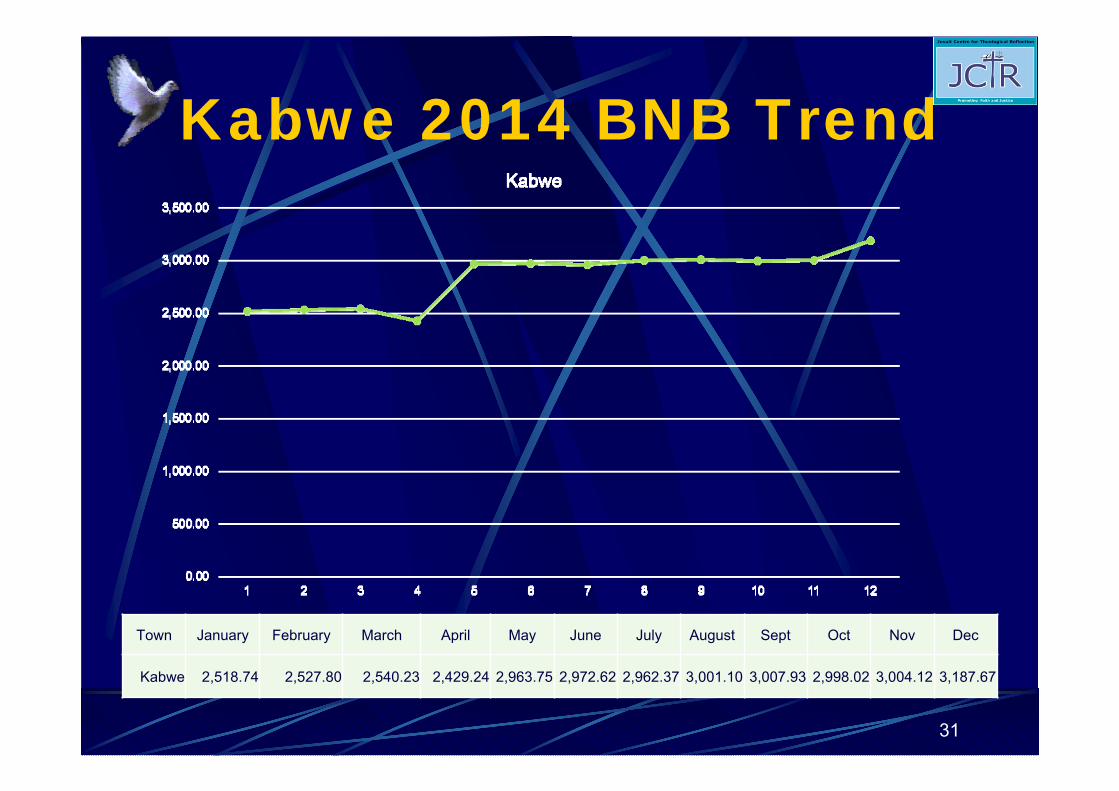
Kabwe 2014 BNB Trend
31
Town January February March April May June July August Sept Oct Nov Dec
Kabwe 2,518.74 2,527.80 2,540.23 2,429.24 2,963.75 2,972.62 2,962.37 3,001.10 3,007.93 2,998.02 3,004.12 3,187.67
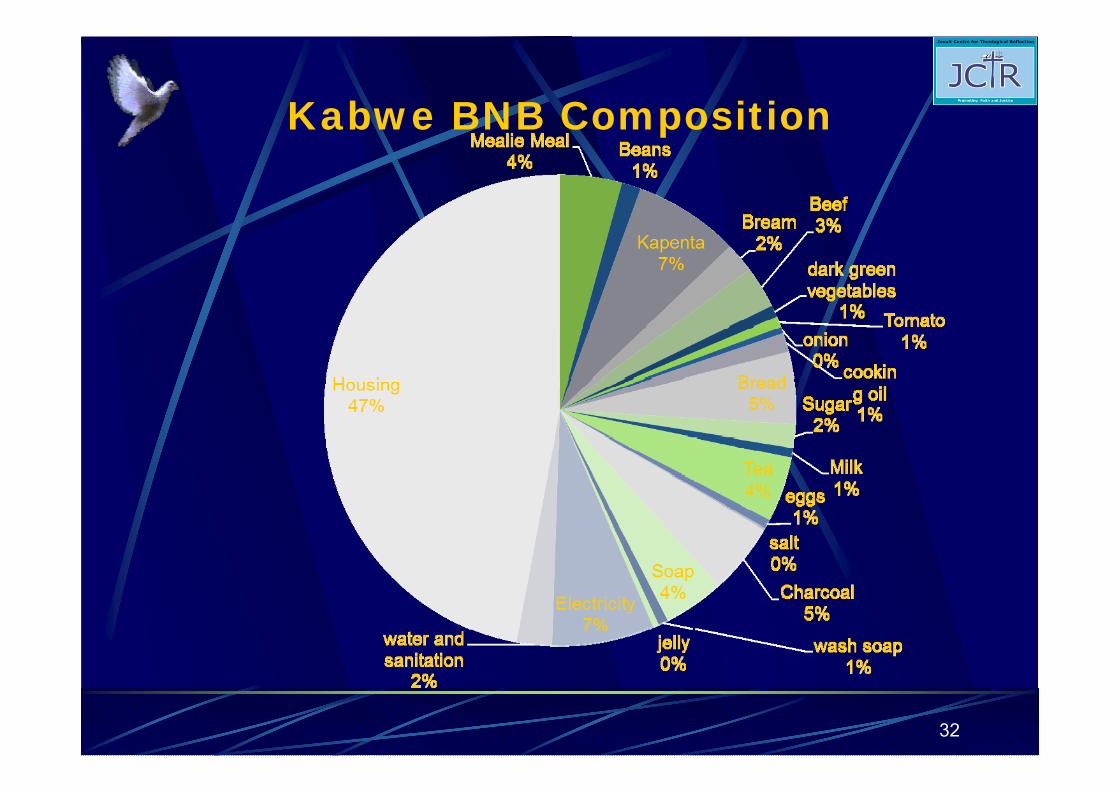
Kabwe BNB Composition
32
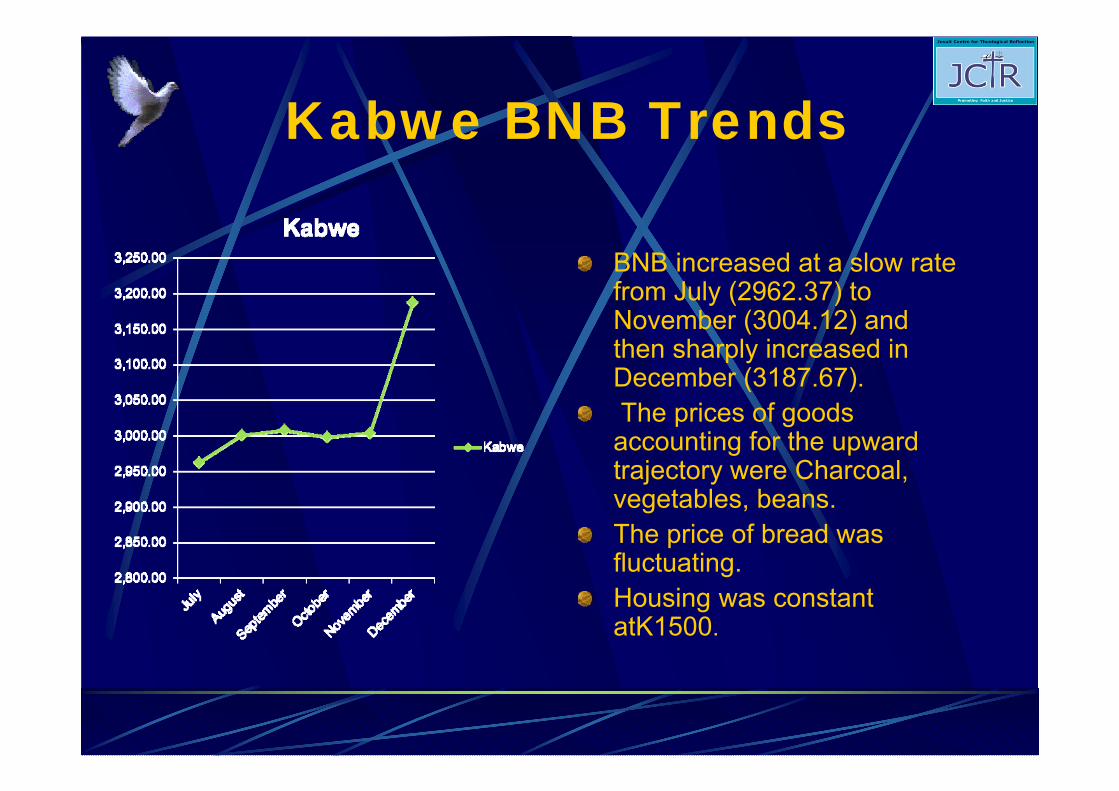
Kabwe BNB Trends
BNB increased at a slow rate from July (2962.37) to November (3004.12) and then sharply increased in December (3187.67).The prices of goods accounting for the upward trajectory were Charcoal, vegetables, beans. The price of bread was fluctuating. Housing was constant atK1500.
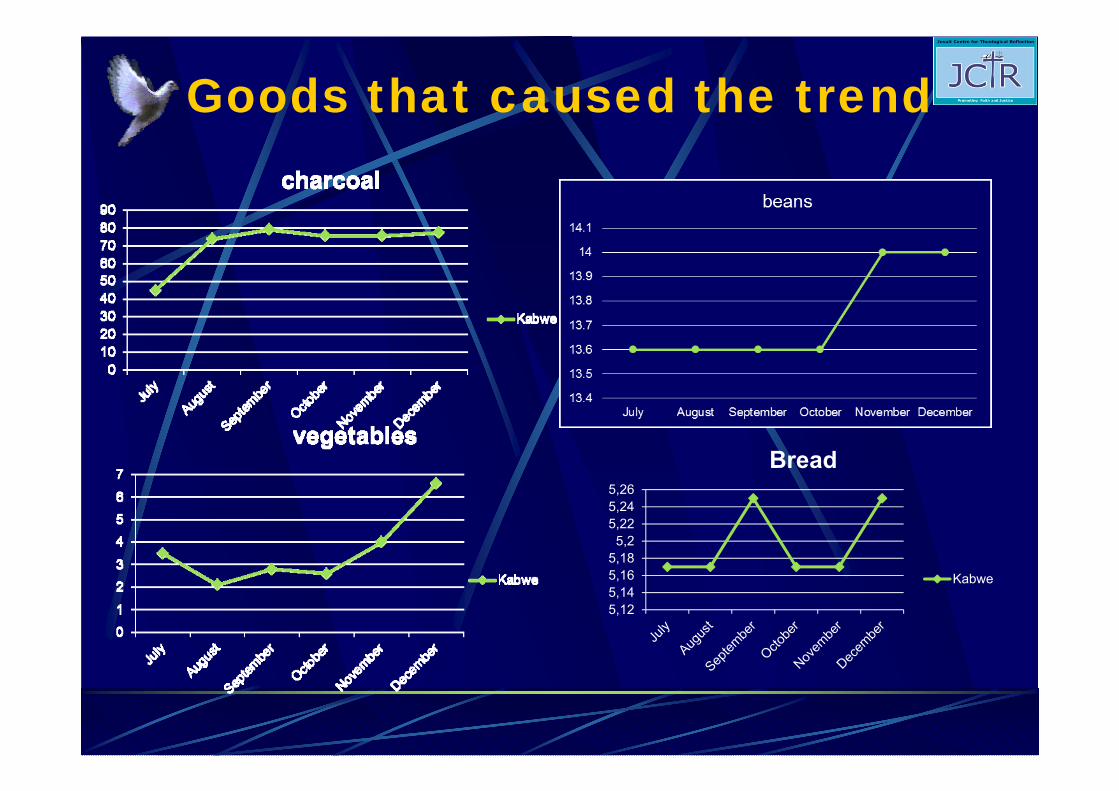
Goods that caused the trend
5,125,145,165,18
5,25,225,245,26
Bread
Kabwe
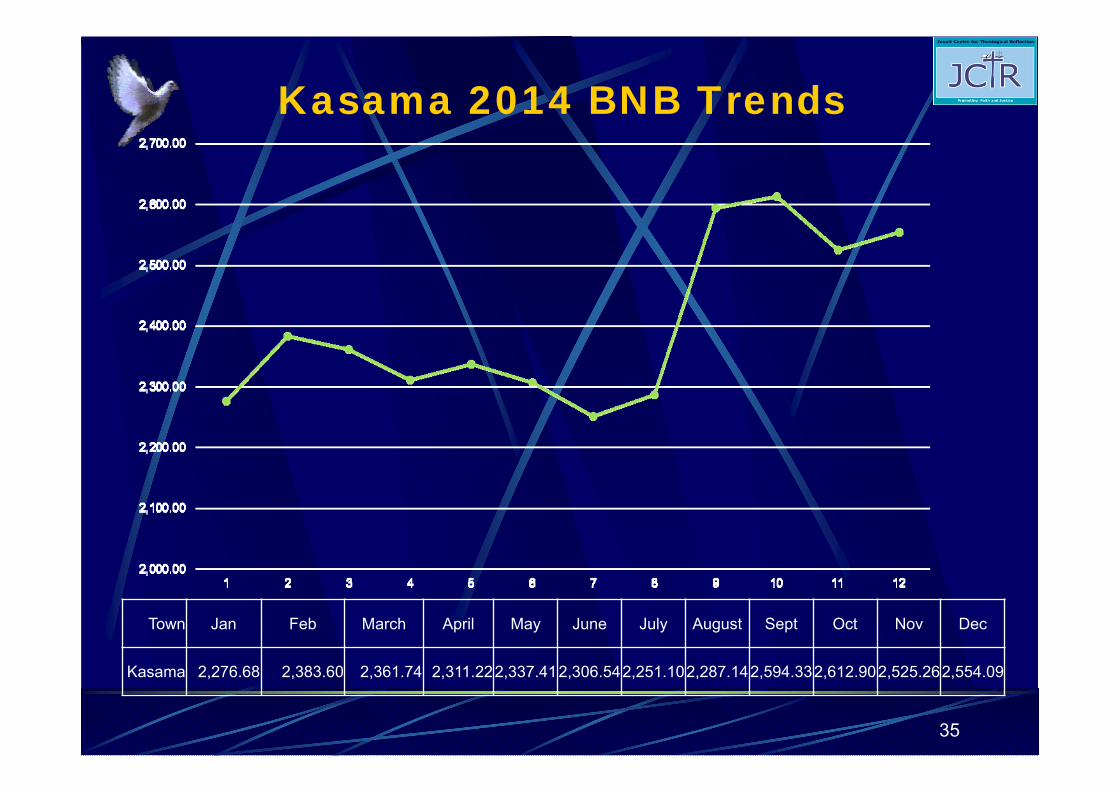
Kasama 2014 BNB Trends
35
Town Jan Feb March April May June July August Sept Oct Nov Dec
Kasama 2,276.68 2,383.60 2,361.74 2,311.222,337.412,306.542,251.102,287.142,594.332,612.902,525.262,554.09

Kasama BNB Composition
36
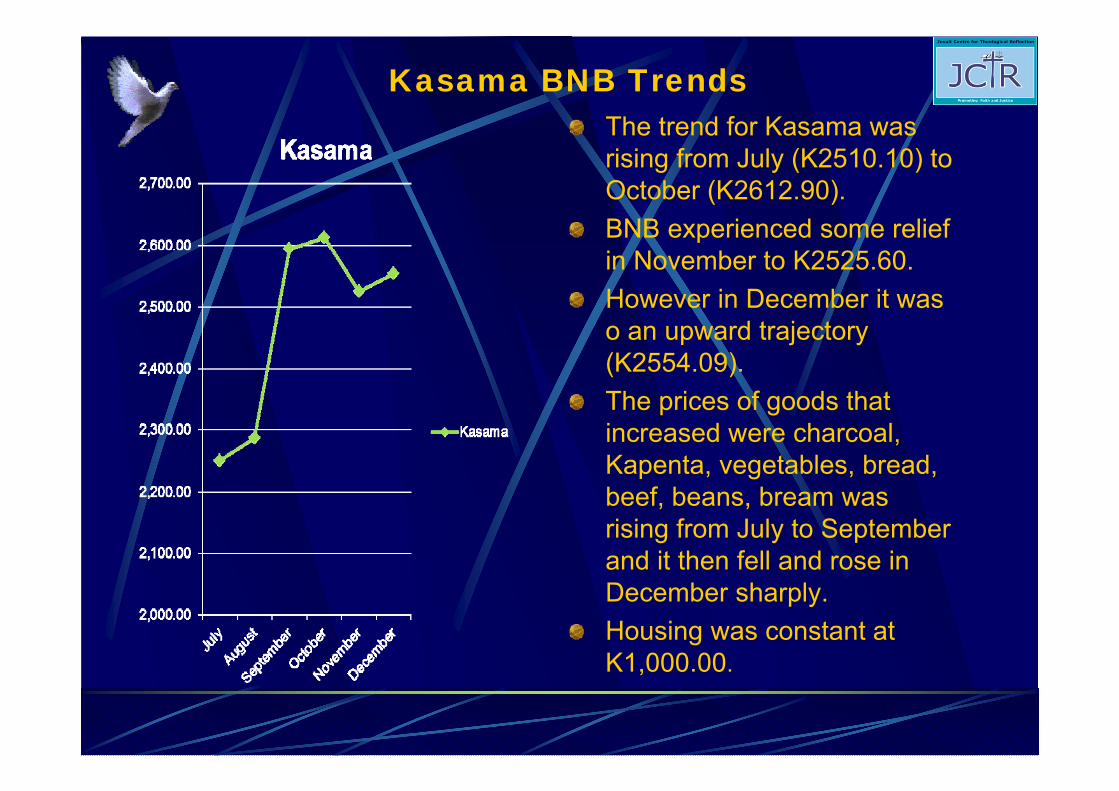
Kasama BNB TrendsThe trend for Kasama was rising from July (K2510.10) to October (K2612.90). BNB experienced some relief in November to K2525.60.However in December it was o an upward trajectory (K2554.09).The prices of goods that increased were charcoal, Kapenta, vegetables, bread, beef, beans, bream was rising from July to September and it then fell and rose in December sharply.Housing was constant at K1,000.00.
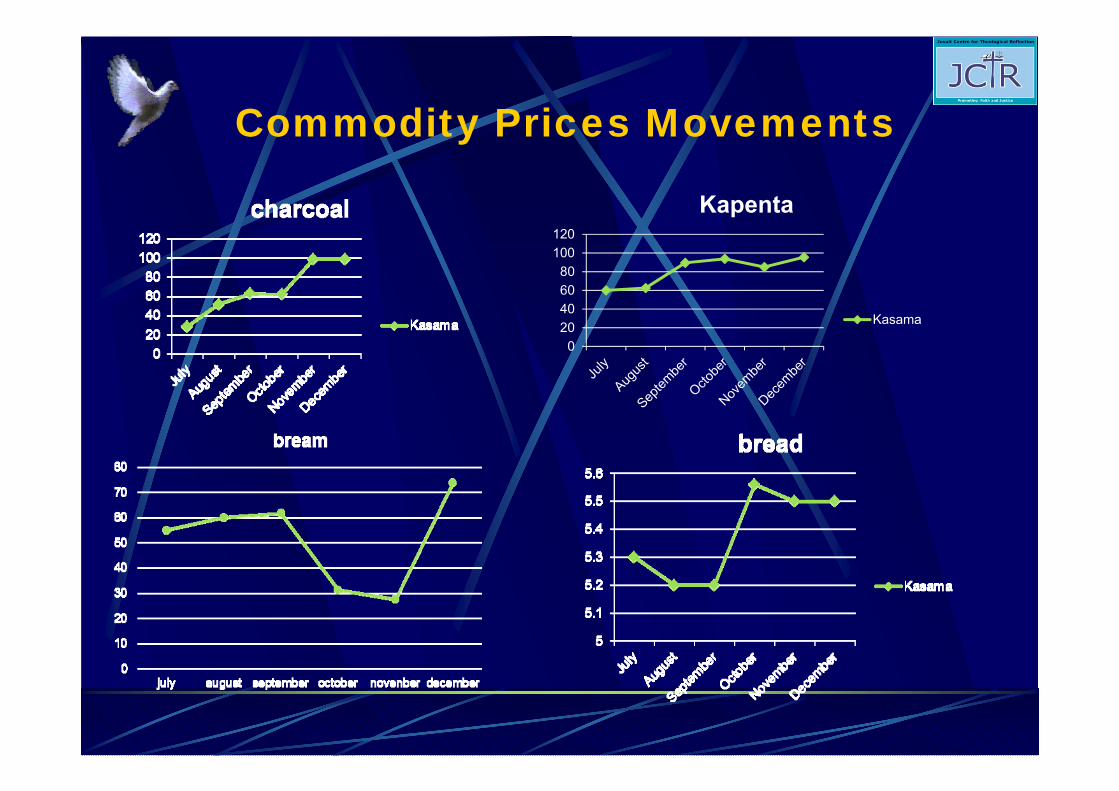
Commodity Prices Movements
020406080
100120
Kapenta
Kasama
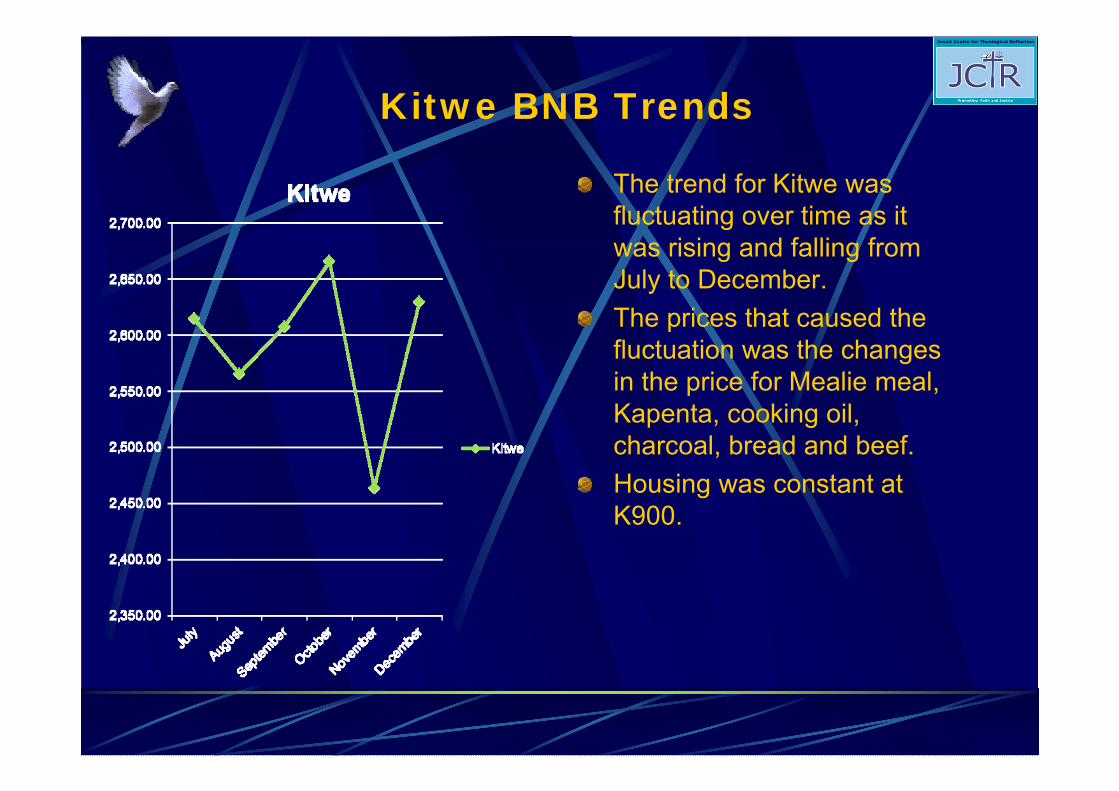
Kitwe BNB Trends
The trend for Kitwe was fluctuating over time as it was rising and falling from July to December.The prices that caused the fluctuation was the changes in the price for Mealie meal, Kapenta, cooking oil, charcoal, bread and beef.Housing was constant at K900.
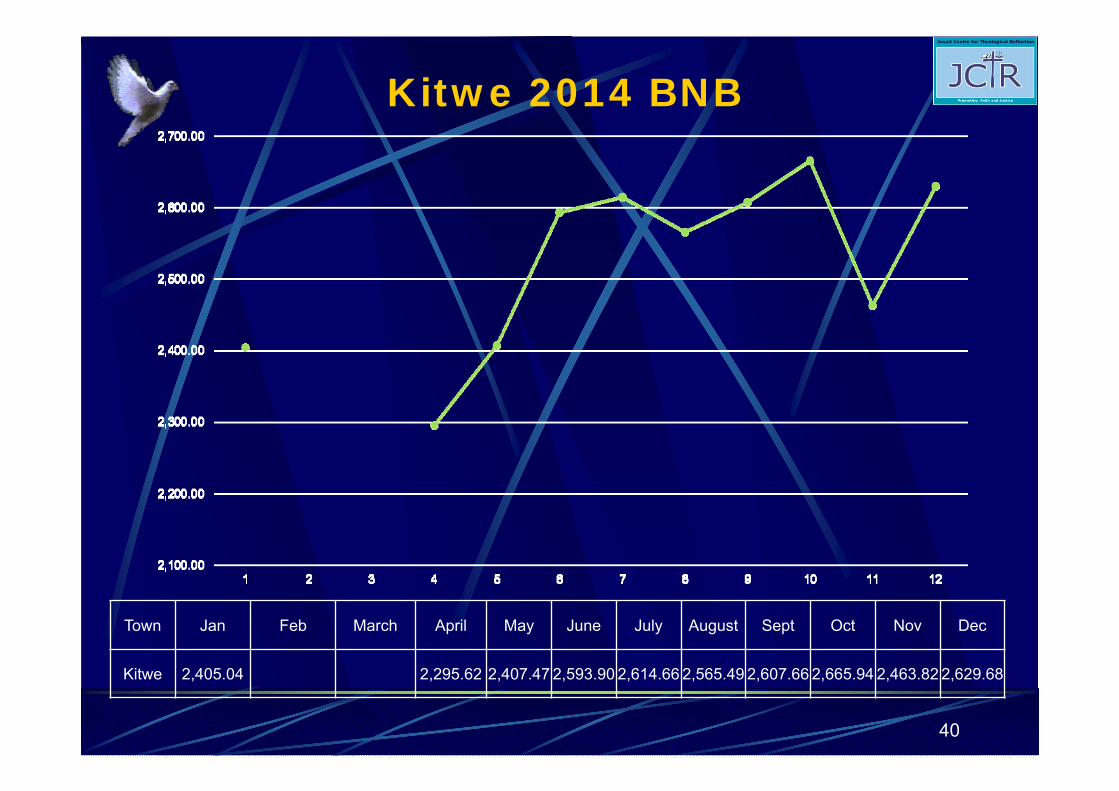
Kitwe 2014 BNB
40
Town Jan Feb March April May June July August Sept Oct Nov Dec
Kitwe 2,405.04 2,295.62 2,407.47 2,593.90 2,614.66 2,565.49 2,607.66 2,665.94 2,463.82 2,629.68
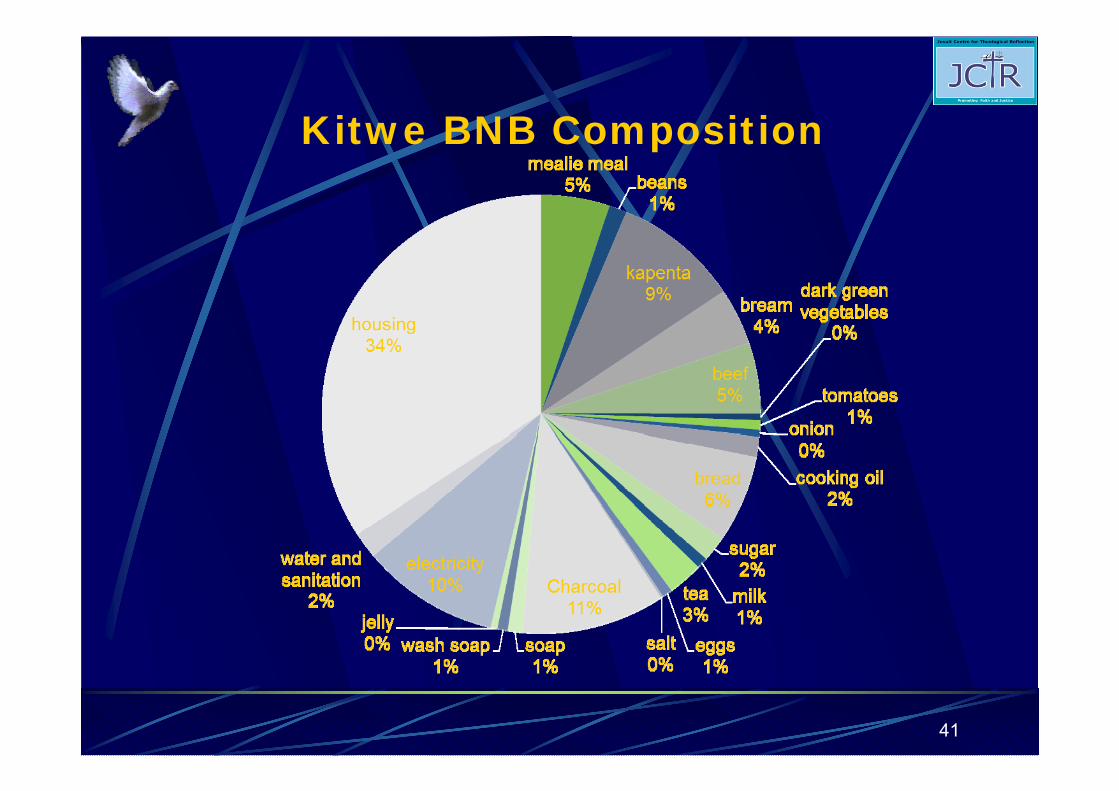
Kitwe BNB Composition
41
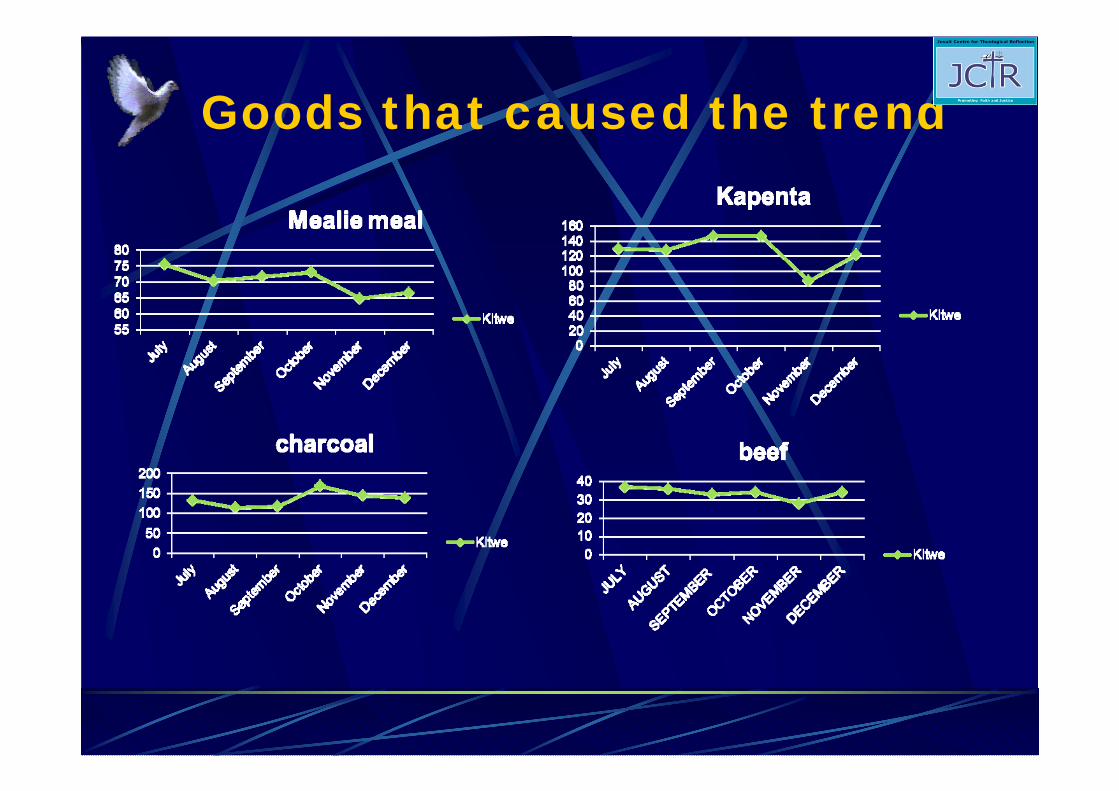
Goods that caused the trend
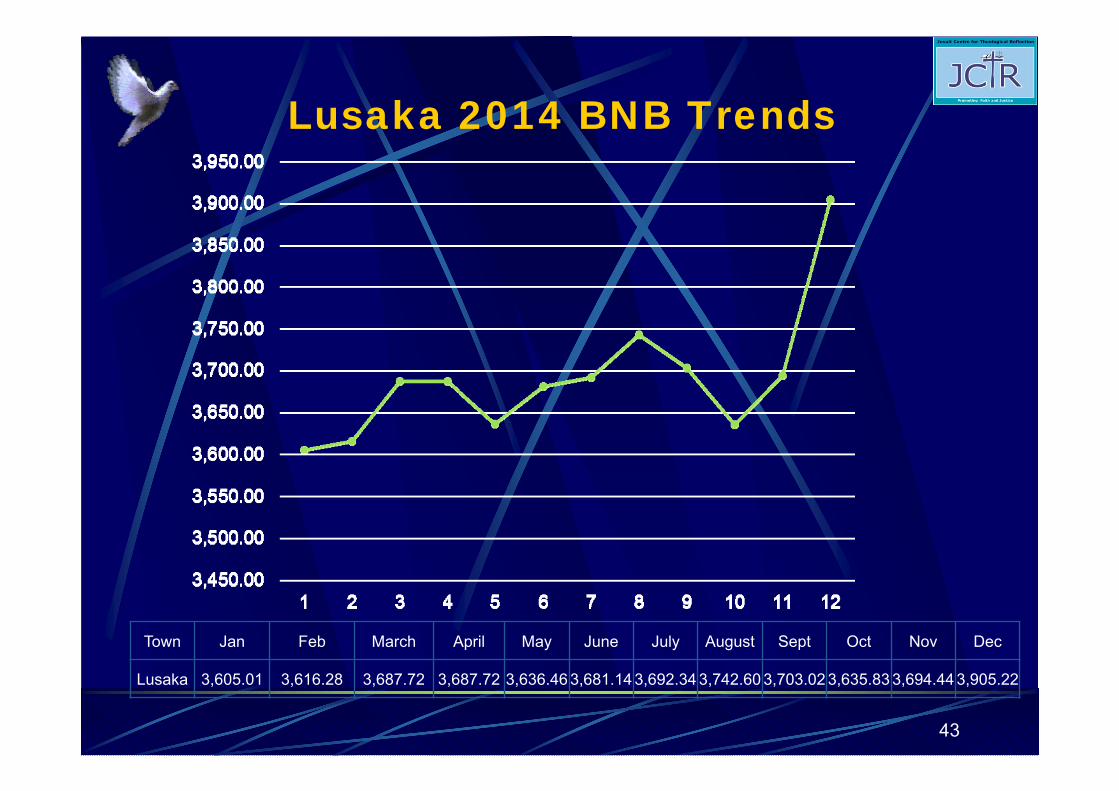
Lusaka 2014 BNB Trends
43
Town Jan Feb March April May June July August Sept Oct Nov Dec
Lusaka 3,605.01 3,616.28 3,687.72 3,687.72 3,636.46 3,681.14 3,692.34 3,742.60 3,703.02 3,635.83 3,694.44 3,905.22
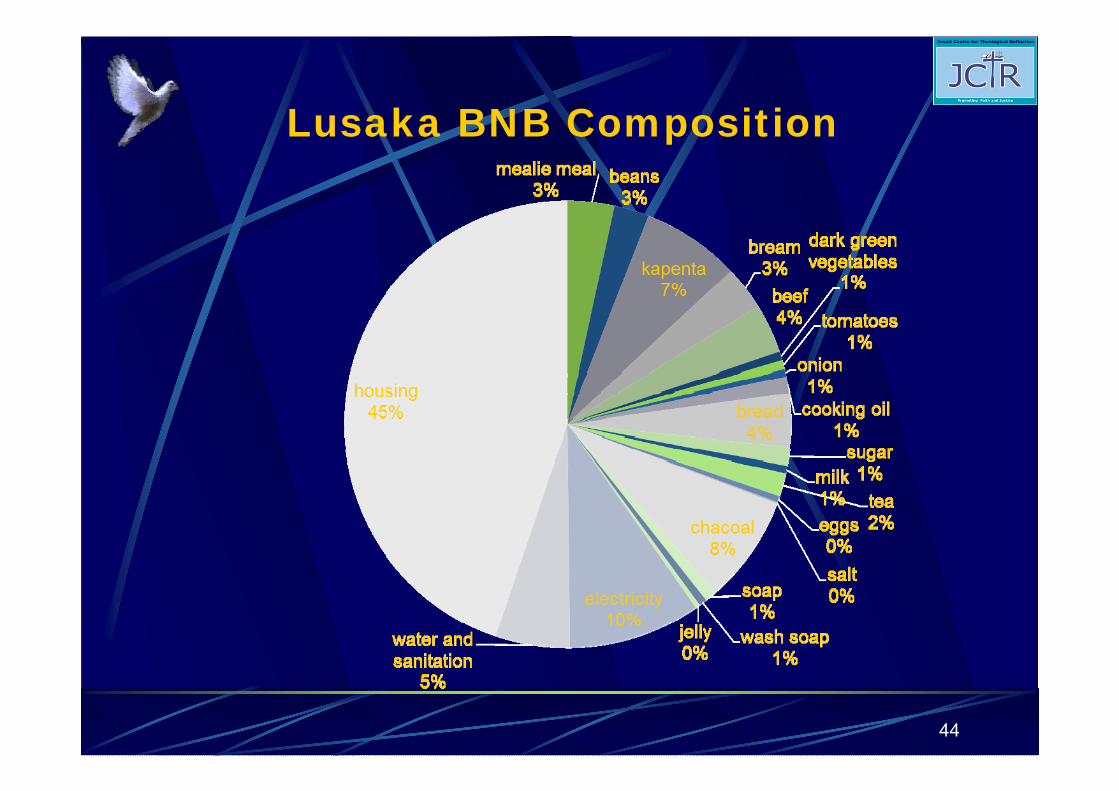
Lusaka BNB Composition
44
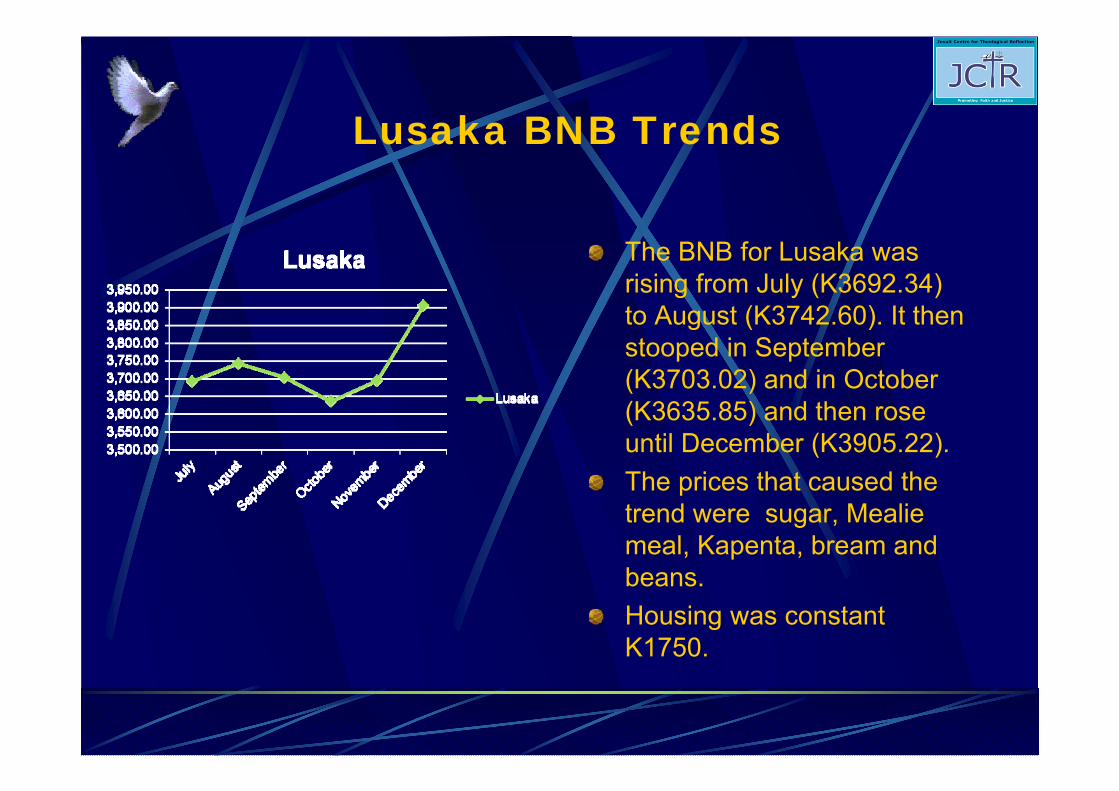
Lusaka BNB Trends
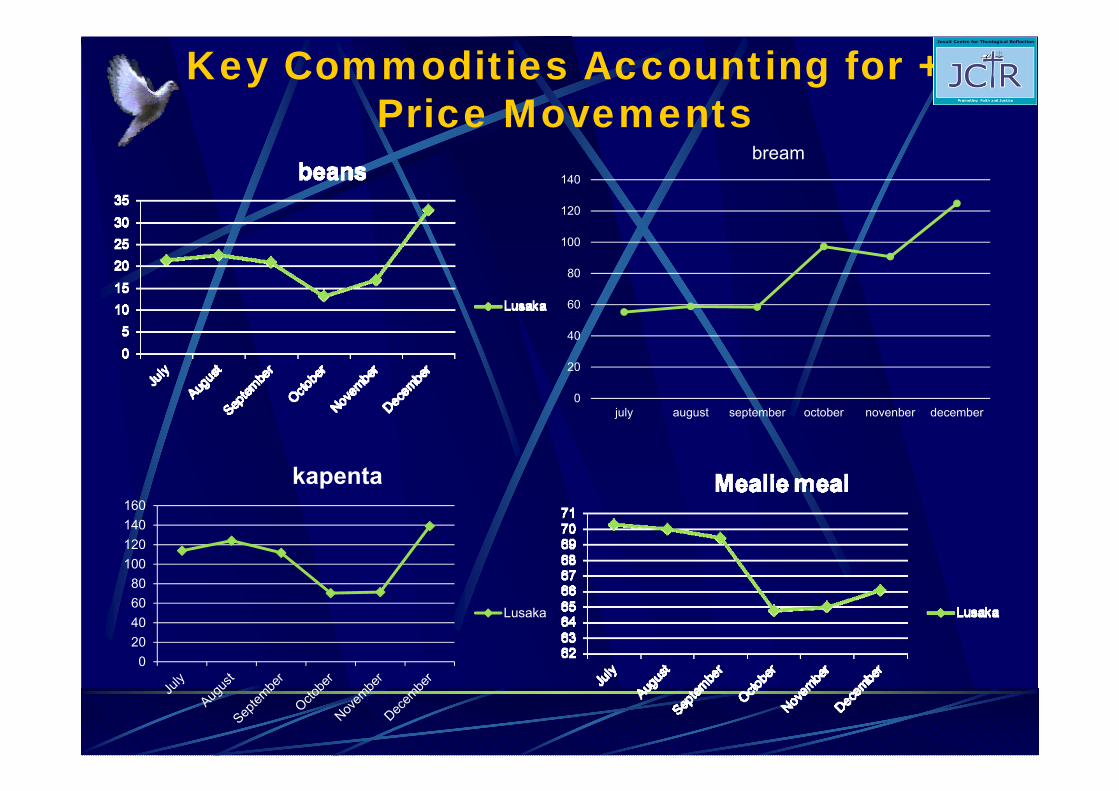
The BNB for Lusaka was rising from July (K3692.34) to August (K3742.60). It then stooped in September (K3703.02) and in October (K3635.85) and then rose until December (K3905.22). The prices that caused the trend were sugar, Mealie meal, Kapenta, bream and beans.Housing was constant K1750.
0
20
40
60
80
100
120
140
july august september october novenber december
bream
020406080
100120140160
kapenta
Lusaka
Key Commodities Accounting for + Price Movements
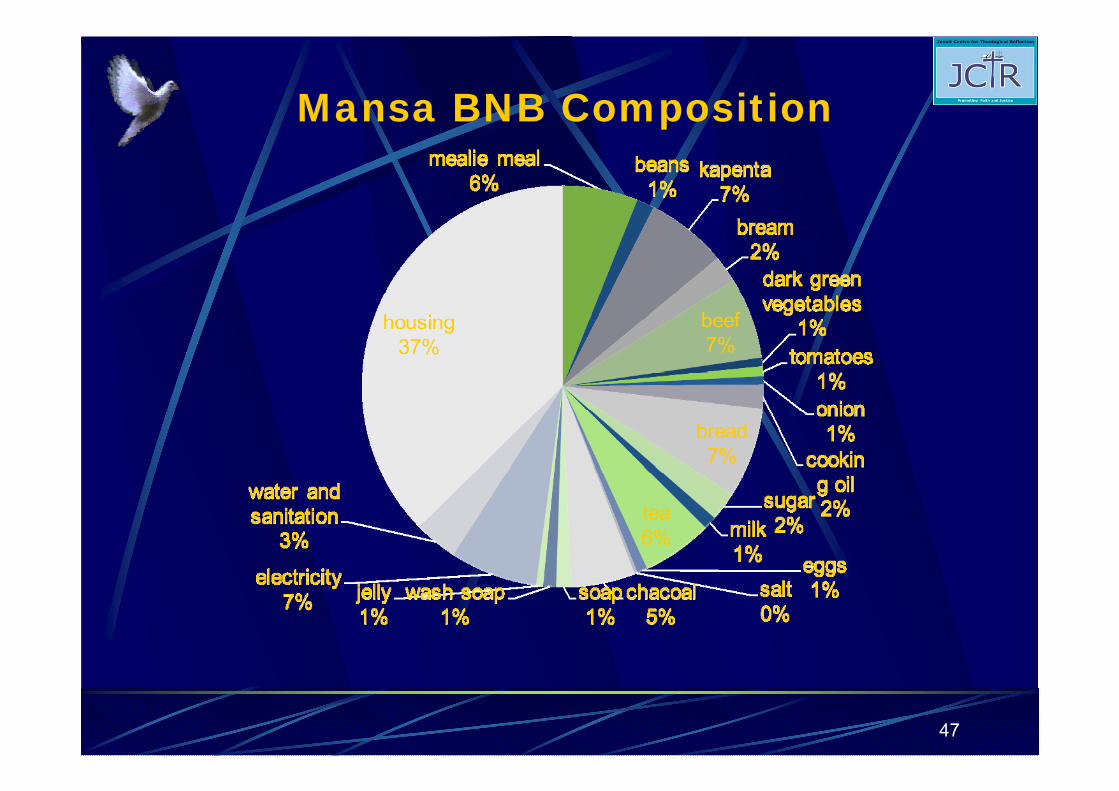
Mansa BNB Composition
47
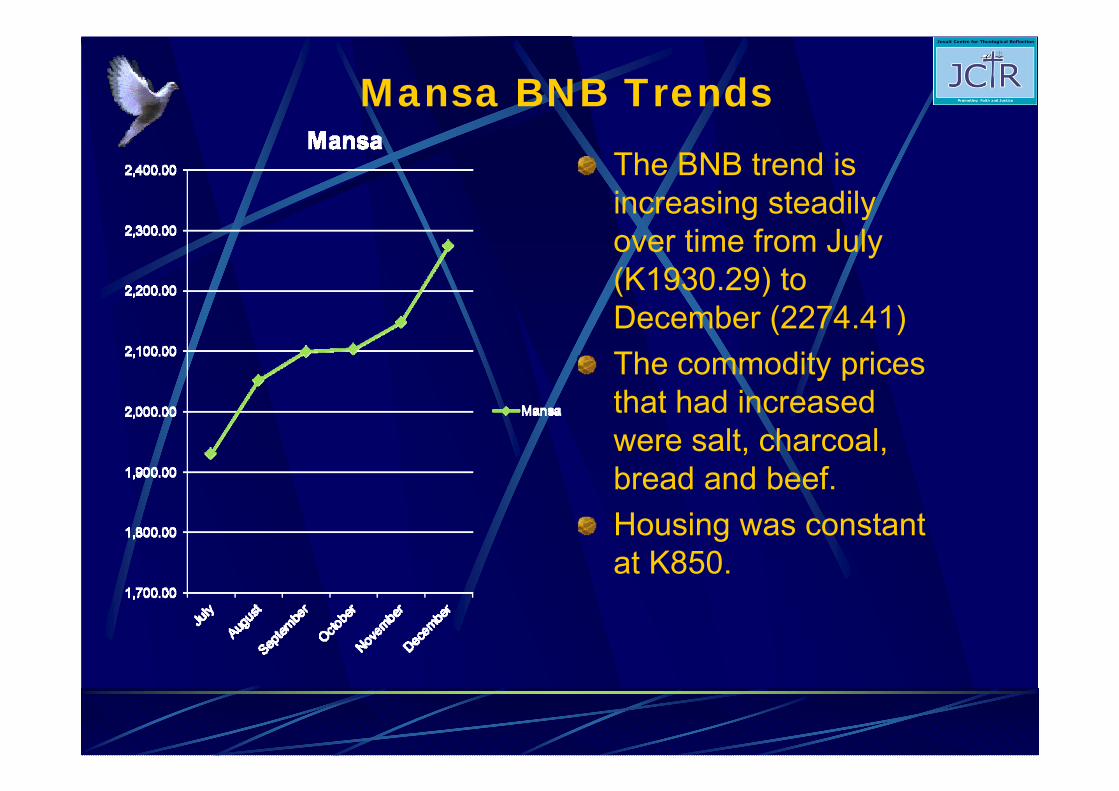
Mansa BNB TrendsThe BNB trend is increasing steadily over time from July (K1930.29) to December (2274.41) The commodity prices that had increased were salt, charcoal, bread and beef.Housing was constant at K850.
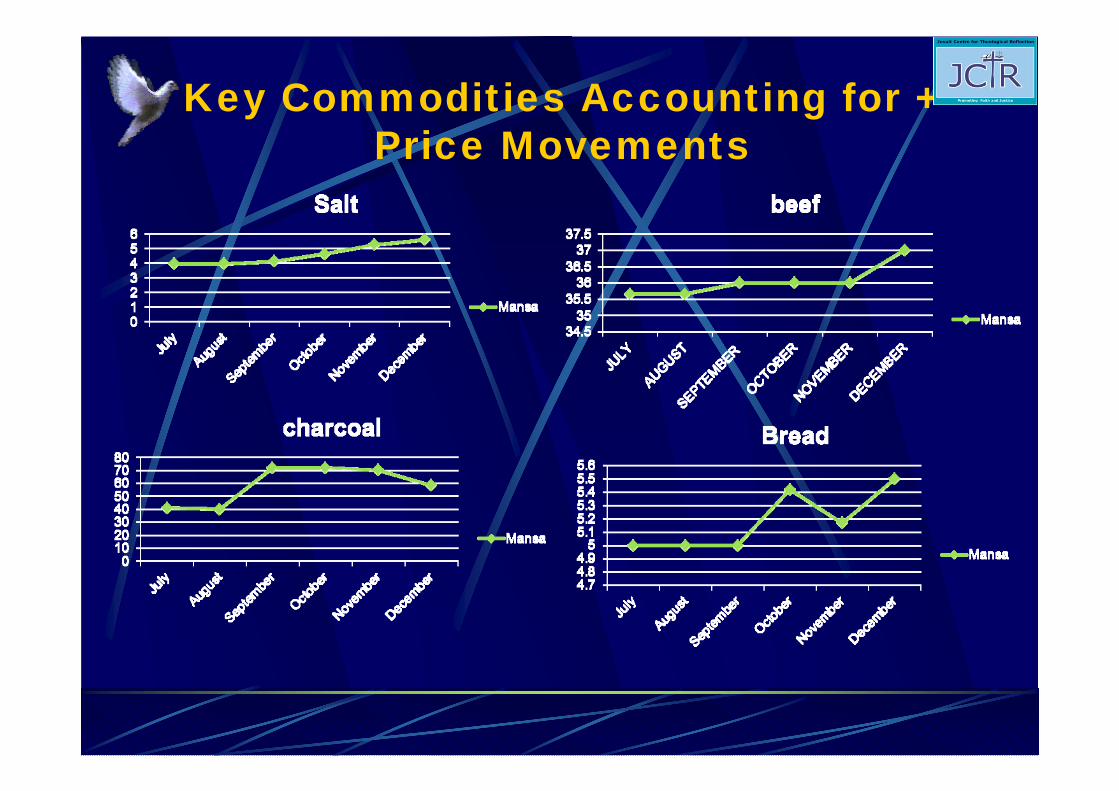
Key Commodities Accounting for + Price Movements
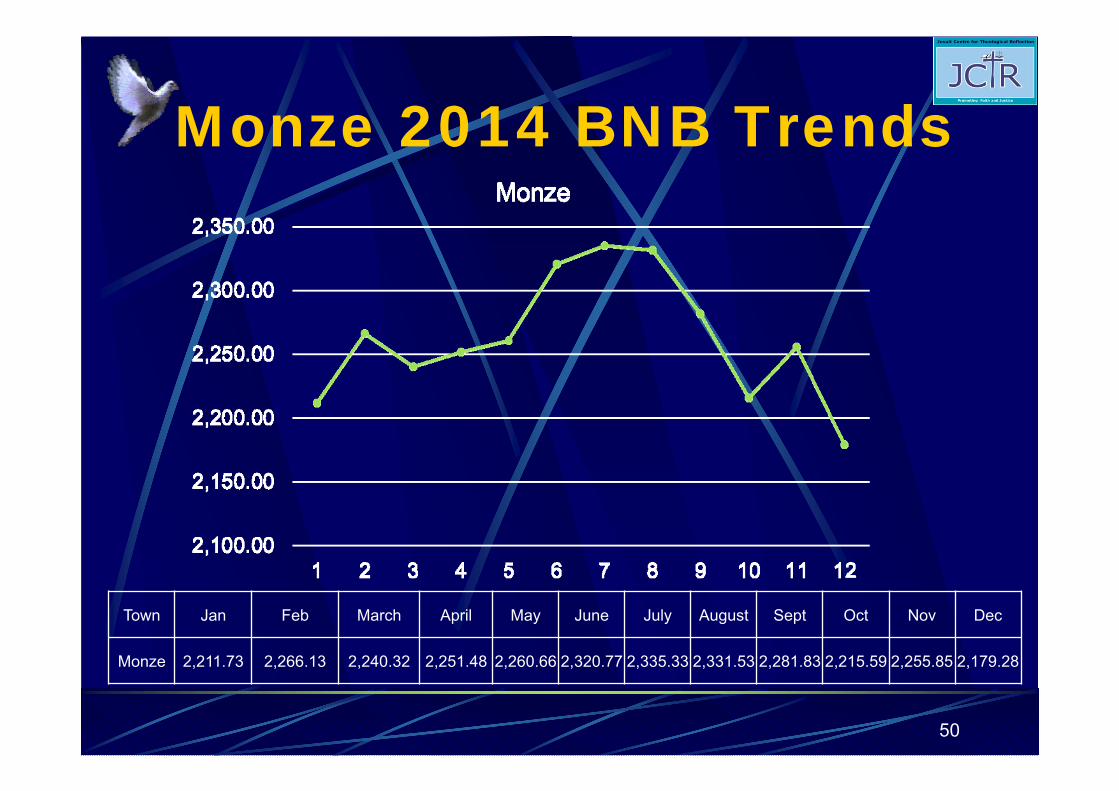
Monze 2014 BNB Trends
50
Town Jan Feb March April May June July August Sept Oct Nov Dec
Monze 2,211.73 2,266.13 2,240.32 2,251.48 2,260.66 2,320.77 2,335.33 2,331.53 2,281.83 2,215.59 2,255.85 2,179.28
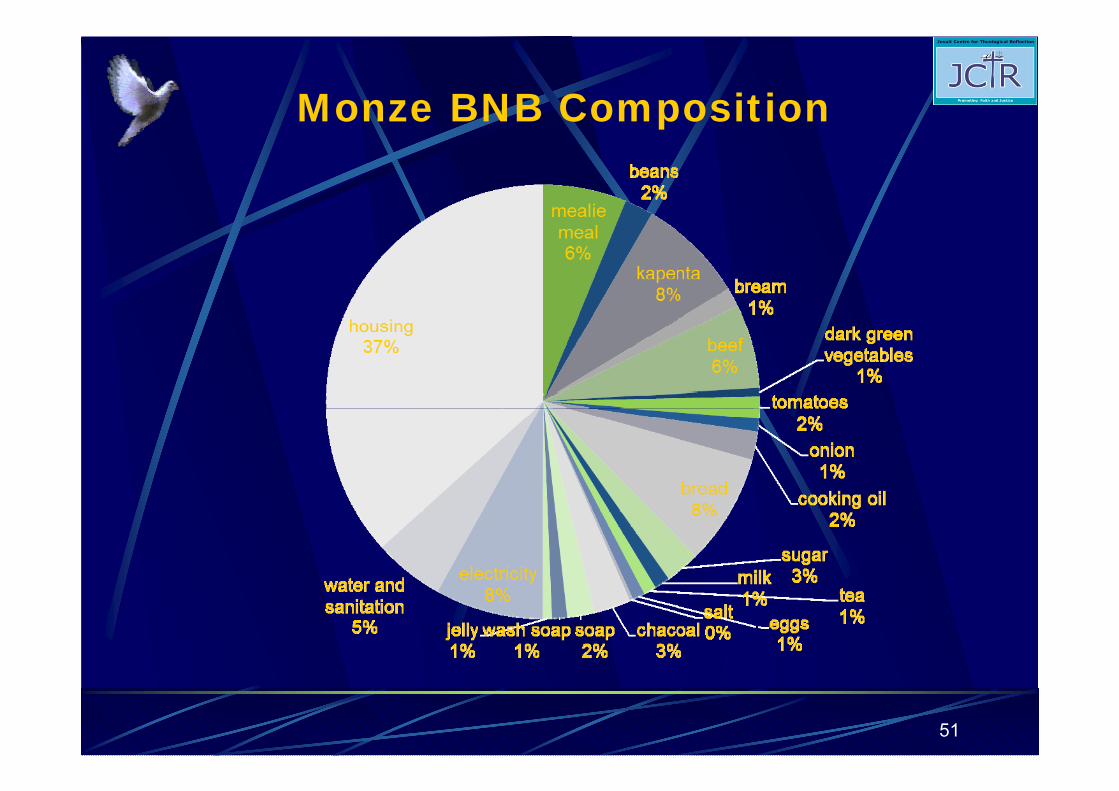
Monze BNB Composition
51
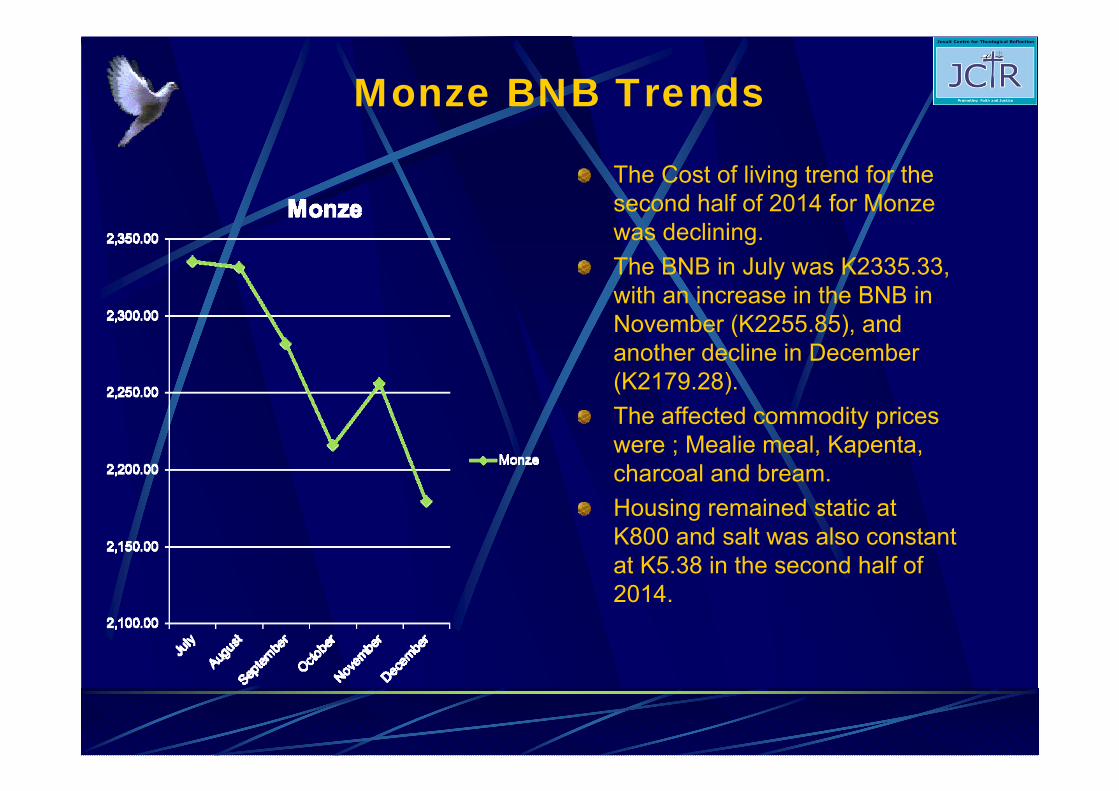
Monze BNB Trends
The Cost of living trend for the second half of 2014 for Monze was declining. The BNB in July was K2335.33, with an increase in the BNB in November (K2255.85), and another decline in December (K2179.28).The affected commodity prices were ; Mealie meal, Kapenta, charcoal and bream.Housing remained static at K800 and salt was also constant at K5.38 in the second half of 2014.
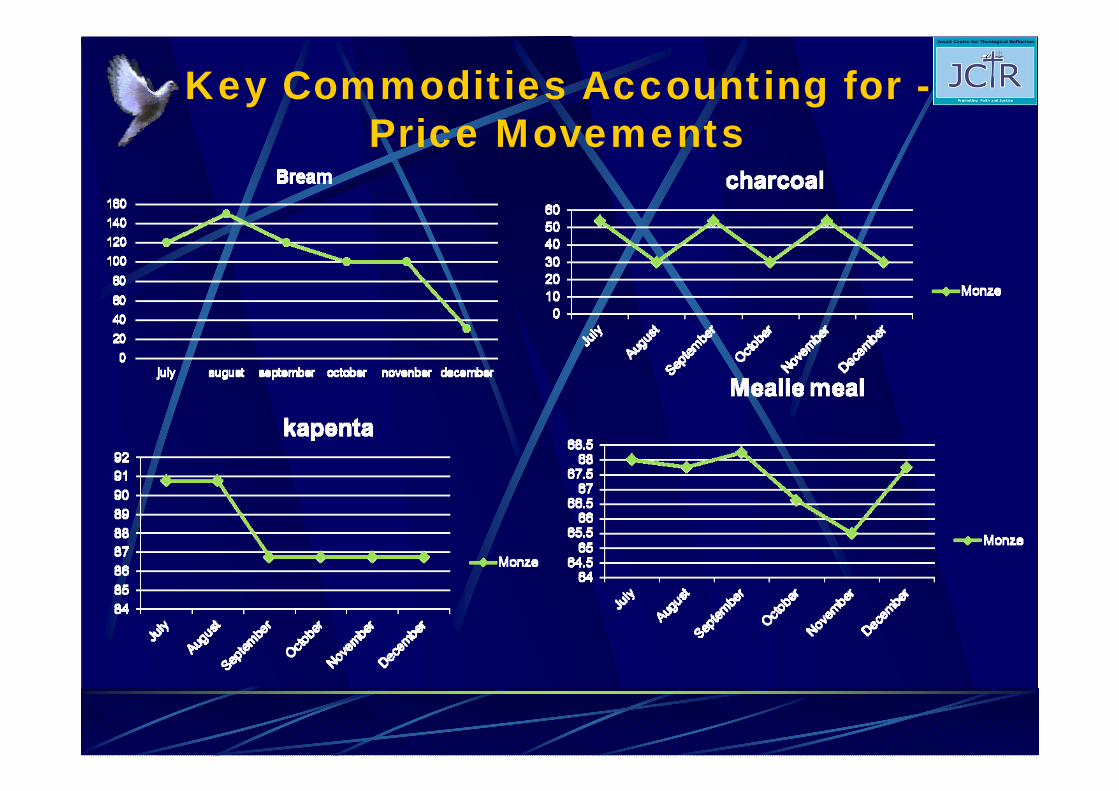
Key Commodities Accounting for -Price Movements
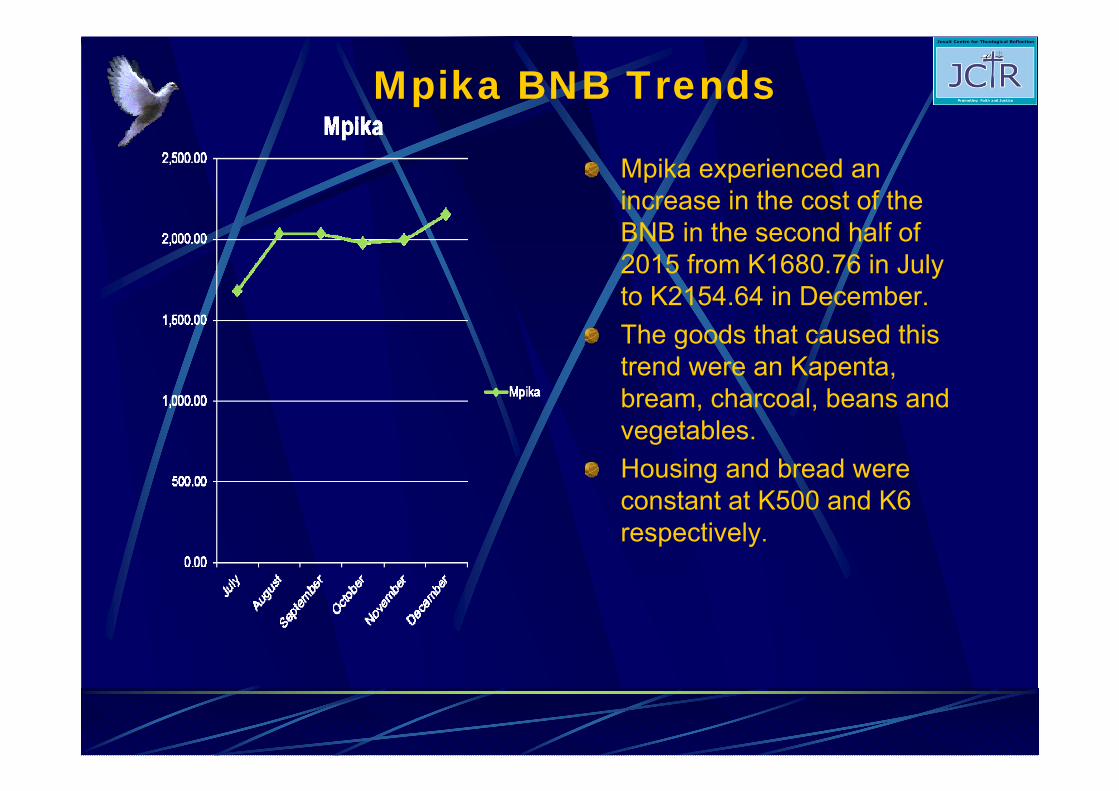
Mpika BNB Trends
Mpika experienced an increase in the cost of the BNB in the second half of 2015 from K1680.76 in July to K2154.64 in December.The goods that caused this trend were an Kapenta, bream, charcoal, beans and vegetables.Housing and bread were constant at K500 and K6 respectively.
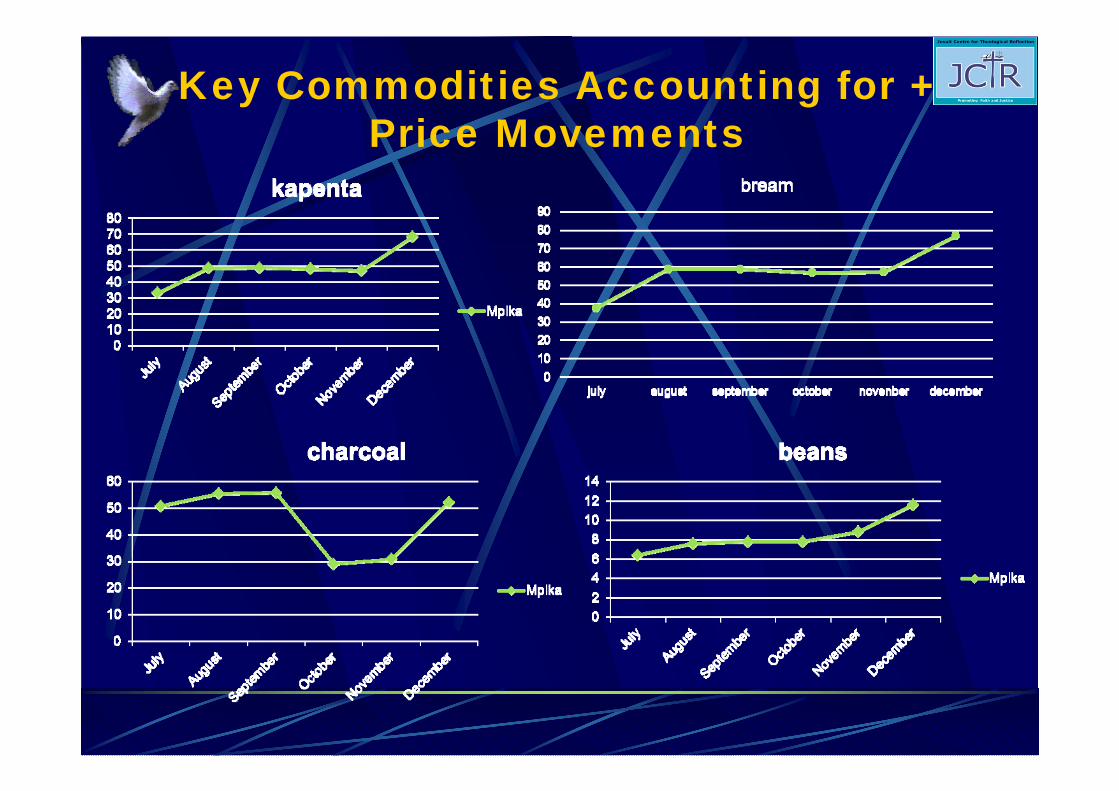
Key Commodities Accounting for + Price Movements
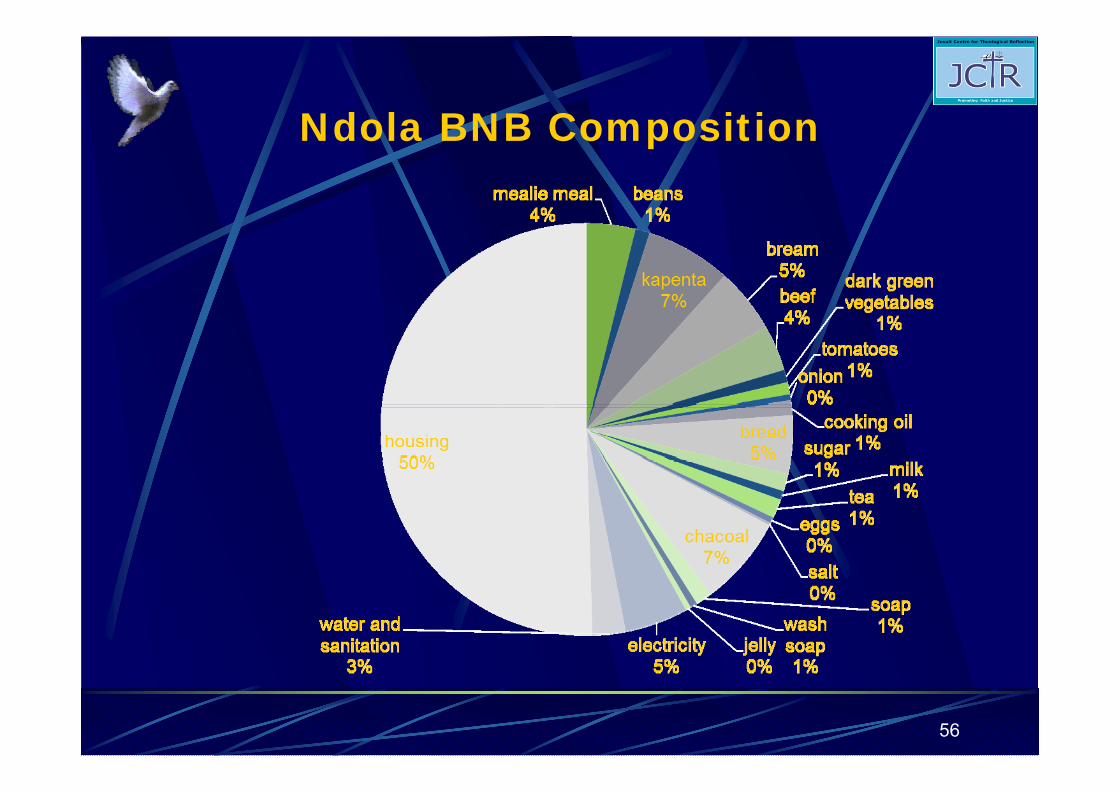
Ndola BNB Composition
56
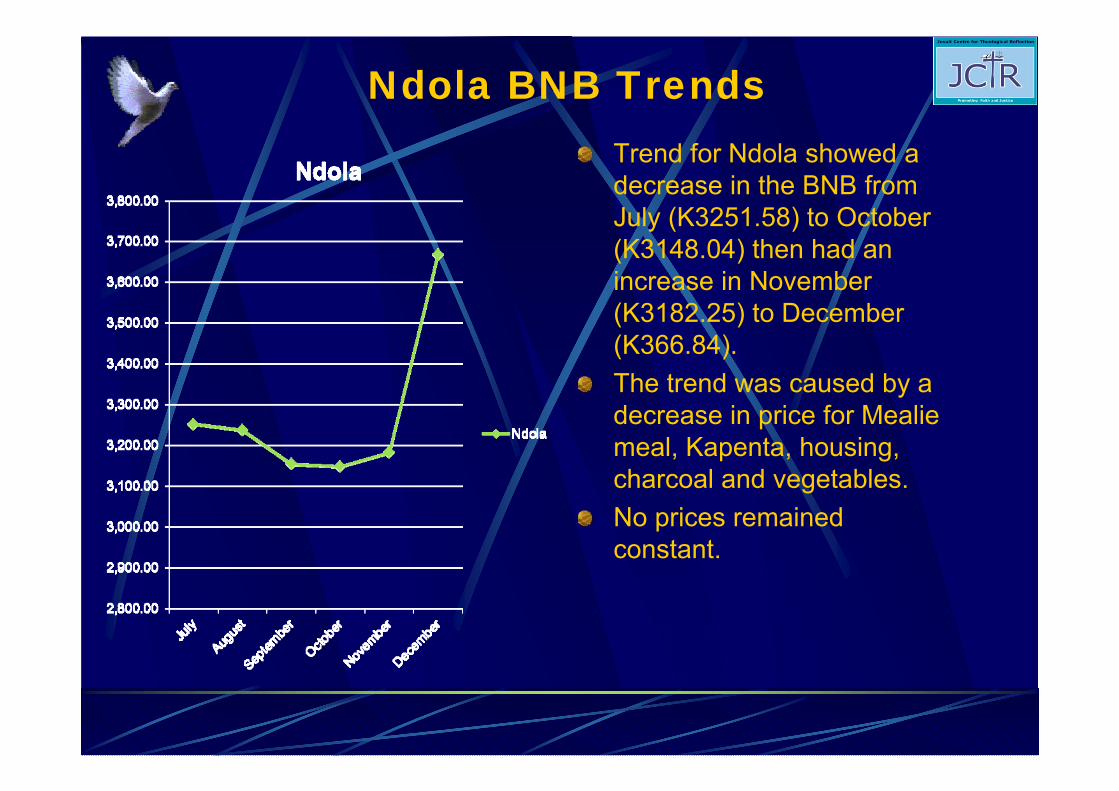
Ndola BNB TrendsTrend for Ndola showed a decrease in the BNB from July (K3251.58) to October (K3148.04) then had an increase in November (K3182.25) to December (K366.84).The trend was caused by a decrease in price for Mealie meal, Kapenta, housing, charcoal and vegetables.No prices remained constant.
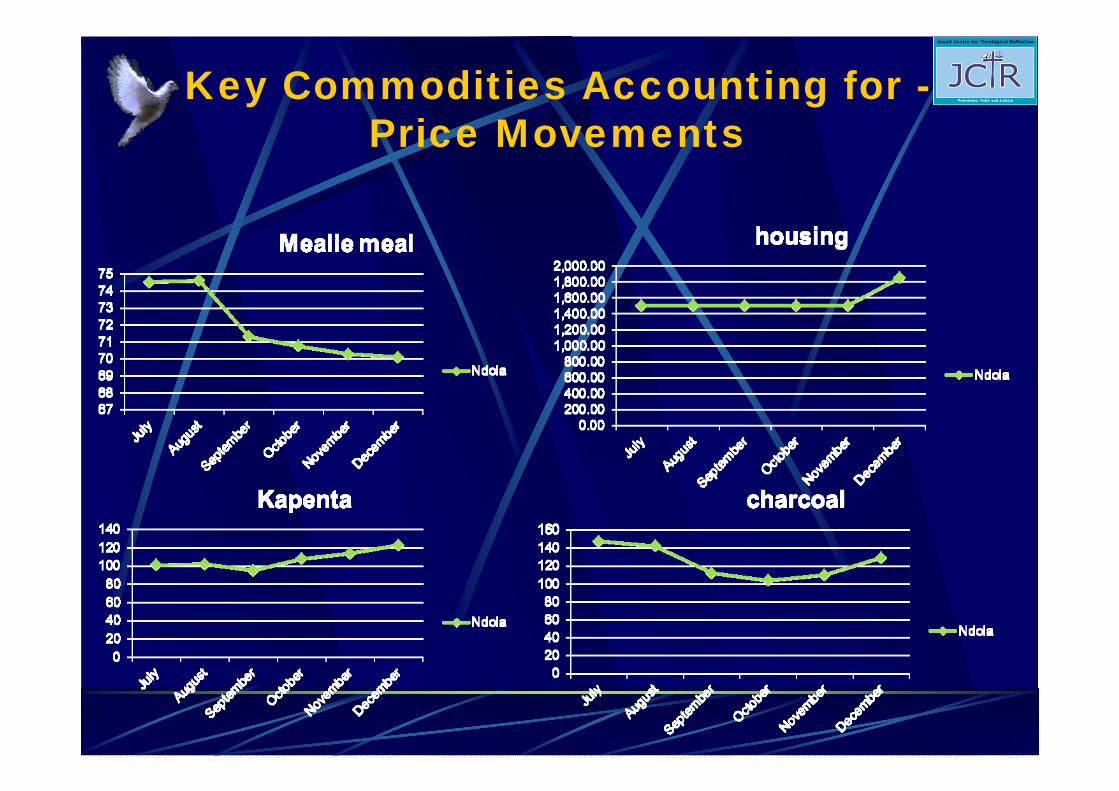
Key Commodities Accounting for -Price Movements
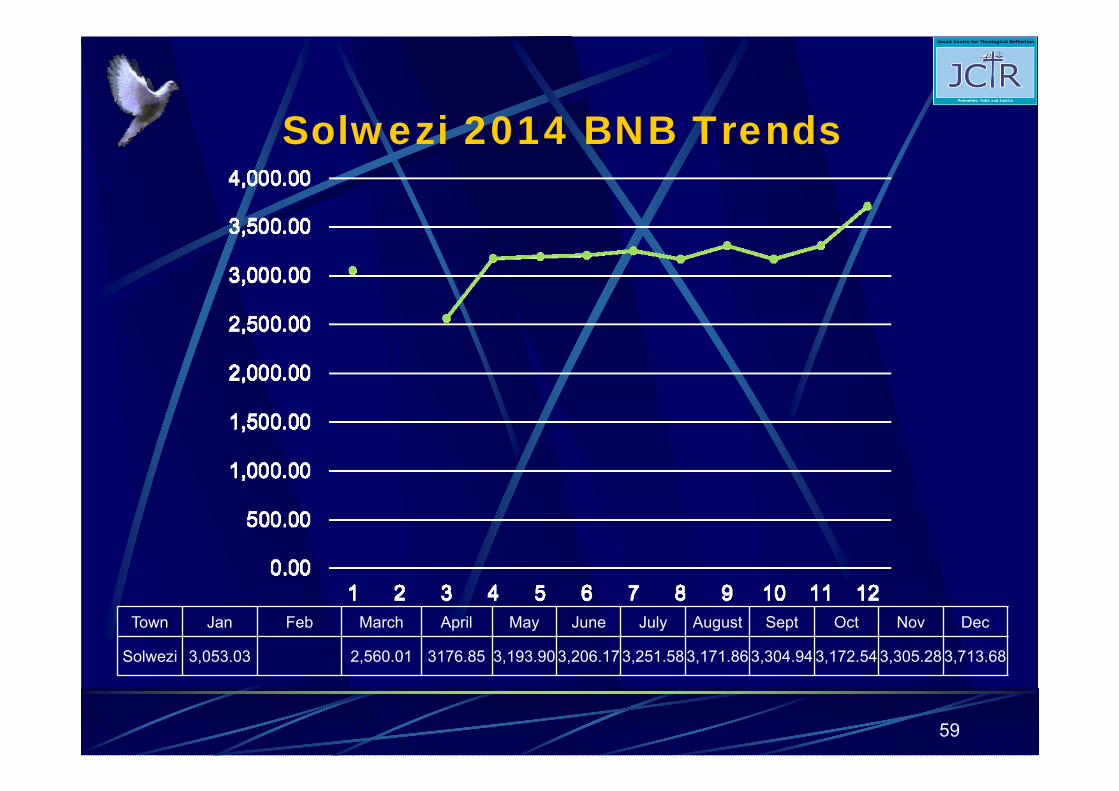
Solwezi 2014 BNB Trends
59
Town Jan Feb March April May June July August Sept Oct Nov Dec
Solwezi 3,053.03 2,560.01 3176.85 3,193.90 3,206.17 3,251.58 3,171.86 3,304.94 3,172.54 3,305.28 3,713.68
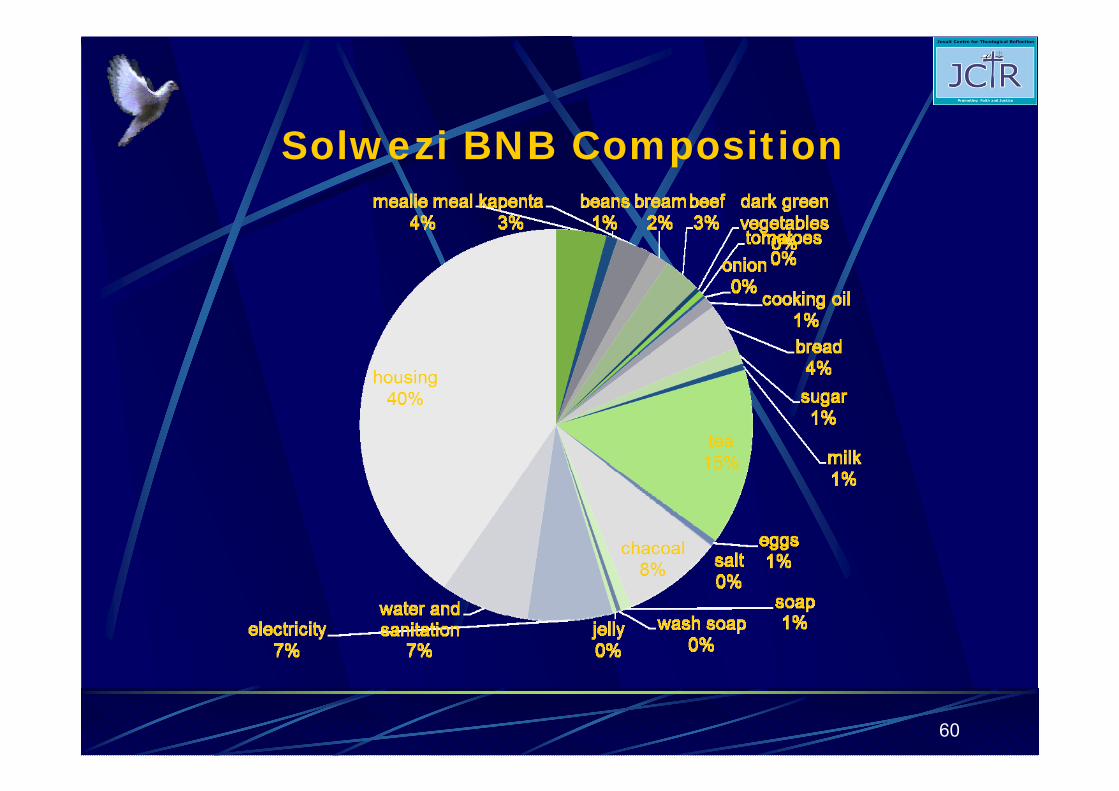
Solwezi BNB Composition
60
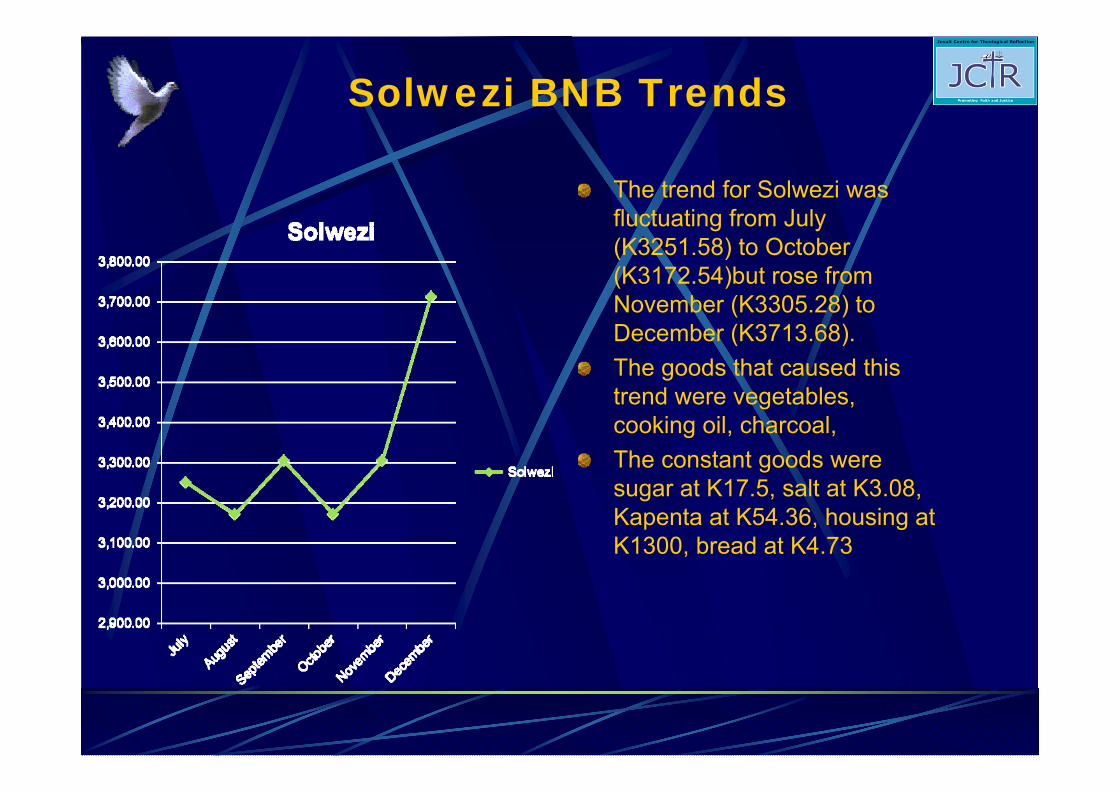
Solwezi BNB Trends
The trend for Solwezi was fluctuating from July (K3251.58) to October (K3172.54)but rose from November (K3305.28) to December (K3713.68). The goods that caused this trend were vegetables, cooking oil, charcoal,The constant goods were sugar at K17.5, salt at K3.08, Kapenta at K54.36, housing at K1300, bread at K4.73
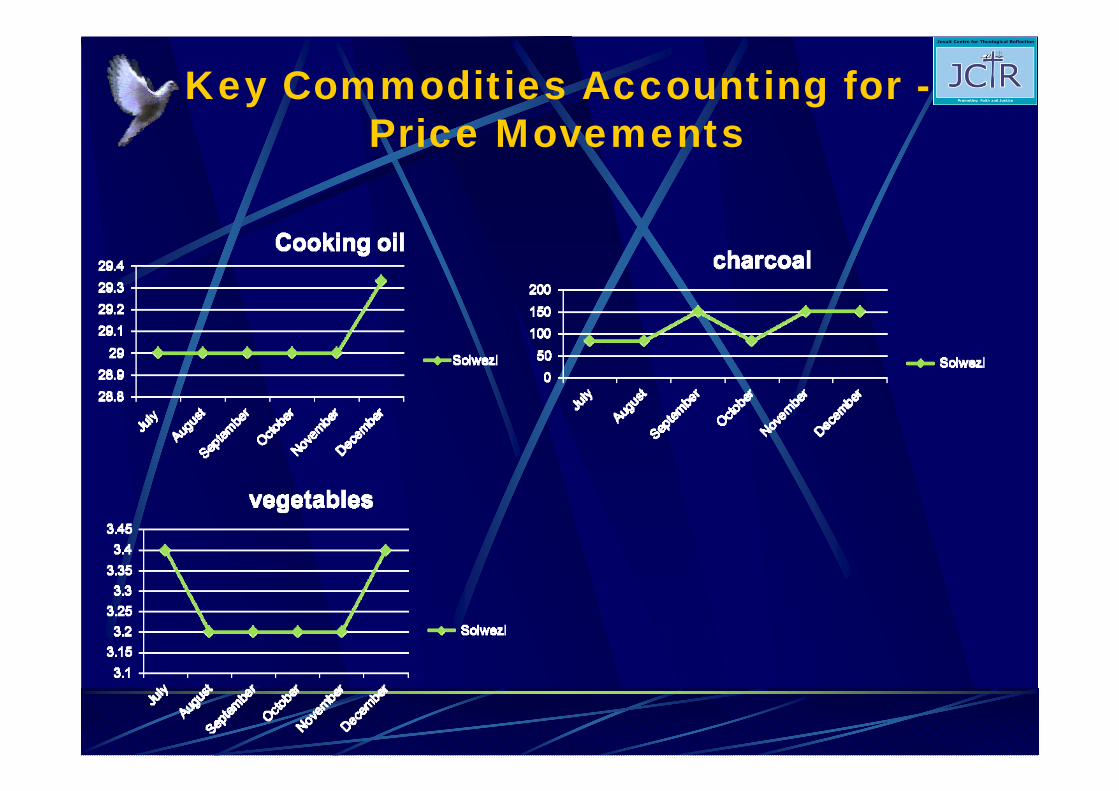
Key Commodities Accounting for -Price Movements
Conclusion
Ideally society should be structured to meet everyone’s basic needs. Therefore there is need for implementation of policies and programmes that translate into real growth so that majority of the people can be removed from the poverty trap.
1. How do people cope with these prices?2. How can we see living standards of people
improve?3. What policies can be put in place and
IMPLEMENTED?
Hypothesis
In the light of the evidence adduced by the BNB over the period 2014 ( January –December ) we hypothesize that the cost of living in Zambia is increasing gradually and steadily as evidenced by the indices of cost of commodities ( Food and Non Food items) and wage levels
64

65
Twitter : @JCTROrg
Like us on Face book : Jesuit Centre for Theological Reflection
www.jctr.org.zm

SED 66