social network analysis in business and economics marko pahor
TRANSCRIPT

Social network analysis in business and economics
Marko Pahor

Agenda
• What is social network analysis• Short overview of social network analysis
techniques• Applications of social network analysis in
business and economics• Learning networks• Ownership relations

Why do we need (social) network analysis?
• Different types of data: • Attribute (properties, opinions, behavior,…)• Ideational (meanings, motives, definitions,…)• Relational (contacts, ties, connections…)
• Different data needs different analysis• Variable analysis for attribute data• Typological analysis for ideational data• Network analysis for relational data
What is social network analysis
• Network analysis is a series of techniques (mathematical, statistical,…) designed to analyze relation data
• Mathematically funded in graph theory• Social network analysis is the application of
network analysis in the social sciences context

What are networks
• Imagine a closed set of units, call them actors or nodes• For example people, companies, web pages,
• Networks are a set of actors or nodes connected by one or more relations
Social networks
• Thinking:
• … well, yes, but not really what social network analysis is about
• Social networks is any network with social entities (persons, groups, companies, social events,…) as actors

Social network analysis techniques
• “Descriptive statistics” of networks• Actors’ properties• Network properties
• Statistical methods• Blockmodelling• Probability models
• One-time networks• Dynamic networks

Descriptive statistics
• Properties of actors• Measures, that describe the position and importance of
individual actors in the network• E.g. Degree, betweeness,...
• Properties of network• Describe the entire network• Centalization, degree distribution, triadic census,...

Statistical methods of social network analysis
• Blockmodelling• A clustering methods• Permutations of the adjacency matrix in order to find
some apriori expected blocks
• Probability models for one-time networks• Modeling the probability of existence of a tie given
parameters• Network parameters (e.g. reciprocity), covariates (e.g.
gender) and dyadic covariates (e.g. other relation)
• Probability models for dynamic networks• Modeling the probability of creation or dissolution of a tie
given parameters

Applications of social network analysis in business and economics
• Example 1: Organizational learning and through learning networks
• Example 2: The evolution of the cross-ownership network in Slovenia

The Network Perspective to Organizational Learning – A Comparison of Two Companies

Organizational learning and learning networks
• Organizational learning: individuals’ acquisition of information and knowledge, analytical and communicative skills
• Twodivergent perspectives for organizational learning• the acquisition perspective• the participation perspective
• Elkjaer’s (2004) ‘third way’ - a synthesis of the participation perspective and communities of practice • Critisim: too much emphasis on the participation
perspective and neglects some vital aspects of the acquisition perspective

The learning network perspective
• The individual is recognized as the primary source and destination for learning
• Learning takes place primarily in social interaction
• The network perspective helps develop an organizational learning culture

Learning networks
• External• an extended enterprise model and comprise
relationships that a firm has with its customers, suppliers and other stakeholders
• Internal• a set of internal relationships among individual members
of the firm and other constituencies such as product/service divisions and geographical units
• Components of learning networks• learning processes • learning structures • actors
Propositions
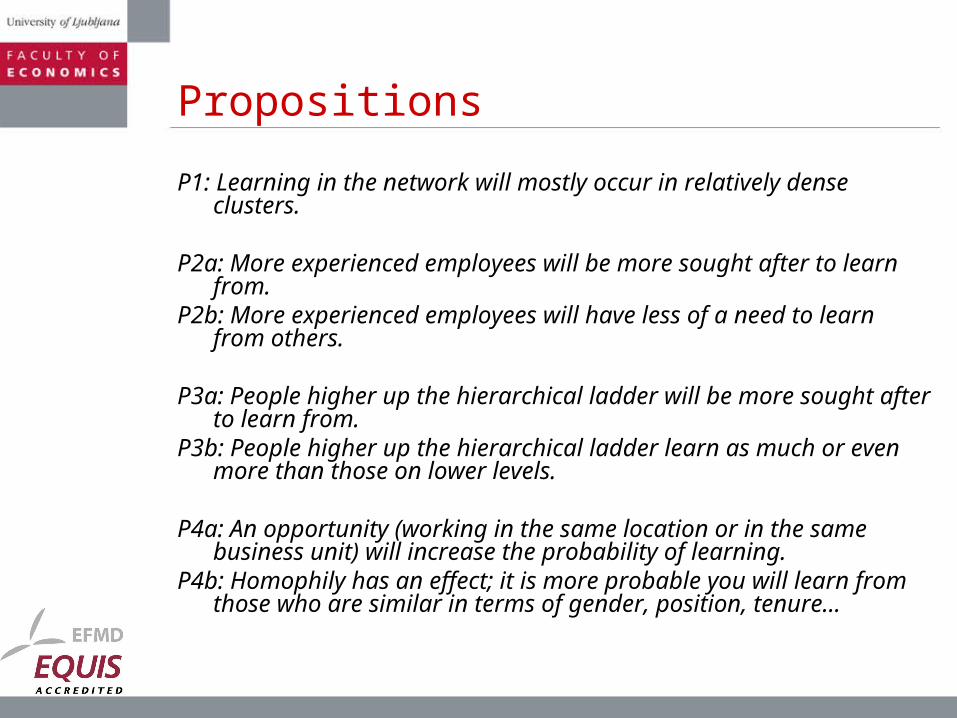
P1: Learning in the network will mostly occur in relatively dense clusters.
P2a: More experienced employees will be more sought after to learn from.
P2b: More experienced employees will have less of a need to learn from others.
P3a: People higher up the hierarchical ladder will be more sought after to learn from.
P3b: People higher up the hierarchical ladder learn as much or even more than those on lower levels.
P4a: An opportunity (working in the same location or in the same business unit) will increase the probability of learning.
P4b: Homophily has an effect; it is more probable you will learn from those who are similar in terms of gender, position, tenure...

Data – first company
• a software company• 93 employees in three geographical units• 81 employees participated in the study
• 59 from Ljubljana (Slovenia), 11 in Zagreb (Croatia) and another 11 in Belgrade (Serbia)
• 56.7% of the respondents have a university degree or higher (even one PhD)
• 74% of the respondents are male• average tenure 38.9 months

Learning network in the first company

Data – second company
• main business engineering and production of pre-fabricated buildings
• 860 employees, 470 of which on the main location
• One production and several sales subsidiaries• 348 employees from the main location
participated• 59 % of respondents have finished high school,
29 % have a university degree• 79% of the respondents are male, • average tenure is 12.7 years

Learning network in the second company

Methodology
• Network analysis is concerned with the structure and patterning of these relationships
• Logistic model for social networks known as the exponential random graph model (Snijders, 2002, Snijders et al., 2004)
• What makes a learning tie more probable?• Structural effects• Actor covariate effects• Dyadic covariate effects

Results – first company
Effect Model 1 Model 2 Model 3 Model 4 Model 5
reciprocity 1.32 (0.24) 0.75 (0.29) 0.53 (0.26) 0.54 (0.3) 0.54 (0.31)
alternating out-k-stars, par. 2 -0.63 (0.23) -0.6 (0.2) -0.74 (0.22) -0.83 (0.26) -0.8 (0.21)
alternating in-k-stars, par. 2 0.46 (0.13) 0.23 (0.15) 0.23 (0.14) 0.21 (0.16) 0.22 (0.17)
Stru
ctur
al
effe
cts
direct + indirect connections 1.24 (0.13) 0.15 (0.17) 0.2 (0.18) 0.26 (0.21) 0.17 (0.2)
alternating k-triangles, par. 2 1.14 (0.11) 0.8 (0.12) 0.76 (0.14) 0.79 (0.14)
Clu
ster
ing
alternating independent twopaths, par. 2 -0.2 (0.03) -0.19 (0.02) -0.21 (0.03) -0.2 (0.03)
location (centered) 1.68 (0.26) 1.63 (0.26) 1.72 (0.23)
Opp
ortu
nity
sector (centered) 0.62 (0.11) 0.81 (0.13) 0.72 (0.11)
tenure ego 0 (0.02) -0.02 (0.02)
Exp erie
nce
tenure alter 0.02 (0.01) 0.05 (0.02)
hierarchy ego -0.04 (0.06) -0.06 (0.07)
Seni
orit y
hierarchy alter -0.12 (0.04) -0.15 (0.06)
gender ego 0.26 (0.15)
Gen der
gender alter 0.07 (0.13)
tenure similarity 0.47 (0.16)
hierarchy similarity 0.78 (0.41)
Hom
ophi
ly
gender identity 0.47 (0.22)

Results – second company
Effect Model 1 Model 2 Model 3 Model 4 Model 5
reciprocity 1.38 (0.27) 1.4 (0.26) 1.33 (0.34) 1.27 (0.31) 1.22 (0.35) alternating out-k-stars, par. 2 -0.47 (0.12) -0.33 (0.12) -0.55 (0.11) -0.57 (0.13) -0.6 (0.13)
alternating in-k-stars, par. 2 0.7 (0.08) 0.79 (0.08) 0.86 (0.09) 0.74 (0.09) 0.72 (0.09)
Stru
ctur
al
effe
cts
direct + indirect connections 1.63 (0.11) 0.79 (0.3) 0.77 (0.24) 0.92 (0.31) 0.75 (0.26)
alternating k-triangles, par. 2 0.93 (0.24) 0.73 (0.18) 0.66 (0.26) 0.82 (0.18)
Clu
ste
rin
g
alternating independent twopaths, par. 2 -0.13 (0.02) -0.17 (0.03) -0.17 (0.02) -0.16 (0.02)
Opportunity sector (centered)
1.14 (0.11) 1.23 (0.11) 1.18 (0.12)
tenure ego 0.1 (0.09) 0.08 (0.1)
Exp
erie
nce
tenure alter -0.05 (0.04) -0.03 (0.07)
hierarchy ego 0.16 (0.21) 1.09 (0.93)
Seni
orit y
hierarchy alter -0.02 (0.13) 0.86 (0.89)
gender ego -0.31 (0.18)
Gen der
gender alter 0.02 (0.09)
education similarity 0.04 (0.27)
hierarchy similarity -1.84 (1.8)
Hom
ophi
ly
gender identity 0.05 (0.15)
Discussion of results
• findings offers support for the network perspective to organizational learning
• learning often occurs in project settings and mainly involves the transfer of tacit knowledge through participation
• a particular learning setting is dependent on corporate culture and it is hard to capture all of its parameters

Paths of Capital: The Creation and Dissolution of the Slovenian Corporate Network

Corporate networks
• Networks between corporate entities (companies)
• Different types of links• Interlocking directorates• Financial links• Strategic alliances• Cross-ownership• Multilink• …

Corporate networks configurations
• Corporate networks evolve through time• Self-organized or guided
• The configuration of a network is a reflection of the current situation (and historical path)
• Some configurations:• Groups around financial centers (US, Mizruchi, 1982)• Pyramidal structures (Belgium, Renneboog, 1997 and
1998)• Cross-owned groups (keiretsu system in Japan, Gerlach,
1992)• Sparse (“dismanteled”) network (Hungary, Stark, 2001)

The Slovenian corporate network
• Basically no corporations before 1992 • Socially (not state!) owned companies
• “Ownership allocation” (privatization)• Began in 1992• Was over by 1998• “Voucher” privatization
• In 1998 almost no connection between (non-financial) corporation
• By the year 2000 a rather dense network and growing

Data
• Ownership relations• Owns a share in a public limited company
• Only non-financial companies• 476 public limited companies
• Companies that existed in 2000 and their legal successors
• Were connected at least once in the observed period
• 10 years (2000-2009), two observations per year

Changes in the network
• Network is evolving• Changing links• Changing composition
• Two distinct periods are visible• Network creation period• Dismantlement period

Network in 2000

Network in 2002

Network in 2004
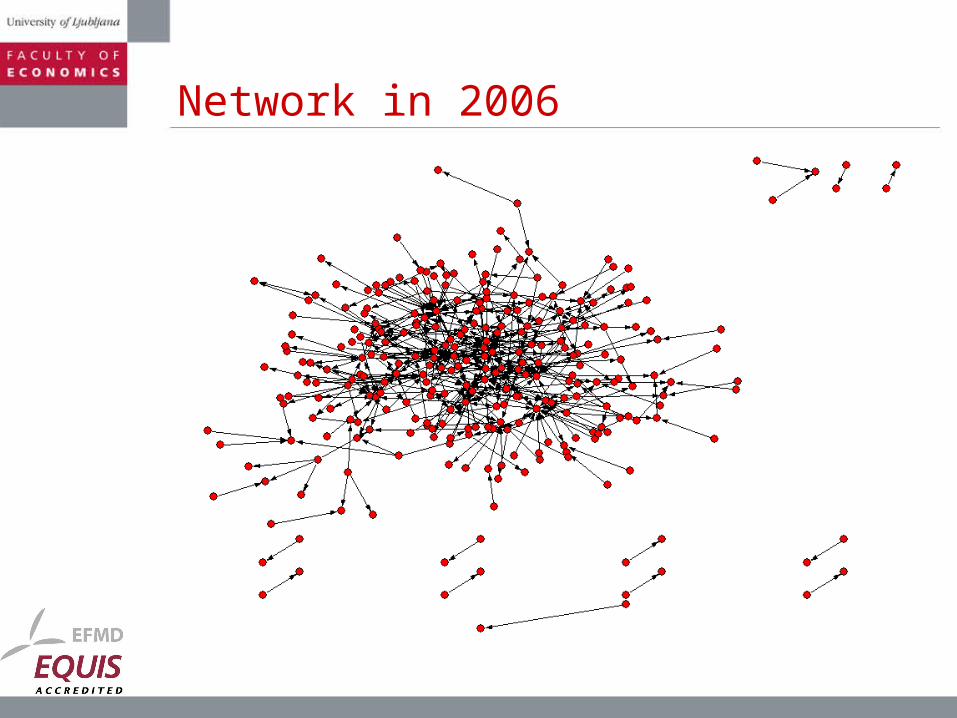
Network in 2006

Network in 2008

Number of ties

Disconnected companies

Size of the largest strong component

How it happened?
• Some patterns can be observed• Two phased process
• Preparatory phase• Execution phase• Coincides with changes in network
• Examples• 2000 – 2004 comparisons for the first phase• 2005 – 2009 comparisons for the second phase

First phase: Building a portfolio

Second phase: Cashing out

First phase: making a group

Second phase: Closing the deal

Findings
• Slovenian corporate network is dissolving after a rise early in the decade
• Reason: ownership changes• Shows how networks are used to gain control
Conclusions
• Social network analysis is an emerging technique for the analysis of relations data• Networks are everywhere
• Many possibilities for applications in business and economics• Interpersonal relations• Interorganizational relations• Marketing applications: products and customers
networks