social newtworks, poverty and neighborhoods in two...
TRANSCRIPT

TEXTO PARA DISCUSSÃO Nº 002/2010
Social newtworks, poverty and neighborhoods in two Brazilian cities
Eduardo Marques Renata Bichir
Graziela Castello Maria Encarnación Moya

CENTRO DE ESTUDOS DA METRÓPOLE SÉRIE TEXTOS PARA DISCUSSÃO
ISSN: em tramitação
Expediente Centro de Estudos da Metrópole Diretora Marta Arretche Conselho Diretor do CEM Adrián Gurza Lavalle Alvaro Augusto Comin Antônio Sérgio Guimarães Eduardo Marques Fernando Limongi Nadya Araújo Guimarães Márcia Lima Marta Arretche Henri Gervaiseau Paula Montero Ronaldo de Almeida Vera Schattan Coelho Comissão Coordenadora do INCT Antônio Sérgio Guimarães Celi Scalon Eduardo Marques Elisa Reis Fernando Limongi Marta Arretche Nadya Araújo Guimarães Paula Montero
Publicação online cujo objetivo é divulgar resultados de estudos direta ou indiretamente desenvolvidos como parte da pesquisa do Centro de Estudos da Metrópole, de forma a favorecer a difusão de informações para pesquisadores, estudantes e profissionais especializados e estabelecer espaço para troca de idéias e sugestões. Os textos desta série estão disponíveis em: www.centrodametropole.org.br As opiniões emitidas nesta publicação são de inteira responsabilidade de seus autores, não exprimindo necessariamente o ponto de vista do Centro de Estudos da Metrópole. É permitida a reprodução dos textos e dados neles contidos, desde que citada a fonte e que não haja restrição expressa pelos autores. Reproduções para fins comerciais são proibidas.
www.centrodametropole.org.br Rua Morgado de Mateus 615
Vila Mariana 04015 902 São Paulo SP Brasil Fone 55 11 – 5574 0399 Fax 55 11 – 5574 5928

2
Social Networks, Poverty and Neighborhoods in Two Brazilian
Cities
Eduardo Marques, Renata Bichir,
Graziela Castello and Maria Encarnación Moya 2
University of São Paulo and Center for Metropolitan Studies
Abstract
The article builds upon previous research findings about the role of social
networks in the reproduction of poverty, taking into consideration the access of poor
individuals to goods and services obtained through market or social support and
exchange. The previous research studied the personal networks of 209 poor
individuals and 30 middle-class individuals in seven locations in São Paulo. This
paper includes the results of 153 personal networks of individuals in poverty who live
in five different locations in the City of Salvador, Bahia. The article comparatively
discusses the characteristics of poor people’s personal networks in São Paulo and
Salvador. In general, the results confirm previous findings regarding the diversity and
the importance of networks in living conditions, especially considering the content
and diversity of sociability. On the other hand, the article explores differences
between the cities to discuss dimensions of migration, race, housing conditions, and
tenure situations that could not be stressed in the previous research.
Key-words: poverty; personal networks; segregation; São Paulo; Salvador
Introduction
This article discusses the characteristics of personal networks of individuals in
poverty in twelve neighborhoods in the cities of São Paulo, São Paulo, and Salvador,
Bahia, submitted to different degrees of residential segregation. Previous results of
this same research project studied the joint effects of social networks and urban
2 The research team of the project also included Miranda Zoppi, to whom we are thankful for data collection and analysis.

3
segregation in the reproduction of poverty, considering the access of poor individuals
to markets, and to goods and services obtained through social support and social
exchange (Marques, forthcoming). The previous research studied the personal
networks of 209 individuals in poverty and 30 middle-class individuals in seven
locations in São Paulo. This paper adds another 153 personal networks of individuals
in poverty who live in five different locations in the city of Salvador, analyzing
comparatively the patterns between cities and social groups3.
São Paulo and Salvador are both very large and important metropolises,
although the first holds national prominence, while the second is the most important
center of the Northeastern region. The comparison is especially interesting since the
cities are very different when urban structure, labor markets, daily sociability and
social structure are taken into consideration. In each city fieldwork was carried out in
poor neighborhoods with very different urban and segregation profiles. In general, the
results presented here confirm previous findings regarding the diversity and the
importance of networks in living conditions, but they also explore the differences
between the cities to discuss dimensions of migration, race, housing conditions, and
tenure situations that could not be stressed in the previous research. Besides this
general characterization of poor people’s personal networks in the two cities, we
sought to classify the diversity of their personal networks developing two kinds of
typology, one based on the structure of their personal networks and the other one
based on their patterns of sociability.
The article is divided in four sections, not considering this introduction and the
conclusion. The next section reviews the literature, establishing the main points of
departure of the analysis. The second section presents the research design and
sketches briefly the results of the previous phase. The third section presents and
discusses comparatively the characteristics of personal networks of the individuals in
São Paulo and Salvador. The fourth section explores the variability of the networks
3 Individuals in poverty have very little schooling, low family income and included low-skilled workers such as domestic employees, gardeners, civil construction workers, salesmen, telemarketing operators, and more traditional industrial workers, but also students, housewives, and retired persons. Their families tend to have several children and a younger average age than the metropolitan population. Middle class was defined in a broad sense, mixing income and professional criteria, and included liberal professionals, civil servants, persons involved in intellectual activities, and commercial establishment owners. The middle-class networks were used only as a parameter and were not fully analyzed.

4
and of sociability, constructing two typologies, whose results are closely associated
with the social attributes of the individuals in poverty.
1. Social networks, urban segregation and poverty
In Latin America the role of segregation has been at the center of urban
studies since the 1970s, although originally associated with the debates about urban
peripheries (Bonduki and Rolnik 1982) and the nature of Latin American peripheral
capitalism (Kowarick 1979). Several changes in the Brazilian debate have followed,
but the importance of urban segregation continues to be explored recently to interpret
social vulnerability (Kowarick 2009; Telles and Cabannes 2006) and social
inequalities (Lago 2000), as well as to explain several social processes associated
with the reproduction of poverty (Marques and Torres 2005).
The association between urban segregation and poverty has also been
considered by the international literature as one of the most important elements in
the reproduction of the so-called new urban poverty, since at least Wilson’s (1987)
seminal work. Since then, several studies in Europe (Mingione 1996, and more
recently Mustered, Murie and Kesteloot 2006), in the United States (Briggs 2005, and
Wacquant 2007), and in Latin America (Auyero 1999), have discussed its importance
for material well-being as well as for social and political integration.
In all those analyses, segregation was considered to be important because it
enhances social isolation, hampering the circulation of material and immaterial
elements among social groups. However, as highlighted by authors from different
traditions such as Nan Lin, Loic Wacquant, Xavier Briggs, and Talja Blokland, the
isolation effect of segregation may be counterbalanced by social ties that might
bridge the spatial separation, leading to the need of integrating social networks into
segregation studies. And for its greater part, the interaction of networks with
segregation and poverty involves the incorporation of informal elements recently
highlighted by the literature on urban poverty (Mingione 1994, Roy 2005, and Pamuk
2000).
Social network analysis tends to be quite a recent issue in the social sciences,
but its relational ontology has been at the heart of social sciences since the classics
(Emirbayer 1997). More recently, however, the development of social network
analysis methods has allowed the production of precise studies of the effects of
relational patterns over a broad variety of processes (Freeman 2004). Although some

5
interesting analyses have been published using networks metaphorically (Fawax
2007, and Gonzalez de la Rocha 2001), the full potential of relational ontology comes
with its methodological use. In the discussion of living conditions and poverty, in
particular, the international literature has increasingly emphasized their role in the
access to opportunities (Briggs 2005a, 2005b, and 2003), in the presence or absence
of the sense of belonging (Blokland and Savage 2008), as well as in the mediation of
the access of individuals and groups to other three sources of welfare – markets,
sociability and the state (Mustered, Murie and Kesteloot 2006).
After studying poverty in São Paulo and other Brazilian cities for some years
in a more socio-demographic way (CEM 2004, Marques and Torres 2005), a
research was designed to test the joint effects of networks and segregation over
poverty conditions. Since the following sections are based upon hypotheses driven
from that research, and since they compare results from Salvador with the previous
results from São Paulo, it is important to summarize them briefly. We researched
relational structures (the networks), their use (sociability profiles), and mobilization (in
everyday life situations).
The research suggested that, on average, the networks of individuals in
poverty tend to be smaller, less diverse in terms of sociability and more local than
middle-class networks. Regardless of those average characteristics, networks tended
to vary substantially among the poor, as well as among the middle class. To explore
this variability, a typology based on both network characteristics and sociability
profiles was developed (Marques 2010). Those types appeared highly associated in
quantitative models with classical elements in the study of poverty, such as
employment, stable employment, social vulnerability, and income, even in the face of
traditional variables such as education and household size (Marques 2009a and
forthcoming). The worse social situations were associated with very homophilic
sociability patterns, as well as with highly local networks4. The best social situations
were associated with middle-size and non-local networks and sociability
concentrated in organizational spheres (work, church, associations). Therefore, low
homophily and low localism tended to be directly associated with better social
4 Homophily is the characteristic of networks that describes the existence of relationships among individuals with similar attributes. For example, the relationship between two women is homophilic regarding gender, as well as a relationship between two poor individuals is homophilic regarding social group. For a detailed analysis of the elements associated with this important relational issue see McPherson et al (2001).

6
situations, but network size did not have direct influence (although mid-sized
networks tended to be better if combined with less homophilic sociability patterns). It
is impossible to determine a strict causality here, and social networks/sociability and
individual attributes are constructed by biunivocal causality through the individuals’
life trajectories, impacted by individual decisions, events (migration, marriage,
divorce, child birth, etc), as well as the effects of the other individuals’ networks and
decisions.
The importance of homophily and localism was confirmed by results from
other research focused on ego centered networks of social support in Rio de Janeiro
and São Paulo. Based on data from a survey carried out in the two cities with
representative samples from both poor and non-poor social groups, that research
showed that although each of these groups has very different levels of homophily
and localism (and obviously income), the better social situations inside each group
are associated with less local and less homophilic networks (Marques and Bichir
2010).
It is important to stress, finally, that the results reported here concern personal
networks instead of ego centered networks and whole-community networks.
Community networks may be spatially or thematically constituted, and are the
relational environments that surround individuals within a given context, occurrence
or process, such as through social mobilization, within policy communities, in the
interaction between business organizations or in the familial or economic
relationships amongst patriarchal families, to mention just a few examples in which
networks are represented in very different ways. What is different about this study is
that it considers sociability as the topic or theme upon which the questions to
interviewees were made, not limiting them to the egocentric networks of individuals
(or egonets), which take into consideration only information of the individuals’ primary
contacts and the bonds between some of them. Unlike the greater part of the
international literature, we consider that an important portion of the sociability that
influences poverty and life conditions occurs at greater distances from the ego than
his or her direct contacts. Hence, we decided to analyze personal networks instead
of egonets.

7
2. The research
The study encompassed two fieldwork phases, one in 2006/2007 in the
metropolitan region of São Paulo, and the other one in 2009 in the City of Salvador.
In São Paulo, network interviews were conducted with 209 individuals in seven
locales chosen intentionally taking previous studies of urban poverty into
consideration to cover the variability of segregation and housing situations in the city.
The fieldwork included downtown slum tenements, favelas on the urban fringe of the
metropolis, in very high-income and in middle-class neighborhoods, in an industrial
district, as well as a large-scale housing project on the metropolitan fringe and a fairly
peripheral irregular settlement. In Salvador, fieldwork was conducted in five locales
based on the same criteria, including downtown slum tenements, favelas in two
consolidated and in two peripheral regions of the city; the fieldwork researched 153
personal networks. To create parameters in order to compare the networks, we also
developed 30 middle-class networks in São Paulo.
In each of those places, the interviewees were chosen and approached in
public spaces and at the entrances of their houses on both weekdays and weekends.
The interviews collected both relational information about the personal networks and
attributes about their components. In each field, basic social attributes such as
gender, age, and employment status were used to control the sample and avoid bias.
Although we did not follow random sample statistical techniques, the comparison of
the interviewees’ characteristics and those of the population studied does not
suggest the presence of bias.
The interviews were ego centered (inquiring about a person’s own network),
and used a semi-open questionnaire and a name generator. The questionnaire
covered basic socioeconomic attributes and also the individuals’ family configuration
and migratory and occupational trajectories. After that, a two-step name generator
was used. The interviewee was first asked to list up to five persons in each of his/her
spheres of sociability – family, neighbors, friends, work, religion, associations, leisure,
and others that had appeared during the first part of the interview. These names
represented the ‘seed’ of the network and were included in the first column of the
relational questionnaire. He/she was then asked to list up to three names for each of
the names in the seed, which were associated in his/her mind with the one cited in
view of their sociability. He/she could present a new name, repeat names, include
his/her own name or say none. Those persons were included in the rows of each
8
cited name, but the new names were also included in the first column, at the end of
the list. With the ‘seed’ names finalized, the interview went on with the names
recently added. The procedure was repeated up to four times (including the seed),
but none of the poor individuals reached this limit, suggesting that the frontier of the
network had been reached. After that, the interviewee was asked to classify the
persons according to two attributes: place of residence (local/non-local) and sphere
of sociability in which the tie occurred.5
For each of the cities, after processing the relational data and constructing the
networks, we returned to the field to perform qualitative interviews with selected
individuals, combining types of networks and personal characteristics. These new
interviews involved 17 individuals in São Paulo and 21 in Salvador, and explored
network transformations, but mainly network mobilization to solve daily problems
through social help, such as in migration, getting jobs, child and elderly care,
emotional support, etc. Network mobilization in São Paulo was explored in details by
Marques (2009b and forthcoming).
3. Networks and Sociability in São Paulo and Salvador
We conducted interviews with 209 poor individuals in São Paulo and 153 in
Salvador, totaling 362 individuals in poverty, plus 30 middle-class individuals in São
Paulo. All the following information concerns the individuals in poverty, except when
indicated.
The interviewees were made up of 56% women and 44% men, with ages
ranging from 12 to 94 years (with an average of 37 years). The households had an
average size of 3.9 persons, a figure that did not vary between cities. Our sample
included 43% and 34% of people living in segregated places in São Paulo and
Salvador, respectively.
Education tended to be very low, although better in Salvador – on average
64% had completed 8th grade schooling at the most, with a slightly better profile in
Salvador, a city that also presented a higher presence of high school education (37%
against 28% in São Paulo). This was also evident in the average years of schooling,
7 in Salvador and 6 in São Paulo. These relative positions were inverted concerning
5 In the case of São Paulo, people were also asked about the context of sociability in which the tie was created, but since this information did not produce interesting results, it was discarded for the fieldwork conducted in Salvador.
9
income: 19% in São Paulo and 22% in Salvador had per capita family income inferior
to ¼ of a minimum wage. In fact, the average of per capita family income in São
Paulo was 0.82 minimum wages, while in Salvador the average was 0.77. This
basically expressed the differences between the two labor markets, and while 54% in
São Paulo were employed, only 38% in Salvador had this condition. On the other
hand, informal workers and unemployed in Salvador reached 45% against only 32%
in São Paulo.
Association practices tended to be low in both cities (12%), while higher in
Salvador – 16%. But since we had access to some locales departing from persons
connected to community associations, the findings concerning associative life might
be biased. In accordance with several recent studies on the topic, the most important
collective participation was related to religious practices, and 47% of the interviewees
from the two cities reported going to a place of worship at least once every 15 days,
a figure that reached 54% in Salvador. In both cities, about 20% of the persons
stated themselves as Neopentecostal Protestants, while 63% affirmed being
Catholics in São Paulo and 45% in Salvador. This last city also had a 5% following of
Candomblé (an Afro-Brazilian religion), and 22% considered having no religion,
against 12% in São Paulo (Candomblé followers were absent in the São Paulo
sample).
Migrants were substantially more present in São Paulo (70%), while in
Salvador they were only 34%. In both cities the majority of the migrants tended to be
long-term residents, and 72% in São Paulo and 89% in Salvador arrived at the cities
more than 10 years ago. The stability of the neighborhoods is also high in both cities,
although higher in Salvador, where 89% of the persons had lived in their
neighborhoods for more than 10 years, while in São Paulo only 54% of the
interviewees were in this condition. The higher localism of Salvador is also present in
the labor market, since 44% of the interviewees worked inside the community, while
only 38% in São Paulo worked locally. Finally, skin color was much more prominent
in Salvador, where 74% were considered to be black.
The average networks of the two cities had similar but not equal
characteristics. The average networks in São Paulo had more nodes – 52.5 against
40.7 in Salvador –, but less ties, 53.4 against 74.7 in Salvador. Localism was larger
in Salvador – 63.5% of the individuals in the networks lived in the same place as the
interviewee, against 55% in São Paulo. Several other network measures suggest

10
more intense relational activities in Salvador on the average6. Only for the sake of
comparison it is worth noting that the middle-class networks researched in São Paulo
had an average size of 93 nodes and 183 ties, and localism was smaller than 20%.
The variability of sociability tended to be slightly larger in São Paulo: 3.8
average spheres of sociability against 3.5 in Salvador, both substantially smaller than
the 5.5 spheres among middle -class individuals in São Paulo. The profiles of
sociability, however, showed remarkable similarity between the cities, with the family
answering for 40.6% and the neighborhood as the second most important sphere,
with 31.6% of the ties. Following them, work corresponded to 8.0%, friendship to
5.9%, church to 4.6%, and studies to 3.3%. The individual variations around these
averages, however, are high in both cities, suggesting the existence of a substantial
heterogeneity in sociability, which led us to explore the data constructing typologies.
As we will see in the next section, the similarities between the cities become even
more eloquent considering the network and sociability types. Among middle-class
individuals in São Paulo, 35% of the ties were associated with the family sphere,
followed by work (26%), friendship (14%), and studies (10%). Neighborhood and
church reached only 5% and 1%, respectively.
In short, the networks of poor individuals tend to be smaller, less varied in
terms of sociability, and more local than those of middle-class individuals. However,
they showed similar characteristics in São Paulo and in Salvador, except for the
higher localism in Salvador, slightly larger networks with more varied sociability in
São Paulo, and higher relational activity in Salvador. These differences might be
caused by the smaller offer of ties for new connections in Salvador due to higher
localism, leading to networks that are at the same time smaller and more intensely
connected.
But what is the relation between social attributes and the characteristics of
networks and of sociability? To begin exploring this issue, we develop the following
univariate analysis. Since almost all the elements are correlated (and the processes
that produce them are superposed), these results should not be understood as
determining associations, but as explorations of the processes and dimensions
6 Network density in Salvador was 0.14 against 0.10 of São Paulo, average normalized degree was 12.1 against 8.3 in São Paulo and the average clustering coefficient was 0.52 against 0.46 in São Paulo.

11
involved. All the reported relationships are statistically representative at 99% of
significance.
There are no strong differences between the networks of men and women,
although small differences in sociability appeared, with men’s networks more
centered on work and leisure, while the presence of the church sphere tends to be
greater for women. These patterns are consistent with the sociability typology, as it
will be seen.
The different effect of the life cycle on the networks is very clear7. As age
advances, networks tend to have less varied sociability but more redundant ego
centered networks (measured by Burt’s efficient size). In terms of sociability, the
family becomes more important and studies and friends relatively less present. But
this dynamics is not linear in all ages; it is more concentrated for the two poles of the
life cycle. For youngsters (with less than 21 years of age), for example, networks tend
to have more nodes and ties and more efficient ego-centered networks, but larger
localism and higher proportions of studies and less work than the rest of the
population. The elderly have networks with opposite characteristics – smaller in
nodes and ties, less varied in sociability, lower presence of studies and friends, and
higher relative family presence in sociability.
Another very important variation in the networks is associated to social
groups, in this case characterized by income and schooling. This is very interesting
since the sample includes only individuals in poverty, and consequently income and
schooling tend to vary relatively little. Thus, network characteristics tend to vary
according to social groups even among the poor. The tendencies are similar, with the
variability of sociability, as well relational activity (clusterization, efficiency of the
egonet, betweenness) increasing as income and schooling increase. The size of the
networks tends to increase with years of schooling, and localism decreases as
income increases. Finally, as schooling and income increase, the relative presence
of the family and the neighborhood spheres decrease, and the friendship and work
spheres increase.
These tendencies are confirmed when extreme poverty conditions are
considered. Very poor individuals (with per capita average family income inferior to ½
minimum wage) tend to have networks with less varied sociability (lower number of
7 It is interesting to add that this effect is also very clear on the egocentered social support networks. See Marques and Bichir (2010).

12
spheres), less clusterization, and larger diameters (for the same average size, which
means less connectivity), a sociability that is more based on neighborhood and less
on work, as well as larger localism. The poorest among the poor (with per capita
average family income inferior to ¼ minimum wages) have less clustered networks
with larger diameters and, their sociability includes more neighbors.
4. Types of Networks and Sociability
As presented in the last section, the networks in both cities showed a great
diversity of patterns and significant variability in terms of size, sociability spheres, and
localism, among other dimensions. The univariate analysis suggested the existence
of associations between network characteristics and social attributes. But since
several of these elements are correlated, it is difficult to come to conclusions about
the elements that influence networks. Therefore, a decision was made to explore
their variability by means of a certain typology, following the strategy developed by
Marques (forthcoming).
In order to classify these networks, two complementary cluster analyses were
conducted. Firstly, they were classified by taking into consideration several network
measures currently used by the network analysis literature. Secondly, networks were
classified according to their sociability profiles, considering the relative distribution of
nodes in different spheres of sociability: family, neighbors, friends, work, religiosity,
leisure, and civil association. While the first typology aims at exploring the main
structural characteristics of the networks, the second one provides information on
how they are differently mobilized in everyday life.
This section presents first the types of networks and then the types of
sociability. In the last part, the two typologies are combined in order to explore the
different relational settings, illustrating them with actual cases from São Paulo and
Salvador.
4.1. Types of Networks
With the purpose of analyzing and classifying the heterogeneity of personal
networks in the two cities, 362 networks8 were submitted to a cluster analysis based
on several social network analysis measures: number of nodes, number of ties,
8 We have 209 cases with complete relational information in São Paulo and 152 in Salvador.

13
diameter, average degree, centralization, clustering coefficient, E-I indexes, n-clans,
betweenness, information, structural holes, number of contexts, and number of
spheres.9 The automatic solution of this analysis generated six groups, which were
reclassified into five main types of networks, varying especially in terms of size –
number of nodes and ties. The average number of spheres decreases slightly from
large to small networks. Localism presents a similar level in the two first types,
around 68%, as well in the third and fifth types, although slightly higher – 73%. The
fourth type of networks, medium to small, presents much smaller localism and has
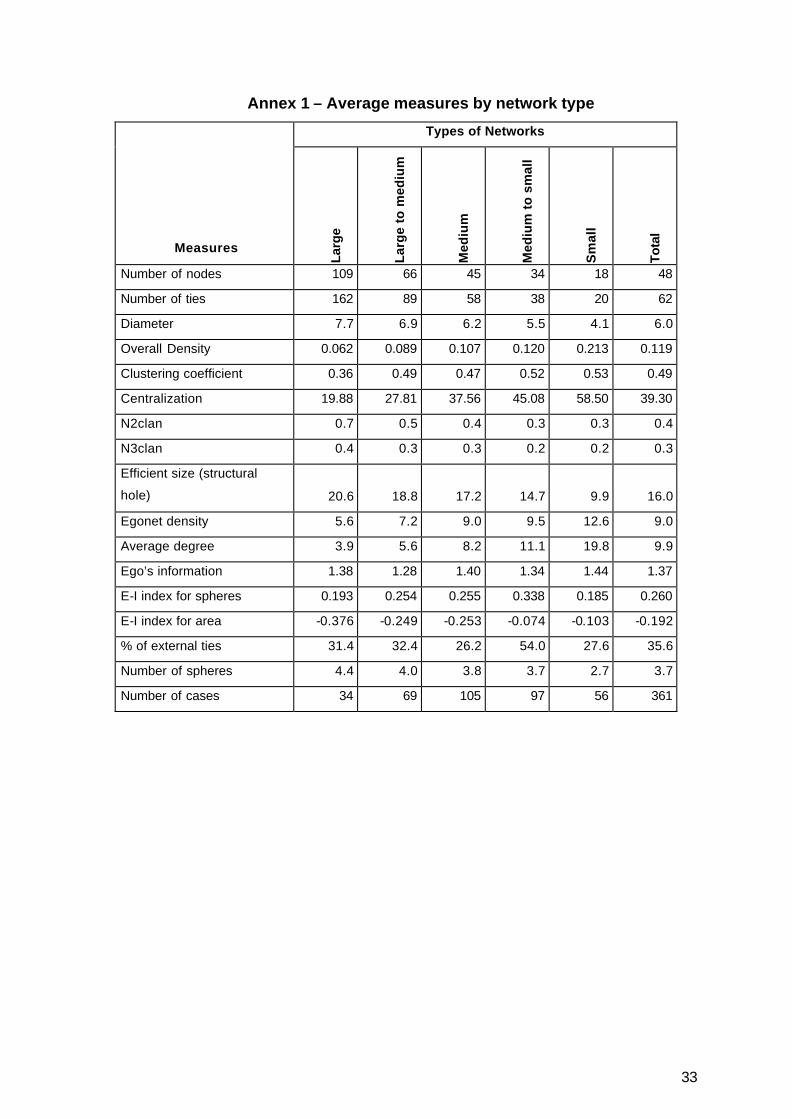
only 46% of internal ties. Graph 1, below, shows these main characteristics, while the
complete description of the groups is presented in Annex 1.
Graph 1. Size, Localism and Spheres of Sociability According to Type of
Network
Source: Author’s elaboration based on empirical data collected.
The following table presents the distribution of network types by city. As can
be seen in the first rows, the distribution in each city is quite similar, although São
9 All these measures were subjected to a cluster analysis in the software SPSS 13.0, using the K-means algorithm. For details about the measure, see Wasserman and Faust (1994).

14
Paulo presents a slightly higher concentration of small networks, while Salvador
presents a slightly higher concentration of larger networks. The table also indicates
that midsized networks tend to be more common, although the distribution is skewed
in the direction of the smaller networks.
Table 1. Types of Networks, According to Cities
Types of Networks
Large
Large to
medium Medium
Medium
to small Small Total
São Paulo 8.6% 18.7% 27.7% 30.2% 14.8% 100.0%
Salvador 10.5% 19.7% 30.9% 22.3% 16.4% 100.0%
Total 9.4% 19.1% 29.1% 26.9% 15.5% 100.0%
# of cases 34 69 105 97 56 361
Source: Authors’ elaboration based on empirical data collected.
As follows, the main aspects of each type of network as briefly presented.
a. Large Networks – 34 Cases
This is the least frequent type of network. Large networks are more common
among men, non-migrants, and single individuals, in addition to those who live in
segregated areas. Individuals with this type of network tend to present higher levels
of education, which is consistent with the higher concentration of students and
youngsters. Employees with formal job registration are overrepresented in this type
of network, as well as individuals who work outside the neighborhood where they live
and people who participate in some kind of civil association. Levels of
precariousness are slightly above the average in this group, especially due to familiar
precariousness and income precariousness – individuals classified in this type of
network have, on the average, lower per capita family income.10 This is consistent
10 There is income precariousness when the average per capita family income is inferior or equal to ¼ minimum wage; there is family precariousness in situations in which a single adult with small children composes the family nucleus; there is housing precariousness when people live in a small shanty house (shack) or in the case of tenements, in a room without bathroom; there is labor precariousness if wages are earned informally, from odd jobs or employment without registration.

15
with the higher levels of access to the main CCT federal welfare program, Bolsa
Família, among people with this kind of network.
b. Large to Medium Networks – 69 Cases
In this type of network women are strongly overrepresented, as well as non
migrants and those who are single. People with higher levels of education –
secondary level – tend to have this kind of network more frequently, but the average
income is slightly below the average in this group. Civil servants, non-formal workers
and the unemployed show this type of network more frequently. Familiar and housing
precariousness are more common among people with large to medium networks.
c. Medium Networks – 105 Cases
This is the most common type of network, representing almost one third of all
personal networks. People with this kind of network have demographic
characteristics – sex, age, schooling, income and migratory status – similar to the
overall average. Married people, housewives, small business owners, and people
who work in the same place where they live are all overrepresented in this group.
Family, work and income precariousness are more common among individuals with
medium networks.
d. Medium to Small Networks – 97 Cases
The medium to small networks are the second most frequent type of network,
classifying 27% of all personal networks. As with the previous type, individuals with
medium to small networks have, on the average, demographic characteristics close
to the overall average, especially considering age (37 years old) and schooling (6.4
years of study). But, considering income, individuals within this group show the
highest one - almost one minimum wage per capita. This type of network is more
frequent among older migrants – more than 10 years in the place of residence –
married individuals, those who work in family businesses, formally employed workers
– including those in domestic services –, and precarious self-employed workers,
working mainly outside the community where they live. Individuals classified in this
type of network present low levels of precariousness, except for housing
precariousness.
16
e. Small Networks – 56 Cases
This is the second least frequent type of network, representing 15% of all
personal networks. Individuals classified in this group show the higher average age -,
41 years of age - and schooling and income below the average score. Men, migrants,
and married people tend to have this type of network more frequently. Small
business owners, retired and unemployed people are also overrepresented in this
group, which concentrates people who work where they live. Family, work, and
income precariousness are more common within this group.
4.2. Types of sociability
Besides classifying personal networks according to their structural
characteristics, they have been clustered according to the most frequent types of
sociability, i.e., the prevalence of the spheres - family, neighborhood, friendship,
church, work, and others - has been examined in the everyday life of poor people in
São Paulo and Salvador. A cluster analysis of the sociability profiles has revealed six
main types of sociability, depending on whether they were centered on the family, on
the neighborhood, on friends, on the church, on the work or on associations. We can
consider the three first types – family, neighborhood and friends – as more primary
and potentially homophilic, while the others – church, work, and association – tend to
be less homophilic and more based on ties constructed inside organizational
settings.
Before presenting each group in detail, it is important to point out that the
presence of the family and of neighborhood is high for the majority of the poor in São
Paulo and Salvador11. However, besides these more primary spheres, important
portions of their sociability are organized by other spheres, leading to the relevance
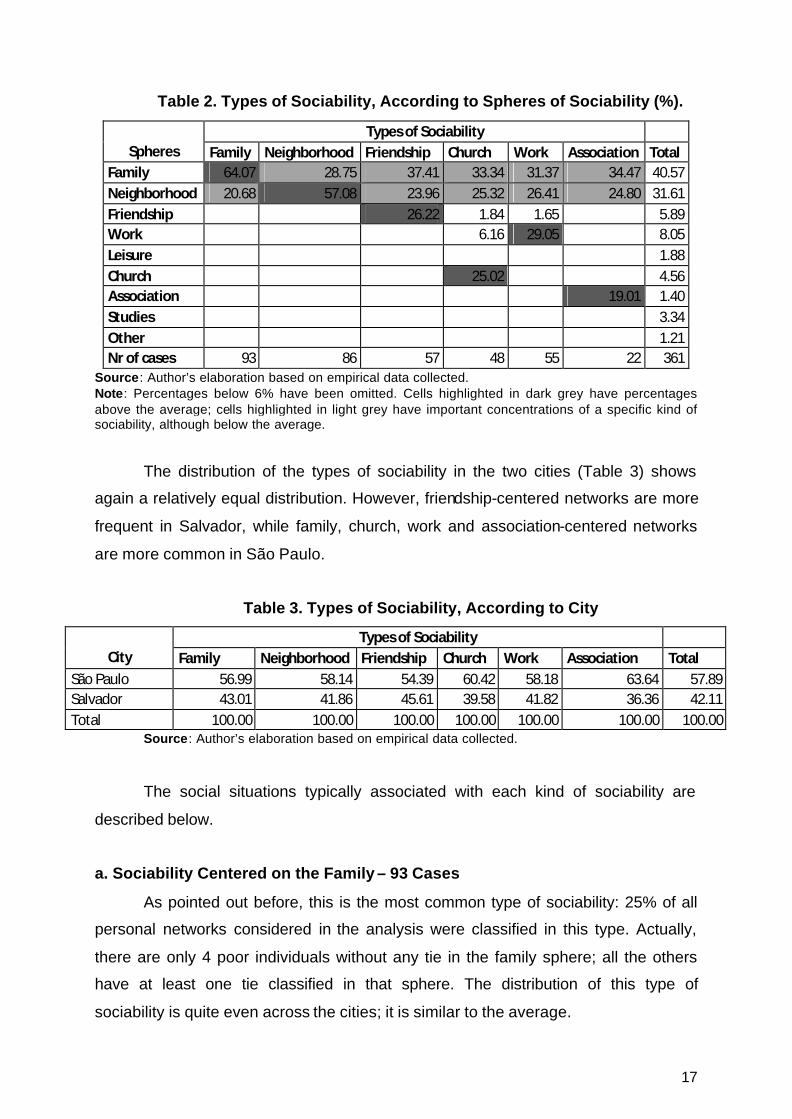
of the six types of sociability presented below. Table 2, below, presents the
distribution of each sphere of sociability across the types of sociability, highlighting
concentrations above the average.
11 This is actually also the case for the family sphere among middle-class people. See Marques (forthcoming).
17
Table 2. Types of Sociability, According to Spheres of Sociability (%).
Types of Sociability Spheres Family Neighborhood Friendship Church Work Association Total
Family 64.07 28.75 37.41 33.34 31.37 34.47 40.57 Neighborhood 20.68 57.08 23.96 25.32 26.41 24.80 31.61 Friendship 26.22 1.84 1.65 5.89 Work 6.16 29.05 8.05 Leisure 1.88 Church 25.02 4.56 Association 19.01 1.40 Studies 3.34 Other 1.21 Nr of cases 93 86 57 48 55 22 361
Source: Author’s elaboration based on empirical data collected. Note: Percentages below 6% have been omitted. Cells highlighted in dark grey have percentages above the average; cells highlighted in light grey have important concentrations of a specific kind of sociability, although below the average.
The distribution of the types of sociability in the two cities (Table 3) shows
again a relatively equal distribution. However, friendship-centered networks are more
frequent in Salvador, while family, church, work and association-centered networks
are more common in São Paulo.
Table 3. Types of Sociability, According to City
Types of Sociability City Family Neighborhood Friendship Church Work Association Total
São Paulo 56.99 58.14 54.39 60.42 58.18 63.64 57.89 Salvador 43.01 41.86 45.61 39.58 41.82 36.36 42.11 Total 100.00 100.00 100.00 100.00 100.00 100.00 100.00
Source: Author’s elaboration based on empirical data collected.
The social situations typically associated with each kind of sociability are
described below.
a. Sociability Centered on the Family – 93 Cases
As pointed out before, this is the most common type of sociability: 25% of all
personal networks considered in the analysis were classified in this type. Actually,
there are only 4 poor individuals without any tie in the family sphere; all the others
have at least one tie classified in that sphere. The distribution of this type of
sociability is quite even across the cities; it is similar to the average.

18
The networks of family-centered individuals tend to be smaller than others,
considering number of spheres, nodes, and ties. Individuals with family-centered
networks have age, schooling and income below the overall average. Women,
migrants, married people, and illiterate people, are overrepresented in this type, as
are housewives, retired, and unemployed people. Catholics and people with no civil
participation are more common among those with family-centered networks.
Individuals with this pattern of sociability are less exposed to all kinds of
precariousness, but have more access than the average to CCT welfare transfers.
b. Sociability Centered on the Neighborhood – 86 Cases
This is the second most frequent type of sociability, classifying 24% of all poor
personal networks; only 23 poor individuals – out of 361 considered – do not have
any tie in the neighborhood. There is no difference between São Paulo and Salvador
considering the distribution of this type of sociability.
Individuals with neighborhood-centered sociability show average, age,
schooling and income below the average age – better levels of education and worse
income when compared with family-centered individuals. Their networks show
average number of spheres and are bigger than the average considering numbers of
nodes and ties, and present the highest level of localism, as expected. Several
demographic characteristics – sex, migratory status – are similar to the average.
Single men, precarious self-employed workers, unemployed people, and people who
work inside their communities are over-represented in this type of sociability. The
same is true for beneficiaries of CCT programs and those who never attend worship
or civil associations. Neighborhood-centered individuals are more exposed to
housing, income, and job precariousness, and this type of sociability is more frequent
in segregated areas.
c. Sociability Centered on Friendship – 57 Cases
Individuals with friendship-centered sociability represent 16% of all personal
networks of poor people. This type of sociability is slightly more frequent in Salvador
than in São Paulo.
Individuals with this pattern of sociability are the youngest ones, and present
better level of schooling and income than the average. Their networks are a little
19
bigger than the average, taking into consideration the number of spheres, nodes, and
ties. Women, non migrants and those who are single are overrepresented in this type
of sociability, as well as students, housewives, public employees, and those who
work in the same neighborhood where they live. Individuals with this pattern of
sociability are less exposed to all kinds of precariousness and tend to live in non-
segregated neighborhoods.
d. Sociability Centered on the Church – 48 Cases
Sociability centered on any kind of religious congregation represents 13% of
all cases. It is important to highlight that, in Brazil, it is quite common to profess some
religion, even though many individuals hardly ever – or never – attend any kind of
worship. In this sense, this type of sociability selects people who, besides professing
a religion, have an active involvement in religious activities and have ties with people
who have the same religion and/or attend the same worship. This type of sociability
is more frequent in São Paulo than in Salvador.
Individuals with this pattern of sociability have age, schooling and income
levels similar to the average, but their networks are bigger than the average when
taking into consideration the number of spheres, nodes, and ties. Women, old
migrants, and married people present this type of sociability more frequently. This
pattern of sociability is also present in more common among housewives, retired
people, people with formal jobs, and those who work outside their neighborhood. As
expected, evangelicals who attend worship on a weekly basis are much more
common in this type of sociability, as well as people who participate in other civil
associations. Family precariousness is above the average, but all other types of
precariousness are below the average. This pattern of sociability is more present in
segregated areas.
e. Sociability Centered on Work – 55 Cases
As described in previous sections, most of the poor people in our sample work
– regardless of the level of protection of the job – or are looking for jobs. But a small
portion of all of them – 15% – actually have sociability patterns rich in people whom
they work with. The distribution of this pattern of sociability is similar in both cities.

20
As expected, people with work-centered sociability show better levels of
income (the highest one) and schooling, besides average age. Their networks
present the lowest level of localism – few internal ties –, a number of spheres higher
than the average, and a number of nodes and ties similar to the average. Men, non-
migrants, and married people are overrepresented in this type of sociability. The
same is true for small business owners, those who work in family businesses,
formally employed workers, public employees, workers without legal protection, and
those who work outside their neighborhoods. Catholics who do not attend worship
and those who have no participation in civil associations are also overrepresented in
this group. Individuals with this pattern of sociability are almost not exposed to any
kind of precariousness.
f. Sociability Centered on Associations – 22 Cases
This is the least frequent type of sociability, representing only 6% of all
personal networks of poor people. We have seen in previous sections that the
percentage of poor people who actually participate in any kind of civil association,
neighborhood association, political party or any other, is low. Now we know that
having ties inside this kind of association is even rarer. This type of sociability is
much more frequent in São Paulo than in Salvador.
Individuals with this pattern of sociability have average age and schooling
above the average, but income below the average. The number of spheres and
nodes are above the average, but the number of ties is below the average. Men,
single people, those who work inside their neighborhood, workers without formal
registration, precarious self-employed workers, and unemployed individuals are
overrepresented in this type of sociability. As expected, those who attend any kind of
civil association are highly overrepresented in this group, but the same is not true
when taking into consideration attendance of religious services. Individuals with this
pattern of sociability are more exposed to all kinds of precariousness.
4.3. Main Relational Situations
The combination of the two typologies provides interesting information for the
analysis of the networks of poor individuals in the two cities. Although theoretically
there were 30 possible combinations (5x6), only some combinations appeared

21
frequently. We decided to highlight four combinations, which ended up in the
classification of 92.5% of all personal networks:
a) Primary sociability within small networks
b) Primary sociability within medium networks
c) Primary sociability within large networks
d) Institutional sociability within medium networks
It is important to state that there was no significant number of cases of
institutional sociability – focused on church, work or association – within small or
large networks. While the first three types – primary sociability with small, medium or
large networks – tend to be associated with worse socioeconomic conditions, the last
one, institutional mid-size networks, tends to be associated with better social
conditions and attributes. Examples from São Paulo and Salvador that illustrate each
of these relational situations are presented below.
a) Primary Sociability within Small Networks – 101 Cases
Case Number 76, from Taboão, São Paulo, illustrates this relational situation.
She is a 21year-old, non migrant young lady, married with someone who was her
neighbor, who has finished high school education. She is now a housewife, having a
per capita family income of only ¼ of the minimum wage. Her network has 19 nodes,
21 ties and 3 spheres of sociability: family, neighborhood and friendship.

22
Figure 1. Case 76, São Paulo
Source: Authors’ elaboration based on empirical data collected. Legend: Ego in black, family in red, neighborhood in blue, work in green, church in yellow, studies in grey, leisure in pink, friendship in light blue, association in white and other spheres in orange.
Case Number 379 from the Bairro da Paz in Salvador gives us another
illustration. She is 23 years old, a native of Salvador, and has been living in this very
segregated neighborhood for all her life. She is married, has 2 sons, and is currently
unemployed – she used to work as a domestic worker – earning a per capita family
income of only ¼ of the minimum wage. Her network has 14 nodes, 17 ties, and only
2 spheres of sociability: family and neighborhood.

23
Figure 2. Case 379, Salvador
Source: Authors’ elaboration based on empirical data collected. Legend: Ego in black, family in red, neighborhood in blue, work in green, church in yellow, studies in grey, leisure in pink, friendship in light blue, association in white and other spheres in orange.
b) Primary sociability within medium networks – 72 cases
Case Number 121, from Paraisópolis, São Paulo, illustrates this type of
network and sociability. He is a 52-year-old man who migrated from Alagoas more
than 10 years ago. He has finished only the basic education and is currently formally
employed as a gardener for high middle-class houses near the slum where he lives.
His network has 40 nodes, 54 ties, and 4 spheres: family, neighborhood, friendship,
and work.

24
Figure 3. Case 121, São Paulo
Source: Authors’ elaboration based on empirical data collected.
Legend: Ego in black, family in red, neighborhood in blue, work in green, church in yellow, studies
in grey, leisure in pink, friendship in light blue, association in white and other spheres in orange.
Another example is given by Case Number 293, from Novos Alagados,
Salvador. She is 37 years old, a native from Salvador, and has been living in this
segregated neighborhood for all her life. She is single and lives with her sister and
three nephews, working at her own house as a manicurist. They are also on the
family welfare program known as Bolsa Família, but even so their per capita family
income is 0.4 minimum wages. She is evangelical and every single day attends
worship in her neighborhood. Her network has 43 nodes, 69 ties, and 4 spheres:
family, friendship, work and church.

25
Figure 4. Case 293, Salvador
Source: Authors’ elaboration based on empirical data collected. Legend: Ego in black, family in red, neighborhood in blue, work in green, church in yellow, studies in grey, leisure in pink, friendship in light blue, association in white and other spheres in orange.
c) Primary Sociability within Large Networks – 63 Cases
Case Number 75, a 13-year-old girl born in Bahia but who has been living in
São Paulo (Vila Nova Esperança) for the last 2 years is an example of this situation
in São Paulo. Her parents are still in the Northeast, and she lives with her older
sister, helping her to take care of her little baby. She studies in the same
neighborhood where she lives and has many friends, several of them from a Catholic
association, although she professes no religion. Her personal network shows 68
nodes, 66 ties and 4 spheres: family, neighborhood, study, and church association.

26
Figure 5. Case 75, São Paulo
Source: Authors’ elaboration based on empirical data collected. Legend: Ego in black, family in red, neighborhood in blue, work in green, church in yellow, studies in grey, leisure in pink, friendship in light blue, association in white and other spheres in orange.
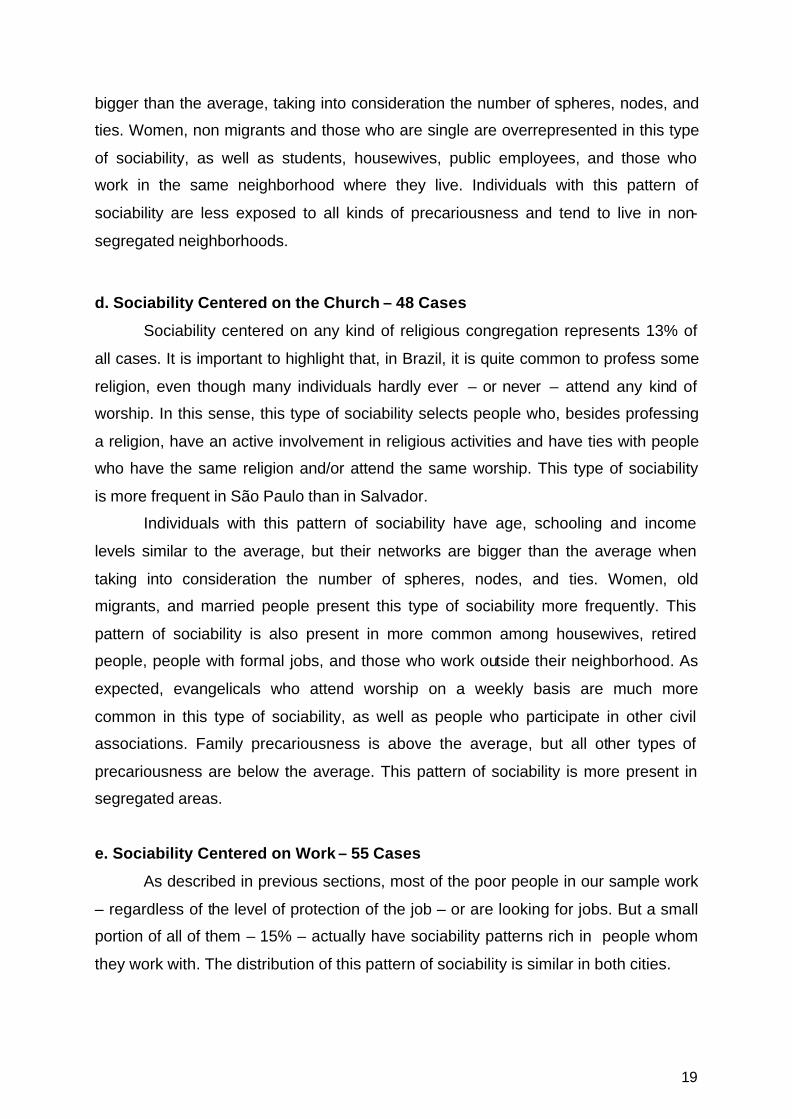
On average, her relational situation is similar to Case Number 326 from
Liberdade, Salvador. He is a 51-year-old small businessman born in Ceará, although
he has been living in Salvador for many decades. He has little formal education and
is the typical self-made-man who came from nowhere and now runs his own
business, employing fellow countrymen and making money. He and his wife chose to
have only one child in order to give the child all the best and avoid poverty. His
network has 67 nodes, 128 ties, and 3 spheres: family, neighborhood, and friendship.
27
Figure 6. Case 326, Salvador
Source: Authors’ elaboration based on empirical data collected. Legend: Ego in black, family in red, neighborhood in blue, work in green, church in yellow, studies in grey, leisure in pink, friendship in light blue, association in white and other spheres in orange.
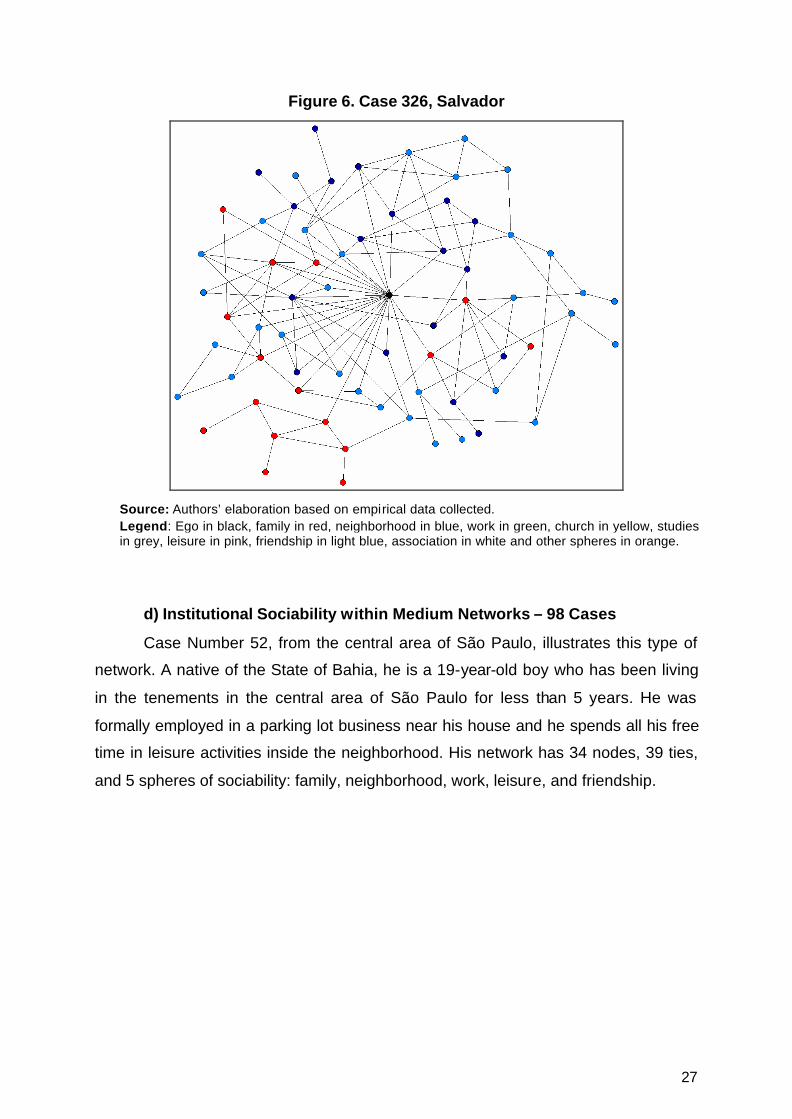
d) Institutional Sociability within Medium Networks – 98 Cases
Case Number 52, from the central area of São Paulo, illustrates this type of
network. A native of the State of Bahia, he is a 19-year-old boy who has been living
in the tenements in the central area of São Paulo for less than 5 years. He was
formally employed in a parking lot business near his house and he spends all his free
time in leisure activities inside the neighborhood. His network has 34 nodes, 39 ties,
and 5 spheres of sociability: family, neighborhood, work, leisure, and friendship.

28
Figure 7. Case 52, São Paulo
Source: Authors’ elaboration based on empirical data collected. Legend: Ego in black, family in red, neighborhood in blue, work in green, church in yellow, studies in grey, leisure in pink, friendship in light blue, association in white and other spheres in orange.
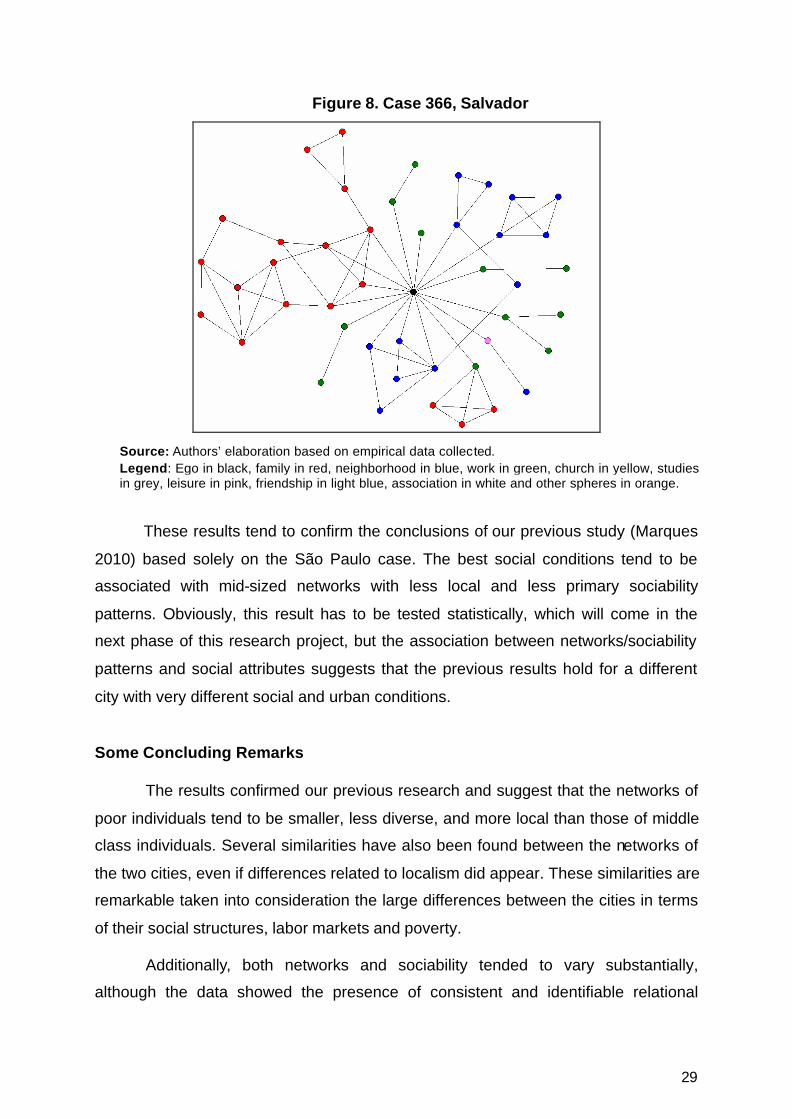
Another illustration comes from Case Number 366, who lives in the historical
area of downtown Salvador. He is a 39-year-old man from Salvador who lives in a
tenement in the downtown area, where he owns a small bar, earning 2.6 per capita
minimum wages. His network has 45 nodes, 72 ties, and 4 spheres of sociability:
family, neighborhood, work, and leisure.
29
Figure 8. Case 366, Salvador
Source: Authors’ elaboration based on empirical data collected. Legend: Ego in black, family in red, neighborhood in blue, work in green, church in yellow, studies in grey, leisure in pink, friendship in light blue, association in white and other spheres in orange.
These results tend to confirm the conclusions of our previous study (Marques
2010) based solely on the São Paulo case. The best social conditions tend to be
associated with mid-sized networks with less local and less primary sociability
patterns. Obviously, this result has to be tested statistically, which will come in the
next phase of this research project, but the association between networks/sociability
patterns and social attributes suggests that the previous results hold for a different
city with very different social and urban conditions.
Some Concluding Remarks
The results confirmed our previous research and suggest that the networks of
poor individuals tend to be smaller, less diverse, and more local than those of middle
class individuals. Several similarities have also been found between the networks of
the two cities, even if differences related to localism did appear. These similarities are
remarkable taken into consideration the large differences between the cities in terms
of their social structures, labor markets and poverty.
Additionally, both networks and sociability tended to vary substantially,
although the data showed the presence of consistent and identifiable relational
30
patterns present in the two cities. These patterns tend to be associated with social
attributes, suggesting that networks and sociability are really connected to living
conditions and poverty, although in multiple causality chains. The key elements that
discriminate situations are apparently localism and homophily, mediating the access
to different goods and services, both in markets and through social support.
Needless to say that the concentration of the less homophilic networks in the socially
better-positioned individuals tends to reinforce social inequalities and reproduce the
mechanisms that drive poverty.
References
Auyero, J. “’This is a lot like the Bronx, isn’t it?’ Lived experiences of marginality in an
Argentine slum ”. International Journal of Urban and Regional Research, Vol 23
(1): 45-69, 1999.
Blokland, T. Urban Bonds. London, Basil Blackwell, 2003.
Blokland, T. and Savage, M.. Networked urbanism: social capital in the city. London:
Ashgate Ed., 2008.
Bonduki, N. & Rolnik, R. “Periferia da Grande São Paulo – Reprodução do espaço como expediente de reprodução da força de trabalho”. In: MARICATO, E. A produção capitalista da casa e da cidade no Brasil industrial. 2. ed. São Paulo, Editora Alfa-Ômega, 1982.
Briggs, X. “Social capital and segregation in the United States”. In: VARADY, D.
Desegregating the city. Albany, Suny Press, 2005.
Briggs, X. Bridging networks, social capital and racial segregation in America.
Cambridge, KSG Faculty Research Working Paper Series, 2003.
Briggs, X. (ed). The Geography of opportunity Race and Housing Choice in
Metropolitan America. Brookings Institution Press, 2005.
CEM. Mapa da Vulnerabilidade Social da População da Cidade de São Paulo. São
Paulo, CEM/Cebrap; SAS/PMSP; SESC, 2004.
Degenne, A. “Tipos de interacciones, formas de confiança y relaciones”. Redes –
Revista hispana para el análisis de redes sociales, Vol. 16 (3), 2009: 63-91.
Emirbayer, M. “Manifesto for a relational sociology”. American Journal of Sociology,
103 (2): 231-317, 1997.

31
Fawax, M. “An unusual clique of city-makers: social networks in the production of a
neighborhood in Beirut (1950-75)”. International Journal of Urban and Regional
Research, Vol 32 (3): 565-585.
Freeman, L. The development of social network analysis. Vancouver, Empirical
Press, 2004.
Gonzalez de la Rocha, M. “From the resources of poverty to the poverty of
resources? The erosion of a survival model.” Latin American Perspectives, Vol.
28 (4):72-1000, 2001.
Jariego, I. “A general typology of the personal networks of immigrants with less than
10 years living in Spain”. Paper presented a the XXIII Sunbelt Conference,
2003.
Kowarick, L. Espoliação urbana. Rio de Janeiro: Paz e Terra, 1979.
Kowarick, L.. Viver em risco. São Paulo, Ed. 34, 2009.
Lago, L. Desigualdades e segregação na metrópole: o Rio de Janeiro em tempo de
crise. 1. ed. Rio de Janeiro: Revan/Observatório-IPPUR/UFRJ-FASE, 2000.
Lin, Nan. “Building a network theory of social capital”. Connections, vol. 22(1): 28-51,
1999a.
Marques, E. Redes sociais, segregação e pobreza em São Paulo. São Paulo: Ed.
Unesp/Sesc/CEM, forthcoming.
Marques, E. ¿Como son las redes de los individuos en situación de pobreza en el
Brasil urbano? Redes - Revista hispana de redes sociales, No 18, 2010.
Marques, E. As redes importam para o acesso a bens e serviços obtidos fora de
mercados? Revista Brasileira de Ciências Sociais, Vol 24 (71), 2009b.
Marques, E. As Redes Sociais Importam para a Pobreza Urbana? Revista Dados,
No 52, 2009a.
Marques, E. and Bichir, R. Redes de apoio social no Rio de Janeiro e em São Paulo.
São Paulo: CEM, unpublished manuscript, 2010.
Mingione, E. “Life strategies and social economies in the postfordist age”
International Journal of Urban and Regional Research, Vol. 18 (1): 24-45, 1994.
McPherson, M.; Smith-Lovin, L. and Cook, J. “Birds of a feather: homophily in social
networks”. Annual Review of Sociology, 27: 415-444, 2001.
Moore, G. “Structural determinants of men’s and women’s personal networks”.
American Sociological Review, vol. 55: 726-35, 1990.

32
Mustered, S.; Murie, A. and Kestellot, C. Neighborhoods of poverty: urban social
exclusion and integration in Europe. London: Palgrave Ed. 2006.
Pamuk, A. “Informal institutional arrangements in credit, land markets and
infrastructure delivery in Trinidad”. International Journal of Urban and Regional
Research, Vol. 24 (2), 2000.
Roy, A. “Urban informality: towards an epistemology of planning”. Journal of the
American Planning Association, Vol. 71 (2): 147-158, 2005.
Telles, V. and Cabannes, R. Nas tramas da cidade. São Paulo: Ed. Humanitas,
2006.
Wacquant, L. Urban Outcasts: a comparative sociology of advanced marginality.
Cambridge: Polity Press, 2007.
Wasserman, S. e Faust, K. Social Network Analysis: Methods and Applications.
Cambridge: Cambridge University Press, 1994.
Wilson, W. The truly disadvantage: the inner city, the underclass and public policy.
Chicago: University Chicago Press, 1987.
33
Annex 1 – Average measures by network type
Types of Networks
Measures
Larg
e
Lar
ge
to m
ediu
m
Med
ium
Med
ium
to
sm
all
Sm
all
Tota
l
Number of nodes 109 66 45 34 18 48
Number of ties 162 89 58 38 20 62
Diameter 7.7 6.9 6.2 5.5 4.1 6.0
Overall Density 0.062 0.089 0.107 0.120 0.213 0.119
Clustering coefficient 0.36 0.49 0.47 0.52 0.53 0.49
Centralization 19.88 27.81 37.56 45.08 58.50 39.30
N2clan 0.7 0.5 0.4 0.3 0.3 0.4
N3clan 0.4 0.3 0.3 0.2 0.2 0.3
Efficient size (structural
hole) 20.6 18.8 17.2 14.7 9.9 16.0
Egonet density 5.6 7.2 9.0 9.5 12.6 9.0
Average degree 3.9 5.6 8.2 11.1 19.8 9.9
Ego’s information 1.38 1.28 1.40 1.34 1.44 1.37
E-I index for spheres 0.193 0.254 0.255 0.338 0.185 0.260
E-I index for area -0.376 -0.249 -0.253 -0.074 -0.103 -0.192
% of external ties 31.4 32.4 26.2 54.0 27.6 35.6
Number of spheres 4.4 4.0 3.8 3.7 2.7 3.7
Number of cases 34 69 105 97 56 361

www.centrodametropole.org.br