social precarity and social integration
TRANSCRIPT

Social Precarity and SocialIntegration
Report for the European CommissionBased on
Eurobarometer 56.1
October 2002

Social Precarity and Social Integration
Report written byDuncan Gallie and Serge Paugam
For the European CommissionDirectorate-General Employment
Eurobarometer 56.1
October 2002
This document does not reflect the views of the European Commission.Any interpretations or opinions expressed in this report are those of the authors alone.
The opinion poll, managed and organised by Directorate-General Press and Communication,was carried out at the request of Directorate-General Employment and Social Affairs, Unit E2Social Protection and Inclusion Policies.
It was carried out in all European member states, between September 17 and October 26 2001,under the overall co-ordination of INRA (Europe) – E.C.O., on behalf of the European OpinionResearch Group, located in Brussels.
Contact:Directorate-General Press and Communication Telephone: (32.2) 296.24.63Rue de la Loi 200 (BREY – 7/150) Fax: (32.2) 296.17.49B – 1049 Brussels E-mail: [email protected]: http://europa.eu.int/comm/public_opinionReproduction is authorised, except for commercial purposes, provided the source is acknowledged

Preface
Combating poverty and social exclusion ceased to be an exclusively national concern in 2001when the European Council of Nice endorsed the proposal of a strengthened coordinationprocess based on common objectives, National Action Plans and commonly agreed indicators.
Since then, the process has moved forward quickly. The Commission and the Member Stateshave been fully committed to the implementation of the new open method of coordination.Following the submission of National Action Plans by all Member States in June 2001, theCommission examined the plans and made public its conclusions. Drawing on this analysis, aJoint Report on Social Inclusion was endorsed by the European Council of Laeken in December2001. An expert group set up under the auspices of the Social Protection Committee in 2001, setout a list of common indicators on social inclusion, which was subsequently adopted by theCouncil and submitted to the Laeken summit. The Council and the Parliament adopted the firstCommunity action programme to encourage coordination in the fight against social exclusion.This is helping to improve policy analysis, the use of statistics, the exchange of good practiceand the promotion of networking across Europe among NGOs active in fighting poverty andsocial exclusion.
This study is based on a Eurobarometer survey carried out in the autumn of 2001. It shows thatwhile in most EU Member States more traditional forms of poverty have been contained to alarge extent by the development of social protection systems, more recent forms of poverty andsocial exclusion pose new challenges for social justice. Such new challenges can be associatedwith increasing precarity in employment, new household structures, drug addiction,immigration and ethnic diversity. They can also be associated with the widening gap betweenthose who have the necessary skills to participate in a knowledge-based society, and those whoeither lack the skills or encounter difficulties in adapting. Hence creating a digital divide.
Duncan Gallie and Serge Paugam have prepared this report in a thought-provoking way. Thesurvey charts include key drivers of social exclusion such as insufficient income,unemployment, lack of social support and low quality of jobs. While a general improvement inthe proportion of people suffering from financial difficulty during the 1990s is to be welcomed,the results also reveal increased difficulties for the poor in making ends meet, and a lesssympathetic interpretation of poverty by the general public. The study then looks at issuesrelating to precarity, in terms of living conditions and job quality, and examines theimplications of social precarity for people’s personal integration and their attitudes to society.
The new challenges brought about by precarity appear to be common to all EU Member States.But, in parallel with social exclusion patterns, they vary strongly between country and regionand in particular, between Northern and Southern countries. The implications of precarity inwider attitudes to society, to democracy and to welfare state provision, signal the need for socialcohesion strategies effective enough to prevent precarity. The results deserve careful attention. Iam convinced that the report will be extremely useful to national authorities, as well as otherstakeholders, as they prepare the next round of National Action Plans to develop effectivepolicy responses to combat poverty and social exclusion.
Odile QuintinDirector General of DG Employment and Social Affairs

Table of Contents
Summary i
Chapter 1
Introduction 1
Chapter 2
The Evolution and Social Representation of Poverty 9
Chapter 3
Precarity of Living Conditions: The Experience of Poverty andSocial Isolation 30
Chapter 4
Work Precarity : Task Quality and Work Pressure 62
Chapter 5
Work Precarity: Skill Development and Job Security 75
Chapter 6
Social Precarity and Personal Integration 98
Chapter 7
Social Precarity and Attitudes to Society and the Welfare State 111
Chapter 8
Conclusion 127
Technical Annex 1 Data Analysis 131
Technical Annex 2 Response Rates 133
Reference List 134
Questionnaire 135

SOCIAL PRECARITY AND SOCIAL INTEGRATIONTHE EUROPEAN OPINION RESEARCH GROUP EEIG
EUROBAROMETER 56.1. – OCTOBER 2002 Page i
SOCIAL PRECARITY AND SOCIAL INTEGRATION
SUMMARY
The report is concerned with charting trends in social precarity, that is the factors thatare associated with higher risks of social exclusion. It draws upon a survey speciallycommissioned by DG Employment and conducted with the framework of theEurobarometer studies (Eurobarometer, 56.1), which allows for comparison with arange of earlier studies.
The first two chapters focus particularly on issues relating to precarity in terms ofliving conditions, while the third and fourth are concerned with sources of precarity inpeople’s work lives. The fifth and sixth chapters examine the implications of socialprecarity in both of these spheres for people’s personal integration and their attitudesto society.
Chapter 2. The Evolution and Social Representation of Poverty
A measure of subjective poverty (based on whether people’s total net income is lowerthan the amount they judge absolutely necessary) showed that the proportion ofindividuals in poor households was greatest in Southern Europe (especially Portugal,Greece and Italy), and in Ireland. The inter-country differences are more marked thanthose that emerge from objective poverty indicators. For instance, 66% of individualsin Portugal were poor on the subjective measure compared with only 9% in Denmark– the country with the lowest level of subjective poverty.
The visibility of poverty in the local neighbourhood has varied markedly with theeconomic cycle. It rose sharply in all countries other than Italy between 1989 and1993 and then declined in all countries other than the Netherlands between 1993 and2001.
There were major country variations in the visibility of local poverty. It was mostvisible in Portugal and Greece, where approximately 50% of the population reportedits presence in their local neighbourhood; it was least visible in Denmark where it wasreported by less than 10%.
There were also strong inter-country variations in attributions of the causes ofpoverty. The proportions that viewed poverty as the results of the characteristics ofindividuals were highest in Portugal (48%), Denmark (47%), the United Kingdom(43%) and Ireland (41%). In contrast, social explanations of poverty werepredominant in Sweden and East Germany (69%), Finland (66%), France and WestGermany (59%).

SOCIAL PRECARITY AND SOCIAL INTEGRATIONTHE EUROPEAN OPINION RESEARCH GROUP EEIG
EUROBAROMETER 56.1. – OCTOBER 2002 Page ii
Poverty attributions were strongly affected by the economic cycle. In the majority ofthe Northern and Central countries of the EU (and in Spain), there was a markeddecline of explanations in terms of individual laziness between 1989 and 1993 aseconomic conditions deteriorated, followed by an increase between 1993 and 2001when economic conditions improved. Conversely, in most countries (9 out of 11)explanations in terms of social injustice were most frequent in 1993, and had declinedby 2001. The analyses showed that unemployment levels were a strong predictor ofpeople’s interpretations of the causes of poverty.
Those in the Southern countries of the EU were notably more likely to view povertyas an inherited condition: 53% of people in Greece and Portugal and 46% in Italy andSpain believed that the poor had always been in the same situation. In contrast, withthe exception of Ireland and Great Britain, the most common view in the Northernand Central countries of the EU was that people fell into poverty after someunfavourable life event.
Views about the inherited or conjunctural nature of poverty were also affected by theeconomic cycle. The period between 1989 and 1993 saw a rise in all countries ofexplanations of shorter-term adverse circumstances, reflecting the sharp rise inunemployment. But such explanations had declined by 2001 in all countries (exceptEast Germany and Italy) with the improvement in economic conditions. The level ofunemployment was a particularly important factor accounting for the extent to whichunemployment was viewed as inherited or conjunctural.
Chapter 3. Precarity of Living Conditions: the Experience of Poverty and SocialIsolation
There has been a general reduction since 1993 in the proportion of people directlyexperiencing financial difficulty. The only exceptions are Portugal and theNetherlands. Moreover, the level of experienced financial difficulty remains very highin Greece and Portugal where it affects more than 50% of the population.
As with the population as a whole, financial difficulty has, in most countries, beenreduced among those in the poorest income quartile. The exceptions are theNetherlands, Greece, Portugal and Italy.
There are very considerable country variations in the experience of financial difficultyamong those with low incomes, ranging from approximately a quarter of those in thelowest income quartile in Denmark to around 80% of those in the lowest incomequartile in Greece and Portugal.
While there had been a reduction or stabilisation since 1993 in difficulties in meetinghousing expenses for the overall population of most countries, it was notable thatthere had been an increase in most countries in the difficulties encountered by those inthe lowest income quartile.
The unemployed experienced significantly greater difficulties in covering both foodand housing expenses.

SOCIAL PRECARITY AND SOCIAL INTEGRATIONTHE EUROPEAN OPINION RESEARCH GROUP EEIG
EUROBAROMETER 56.1. – OCTOBER 2002 Page iii
There are marked differences in the duration of poverty experiences between theNorthern and Southern countries. In the former the majority of those affected bypoverty report a duration of two or three years, whereas in the latter the most commonexperience is about fourteen or fifteen years. This points to the conjunctural nature ofpoverty in the northern countries, compared with its structural character in theSouthern countries.
The probability of adults experiencing financial difficulties is considerably greateramong those who spent their childhood in an economically disadvantaged milieu.This inheritance effect is particularly strong in the southern countries.
Social support in the sense of the availability of people that can be relied upon insituations of personal difficulty increased for the bulk of the population in mostEuropean countries between 1996 and 2001. However, in all countries other thanItaly, it decreased over the same period for the poorest income quartile.
In the Southern countries, with the exception of Portugal, sociability tends to behigher for those with low incomes, while the inverse is the case in the northerncountries. There is then no systematic relationship between poverty and the frequencyof social contacts.
However, subjective social isolation is greater for the poor in all countries, indicatingthat frequency measures of social isolation fail to capture important qualitativedifferences in the character of networks. Those in the lowest quartile income groupare also more likely to feel that others do not value them.
The unemployed do not have lower levels of sociability than those in work, but theyfeel significantly more isolated. This is the case even when income has beencontrolled. Social isolation is also greater in cities and large towns.
The view that the poor have qualitatively different networks is reinforced by the factthat a much higher proportion of friends are unemployed (and are therefore poorlyplaced to offer significant support). The polarisation of networks between those inlowest income quartile and others is particularly marked in Belgium, West Germany,Great Britain, Ireland, Finland and Austria.
Satisfaction with family life is significantly higher among the general population thanamong those in the lowest income quartile. It increased overall between 1996 and2001, but it decreased for those in the lowest income quartile. The same pattern isevident for satisfaction with social life.
The unemployed are significantly more dissatisfied with both their family and sociallives than those in other employment statuses.
Those in the lowest income quartile tend to live in neighbourhoods with moredisadvantaged local environments on a range of different dimensions.

SOCIAL PRECARITY AND SOCIAL INTEGRATIONTHE EUROPEAN OPINION RESEARCH GROUP EEIG
EUROBAROMETER 56.1. – OCTOBER 2002 Page iv
Chapter 4. Work Precarity: Task Quality and Work Pressure
Poor task quality can be seen as an important long-term risk factor for socialexclusion in that it is likely to reduce commitment to employment and to underminethe maintenance of learning skills. Poor quality tasks, in particular those with low jobcontrol, can also increase people’s vulnerability to ill health from work pressure.
Less than a third of employees in the European Union were in jobs where tasks wereof high quality on measures of variety, opportunities for self-development and taskcontrol.
There was an overall decline in the quality of work tasks for employees between 1996and 2001.
Women were in jobs of poorer task quality than men in both 1996 and 2001.Moreover the decline in quality scores between the years was more marked forwomen than for men (although the difference was only at a marginal level ofstatistical significance).
There were very wide class differences in job quality. However, there was no changein the relative position of the least skilled workers over the period.
Denmark, Finland and Sweden consistently showed distinctively high levels of taskquality in both 1996 and 2001.
In contrast to the trends reported in the first half of the 1990s, there was an overalldecline in the proportion of employees experiencing a high level of work pressurebetween 1996 and 2001. However, taking account of compositional effects, thedecline in work pressure was only statistically significant in two countries: France andGermany.
Employees in Great Britain and Sweden experienced distinctively high levels of workpressure in both years, the Netherlands and Luxembourg distinctively low levels.
Work pressure was highly correlated with skill level. Those in more skilledoccupations reported higher levels of pressure. However, there was no changebetween the years in the relative work pressure experienced by employees in differentoccupational classes.
Overall, with respect to both task quality and work pressure, there was little progressover these years in reducing the exclusionary risks of jobs. Indeed, the decline in taskquality is likely to have made them greater especially for the low-skilled, given itsnegative implications for both employment commitment and work motivation asshown in Chapter 6.

SOCIAL PRECARITY AND SOCIAL INTEGRATIONTHE EUROPEAN OPINION RESEARCH GROUP EEIG
EUROBAROMETER 56.1. – OCTOBER 2002 Page v
Chapter 5. Work Precarity: Skill Development and Job Security
Jobs with opportunities for skill development help to reduce the risks of socialexclusion by making it possible for people to keep up with technological change andincrease their labour market power in periods of economic restructuring. The findingsshow no improvement over the period with respect to skill development and adeterioration in the position of the low-skilled.
While the proportions of employees in more highly skilled occupations continued toincrease slightly from the mid-1990s, the pace of upskilling appears to have sloweddown. In both 1996 and 2001, employees were more likely to have been upskilledthan deskilled, but the proportion of employees who had experienced an upgrading ofeither the skill or the responsibility of their jobs in the previous five years was lowerin 2001 than it had been in 1996.
Those in elementary occupations were particularly unlikely to have experienced anincrease in the skill and responsibility requirements of their jobs. Less than a quarterhad seen any upgrading of their job requirements in the five years prior to 2001. Boththe absolute and the relative position of those in elementary occupations deterioratedsignificantly between the two years.
In both 1996 and 2001, over half of all employees had not received any training froman employer in the preceding five years. But there was a small (but statisticallysignificant) improvement between the years in the amount of employer training given,with the proportion without training falling from 59% in 1996 to 55% in 2001.
Only a small proportion of employees had received training lasting more than a month(12% in 1996 and 13% in 2001).
Training was largely given to those who already had higher skills. In 2001, 68% ofmanagers and 66% of professionals had received some training in the previous fiveyears, but only 18% of those in elementary occupations.
Between 1996 and 2001, there was little change in absolute terms and a deteriorationin relative terms in the training received by those in elementary occupations.
In both years Denmark, Finland and Sweden had significantly higher levels oftraining than other countries, although in Finland this reflected structural variables (inparticular, the extensive use of advanced technologies).
Only Denmark, Germany and Italy showed an increase in employer training betweenthe years once structural variables were held constant.
In contrast to the results of studies for earlier periods, there was no consistentevidence that job insecurity grew worse between 1996 and 2001. Employees’perceptions of the security of their current jobs were not statistically different in 2001than in 1996.
There were important variations however between those in different occupationalclasses – managers, plant and machine operatives and employees in elementary

SOCIAL PRECARITY AND SOCIAL INTEGRATIONTHE EUROPEAN OPINION RESEARCH GROUP EEIG
EUROBAROMETER 56.1. – OCTOBER 2002 Page vi
occupations reported greater insecurity in 2001 than in 1996, whereas professionals,technicians and service and sales employees felt more secure. The position ofprofessionals and those in intermediate occupational classes improved between theyears relative to that of managers, but there was no change in the relative position ofeither machine operatives or those in elementary occupations.
There was no significant change between the years in perceived vulnerability todismissal for lateness or inadequate work performance.
There were wide class differentials in vulnerability to dismissal. In 2001 only 15% ofprofessionals and 29% of managers thought they could be dismissed within a monthfor regular lack of work effort, compared with 39% of employees in elementaryoccupations.
The relative security from dismissal of professionals and those in the intermediateclasses improved compared to managers between 1996 and 2001, partly as a result ofthe deterioration in the security of managers. But there was no improvement in therelative position of machine operatives or those in elementary occupations.
Finland, Sweden and to a lesser extent Denmark stood out as having relatively highlevels of protection from rapid dismissal, whereas employees in Spain had aparticularly high level of vulnerability.
Between 1996 and 2001, there was a slight (but statistically significant) decline in theproportion of employees that had been unemployed in the previous five years (from19% in 1996 to 16% in 2001).
There were very large class differences in the risks of having had an experience ofunemployment. Whereas 10% of managers and professionals had had an experienceof unemployment prior to 2001, this was the case for 24% of employees in elementaryoccupations. However, in part because of the rise in unemployment experiencesamong managers, the relative position of those in elementary occupations improvedover the years.
Belgium, Finland, France, the Netherlands and Sweden witnessed a significantdecline over the period in the proportion of employees who had had an experience ofunemployment in the previous five years.
Overall, while employment growth over these years prevented a deterioration in short-term job security, the decline in skill development, particularly among the low-skilled,may well have increased exclusionary risks in the longer-term.

SOCIAL PRECARITY AND SOCIAL INTEGRATIONTHE EUROPEAN OPINION RESEARCH GROUP EEIG
EUROBAROMETER 56.1. – OCTOBER 2002 Page vii
Chapter 6. Social Precarity and Personal Integration
The implications of social precarity were examined for five measures of personalintegration: employment commitment, job satisfaction, work-related stress, lifesatisfaction and psychological distress. The first three measures were concerned withpersonal integration in the world of work, while the third and fourth provided broadermeasures of personal integration for the wider population. While there was an overallimprovement on most of our measures of personal integration between 1996 and2001, there was still a very strong association in 2001 between all of the precarityfactors and poorer personal integration.
Employment commitment was at a relatively modest level in both 1996 and 2001,with only about half the workforce wishing to continue working if there were nofinancial necessity. However, the period saw a small but statistically significant rise inpeople’s commitment. This was true for both men and women.
The non-skilled had considerably lower levels of employment commitment than otheroccupational classes, with only 41% willing to continue work if there were nofinancial necessity in 2001. However, this was mainly accountable for by differencesin the quality of jobs, in particular the poorer quality of job tasks.
Overall, there was no increase in job satisfaction between 1996 and 2001. However,satisfaction did rise among female employees.
Non-skilled workers had much lower levels of job satisfaction than employees in allother classes. Again this could be almost entirely accounted for by the poorer qualityof the jobs of the non-skilled.
In 2001 nearly a third (31%) of employees reported that they regularly found theirwork stressful, a quarter that they came home from work exhausted and around 20%that their work was detrimental to their family and home lives. Work stress then was aproblem that affected a substantial sector of the workforce. But there was no evidencethat it had increased since 1996. Rather all the measures of work stress indicated somedecline over the period. The pattern was the same for men and women and foremployees in all-occupational classes.
Job quality factors were strong predictors of work stress. Lower task quality, greaterwork pressure and greater job insecurity all increased the level of work stressexperienced by employees. The evidence was consistent with the view that jobs thatoffer greater opportunities for learning and control on the job mediate the impact ofwork pressure on stress.
Taking the population as a whole, there was a small but significant decline between1996 and 2001 in both dissatisfaction with life and psychological distress. However,there was no evidence of a decline in psychological distress for women.
There were substantial differences in both satisfaction with life and psychologicaldistress depending upon people’s employment status. In particular, the unemployedhad markedly lower levels of personal integration in both respects.

SOCIAL PRECARITY AND SOCIAL INTEGRATIONTHE EUROPEAN OPINION RESEARCH GROUP EEIG
EUROBAROMETER 56.1. – OCTOBER 2002 Page viii
The self-employed showed a contradictory pattern: they had relatively high levels oflife satisfaction, but also higher levels of psychological distress, possibly reflectingthe anxieties associated with assuring the financial viability of their businesses.
There was no evidence that employment per se improved personal integration.However, those in better quality jobs were more satisfied with their lives and showedlower levels of psychological distress. Low quality jobs were associated with lowerpersonal integration on both measures.
Income precarity, in particular the degree of financial difficulty experienced, was thestrongest predictor of both life satisfaction and psychological well being. Level ofincome also had an effect, even controlling for the experience of financial difficulty.
Social isolation had a strongly negative association with both life satisfaction andpsychological well being.
Overall, the evidence is consistent with the view that both precarity in terms of livingconditions and precarity in terms of work conditions have strongly negative effects forpersonal integration.
Chapter 7. Social Precarity and Attitudes to Society and the Welfare State
The final chapter considers the implications of precarity for wider attitudes to society,to democracy and to welfare state provision. The results show that precarity in bothliving and work conditions is strongly associated with more negative attitudes tosociety and to greater dissatisfaction with democracy. It has more mixed implicationsfor attitudes to welfare.
Dissatisfaction varies very substantially between the EU countries. It is relativelyweak in Denmark, but high in the eastern part of Germany, France, Italy and Greece.
Those in more precarious life situations were significantly more dissatisfied withsociety. These effects were evident for unemployment, low income, social isolation,poor quality local neighbourhood environments, high levels of work pressure, jobinsecurity and poor quality work tasks.
A virtually identical pattern was found for dissatisfaction with democracy, both withrespect to inter-country variation and to the significant effects of precarity inheightening dissatisfaction.
Attitudes to the welfare state were studied taking account of three indicators:favourability to the government’s social policy, the strength of solidaristic values andthe severity of attitudes to the unemployed.
SOCIAL PRECARITY AND SOCIAL INTEGRATIONTHE EUROPEAN OPINION RESEARCH GROUP EEIG
EUROBAROMETER 56.1. – OCTOBER 2002 Page ix
Critical attitudes to the government’s social policy are most frequent in countrieswhere state welfare policies are relatively underdeveloped (especially the countries ofSouthern Europe). Support for government social policy is also particularly strongamong the unemployed and the poor. Those who have poor quality work tasks and arein less secure jobs are less favourable to government social policy, while those whohave experienced job upgrading are more favourable.
Solidaristic attitudes are indicated by the willingness to pay higher taxes if it werecertain that they would be used to improve the situation of the poor. Solidarism ishighest in Denmark, Great Britain, Sweden, Luxembourg, Italy and Spain.
Those with low incomes do not show higher solidarism on this measure (presumablybecause they would find it difficult to meet any higher tax payments). Job insecurityreduces solidarism, but those with higher quality work tasks are more solidaristic.
A high proportion of people in all countries were in agreement with the view that theunemployed should be required to accept a job quickly even if it is less good thantheir previous job. But the unemployed, the poor and those who are in insecure jobsare significantly less likely to endorse this view.

SOCIAL PRECARITY AND SOCIAL INTEGRATIONTHE EUROPEAN OPINION RESEARCH GROUP EEIG
EUROBAROMETER 56.1. – OCTOBER 2002 Page 1
CHAPTER 1
INTRODUCTION
Objectives of the Report
The objective of this report is to chart trends in social precarity in the member statesof the European Union. In the past, research on social exclusion has focused primarilyon describing the conditions of groups that have already become separated from themainstream of society. Increasingly, however, it has been recognised that an effectivestrategy for combating social exclusion needs to focus on the factors that put people atrisk of entering a process of marginalisation that may lead to social exclusion. Thus aconcern with social exclusion leads to the need for a wider analysis of social precarity.The report focuses on two major dimensions of social precarity – precarity of livingconditions and precarity of work conditions. In both cases, it adopts a broad rather arestricted concept of precarity: it is concerned not just with factors that constitute athreat of social exclusion in the short-term but with factors that are likely to erodepeople’s resources and capacities in a way that raises their risks of marginalisation inthe longer-term.
With respect to living conditions, a crucial factor that heightens precarity is clearlyinadequacy of financial resources. This involves not only the current level of incomebut also the duration of time over which people have experienced financialdeprivation. The lack of social connections is also likely to constitute a long-termsource of risk, since people will have fewer material and affective sources of supportto draw upon in times of need (Paugam, 1991; Gallie and Paugam, 2000). The extentto which poverty is associated with social isolation in turn is likely to be affected bythe broader understanding in society of the causes of social disadvantage, sincewhether poverty is seen as a result of the failure of the individual or the failure ofsociety will have implications for the degree of stigmatisation of the poor and hencefor the barriers to social interaction.
The second major dimension of precarity examined is that of work precarity – sincethe nature of people’s jobs has been shown consistently to be a central factor affectingtheir long-term risks of unemployment, poverty and ill-health. The necessity for"poverty" studies to extend their analyses to the arena of work was clearly enunciatedby Townsend in his classic study of poverty in the United Kingdom (Townsend,1979), while the rise of unemployment in the 1980s led to a growing concern aboutthe sources of precarity in work (Gallie et al. 1998; Paugam, 2000; Burchell et al.2002). As underlined by a recent Employment in Europe report: "Those employed injobs of poor quality are also at much higher risk of becoming unemployed or ofdropping out of the labour force. Concerns about job quality are therefore stronglyrelated to concerns about labour market segmentation and social exclusion" (EuropeanCommission, 2001:66). It is clear that many of the problems of those who arrive at themargins of society derive from difficulties they encountered earlier in their lives inmaintaining stable employment.

SOCIAL PRECARITY AND SOCIAL INTEGRATIONTHE EUROPEAN OPINION RESEARCH GROUP EEIG
EUROBAROMETER 56.1. – OCTOBER 2002 Page 2
While this may partly have resulted from individual characteristics, the risk ofemployment instability is heavily structured in a way that points to the importance ofthe way in which work is organised. Hence in assessing trends in the precarity ofwork conditions, it is important to take account not only of people’s short-termsituation with respect to job security, but also of the longer-term sources ofemployment instability – in particular whether jobs maintain people’s motivation,sustain their learning skills and provide them with the opportunities for upgradingtheir work skills and competence in the way needed to safeguard their futures.
The report addresses three issues. First has precarity of living and work conditionsbeen increasing or not in the countries of the European Union, and if, so whichdimensions of precarity have changed most? Second, has the process been relativelyconsistent across countries or have there been marked variations in trends reflectingdifferent institutional systems? Finally, what are the implications of precarity forsocial integration, both in terms of people’s personal sense of integration in theirsociety and in terms of their attitudes to the institutional framework of their society?
The answers to such questions require evidence across time. There has been no singlesurvey in the past that provides relevant indicators across these different domains. Butthere have been a number of surveys covering the European Union countries thatprovide evidence relating to particular parts of the picture. The study, then, has builtupon these earlier studies to make a series of comparisons that necessarily vary interms of the time frame involved.
The Context of Earlier Research
With respect to precarity of living conditions it has been possible to build upon asequence of three earlier surveys. Helene Riffault, of the French Institute of PublicOpinion (L'IFOP) and Jacques-René Rabier of the European Commission carried outthe first of these in 1976. Entitled in French La perception de la misère en Europe, (inEnglish, The Perception of Poverty in Europe), this was in many ways a landmarkstudy exploring the subjective perception of poverty, the extent of deprivation interms of living conditions and public understandings of the causes of poverty (Riffaultand Rabier, 1977). It flowed from a tradition of work that had been centrallyconcerned with changes in social values. There was then a considerable gap before thesecond survey – The Perception of Poverty in Europe 1989 –was carried out as part ofthe Poverty 3 Programme, focusing primarily on people’s experiences of their livingconditions. Finally, in 1993, a third survey was carried out, in the context of agrowing interest in the problematic of social exclusion. The title of the report, ‘Laperception de la pauvreté et de l’exclusion sociale’ (Rigault, 1994) captured itstransitional position between two rather different conceptual currents. The concern inthe present study with social precarity necessarily required comparison over time witha wider range of indicators than any of these surveys could provide, particularly inrelation to the field of work experience. To achieve this, the study has build upon anearlier survey carried out in 1996 by DG Employment, which focused primarily onprecarious work conditions and unemployment (Gallie, 1997).

SOCIAL PRECARITY AND SOCIAL INTEGRATIONTHE EUROPEAN OPINION RESEARCH GROUP EEIG
EUROBAROMETER 56.1. – OCTOBER 2002 Page 3
The existence of these earlier surveys has clearly been crucial in opening up theopportunities for comparison across time. At the same time the shifts in focus andmethod they involved impose inherent constraints on what can be achieved in terms ofcharting trends. The length of time over which comparisons can be made variessubstantially depending on the particular issue of concern. With respect to livingconditions, it has been possible in certain instances to provide analyses of trends as farback as 1976, in others only from 1989. With respect to work precarity, we arenecessarily confined to the shorter period of the second half of the 1990s. It must alsobe borne in mind that previous surveys were still in the early days of systematicovertime comparative analysis. The importance of consistency in wording andquestion format was not always fully taken into account, with apparently randomchanges in phrasing or response sets often undermining the opportunity for rigorouscomparison across the full set of years. Our position has been to confine ourselves toindicators where we have the exact equivalents between years, rather than try tomodify non-consistent variables in the hope that they can be made to provide trulycomparable information.
The Economic Context
The evolution of the broad economic context at the time of the different surveys isimportant to bear in mind. The very earliest survey that we use – 1976 – dates fromthe period prior to the major deterioration in West European labour markets thatoccurred from the late 1970s, after the second oil price shock of 1979. The morerecent surveys were carried out in a period of much greater labour market volatility.The 1989 survey was at a time when labour markets had substantially recovered fromthe turmoil of the early 1980s; the 1993 survey was carried out in a period of renewedcrisis which extended for many countries into the mid years of the decade. Finally, thecurrent 2001 survey took place after a substantial period of economic recovery.
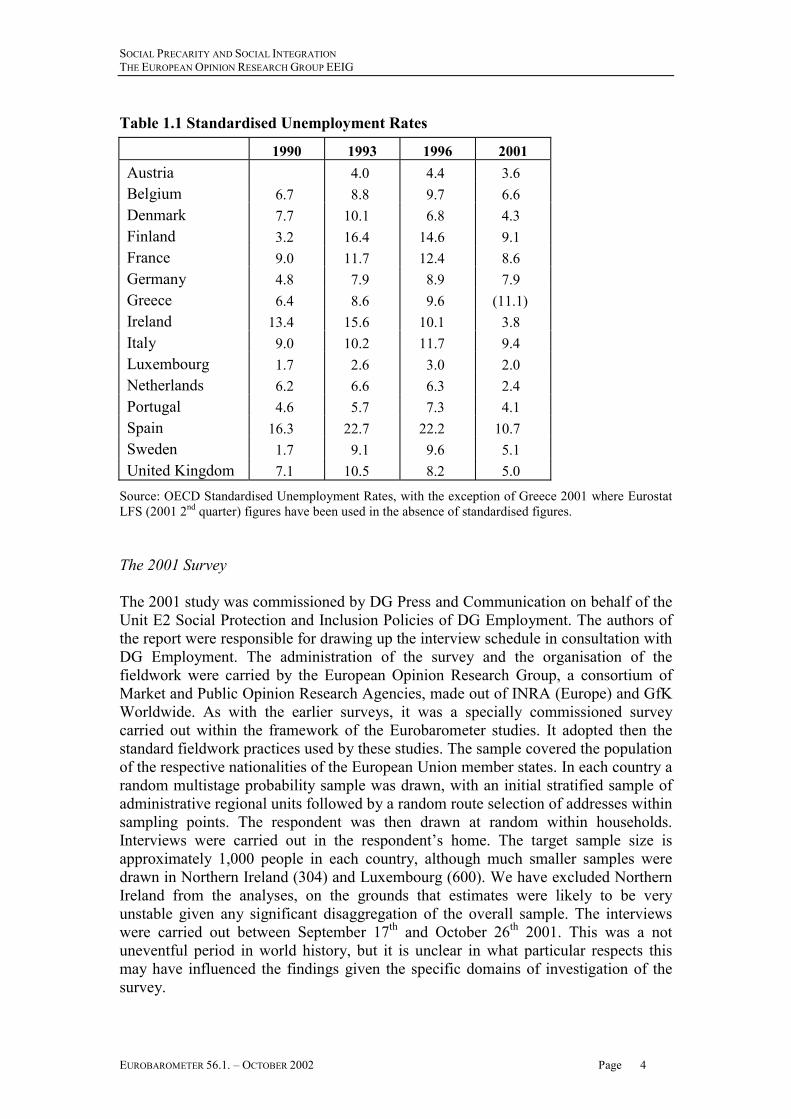
This broad pattern can be seen clearly in the unemployment rates in the differentperiods (Table 1.1). Unemployment rose in all countries between the beginning of thedecade to 1993, with particularly sharp rises in Finland (from 3.2% to 16.4%) andSweden (1.7% to 9.1%). Unemployment rates then remained at a very high level inmost countries through to 1996, with a marked decline occurring only in Denmarkand Ireland. Finally, unemployment fell between 1996 and 2001 in all countries, withthe possible exception of Greece. There were particularly marked declines in Finland,Ireland, Spain and Sweden.
SOCIAL PRECARITY AND SOCIAL INTEGRATIONTHE EUROPEAN OPINION RESEARCH GROUP EEIG
EUROBAROMETER 56.1. – OCTOBER 2002 Page 4
Table 1.1 Standardised Unemployment Rates
1990 1993 1996 2001Austria 4.0 4.4 3.6Belgium 6.7 8.8 9.7 6.6Denmark 7.7 10.1 6.8 4.3Finland 3.2 16.4 14.6 9.1France 9.0 11.7 12.4 8.6Germany 4.8 7.9 8.9 7.9Greece 6.4 8.6 9.6 (11.1)Ireland 13.4 15.6 10.1 3.8Italy 9.0 10.2 11.7 9.4Luxembourg 1.7 2.6 3.0 2.0Netherlands 6.2 6.6 6.3 2.4Portugal 4.6 5.7 7.3 4.1Spain 16.3 22.7 22.2 10.7Sweden 1.7 9.1 9.6 5.1United Kingdom 7.1 10.5 8.2 5.0
Source: OECD Standardised Unemployment Rates, with the exception of Greece 2001 where EurostatLFS (2001 2nd quarter) figures have been used in the absence of standardised figures.
The 2001 Survey
The 2001 study was commissioned by DG Press and Communication on behalf of theUnit E2 Social Protection and Inclusion Policies of DG Employment. The authors ofthe report were responsible for drawing up the interview schedule in consultation withDG Employment. The administration of the survey and the organisation of thefieldwork were carried by the European Opinion Research Group, a consortium ofMarket and Public Opinion Research Agencies, made out of INRA (Europe) and GfKWorldwide. As with the earlier surveys, it was a specially commissioned surveycarried out within the framework of the Eurobarometer studies. It adopted then thestandard fieldwork practices used by these studies. The sample covered the populationof the respective nationalities of the European Union member states. In each country arandom multistage probability sample was drawn, with an initial stratified sample ofadministrative regional units followed by a random route selection of addresses withinsampling points. The respondent was then drawn at random within households.Interviews were carried out in the respondent’s home. The target sample size isapproximately 1,000 people in each country, although much smaller samples weredrawn in Northern Ireland (304) and Luxembourg (600). We have excluded NorthernIreland from the analyses, on the grounds that estimates were likely to be veryunstable given any significant disaggregation of the overall sample. The interviewswere carried out between September 17th and October 26th 2001. This was a notuneventful period in world history, but it is unclear in what particular respects thismay have influenced the findings given the specific domains of investigation of thesurvey.

SOCIAL PRECARITY AND SOCIAL INTEGRATIONTHE EUROPEAN OPINION RESEARCH GROUP EEIG
EUROBAROMETER 56.1. – OCTOBER 2002 Page 5
Any survey has to make difficult choices about what to include or exclude, given thetight constraints on interview time. This is particularly the case with a survey such asthis that covers a number of dimensions of people’s lives. Our final selectiondepended on theoretical interest, potential for comparability and additionality toexisting data sources. The survey focuses primarily on subjective rather than objectiveindicators, which have been much better, served by other data sources. We have forinstance relatively little information on detailed sources of income or on pay, aspectsof people’s lives that can be much better studied through surveys such as theEuropean Community Household Panel which devotes a considerable part of theinterview schedule to these topics. Similarly, with respect to health and work, we havefocused on psychological health, where the data are much sparser, rather than on thetraditional area of physical health where there is already a very considerable existinginvestment in data collection and analysis. Clearly the results of these studies needeventually to be taken in the context of these other research programmes.
There are two particularly important limitations to the study. The first (as withprevious surveys) is the small size of the country samples. This makes it difficult tocarry out detailed ‘within country’ analyses in term's say of the different implicationsfor men and women of occupational class without rapidly encountering constraints ofcell size. The second is the variable nature of the response rates. It is well known thatthere are marked differences in typical response rates between countries, with forinstance particularly low response rates in the Netherlands. In certain cases howeverthe response rates achieved in this survey seem deviant even by conventionalstandards. In particular the spectacularly low response rates in Great Britain (21%)and Ireland (37%) indicate that considerable caution needs to be exercised in theinterpretation of the results for these countries. The data have been weighted toprovide a representative picture of the population for each country. But it cannot besure that such weighting eliminates all of the potential sources of bias that couldaccompany low response rates. Recent analyses of response rate patterns have beenrelatively optimistic about the robustness of results across differential response rateswithin a particular country and, as will be seen in the text of the report, there iscertainly a plausible consistency of country patterns across different time periods.However, we believe that results are best regarded as tentative pending the creation ofdata sets of the requisite size and quality.

SOCIAL PRECARITY AND SOCIAL INTEGRATIONTHE EUROPEAN OPINION RESEARCH GROUP EEIG
EUROBAROMETER 56.1. – OCTOBER 2002 Page 6
Table 1.2 Unweighted Sample Sizes 2001 Survey
Overall In workAustria 1000 477Belgium 1032 500Denmark 1001 544Finland 997 481France 1002 501Germany W 1009 471Germany E 1000 552Great Britain 999 459Greece 1004 393Ireland 996 472Ireland N 304 136Italy 992 453Luxembourg 600 313Netherlands 1006 473Portugal 1001 507Spain 1000 430Sweden 1000 553
15943 7715
There is a final general point of caution about the interpretation of the comparativeresults in this study that must be borne in mind. The concern is with trends, but thecomparative reference points are sparse. Strong judgements about trends requireregularly collected data over extended time periods. If there are two data points (byway of illustration, 1996 and 2001) conclusions about trends are necessarily verytentative. Strictly speaking we can only talk about whether there has been a changefrom one year to the other. To find that there was no difference between the results forthese two years does not preclude a substantial longer-term difference, for instancebetween the early 1990s and 2001. Indeed, although it is unknowable, it might be thecase that the comparator year was altogether exceptional and masks an otherwisestrong and relatively consistent direction of change. The same problems ofinterpretation obviously would occur if for some reason 2001 were a highlyexceptional year. This type of issue is inherent in the current limitations of dataavailability and clearly calls for the construction of more sustained data series in thefuture.

SOCIAL PRECARITY AND SOCIAL INTEGRATIONTHE EUROPEAN OPINION RESEARCH GROUP EEIG
EUROBAROMETER 56.1. – OCTOBER 2002 Page 7
Structure of the Report
The report divides into three broad parts. The first charts trends in the precarity ofliving conditions; the second focuses on trends in the precarity of work conditions andthe third examines the implications of the different spheres of precarity for personalwell-being and for attitudes to society.
Chapter 2 and 3 are concerned with precarity in living conditions. Chapter 2 begins bycharting the evolution of poverty within the general populations of the differentmember states, with a particular focus on subjective poverty. It then considers thechanging visibility of poverty at local neighbourhood level and the way this isaffected by variations in the economic cycle and the level of unemployment inparticular periods and countries. Finally it turns to examine the way that the generalpopulation interprets the mechanisms underlying poverty. In particular it addresses theextent to which it is viewed as a result of individual characteristics rather than broadersocial factors and as an inherited condition rather than one deriving from shorter-termadverse events.
Chapter 3 turns to a closer investigation of the experiences of those who are in thelowest income quartile. It considers the extent to which they experience financialdifficulty and how this has changed over the last decade. It then looks at the typicalduration of time that people have experienced poverty and the extent to which adultpoverty is associated with being brought up as a child in an economicallydisadvantaged milieu. Finally, it looks at the implications of low income for the natureand experience of social networks: the availability of social support in times ofdifficulty, the frequency of social contacts, the experience of social isolation, theextent of segregation of friendship networks with respect to employment status andthe degree of satisfaction with family and social life.
Chapter 4 and 5 are concerned with the assessment of changes in precarity at work.We follow the dimensions that have emerged in earlier research literature as of centralimportance for people’s employment risks. Chapter 4 considers first whether thequality of work tasks, with its implications for people’s learning and decision-makingskills, has been changing since the mid-1990s. A substantial literature has pointed tothis as a crucial factor affecting general personal development and the risk of bothpsychological and physical illness as a result of work (Kohn and Schooler, 1983;Karasek and Theorell, 1990; Johnson and Johansson, 1991). The chapter thenaddresses the issue of whether or not there has been an intensification of workpressures in employment, whether as a result of technological change or increasedcompetitive pressure, which could be potentially detrimental to employee health. Acentral concern is whether the employment conditions of the non-skilled (who have aparticularly high risk of losing employment) have improved over time in way thatwould lessen their long-term vulnerability to social exclusion.

SOCIAL PRECARITY AND SOCIAL INTEGRATIONTHE EUROPEAN OPINION RESEARCH GROUP EEIG
EUROBAROMETER 56.1. – OCTOBER 2002 Page 8
Chapter 5 extends the discussion of work precarity by examining the opportunities forthe development of new work skills and for career advancement. The regular updatingof work skills is an essential factor in maintaining people’s value on the labourmarket, protecting them from risks of redundancy and improving their chances of re-employment if they do become unemployed. The chapter examines both the extent towhich people have experienced increases in the skill requirements of their work andwhether they have received training from their employers. Finally, it turns to the issueof job security, assessing whether labour market trends have tended to undermine thestability of jobs. It considers both employees’ perceptions of their current job securityand their recent experiences of unemployment. Again, the analysis focusesparticularly on changes over time in the position of the non-skilled given their higherrisks of unemployment.
Chapters 6 and 7 are concerned with the implications of precarity for socialintegration. Chapter 6 explores the impact of precarity on people’s sense of personalwell being. It begins by looking at whether, for those in work, there have beenchanges over time in employment commitment, job satisfaction and the prevalence ofwork-related stress. It explores the impact of the various measures of work precarityfor people’s well being at work. It then examines for the broader population theimpact of precarity both in living conditions and in work conditions on lifesatisfaction and psychological distress.
Chapter 7 examines whether precarity in living and work conditions affects people’sevaluation of the wider society in which they live. It first considers people’s generallevels of satisfaction with society and with its democratic institutions. It then focusesmore specifically on people’s attitudes to the welfare state: their favourability tocurrent government welfare policies, the importance they attach to solidaristic welfarevalues and finally their attitude to policies towards the unemployed.
Finally Chapter 8 draws some of the major conclusions of the findings and points tosome of their implications for the future development of welfare policies.

SOCIAL PRECARITY AND SOCIAL INTEGRATIONTHE EUROPEAN OPINION RESEARCH GROUP EEIG
EUROBAROMETER 56.1. – OCTOBER 2002 Page 9
CHAPTER 2
THE EVOLUTION AND SOCIAL REPRESENTATION OFPOVERTY1
The purpose of this chapter is to study the evolution of poverty in Europe both on thebasis of conventional statistical indicators and in terms of the way this phenomenon isviewed by the respondents in each country. The analysis of poverty on the basis ofmoney indicators has already been the subject of a number of works, especially sincethe availability of figures from the European Community Household Panel2, whichnowadays provides the most reliable statistical basis in Europe for these purposes. Onthe other hand, this panel tells us nothing about how people see poverty; this can bestudied by using the Eurobarometer, where trends may be followed from 1976, thedate of the first such survey to tackle perceptions of poverty in Europe. We haveevidence from this date onwards for two useful indicators: one lets us examine theperceived causes of poverty, while the other shows us how the people interviewedperceived the principal characteristics of poverty.
When we set about comparing the first, 1976 survey with later ones (those of 1989,1993 and 2001) we naturally find that this is only feasible for those countries whichbelonged to the European Union in 1976 and where, accordingly, the survey wasconducted in that year: Belgium, Denmark, Germany, France, Ireland, Italy,Luxembourg, the Netherlands and the United Kingdom. If we want to makecomparisons with the countries of southern Europe, apart from Italy, we shall only beable to do this from the 1989 survey onwards, since Greece became an EU memberonly in 1979 and Spain and Portugal only in 1986. In these cases, then, we have onlythree different years to compare. For this first chapter, we have decided to present theresults of both sets of countries, so as to give the longest possible historical view,followed by the widest possible international comparison.
This chapter has three sections: the first compares poverty as measured in moneyterms with other indicators of poverty, the second analyses the perceived causes ofpoverty, and the third studies the characteristics of two contrasting forms: inheritedpoverty (structural poverty) and "new" poverty which follows a collapse in a person’scircumstances.
1 Serge Paugam wrote this chapter; the calculations and graphs were made with the assistance ofMarion Selz.2 See, e.g. Duncan Gallie and Serge Paugam (eds.), Welfare Regimes and the Experience ofUnemployment, Oxford, Oxford University Press, 2000.

SOCIAL PRECARITY AND SOCIAL INTEGRATIONTHE EUROPEAN OPINION RESEARCH GROUP EEIG
EUROBAROMETER 56.1. – OCTOBER 2002 Page 10
Measuring poverty
There is more than one way of measuring poverty, and we make no claim here to havetried them all. The 2001 survey does not afford us any very precise statisticalmeasurement, since the samples are not large, and our knowledge about incomes isstill too superficial. On the other hand, it does enable us to get a fairly reliableestimate of a number of other aspects of poverty, and in particular "subjectivepoverty", or the difficulties experienced in coping with certain expenditures. It ispossible also to investigate the visibility of poverty at local level.
Objective and subjective poverty
While there is a great range of different indicators and methods for measuringpoverty, statisticians generally adopt a strictly financial approach, setting an incomethreshold below which households or individuals are considered poor. The thresholdvaries: for many years, the most usual one was 50% of national average (mean)income. Since 2001, the European Union has used a reference threshold of 60% of thenational median, described as an indicator of the "risk of poverty" that we will belooking at later. To take account of economies of scale applying to householdsdepending on their composition, it is usual to give a value of 1 to the first adult in thehousehold, 0.5 to all others aged 14 and over, and 0.3 to children under 14: we shalladopt this convention also.
Contrasting with this type of measurement, there are the approaches based onsubjective poverty. Here again there is a customary definition: poor individuals arethose whose total net income is less than they consider absolutely necessary for aproper standard of living.
Table 2.1 compares the "risk of poverty" indicator based on the European Union’sobjective money definition with that for subjective poverty as we have just defined it.
From the figures of the first European Community Household Panel surveys, we findthat the proportion of individuals at risk of poverty is distinctly greatest in Portugal,Greece and the United Kingdom (most often above 20%). It is also high in Italy,Spain and Ireland (around 20%). At the other end of the scale, the Scandinaviancountries (Denmark, Sweden and Finland) appear least affected by the risk of poverty,for here the proportion of individuals living in poor households is most often less than10%. The Netherlands and Luxembourg also show a fairly low risk of poverty(between 11% and 12%). France, Germany and Belgium are in the middle (between15% and 20%).

SOCIAL PRECARITY AND SOCIAL INTEGRATIONTHE EUROPEAN OPINION RESEARCH GROUP EEIG
EUROBAROMETER 56.1. – OCTOBER 2002 Page 11
When we measure subjective poverty we get noticeably different results. With theexception of Denmark and Germany, the proportion of people who regard themselvesas poor is distinctly greater than that of people facing an objectively measured risk ofpoverty. In certain countries the difference is as much as threefold; in Portugal, forinstance, where we find 20% of individuals below the poverty line, while theproportion of individuals who consider themselves poor is 66%. In Greece there are22% according to the first indicator and 54% according to the second. This differenceis mainly connected with the fact that these two indicators are not measuring the samething. The first is relative, in the sense that it is calculated with reference to thenational median income: it depends on the income distribution within in the country inquestion, and can therefore be regarded as an indicator of national inequalities. Thesecond measures individuals’ degree of dissatisfaction with their standard of living; itdepends on a personal perception of what is necessary for a decent life and of thepossible gap between this subjective minimum and their declared net income. Clearly,in countries where there are still some very poor regions, those who live in them mayfeel frustrated when they compare themselves with those in other, better-off regions oftheir country, or even elsewhere in Europe, whose living standards they know moreabout, partly because travel is more frequent and partly through the media. Wetherefore need to see this as indicating the difficulty that individuals have in copingwith the ordinary expenditures they judge necessary and, at the same time, theiraspirations to an improved standard of living. In this sense we might say that the veryhigh proportion of people regarding themselves as "poor" in Portugal and Greecereflects the desire expressed by most of those populations for economic and socialprogress that would bring them access to better conditions of life. This process is notnew: we know, for instance, that countries such as France whose agriculture andindustry developed very rapidly during the "three-decade boom" also had, during thisperiod, a large proportion of the rural population very strongly dissatisfied with theirlot and keen on a rapid transformation. This frustration can indeed be regarded as oneof the preconditions for development.
It is striking that, while there are considerable differences between the results for theobjective and subjective measures of poverty, the ranking is nevertheless quite largelythe same. Portugal and Greece are still the two countries where the proportion of poorpeople is highest. Italy also has a large proportion of the subjectively poor (41%),while Denmark and Luxembourg, on the contrary, are again among the least affectedcountries (between 8% and 9%) followed by Germany (14%) and the Netherlands(18%). We may note, though, that the proportion of poor people according to thesubjective indicator of poverty is high in Sweden (20%) and in Finland (30%),contrasting with the small proportion of "poor" people in these countries according tothe objective "risk of poverty" indicator.

SOCIAL PRECARITY AND SOCIAL INTEGRATIONTHE EUROPEAN OPINION RESEARCH GROUP EEIG
EUROBAROMETER 56.1. – OCTOBER 2002 Page 12
Table 2.1 Comparison of objective and subjective poverty
"Risk of poverty" indicator Subjective povertyindicator
% living in households at risk of poverty (1) % who considerthemselves poor (2)
1995 1996 1997 1998 2001
Belgium 17 16 15 16 32Denmark 12 10 8 9 9Germany 17 15 15 16 14 (3)
Greece 22 21 23 22 54Spain 20 19 20 19 34France 16 17 16 18 30Ireland 19 20 20 17 24Italy 20 19 19 20 41Luxembourg 12 12 - - 8Netherlands 11 12 11 12 18Austria 13 14 13 13 16Portugal 23 22 24 20 66Finland - 8 8 - 30Sweden - - 9 10 20United Kingdom 21 17 22 21 27
(1) European Community Household Panel, threshold of poverty risk: 60% of the national median income,"modified" OECD scale, in which the first adult of the household counts 1, other aged 14 years or more count 0.5,and children under 14 count 0.3. (2) Eurobarometer 56.1, Poverty and social devaluation, 2001. These are the percentages of individuals whosetotal net income is below what they consider absolutely necessary for a proper standard of living. (3) Western Länder of Germany: 11%, eastern Länder: 24%.

SOCIAL PRECARITY AND SOCIAL INTEGRATIONTHE EUROPEAN OPINION RESEARCH GROUP EEIG
EUROBAROMETER 56.1. – OCTOBER 2002 Page 13
Another way to measure subjective poverty is to look at individuals’ financialdifficulties. We have moreover an opportunity to make a time comparison for thisindicator, since the question was put in 1993 and 2001; the first of these two momentswas marked by high unemployment, and the second by a distinctly more favourableeconomic situation, even though some signs of a slow-down by comparison with theprevious year were to be seen3 (cf. figure 2.1 below).
Figure 2.1
HOUSEHOLDS IN FINANCIAL DIFFICULTIES All households
0
10
20
30
40
50
60
70
80
90
Bel
gium
Den
mar
k
Wes
tG
erm
any
East
Ger
man
y
Fran
ce
Gre
atB
ritai
n
Irel
and
The
Net
herla
nds
Luxe
mbo
urg
Italy
Spai
n
Gre
ece
Portu
gal
1993 2001
Northern countries Southern countries
Source: Eurobarometer-LASMAS-IdL
It can be seen that in all countries except Portugal and the Netherlands, thepercentages of households in difficulty have fallen noticeably between these two
3 We should also point out that the level of consumer confidence fell in 2001. It should be recalled thatthe survey was conducted in the autumn, after the events of 11 September, which had an effect onhousehold behaviour.

SOCIAL PRECARITY AND SOCIAL INTEGRATIONTHE EUROPEAN OPINION RESEARCH GROUP EEIG
EUROBAROMETER 56.1. – OCTOBER 2002 Page 14
dates. We may therefore suppose that, overall, the improvement in the economicclimate had a positive effect on households’ standard of living. That said, it wouldstill be as well to emphasise that numbers in financial difficulty remained at a veryhigh level in Greece and in Portugal: more than 50% of households in both thesecountries. We observe that in 2001 Denmark was still the country with the leastpoverty. In a general way, then, this measure of poverty does not contradict the othermeasures, and we may therefore regard the results for objective poverty and those forsubjective poverty as to some extent convergent.

SOCIAL PRECARITY AND SOCIAL INTEGRATIONTHE EUROPEAN OPINION RESEARCH GROUP EEIG
EUROBAROMETER 56.1. – OCTOBER 2002 Page 15
Visibility of poverty at local level
If subjective poverty seems have diminished in recent years, we may wonder whetherit is as visible as it used to be. We have the means of comparing over time (back as faras 1989) the proportion of respondents who think there are poor people, or extremelypoor people, in their neighbourhood or village (cf. figure below). In 1989,unemployment was lower, in these countries as a whole, than in 1993, whileeconomic growth was higher.
The changes since that date are most significant. We have a very distinct finding thatthe visibility of poverty or extreme poverty greatly increased from 1989 to 1993 in allcountries except Italy, while from 1993 to 2001, on the contrary, it greatly diminishedexcept in the Netherlands. Once more, Portugal and Greece are at one end of the scaleand Denmark is at the other: the visibility of poverty or extreme poverty is very highin the former pair (some 50% of the population think there is poverty nearby) andvery low in the latter (fewer than 10%).
Figure 2.2

SOCIAL PRECARITY AND SOCIAL INTEGRATIONTHE EUROPEAN OPINION RESEARCH GROUP EEIG
EUROBAROMETER 56.1. – OCTOBER 2002 Page 16
% of respondents who think that there are people living in poverty or extreme poverty in their neighbourhood/village
0
10
20
30
40
50
60
70
Bel
gium
Den
mar
k
Wes
t Ger
man
y
East
Ger
man
y
Fran
ce
Gre
at B
ritai
n
Irel
and
The
Net
herla
nds
Italy
Spai
n
Gre
ece
Portu
gal
1989 1993 2001
Source: Eurobarometer - LASMAS-IdL -March 2002
Northern countries Southern countries

SOCIAL PRECARITY AND SOCIAL INTEGRATIONTHE EUROPEAN OPINION RESEARCH GROUP EEIG
EUROBAROMETER 56.1. – OCTOBER 2002 Page 17
The contrasts among these three years are even more striking if we compare theproportion of respondents who think that there are people nearby living in extremepoverty. In all the countries, without exception, we find a very sharp increase in theyears to 1993, and a sharp fall between then and 2001. These results for the visibilityof poverty agree with the objective and subjective measures of the phenomenon, forthe ranking of the various countries is here again remarkably unchanged.
We may therefore hypothesise that, while the differences among European countriesremain whatever the stage of the economic cycle, the status and subjective experienceof the poor also vary greatly from one country to another: living in poverty in acountry where the poor constitute a large and visible segment of the population is notthe same as living in poverty where the poor are few and comparatively out of sight.In the first case, we might almost say poverty is part of the social system, and the poorare not seriously marginalized; in the second, being poor can be more of an anomalyor a survival from the past, and the poor may feel rejected or at least relegated to aposition remote, on the whole, from the ordinary population. We shall be able to setabout testing this hypothesis in the next chapter.
The causes of poverty
The question on perceived causes of poverty was formulated as follows: "Why, inyour opinion, are there people who live in want?" and the answers offered for therespondents to choose from were:
1. Because they have been unlucky;
2. Because of laziness and lack of willpower;
3. Because there is much injustice in our society;
4. It’s an inevitable part of modern progress;
5. None of these.
This question has been asked since 1976, and we therefore have figures from foursurveys, giving us a particularly good basis for studying, over time, both nationaldifferences and differences among survey periods. To start with, we shall distinguishbetween personal causes and social causes; we shall then go on to look more closelyat the factors cited to explain poverty in terms of laziness, and those which point toinjustice as an explanation.

SOCIAL PRECARITY AND SOCIAL INTEGRATIONTHE EUROPEAN OPINION RESEARCH GROUP EEIG
EUROBAROMETER 56.1. – OCTOBER 2002 Page 18
Personal causes and social causes
The first two replies offered refer to personal causes ("because they’ve been unlucky","because of laziness or lack of willpower") while the next two refer to social causes("because there’s a great deal of injustice in our society" and "it’s inevitable in themodern world") (cf. table 2.2).
Of the two personal causes, the first, unlike the second, is based on a factualobservation only, passing no judgement on the poor people involved. Among thesocial causes, the explanation in terms of the inevitability of poverty also amounts to afactual observation about society, and does not imply a criticism of it, unlike the"injustice" explanation, which does. We may therefore say that the "laziness" and"injustice" explanations are more ideological ones than the others. However that may be, the attribution of poverty to an individual cause or a social oneis in itself a significant indication of the way individuals and societies relate topoverty. There are, moreover, considerable variations here from country to country.
Table 2.2 Perceived causes of poverty in 2001
Bad luck LazinessTotal,
personalcauses
Injustice Inevita-bility
Totalsocialcauses
None ofthese
replies
Don’tknow
Belgium 17.9 17.9 35.8 31.2 23.6 54.8 4.4 4.9Denmark 27.5 19.3 46.8 12.8 30.6 43.4 6.0 3.8Germany (W)
11.6 17.1 28.7 33.2 25.4 58.6 3.8 8.8Germany (E) 9.8 14.4 24.2 50.1 18.9 69.0 3.6 3.1Greece 13.7 19.9 33.6 32.9 24.8 57.7 3.7 4.9Italy 19.4 15.4 34.8 36.1 15.8 51.9 6.2 7.2Spain 24.0 12.4 36.4 35.3 19.4 54.7 3.6 5.4France 16.4 15.6 32.0 39.9 19.1 59.0 5.1 3.9Ireland 22.8 17.9 40.7 22.9 19.7 42.6 7.0 9.8Netherlands 23.2 11.9 35.1 19.3 22.5 41.8 14.2 8.8Austria 12.6 22.3 34.9 29.6 24.2 53.8 6.6 4.7Portugal 18.3 29.4 47.7 33.6 10.2 43.8 3.2 5.4Finland 13.4 14.7 28.1 42.5 23.4 65.9 2.4 3.6Sweden 13.1 8.5 21.6 42.0 27.1 69.1 5.2 4.1UnitedKingdom 20.9 22.5 43.4 19.5 22.3 41.8 5.2 9.7All countries 17.5 17.6 35.1 31.4 21.9 53.3 5.7 5.9
Source: Eurobarometer 56.1, Poverty and social devaluation in Europe (2001)

SOCIAL PRECARITY AND SOCIAL INTEGRATIONTHE EUROPEAN OPINION RESEARCH GROUP EEIG
EUROBAROMETER 56.1. – OCTOBER 2002 Page 19
The countries where poverty is most often explained in terms of personal causes are,in descending order: Portugal (48%), Denmark (47%), the United Kingdom (43%)and Ireland (41%). The countries where the social causes predominate as explanationsof poverty are: Sweden and eastern Germany (69%), then Finland (66%), followed byFrance and western Germany (59%), Belgium and Spain (55%) and Italy (52%).These differences cannot be explained by any single factor: we could suggest that thecountries with strong social-democrat traditions (Sweden, Finland) or socialist ones(eastern Germany) lean more towards the explanation in terms of social causes: thereis some backing for this, yet Denmark is an exception. To observe that the Latincountries have a culture of challenging the social system, which translates into astronger tendency to explain poverty in terms of social causes, is doubtless true; but inthis case we have to point to Portugal as an exception.
On the other hand, it appears that the United Kingdom and Ireland tend more toexplain poverty in terms of personal causes. In general, therefore, we may say thatthere is no single factor to explain these differences. All we can do is observe that, byand large, the development of an advanced social security system is often correlatedwith a frequent explanation of poverty in terms of social causes while, conversely, asocial security system like the British, which has been considerably pruned overrecent years particularly so far as unemployment compensation is concerned, isassociated with a greater tendency to see poverty as the result of personal causes. Wemay cast more light on this by examining the explanatory factors of laziness andinjustice.
Laziness and injustice
As we have seen, the explanations of poverty in terms of laziness and of injustice areopposed. The former refers to a moral concept based on the sense of duty and thework ethic. In this view, the poor are as it were accused of not doing more forthemselves, and the government authorities have therefore no duty to do more forthem. According to this approach, each individual person is responsible for him- orherself, and the avoidance of poverty is a personal task. The explanation of poverty interms of injustice, on the other hand, refers to a more global view of society: the poorare primarily the victims of a system that has condemned them. To this way ofthinking, government authorities do have a duty: to help the poor, as a matter ofgreater social justice. The "laziness" and the "injustice" explanations correspond tocontrasting opinions whose ideological and political orientation are obvious to all; andthese two explanations themselves have a history which goes back to the MiddleAges: societies have opted, in their treatment of poverty, for "pity, or the gallows", toborrow the title of a book by the historian Geremek4; that is, the temptation toeliminate the poor on the grounds that they are lazy, irresponsible and thereforeundesirable, has vied with the temptation to feel compassion for the world of all thosewho have never had a chance, and who have always lived in want.
4 Cf. B. Geremek, (1st edition in Polish, 1978). English translation entitled “Poverty: a History”,Blackwell Publishers; ISBN: 0631205292; Reprint edition March 1997.

SOCIAL PRECARITY AND SOCIAL INTEGRATIONTHE EUROPEAN OPINION RESEARCH GROUP EEIG
EUROBAROMETER 56.1. – OCTOBER 2002 Page 20
Looking at these two explanations of poverty, we may want to know on the one handwhether there are considerable differences among European countries and, on theother, whether there have been changes over time. We might suspect that a countrywill be less likely to develop ambitious social policies if many of its citizens regardpoverty as a problem of individual responsibility and, conversely, that a country willmore readily devote resources to the fight against poverty if its inhabitants regard thisproblem as the effect of systematic injustice which condemns its most deprivedvictims to one uniform destiny. We must see national differences on this point as boththe effect of a value system inherited from history and the result of the interventionisttradition of the Welfare State.
We may also hypothesise that these two explanations of poverty become more or lessprevalent according to the economic and social climate, and especially the rates ofunemployment and growth. In 1976, the year of the first survey, the rate ofunemployment was under 5% in most of the European countries, while in 1993, whenthe third survey was conducted, it was twice that level in many countries. If we look,likewise, at the rate of growth of GNP, this was above 5% – remarkable though it mayseem today – in Belgium, Denmark, Germany, Greece, Italy and Portugal. In 1993,growth was near zero in most of the countries, or even negative. These changesseldom left the populations of any country unaffected; they have at least a partialeffect on household consumption. It is therefore probable that they also influence theway people think about poverty.
The figures (2.3. and 2.4.) below trace the evolution since 1976 of the "laziness" and"injustice" explanations of poverty in each country, allowing us to test thesehypotheses; the two explanations do in fact vary over time, from country to countryand from period to period. If we compare France and Great Britain, for instance, itappears that the "laziness" explanation is always voiced more often in Great Britainthan in France, whichever period we look at. The difference was, moreover,particularly high in 1976, when more than 44% of British respondents chose thisexplanation compared with some 17% of French ones. We have to infer that there aredifferent conceptions of poverty in these two countries, and this has been shown inother works as well5.
We also need to stress that despite the differences of actual level among countries,trends have been similar since 1976 in many of them. In Belgium, Germany, France,Great Britain and Ireland, the "laziness" explanation of poverty scored high in the firstsurvey, noticeably lower in the second, and still lower in the third, moving back upstrongly in the last. The changes are considerable: in France, for instance, theproportion of people explaining poverty as due to laziness was 16.1% in 1976, 11. 7%in 1989, 5.6% in 1993, and 15.6% in 2001. In Belgium, the trends were the same:22.4% in 1976, 15.13% in 1989, 8.2% in 1993 and 17.9% in 2001.
5 Cf. M. Evans, S. Paugam, J. Prélis, Chunnel Vision: Poverty, Social devaluation' and the Debate onSocial Welfare in France and Britain, London School of Economics, STICERD, Discussion paper,Welfare state programme/115, 1995.

SOCIAL PRECARITY AND SOCIAL INTEGRATIONTHE EUROPEAN OPINION RESEARCH GROUP EEIG
EUROBAROMETER 56.1. – OCTOBER 2002 Page 21
Figure 2.3
Changes over time, "Laziness" explanation of poverty
0
5
10
15
20
25
30
35
40
45
50
Bel
gium
Den
mar
k
Wes
t Ger
man
y
East
Ger
man
y
Fran
ce
Gre
at B
ritai
n
Irel
and
The
Net
herla
nds
Italy
Spai
n
Gre
ece
Portu
gal
1976 1989
1993 2001
Source Eurobarometer - LASMAS-IdL
Northern countries Southern countries
Figure 2.4

SOCIAL PRECARITY AND SOCIAL INTEGRATIONTHE EUROPEAN OPINION RESEARCH GROUP EEIG
EUROBAROMETER 56.1. – OCTOBER 2002 Page 22
Changes over time, "Unfairness" explanation of poverty
0
10
20
30
40
50
60
70
Bel
gium
Den
mar
k
Wes
t Ger
man
y
East
Ger
man
y
Fran
ce
Gre
at B
ritai
n
Irel
and
The
Net
herla
nds
Italy
Spai
n
Gre
ece
Portu
gal
1976 1989
1993 2001
Source: Eurobarometer - LASMAS-IdL
Northern countries Southern countries

SOCIAL PRECARITY AND SOCIAL INTEGRATIONTHE EUROPEAN OPINION RESEARCH GROUP EEIG
EUROBAROMETER 56.1. – OCTOBER 2002 Page 23
If we look only at the last three surveys, we find an appreciable waning of the"laziness" explanation of poverty in 1993 by comparison with 1989, and an increasein 2001 (again by comparison with 1989) in eight countries out of the eleven shown inthe graph.
We find almost exactly the reverse for the "injustice" explanation of poverty. Thisexplanation is chosen most often in eastern Germany (50%), Finland and Sweden(42%) and France (40%). The United Kingdom and Netherlands respondents chosethis explanation a great deal less frequently (19%) and Denmark still less (13%). Insouthern countries, particularly Italy, Spain and Portugal, the proportion of thepopulation choosing this explanation is fairly high overall (between 33% and 36%).
To interpret these differences, we should take into account not only the type ofWelfare State, but also the way inequality is discussed in each of these countries,which depends on their experiments and experiences in the field of combatingpoverty, the people and organisations involved in this area, and the usual modes ofsocial intervention more generally.
It is also remarkably clear that the "injustice" explanation of poverty varies greatlyover time. In nine countries of the eleven, it reached a peak in 1993 (a time when theeconomic climate was most unfavourable, with a very high unemployment rate inmost countries and very weak or even negative growth).
The "injustice" explanation of poverty dropped sharply in 2001 in all countries exceptGreece, where it has become somewhat stabilised at a high level.
We may immediately infer, therefore, that explanations offered for poverty varygreatly depending on place and time; and that these two variables seem, on the face ofit, equally robust. We do need, however, to test this in a more systematic way, and tothat end have run a number of logistic regression models for the "laziness" (table 2.3)and "injustice" (table 2.4) explanations of poverty, using the country data available,firstly from 1976 and secondly from 1989 onwards. All the models are standardisedfor the basic social and demographic variables of sex, age and income, and givedetailed results by year and country. To test the effect of the economic climate, inaddition to the survey period we have added (in model 2) an indicator ofunemployment for the year of each survey and (in model 3) an additional growthindicator, also for the year of each survey.
Clearly, these indicators are still very crude and cannot on their own describe theoverall economic climate. Moreover, a difference of one percentage point in anunemployment rate is not very significant from a statistical point of view, though itcan be more so in social life since it features prominently in the news. As aconsequence, if we can see even a very slight change in the results after adding inthese indicators, we may be able to conclude that they do have an effect on the waypeople see the causes of poverty.

SOCIAL PRECARITY AND SOCIAL INTEGRATIONTHE EUROPEAN OPINION RESEARCH GROUP EEIG
EUROBAROMETER 56.1. – OCTOBER 2002 Page 24
Table 2.3 Explanation of poverty in terms of laziness (Logistic regression, standardised for sex, age and income)
From 1976 From 1989Model 1 Model 2 Model 3 Model 1 Model 2 Model 3
Year1976 Reference Reference Reference - - -1989 -0 .45*** -0.35*** -0.32*** Reference Reference Reference1993 -0 .81*** -0.66*** -0.76*** -0.32*** -0.24*** -0.37***2001 -0 .32*** -0.28*** -0.25*** 0.14*** 0.08* 0.08*CountryUnited Kingdom Reference Reference Reference Reference Reference ReferenceBelgium -0.55*** -0.53*** -0.46*** -0 .32*** -0.29*** -0.29***Denmark -0.78*** -0.77*** -0.75*** -0 .33*** -0.33*** -0.38***Germany -0.32*** -0.34*** -0.31*** -0 .03 (n.s.) -0.02 (n.s.) -0.04 (n.s.)France -0.82*** -0.77*** -0.69*** -0 .53*** -0.38*** -0.35***Ireland -0.34*** -0.21** 0. 02 (n.s.) -0 .24*** -0.05 (n.s.) 0.16 (n.s.)
Luxembourg 0 .05 (n.s.)-0 .09(n.s.) 0 .06 (n.s.) 0 .33*** 0 .09 (n.s.) 0 .27*
Netherlands -0.89*** -0.94*** -0.92*** -0 .51*** -0.61*** -0.60***Italy -0.32*** -0.23*** -0.13* 0 .03 (n.s.) 0.19** 0.20**
Spain - - - -0 .46*** 0. 03 (n.s.)0. 14(n.s.)
Greece - - - 0 .22*** 0.34*** 0.36***
Portugal - - - 0 .08 (n.s.) -0.02 (n.s.)-0.03(n.s.)
Unemployment (1) - -0.03*** -0.05*** - -0.05*** -0.05***Growth (2) - - -0.05*** - -0.03**
*: P <0.05, **: P < 0.01, ***: P < 0.001, n.s.: not significant (1) National unemployment rate for the year of each survey (Source OECD) (2) National growth rate for the year of each survey (Source OECD)
Table 2.3 confirms, in the first place, that the year-of-survey effect and the countryeffect are still significant, both from 1976 onwards and from 1989 onwards. In model1 (from 1976), the "laziness" explanation of poverty decreases in 1989 (coefficient -0.45 by comparison with the base year (1976), falls further in 1993 (-0.81) and thenrises again in 2001 (-0.32). If we take the United Kingdom as country of reference(where the "laziness" explanation of poverty was the most widespread in 1976), allthe other countries differ, but the Netherlands, France and Denmark differ most of all(coefficients of -0.89, -0.82 and -0.78, respectively). When, in model 2, we add theunemployment indicator for the year of each survey, all the coefficients for the threeyears (1989, 1993 and 2001) decrease substantially, proving that there is indeed aspecific unemployment effect, quite independent of the survey year. With higherunemployment there is a slightly lower probability that respondents will chose the"laziness" explanation of poverty. In every country, people tend more to reflect,during a period of recession when jobs are scarce, that it may not be the fault of theunemployed themselves if they do not find work.

SOCIAL PRECARITY AND SOCIAL INTEGRATIONTHE EUROPEAN OPINION RESEARCH GROUP EEIG
EUROBAROMETER 56.1. – OCTOBER 2002 Page 25
When (model 3), we also add the growth indicator for each survey year, we can seethe coefficients change once more, either upward or downward by comparison withmodel 2, but without reversing the general tendency. The specific effect of highergrowth is, however, harder to interpret than that of higher unemployment: the figuresshow that when growth rises, also, the probability that respondents will give the"laziness" explanation of poverty falls slightly. We must undoubtedly relate this resultto another observation from the same surveys: that awareness of inequalities becamestronger over the period 1993 – 2001, even though the economic climate actuallyimproved over that period. It has to be recognised also that as the economy recovers,unemployment may go down but inequalities simultaneously increase, along withgeneral awareness of them. However that may be, these models confirm a very strongeffect for the survey period, which we may attribute at least partly to the economicand social climate, since the introduction of the relevant specific indicators changesthe coefficients noticeably, without reversing the overall tendency.
The factors contributing to the "injustice" explanation of poverty can be analysedaccording to the same models (cf. table 2.4). We find that the survey period is againhighly significant. By comparison with 1976, the probability that this explanation willbe given is greater in 1989 and greater still in 1993; moreover we find a net fall forthis coefficient in 2001 compared with 1993 in all the models, and this warrants theinference that improvements in the economic climate reduce the collective readinessto refer to injustice as an explanation of poverty.
The models also confirm that the "injustice" explanation of poverty variessignificantly from country to country. Once we have stripped out the effects of age,sex and income, and also that of the survey period, we still find that the two countrieswhere this explanation is least popular are Denmark and the Netherlands, whichseems logical as these are the countries where social security is most advanced.
If we add in unemployment (model 2), we find the coefficients fall significantly,proving that this indicator has a specific effect on the "injustice" explanation ofpoverty. Thus we find that an increase in unemployment raises the popularity of thisexplanation, whatever the country. When we also add growth (model 3), thecoefficients again change, but less markedly. Once more, an increase in growth raisesceteris paribus the probability of this type of explanation. We may note however thatthe growth indicator is, under model 3, less significant in the model starting in 1989than in that starting in 1976.
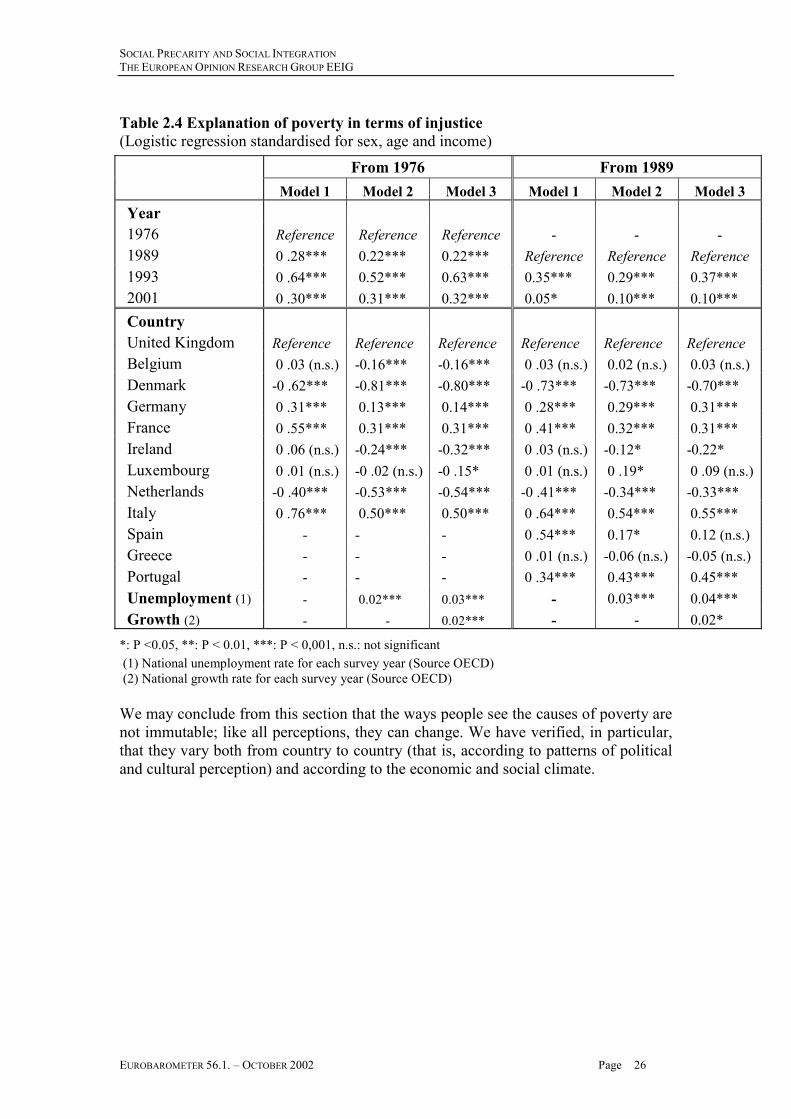
SOCIAL PRECARITY AND SOCIAL INTEGRATIONTHE EUROPEAN OPINION RESEARCH GROUP EEIG
EUROBAROMETER 56.1. – OCTOBER 2002 Page 26
Table 2.4 Explanation of poverty in terms of injustice (Logistic regression standardised for sex, age and income)
From 1976 From 1989Model 1 Model 2 Model 3 Model 1 Model 2 Model 3
Year1976 Reference Reference Reference - - -1989 0 .28*** 0.22*** 0.22*** Reference Reference Reference1993 0 .64*** 0.52*** 0.63*** 0.35*** 0.29*** 0.37***2001 0 .30*** 0.31*** 0.32*** 0.05* 0.10*** 0.10***CountryUnited Kingdom Reference Reference Reference Reference Reference ReferenceBelgium 0 .03 (n.s.) -0.16*** -0.16*** 0 .03 (n.s.) 0.02 (n.s.) 0.03 (n.s.)Denmark -0 .62*** -0.81*** -0.80*** -0 .73*** -0.73*** -0.70***Germany 0 .31*** 0.13*** 0.14*** 0 .28*** 0.29*** 0.31***France 0 .55*** 0.31*** 0.31*** 0 .41*** 0.32*** 0.31***Ireland 0 .06 (n.s.) -0.24*** -0.32*** 0 .03 (n.s.) -0.12* -0.22*Luxembourg 0 .01 (n.s.) -0 .02 (n.s.) -0 .15* 0 .01 (n.s.) 0 .19* 0 .09 (n.s.)Netherlands -0 .40*** -0.53*** -0.54*** -0 .41*** -0.34*** -0.33***Italy 0 .76*** 0.50*** 0.50*** 0 .64*** 0.54*** 0.55***Spain - - - 0 .54*** 0.17* 0.12 (n.s.)Greece - - - 0 .01 (n.s.) -0.06 (n.s.) -0.05 (n.s.)Portugal - - - 0 .34*** 0.43*** 0.45***Unemployment (1) - 0.02*** 0.03*** - 0.03*** 0.04***Growth (2) - - 0.02*** - - 0.02*
*: P <0.05, **: P < 0.01, ***: P < 0,001, n.s.: not significant (1) National unemployment rate for each survey year (Source OECD) (2) National growth rate for each survey year (Source OECD)
We may conclude from this section that the ways people see the causes of poverty arenot immutable; like all perceptions, they can change. We have verified, in particular,that they vary both from country to country (that is, according to patterns of politicaland cultural perception) and according to the economic and social climate.

SOCIAL PRECARITY AND SOCIAL INTEGRATIONTHE EUROPEAN OPINION RESEARCH GROUP EEIG
EUROBAROMETER 56.1. – OCTOBER 2002 Page 27
We shall have occasion in the next chapter to analyse the consequences of theseimages and perceptions on the subjective experiences of poverty. As "the poor" arenot defined or perceived (as a group) in quite the same way throughout Europe, itstands to reason that their experience and behaviour will not be uniform from onecountry to another. Quite apart from differences in standard of living, the fact ofreceiving assistance while of an age to work has quite a different meaning for theindividual and will produce quite different attitudes, depending on whether thatindividual lives in a country where unemployment is low and community pressure ondeviant behaviour strong, or in a society where there is structural unemployment andthe parallel economy is highly developed. In the former case, the individual is amember of a minority, and liable to be seriously stigmatised while feeling inadequatein the face of collective expectations; in the latter, such individuals are lessmarginalized and have more chance of managing to counteract the lowering of theirsocial status, by still having access to both material and symbolic resources via theunderground economy.
Inherited poverty and the newly poor
In research on poverty, one question remains virtually unanswered in spite of beingoften studied: that of the relationship between two characteristic forms of poverty:that which reproduces itself from generation to generation like a destiny, and thatwhich afflicts people who had formerly seemed free of the problem. Which of thesetwo really matches the situation most often? Some consider that poverty is mostoutrageous when it concentrates on families who remain poor whatever the age oreconomic climate in which they live. In their view, the only possible explanation forthis phenomenon is injustice. For others, poverty is worst when, like a whirlpool, itsucks down successive bands of the population or, in other words, when it spreadsbeyond the traditionally poor. Collective mobilisation is generally stronger in thesecond case. Our hypothesis here is that neither version of "poverty" is the "right" onein any absolute sense. They are both relative, and vary greatly not just from country tocountry, but also according to the economic climate.
It is possible to test this hypothesis by referring to a question, which has beenincluded in the Eurobarometer surveys since 1976. The question is put to those whosay they have seen, in their neighbourhood or village, people who are living inextreme poverty, in poverty, or at risk of falling into poverty. These respondents areasked whether these people have always been in their present situation ("inherited"poverty) or, on the contrary, have fallen into poverty following a particularunfavourable life event, having previously known something else ("the newly poor").

SOCIAL PRECARITY AND SOCIAL INTEGRATIONTHE EUROPEAN OPINION RESEARCH GROUP EEIG
EUROBAROMETER 56.1. – OCTOBER 2002 Page 28
The figure 2.5 below shows that a very high proportion of respondents in southerncountries regard poverty as a permanent, heritable condition (in 2001, the proportionwas 53% in Greece and Portugal, and 46% in Italy and Spain).
Figure 2.5
Proportion of respondents who say that the poor in their neighbourhood/village have always been poor (Inherited poverty)
0
10
20
30
40
50
60
70
80
Bel
gium
Den
mar
k
Wes
tG
erm
any
East
Ger
man
y
Fran
ce
Gre
atB
ritai
n
Irel
and
The
Net
herla
nds
Italy
Spai
n
Gre
ece
Portu
gal
1976 1989
1993 2001
Source: Eurobarometer - LASMAS-IdL
Northern countries Southern countries
It is striking how the perception of poverty as an inherited condition also varies fromperiod to period of the survey. In all the countries, this perception waned between1976 and 1993, probably due to the deteriorating jobs situation; then the trendreversed, and it rose noticeably from 1993 to 2001. We may note that while thedifferences among countries are less marked in 2001, the perception of poverty as aninheritance is still that of a small minority in Germany, Denmark and the Netherlands.

SOCIAL PRECARITY AND SOCIAL INTEGRATIONTHE EUROPEAN OPINION RESEARCH GROUP EEIG
EUROBAROMETER 56.1. – OCTOBER 2002 Page 29
Figure 2.6
Proportion of respondents who say that the poor in their neighbourhood/village have fallen into poverty (the newly poor)
0
10
20
30
40
50
60
70
80
90
100
Bel
gium
Den
mar
k
Wes
tG
erm
any
East
Ger
man
y
Fran
ce
Gre
at B
ritai
n
Irel
and
The
Net
herla
nds
Italy
Spai
n
Gre
ece
Portu
gal
1976 19891993 2001
Source: Eurobarometer - LASMAS-IdL
Northern countries Southern countries
The perception of poverty as "new poverty", on the other hand, is less widespread insouthern countries (28% in Portugal, and in the range 32% - 35% in Spain, Italy andGreece) while it is much more so in northern countries, particularly Germany(especially the eastern Länder, with 86%), the Netherlands (65%) and Denmark(53%). Clearly, poverty is perceived in different ways depending on the type ofeconomic development and the level of social security provision. We may note alsothat collective perceptions at least partly match the observed national differences instatistical measurements of poverty itself.
As in the case of inherited poverty, the proportion of people who think that poverty is"new" also varies according to the period of the survey. We find that this view ofpoverty became much more widespread between 1976 and 1993, when it reached its

SOCIAL PRECARITY AND SOCIAL INTEGRATIONTHE EUROPEAN OPINION RESEARCH GROUP EEIG
EUROBAROMETER 56.1. – OCTOBER 2002 Page 30
peak in all countries apart from eastern Germany, and then fell sharply from 1993 to2001. It seems therefore that under the effect of declining job opportunities thepopulation of each country became more aware of the growing number of poorpeople, and more aware that many of these were "newly poor". As the economicclimate improved, so this perception grew weaker.
To examine in greater depth the factors explaining these two views of poverty, we canuse the same type of logistic regression model as in the previous section (cf. tables 2.5and 2.6).

SOCIAL PRECARITY AND SOCIAL INTEGRATIONTHE EUROPEAN OPINION RESEARCH GROUP EEIG
EUROBAROMETER 56.1. – OCTOBER 2002 Page 31
Table 2.5 Poverty perceived as an inherited condition (Logistic regression standardised for sex, age and income)
From 1976 From 1989Model 1 Model 2 Model 3 Model 1 Model 2 Model 3
Year1976 Reference Reference Reference - - -1989 -0 .43*** -0.22* -0.22* Reference Reference Reference1993 -1 .17*** -0.88*** -0.80*** -0.73*** -0.62*** -0.65***2001 -0 .67*** -0.59*** -0.59*** -0.49*** -0.54*** -0.54***CountryUK Reference Reference Reference Reference Reference ReferenceBelgium -0 .35** -0.32** -0.35** -0 .23 (n.s.) -0.22 (n.s.) -0.23 (n.s.)Denmark -0 .33** -0.33** -0.33** -0 .54*** -0.52** -0.54**Germany -0 .77*** -0.82*** -0.84*** -1 .17*** -1.22*** -1.23***France -0 .17 (n.s.) -0.10 (n.s.) -0.12 (n.s.) -0 .35** -0.19 (n.s.) -0.20 (n.s.)Ireland 0.24* 0.50*** 0.44** 0 .35* 0.67*** 0.70***Luxembourg -0 .24 (n.s.) -0 .52** -0 .55** 0 .13 (n.s.) -0 .22 (n.s.) -0 .18 (n.s.)Netherlands -0.59*** -0.72*** -0.73*** -0 .64*** -0.81*** -0.81***Italy 0.62*** 0.75*** 0.71*** 0 .80*** 0.96*** 0.95***Spain - - - 0 .56*** 1.26*** 1.26***Greece - - - 1 .15*** 1.26*** 1.25***Portugal - - - 1 .05*** 0.87*** 0.86***Unemployment (1) - -0.05** -0.05** - -0.06*** -0.06***Growth (2) - - 0.02* - - -0.01 (n.s.)
*: P <0.05, **: P < 0.01, ***: P < 0,001, n.s.: not significant (1) National unemployment rate for each survey year (Source OECD) (2) National growth rate for each survey year (Source OECD)
Once we have taken account of the effects of sex, age and income, we still find thatboth the year of the survey and the country can to a very significant extent account forthe perception of poverty as an inherited condition. Taking 1976 as the base, thecoefficients obtained for 1989, 1993 and 2001 are all negative, meaning that the firstsurvey year was the one where this perception was the strongest. It then declined until1993, the period with the lowest coefficient (-1,17 in model 1), and rose again verysharply between 1993 and 2001.
If we add in unemployment (model 2), the coefficients for each year increaseconsiderably, proving that this indicator has a specific effect (for instance the 1993figure rises from -1,17 in model 1 to –0.88 in model 2). We may therefore conclude ina general way that increases in unemployment lessen the probability that people willsee poverty as a problem reproduced from generation to generation. If we also add inthe growth indicator (model 3), we see no great change in the coefficients, particularlynot in those using figures from 1989 onwards, indicating that the unemploymenteffect is of greater explanatory power than growth, so far as this phenomenon isconcerned.
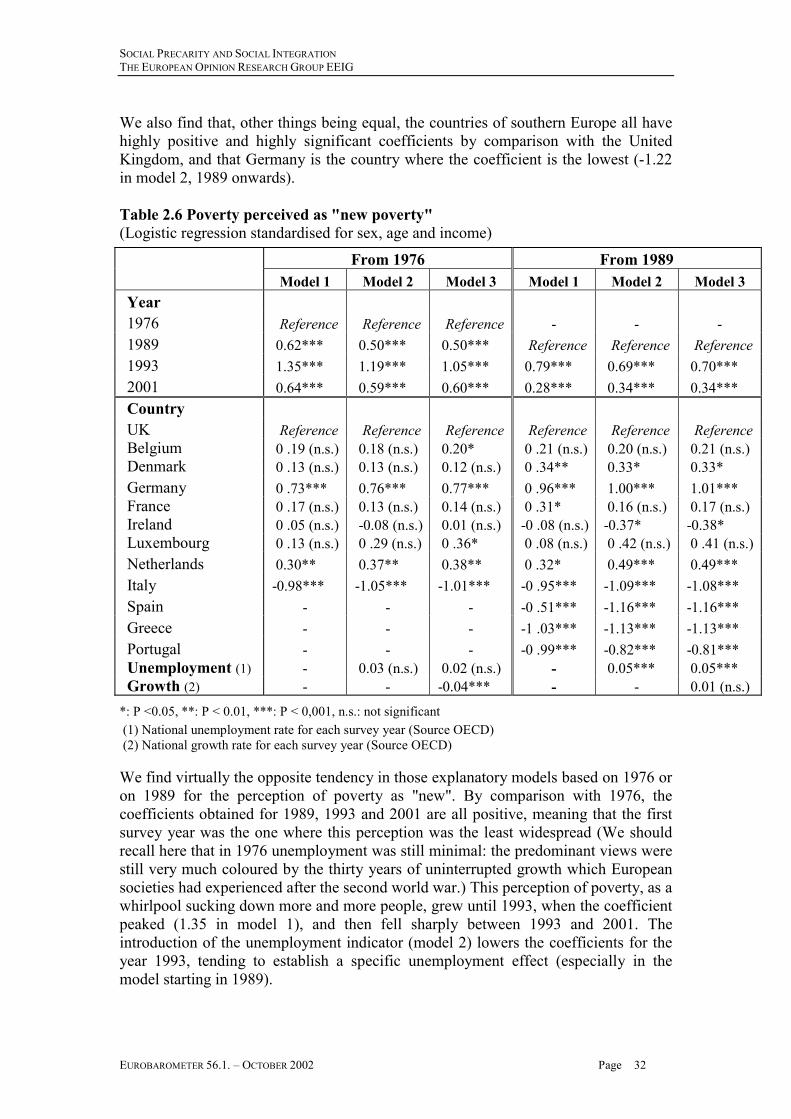
SOCIAL PRECARITY AND SOCIAL INTEGRATIONTHE EUROPEAN OPINION RESEARCH GROUP EEIG
EUROBAROMETER 56.1. – OCTOBER 2002 Page 32
We also find that, other things being equal, the countries of southern Europe all havehighly positive and highly significant coefficients by comparison with the UnitedKingdom, and that Germany is the country where the coefficient is the lowest (-1.22in model 2, 1989 onwards).
Table 2.6 Poverty perceived as "new poverty" (Logistic regression standardised for sex, age and income)
From 1976 From 1989Model 1 Model 2 Model 3 Model 1 Model 2 Model 3
Year1976 Reference Reference Reference - - -1989 0.62*** 0.50*** 0.50*** Reference Reference Reference1993 1.35*** 1.19*** 1.05*** 0.79*** 0.69*** 0.70***2001 0.64*** 0.59*** 0.60*** 0.28*** 0.34*** 0.34***CountryUK Reference Reference Reference Reference Reference ReferenceBelgium 0 .19 (n.s.) 0.18 (n.s.) 0.20* 0 .21 (n.s.) 0.20 (n.s.) 0.21 (n.s.)Denmark 0 .13 (n.s.) 0.13 (n.s.) 0.12 (n.s.) 0 .34** 0.33* 0.33*Germany 0 .73*** 0.76*** 0.77*** 0 .96*** 1.00*** 1.01***France 0 .17 (n.s.) 0.13 (n.s.) 0.14 (n.s.) 0 .31* 0.16 (n.s.) 0.17 (n.s.)Ireland 0 .05 (n.s.) -0.08 (n.s.) 0.01 (n.s.) -0 .08 (n.s.) -0.37* -0.38*Luxembourg 0 .13 (n.s.) 0 .29 (n.s.) 0 .36* 0 .08 (n.s.) 0 .42 (n.s.) 0 .41 (n.s.)Netherlands 0.30** 0.37** 0.38** 0 .32* 0.49*** 0.49***Italy -0.98*** -1.05*** -1.01*** -0 .95*** -1.09*** -1.08***Spain - - - -0 .51*** -1.16*** -1.16***Greece - - - -1 .03*** -1.13*** -1.13***Portugal - - - -0 .99*** -0.82*** -0.81***Unemployment (1) - 0.03 (n.s.) 0.02 (n.s.) - 0.05*** 0.05***Growth (2) - - -0.04*** - - 0.01 (n.s.)
*: P <0.05, **: P < 0.01, ***: P < 0,001, n.s.: not significant (1) National unemployment rate for each survey year (Source OECD) (2) National growth rate for each survey year (Source OECD)
We find virtually the opposite tendency in those explanatory models based on 1976 oron 1989 for the perception of poverty as "new". By comparison with 1976, thecoefficients obtained for 1989, 1993 and 2001 are all positive, meaning that the firstsurvey year was the one where this perception was the least widespread (We shouldrecall here that in 1976 unemployment was still minimal: the predominant views werestill very much coloured by the thirty years of uninterrupted growth which Europeansocieties had experienced after the second world war.) This perception of poverty, as awhirlpool sucking down more and more people, grew until 1993, when the coefficientpeaked (1.35 in model 1), and then fell sharply between 1993 and 2001. Theintroduction of the unemployment indicator (model 2) lowers the coefficients for theyear 1993, tending to establish a specific unemployment effect (especially in themodel starting in 1989).

SOCIAL PRECARITY AND SOCIAL INTEGRATIONTHE EUROPEAN OPINION RESEARCH GROUP EEIG
EUROBAROMETER 56.1. – OCTOBER 2002 Page 33
The introduction of the growth indicator makes a significant difference in model 3based on 1976. Higher growth lessens the probability that people will perceivepoverty as "new". The introduction of this indicator makes an even more significantdifference to the coefficient for the year 1993. We may therefore conclude that theeconomic climate has a real effect on the perception of poverty.
This effect of the economic climate does not eliminate the country effect, however.Just as with the perception of poverty as an inherited condition, this perception ofpoverty as the result of a fall is far less widespread in southern countries than innorthern ones.
Conclusion
In this chapter we have been able to verify that the ways people see poverty are notunvarying but, on the contrary, change considerably from one period to another in allEuropean countries. Not only does the economic climate, and in particular a change inthe unemployment rate, contribute to altering the level of poverty in each society, butthe collective perception of this phenomenon is transformed as well. Thecharacteristic forms and perceived causes of poverty change from one phase toanother in the history of each society; but these evolutions over time do not radicallyaffect national differences in perceptions of the phenomenon: each country faces bothpeculiar and common problems, which it tries to tackle with its own particular means.
We may therefore speak of a "processing" of poverty that varies with both economiccircumstances and national characteristics. This processing contributes to the overalldefinition, in each country and period, of the social status of those regarded as poor,since the ways they are designated and the forms of social intervention applied tothem are an expression of collective expectations concerning them. In the same way,these people’s subjective experiences and ways of adapting to their socialenvironment can affect the attitudes of the different societies in which they live, andin particular the institutions of social intervention concerned with them. In oneparticular country, therefore, it could be thought, on the basis of various types ofevidence, that the poor are being made passive by the assistance they receive, andrecommendations for a reduction in their allowances might result; while in another, itmight be agreed that it was pointless helping them more, because kinship and othermechanisms of solidarity were still operating. In a more general way, the group ofpeople recognised as poor in a given society will be more or less homogeneous, andmore or less stigmatised, depending on the combination, in that country or region, of anumber of variables (economic, political and social), and the particular historicalperiod under consideration.

SOCIAL PRECARITY AND SOCIAL INTEGRATIONTHE EUROPEAN OPINION RESEARCH GROUP EEIG
EUROBAROMETER 56.1. – OCTOBER 2002 Page 34
CHAPTER 3
THE SUBJECTIVE EXPERIENCE OF POVERTY 6
When sociologists speak of "the subjective experience of poverty", they are referringto in-depth analysis of how the people living in poverty or designated as "poor" livetheir everyday lives and give meaning to their experience; in other words, thisinvolves taking account of the tribulations that poverty, or what is regarded aspoverty, consists of, in several life domains: budget management, family behaviour,working life, social and cultural practices, etc. The subjective experience of povertyhas often been interpreted as a negative one, for many reasons: not only can thisexperience take the form of real deprivation and difficulties in coping with therequirements of daily living; it can also be accompanied by a weakening of social ties,a deterioration of social status, and feelings of humiliation or psychological distress.
We do not claim, in this chapter, to deal with all these points. This chapter has threesections, each corresponding to one aspect of the experience of poverty: the first looksat the pressure of difficulties in making ends meet, day by day; the second attempts toassess the risk of social isolation; and the third studies differences in terms of thequality of life. The aim of this chapter is to analyse the subjective experience ofpoverty with particular reference, as in the previous chapter, to differences betweencountries and changes over time. Our study cannot go so far back historically, though:the data necessary for this chapter’s analyses are not available before the survey of1993.
The pressure of difficulties in making ends meet
A number of indicators of subjective poverty were examined in the previous chapter,including one referred to as "financial difficulty". We found that financial difficultyaffected a smaller proportion of people, overall, in 2001 than in 1993. If we considerthe poorest group (below lower quartile) in each country, we still find the same,except in five countries: the Netherlands, Luxembourg, Italy, Greece and Portugal (cf.figure 3.1). We may note also, as might be expected, that financial difficulty affects ahigher proportion of people in the southern countries, especially in Greece andPortugal, being distinctly less widespread in Denmark and Luxembourg. Around aquarter of the population up to the first quartile have financial difficulties in Denmark,against approximately 80% in Greece and in Portugal.
6 Serge Paugam wrote this chapter. The calculations and graphs were made with the assistance ofMarion Selz.
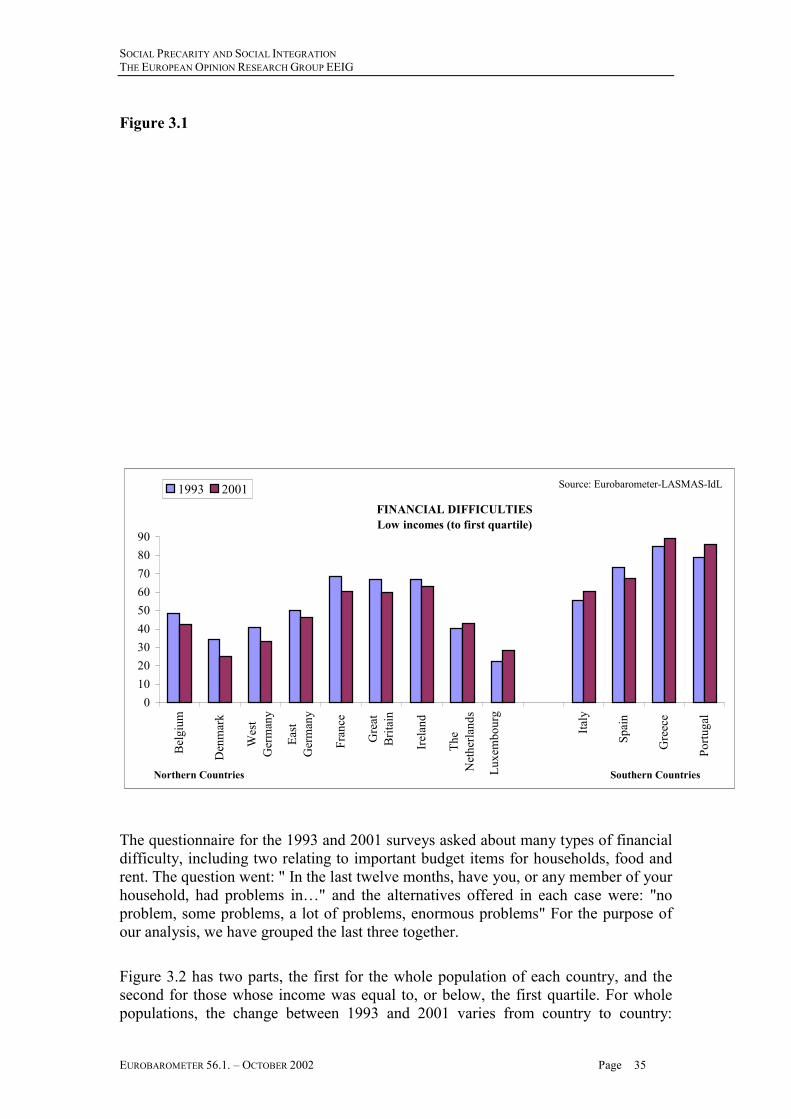
SOCIAL PRECARITY AND SOCIAL INTEGRATIONTHE EUROPEAN OPINION RESEARCH GROUP EEIG
EUROBAROMETER 56.1. – OCTOBER 2002 Page 35
Figure 3.1
FINANCIAL DIFFICULTIES Low incomes (to first quartile)
0102030405060708090
Bel
gium
Den
mar
k
Wes
tG
erm
any
East
Ger
man
y
Fran
ce
Gre
atB
ritai
n
Irel
and
The
Net
herla
nds
Luxe
mbo
urg
Italy
Spai
n
Gre
ece
Portu
gal
1993 2001
Northern Countries Southern Countries
Source: Eurobarometer-LASMAS-IdL
The questionnaire for the 1993 and 2001 surveys asked about many types of financialdifficulty, including two relating to important budget items for households, food andrent. The question went: " In the last twelve months, have you, or any member of yourhousehold, had problems in…" and the alternatives offered in each case were: "noproblem, some problems, a lot of problems, enormous problems" For the purpose ofour analysis, we have grouped the last three together.
Figure 3.2 has two parts, the first for the whole population of each country, and thesecond for those whose income was equal to, or below, the first quartile. For wholepopulations, the change between 1993 and 2001 varies from country to country:

SOCIAL PRECARITY AND SOCIAL INTEGRATIONTHE EUROPEAN OPINION RESEARCH GROUP EEIG
EUROBAROMETER 56.1. – OCTOBER 2002 Page 36
between these two dates we find an increase in Portugal, Greece, the Netherlands,Great Britain, eastern Germany and Belgium, and no change or a fall in the othercountries.
Naturally, we find that difficulties in paying for food are more frequent among peoplewhose income is the lower quartile or below, and we also find that national variationspersist here. People affected by this type of difficulty are proportionally morenumerous in Greece and Portugal than in the other countries, especially Denmark,where the rate is still quite low.

SOCIAL PRECARITY AND SOCIAL INTEGRATIONTHE EUROPEAN OPINION RESEARCH GROUP EEIG
EUROBAROMETER 56.1. – OCTOBER 2002 Page 37
Figure 3.2
PROBLEMS IN PAYING FOR FOOD in the last twelve months
Whole population
0
10
20
30
40
50
60
70
Bel
gium
Den
mar
k
Wes
tG
erm
any
East
Ger
man
y
Fran
ce
Gre
at B
ritai
n
Irel
and
The
Net
herla
nds
Luxe
mbo
urg
Italy
Spai
n
Gre
ece
Portu
gal
1993 2001
Northern countries Southern countries
Source: Eurobarometer-LASMAS-

SOCIAL PRECARITY AND SOCIAL INTEGRATIONTHE EUROPEAN OPINION RESEARCH GROUP EEIG
EUROBAROMETER 56.1. – OCTOBER 2002 Page 38
PROBLEMS IN PAYING FOR FOOD in the last twelve months
Low incomes (to first quartile)
0
10
20
30
40
50
60
70
Bel
gium
Den
mar
k
Wes
tG
erm
any
East
Ger
man
y
Fran
ce
Gre
atB
ritai
n
Irel
and
The
Net
herla
nds
Luxe
mbo
urg
Italy
Spai
n
Gre
ece
Portu
gal
1993 2001
Northern countries Southern countries
Source: Eurobarometer-LASMAS-IdL
So far as difficulties in paying the rent are concerned (cf. figure 3.3), the changesbetween 1993 and 2001 also vary from one country to another, for the wholepopulation: we find a clear increase in Portugal, Greece, eastern Germany andLuxembourg, and either no change or a fall in the other countries. On the other hand,an increase can be seen in more countries when we take those with incomes at orbelow the lower quartile: all southern countries, but also, among the others, Ireland,Great Britain, eastern and western Germany, and even Denmark.

SOCIAL PRECARITY AND SOCIAL INTEGRATIONTHE EUROPEAN OPINION RESEARCH GROUP EEIG
EUROBAROMETER 56.1. – OCTOBER 2002 Page 39
Difficulties in paying the rent may in fact depend more on the state of the housingmarket than on income levels; in other words, with the same or even higher moneyincomes the poor can be faced with greater difficulties when rents go up andconditions of access to housing become more strictly selective. It is known that inmany countries the economic climate can improve without any attendant relaxation ofthe tight conditions applying to those in rented accommodation.
Figure 3.3
PROBLEMS PAYING THE RENT in the last twelve months
Whole population
0
10
20
30
40
50
Bel
gium
Den
mar
k
Wes
tG
erm
any
East
Ger
man
y
Fran
ce
Gre
atB
ritai
n
Irel
and
The
Net
herla
nds
Luxe
mbo
urg
Italy
Spai
n
Gre
ece
Portu
gal
1993 2001
Northern countries Southern countries
Source: Eurobarometer-LASMAS-IdL

SOCIAL PRECARITY AND SOCIAL INTEGRATIONTHE EUROPEAN OPINION RESEARCH GROUP EEIG
EUROBAROMETER 56.1. – OCTOBER 2002 Page 40
PROBLEMS PAYING THE RENT in the last twelve months
Low incomes (to first quartile)
0
10
20
30
40
50
Bel
giqu
m
Den
mar
k
Wes
tG
erm
any
East
Ger
man
y
Fran
ce
Gre
at B
ritai
n
Irel
and
The
Net
herla
nds
Luxe
mbo
urg
Italy
Spai
n
Gre
ece
Portu
gal
1993 2001
Northern countries Southern countries
Source: Eurobarometer-LASMAS-IdL

SOCIAL PRECARITY AND SOCIAL INTEGRATIONTHE EUROPEAN OPINION RESEARCH GROUP EEIG
EUROBAROMETER 56.1. – OCTOBER 2002 Page 41
The likelihood of being confronted with either of these two types of difficulty dependsalso on a number of variables which we have examined using a logistic regressionmodel (cf. table 3.1). Other things, including the country, being held equal, womenface difficulties paying for food more often than men do. Age also has a significanteffect. By comparison with those aged 35 to 44 (the reference group for this model),young people under 25 and people over 45 (and especially those over 55) seem lessaffected by this type of difficulty. Young people under 25, of course, are not alwaysindependent and often still live with their parents, especially in southern countries:this might explain both their less frequent reports of difficulty and also, no doubt,their lesser sensitivity to this problem. The groups most affected of all are those ofintermediate age, who are liable to have the heaviest family responsibilities.
We may note also, as might be expected, that the unemployed are much more oftenaffected by these difficulties in paying for food than those in paid work, just as thosewhose income is at or below the lower quartile are more affected than others. Lastly,the year turns out to be statistically significant. Adjusting for other factors, the totalpopulation was more affected as a whole by this type of difficulty in 2001 than in1993. While the lowest income groups are in general more affected than the othercategories, they are not more so in 2001 than they were already in 1993, as we seefrom the interaction effect tested in the model (the coefficient here is almost zero, andnot significant).

SOCIAL PRECARITY AND SOCIAL INTEGRATIONTHE EUROPEAN OPINION RESEARCH GROUP EEIG
EUROBAROMETER 56.1. – OCTOBER 2002 Page 42
Table 3.1 Logistic regression for the probability of having difficulty in paying forfood and rent in the last twelve months (standardised for country)
Difficultyin paying for food
Difficultyin paying the rent
GenderMen Reference ReferenceWomen 0.13*** 0.05 n.s.Age15 - 24 -0.35*** -0.33***25 - 34 -0.10 n.s. -0.01 n.s.35 - 44 Reference Reference45 - 54 -0.18** -0.21***55 - 64 -0.40*** -0.66***65+ -0.69*** -1.20***Employment statusIn paid work Reference ReferenceUnemployed 1.02*** 0.82***Inactive 0.31*** 0.09 n.s.IncomeFirst quartile and below 1.50*** 1.00***Above first quartile Reference ReferenceYear1993 Reference Reference2001 0.29*** 0.10 n.s.Interactionbelow lower quartile with 2001 -0.03 n.s. 0.11 n.s.
*: P <0.05, **: P < 0.01, ***: P < 0,001, n.s.: not significant
We may observe fairly similar results for difficulties in paying the rent. Thoughwomen are not more affected than men are by this type of difficulty, the age effect isjust the same as in the analysis for difficulties in paying for food. It is still those ofintermediate age who are the most affected; likewise, the unemployed are distinctlymore likely to have difficulties paying the rent than those in paid work. The poorest25% are also more often affected than the other income categories. On the other hand,the year 2001 is not significantly different from 1993, nor is the interaction effect oflow income and the year 2001: while the lowest income groups are more affected thanthe other income categories in both years, they are not more so in 2001 than in 1993to any statistically significant extent.

SOCIAL PRECARITY AND SOCIAL INTEGRATIONTHE EUROPEAN OPINION RESEARCH GROUP EEIG
EUROBAROMETER 56.1. – OCTOBER 2002 Page 43
Figure 3.4
DURATION OF FINANCIAL DIFFICULTIES BY COUNTRY (2001)NORTHERN COUNTRIES
0
5
10
15
20
25
30
35
0 2 4 6 8 10 12 14 16
Belgiqum Denmark West Germany East GermanyFrance Great BritainIreland The Netherlands
Source: Eurobarometer - LASMAS-IdL - March 2002
%
Number of years

SOCIAL PRECARITY AND SOCIAL INTEGRATIONTHE EUROPEAN OPINION RESEARCH GROUP EEIG
EUROBAROMETER 56.1. – OCTOBER 2002 Page 44
DURATION OF FINANCIAL DIFFICULTIES BY COUNTRY (2001)SOUTHERN COUNTRIES
0
5
10
15
20
25
30
35
40
45
0 2 4 6 8 10 12 14 16
Italy Spain
Greece Portugal
Source: Eurobarometer - LASMAS-IdL - March 2002
Number of years
%

SOCIAL PRECARITY AND SOCIAL INTEGRATIONTHE EUROPEAN OPINION RESEARCH GROUP EEIG
EUROBAROMETER 56.1. – OCTOBER 2002 Page 45
In assessing the intensity of poverty, we have to take into account how long it lasts:people confronted with poverty may be experiencing it only during a short period intheir lives, or over a long period7. In the first case, we may speak of "episodicpoverty", arising as the result of some particular new difficulty; the second is referredto rather as "structural poverty", in the sense that it persists and corresponds to one ormore permanent difficulties. In the 2001 survey, a question was asked about theduration of the financial difficulties, and in Figure 3.4 we may contrast the northernand southern countries. In the former, it is noticeable that the majority of those whohave had financial difficulties have done so for some two or three years, while in thelatter these difficulties have on the whole been going on a great deal longer: aroundfourteen or fifteen years in the case of the largest proportion of people, whatever thecountry. It is clear, therefore, that poverty is more of an episodic phenomenon in thenorthern countries, and more of a structural one in southern countries. This contrastshould be related to our finding in the previous chapter, where we distinguishedbetween the views of poverty as "new poverty" (widespread in the northern countries)and “ inherited” (far more prevalent in southern countries).
This distinction between episodic and structural poverty, though it relates to the onebetween northern countries and southern ones, should not be taken to suggest thatstructural poverty only exist in the southern countries, or episodic poverty only inthose of the North. We find in northern countries also a proportion of the populationwhich remains poor from generation to generation and has persistent difficulty insurviving, whatever the economic and social climate. Surveys have revealed only thatthis proportion is distinctly smaller in the northern countries, and that episodic povertyis a more widespread phenomenon in the North than in the South.
7 For a number of years now, those who specialise in research into poverty have been assigning moreimportance to this question of its duration. Cf. Lutz Leisering and Stephan Leibfried, Time and Povertyin Western Welfare States, Cambridge, Cambridge University Press, 1999.

SOCIAL PRECARITY AND SOCIAL INTEGRATIONTHE EUROPEAN OPINION RESEARCH GROUP EEIG
EUROBAROMETER 56.1. – OCTOBER 2002 Page 46
Table 3.2 Effect of disadvantaged childhood background on the likelihood offinancial difficulties in adulthood, by country
Interactive effect:Country/Parents’ financial
difficulties (PFD)
Model 1(standardised for sex,
age and country)
Model 2(standardised for sex, age,
country and income)Northern countriesBelgium-PFD 0.69*** 0.57*Denmark-PFD 0.38 n.s. 0.46*Germany-West-PFD 0.90*** 0.79*Germany-East-PFD 0.31 n.s. 0.38 n.s.France-PFD 0.32 n.s. 0.48*Great Britain-PFD 0.28 n.s. 0.21 n.s.Ireland-PFD 0.85*** 0.88***Luxembourg-PFD 0.76** 0.73**Netherlands-PFD 0.34 n.s. 0.27 n.s.Finland-PFD 0.14 n.s. 0.16 n.s.Sweden-PFD 0.75*** -Austria-PFD 0.46* 0.39 n.s.Southern countriesItaly-PFD 0.85*** 0.76***Spain-PFD 1.00*** 0.95***Greece-PFD 1.01*** 0.83***Portugal-PFD 1.14*** 0.96***Incomebelow lower quartile - 1.63***lower quartile to median - 0.54***median to upper quartile - -0.15**above upper quartile - Reference
*: P <0.05, **: P < 0.01, ***: P < 0,001, n.s.: not significant
Lastly, when we look at the variables regarded as explaining poverty, we cannotdisregard family background. In the 1960s the anthropologist Oscar Lewis explained,on the basis of his research on very poor families, that the "culture of poverty" has atendency to perpetuate itself from generation to generation, through the effect it hason children. As he says, "by the time slum children are aged six or seven, they haveusually absorbed the basic values and attitudes of their subculture and are notpsychologically geared to take full advantage of the changing conditions or increasedopportunities that may occur in their lifetime." 8 Now the materials we have from our2001 survey are not, of course, as full as those Lewis gathered in the field; but we dohave specific information about the respondents’ childhood's, and in particular on anyfinancial difficulties their parents had when they were responsible for theirmaintenance and upbringing. 8 Cf. Oscar Lewis, La Vida: A Puerto Rican Family in the Culture of Poverty--San Juan & New York,1965 and 1966, Random Ho., NY.

SOCIAL PRECARITY AND SOCIAL INTEGRATIONTHE EUROPEAN OPINION RESEARCH GROUP EEIG
EUROBAROMETER 56.1. – OCTOBER 2002 Page 47
Table 3.2 shows the effect of these financially disadvantaged childhoods on thefinancial difficulties experienced in adulthood. As might be expected, there is a strongcorrelation between these two variables: the probability of financial difficulties inadulthood increases if the childhood background was economically disadvantaged9.However, the strength of this correlation varies from one country to another, even ifwe control not only for the effects of gender and age (model 1), but also for the effectof household income (model 2). In southern countries, the regression coefficients arealways very high and statistically significant, indicating that reproduction of financialdifficulties experienced in childhood is prevalent. In the northern countries, thecoefficients are on the whole weaker and not always significant: in eastern Germany,Great Britain, the Netherlands and Finland the coefficient is not significant in any ofthe models. In other words, the tendency for childhood financial difficulties to bereproduced is less noticeable in the northern countries than in southern ones, doubtlessbecause income disparities are on the whole smaller in the north. In the countrieswhich enjoyed a period of rapid economic and social growth, as was the case duringthe "Three glorious decades", prospects for upward social mobility were also betterthan in the less developed countries of southern Europe, which were also countries ofemigration. Poverty has tended and still tends to be a social destiny in economicallypoor countries or regions, where unemployment and underemployment are high andsocial security is less developed.
The risk of social isolation
Another aspect of the experience of poverty is the risk of social isolation. A numberof research projects have shown that the poor often live closed in on themselves,unable to enjoy social ties and relationships that could help with their difficulties. Wecan measure this risk of social isolation in various ways.
9 This issue has been analysed recently: Cf. Mary Corcoran, "Mobility, Persistence, and theConsequences of Poverty for Children: Child and Adult Outcomes", in Sheldon H. Danziger andRobert H. Haveman (eds.), Understanding Poverty, New York, Russell Sage Foundation,/HarvardUniversity Press, 2001.

SOCIAL PRECARITY AND SOCIAL INTEGRATIONTHE EUROPEAN OPINION RESEARCH GROUP EEIG
EUROBAROMETER 56.1. – OCTOBER 2002 Page 48
Potential support
First, it is possible to take account of individuals’ ability to count on someone insituations of difficulty, something we may call "potential support". The surveydistinguishes three situations: 1) "if you felt depressed"; 2) "if you needed helpfinding work for yourself or for a family member"; 3) "if you had to borrow money tohelp pay an urgent bill like the electricity or gas bill, or the rent or a mortgagepayment". Figure 3.5 shows the proportion of people who said that they would havesomeone they could count on, for each of these three situations. The figure showsproportions, firstly, among the whole population in each country and secondly amongjust those with the lowest incomes (below lower quartile), for both 1996 and 2001.
Figure 3.5
0
20
40
60
80
Bel
gium
Den
mar
k
Wes
tG
erm
any
East
Ger
man
y
Fran
ce
Gre
at B
ritai
n
Irel
and
The
Net
herla
nds
Finl
and
Swed
en
Aus
tria
Luxe
mbo
urg
Italy
Spai
n
Gre
ece
Portu
gal
Source:Eurobarometer -LASMAS-IdL1996 2001
Northern countries Southern countries
Potential SupportWhole population

SOCIAL PRECARITY AND SOCIAL INTEGRATIONTHE EUROPEAN OPINION RESEARCH GROUP EEIG
EUROBAROMETER 56.1. – OCTOBER 2002 Page 49
Potential SupportLowest incomes (low first quartile)
0
20
40
60
80
Bel
gium
Den
mar
k
Wes
tG
erm
any
East
Ger
man
y
Fran
ce
Gre
at B
ritai
n
Irel
and
The
Net
herla
nds
Finl
and
Swed
en
Aus
tria
Luxe
mbo
urg
Italy
Spai
n
Gre
ece
Portu
gal
Source: Eurobarometer-LASMAS-IdL1996 2001
Northern countries Southern countries

SOCIAL PRECARITY AND SOCIAL INTEGRATIONTHE EUROPEAN OPINION RESEARCH GROUP EEIG
EUROBAROMETER 56.1. – OCTOBER 2002 Page 50
Though there are variations from country to country, the most obvious fact is thedifference between the first and second parts of this figure. While in the case of thewhole population the proportion of people with someone to count on in these threesituations increased markedly between 1996 and 2001 in most countries, we find theopposite for the 25% with the lowest incomes. "Potential support" has diminished forthem, in all countries except Denmark, the Netherlands and Italy.
The likelihood of being able to count on someone in situations of difficulty dependson a number of variables, and in particular gender, age, employment status, the yearof the survey, and income (cf. table 3.3). Once we have taken account of thedifferences between countries, it should be emphasised that women have a betterchance than men of enjoying this type of support do. Young people also, ceterisparibus, are better supported than older ones. The availability of potential support infact decreases steadily with age10.
This age effect results first of all from the progressive reduction as one age in thenumber of older family members. The weakening of potential support with age canalso be explained by social customs of helping younger people to get a start in life:where a young person who has difficulties in getting established and setting up ahome may be helped by his or her family, older individuals are more likely to bethought of as having failed to make the effort to provide for themselves; they will alsobe less comfortable asking the family for help, for accepting such help in maturitymay be interpreted as the result of individual failure or inadequacy. This produces notonly an objective dependence of young people on their family and entourage forsupport (of a material or moral kind or both), but also collective expectations andsocial standards concerning this type of assistance.
10 This observation has been verified e.g. by Serge Paugam and Jean-Paul Zoyem, "Le soutien financierde la famille: une forme essentielle de la solidarité", [Financial support from families: an essential formof solidarity] Economie et Statistique, n°308-309-310, 1997, 8/9/10, pp. 187-120

SOCIAL PRECARITY AND SOCIAL INTEGRATIONTHE EUROPEAN OPINION RESEARCH GROUP EEIG
EUROBAROMETER 56.1. – OCTOBER 2002 Page 51
Table 3.3 Logistic regression for the probability of being able to count onsomeone in the times of difficulty (standardised for country)
Model 1 Model 2GenderMen Reference ReferenceWomen 0.11*** 0.12***Age15 - 24 0.43*** 0.45***25 - 34 0.31*** 0.33***35 - 44 Reference Reference45 - 54 -0.18*** -0.18***55 - 64 -0.39*** -0.37***65+ -0.42*** -0.35***Employment status In paid work Reference ReferenceUnemployed -0.62*** -0.53***Inactive -0.37*** -0.32***Year1996 Reference Reference2001 0.25*** 0.40***Income 1below lower quartile -0.17*** -lower quartile to median -0.15*** -median to upper quartile -0.13*** -above upper quartile Reference -Interactions1996-below lower quartile - 0.27***2001-below lower quartile - -0.46***
*: P <0.05, **: P < 0.01, ***: P < 0,001
Employment status also has an effect. The probability of those who are unemployedor otherwise economically inactive being able to count on someone in the event ofdifficulty is less than for those in paid work. The negative coefficient is larger for theunemployed than for others outside the workforce, whichever model we choose. Wemay also note a significant income effect: the likelihood of being able to get such helpincreases with income. The poor and the unemployed are thus more sociallyvulnerable, ceteris paribus, than other categories. Though their material andpsychological situation might well require more support from their entourage than isneeded by other categories, they are unfortunately often deprived of such support, forlack of an easily mobilised network near at hand.

SOCIAL PRECARITY AND SOCIAL INTEGRATIONTHE EUROPEAN OPINION RESEARCH GROUP EEIG
EUROBAROMETER 56.1. – OCTOBER 2002 Page 52
Lastly, the logistic regression confirms an increase in potential support between 1996and 2001 for the whole population: the coefficient for 2001 is 0.25 (by comparisonwith reference year, 1996) in the first model and 0.40 in the second. On the otherhand, the interactive effect of survey year and income below the lower quartile, inmodel 2, shows that the situation was worse in 2001 for those with the lowest incomes(a statistically significant coefficient of –0.46). This gives some confirmation of thegeneral tendency seen in figure 3.5.
Social contact and sense of social isolation
To measure the risk of social isolation, we can also work out a social contact("sociability") index from the information available in the 2001 survey. Sevenvariables are used to represent social contact: they are expressed as follows:
- I speak to my neighbours almost every day
- I see my friends many times a week
- I meet family members not belonging to my household many times a week
- I belong to a sports or leisure club
- I belong to a voluntary or charity group
- I belong to a political party
- I go to church regularly (or another place of worship).
These variables admittedly stand for fairly different sorts of social contact; we may inparticular distinguish between the informal social contact of social affinity networks(family, friends and neighbours) and the organised social contact of associations,clubs, parties and churches. The Cronbach test, though, which measures the degree oflinkage among the various items in a composite index, gives a satisfactory result(0.63), warranting the use of our social contact index based on these seven variables.

SOCIAL PRECARITY AND SOCIAL INTEGRATIONTHE EUROPEAN OPINION RESEARCH GROUP EEIG
EUROBAROMETER 56.1. – OCTOBER 2002 Page 53
Figure 3.6 presents this index both for the whole population and for the group with thelowest incomes (below lower quartile). Once more, there is a clearly visible differencebetween southern countries and northern ones. In the former, the social contact of thepoorest people is greater than for the population as a whole, except in Portugal wherethe levels are roughly equal. In the northern countries, we find the opposite tendency,except in Ireland and Great Britain and, to a lesser extent, in eastern Germany. At allevents, it cannot be concluded that in all countries the poor have a very low level ofsocial contact compared with the rest of the population. The social isolation of themost deprived people is, as revealed by this indicator of social contact, by no meanssystematic.
Figure 3.6

SOCIAL PRECARITY AND SOCIAL INTEGRATIONTHE EUROPEAN OPINION RESEARCH GROUP EEIG
EUROBAROMETER 56.1. – OCTOBER 2002 Page 54
Index of social contact, 2001
0
0,5
1
1,5
2
2,5
Bel
gium
Den
mar
k
Wes
t Ger
man
y
East
Ger
man
y
Fran
ce
Gre
at B
ritai
n
Irel
and
The
Net
herla
nds
Finl
and
Swed
en
Aus
tria
Luxe
mbo
urg
Italy
Spai
n
Gre
ece
Portu
gal
Whole population
Lowest incomes
Northern countries Southern countries
Source: Eurobarometer-LASMAS-IdL
We may also, however, look a little more closely by using an index of subjectivesocial isolation. This index may be calculated from four variables in the 2001 survey:
- I have felt lonely at certain moments in the two last weeks
- It’s hard to have friends where I live
- I feel left out of society
- I feel isolated from my family

SOCIAL PRECARITY AND SOCIAL INTEGRATIONTHE EUROPEAN OPINION RESEARCH GROUP EEIG
EUROBAROMETER 56.1. – OCTOBER 2002 Page 55
As in the case of the social contact index, these variables are not all of a kind, eventhough they all report a sense of isolation: the first is general in scope, while theothers each mention one particular aspect of isolation, in relation to the friends,society and the family. We repeated the Cronbach test for this index, and again theresult was satisfactory (0.73), so we are warranted in using it in our analyses.
Figure 3.7 shows that this index varies considerably from country to country. Theindex of subjective social isolation is relatively weak in Denmark, the Netherlands,Spain and Italy by comparison with other countries. On the other hand, in all thecountries without exception, we find a distinctly higher value of this index for thosewith the lowest incomes by comparison with that for the whole population.
Figure 3.7

SOCIAL PRECARITY AND SOCIAL INTEGRATIONTHE EUROPEAN OPINION RESEARCH GROUP EEIG
EUROBAROMETER 56.1. – OCTOBER 2002 Page 56
Index of subjective social isolationin 2001
0
0,2
0,4
0,6
0,8
1
1,2
1,4
Bel
gium
Den
mar
k
Wes
t Ger
man
y
East
Ger
man
y
Fran
ce
Gre
at B
ritai
n
Irel
and
The
Net
herla
nds
Finl
and
Swed
en
Aus
tria
Luxe
mbo
urg
Italy
Spai
n
Gre
ece
Portu
gal
Whole population
Lowest incomes
Northern countries Southern countries
Source: Eurobarometer-LASMAS-IdL

SOCIAL PRECARITY AND SOCIAL INTEGRATIONTHE EUROPEAN OPINION RESEARCH GROUP EEIG
EUROBAROMETER 56.1. – OCTOBER 2002 Page 57
The tendencies observed on the basis of the objective social contact index, then, donot match those observed on the basis of the index of subjective social isolation. Thedifference between the northern countries and southern countries in the case of thosewith the lowest incomes is not found for both indices: while poor people in thesouthern countries have more social contact than the average for those countries11,they feel more isolated socially, as do poor people in the northern countries. Thisdifference actually reveals a weakness in our measure of social contact: obtainingmeasures of the frequency of relationships is necessary, but still not sufficient forexplaining their quality; an individual may be surrounded by kin and unable toappreciate this proximity much, at the same time as feeling the lack of relationships heor she finds subjectively important. It is thus quite possible to have a high level of[objective] social contact and still not be in touch with what the psychologists call"significant others". When social contact is of an informal kind, as it is more often insouthern countries, it is probable that it is also often constrained, determined in asense by the requirements of common life and the paucity of collective venues in theneighbourhoods or villages where a large part of the population lives in conditions ofpoverty.
What are the factors, which determine both social contact and the propensity to feel,isolated socially? Ceteris paribus, women have more social contact than men: thedifference is slight, but statistically significant; on the other hand they also feel moreisolated (cf. Table 3.4). Social contact, as we have measured it, also increasesmarkedly with age, peaking among those aged 65 years and more (who have reachedthe age of retirement and therefore may have more time to devote to their family andfriends and to club activity). There is on the other hand no statistically significant ageeffect on subjective social isolation.
As might be expected, those with the lowest incomes have the least social contact andalso feel the most isolated socially. This observation is confirmed by the indicator offinancial difficulty. The result can be explained, at least partly, by the cost ofparticipating in social life, which is often considerable whether in the form ofmembership of sports clubs or cultural associations or of the cost of inviting friends orneighbours home, or going on group outings. Lastly, while the unemployeds do nothave significantly less social contact than those in paid work, they do however feelmore isolated socially than the others.
11 This has been observed before. Cf. Serge Paugam and Helen Russell, "The Effects of EmploymentPrecarity and Unemployment on Social Isolation", in Duncan Gallie and Serge Paugam (eds.), WelfareRegimes and the Experience of Unemployment in Europe, Oxford, Oxford University Press, 2000, pp.243-264.

SOCIAL PRECARITY AND SOCIAL INTEGRATIONTHE EUROPEAN OPINION RESEARCH GROUP EEIG
EUROBAROMETER 56.1. – OCTOBER 2002 Page 58
Table 3.4 Ordered logistic regression for social contact and the probability offeeling socially isolated (Standardised for country)
Social contact Subjective social isolationGenderMen Reference ReferenceWomen 0.05** 0.07***Age15 - 24 -0.26*** -0.04 n.s.25 - 34 -0.16*** -0.01 n.s.35 - 44 Reference Reference45 - 54 0.08** -0.01 n.s.55 - 64 0.20*** -0.01 n.s.65+ 0.28*** -0.01 n.s.Incomebelow lower quartile -0.19*** 0.34***lower quartile to median -0.09** 0.09***median to upper quartile -0.06* 0.02 n.s.above upper quartile Reference ReferenceFinancial difficultiesNo Reference ReferenceYes -0.17*** 0.35***Employment statusIn paid work Reference ReferenceUnemployed -0.04 n.s. 0.28***Inactive 0.18*** 0.05***
*: P <0.05, **: P < 0.01, ***: P < 0,001, n.s.: not significant
Among the four variables taken into account in calculating the index of subjectivesocial isolation, one explicitly refers to the place of residence: this deserves particularattention. This is the difficulty of having friends where one lives (cf. table 3.5).Ceteris paribus, and to a statistically significant extent, women reported difficulties ofthis type more often than men did. The under-25s, on the other hand, appear to isdistinctly less affected than their elders are by this problem. Unemployed people moreoften feel that it is difficult to have friends where they live than do those in paid work.

SOCIAL PRECARITY AND SOCIAL INTEGRATIONTHE EUROPEAN OPINION RESEARCH GROUP EEIG
EUROBAROMETER 56.1. – OCTOBER 2002 Page 59
Table 3.5 Ordered logistic regression on the probability of feeling that it isdifficult to have friends where one lives
Variables B. Sig.GenderMen ReferenceWomen 0.10***Age15 - 24 -0.29***25 - 34 -0.01 n.s.35 - 44 Reference45 - 54 -0.02 n.s.55 - 64 -0.04 n.s.65+ -0.08 n.s.
Employment statusIn paid work ReferenceUnemployed 0.35***Inactive -0.02 n.s.Type of communeVillage or countryside -0.17***Town ReferenceCity 0.13***Interaction of variables:Country/below lower quartile (Q1)Northern countriesBelgium-Q1 0.20 n.s.Denmark-Q1 0.02 n.s.Germany-West-Q1 0.57***Germany-East-Q1 0.45***France-Q1 0.44***Great Britain-Q1 0.50*Ireland-Q1 0.16 n.s.Luxembourg-Q1 0.22 n.s.Netherlands-Q1 -0.08 n.s.Finland-Q1 1.02***Sweden-Q1 0.50***Austria-Q1 0.63***Southern countriesItaly-Q1 0.16 n.s.Spain-Q1 0.07 n.s.Greece-Q1 -0.01 n.s.Portugal-Q1 0.31*
*: P <0.05, **: P < 0.01, ***: P < 0,001, n.s.: not significant

SOCIAL PRECARITY AND SOCIAL INTEGRATIONTHE EUROPEAN OPINION RESEARCH GROUP EEIG
EUROBAROMETER 56.1. – OCTOBER 2002 Page 60
We find also that the type of locality has a significant effect: major conurbation giverise to this difficulty more than villages or the countryside, despite expectations to thecontrary (the frequently assumed "peace and solitude" of the countryside).
Lastly, using the interaction of variables "country* income below lower quartile in themodel proves that there is a statistically significant poverty effect in many northerncountries, especially Germany (east and west), France, Great Britain, Finland, Swedenand Austria. Of the southern countries, the coefficients obtained are not significant inItaly, Spain or Greece, and only slightly so in Portugal. This difference between thenorthern and southern countries should be related to the results on social contact. Wemay suppose that when social contact is well developed, the probability of feeling thatit is difficult to have friends where one lives will be lower, which does not mean,however, that one is totally immune to the possibility of social isolation, or that onewill feel surrounded by friends.
When we study social networks, we have to be particularly attentive to theircomposition. Figure 3.8 gives the proportion of people who say that more than half oftheir friends are unemployed, both for the population as a whole and for those withthe lowest incomes (below lower quartile). By comparison with the whole population,the poorest people are proportionally more likely, in all the countries except Sweden,to have at least 50% of their friends among the unemployed. This result isconfirmation that the help the poorest can mobilise is less because of this particularcomposition of their network of friends.

SOCIAL PRECARITY AND SOCIAL INTEGRATIONTHE EUROPEAN OPINION RESEARCH GROUP EEIG
EUROBAROMETER 56.1. – OCTOBER 2002 Page 61
Figure 3.8
Proportion of respondents reporting that more than half their friends are unemployed
0
5
10
15
20
25
30
35
40
Bel
gium
Den
mar
k
Wes
t Ger
man
y
East
Ger
man
y
Fran
ce
Gre
at B
ritai
n
Irel
and
The
Net
herla
nds
Finl
and
Swed
en
Aus
tria
Luxe
mbo
urg
Italy
Spai
n
Gre
ece
Portu
gal
Wholepopulation
Lowestincomes
Northern countries Southern countries
Source:Eurobarometer-LASMAS-IdL

SOCIAL PRECARITY AND SOCIAL INTEGRATIONTHE EUROPEAN OPINION RESEARCH GROUP EEIG
EUROBAROMETER 56.1. – OCTOBER 2002 Page 62
We need, though, to look at the ratio of those with the lowest incomes to the wholepopulation in terms of this indicator (cf. table 3.6). The higher this ratio, the more wemay infer that the poor have a social network of friends of a polarised kind, quitedifferent from those of the whole population. This ratio is over 2 in Belgium, westernGermany, Great Britain, Ireland, Finland and Austria. In these countries, we maydeduce that the poor have a distinctly more disadvantaged social network than will befound for the population as a whole. In southern countries, on the other hand, the ratiois nearer 1, especially in Italy, indicating that there is little difference in terms of thepresence of unemployed friends in the composition of the social networks of thepoorest and of the whole population.
Table 3.6 Indicator of social polarisation based on the composition of networksof friends
More than half of friendsunemployed Ratio: low-income
group/whole pop.Northern countriesBelgium 2.06Denmark 1.46Germany-West 2.67Germany-East 1.34France 1.76Great Britain 2.02Ireland 2.22Netherlands 1.69Luxembourg 1.27Finland 2.82Sweden 0.98Austria 2.84Southern countriesItaly 1.09Spain 1.29Greece 1.52Portugal 1.41
This result can largely be explained by reference to the composition of unemploymentin southern countries. Unemployment affects mostly women and young people,especially in Italy, even though it is also more widespread there in the wholepopulation. In other words, having a large proportion of unemployed friends in one’scircle is to some extent a sign that this circle is made up of young people and women,which is of course to be expected, for the poor just as for others.
SOCIAL PRECARITY AND SOCIAL INTEGRATIONTHE EUROPEAN OPINION RESEARCH GROUP EEIG
EUROBAROMETER 56.1. – OCTOBER 2002 Page 63
Differences in the quality of life
Lastly, the experience of poverty may be grasped on the basis of replies concerningthe quality of life. We can distinguish many aspects of this: some relate to satisfactionwith family life and social life and others to the dilapidation of local surroundings,and social devaluation.
Satisfaction with family life
The question concerning satisfaction with family life appears in the surveys for 1996and 2001 and therefore enables us to make comparisons over time. The first part offigure 3.9 refers to the whole population for these two dates, while the secondconcerns only those with the lowest incomes. The first impression we have from thisgraph is indeed the contrast between the first and second parts: in both survey periods,satisfaction with family life is distinctly greater in the population as a whole than forthose whose income is at or below the lower quartile. Low incomes not only hinderthe achievement of family plans, but can also, of course, by causing financialdifficulties, damage a family’s balance and the psychological health of its members.
There is also a strikingly general tendency for satisfaction with family life to improvebetween 1996 and 2001 for the population as a whole, while the opposite generaltendency is apparent for those with the lowest incomes, except in Luxembourg.
Figure 3.9

SOCIAL PRECARITY AND SOCIAL INTEGRATIONTHE EUROPEAN OPINION RESEARCH GROUP EEIG
EUROBAROMETER 56.1. – OCTOBER 2002 Page 64
Satisfaction with family life Whole population
0
10
20
30
40
50
60
70
80
Bel
gium
Den
mar
k
Wes
t Ger
man
y
Esat
Ger
man
y
Fran
ce
Gre
at B
ritai
n
Irel
and
The
Net
herla
nds
Finl
and
Swed
en
Aus
tria
Luxe
mbo
urg
Italy
Spai
n
Gre
ece
Portu
gal
1996 2001
Northern countries Southern countries
Source:Eurobarometer-LASMAS-IdL

SOCIAL PRECARITY AND SOCIAL INTEGRATIONTHE EUROPEAN OPINION RESEARCH GROUP EEIG
EUROBAROMETER 56.1. – OCTOBER 2002 Page 65
Satisfaction with family life Low incomes (low first quartile)
0
10
20
30
40
50
60
70
80
Bel
gium
Den
mar
k
Wes
t Ger
man
y
East
Ger
man
y
Fran
ce
Gre
at B
ritai
n
Irel
and
The
Net
ehrla
nds
Finl
and
Swed
en
Aus
tria
Luxe
mbo
urg
Italy
Spai
n
Gre
ece
Portu
gal
1996 2001
Northern countries Southern countries
Source:Eurobarometer-LASMAS-IdL
There are also large differences from country to country to be noted. For both yearsand both income levels, satisfaction with family life is highest in Denmark and lowestin Italy. Now Italy is often regarded as the country most essentially devoted to thefamily, and the way society is run there is often interpreted in terms of a "familistic"model. Though the results of our surveys may not necessarily be contradicting theseconventional representations and analyses of the Italian family, it is necessary to stressthat the current family model, especially its feature that grown offspring continue fora long while to live in the parents’ household, can feel to individuals like astraitjacket.

SOCIAL PRECARITY AND SOCIAL INTEGRATIONTHE EUROPEAN OPINION RESEARCH GROUP EEIG
EUROBAROMETER 56.1. – OCTOBER 2002 Page 66
Among the explanatory variables for satisfaction with family life, we should point tothe following as significant, ceteris paribus: gender, employment status, the surveyyear, income, and the interaction of year*income (cf. table 3.7).

SOCIAL PRECARITY AND SOCIAL INTEGRATIONTHE EUROPEAN OPINION RESEARCH GROUP EEIG
EUROBAROMETER 56.1. – OCTOBER 2002 Page 67
Table 3.7 Logistic regression for satisfaction with family life (Standardised for country)
Model 1 Model 2GenderMen Reference ReferenceWomen 0.04* 0.05**Age15 - 24 -0.01 n.s. 0.01 n.s.25 - 34 0.02 n.s. 0.04 n.s.35 - 44 Reference Reference45 - 54 -0.01 n.s. -0.01 n.s.55 - 64 0.10* 0.13*65+ 0.08 n.s. 0.12*Employment status In paid work Reference ReferenceUnemployed -0.49*** -0.38***Inactive 0.02 n.s. 0.10***Year1996 Reference Reference2001 0.16*** 0.39***Incomebelow lower quartile -0.05 n.s. -lower quartile to median 0.07 * -median to upper quartile 0.15*** -above upper quartile Reference -Interactions1996-below lower quartile - 0.46***2001-below lower quartile - -0.77***
*: P <0.05, **: P < 0.01, ***: P < 0,001, n.s.: not significant
Women are slightly more satisfied with family life than men. There is no significantage effect to be seen. On the other hand, the unemployed are a great deal less satisfiedwith family life than those in paid work. We have known since the first major surveysof unemployment in the 1930s that it is often a source of tensions within thehousehold, and can threaten its equilibrium12. This effect, then, is now confirmed oncemore, to a highly significant extent.
12Among the earliest systematic surveys of the experience of unemployment, we should mention: P.Lazarsfeld, M. Jahoda, H. Zeisel, Marienthal: The Sociology of an Unemployed Community, London,Tavistock, 1933 (translation in French: Les chômeurs de Marienthal, Paris, Editions de Minuit,1981).et E.W.Bakke, The Unemployed Worker: A Study of the Task of Making a Living without a Job,New Haven, Yale University Press, 1940

SOCIAL PRECARITY AND SOCIAL INTEGRATIONTHE EUROPEAN OPINION RESEARCH GROUP EEIG
EUROBAROMETER 56.1. – OCTOBER 2002 Page 68
The results of the logistic regression also confirm that satisfaction with family life ismore prevalent in 2001 than in 1996 for the population as a whole. However, if wecombine this with the "income below lower quartile" variable, the coefficient is 0.46for 1996 and –0.77 for 2001, meaning that satisfaction with family life grew worse in2001 for those with the lowest incomes: the reverse of the trend observed for thewhole population.
Satisfaction with social life
The question on satisfaction also concerned social life. As in the case of satisfactionwith family life, we find large differences from country to country. The proportion ofpeople who are satisfied in this domain is once again highest in Denmark, followed bythe Netherlands, being over 60% in the first case and just 50% in the second (cf.figure 3.10).
It is tempting to relate satisfaction with social life to the circumstances of socialpolicy in each country. Denmark and the Netherlands are in fact two countriescharacterised by considerable intervention by the state and government authoritieswith respect to social security and access to social rights. This is an insufficientexplanation, though; for the proportion of people satisfied with their social lives isrelatively low in France and Germany, also countries where the intervention of theWelfare State is considerable. We therefore clearly need to attribute satisfaction withsocial life to a whole set of factors connected more generally with the quality of life,of which social policy is only one dimension.
The lower part of figure 3.10 once more concerns the lowest income group, while theupper part describes the population as a whole. What we find is a general tendencytowards greater satisfaction with social life for the population as a whole between1996 and 2001, while there is a clearly contrary trend between these two dates if welook at the poorest layer of the population: among those below the lower quartileincome, the proportion of people satisfied with social life is lower in 2001 than in1996, in all countries (Luxembourg once more excepted).

SOCIAL PRECARITY AND SOCIAL INTEGRATIONTHE EUROPEAN OPINION RESEARCH GROUP EEIG
EUROBAROMETER 56.1. – OCTOBER 2002 Page 69
Figure 3.10
Satisfaction with social life Whole population
0
10
20
30
40
50
60
Bel
gium
Den
mar
k
Wes
tG
erm
any
East
Ger
man
y
Fran
ce
Gre
at B
ritai
n
Irel
and
The
Net
herla
nds
Finl
and
Swed
en
Aus
tria
Luxe
mbo
urg
Italy
Spai
n
Gre
ece
Portu
gal
1996 2001
Northern countries Southern countries
Source:Eurobarometer-LASMAS-IdL

SOCIAL PRECARITY AND SOCIAL INTEGRATIONTHE EUROPEAN OPINION RESEARCH GROUP EEIG
EUROBAROMETER 56.1. – OCTOBER 2002 Page 70
Satisfaction with social life Low incomes (low first quartile)
0
10
20
30
40
50
60
Bel
gium
Den
mar
k
Wes
tG
erm
any
East
Ger
man
y
Fran
ce
Gre
at B
ritai
n
Irel
and
The
Net
herla
nds
Finl
and
Swed
en
Aus
tria
Luxe
mbo
urg
Italy
Spai
n
Gre
ece
Portu
gal
1996 2001
Northern countries Southern countries
Source:Eurobarometer LASMAS-IdL
Satisfaction with social life may be analysed on the basis of the same explanatoryvariables as we used for satisfaction with family life (cf. table 3.8). The effects,however, are not exactly the same. Women were slightly more satisfied than men withtheir family life; but they are less satisfied than men with their social life. True, thecoefficients are small, but they are significant. We may surely interpret these results interms of a persistent contrast in the masculine and feminine models of self-affirmation, in spheres of integration which retain gender differences, at least in part.
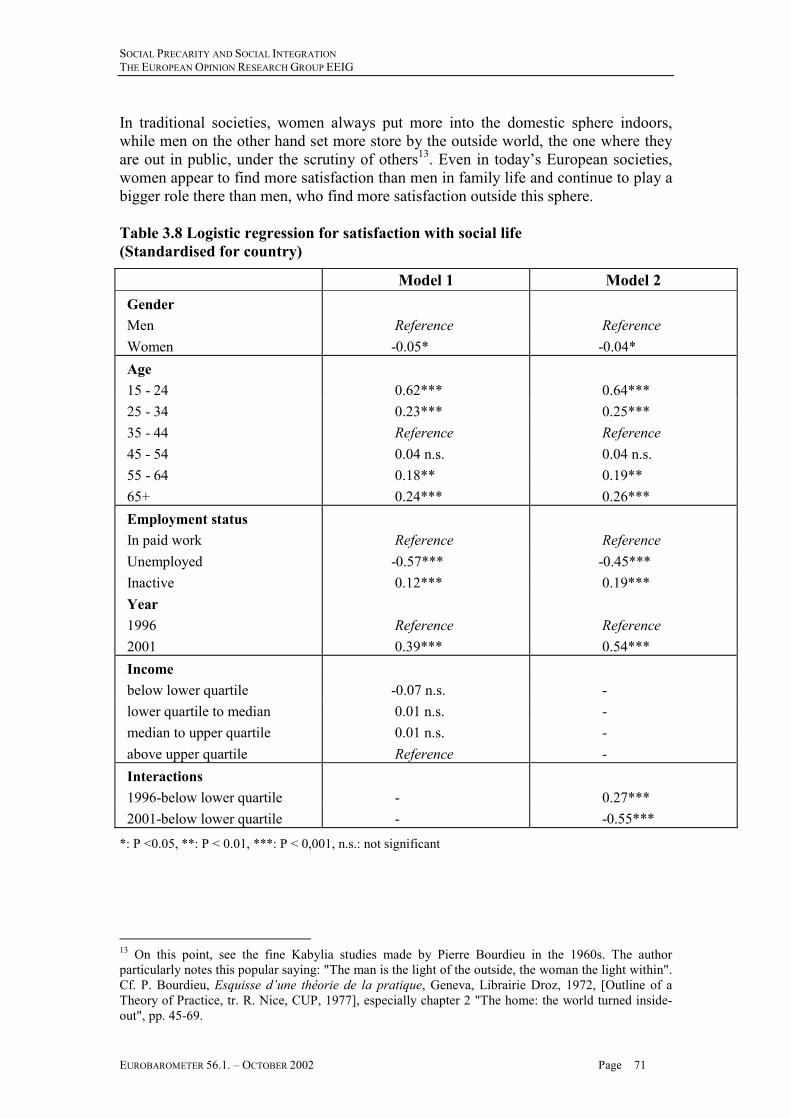
SOCIAL PRECARITY AND SOCIAL INTEGRATIONTHE EUROPEAN OPINION RESEARCH GROUP EEIG
EUROBAROMETER 56.1. – OCTOBER 2002 Page 71
In traditional societies, women always put more into the domestic sphere indoors,while men on the other hand set more store by the outside world, the one where theyare out in public, under the scrutiny of others13. Even in today’s European societies,women appear to find more satisfaction than men in family life and continue to play abigger role there than men, who find more satisfaction outside this sphere.
Table 3.8 Logistic regression for satisfaction with social life (Standardised for country)
Model 1 Model 2GenderMen Reference ReferenceWomen -0.05* -0.04*Age15 - 24 0.62*** 0.64***25 - 34 0.23*** 0.25***35 - 44 Reference Reference45 - 54 0.04 n.s. 0.04 n.s.55 - 64 0.18** 0.19**65+ 0.24*** 0.26***Employment status In paid work Reference ReferenceUnemployed -0.57*** -0.45***Inactive 0.12*** 0.19***Year1996 Reference Reference2001 0.39*** 0.54***Incomebelow lower quartile -0.07 n.s. -lower quartile to median 0.01 n.s. -median to upper quartile 0.01 n.s. -above upper quartile Reference -Interactions1996-below lower quartile - 0.27***2001-below lower quartile - -0.55***
*: P <0.05, **: P < 0.01, ***: P < 0,001, n.s.: not significant
13 On this point, see the fine Kabylia studies made by Pierre Bourdieu in the 1960s. The authorparticularly notes this popular saying: "The man is the light of the outside, the woman the light within".Cf. P. Bourdieu, Esquisse d’une théorie de la pratique, Geneva, Librairie Droz, 1972, [Outline of aTheory of Practice, tr. R. Nice, CUP, 1977], especially chapter 2 "The home: the world turned inside-out", pp. 45-69.

SOCIAL PRECARITY AND SOCIAL INTEGRATIONTHE EUROPEAN OPINION RESEARCH GROUP EEIG
EUROBAROMETER 56.1. – OCTOBER 2002 Page 72
We may also point to a positive age effect. Satisfaction with social life is in factstrongest at the two ends of the age scale, among the 15 - 24 year-olds and those 65and over, and we see lower values in the middle of this scale, around 35 to 54 years ofage.
As might be expected, the unemployed are distinctly less satisfied with their sociallife than those in paid work. We may also confirm that satisfaction with social life ishigher in 2001 than in 1996 for the population as a whole. However when weintroduce an interaction of the two variables "year" and "income below lowerquartile", we find that satisfaction with social life had declined by 2001 for those withthe lowest incomes (coefficient –0.55, statistically significant). There are thus anumber of indicators all pointing to a tendency towards a polarisation: those with thelowest incomes on the one hand, and the rest on the other.
Run-down local surroundings and social devaluation
Lastly, for our assessment of quality of life, we have calculated two new indices, oneconcerning the surroundings of life and their deterioration, the other on the feeling ofsocial devaluation. The index of deterioration of local surroundings has beencalculated on the basis of the three following variables:
- there is run-down housing where I live;
- there is a great deal of unemployment where I live;
- there are drug addiction problems where I live.
While these three variables are formally personal assessments, they are not entirelysubjective for all that, being based on close observation of the neighbourhood orvillage of residence. The Cronbach test gives a highly satisfactory result (0.84),proving the strength of the link among these three aspects of deterioration in localsurroundings.

SOCIAL PRECARITY AND SOCIAL INTEGRATIONTHE EUROPEAN OPINION RESEARCH GROUP EEIG
EUROBAROMETER 56.1. – OCTOBER 2002 Page 73
Figure 3.11
Index of run-down local surroundings, 2001
0
0,5
1
1,5
2
2,5
Bel
gium
Den
mar
k
Wes
t Ger
man
y
East
Ger
man
y
Fran
ce
Gre
at B
ritai
n
Irel
and
The
Net
herla
nds
Finl
and
Swed
en
Aus
tria
Luxe
mbo
urg
Italy
Spai
n
Gre
ece
Portu
gal
Whole population
Lowest incomes
Northern countries Southern countries
Source:Eurobarometer LASMAS-IdL
A number of observations emerge from figure 3.11. In the first place, there are majordifferences among countries. The index is low in western Germany, Sweden, Austriaand Luxembourg, while it is high in Great Britain, Greece and Portugal. Secondly, inall the countries, we find that this index of deterioration is higher for those with thelowest incomes than for the population as a whole. Thirdly, the divide between thepopulation as a whole and the lowest income group is fairly narrow in Greece andPortugal, which are in economic terms the poorest countries in the European Union.
The index of social devaluation has been calculated on the basis of the five followingvariables:
- I don’t feel that what I do is valued by people;

SOCIAL PRECARITY AND SOCIAL INTEGRATIONTHE EUROPEAN OPINION RESEARCH GROUP EEIG
EUROBAROMETER 56.1. – OCTOBER 2002 Page 74
- I feel left out of society;
- I don’t feel I play a useful part in society;
- Certain people look down on me because of my income or my situation;
- The neighbourhood where I live has a bad reputation.

SOCIAL PRECARITY AND SOCIAL INTEGRATIONTHE EUROPEAN OPINION RESEARCH GROUP EEIG
EUROBAROMETER 56.1. – OCTOBER 2002 Page 75
The Cronbach test for the index of social devaluation defined in this way gives asatisfactory result (0.73). What these five variables have in common is the expressionof a negative individual point of view on the basis of the individual’s own perceptionof others’ judgement of him or her. Social devaluation results from the internalisationof a negative self-image connected with a lack of social recognition, not feelingtrusted, feeling shut out, or having a bad reputation. Social devaluation corresponds,therefore, to an individual and collective experience of a process that leads to alowered social status. It has been found that people on benefit have this experiencewhen they turn to social services asking to be looked after because they are unable,temporarily or for the long term, to cope with their own needs.14
Figure 3.12
14 Cf. Serge Paugam, La disqualification sociale,[Social devaluation'] Paris, PUF, 1991, new edition,the "Quadrige" series, 2002.

SOCIAL PRECARITY AND SOCIAL INTEGRATIONTHE EUROPEAN OPINION RESEARCH GROUP EEIG
EUROBAROMETER 56.1. – OCTOBER 2002 Page 76
Index of social exclusion, 2001
0
0,2
0,4
0,6
0,8
1
1,2
1,4
1,6
1,8
Bel
gium
Den
mar
k
Wes
t Ger
man
y
East
Ger
man
y
Fran
ce
Gre
at B
ritai
n
Irel
and
The
Net
herla
nds
Finl
and
Swed
en
Aus
tria
Luxe
mbo
urg
Italy
Spai
n
Gre
ece
Portu
gal
Whole population
Lowest incomes
Northern countries Southern countries
Source:Eurobarometer-LAMAS-IdL
Figure 3.12 shows us that those with the lowest incomes are, in all countries, moreexcluded socially than the population as a whole. The index of social devaluation ishighest in Finland and Great Britain.

SOCIAL PRECARITY AND SOCIAL INTEGRATIONTHE EUROPEAN OPINION RESEARCH GROUP EEIG
EUROBAROMETER 56.1. – OCTOBER 2002 Page 77
Table 3.9 Logistic regression for run-down local surroundings and the feeling ofexclusion (standardised for country)
Run-down localsurroundings Feeling of exclusion
GenderMen Reference ReferenceWomen -0.05 n.s. -0.03**Age15 - 24 0.14** -0.05*25 - 34 0.04 n.s. -0.02 n.s.35 - 44 Reference Reference45 - 54 -0.05* -0.01 n.s.55 - 64 -0.12** -0.06*65+ -0.25*** -0.17***Incomebelow lower quartile 0.37*** 0.29***lower quartile to median 0.22*** 0.12***median to upper quartile 0.13** 0.05*above upper quartile Reference ReferenceFinancial difficultiesNo Reference ReferenceYes 0.54*** 0.48***Employment statusIn paid work Reference ReferenceUnemployed 0.21*** 0.40***Inactive -0.01 n.s. 0.09***
P <0.05, **: P < 0.01, ***: P < 0,001, n.s.: not significant
Among the factors called on to explain these two indices, we may note that, to a slightbut statistically significant extent, women less often feel excluded than men; in thecase of run-down local surroundings the gender coefficient is not significant.
Younger people tend more to live in dilapidated surroundings than older ones, and theolder they are, the less likely their local surroundings are to be in a poor state. Thesense of being excluded is negatively correlated with age, in all comparisons with thereference group, that of people aged 35 to 44. We may therefore regard this group asthe one most affected by social devaluation; and point out that this condition is harderto cope with when it comes around the mid-term of life, at an age when collectiveexpectations of individuals are particularly high, both at work and in social and familylife.

SOCIAL PRECARITY AND SOCIAL INTEGRATIONTHE EUROPEAN OPINION RESEARCH GROUP EEIG
EUROBAROMETER 56.1. – OCTOBER 2002 Page 78
Living in run-down surroundings and the sense of being excluded socially are both[negatively] correlated with income. The coefficient is highest for the lowest incomegroups; and, logically enough, individuals who have financial difficulties, as well asthe unemployed, are also more likely to be faced with a run-down environment andsocial devaluation.
Conclusion
The experience of poverty was analysed in the first section of this chapter on the basisof financial difficulties, and specifically difficulties paying for food and rent in thecourse of the previous twelve months. The results confirm that the situation of allhouseholds taken together has improved since 1993; but if we study the changes forhouseholds whose income is at or below the lower quartile, it becomes obvious thatthe situation has got worse in many countries. Our regression analysis has enabled usto confirm this phenomenon for difficulties in paying the rent; and we have also beenable to confirm that these difficulties are distinctly worse in the southern countries ofEurope, especially Greece and Portugal. The duration of periods of financial difficultyis also markedly longer in southern countries, and their reappearance in adults afterfeaturing in their childhood background is also more frequent there. We may thereforesay that household poverty in money terms is more structural in the southerncountries, confirming the results of the previous chapter on inherited poverty.
In the second section, we looked at a number of indicators for assessing the risk ofsocial isolation. The proportion of people who consider they can count on someone intimes of difficulty has risen in most of the countries between 1996 and 2001 so far asthe population as a whole is concerned; but on the other hand it has fallen sharplyamong those whose income is at or below the lower quartile. We also found that thesocial contact index we calculated is higher in southern countries, particularly for thepoorest people. If we turn to a more subjective index of social isolation, we find thatthe poorest 25% still have a greater sense of being isolated than the population as awhole. Lastly, we were able to verify that people in friendship networks where morethan half are unemployed are more widely distributed throughout the population insouthern countries, suggesting that there is less stigma and better social integration forthe unemployed in these countries than in the northern ones.
In the third section, our analysis of satisfaction with family life and social lifeconfirmed a trend towards a more marked polarisation between the poorest 25% andthe rest of the population. While the results clearly show that satisfaction with familylife, and with social life, has risen overall between 1996 and 2001, this is not true forthat layer of the population whose incomes are at or below the lower quartile, forwhom we observe a net decline in all countries. We also notice a wide gap betweenthe poorest 25% and the population as a whole so far as the dilapidation of localsurroundings and the sense of social devaluation are concerned.

SOCIAL PRECARITY AND SOCIAL INTEGRATIONTHE EUROPEAN OPINION RESEARCH GROUP EEIG
EUROBAROMETER 56.1. – OCTOBER 2002 Page 79
CHAPTER 4
WORK PRECARITY : TASK QUALITY AND WORK PRESSURE
Introduction
In recent years there has been a growing recognition that employment policy isintegrally linked to the risks of social exclusion. This has been reflected in a strongerpolicy emphasis on boosting employment rates to provide an adequate quantity ofjobs. More recently, attention also has been directed at the effects of the qualitativeaspects of employment. Employment per se does not guarantee social integration; inthe longer run, poor quality jobs are likely to make people highly vulnerable to jobloss and to eventual labour market marginalisation. In particular, it has becomeevident that the quality of jobs is a vital factor affecting motivation, physical andpsychological health, opportunities for the development and maintenance of skills,and the security needed to construct coherent work and non-work life plans.Monitoring the way in which patterns of work are evolving is then central for theconstruction of adequate policies against social exclusion.
The Social Exclusion Survey included a number of questions designed to providecomparison over time with a survey commissioned by DG Employment in 1996.These enable us to assess change in a range of work and employment conditions thathave been shown to have important implications for work motivation, psychologicalwell-being and opportunities self-development. This chapter will focus on the qualityof the immediate job task and the intensity of work, while Chapter 5 will beconcerned with the opportunities for long-term skill development and the level of jobsecurity.
Where jobs undermine work motivation and psychological health, people are morelikely to quit their jobs, increasing their risk of unemployment, or to withdraw fromthe labour market altogether. Two factors have been shown to be particularly crucialin this respect: the quality of the work task and the level of pressure at work. Agrowing literature has pointed to the importance of task quality – in particular thedegree of control people have over how they do their work - as a crucial factoraffecting both work motivation and the risk of psychological and physical illness(Kohn and Schooler, 1983; Karasek and Theorell, 1990; Johnson and Johansson,1991). There has also been very consistent evidence from prior research that workpressure is a source of more general psychological stress. A central issue, then, iswhether jobs have been changing over time in terms of the quality of work tasks andthe work pressure people experience.

SOCIAL PRECARITY AND SOCIAL INTEGRATIONTHE EUROPEAN OPINION RESEARCH GROUP EEIG
EUROBAROMETER 56.1. – OCTOBER 2002 Page 80
The Quality of the Immediate Job Task
Previous research has highlighted a number of key dimensions of the job task that canbe important both for people’s experience of work and their non-work lives. The firstis the variety of the job – the extent to which it involves a diversity of sub-tasks orconsists of highly repetitive actions. The second is people’s capacity to continue todevelop their knowledge through carrying out the work. The third, which has becomeincreasingly central to discussions of well-being at work, is the extent to which theindividual can take decisions about how the work is carried out.
The measures of intrinsic job quality were based on four question items. Respondentswere given a list of statements and asked to report, using a four point scale, how trueor untrue each was about their own particular job. The questions were designed to beapplicable to the widest possible range of jobs and to direct attention to the factualnature of the jobs. Items were chosen to relate to the key conceptual dimensions ofintrinsic job quality discussed above - the variety of the work, the opportunities forskill development and the scope for personal initiative. The wording of the items was
- "There is a lot of variety in my work"
- "My job requires that I keep learning new things"
- "I have a lot of say over what happens in my job"
- "My job allows me to take part in decisions that affect my work"
Table 4.1 presents the full distribution of answers for employees. A first point to noteis that, in terms of these measures, only a minority of employees in 2001 were in jobsof high quality. Only 27% thought that it was very true that there was a lot of varietyin their work and only 28% that they kept on learning new things on the job. Only18% reported it was very true that they had a lot of say over what happened on the joband 23% that they had the ability to take part in decisions that affected their work.Second, if change over time is examined, on all four measures, task quality had grownpoorer between 1996 and 2001. The proportion of those strongly agreeing there was alot of variety had fallen by 6 percentage points, while there had been a decline of 3points for the ability to keep on learning and take part in decisions, and of 5 points forthe say people had over the job.

SOCIAL PRECARITY AND SOCIAL INTEGRATIONTHE EUROPEAN OPINION RESEARCH GROUP EEIG
EUROBAROMETER 56.1. – OCTOBER 2002 Page 81
Table 4.1 Job Task Characteristics Employees 1996-2001
Very true Quite true A little true Not at alltrue
A lot of variety1996 33.0 30.9 22.1 13.92001 27.4 33.3 24.7 14.6Ability to learn1996 31.1 29.2 24.6 15.12001 28.3 31.2 24.0 16.5Say over what happens1996 23.3 30.5 27.7 18.52001 18.3 31.7 27.0 23.0Take part in decisions1996 26.0 30.2 23.9 20.02001 23.2 31.3 24.8 20.7
To simplify the analysis, and at the same time use the full range of responses, a scaleof intrinsic job quality can be constructed from the four items15. Each item was scoredfrom 3 for "very true" to 0 for "not at all true", and the scale score represents theaverage score across the four items. As can be seen in Table 4.2, the overall taskquality score declined from 1.70 in 1996 to 1.62 in 2001, a change that was at a highlevel of statistical significance (p=<.001).
15 The different job characteristics were clearly very closely related. A reliability analysis gave asatisfactory Cronbach alpha of .78. A principal components analysis confirmed that the items related toa single underlying dimension. The eigenvalue was 2.40 and the factor accounted for 60% of thevariance.
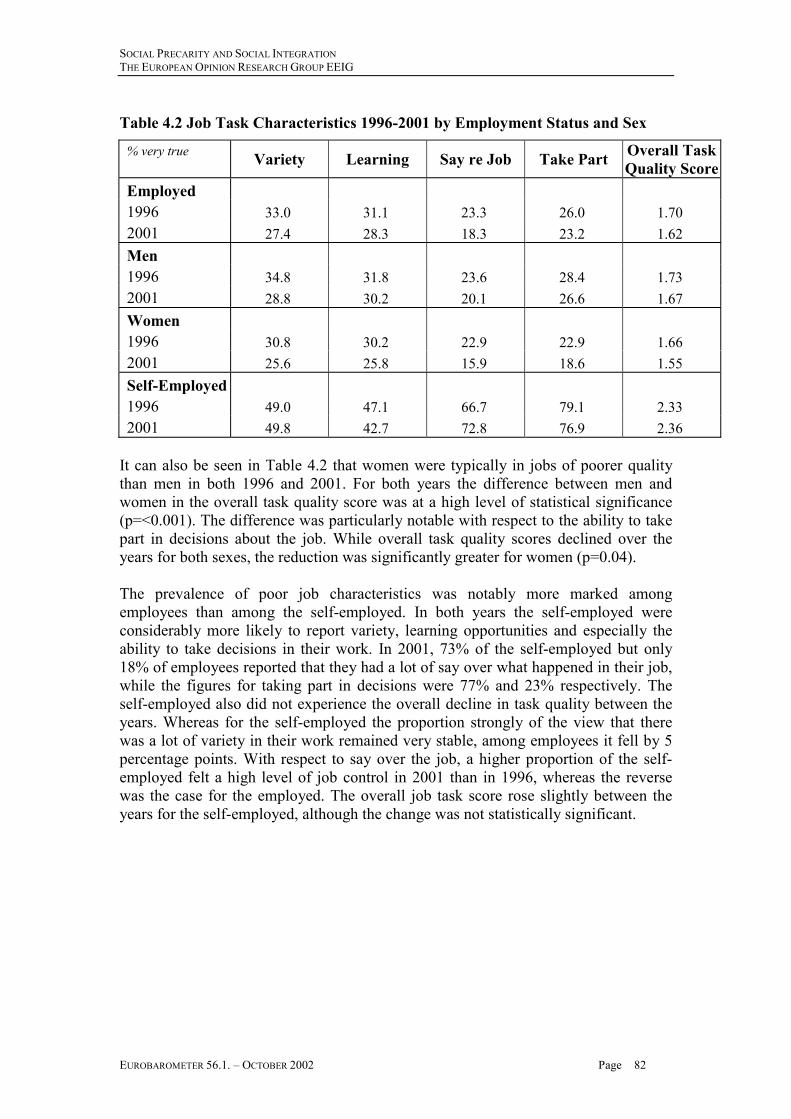
SOCIAL PRECARITY AND SOCIAL INTEGRATIONTHE EUROPEAN OPINION RESEARCH GROUP EEIG
EUROBAROMETER 56.1. – OCTOBER 2002 Page 82
Table 4.2 Job Task Characteristics 1996-2001 by Employment Status and Sex
% very true Variety Learning Say re Job Take Part Overall TaskQuality Score
Employed1996 33.0 31.1 23.3 26.0 1.702001 27.4 28.3 18.3 23.2 1.62Men1996 34.8 31.8 23.6 28.4 1.732001 28.8 30.2 20.1 26.6 1.67Women1996 30.8 30.2 22.9 22.9 1.662001 25.6 25.8 15.9 18.6 1.55Self-Employed1996 49.0 47.1 66.7 79.1 2.332001 49.8 42.7 72.8 76.9 2.36
It can also be seen in Table 4.2 that women were typically in jobs of poorer qualitythan men in both 1996 and 2001. For both years the difference between men andwomen in the overall task quality score was at a high level of statistical significance(p=<0.001). The difference was particularly notable with respect to the ability to takepart in decisions about the job. While overall task quality scores declined over theyears for both sexes, the reduction was significantly greater for women (p=0.04).
The prevalence of poor job characteristics was notably more marked amongemployees than among the self-employed. In both years the self-employed wereconsiderably more likely to report variety, learning opportunities and especially theability to take decisions in their work. In 2001, 73% of the self-employed but only18% of employees reported that they had a lot of say over what happened in their job,while the figures for taking part in decisions were 77% and 23% respectively. Theself-employed also did not experience the overall decline in task quality between theyears. Whereas for the self-employed the proportion strongly of the view that therewas a lot of variety in their work remained very stable, among employees it fell by 5percentage points. With respect to say over the job, a higher proportion of the self-employed felt a high level of job control in 2001 than in 1996, whereas the reversewas the case for the employed. The overall job task score rose slightly between theyears for the self-employed, although the change was not statistically significant.

SOCIAL PRECARITY AND SOCIAL INTEGRATIONTHE EUROPEAN OPINION RESEARCH GROUP EEIG
EUROBAROMETER 56.1. – OCTOBER 2002 Page 83
As can be seen from Table 4.3, there were marked differences in task quality byoccupational class with the score of those in managerial and professional occupationsapproximately twice that of employees in elementary occupations. The decline in taskquality also affected different occupational groups to a very different extent. Therewas no evidence of a change in the conditions of those in craft and related work, andthe change was relatively small for professionals and technicians. The sharpestdeclines were among clerical employees, service and sales workers, and machineoperatives.
Table 4.3 Job Quality Scores by Occupational Group (Employees)1996 2001 2001-1996
Legislators/Managers 2.38 2.27 -0.11Professionals & Managers 2.12 2.08 -0.04Technicians/ Assoc Profs 1.90 1.84 -0.06Clerical 1.71 1.57 -0.14Service & Sales 1.63 1.44 -0.19Craft & Related 1.48 1.54 0.06Plant & Machine Ops 1.44 1.23 -0.21Elementary Occupations 1.14 1.03 -0.11
Was there a significant change over the years in the disadvantage experienced by non-skilled workers? This is examined in Table 4.4 through regression analyses thatcontrol for sex, age and country effects. The first two columns (Models 1 and 2) showthe occupational class coefficients and their significance for each year takenseparately. The relative quality of tasks of different classes is shown relative to thesituation of those in managerial occupations. It reveals a very sharp and highlysignificant class gradient in both years, with those in elementary occupations havingthe strongest negative coefficients.
The third model is based on the pooled data for both years and shows the coefficientsfor the interaction terms between classes and year 2001. The direction of thecoefficients (positive or negative) and the significance of these terms show how taskquality changed relative to the situation of managers between the two years. It can beseen that only craft and related workers improved their position. The relative positionof the most disadvantaged of all – those in elementary occupations – remainedunchanged.

SOCIAL PRECARITY AND SOCIAL INTEGRATIONTHE EUROPEAN OPINION RESEARCH GROUP EEIG
EUROBAROMETER 56.1. – OCTOBER 2002 Page 84
Table 4.4 Task Quality Class Effects (Employees) 1996-2001Model 1 Model 2 Model 3
1996 ClassCoefficients
2001 ClassCoefficients
Class /YearInteractions
Legislators/Managers ref. ref. ref.Professionals & Managers -0.21*** -0.15* 0.05 n.s.Technicians/ Assoc Profs -0.43*** -0.38*** 0.05 n.s.Clerical -0.58*** -0.62*** -0.04 n.s.Service & Sales -0.67*** -0.73*** -0.08 n.s.Craft & Related -0.87*** -0.72*** 0.15 **Plant & Machine Ops -0.96*** -1.04*** -0.09 n.s.Elementary Occupations -1.16*** -1.16*** 0.00 n.s.Adj R2 (full model) 0.20 0.19 0.21N 6581 6724 13306
Note 3: * = P < 0.05, ** = P < 0.01, *** = P < 0.001
Table 4.5 Task Quality Scores by Country1996 2001 Change 2001-1996
Austria 1.72 1.71 -0.01Belgium 1.66 1.47 -0.19Denmark 2.14 2.27 0.13Finland 1.84 2.02 0.18France 1.83 1.64 -0.19Germany 1.62 1.63 0.01Great Britain 1.76 1.64 -0.12Greece 1.79 1.52 -0.27Ireland 1.61 1.38 -0.23Ireland N 1.45 1.55 0.10Italy 1.59 1.56 -0.03Luxembourg 1.57 1.82 0.25Netherlands 1.74 1.69 -0.05Portugal 1.38 1.50 0.12Spain 1.55 1.34 -0.21Sweden 2.15 1.84 -0.31
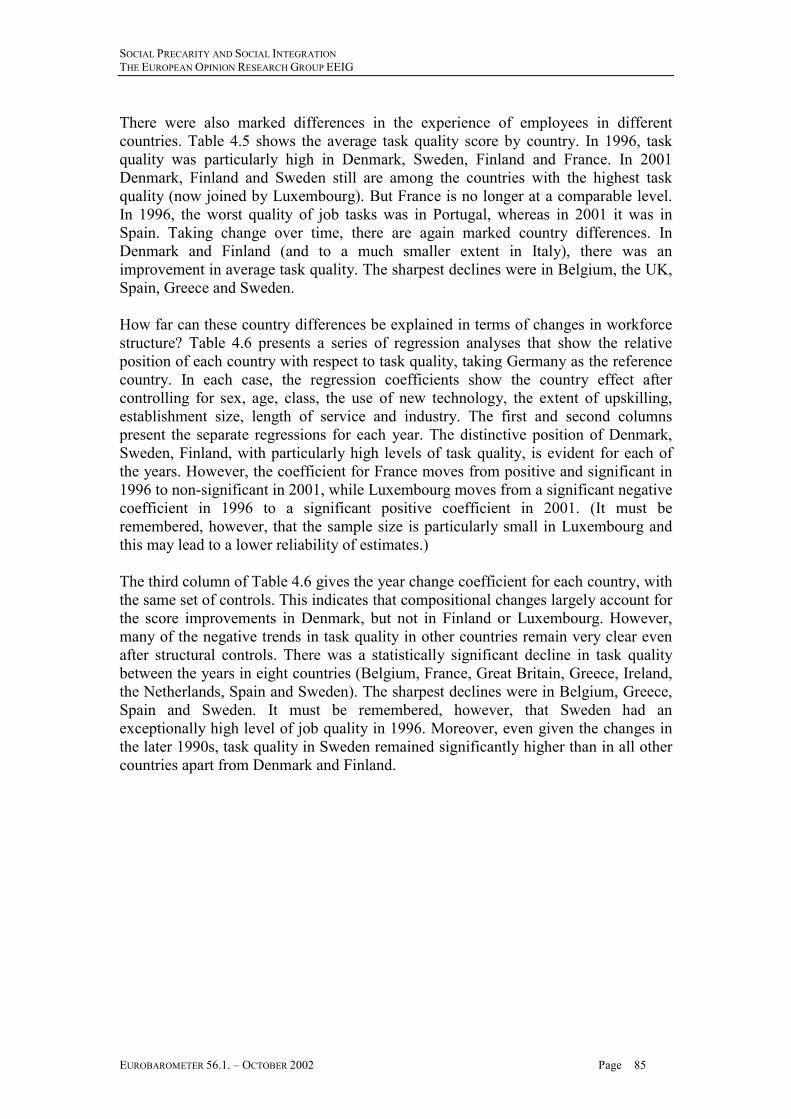
SOCIAL PRECARITY AND SOCIAL INTEGRATIONTHE EUROPEAN OPINION RESEARCH GROUP EEIG
EUROBAROMETER 56.1. – OCTOBER 2002 Page 85
There were also marked differences in the experience of employees in differentcountries. Table 4.5 shows the average task quality score by country. In 1996, taskquality was particularly high in Denmark, Sweden, Finland and France. In 2001Denmark, Finland and Sweden still are among the countries with the highest taskquality (now joined by Luxembourg). But France is no longer at a comparable level.In 1996, the worst quality of job tasks was in Portugal, whereas in 2001 it was inSpain. Taking change over time, there are again marked country differences. InDenmark and Finland (and to a much smaller extent in Italy), there was animprovement in average task quality. The sharpest declines were in Belgium, the UK,Spain, Greece and Sweden.
How far can these country differences be explained in terms of changes in workforcestructure? Table 4.6 presents a series of regression analyses that show the relativeposition of each country with respect to task quality, taking Germany as the referencecountry. In each case, the regression coefficients show the country effect aftercontrolling for sex, age, class, the use of new technology, the extent of upskilling,establishment size, length of service and industry. The first and second columnspresent the separate regressions for each year. The distinctive position of Denmark,Sweden, Finland, with particularly high levels of task quality, is evident for each ofthe years. However, the coefficient for France moves from positive and significant in1996 to non-significant in 2001, while Luxembourg moves from a significant negativecoefficient in 1996 to a significant positive coefficient in 2001. (It must beremembered, however, that the sample size is particularly small in Luxembourg andthis may lead to a lower reliability of estimates.)
The third column of Table 4.6 gives the year change coefficient for each country, withthe same set of controls. This indicates that compositional changes largely account forthe score improvements in Denmark, but not in Finland or Luxembourg. However,many of the negative trends in task quality in other countries remain very clear evenafter structural controls. There was a statistically significant decline in task qualitybetween the years in eight countries (Belgium, France, Great Britain, Greece, Ireland,the Netherlands, Spain and Sweden). The sharpest declines were in Belgium, Greece,Spain and Sweden. It must be remembered, however, that Sweden had anexceptionally high level of job quality in 1996. Moreover, even given the changes inthe later 1990s, task quality in Sweden remained significantly higher than in all othercountries apart from Denmark and Finland.

SOCIAL PRECARITY AND SOCIAL INTEGRATIONTHE EUROPEAN OPINION RESEARCH GROUP EEIG
EUROBAROMETER 56.1. – OCTOBER 2002 Page 86
Table 4.6 Task Quality Country effects and Country Model 1 Model 2 Models 3
1996 CountryCoefficients
2001 CountryCoefficients
Within CountryYear Changes
Austria 0.06 n.s. 0.04 n.s. -.01 n.s.Belgium 0.04 n.s. -0.20 *** -.24 ***Denmark 0.51 *** 0.56 *** .04 n.s.Finland 0.10 * 0.24 *** .15 ***France 0.16 *** 0.00 n.s. -.19 ***Germany ref. ref. .02 n.s.Great Britain 0.07 n.s. -0.05 n.s. -.14 **Greece 0.13 ** -0.12 * -.27 ***Ireland -0.05 n.s. -0.22 *** -.17 **Italy -0.02 n.s. -0.02 n.s. -.00 n.s.Luxembourg -0.13 ** 0.15 ** .29 ***Netherlands 0.04 n.s. -0.04 n.s. -.12 **Portugal -0.16 *** -0.08 (*) -.02 n.s.Spain -0.05 n.s. -0.24 *** -.24 ***Sweden 0.41 *** 0.13 *** -.28 ***N 6393 6708Adj R2 0.28 0.30
Note 1: OLS Regressions. Model 1 and 2 Control for sex, age, class, use of new technology, skillchange, establishment size, length of service and industry for each year separately. The third columnpresents year change coefficients from separate regressions for each country.Note 2: (*)=P<0.10, * = P < 0.05, ** = P < 0.01, *** = P < 0.001
The evidence provides then a rather disturbing picture of lack of progress inimproving aspects of the work situation that have been shown to be crucial toopportunities for self-development and the maintenance of learning skills. Given theavailability of other work specifically dedicated to this subject, the survey has notsought to measure trends across time in the other major aspect of task quality - healthand safety conditions. However, it is interesting that the main source of survey data onthis (European Foundation for the Improvement of Living and Working Conditions,2001) also found little improvement across time taking the period 1990 to 2000. Itnotes; "There was no improvement in classic workplace hazards such as noise,vibrations, inhaling fumes and dangerous substances, high and low temperatures,carrying heavy loads and working in painful and tiring positions". While overall therewas a slight decline in the perceived risk of work to people’s health and safety (from30% in 1990 to 27% in 2000), there was an increase between 1995 and 2000 in thereport of work-related health problems such as backache, overall fatigue andheadaches. In short, whether one takes the "learning" or the "physical health" aspectsof task quality, the general conclusion is of a failure to achieve a significantimprovement in the work environment in recent years.

SOCIAL PRECARITY AND SOCIAL INTEGRATIONTHE EUROPEAN OPINION RESEARCH GROUP EEIG
EUROBAROMETER 56.1. – OCTOBER 2002 Page 87
The Intensification of work?
A second aspect of the quality of work life that has been of central concern is that ofwork pressure. There is evidence that the first half of the 1990s saw a marked increasein the intensity of work, as a result of increased competitive pressure, changes in theskill requirements of jobs, the introduction of new technologies and the decline oftrade union power (Green and McIntosh, 2001). Did this trend continue in the period1996 to 2001?
The survey included four measures of work pressure that had been asked in 1996.These were:
- My job requires that I work very hard
(5 point response scale: Strongly agree- Strongly disagree)
- I work under a great deal of pressure
(2 point response scale: Agree-Disagree)
- I never seem to have enough time to get everything done in my job
(5 point response scale: Strongly agree- Strongly disagree)
- I often have to work extra time, over and above the formal hours of my job to getthrough the work or to help out.
(5 point response scale: Strongly agree- Strongly disagree)
The distributions for those agreeing with each question are given in Table 4.7. Foreach measure there was a decline in the proportion reporting that they experienced ahigh level of work pressure between 1996 and 2001. An overall index of workpressure was constructed by averaging the scores for the four items16. This confirmsthat there was a general tendency for work pressure to fall between the years. It alsoshows that the decline occurred for both men and women.
The final measure given in the last four rows of Table 4.7 is a question asking peoplewhether or not there had been a significant change in "the effort you have to put intoyour job in the past five years". In 1996, nearly half of all employees (48%) said thatthere had been an increase in effort demands. In 2001, although those reporting anincrease still greatly outweighed those reporting a decrease, the proportion that hadexperienced an intensification of work had fallen to 41% and was now lower than thatfor people for whom there had been no change in the effort required in their job.
16 The 5 point items were coded from 4 (strongly agree) to 0 (strongly disagree). The two point itemwas coded 4 (applies) and 1 (does not apply). Different versions of measure were tested with differentcoding of the second item but the results are unaffected. The scale has an acceptable alpha of 0.72.

SOCIAL PRECARITY AND SOCIAL INTEGRATIONTHE EUROPEAN OPINION RESEARCH GROUP EEIG
EUROBAROMETER 56.1. – OCTOBER 2002 Page 88
Table 4.7 Work Intensity (Employees) 1996-20011996 2001
Job requires that works very hardStrongly agrees 28.1 23.2Agrees 40.1 41.5Works under a great deal of pressureAgrees 43.0 42.4Never enough time to get everything doneStrongly agree 15.3 13.3Agree 27.3 26.6Works extra time over formal hoursStrongly agree 15.4 14.6Agree 26.2 27.8Work Pressure IndexAll 2.33 2.29Men 2.39 2.36Women 2.25 2.20Change in work effort last 5 yearsIncreased 47.5 41.3Same 46.1 51.4Decreased 6.4 7.3
In both years work pressure was strongly related to occupational class. Table 4.8 givesthe results of regression analyses in which other classes are compared with that ofManagers as the reference category. The analysis controlled for sex, age and country.The first two models give the results for 1996 and 2001 separately, while the thirdmodel takes the class/year interaction terms in a pooled model to assess whether therewere significant changes in relative class positions across time. In 1996 all classes hadsignificantly lower work pressure scores than managers. Work pressure scores wereparticularly low among service and sales workers and those in elementaryoccupations. The pattern was broadly similar in 2001. Service and sales workers werenow less distinctive from other categories of employee than in 1996, although those inelementary occupations still had very much lower scores than all other groups.However, the final model in Table 4.8 (model 3) shows that (with the possibleexception of technicians and associate professionals) there were no statisticallysignificant changes between 1996 and 2001 in the relative work pressure experiencedby employees in different occupational classes.
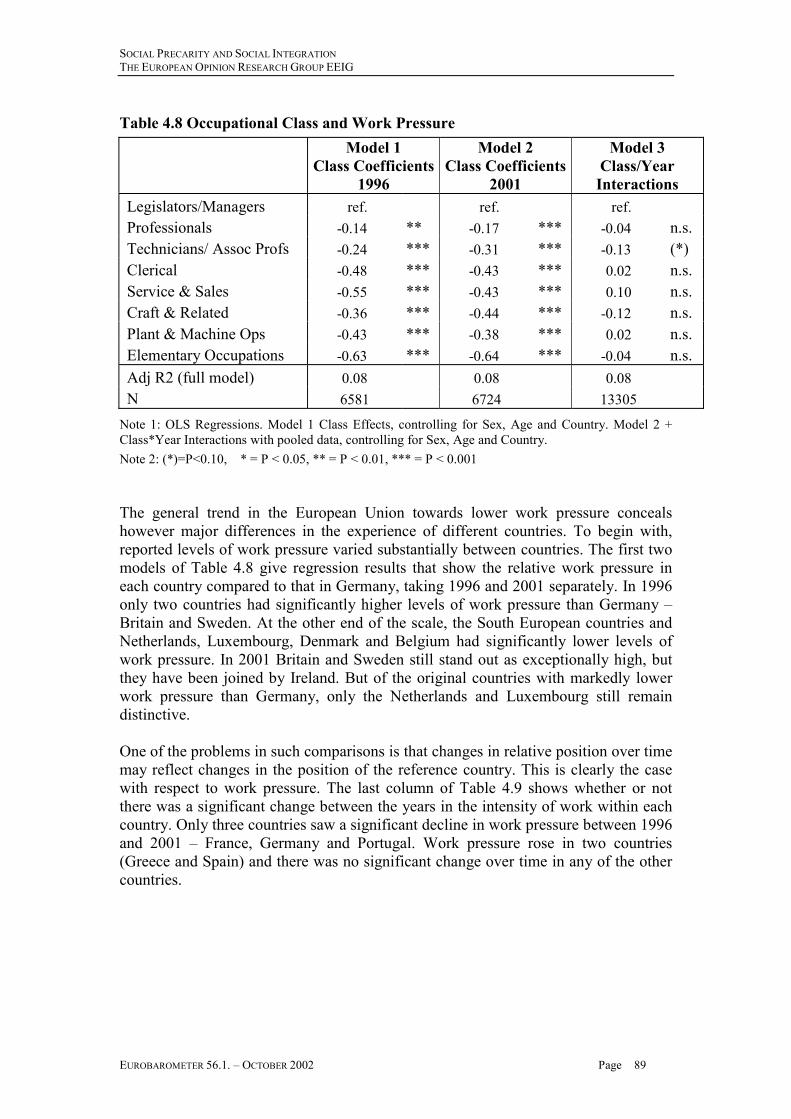
SOCIAL PRECARITY AND SOCIAL INTEGRATIONTHE EUROPEAN OPINION RESEARCH GROUP EEIG
EUROBAROMETER 56.1. – OCTOBER 2002 Page 89
Table 4.8 Occupational Class and Work Pressure Model 1
Class Coefficients1996
Model 2Class Coefficients
2001
Model 3Class/YearInteractions
Legislators/Managers ref. ref. ref.Professionals -0.14 ** -0.17 *** -0.04 n.s.Technicians/ Assoc Profs -0.24 *** -0.31 *** -0.13 (*)Clerical -0.48 *** -0.43 *** 0.02 n.s.Service & Sales -0.55 *** -0.43 *** 0.10 n.s.Craft & Related -0.36 *** -0.44 *** -0.12 n.s.Plant & Machine Ops -0.43 *** -0.38 *** 0.02 n.s.Elementary Occupations -0.63 *** -0.64 *** -0.04 n.s.Adj R2 (full model) 0.08 0.08 0.08N 6581 6724 13305
Note 1: OLS Regressions. Model 1 Class Effects, controlling for Sex, Age and Country. Model 2 +Class*Year Interactions with pooled data, controlling for Sex, Age and Country.Note 2: (*)=P<0.10, * = P < 0.05, ** = P < 0.01, *** = P < 0.001
The general trend in the European Union towards lower work pressure concealshowever major differences in the experience of different countries. To begin with,reported levels of work pressure varied substantially between countries. The first twomodels of Table 4.8 give regression results that show the relative work pressure ineach country compared to that in Germany, taking 1996 and 2001 separately. In 1996only two countries had significantly higher levels of work pressure than Germany –Britain and Sweden. At the other end of the scale, the South European countries andNetherlands, Luxembourg, Denmark and Belgium had significantly lower levels ofwork pressure. In 2001 Britain and Sweden still stand out as exceptionally high, butthey have been joined by Ireland. But of the original countries with markedly lowerwork pressure than Germany, only the Netherlands and Luxembourg still remaindistinctive.
One of the problems in such comparisons is that changes in relative position over timemay reflect changes in the position of the reference country. This is clearly the casewith respect to work pressure. The last column of Table 4.9 shows whether or notthere was a significant change between the years in the intensity of work within eachcountry. Only three countries saw a significant decline in work pressure between 1996and 2001 – France, Germany and Portugal. Work pressure rose in two countries(Greece and Spain) and there was no significant change over time in any of the othercountries.

SOCIAL PRECARITY AND SOCIAL INTEGRATIONTHE EUROPEAN OPINION RESEARCH GROUP EEIG
EUROBAROMETER 56.1. – OCTOBER 2002 Page 90
Table 4.9 Country and Work Pressure Scores
Model 1 Model 2 Models 31996 CountryCoefficients
2001 CountryCoefficients
Within CountryYear Change
Austria -0.11 * 0.01 n.s. -0.02 n.s.Belgium -0.23 *** -0.10 (*) 0.01 n.s.Denmark -0.14 ** -0.05 n.s. -0.10 n.s.Finland -0.02 n.s. 0.07 n.s. -0.07 n.s.France -0.09 (*) -0.09 (*) -0.19 **Germany ref. ref. -0.17 ***Great Britain 0.16 *** 0.30 *** -0.06 n.s.Greece -0.13 * 0.06 n.s. 0.21 **Ireland 0.02 n.s. 0.15 ** -0.04 n.s.Italy -0.25 *** -0.07 n.s. 0.03 n.s.Luxembourg -0.23 *** -0.16 ** -0.10 n.s.Netherlands -0.36 *** -0.14 ** 0.04 n.s.Portugal -0.20 *** -0.08 n.s. -0.04 n.s.Spain -0.31 *** -0.06 n.s. 0.18 **Sweden 0.16 *** 0.34 *** -0.02 n.s.N 6383 6708Adj R2 0.11 0.09
Note 1: Higher scores indicate higher work pressureNote 2: (*)=P<0.10, * = P < 0.05, ** = P < 0.01, *** = P < 0.001
The factors underlying country differences in work pressure may reflect a wide arrayof factors, from relatively immediate economic pressure to longer structuralcharacteristics of work organisation. They may be influenced for instance by thedifficulty in recruiting new employees or by the degree of emphasis on increasedlabour productivity. If one takes annual percentage change in employment as a proxyfor the likely staffing pressures on employers, there is not a significant correlation for2001 between country employment changes and the country work pressure scores (-0.09, p=0.75). However, there was an association between the level of work pressureand annual percentage change in labour productivity (0.54; p=0.04). These are clearlyrelatively crude measures and more detailed research is needed.

SOCIAL PRECARITY AND SOCIAL INTEGRATIONTHE EUROPEAN OPINION RESEARCH GROUP EEIG
EUROBAROMETER 56.1. – OCTOBER 2002 Page 91
Conclusion
The quality of job tasks is of central importance for the maintenance of people’slearning skills and has also been shown to be an important factor mediating the effectsof work pressure on stress and psychological ill-health. Those who are confined topoor quality jobs are then less likely to acquire or maintain the competences needed toensure employment stability in a world of rapid technological and economic change.At the same time, they are more likely to be subject to the types of pressures that leadto withdrawal from the labour market.
The evidence from the survey indicates that not only were a substantial proportion ofemployees in poor quality jobs, but that, at least over the period from 1996 to 2001,there had been some deterioration in the quality of job tasks rather than the type ofimprovement required for an effective policy of reducing risks of social exclusion.Most particularly, the quality of work tasks of the most vulnerable category ofemployee – the non-skilled – declined over the period and their relative positionremained unchanged.
In contrast, there was no evidence to confirm the frequently asserted trend towardsheightened work intensification. In most countries the level of work pressureremained unchanged from the mid-1990s. Indeed, in two countries – France andGermany – the evidence points to a small but significant reduction in work pressures.
The picture that emerges is one that differs rather sharply from analyses based on theearly to mid 1990s (Capelli et al. 1997; Gallie et al. 1998) where the trend appeared tobe one in which progressive upskilling, in part driven by the spread of computertechnologies, was leading to task enlargement, the devolution of decision-making toemployees and more intense work pressure. Further research is required to establishwhy such changes have occurred. But speculatively there are at least two factors thatwould be worth closer investigation. The first is the growth of stricter forms ofexternal regulation of work life (for instance with respect to health and safety normsand obligations to customers/clients) that may have made employers more cautiousabout the degree of autonomy that should be exercised by employees. The second isthe evolution of computer systems and their role in the overall work process. Whereasthe earlier 1990s was marked by the spread of stand-alone computer technologies thatmay well have encouraged greater task discretion for employees, the second half ofthe 1990s saw the expansion of more integrated network systems that may havesubstantially facilitated closer monitoring of work performance and acted as aconstraint on employees’ ability to take decisions on the job.

SOCIAL PRECARITY AND SOCIAL INTEGRATIONTHE EUROPEAN OPINION RESEARCH GROUP EEIG
EUROBAROMETER 56.1. – OCTOBER 2002 Page 92
CHAPTER 5
WORK PRECARITY: SKILL DEVELOPMENT AND JOBSECURITY
The previous chapter examined the trends in the quality of job tasks with theirimplications for people’s ability to maintain their basic learning and decision-makingskills. But, in the longer-term job security also requires a regular updating andupgrading of individual skills so that people have the ability to keep pace withchanging technological requirements and retain their value on the labour market inperiods of economic restructuring. Skill development can take place both informallythrough learning on the job to cope with modifications in work practices and formallythrough employer training. This chapter begins by considering how opportunities fornew skill acquisition have been changing, both in terms of changes in therequirements of jobs and in terms of the availability of employer training at work. Itthen turns to consider changes in more immediate job security, looking both atpeople’s perceptions of the current stability of their jobs and their experiences ofrecent unemployment.
The Changing Skill and Responsibility Demands of Jobs
It has been increasingly recognised that if people are to avoid a high risk of labourmarket marginalisation later in their careers, they need to be in jobs that provide on-going skill development. This not only helps protect them from skill depreciation astechniques change but it maintains the underlying learning skills that are essential forre-skilling if they are made redundant. Further, the integrating potential of work islikely to be greater where it offers some type of longer term career development,where people can acquire higher levels of skill. Did the evolution of jobs between1996 and 2001 lead to increased opportunities for such skill and career development?
Taking the overall EU pattern, in the second half of the 1990s, there was a slightincrease in the proportion of employees in highly skilled jobs and a slight decrease ofthose in non-skilled work. For instance, comparing Labour Force Survey data for1995 and 2000, the share of those in professional and managerial work rose by 2.3%,while that of operatives and of employees in elementary occupations declined by0.8%. However, such an increase may reflect generational substitution (with newmore highly skilled jobs being primarily filled by new entrants) rather thanexperiences of skill development or mobility among those currently in the workforce.

SOCIAL PRECARITY AND SOCIAL INTEGRATIONTHE EUROPEAN OPINION RESEARCH GROUP EEIG
EUROBAROMETER 56.1. – OCTOBER 2002 Page 93
To examine in-career experiences of skill development people were asked whetherthere had been a significant increase, significant decrease or little or no change in "thelevel of skill you use in your job" and in "the responsibility involved in your job"compared to what they were doing five years previously (or the nearest year to that ifthey had not been employed five years ago). In both years only 7% reported that theskill level of their work had declined, while over 40% said that it had risen (Table5.1). Similarly, only 6% said that the responsibility in their job had declined, whileover 40% had experienced increased responsibilities. The general picture is consistentwith the view that there has been a process of upgrading of skills in the EuropeanUnion over the last decade at least for a significant minority of employees.
But at the same time, there is some evidence that the pace of change slowed after themid-1990s. Whereas 48% of employees had experienced upskilling at work in 1996,this was the case for 43% in 2001; similarly the proportions reporting increasedresponsibilities fell from 50% to 46% over the period. In both years women were lesslikely to have experienced increases in skill and responsibility, but the declineaffected both male and female employees in a broadly similar way. Those who hadbeen promoted were more likely in both years to have experienced increased skill andresponsibility than those who had remained in jobs at the same level, though there wassignificant job upgrading even for the non-mobile. The decline again affected both thepromoted and the stayers.
Table 5.1 Percentages Experiencing Changes in Skill and Responsibility 1996-2001
% Increased skill % Increased Responsibilities1996 2001 2001-1996 1996 2001 2001-1996
All Employees 48.4 43.1 -5.3 49.9 46.2 -3.7Men 50.6 45.7 -4.9 52.6 48.3 -4.3Women 45.5 39.5 -6.0 46.4 43.3 -3.1Legislators/Managers 51.8 60.9 9.1 60.7 68.9 8.2Professionals 53.8 48.5 -5.3 52.7 47.6 -5.1Technicians/ Ass Profs 58.1 51.2 -6.9 60.4 53.0 -7.4Clerical 55.1 46.1 -9.0 53.0 48.4 -4.6Service & Sales 45.7 38.9 -6.8 46.7 45.9 -0.8Craft & Related 48.8 42.0 -6.8 50.5 43.5 -7.0Plant & Machine Ops 39.4 31.5 -7.9 39.0 32.7 -6.3Elementary Occupations 29.3 24.1 -5.2 36.3 27.6 -8.7Promoted 61.3 57.8 -3.5 67.3 62.0 -5.3Not promoted 43.0 37.8 -5.2 41.7 38.4 -3.3N 6630 6773 6630 6773

SOCIAL PRECARITY AND SOCIAL INTEGRATIONTHE EUROPEAN OPINION RESEARCH GROUP EEIG
EUROBAROMETER 56.1. – OCTOBER 2002 Page 94
Table 5.2 Class Effects on Changes in Skill and ResponsibilityModel 1 Model 2 Model 3
1996 ClassCoefficients
2001 ClassCoefficients
Class/YearInteractions
Legislators/Managers ref. n.s. ref. ref.Professionals & Managers -0.12 n.s. -0.66 *** -0.16 n.s.Technicians/ Assoc Profs 0.18 n.s. -0.55 *** 0.12 n.s.Clerical -0.02 n.s. -0.71 *** -0.08 n.s.Service & Sales -0.34 ** -1.00 *** -0.38 ***Craft & Related -0.44 *** -1.06 *** -0.45 ***Plant & Machine Ops -0.88 *** -1.55 *** -0.89 ***Elementary Occupations -0.97 *** -1.58 *** -1.02 ***Chi2 (DF) 419.88 (28) 452.1(28) 881.45 (37)Sig *** *** ***N 6364 6253 12617
Note 1: Ordered Logistic Analyses. Model 1 and 2 give Class Effects, controlling for Sex, Age andCountry, for each year separately. Model 3 gives Class*Year Interactions with pooled data, controllingfor Sex, Age and CountryNote 2: * = P < 0.05, ** = P < 0.01, *** = P < 0.001
The extent of skill and responsibility upgrading were heavily affected by position inthe occupational structure. Taking 1996, half or more of managers, professionals,technicians and clerical employees were in jobs where the skill and responsibilitydemands had increased, while this was case for only 39% of plant and machineoperatives. Those in elementary occupations were particularly unlikely to have seenchanges in the skill and responsibility requirements of their jobs (29% and 36%respectively). The decline in the frequency of such changes between the years affectedall occupational categories other than managers. With respect to skill, it was sharpestamong clerical employees (-9 percentage points), perhaps reflecting a slower pace ofchange after a period of particularly rapid innovation in office technology. Withrespect to responsibilities, it was particularly severe for the least skilled – those inelementary occupations (-9 percentage points). In 2001, only 24% of those inelementary occupations had experienced any upgrading of their skills in the previousfive years and only 28% had been given increased responsibilities in their work. Table5.2 (Model 1 and 2) shows that the class gradient was highly significant in both yearsfor service and sales workers, craft and related employees, machine operatives andelementary workers. Further, there was a significant widening of the class differentialfor each of these categories between the years with respect to changes in jobrequirements (Model 3). The coefficients indicate that this deterioration in relativeposition was particularly sharp for those in elementary occupations.
SOCIAL PRECARITY AND SOCIAL INTEGRATIONTHE EUROPEAN OPINION RESEARCH GROUP EEIG
EUROBAROMETER 56.1. – OCTOBER 2002 Page 95
There were also substantial differences by country in the extent of change in the skilland responsibility requirements of jobs (Table 5.3). Employees in Austria, Denmark,Finland, Italy and the Netherlands were consistently high in both years with respect toskill upgrading, while Portugal and Belgium were consistently low. Finland, Greece,the Netherlands and Sweden had high proportions in both years with experiences ofincreased responsibility, while Belgium, Spain and Portugal were consistently low.Great Britain and Ireland stood out as countries in which there had been a marked fallbetween 1996 and 2001 in the proportions experiencing both upskilling and increasedresponsibility. There was also a marked decline in the experience of skill upgrading inSpain, and in the experience of increased responsibility in Austria.
Job upgrading appears to relate in part to changes in the character of the workforce asa result of unemployment reduction. Comparing countries, the greater the reduction inunemployment between 1996 and 2001, the greater the reduction in job upskilling(correlation coefficient 0.59; p=0.02). (There was similarly a high negative correlationwith employment growth: coefficient –0.51;p=0.05). This may reflect the fact that thereduction of unemployment involves a particularly substantial expansion of lowerskilled work, where employers are less likely to believe they will receive a goodreturn from an investment in training. To control for this, a regression analysis wascarried out on a combined index of skill/responsibility demands, constructed byaveraging the scores of the two measures. Once structural factors are controlled(Table 5.4, Models 3), there is no evidence of change over the years for half of thecountries. But significant declines in skill/responsibility upgrading were evident inAustria, Germany, Great Britain, the Netherlands, Ireland and Spain.
Table 5.3 Percentage Experiencing Change in Skill and Responsibility byCountry
% Increased Skill % Increased Responsibility1996 2001 2001-1996 1996 2001 2001-1996
Austria 53.4 47.2 -6.2 54.3 42.3 -12.0Belgium 33.0 34.7 1.7 35.9 40.0 4.1Denmark 48.5 49.5 1.0 49.4 50.1 0.7Finland 67.5 65.7 -1.8 58.3 56.9 -1.4France 42.8 42.2 -0.6 48.3 47.0 -1.3Germany 46.0 40.8 -5.2 51.1 45.9 -5.2Great Britain 53.1 44.4 -8.7 55.7 44.6 -11.1Greece 44.8 41.4 -3.4 56.1 54.0 -2.1Ireland 53.9 40.3 -13.6 59.8 43.7 -16.1Italy 52.2 47.0 -5.2 43.7 48.4 4.7Luxembourg 40.0 39.4 -0.6 45.0 40.4 -4.6Netherlands 62.8 54.6 -8.2 58.5 58.0 -0.5Portugal 33.1 32.7 -0.4 44.7 41.8 -2.9Spain 48.1 36.5 -11.6 39.5 36.1 -3.4Sweden 51.3 44.5 -6.8 55.5 56.2 0.7

SOCIAL PRECARITY AND SOCIAL INTEGRATIONTHE EUROPEAN OPINION RESEARCH GROUP EEIG
EUROBAROMETER 56.1. – OCTOBER 2002 Page 96
Table 5.4 Changes in Skill/Responsibility Demands of JobsModel 1 Model 2 Models 3
1996 CountryCoefficients
2001 CountryCoefficients
Within CountryYear Change
Austria 0.11 n.s. -0.04 n.s. -0.41 **Belgium -0.64 *** -0.35 ** 0.08 n.s.Denmark 0.03 n.s. 0.15 n.s. -0.20 n.s.Finland 0.54 *** 0.66 *** -0.09 n.s.France -0.29 ** -0.21 (*) -0.16 n.s.Germany ref. ref. -0.22 *Great Britain 0.16 n.s. -0.18 n.s. -0.47 ***Greece 0.36 ** 0.14 n.s. -0.26 n.s.Ireland 0.38 ** -0.00 n.s. -0.68 ***Italy -0.05 n.s. 0.26 * 0.04 n.s.Luxembourg -0.32 * -0.23 n.s. -0.31 (*).Netherlands 0.44 *** 0.38 *** -0.29 *Portugal -0.30 * -0.29 * -0.15 n.s.Spain -0.04 n.s. -0.22 (*) -0.33 *Sweden 0.04 n.s. 0.14 n.s. -0.12 n.s.Chi2 (DF) 698.23 (42) 568.14 (42)Sig *** ***N 6200 6081
Note 1: Ordered logit analyses. Models 1 and 2 present the country coefficients relative to Germanyfrom models controlling for sex, age, class, use of new technology, skill change and establishment sizelength of service and industry. Models 3 present the year coefficients from a series of ordered logitregressions carried out for each country separately.Note 2: (*)=P<0.10, * = P < 0.05, ** = P < 0.01, *** = P < 0.001

SOCIAL PRECARITY AND SOCIAL INTEGRATIONTHE EUROPEAN OPINION RESEARCH GROUP EEIG
EUROBAROMETER 56.1. – OCTOBER 2002 Page 97
Training
The best measure of intentional effort to ensure longer-term skill maintenance is thewillingness of employers to invest in training. In the survey, people were asked: "Didyou receive any education or training in the last five years, which was paid for byyour employer or former employer?" People who had received training were thenasked how long it had lasted in total. Table 5.5 presents the proportions that receivedno training at all and the proportions that received a month or more training.
The most striking feature of Table 5.5 is the very high proportion of employees thathad received no training at all in the period preceding either year (59% in 1996 and55% in 2001). The proportions were broadly similar for men and women. There wasan improvement between 1996 and 2001, with the proportion with no employertraining falling by four percentage points. Such training as was given was typically ofrelatively short duration. Only 12% had had a month or more training in 1996 and13% in 2001.
Training opportunities were heavily concentrated on those who were already in higherskilled jobs. In 2001, only about a third of managers and professionals, and less thanhalf of technicians and clerical employees, had received no training. In contrast, theproportions without training were 69% among craft and related workers, 65% amongplant and machine operatives and 82% among those in elementary occupations.Between 1996 and 2001, there had been a decline in the proportion without trainingamong managers, clerical workers, service and sales employees and machineoperatives, but the proportion of those in elementary occupations without trainingremained very stable between the years (81% and 82%).
Table 5.6 shows the results from a logistic regression analysis that controls for thepotentially confounding effects of sex and age. The very steep gradient byoccupational class is evident in both years with those in elementary occupations beingthe most likely to be without training. The analysis of the significance of class/yeareffects (Model 3) shows a significant deterioration in the relative position of those incraft and related and elementary occupations between the two years.

SOCIAL PRECARITY AND SOCIAL INTEGRATIONTHE EUROPEAN OPINION RESEARCH GROUP EEIG
EUROBAROMETER 56.1. – OCTOBER 2002 Page 98
Table 5.5 Percentage Receiving Employer Training in Last 5 YearsNone 1 month +
1996 2001 2001-1996 1996 2001 2001-1996All 59.0 54.9 -4.1 12.4 13.1 0.7Men 58.4 54.4 -4.0 12.9 15.2 2.3Women 59.8 55.6 -4.2 11.7 10.4 -1.3Legislators/Managers 43.3 32.1 -11.2 16.3 22.7 6.4Professionals 35.4 33.6 -1.8 24.8 17.7 -7.1Technicians/ Assoc Profs 42.0 40.1 -1.9 21.1 17.8 -3.3Clerical 57.6 49.1 -8.5 9.6 14.0 4.4Service & Sales 64.2 60.2 -4.0 9.6 13.2 3.6Craft & Related 69.2 69.0 -0.2 8.9 10.0 1.1Plant & Machine Ops 73.8 65.4 -8.4 5.2 7.8 2.6Elementary Occupations 81.3 81.8 0.5 3.8 3.3 -0.5
Table 5.6 Class Effects No Training Model 1 Model 2 Model 3
1996 ClassCoefficients
2001 ClassCoefficients
Class/YearInteractions
Legislators/Managers ref. ref. ref.Professionals & Managers -0.58 *** -0.21 *** 0.41 *Technicians/ Assoc Profs -0.16 n.s. 0.08 * 0.31 (*)Clerical 0.31 * 0.33 n.s. 0.04 n.s.Service & Sales 0.62 *** 0.81 *** 0.22 n.s.Craft & Related 0.96 *** 1.41 *** 0.46 **Plant & Machine Ops 1.33 *** 1.25 *** -0.05 n.s.Elementary Occupations 1.47 *** 1.92 *** 0.47 *Chi2 (DF) 985.68 (28) 1138.52 (28) 2072.49 (37)Sig *** *** ***N 6364 6253 12617
Note 1: Logistic Regression Analyses. Model 1 and 2 give Class effects, controlling for Sex, Age andCountry, for each year separately. Model 3 gives Class*Year Interactions with pooled data, controllingfor Sex, Age and Country.Note 2: (*)=P<0.10, * = P < 0.05, ** = P < 0.01, *** = P < 0.001

SOCIAL PRECARITY AND SOCIAL INTEGRATIONTHE EUROPEAN OPINION RESEARCH GROUP EEIG
EUROBAROMETER 56.1. – OCTOBER 2002 Page 99
The chances of receiving training from an employer were also very different from oneEU country to another (Table 5.7). In 1996 the proportions that had received noemployer training in the previous five years ranged from 79% of employees in Italy toonly 29% of employees in Finland. In 2001 they ranged from 78% of employeeswithout training in Portugal to 23% in Denmark. In both years, Denmark, Finland andSweden stand out as having exceptionally high proportions with training, whileGreece, Portugal and Spain had very low proportions.
Table 5.7 Percentage of Employees with no Employer Training in Last FiveYears
1996 2001 2001-1996Austria 53.5 51.4 -2.1Belgium 68.2 65.1 -3.1Denmark 35.8 22.9 -12.9Finland 28.5 26.2 -2.3France 61.7 67.1 5.4Germany 51.7 44.5 -7.2Great Britain 52.6 45.6 -7.0Greece 76.5 77.5 1.0Ireland 58.7 62.5 3.8Italy 78.8 62.0 -16.8Luxembourg 66.8 48.9 -17.9Netherlands 49.3 45.9 -3.4Portugal 70.6 78.2 7.6Spain 69.8 71.1 1.3Sweden 30.9 34.2 3.3
While these differences partly reflect differences in workforce demographics,economic structure and technical level, it is notable that the many differences persistafter taking account of age, sex, length of service, occupational class, changes in jobskill requirements, use of advanced technology, size of establishment, and industry.Models 1 and 2 of Table 5.8, give the country effects relative to Germany on durationof training (a four category variable ranging from none to 3 months or more). In bothyears, even with controls, Denmark and Sweden remain distinctively high, whileBelgium, Greece, Italy, Portugal and Spain remain distinctively low with respect tothe amount of training given. Finland was particularly high in 1996, but only differedfrom Germany at a marginal level of significance in 2001. Given its very high rankingin terms of the initial training scores, it is clear that the control variables areaccounting for a good deal of its distinctiveness. Further analysis showed that itretained significantly higher levels of training than other countries when the greatmajority of the control variables are introduced; the crucial variable that reduces thesignificance of the results is the use of advanced technology. A good deal of thetraining provided in Finland appears to be integrally linked to the upgrading oftechnologies, while training in Denmark and Sweden is more independent of this.

SOCIAL PRECARITY AND SOCIAL INTEGRATIONTHE EUROPEAN OPINION RESEARCH GROUP EEIG
EUROBAROMETER 56.1. – OCTOBER 2002 Page 100
Table 5.8 Country and Year Effects on Employer Training (Ordered Logits)Model 1 Model 2 Models 3
1996 Effects 2001 Effects Year ChangeWithin Country
Austria 0.04 n.s. -0.21 (*) 0.02 n.s.Belgium -0.58 *** -0.94 *** -0.02 n.s.Denmark 0.68 *** 0.80 *** 0.33 **Finland 0.65 *** 0.19 (*) -0.18 n.s.France -0.38 *** -0.78 *** -0.08 n.s.Germany ref. ref. 0.32 **Great Britain 0.03 n.s. -0.16 n.s. 0.02 n.s.Greece -0.76 *** -1.41 *** -0.33 n.s.Ireland -0.17 n.s. -0.60 *** -0.15 n.s.Italy -0.98 *** -0.57 *** 0.70 ***Luxembourg -0.50 ** -0.47 *** 0.38 (*)Netherlands 0.10 n.s. -0.14 n.s. -0.02 n.s.Portugal -0.56 *** -1.30 *** -0.41 (*)Spain -0.41 ** -1.10 *** -0.51 (*)Sweden 0.66 *** 0.33 ** -0.24 (*).N 6201 6080Chi2 (DF) 1600.96 (43) 1709.39 (43)
Note 1: The dependent variable distinguishes four training durations: none, less than one week, 1 weekto 2 months, 3 months or more. Models 1 and 2 present the country coefficients relative to Germanyfrom models controlling for sex, age, class, use of new technology, skill change and establishment sizelength of service and industry. Models 3 present the year coefficients from a series of ordered logitregressions carried out for each country separately, with the same controls.Note 2: (*)=P<0.10, * = P < 0.05, ** = P < 0.01, *** = P < 0.001
Finally, the last set of model results presented in Table 5.8 (Model 3) show whether ornot there had been a significant change between 1996 and 2001 in the amount oftraining given within each country, with structural factors held constant. It is clear thatin the majority of countries there is no evidence of an improvement in trainingprovision. The exceptions are Denmark, Germany and Italy. It must be rememberedthat the improvement in Denmark was from a position of already exceptionally hightraining provision, whereas that from Italy was from a very low starting point.

SOCIAL PRECARITY AND SOCIAL INTEGRATIONTHE EUROPEAN OPINION RESEARCH GROUP EEIG
EUROBAROMETER 56.1. – OCTOBER 2002 Page 101
Job Security and Unemployment Experience
The aspect of job quality that has been of greatest concern in recent years is that of jobsecurity. Some scenarios of the changing structure of the workforce suggest that it isbecoming increasingly polarized between a secure and an insecure segment of theworkforce, with the lower skilled in particular trapped in an employment sector wherethey were likely to experience alternate spells of short-term employment andunemployment. An alternative vision is of a polarisation of security that crosscuts theskill hierarchy, dividing those with standard and those with non-standard employmentcontracts. The common feature of both arguments is the view that the proportion ofemployees in insecure jobs is rising in most capitalist economies. As a result anincreasing proportion of the workforce is thought to be at risk of labour marketmarginalisation, both because of an increased probability of becoming unemployedand because of the greater difficulty of re-entering the decreasing core of stable long-term jobs.
There are diverse measures of job insecurity. The measure that has been used mostfrequently as evidence of rising insecurity is a question that simply asks people towhat extent they feel their job is secure. However, the meaning of this is notunambiguous. The assumption is that respondents equate the term "job" with‘employment’. But in principle it is possible that the term is used with wider referenceand may be taken as the particular "post" that a person occupies within anorganisation. Statements about insecurity may be referring to the risk of demotion aswell as the risk of dismissal and redundancy. In this survey, in addition to the standardindicator, two other measures have been used to assess different dimensions ofinsecurity. The first is a measure of security from dismissal, the second is the extent ofpeople’s experience of unemployment in the recent past.
Job Security
Taking first the conventional survey measure of job insecurity, people were askedhow true it was that "My current job is secure", with four potential responses rangingfrom "very true" to "not at all true". The basic distributions are given in Table 5.9.
Although in earlier time comparisons, this measure gave a picture of rising jobinsecurity, it is clear that this was no longer the case for the period 1996 to 2001. Theproportion of employees in 2001 reporting that it was "very" or "quite true" that theirjob was secure was virtually identical to that in 1996. Moreover, there was a slightdecline, from 14.3% in 1996 to 12.6% in 2001, in the proportion most stronglyconcerned about job insecurity (i.e. reporting it was "not at all true" that their job wassecure). In order to take account of all categories of response, a job security score hasbeen constructed, ranging from 1 for "not at all true" to 4 "for very true". As can beseen that last column of Table 5.9, this overall measure remained very similar over thetwo years, with a small but non-significant rise in the security score.

SOCIAL PRECARITY AND SOCIAL INTEGRATIONTHE EUROPEAN OPINION RESEARCH GROUP EEIG
EUROBAROMETER 56.1. – OCTOBER 2002 Page 102
It is conceivable that the focus on employees conceals a rise of job insecurityconcentrated among the self-employed. However, as can be seen in Table 5.10, this isnot the case. Rather, the job security of the self-employed rose over the period. Whilein 1996 the self-employed were on average less secure than employees, in 2001 theirsecurity score was slightly higher. While the difference between the self-employedand employed was statistically significant in 1996, this was no longer the case in2001. Taking all those in work, there is a small rise in the security score between 1996and 2001, but the difference does not reach statistical significance.
Table 5.9 Job Security among Employees 1996-2001
My job is secure Not at alltrue
A littletrue Quite true Very true %
very+quite
OverallSecurity
ScoreEmployees1996 14.3 23.2 34.2 28.3 62.5 2.772001 12.6 24.2 34.8 28.4 63.2 2.79Men1996 14.5 22.8 33.8 28.9 62.7 2.772001 12.7 23.6 34.4 29.3 63.7 2.80Women1996 14.0 23.8 34.7 27.5 62.2 2.762001 12.5 25.1 35.2 27.2 62.4 2.77
Table 5.10 Job Security among the Self-Employed and All in Work
Not at alltrue
A littletrue Quite true Very true %
very+quite
OverallSecurity
ScoreSelf-Employed1996 20.4 21.8 27.0 30.9 57.9 2.682001 21.7 14.7 30.3 33.3 63.6 2.75All in Work1996 15.2 23.0 33.1 28.7 61.8 2.752001 14.1 22.6 34.0 29.2 63.2 2.78
Note: Ns (weighted) for the self-employed were 1174 in 1996, 1355 in 2001; Ns for all in work were7804 in 1996, 8265 in 2001.

SOCIAL PRECARITY AND SOCIAL INTEGRATIONTHE EUROPEAN OPINION RESEARCH GROUP EEIG
EUROBAROMETER 56.1. – OCTOBER 2002 Page 103
This aggregate stability of job security scores conceals rather different trends amongoccupational classes. As can be seen in Table 5.11, there was a decline between 1996and 2001 in the security scores of managers and of plant and machine operatives. Incontrast there was an improvement in the security of professionals and technicians.These changes led to rather different patterns of relative class security in the two years(Table 5.12). In 1996, there was a fairly clear gradient, with security declining relativeto that of managers with each class level. But in 2001, professionals were significantlymore secure than managers. Similarly there was no longer any clear difference in jobsecurity between managers on the one hand and technical and clerical employees onthe other. But service and sales, craft, machine and plant operatives and elementaryemployees still had distinctively lower security levels.
The year/class interactions in Model 3 of Table 5.12 show that while professionalsand those in the intermediate classes had significantly improved their position relativeto managers over the period, there had been no significant improvement in theposition of either plant and machine operatives or those in elementary occupations.
Table 5.11 Job Security Scores by Class
Job Security Index (Secure) 1996 2001 2001-1996Legislators/Managers 3.07 2.96 -0.11Professionals 2.95 3.16 0.21Technicians/ Assoc Profs 2.83 2.92 0.09Clerical 2.86 2.83 -0.03Service & Sales 2.62 2.69 0.07Craft & Related 2.63 2.64 0.01Plant & Machine Ops 2.67 2.42 -0.25Elementary Occupations 2.56 2.51 -0.05
Note: Higher scores indicate greater security.

SOCIAL PRECARITY AND SOCIAL INTEGRATIONTHE EUROPEAN OPINION RESEARCH GROUP EEIG
EUROBAROMETER 56.1. – OCTOBER 2002 Page 104
Table 5.12 Occupational Class Effects on Job Security (Ordered Logits)Employees Model 1
1996Model 2
2001Model 3Interacts
Legislators/Managers ref. ref. ref.Professionals &Managers -0.17 n.s. 0.43 *** 0.64 ***Technicians/ Assoc Profs -0.31 ** -0.04 n.s. 0.43 **Clerical -0.32 ** -0.13 n.s. 0.21 n.s.Service & Sales -0.77 *** -0.41 ** 0.40 **Craft & Related -0.74 *** -0.59 *** 0.30 (*)Plant & Machine Ops -0.71 *** -0.99 *** -0.15 n.s.Elementary Occupations -0.86 *** -0.77 *** 0.18 n.s.Chi2 (DF) 321.63 (28) 509.17 (28) 772.33 (37)Sig *** *** ***N 6364 6253 12617
Note 1: Ordered Logit Analyses. Model 1 and 2 give Class effects relative to managers, controlling forSex, Age and Country, for each year separately. Model 3 gives Class*Year Interactions with pooleddata, controlling for Sex, Age and CountryNote 2: * = P < 0.05, ** = P < 0.01, *** = P < 0.001
Risk of Individual Dismissal
If the job security measure, discussed in the last section, is the most general indicatorof different aspects of security, the extent to which employees are institutionallyprotected from dismissal has played a particularly important part in the discussion ofthe increased risks related to the deregulation of employment. The survey includedtwo questions designed to capture vulnerability to dismissal. The first asked "Howlong do you think it would be before a person doing your sort of job would bedismissed in your organisation if they persistently arrived late?" There were sixresponse categories: within a week, within a month, within six months, within a year,within more than a year and never. The second question used exactly the same format,but was posed in relation to a situation where a person "persistently did not workhard".
Did security from dismissal decline over the period 1996 to 2001, as is assumed byarguments focusing on the declining regulation of labour markets in the EuropeanUnion? The overall distributions for the two years are given in Table 5.13.

SOCIAL PRECARITY AND SOCIAL INTEGRATIONTHE EUROPEAN OPINION RESEARCH GROUP EEIG
EUROBAROMETER 56.1. – OCTOBER 2002 Page 105
Table 5.13 Dismissal Times for Lateness and Poor Work Performance(Employees)
FOR LATENESS<1 month <6 months <1 year 1 year+ DK
All1996 38.2 17.7 6.2 17.6 20.32001 37.4 16.9 4.7 16.7 24.2Men1996 38.4 17.9 6.3 16.8 20.62001 37.8 17.6 4.9 18.1 21.5Women1996 37.9 17.5 6.2 18.6 19.82001 36.9 16.0 4.5 14.8 27.8FOR DEFICIENT WORK EFFORT
<1 month <6 months <1 year 1 year+ DKAll1996 31.2 20.2 7.5 20.0 21.22001 30.3 18.6 7.1 18.8 25.2Men1996 31.9 19.6 8.0 19.3 21.12001 31.2 19.1 7.2 21.0 21.5Women1996 30.2 20.9 6.7 20.9 21.32001 29.0 17.9 6.9 15.8 30.3
As a rough approximation, dismissal within less than a month can be taken as anindicator of high vulnerability and dismissal after a year or more as an indicator ofhigh security. The distributions are broadly similar for the two questions, althoughvulnerability to dismissal is somewhat greater in the event of persistent lateness thanof deficiencies of work effort. In both cases, there is little evidence of change overtime. In 1996, 38% of employees reported that they were at risk of dismissal within amonth, while in 2001 the figure was 37%. With respect to lack of work effort, thecomparable proportions were 31% and 30% respectively. A rather smaller proportionof people were in jobs with high security (dismissal taking a year or more), but therewas again little evidence of significant change over the years. For lateness theproportions were 18% in 1996 and 17% in 2001; for lack of work effort, 20% and19% respectively. A significant proportion of people had little idea of how well theywere protected. In both years these were quite evenly spread in terms of occupationalposition. Men and women had a similar likelihood of being in highly vulnerable jobsin both years. However, the proportion of men in very secure jobs remained stableover time, while that of women declined.

SOCIAL PRECARITY AND SOCIAL INTEGRATIONTHE EUROPEAN OPINION RESEARCH GROUP EEIG
EUROBAROMETER 56.1. – OCTOBER 2002 Page 106
Table 5.14 Risk of Dismissal in < 1 Month by Occupational ClassLateness Lack of Work Effort
1996 2001 2001-1996 1996 2001 2001-1996Legislators/Managers 24.2 38.9 14.7 20.0 28.7 8.7Professionals 17.3 20.3 3.0 21.2 15.1 -6.1Technicians/ Assoc Profs 30.3 28.8 -1.5 21.1 22.5 1.4Clerical 34.1 33.9 -0.2 29.9 26.8 -3.1Service & Sales 46.8 46.9 0.1 39.6 37.3 -2.3Craft & Related 48.2 43.7 -4.5 37.7 37.8 0.1Plant & Machine Ops 53.0 51.0 -2.0 36.0 39.6 3.6Elementary Occupations 46.3 42.1 -4.2 41.7 38.7 -3.0
The overall figures again conceal very sharp differences for employees in differentoccupational classes (Table 5.14). In both 1996 and 2001, less than a quarter ofprofessionals were at risk of being dismissed within a month for lateness, whereas thiswas the case for nearly half of those in service and sales, craft and related, plant andmachine operatives and in elementary occupations. With respect to deficient workeffort only 21% of professionals were at risk of rapid dismissal in 1996 and theproportion was even smaller ( 15%) in 2001. The comparable proportions for those inelementary occupations were 42% and 39% respectively. In general there was littlechange over time for most occupational groups. The most vulnerable groups remainedas insecure as in 1996. The exceptions were that, on both measures, the security ofmanagers declined over the years, while that of professionals rose with respect todeficient work effort.
Table 5.15 shows relative class risks of dismissal, using an averaged index that takesaccount of the wider set of responses17. The ordered logit analyses control for age,sex, country, size of establishment and industry. The first two models show the classrisks relative to managers in each year separately, while the third model shows thecoefficients for the change in class risks between the two years. Professionals and theintermediate classes significantly increased their security relative to managersbetween the years (although this was partly due to the deterioration in the position ofmanagers rather than any improvement in their own position). However, there was norelative improvement in the position of machine operatives and those in the leastskilled jobs (elementary occupations).
17 The codes of the two measures were grouped into four categories: within a month, within six months,within a year, a year or more, ‘Don’t know’ responses omitted. The risk of dismissal index is theaverage of the two measures.

SOCIAL PRECARITY AND SOCIAL INTEGRATIONTHE EUROPEAN OPINION RESEARCH GROUP EEIG
EUROBAROMETER 56.1. – OCTOBER 2002 Page 107
Table 5.15 Class Effects on Protection from Risk of Dismissal (Employees)Model 1 Model 2 Model 3
1996 ClassCoefficients
2001ClassCoefficients
Class/YearInteractions
Legislators/Managers ref. ref. ref.Professionals & Managers 0.39 ** 0.94 *** 0.53 **Technicians/ Assoc Profs 0.01 n.s. 0.45 *** 0.34 *Clerical -0.40 *** 0.24 (*) 0.39 *Service & Sales -0.86 *** -0.31 * 0.34 *Craft & Related -0.61 *** 0.02 n.s. 0.61 ***Plant & Machine Ops -0.85 *** -0.53 *** 0.17 n.s.Elementary Occupations -0.73 *** -0.29 * 0.29 n.s.Chi2 (DF) 1397.89 (40) 987.46 (40) 172.62 (49)Sig *** *** ***N 4775 4462 9237
Note 1: Ordered Logit Analyses. Model 1 and 2 give Class effects, controlling for sex, age and country,size of establishment and industry for each year separately. Model 3 gives Class*Year Interactions withpooled data, with same controls.Note 2: (*)=P<0.10, * = P < 0.05, ** = P < 0.01, *** = P < 0.001
Vulnerability to individual dismissal also depended on the country a person workedin. Models 1 and 2 in Table 5.16 show the risks relative to Germany. The analysesinclude controls for individual characteristics (sex, age and length of employment),and a range of work characteristics (occupational class, use of new technology, skillchange, establishment size and industry). The Northern countries (Finland andSweden and to a lesser extent Denmark) stand out in both years as having relativelyhigh levels of protection. But this was also the case for the Netherlands and for Italy.In contrast, Spain has a distinctively low level of protection, consistent with itsextensive use of temporary employment contracts. The third analysis shown in theTable (Models 3) gives the year change coefficient estimated separately for eachcountry with the same set of controls. There was no change between 1996 and 2001 invulnerability to dismissal in the majority of countries, but it did increase in Belgium,Greece, Ireland and Italy.

SOCIAL PRECARITY AND SOCIAL INTEGRATIONTHE EUROPEAN OPINION RESEARCH GROUP EEIG
EUROBAROMETER 56.1. – OCTOBER 2002 Page 108
Table 5.16 Country Effects on Protection from Risk of Dismissal (Employees)Employees Models 1 Model 2 Models 3
1996 Effects 2001 Effects Year ChangesWithin Country
Austria 0.18 n.s. -0.04 n.s. -0.30 (*)Belgium 0.44 ** -0.11 n.s. -0.55 **Denmark 0.88 *** 0.71 *** -0.05 n.s.Finland 1.17 *** 0 .77 *** -0.31 (*)France 0.15 n.s. 0.19 n.s. 0.11 n.s.Germany ref. ref. 0.05 n.s.Great Britain 0.14 n.s. 0.07 n.s. -0.16 n.s.Greece 0.18 n.s. -0.20 n.s. -0.45 *Ireland 0.29 * -0.43 ** -0.60 **N. Ireland 0.68 n.s. 0.09 n.s. -0.98 n.s.Italy 1.45 *** 0.68 *** -0.47 *Luxembourg 0.31 (*) 0.70 *** 0.29 n.s.Netherlands 1.07 *** 0.69 *** -0.13 n.s.Portugal 0.51 *** 0.73 *** -0.03 n.s.Spain -0.64 *** -0.34 * 0.30 n.s.Sweden 1.74 *** 1.39 *** -0.13 n.s.N 4660 4369Chi2 (DF) 1428.01 (43) 1226.12 (43)Sig *** ***
Note 1: Ordered Logit Analyses. Models 1 and 2 present the country coefficients relative to Germanyfrom models controlling for sex, age, class, use of new technology, skill change and establishment sizelength of service and industry. Models 3 present the year coefficients from a series of ordered logitregressions carried out for each country separately.Note 2: (*)=P<0.10, * = P < 0.05, ** = P < 0.01, *** = P < 0.001

SOCIAL PRECARITY AND SOCIAL INTEGRATIONTHE EUROPEAN OPINION RESEARCH GROUP EEIG
EUROBAROMETER 56.1. – OCTOBER 2002 Page 109
Experience of Unemployment
The final measure of insecurity is the actual experience that an employee had had ofunemployment in the previous five years. Whereas the risk of dismissal is likely toreflect primarily the institutional constraints on management, unemploymentexperience is also likely to be affected by the extent of economic restructuring and thebusiness cycle. Table 5.17 shows the proportions of people in each year with noexperience of unemployment, one experience or more than one. In both years thegreat majority of employees had not experienced unemployment. But it can be seenthat between 1996 and 2001 there was a slight (but statistically significant) decline inthe proportion of employees that had been unemployed (from 19% in 1996 to 16% in2001). The main trends were identical for men and women.
Table 5.17 Percentage with Experience of Unemployment in Last 5 Years(Employees)
Never Once 1+All1996 80.8 12.6 6.62001 83.8 10.7 5.5Men1996 81.7 12.3 6.02001 84.2 10.2 5.6Women1996 79.7 13.0 7.32001 83.3 11.3 5.4
The differences between average year frequencies are dwarfed by the majordifferences in class risks of unemployment (Table 5.18). In 1996, whereas only 6% ofmanagers and 17% of professionals had been unemployed in the previous five years,the proportion rose to 22% of craft and related workers, 24% of plant and machineoperatives and 29% of those in elementary occupations. Recent experience ofunemployment was lower in 2001 for most occupational classes. But, in contrast tothe main trend, it rose among managers and clerical employees.

SOCIAL PRECARITY AND SOCIAL INTEGRATIONTHE EUROPEAN OPINION RESEARCH GROUP EEIG
EUROBAROMETER 56.1. – OCTOBER 2002 Page 110
Table 5.18 Proportion with Experience of Unemployment in last five years byOccupational Class.
1996 2001 2001-1996Legislators/Managers 5.5 9.6 4.1Professionals 16.9 10.0 -6.9Technicians/ Assoc Profs 15.7 13.2 -2.5Clerical 14.7 16.1 1.4Service & Sales 19.0 17.1 -1.9Craft & Related 22.2 19.6 -2.6Plant & Machine Ops 24.1 20.0 -4.1Elementary Occupations 29.1 24.2 -4.9
The result of these changes was some reduction in unemployment differentialsbetween managers and those in other classes. As can be seen in Table 5.19, once sex,age and country had been controlled, in 1996 all classes had higher risks ofunemployment experience than managers. In 2001, however, there was no significantdifference between managers, professionals and technicians. Craft and relatedworkers, plant and machine operatives and those in elementary occupations still hadsubstantially higher risks of unemployment. However, it can be seen from Model 3,which gives the class/year change effects, that there had been a significant reductionover the period in differentials even for employees in these classes.
Table 5.19 Class Effects on Unemployment Risks (Logit Coefficients)Model 1 Model 2 Model 3
1996 2001 Class /YearInteracts
Legislators/Managers ref. ref. ref.Professionals & Managers 1.11 *** -0.02 -1.20 ***Technicians/ Assoc Profs 1.02 *** 0.20 -0.92 **Clerical 0.89 *** 0.43 * -0.55 (*)Service & Sales 1.22 *** 0.42 * -0.88 **Craft & Related 1.61 *** 0.71 *** -1.58 ***Plant & Machine Ops 1.81 *** 0.81 *** -1.00 **Elementary Occupations 1.90 *** 1.01 *** -0.94 **Chi2 (DF) 612.37 (28) 253.51 (28) 773.83 (37)Sig *** *** ***N 6184 6174 12358
Note 1: Logistic Regression Analyses. Model 1 and 2 give Class effects, controlling for Sex, Age andCountry, for each year separately. Model 3 gives Class*Year Interactions with pooled data, controllingfor Sex, Age and CountryNote 2: * = P < 0.05, ** = P < 0.01, *** = P < 0.001

SOCIAL PRECARITY AND SOCIAL INTEGRATIONTHE EUROPEAN OPINION RESEARCH GROUP EEIG
EUROBAROMETER 56.1. – OCTOBER 2002 Page 111
Finally, there were again marked country differences in security risks (Table 5.20). In1996 the proportion of employees with an experience of unemployment in theprevious five years ranged from just over 30% in Finland and Spain to 6% inLuxembourg and 12% in Austria. In 2001, it ranged from 32% in Greece to 2% inLuxembourg. Table 5.21 shows the country differences relative to Germany withcontrols for individual and work situation characteristics. In 1996 previousunemployment experience was highest in Finland, France, Belgium, Sweden andSpain and it was lowest in Luxembourg. In 2001 it was particularly high in Greeceand low in Luxembourg and the Netherlands.
In the majority of countries the trend had been for a decrease in the proportion ofemployees with recent unemployment experience (Table 5.20). This was particularlymarked in Finland, France, the Netherlands and Spain. But in Greece (and to a muchsmaller extent in Portugal, Ireland and Austria) there was an inverse trend of risingunemployment risks. However, these changes (Models 3, Table 5.21) were notstatistically significant in the majority of countries once account was taken ofcompositional factors. But there were significant reductions in unemploymentexperience in Belgium, Finland, France, the Netherlands and Sweden. Greece was theonly country that saw a significant rise over the period.
In broad terms this clearly reflected marked improvement in the labour marketconditions over the period. As was seen in Chapter 1(Table 1.1) unemployment ratesfell in all countries, with the possible exception of Greece, which may have seen anincrease (although the figures for Greece must be treated with caution as they are notfully comparable). Comparing countries, there is clear association between the extentof reduction of unemployment and the decline in unemployment experiences(correlation of 0.53, p=0.04). But the frequency of individual experiences ofunemployment can be a consequence of factors other than the unemployment rate(such as employer staffing policies) and there is no simple pattern of correspondencebetween the decline in the unemployment rate in a particular country and the declinein previous unemployment experience. The particularly marked reduction in the levelof unemployment in Finland and Spain corresponds closely to the pattern at the levelof individual experiences, but the considerable reduction of unemployment in Irelandwas not accompanied by a corresponding reduction in unemployment experience.Inversely, the significant decline in the proportion of people with a previousexperience of unemployment in France was not accompanied by a particularlydistinctive decline in unemployment rates.

SOCIAL PRECARITY AND SOCIAL INTEGRATIONTHE EUROPEAN OPINION RESEARCH GROUP EEIG
EUROBAROMETER 56.1. – OCTOBER 2002 Page 112
Table 5.20 Proportion with an Experience of Unemployment in Last Five Yearsby Country (Employees)
1996 2001 2001-1996Austria 11.9 13.9 2.0Belgium 19.4 13.9 -5.5Denmark 25.9 19.6 -6.3Finland 31.6 19.3 -12.3France 26.2 15.8 -10.4Germany 14.8 16.3 1.5Great Britain 18.4 16.3 -2.1Greece 14.9 31.8 16.9Ireland 17.2 19.6 2.4Italy 14.1 13.7 -0.4Luxembourg 6.4 2.3 -4.1Netherlands 22.1 9.2 -12.9Portugal 13.8 15.4 1.6Spain 31.2 20.7 -10.5Sweden 22.4 19.2 -3.2

SOCIAL PRECARITY AND SOCIAL INTEGRATIONTHE EUROPEAN OPINION RESEARCH GROUP EEIG
EUROBAROMETER 56.1. – OCTOBER 2002 Page 113
Table 5.21 Country Effects on Unemployment Experience in Last Five Years(Employees)
Models 1 Model 2 Models 3
1996 Effects 2001 Effects Within CountryYear Change
Austria 0.15 n.s. -0.07 n.s. -0.14 n.s.Belgium 0.70 ** 0.06 n.s. -0.60 *Denmark 0.44 * 0.32 (*) -0.05 n.s.Finland 1.22 *** 0.20 * -1.21 ***France 0.90 *** 0.04 n.s. -0.85 ***Germany 0.07 n.s.Great Britain 0.17 n.s. -0.01 n.s. -0.11 n.s.Greece -0.31 n.s. 0.83 *** 1.10 ***Ireland 0.30 n.s. 0.08 n.s. -0.29 n.s.Italy 0.10 n.s. 0.00 n.s. 0.31 n.s.Luxembourg -1.08 ** -2.07 *** -0.72 n.s.Netherlands 0.49 * -0.75 *** -1.10 ***Portugal -0.16 n.s. -0.19 n.s. -0.28 n.s.Spain 0.58 ** 0.29 n.s. -0.35 n.s.Sweden 0.64 *** 0.26 n.s. -0.50 *N 6035 6006Chi2 (DF) 2210.66 (43) 1431.15 (43)Sig *** ***
Note 1: Ordered Logit Analyses. Models 1 and 2 present the country coefficients relative to Germanyfrom models controlling for sex, age, class, use of new technology, skill change and establishment sizelength of service and industry. Models 3 present the year coefficients from a series of ordered logitregressions carried out for each country separately.Note 2: * = P < 0.05, ** = P < 0.01, *** = P < 0.001

SOCIAL PRECARITY AND SOCIAL INTEGRATIONTHE EUROPEAN OPINION RESEARCH GROUP EEIG
EUROBAROMETER 56.1. – OCTOBER 2002 Page 114
Conclusions
From the point of view of a concern with the risks of social exclusion, the extent towhich work offers opportunities for updating and acquiring new work skills is ofcentral importance. Skill development is essential for people to keep pace with thechanging technological environment and remain valuable on the labour market in theevent of the downsizing or closure of their current organisations. But, althoughemployees were more likely to have been upskilled in recent years than deskilled, thegeneral trend was one of a reduced frequency of in-career skill upgrading compared tothe mid-1990s. Most worryingly, the vulnerability of the group most at risk – the low-skilled – particularly increased over the period, with both an absolute and relativedeterioration in their position.
This picture was reinforced by the analysis of developments with respect to employertraining. While, overall, employers were training a somewhat larger proportion oftheir employees in 2001 than in 1996, the low-skilled had been largely excluded fromthis development. Training opportunities remained highly stratified by occupationalclass. There was no change in the very low rates of training for the low-skilled thatprevailed in 1996, and in relative terms their position had grown worse.
But while there are grounds for thinking that the longer-term vulnerability of the low-skilled may have increased, in the shorter-term there was no evidence of adeterioration in job security. There had been no change between 1996 and 2001 in theextent to which people perceived their jobs as secure or insecure, and similarly nochange in perceived vulnerability to dismissal for inadequate work performance(although the non-skilled remained very much less secure on both counts than othercategories of employee). Taking the experience of unemployment, people in workwere less likely to have been unemployed in the recent past and the markedlydisadvantaged position of the low-skilled in this respect had improved somewhat. It islikely that the major factor accounting for this was the general improvement in thestate of the EU economies over this period and the consequent tightening of labourmarkets. But to the extent that the growth in shorter-term security is dependant on theconjuncture of the labour market, it is clearly an aspect of the quality of work thatmay be highly vulnerable to renewed deterioration given the volatility of labourmarkets over the past decade.

SOCIAL PRECARITY AND SOCIAL INTEGRATIONTHE EUROPEAN OPINION RESEARCH GROUP EEIG
EUROBAROMETER 56.1. – OCTOBER 2002 Page 115
CHAPTER 6
SOCIAL PRECARITY AND PERSONAL INTEGRATION
The previous chapters have traced the changes over time in the precariousness ofpeople’s living and work conditions. But to what extent do such factors affectsubjective social integration? We take two key dimensions of subjective socialintegration. The first is people’s personal sense of integration. If people are sociallyintegrated, this should be reflected in relatively high levels of satisfaction with theirlives and low levels of psychological distress. The second is their satisfaction with thebroader society in which they live, in particular with its distributional processes andwith the functioning of its political institutions. The present chapter considers thechange over time in personal integration and examines some of the factors thataffected this in 2001. It starts with an examination of their commitment toemployment, their job satisfaction and the stress they experience from work. It thencontinues with a broader analysis of the factors that affect life satisfaction andpsychological well-being. The next chapter turns to people’s perceptions of the widersociety.
Employment Precarity, Job Satisfaction and Work Stress
Employment Commitment
The relationship between employment precarity and subjective well-being is likely todepend in part on the centrality of employment in people’s lives and the importancethey attach to different aspects of employment. If having a job becomes less central topeople’s life values or if they become less demanding about the nature of thecharacteristics of jobs, then changes in the quality of employment are likely to haveless impact on personal satisfaction. At the same time, commitment to employment isa central (and increasingly important) normative expectation in Western societies andpeople’s acceptance of it when they are of working age is frequently taken as anindicator of their personal integration.
The survey contained a commonly used measure of non-financial employmentcommitment. This asked people: "If you were to get enough money to live ascomfortably as you would like for the rest of your life, would you continue to work,not necessarily in your present job, or would you stop working?". Table 6.1 comparesthe results for 1996 and 2001.

SOCIAL PRECARITY AND SOCIAL INTEGRATIONTHE EUROPEAN OPINION RESEARCH GROUP EEIG
EUROBAROMETER 56.1. – OCTOBER 2002 Page 116
It is clear from the figures for both years that employment motivation is problematicin the European workforce. Only about half of the overall workforce would wish tocontinue working if there were no financial necessity. The proportions are particularlylow among employees and they are lower among male than among female employees.But above all, it should be noted that employment commitment falls to a very lowpoint among those in the least skilled occupations. For instance, in 2001, while 51%of all employees would wish to continue in paid work even if there were no financialnecessity, this was the case for only 41% of employees in elementary occupations. Inboth years a higher proportion of those in elementary occupations would withdrawfrom employment than continue to work.
Table 6.1 Non-financial Employment Commitment
Proportion which would: Continue towork Stop Working Don’t Know
All in work 1996 48.0 44.2 7.82001 52.2 38.3 9.5Self-Employed1996 54.6 37.8 7.62001 57.7 32.1 10.3Employed1996 46.8 45.3 7.92001 51.1 39.5 9.4Employed Men1996 46.3 43.9 9.72001 49.1 42.1 8.8Employed Women1996 47.4 47.0 5.62001 53.9 35.9 10.2Employees ElementaryOccupations1996 35.5 55.3 9.22001 40.5 49.3 10.3
There is however a positive side to the picture. Despite frequent predictions about thedecline of the work ethic, the period between 1996 and 2001 saw a small butstatistically significant (p=<0.001) strengthening of people’s attachment to the labourmarket. This was the case not only for the self-employed, but also for the employed. Itwas also true for both male and female employees and for those in low-skilledoccupations.

SOCIAL PRECARITY AND SOCIAL INTEGRATIONTHE EUROPEAN OPINION RESEARCH GROUP EEIG
EUROBAROMETER 56.1. – OCTOBER 2002 Page 117
What accounts for the very sharp class gradient in employment motivation? It hasbeen noted in chapters 4 and 5 that those in elementary occupations were insubstantially lower quality jobs on all of the dimensions of job quality. It seemsplausible that where people experience work as monotonous, lack control over thework process, experience little in the way of skill improvement or training andexperience higher levels of insecurity, they will come to develop a rather lower levelof attachment to employment. This is confirmed by Table 6.2, which takes the pooleddata for the two surveys. The first column of the table presents the class coefficients,with controls just for age, sex, and country. It shows that, while professional andtechnical employees have exceptionally high levels of commitment, both craftworkers and those in elementary occupations have significantly lower levels ofemployment commitment.
The second column shows the coefficients once controls have been introduced for thedifferent quality of work factors. This has little effect on the level of commitment forprofessionals and technicians. But the quality of work accounts for the entire negativeeffect for commitment among those in the craft and elementary occupational groups.By far the strongest factor is the quality of the work task, although both theexperience of skill improvement and job security also make a contribution.
Table 6.2 Class Effects on Employment Commitment (Employees)Model 1
ClassCoefficients
Model 2Class
CoefficientsLegislators/Managers Ref. Ref.Professionals & Managers 0.62 *** 0.67 ***Technicians/ Assoc Profs 0.25 ** 0.43 ***Clerical -0.04 n.s. 0.20 *Service & Sales -0.15 (*) 0.16 (*)Craft & Related -0.30 *** 0.09 n.s.Plant & Machine Ops -0.13 n.s. 0.34 ***Elementary Occupations -0.46 *** 0.09 n.s.Task Quality 0.36 ***Work Pressure -0.03 n.s.Job Upgrading 0.15 ***Employer Training 0.03 (*)Job Security 0.11 ***Chi2 (DF) 1071.13 (29) 1395.31 (34)Sig *** ***N 12617 12455
Note 1: Logistic Regression Analyses. Model 1 gives Class effects, controlling for sex, age, countryand year. Model 3 gives, with same controls, + task quality, work pressure, job upgrading, employertraining and job security.Note 2: (*)=P<0.10, * = P < 0.05, ** = P < 0.01, *** = P < 0.001

SOCIAL PRECARITY AND SOCIAL INTEGRATIONTHE EUROPEAN OPINION RESEARCH GROUP EEIG
EUROBAROMETER 56.1. – OCTOBER 2002 Page 118
Job Satisfaction
It is now well established that job satisfaction cannot simply be read off fromevidence about work conditions. It will depend upon individual characteristics and thenature of expectations. The survey contained a question on overall job satisfaction,which asked people "All in all, how satisfied would you say you are with your job?"Responses were on a seven point scale ranging from 1 for "completely satisfied" to 7for "completely dissatisfied".
Taking the overall trend for job satisfaction, there was no statistically significantdifference between 1996 and 2001 (Table 6.3). There was however a difference bysex. In both years, men’s satisfaction scores were higher than women’s. However,whereas levels of job satisfaction remained unchanged for men, there was astatistically significant increase in women’s job satisfaction.
Table 6.3 Overall Job Satisfaction 1996 - 2001
1996 2001 Change 2001-1996All Employees 5.00 5.05 0.05 n.s.Men 5.04 5.07 0.02 n.s.Women 4.95 5.02 0.08 *Managers 5.27 5.34 0.07 n.s.Professionals 5.14 5.39 0.25 ***Technicians 5.21 5.19 -0.02 n.s.Clerical 4.98 5.02 0.05 n.s.Sales and Service 4.89 4.92 0.03 n.s.Craft 4.90 4.95 0.05 n.s.Operatives 4.90 4.90 0.00 n.s.ElementaryOccupations 4.68 4.53 -0.15 (*)
If those in elementary occupations are taken, a rather different picture emerges. Therewas a decline in overall job satisfaction (although it is only at a marginal level ofsignificance). A further test (unshown) of the change in relative class effects betweenthe years shows that there was no change in relative job satisfaction for most classes.But for those in elementary occupations, there is some evidence of an increased gap (acoefficient of –0.20, at the p=0.07 level of significance).
Finally, how far can class differences in job satisfaction be accounted for in terms ofdifferences in job quality? Table 6.4 compares the class coefficients without and thenwith the job quality measures. In Model 1, which restricts the controls to sex, age,country and year, there is a very marked class gradient in job satisfaction, with aparticularly sharp break between those in elementary occupations and other classes.However, once the job quality measures are taken into account in Model 2, thenegative class effects for job dissatisfaction disappear entirely. Those in elementaryoccupations are no longer distinctive and there is even a significant positivecoefficient for machine operatives. It is again task quality that has the strongest effect,followed by job security and the level of work pressure.

SOCIAL PRECARITY AND SOCIAL INTEGRATIONTHE EUROPEAN OPINION RESEARCH GROUP EEIG
EUROBAROMETER 56.1. – OCTOBER 2002 Page 119
Table 6.4 Class Effects on Job Satisfaction (Employees)Model 1 Class Coefficients Model 2 Class Coefficients
Professionals 0.00 n.s. 0.02 n.s.Technicians -0.07 n.s. 0.07 n.s.Clerical -0.21 *** 0.00 n.s.Sales and Service -0.30 *** 0.03 n.s.Agriculture 0.10 0.15 n.s.Craft -0.34 *** 0.06 n.s.Operatives -0.35 *** 0.18 **Elementary Occupations -0.63 *** -0.06 n.s.Task Quality 0.44 ***Work Pressure -0.23 ***Job Upgrading 0.18 ***Employer Training -0.01 n.s.Job Security 0.29 ***Adj R2 0.06 0.21N 13306 13098
Note 1: OLS Regression Analyses. Model 1 gives Class effects, controlling for sex, age, country andyear. Model 3 gives, with same controls, + task quality, work pressure, job upgrading, employertraining and job security.Note 2: * = P < 0.05, ** = P < 0.01, *** = P < 0.001
Work-Related Stress
A major concern in recent years has been that developments in the nature andorganisation of work may be leading to higher levels of work stress that in the longerterm may be damaging to health. The survey contained a number of measures of workstress. Five of these were designed to provide indicators of the frequency orpersistence of stressful events. People were asked how often they:
- Find their work stressful
- Come home from work exhausted
- Find your job prevents you giving the time you want to your partner or family
- Feel too tired after work to enjoy the things you would like to do at home
- Find that your partner / family gets fed up with the pressure of your job
In each case there was a five point response set: always, often, sometimes, hardlyever, never.
Table 6.5 presents the results in two ways. The first two columns show the proportionin each year that reported either "always" or "often" for each item. The third andfourth columns give the average scores for each item with scores running from 5 for"always" to 1 for "never". The final column shows the significance of the year changein the score measure.

SOCIAL PRECARITY AND SOCIAL INTEGRATIONTHE EUROPEAN OPINION RESEARCH GROUP EEIG
EUROBAROMETER 56.1. – OCTOBER 2002 Page 120
Table 6.5 Work-Related Stress (Employees) 1996-2001% Always or
Often Stress Scores Sig yr Diff
1996 2001 1996 2001Finds work stressful 35.8 30.6 3.17 3.06 ***Comes home from work exhausted 35.1 24.9 3.14 2.87 ***Too little time for the family 21.8 18.8 2.60 2.46 ***Too tired to enjoy home life 24.8 20.0 2.74 2.64 ***Partner fed up with your job 12.9 10.3 2.21 2.11 ***Increase in work stress last 5 years 45.8 40.0
In 2001, nearly a third (31%) of employees reported that they found their workregularly stressful and a quarter that they came from work exhausted. Three of themeasures examine the stress generated by the conflict demands of work and familylife. Approximately 20% of employees reported that work demands were "always" or"often" detrimental to their family and home lives. Finally 10% report interpersonalfamily tension as a result of their work load, with their partners being "fed up" withtheir job.
Clearly work stress is a major problem for a substantial sector of the workforce.However, at least in comparison to the situation in 1996, it does not appear to havebeen increasing. On all of the five indicators, whether one takes the proportionreporting high levels of stress or the overall score, there was some decline in levels ofwork-related stress between 1996 and 2001. Further, when people were asked directlywhether the level of stress in their job had increased, decreased or stayed the sameover the last five years, the proportion reporting an increase in stress was reducedfrom 46% in 1996 to 40% in 2001. The proportion that had experienced a decrease instress remained identical (8% in both years), while the proportion saying there hadbeen no change rose from 46% to 52%.
Table 6.6 Work-Related Stress Index by Sex and Occupational Class
1996 2001 2001-1996 Sig YearChange
All 2.79 2.63 -0.16 ***Male 2.79 2.62 -0.17 ***Female 2.79 2.63 -0.16 ***Legislators/Managers 2.96 2.72 -0.24 ***Professionals 2.92 2.71 -0.21 ***Technicians/ Assoc Profs 2.81 2.66 -0.15 ***Clerical 2.63 2.50 -0.13 ***Service & Sales 2.74 2.70 -0.04 n.s.Craft & Related 2.84 2.59 -0.25 ***Plant & Machine ops 2.89 2.67 -0.22 ***Elementary Occupations 2.76 2.40 -0.36 ***
Note: * = P < 0.05, ** = P < 0.01, *** = P < 0.001

SOCIAL PRECARITY AND SOCIAL INTEGRATIONTHE EUROPEAN OPINION RESEARCH GROUP EEIG
EUROBAROMETER 56.1. – OCTOBER 2002 Page 121
An overall work stress index was constructed by averaging the five items in Table 6.5.As can be seen in Table 6.6, this confirms the general trend to a reduction in workstress and shows that the pattern was the same for both men and women and foremployees in most occupational classes. The exception is service and sales workers,where there was no significant decrease in work stress between the years. Work stressdeclined for the overall workforce in the majority of the EU countries. But there wasno significant change in stress levels in Belgium, Finland, Greece, Italy and theNetherlands.
How did the different dimensions of work task quality affect vulnerability to workstress? Model 1 of Table 6.7 shows the direct effects of task quality, work pressure,job upgrading and security. The analyses take the pooled data for the two years. Themodel controls for age, sex, country, year and occupational class.
It is clear that by far and away the strongest factor accentuating work stress was thepressure of work in the job. But it was notable that job upgrading and even trainingwere also associated with higher stress levels. In contrast, both high task quality andparticularly job security were very significant factors reducing work stress.
Some research has suggested that one of the key features of higher task quality(especially the learning opportunities and the capacity for control provided by the job)is that it reduces stress not only through its direct effects, but also through mediatingthe impact of work pressure on stress levels. In Model 2 of Table 6.7, this is tested byintroducing an interaction term between task quality and work pressure. As can beseen this is indeed negative and statistically significant, consistent with the view thathigh task quality does make it easier for people to cope with pressures at work,thereby reducing its effects on psychological strain.
Table 6.7 Work Quality and Work-Related StressModel 1 Model 2
Coeff Sig Coeff SigTask Quality -0.06 *** -0.02 n.s.Work Pressure 0.54 *** 0.57 ***Job Upgrading 0.04 *** 0.04 ***Employer Training 0.03 *** 0.03 ***Job Security -0.09 *** -0.09 ***Task Quality*Work Pressure -0.02 *Adj R2 0.39 0.39N 11490 11490
Note: * = P < 0.05, ** = P < 0.01, *** = P < 0.001

SOCIAL PRECARITY AND SOCIAL INTEGRATIONTHE EUROPEAN OPINION RESEARCH GROUP EEIG
EUROBAROMETER 56.1. – OCTOBER 2002 Page 122
Social Precarity, Life Satisfaction and Psychological Distress
The focus of this final section moves from the arena of people’s commitment to andsense of well-being in employment to the broader sense of personal well-being in life.The analysis is now extended to include those in all of the different employmentstatuses – self-employed, employed, unemployed and non-actives. There are twoprincipal measures in the survey that provide relevant indicators. The first is a singleitem measure of life satisfaction. People were asked: "Would you say that you arevery satisfied, fairly satisfied, not very satisfied or not at all satisfied with the life youlead?" Higher scores on the measure indicate greater dissatisfaction with life.
The second, arguably more stringent indicator, is a measure of psychological distress,based on six items from the General Health Questionnaire (Goldberg 1972, 1978), awell-tested measure of propensity to anxiety and depression.
- The question format was:
- Would you say that you have:
- Lost much sleep over worry
- Been feeling unhappy and depressed
- Been losing confidence in yourself
- Been feeling you could not overcome your difficulties
- Been feeling constantly under strain
- Been thinking of yourself as a worthless person

SOCIAL PRECARITY AND SOCIAL INTEGRATIONTHE EUROPEAN OPINION RESEARCH GROUP EEIG
EUROBAROMETER 56.1. – OCTOBER 2002 Page 123
There was a four point response set: not at all, no more than usual, rather more thanusual, much more than usual. An overall psychological distress scale was constructedas the average score across the six items. Higher scores indicate greater psychologicaldistress. Table 6.8 presents the mean scores for 1996 and 2001, together with the significanceof the change in the mean values between the years. Overall there was a small butclearly significant decline between the years in both dissatisfaction with life andpsychological distress. With respect to dissatisfaction with life, the pattern was verysimilar for men and women. However, while men’s psychological distress levelsdeclined over the period, this was not the case for women.
Turning to the patterns for those in different employment statuses, it can be seen thatthere was an improvement in the life satisfaction of those in jobs, both among theemployed and the self-employed. However, there was no evidence of a similarimprovement in the scores for either the unemployed or the non-actives. Even morestriking, for none of the employment status categories was there evidence of areduction in psychological distress between the years. This suggests that the overallimprovement noted above must have been due to a shift in the proportion of people inthe different employment status categories. Comparing the two surveys, there hadbeen a decrease in the proportion unemployed (where psychological distress wasparticularly high) of five percentage points and a rise in the proportion in work (wherepsychological distress was much lower) of three percentage points.
Table 6.8 Dissatisfaction with Life and Psychological Distress 1996-2001Dissatisfaction with Life Psychological Distress
1996 2001 Sig. 1996 2001 Sig.All 2.07 2.00 *** 0.64 0.62 ***Men 2.07 1.99 *** 0.58 0.55 ***Women 2.07 2.02 *** 0.70 0.69 n.s.Employed 1.96 1.93 *** 0.57 0.57 n.s.Self-Employed 2.01 1.91 * 0.63 0.66 n.s.Unemployed 2.83 2.85 n.s. 0.99 0.94 n.s.Non-Active 1.98 1.98 n.s. 0.62 0.61 n.s.
Note: * = P < 0.05, ** = P < 0.01, *** = P < 0.001

SOCIAL PRECARITY AND SOCIAL INTEGRATIONTHE EUROPEAN OPINION RESEARCH GROUP EEIG
EUROBAROMETER 56.1. – OCTOBER 2002 Page 124
How was personal well-being affected by the different aspects of precarity highlightedin earlier chapters of the report? This was assessed by introducing into the samemodel indicators of income, poverty, social isolation, employment status and workquality. At the same time, control variables were added for age, sex, and country andpolitical orientation. The analyses were carried out in two phases. In the first (models1 and 3) employment status was included without measures of work quality. In thesecond (models 2 and 4) interaction terms were introduced to examine theimplications of work quality for employees. Table 6.9 gives the estimates for thedifferent precarity variables, taking account both of other aspects of precarity and ofthe control variables.
The first rows of Table 6.9 show the effects of the degree of precarity in people’swork and labour market position. The reference category for employment status ispeople who were not in the labour market (the non-actives). Employees are usuallytaken to be the least precarious group, with the most favourable conditions for socialintegration. But the results provide no evidence that employment per se raisespersonal well-being compared to non-activity. As can be seen from models one andthree, employee status was associated with slightly greater dissatisfaction with life(once other factors were controlled for) than was the case for non-actives, while therewas no difference with respect to psychological distress. The crucial factor was thenature of employment. Those who were in higher quality jobs were very significantlymore satisfied with their lives and had substantially lower psychological distress(conversely those with poor quality work tasks had much lower levels of personalwell-being). A more detailed analysis (not shown) confirmed that these estimatesremained unchanged when further controls were introduced for occupational class.Moreover both higher work pressure and particularly job insecurity had strongnegative effects for life satisfaction and psychological well-being. An unexpectedfinding is that the receipt of employer training in last five years also had negativeeffects on both measures, although it should be noted that the actual upgrading of jobsin terms of skill and responsibility was associated with better psychological health.Given the importance of training as a strategy for providing longer-term security, thisclearly needs careful investigation in future research.
Turning to those in other employment statuses, it is notable that the two measures givequite different results for the self-employed. Other things equal, the self-employedhad higher levels of satisfaction with life, but were more likely to suffer frompsychological distress. Presumably the latter may reflect the anxieties that come fromthe responsibilities for ensuring financial viability.

SOCIAL PRECARITY AND SOCIAL INTEGRATIONTHE EUROPEAN OPINION RESEARCH GROUP EEIG
EUROBAROMETER 56.1. – OCTOBER 2002 Page 125
For the unemployed, the results confirm a pattern that has been shown consistently inthe literature in the last decade. Those who are currently unemployed haveconsiderably worse scores on both measures of well-being than those who are non-active. However, the less expected feature of the data is the result with respect toprevious experience of unemployment. Those who have been unemployed at sometime previously in the last five years also have higher levels of dissatisfaction with lifeand lower psychological well-being. This suggests that the effects of the experience ofunemployment may be marked over quite long periods of time, even when people areno longer jobless. A variant analysis (not shown) restricted to those currentlyemployees shows virtually identical effects of previous unemployment for thissubgroup (coefficients of .20, p<0.001 for life satisfaction; and .10 p<0.001 forpsychological distress). In short, the experience of unemployment would appear toscar people in a relatively lasting way.
Table 6.9 Life Satisfaction and Psychological Distress 1996-2001Dissatisfaction with life Psychological DistressModel 1 Model 2 Model 3 Model 4
Employed .04 * .14 ** .01 n.s. -.08 *Task Quality -.15 *** -.03 ***Work Pressure .03 ** .09 ***Employer Training .04 *** .03 ***Job Upgrading -.02 n.s. -.05 ***Job Insecurity .20 *** .11 ***Self Employed -.02 n.s. -.10 *** .08 *** .04 *Unemployed .49 *** .53 *** .10 *** .12 ***Prev. Unemployment .23 *** .19 *** .12 *** .10 ***Financial Difficulty .74 *** .73 *** .36 *** .36 ***Lowest Q Income .28 *** .26 *** .12 *** .12 ***2nd Lowest Q Income .08 *** .06 ** .01 n.s. .12 ***2nd Highest Q Income -.02 n.s. -.02 n.s. .02 n.s. .01 n.s.Social Isolation Index .39 *** .37 *** .31 *** .30 ***Adj R2 (Full Model) .26 .26 .26 .27
Note 1: Significant positive coefficients for life dissatisfaction indicate greater dissatisfaction;significant positive coefficients for psychological distress indicate greater psychological distress. Ns forlife dissatisfaction (model 1:15268; model 2 15172); for psychological distress (model 1: 14781; model2 14690). Controls included age, sex, country and political orientation.Note 2: * = P < 0.05, ** = P < 0.01, *** = P < 0.001

SOCIAL PRECARITY AND SOCIAL INTEGRATIONTHE EUROPEAN OPINION RESEARCH GROUP EEIG
EUROBAROMETER 56.1. – OCTOBER 2002 Page 126
The lower rows of Table 6.9 show the impact of the financial and social aspects ofprecarity examined in chapter 2. The experience of financial difficulty is clearly thesingle strongest factor associated with well-being, whichever measure is taken.Moreover, there is a clear effect for both increased dissatisfaction with life andincreased psychological distress of being in the lowest quartile with respect tohousehold income. Being in a household in the second lowest income quartile also hasnegative effects on life satisfaction, but is less consistently related to psychologicaldistress.
Finally the model included the measure of social isolation developed in chapter 2.This reflected the extent to which people were cut off from personal relationships intheir family and community. It can be seen that this had a very strong effect inundermining both life satisfaction and psychological well-being. It was the thirdstrongest factor (after financial difficulty and current unemployment) for lifesatisfaction, and the second strongest factor (after financial difficulty) affectingpsychological distress.

SOCIAL PRECARITY AND SOCIAL INTEGRATIONTHE EUROPEAN OPINION RESEARCH GROUP EEIG
EUROBAROMETER 56.1. – OCTOBER 2002 Page 127
Conclusions
On most of the measures of personal well-being examined in the chapter, the trendbetween 1996 and 2001 was towards greater social integration. For instance, amongthose in jobs, although overall levels of employment commitment remainedremarkably low, commitment appeared to have grown somewhat stronger over theperiod. At the same time, while work stress remained an important problem for asubstantial sector of the workforce, there was some decrease in indicators of work-related stress and of conflict between work and family life. It was only in respect tojob satisfaction that there was no evidence of change (although there was an increasein the job satisfaction of women). Moreover, taking the population as a whole,people’s satisfaction with their lives increased and psychological distress decreased(although not for women).
However, the analyses confirm that the various aspects of precarity that have beenexamined in previous chapters – whether those relating to people’s financialcircumstances, their integration in social networks, their employment status or thequality of their jobs – have very clear implications for the sense of personal well-being in society.
Low task quality, higher levels of work pressure and job insecurity underminedcommitment to employment, reduced job satisfaction and increased work-relatedstress. They also appeared to have wider effects in reducing overall satisfaction withlife and heightening psychological distress.
Taking the population as a whole our evidence confirms the very severe effects ofunemployment on people’s personal well-being. But it is notable that, once otherfactors (such as income and social networks) have been controlled, employment per sedid not lead to a higher degree of satisfaction with life or greater psychological well-being than prevailed among those who were non-active. The positive effects ofemployment for personal integration depend upon the quality of jobs.
Finally, it is clear that both the financial and social aspects of precarity had verystrong implications for personal well-being. Financial difficulty was the singlestrongest predictor of both dissatisfaction with life and psychological distress, whilesocial isolation also had sharp negative effects on both measures.

SOCIAL PRECARITY AND SOCIAL INTEGRATIONTHE EUROPEAN OPINION RESEARCH GROUP EEIG
EUROBAROMETER 56.1. – OCTOBER 2002 Page 128
Chapter 7
SOCIAL INSECURITY AND ATTITUDES TO SOCIETY ANDTHE WELFARE STATE
In the 1960s, there were a large number of studies by sociologists and politicalscientists on the question of political alienation, emphasising above all the subjectiveaspect of this phenomenon. According to these researchers, an individual may beregarded as politically alienated when he or she has a sense of being detached fromsociety, of no longer belonging politically, of being a non-player in the game playedby the politicians18. Though the concept of alienation is little used nowadays, thequestion of political disillusionment and withdrawal from everything pertaining to thelife of the polis still remains, not least when people are at risk of poverty andexperience problems of social integration.
Does social insecurity, as we have defined it in this report, have its own specific effecton attitudes to society and the Welfare State? That is the question at the heart of thischapter.
The underlying hypothesis of our analysis is that social insecurity generates not onlydifficulties coping with the constraints of daily living, and a risk of social isolationand psychological distress, but also a deep dissatisfaction with society and with theway democracy works, as well as particular expectations of the Welfare State.
This chapter has two sections. The first concerns attitudes to society, and the secondattitudes to the Welfare State.
18 Among these research works, we may single out: Dwight G. Dean, "Alienation and PoliticalApathy", Social Forces, 1960, vol. 38, n°3, pp. 185-189, Wayne E. Thompson and John E. Horton,"Political Alienation as a force in Political Action", Social Forces, 1960, vol. 38, n°3, pp. 190-185,Martin E. Olsen, "Two Categories of Political Alienation", Social Forces, 1969, vol. 47, n°3, pp. 288-299, Ada W. Finifter, "Dimensions of Political Alienation", The American Political Science Review,1970, vol. 64, n°2, pp. 389-410.

SOCIAL PRECARITY AND SOCIAL INTEGRATIONTHE EUROPEAN OPINION RESEARCH GROUP EEIG
EUROBAROMETER 56.1. – OCTOBER 2002 Page 129
Attitudes to society
For our analysis of attitudes to society, we have two indicators in the 2001 survey:dissatisfaction with the society in which one lives, and dissatisfaction with the waydemocracy works in one’s own country. These two indicators have much in common,in that they enable us to assess the difficulty individuals have in being part of societyand participating as citizens in communal life by voicing their opinions.Dissatisfaction with society can equally mean having difficulty in finding one’s placewithin it, feeling a sense of injustice, or suffering from a lack of social recognition;and dissatisfaction with the way democracy works in one’s country can be a matter ofthe same difficulty and the same sufferings.
Dissatisfaction with society
Dissatisfaction with the society one lives in varies widely from country to country. Itis very rare in Denmark and particularly high in eastern Germany, France, Italy andGreece (cf. figure 7.1). In most countries, dissatisfaction is more common amongthose whose income is at or below the lower quartile than for the population as awhole.

SOCIAL PRECARITY AND SOCIAL INTEGRATIONTHE EUROPEAN OPINION RESEARCH GROUP EEIG
EUROBAROMETER 56.1. – OCTOBER 2002 Page 130
Figure 7.1
Dissatisfaction with society2001
0
10
20
30
40
50
60
70
80
90
Bel
gium
Den
mar
k
Wes
t Ger
man
y
East
Ger
man
y
Fran
ce
Gre
at B
ritai
n
Irel
and
The
Net
herla
nds
Finl
and
Swed
en
Aus
tria
Luxe
mbo
urg
Italy
Spai
n
Gre
ece
Portu
gal
Whole population Lowest incomes (low first quartile)Source: Eurobarometer-LASMAS-IdL
Northern countries Southern countries

SOCIAL PRECARITY AND SOCIAL INTEGRATIONTHE EUROPEAN OPINION RESEARCH GROUP EEIG
EUROBAROMETER 56.1. – OCTOBER 2002 Page 131
While gender is not a significant factor in dissatisfaction with society, we have tostress that the under-25s are distinctly less dissatisfied in this respect than the otherage groups, none of which differed significantly from the whole (cf. table 7.1).
As might be expected, we also find that the unemployed are markedly (andsignificantly) more dissatisfied than those in paid work. This finding is certainly to berelated to the results of research into the social unease felt by the unemployedgenerally, above all when they can see no likelihood of their situation improving aftermany months of fruitless job-hunting. Dissatisfaction with the society in which theylive is the expression of their feelings of bitterness and despair.
We may note that the logistic regression confirms the pattern given by figure 7.1, andin particular the finding that those whose incomes are lowest are particularlydissatisfied. Furthermore, dissatisfaction with society falls steadily as income rises, sothat we may infer that individuals’ disposable income is not only a factor in their well-being or contrariwise in their difficulty coping with daily living, but also aprecondition of their social integration, as the sociologists of consumption, continuingthe work of Maurice Halbwachs19, have already shown.
The logistic regression also confirms the national differences apparent from the graphabove. There is a marked tendency to dissatisfaction to be seen in all the southerncountries.
The indices of (negative) well-being also have a significant effect: social isolation, thedeterioration of local surroundings, and social devaluation each increase thelikelihood of being dissatisfied with society.
Lastly, we find that job insecurity is a significant factor increasing dissatisfaction withsociety, and the quality of work a significant factor reducing it. Recent research hasshown that the people least integrated into working life (job insecurity or poorworking conditions) are also the least integrated into social life and those who mosttend to regard politics and public institutions in general as remote20. Our present resultfurther confirms this.
To summarise, we may say that dissatisfaction with the society one lives in is anindicator of social integration.
19 Cf. Maurice Halbwachs, La classe ouvrière et les niveaux de vie. Recherches sur la hiérarchie desbesoins dans les sociétés industrielles contemporaines, Paris, Alcan, 1912. ["The working class andliving standards. Research into the hierarchy of needs in modern industrial societies" Apparently noEnglish translation.]20 Cf. Serge Paugam, Le salarié de la précarité. Les nouvelles formes de l’intégration professionnelle,Paris, PUF, coll. "Le lien social", 2000. [Wage earners and insecurity; the new forms of occupationalintegration]

SOCIAL PRECARITY AND SOCIAL INTEGRATIONTHE EUROPEAN OPINION RESEARCH GROUP EEIG
EUROBAROMETER 56.1. – OCTOBER 2002 Page 132
Table 7.1 Logistic regression for the probability of being dissatisfied with thesociety one lives in
Variables B. SigConstant -0.99***GenderMen ReferenceWomen 0.05 n.s. Age 15 - 24 -0.31***
25 - 34 -0.04 n.s.35 - 44 Reference45 - 54 0.06 n.s.55 - 64 -0.01 n.s.65+ -0.07 n.s.
Employment status In paid work ReferenceUnemployed 0.54***Inactive 0.06 n.s.
Income below lower quartile 0.18**lower quartile to median 0.12*median to upper quartile 0.01 n.s.above upper quartile Reference
CountryNORTHERN COUNTRIES Belgium 0.65***
Denmark -1.15***Germany-West 0.33***Germany-East 1.07***France 1.00***Great Britain ReferenceIreland -0.54***Netherlands 0.14 n.s.Finland -0.51***Sweden -0.01 n.s.Austria 0.04 n.s.Luxembourg 0.03 n.s.
SOUTHERN COUNTRIES Italy 0.03 n.s.Spain 1.50***Greece 0.70***Portugal 0.96***
Negative quality of lifeindices Social isolation 0.12***
Deterioration of localsurroundings 0.13***Social devaluation 0.11***
Work and employment Task quality -0.14***Work pressure 0.06*Career development 0.06 n.s.Job insecurity 0.25***
*: P <0.05, **: P < 0.01, ***: P < 0,001, n.s.: not significant

SOCIAL PRECARITY AND SOCIAL INTEGRATIONTHE EUROPEAN OPINION RESEARCH GROUP EEIG
EUROBAROMETER 56.1. – OCTOBER 2002 Page 133
Dissatisfaction with democracy
Dissatisfaction with the way democracy works also varies widely from country tocountry. Once more, Denmark is seen to be a country where dissatisfaction is rare,even among the poorest. It is frequent in eastern Germany, France, Italy and Greece:the same countries in which we have already found widespread dissatisfaction withsociety (cf. figure 7.2).
Figure 7.2
Dissatisfaction with democracy2001
0
10
20
30
40
50
60
70
80
Bel
gium
Den
mar
k
Wes
t Ger
man
y
East
Ger
man
y
Fran
ce
Gre
at B
ritai
n
Irel
and
The
Net
herla
nds
Finl
and
Swed
en
Aus
tria
Luxe
mbo
urg
Italy
Spai
n
Gre
ece
Portu
gal
Whole population Lowest incomes (low first quartile) Source: Eurobarometer-LASMAS-IdL
Northern countries Southern countries

SOCIAL PRECARITY AND SOCIAL INTEGRATIONTHE EUROPEAN OPINION RESEARCH GROUP EEIG
EUROBAROMETER 56.1. – OCTOBER 2002 Page 134
Women seem a little less likely to be dissatisfied, ceteris paribus, than men; also,young people under 25 tend less to be dissatisfied with democracy than the other agegroups.
We also find, in the case of dissatisfaction with democracy, the same effects ofunemployment, poverty, negative quality of life indices and characteristics of thework and employment as for dissatisfaction with society. These two forms ofdissatisfaction are therefore quite similar: both express a deep social discontent; and itis clear that they are not unrelated to difficulties in social integration.

SOCIAL PRECARITY AND SOCIAL INTEGRATIONTHE EUROPEAN OPINION RESEARCH GROUP EEIG
EUROBAROMETER 56.1. – OCTOBER 2002 Page 135
Table 7.2 Logistic regression for the probability of being dissatisfied with theway democracy works in one’s own country
Variables B. SigConstant -1.30***GenderMen ReferenceWomen -0.06*Age 15 - 24 -0.39***
25 - 34 -0.05 n.s.35 - 44 Reference45 - 54 0.08 n.s.55 - 64 0.06 n.s.65+ -0.06 n.s.
Employment status In paid work ReferenceUnemployed 0.62***Inactive 0.05 n.s.
Income below lower quartile 0.20***lower quartile to median 0.13*median to upper quartile 0.04 n.s.above upper quartile Reference
CountryNORTHERN COUNTRIES Belgium 0.95***
Denmark -0.51***Germany-West 0.85***Germany-East 1.56***France 1.14***Great Britain ReferenceIreland -0.30**Netherlands 0.03 n.s.Finland 0.25**Sweden 0.62***Austria 0.60***Luxembourg 0.22*
SOUTHERN COUNTRIES Italy 1.51***Spain 0.70***Greece 1.04***Portugal 0.67***
Negative quality of lifeindices Social isolation 0.08***
Deterioration of localsurroundings 0.13***
Social devaluation 0.10***Work and employment Task quality -0.08*
Work pressure 0.02 n.s.Career development 0.07 n.s.Job insecurity 0.27***
*: P <0.05, **: P < 0.01, ***: P < 0,001, n.s.: not significant

SOCIAL PRECARITY AND SOCIAL INTEGRATIONTHE EUROPEAN OPINION RESEARCH GROUP EEIG
EUROBAROMETER 56.1. – OCTOBER 2002 Page 136
Moreover, if these two forms of dissatisfaction are particularly widespread amongthose people who are least well integrated into the economic, social and political lifeof their country, this is bound to cause problems for social cohesion at both nationaland European levels. Both forms in fact contain a danger of social polarisation whichcould manifest itself in various kinds of radicalism, and in greater violence and moreacute insecurity21.
Attitudes to the Welfare State
In most European societies, the more disadvantaged groups are likely to be gettingassistance from the Welfare State, though its amount and form varies depending onthe country in which they live. These benefits are rights and guarantees designed tocounter the risks of poverty and exclusion. Attitudes to the Welfare State maytherefore vary also, from country to country and according to the extent of thedifficulties that face people in daily living.
They can be studied on the basis of a number of indicators; we have chosen three forthis section: an indicator of approval of government social policy, an indicator ofsolidaristic attitudes and, lastly, an indicator of severity towards the unemployed.
Approval of government social policy
As elements of an attitude of approval towards government social policy, we haveused the following six variables to construct an index:
- It is the responsibility of the government to reduce the differences between thosewith high and low incomes;
- The government should ensure that all children have a decent standard of living;
- The government should provide everyone with a guaranteed basic income;
- The government should provide decent housing for all who cannot afford it.
- The government should provide a job for everyone who wants one;
- The government should provide a decent standard of living for the unemployed.
The Cronbach test produces a satisfactory coefficient of 0.78, indicating that thevariables used in the construction of this index do indeed measure the sameunderlying dimension.
21 A recent survey has shown that those employees who are least well integrated within their firm andin their working lives are distinctly keener than others on a radical transformation of society. Cf. S.Paugam, Le salarie de la precarite, ibid.

SOCIAL PRECARITY AND SOCIAL INTEGRATIONTHE EUROPEAN OPINION RESEARCH GROUP EEIG
EUROBAROMETER 56.1. – OCTOBER 2002 Page 137
This index also varies from country to country. In countries with a less highlydeveloped social policy, the index is particularly high; and this is particularly true ofsouthern countries, where expectations seem to be great. On the other hand, in certainnorthern countries, the index is lower, especially in Denmark, western Germany, theNetherlands and Austria (cf. figure 7.3). These results bode well in a sense for theharmonisation of European social policies, in that public opinion in the countrieswhich seem behind at present appears to be truly in favour of catching up.
We may also point out that the index is higher for the people whose income is at orbelow the lower quartile than for the population as a whole. The poorest 25% aremore in favour of government social policy than the other income categories: thisseems a near-universal tendency, since only the eastern Länder of Germany appear tobe a slight exception, for here no statistically significant divergence between theviews of the poorest and those of the population as a whole is to be found.

SOCIAL PRECARITY AND SOCIAL INTEGRATIONTHE EUROPEAN OPINION RESEARCH GROUP EEIG
EUROBAROMETER 56.1. – OCTOBER 2002 Page 138
Figure 7.3
Approval of government social policy2001
0
1
2
3
4
5
6
Bel
gium
Den
mar
k
Wes
t Ger
man
y
East
Ger
man
y
Fran
ce
Gre
at B
ritai
n
Irel
and
The
Net
herla
nds
Finl
and
Swed
en
Aus
tria
Luxe
mbo
urg
Italy
Spai
n
Gre
ece
Portu
gal
Whole population Lowest incomes (low first quartile) Source: Eurobarometer-LASMAS-IdL
Northern countries Southern countries
This support for the principle of a social policy of government intervention does notsignificantly vary according to gender (cf. table 7.3). In terms of age, on the otherhand, the under-25s and over-65s are significantly less in favour of government socialpolicy than the reference age group (35 to 44). It should be remembered that thefinancial burdens on individuals are lighter for young people under 25, many of whomare still dependent on their parents, and for older people; this certainly explains, atleast in part, their more detached attitude to social security.

SOCIAL PRECARITY AND SOCIAL INTEGRATIONTHE EUROPEAN OPINION RESEARCH GROUP EEIG
EUROBAROMETER 56.1. – OCTOBER 2002 Page 139
We also find that the unemployed have a significantly more favourable attitude togovernment social policy than those in paid work. Ceteris paribus, this attitude alsobecomes significantly less common as income rises. We may therefore conclude thatit is the poorer groups, and those less well integrated into the job market, who mostsupport social policy, in other words the people whose material situation and socialstatus depend on this type of intervention to a great extent.
The two indices of rundown local surroundings and social devaluation also have asignificant positive effect on the likelihood of approving the idea of governmentsocial policy, indicating that the greatest expectations of the Welfare State are to befound among the disadvantaged. We need to stress, though, that instability ofemployment has a slightly negative effect on the probability of being in favour ofgovernment social policy. We might explain this anomaly by suggesting that peoplewho have an insecure job are liable to feel threatened by the unemployed or those onbenefit, especially by those they regard as reluctant to take on hard work; they maywish to distinguish themselves socially from such "scroungers" by validating the viewthat they are able to get benefit without truly looking for work. This attitude ofdisapproval towards social policy would then be an expression of the need for aparticular social distinction, one which might certainly be necessary to makeundervalued and unpleasant employment conditions more bearable. Lastly, we should also note that those who have enjoyed some career development arefavourable to social policy as well: we may surmise that this group has been able tobenefit from such assistance, for instance in training.

SOCIAL PRECARITY AND SOCIAL INTEGRATIONTHE EUROPEAN OPINION RESEARCH GROUP EEIG
EUROBAROMETER 56.1. – OCTOBER 2002 Page 140
Table 7.3 Logistic regression for the probability of approving of governmentsocial policy
Variables B. SigConstant 3.84***GenderMen ReferenceWomen 0.03 n.s.Age 15 - 24 -0.12**
25 - 34 -0.04 n.s.35 - 44 Reference45 - 54 0.02 n.s.55 - 64 -0.04 n.s.65+ -0.16***
Employment status In paid work ReferenceUnemployed 0.59***Inactive 0.43***
Income below lower quartile 0.38***lower quartile to median 0.26***median to upper quartile 0.16***above upper quartile Reference
CountryNORTHERN COUNTRIES Belgium 0.24***
Denmark -0.29***Germany-West -0.61***Germany-East 0.37***France 0.26***Great Britain ReferenceIreland 0.73***Netherlands -0.20**Finland 0.46***Sweden -0.04 n.s.Austria -0.76***Luxembourg 0.30***
SOUTHERN COUNTRIES Italy 0.32***Spain 0.59***Greece 1.10***Portugal 0.43***
Negative quality of lifeindices Social isolation 0.01 n.s.
Deterioration of localsurroundings 0.04***
Social devaluation 0.05**Work and employment Task quality -0.08**
Work pressure -0.03 n.s.Career development 0.19***Job insecurity -0.08*
*: P <0.05, **: P < 0.01, ***: P < 0,001, n.s.: not significant

SOCIAL PRECARITY AND SOCIAL INTEGRATIONTHE EUROPEAN OPINION RESEARCH GROUP EEIG
EUROBAROMETER 56.1. – OCTOBER 2002 Page 141
Solidaristic attitudes
Solidaristic attitudes may be established on the basis of the proposition: "I would beready to pay more tax if it were definitely used to improve the situation of the poor".To accept higher taxes for the sake of the poor is not only a generous towards thoseless privileged than oneself, but also reflects a sense of civic participation and socialjustice: an act stemming from a personal decision but at the same time belonging to anoverall vision of a common life and of social and national cohesion.
Among the countries where this attitude is the most widespread we find Denmark,Great Britain, Sweden, and Luxembourg; also Italy and Spain (cf. figure 7.4). InGermany and Austria it is a great deal less frequent; we may suppose that in Germanythanks to the application of the subsidiarity principle and the important role given tocharity associations at local level, it is more acceptable to look for solutions to povertyfirst in local affinity networks before turning to the idea of greater tax-fundedintervention by the central government. We may also surmise that the large-scaletransfers from western Germany to the eastern region after reunification, whichresulted among other things in a sizeable increase in direct and indirect taxation, mayin the end have made the Germans somewhat more lukewarm about redistributiontowards the poor.
Solidaristic attitudes are less widespread among the lowest income groups than in thepopulation as a whole, in all countries except Belgium, Denmark, Great Britain andItaly. While the poorest groups are a little less prepared to pay more taxes, this issurely because their situation does not allow them to.

SOCIAL PRECARITY AND SOCIAL INTEGRATIONTHE EUROPEAN OPINION RESEARCH GROUP EEIG
EUROBAROMETER 56.1. – OCTOBER 2002 Page 142
Figure 7.4
Solidaristic Attitudes2001
0
10
20
30
40
50
60
70
Bel
gium
Den
mar
k
Wes
tG
erm
any
East
Ger
man
y
Fran
ce
Gre
at B
ritai
n
Irel
and
The
Net
herla
nds
Finl
and
Swed
en
Aus
tria
Luxe
mbo
urg
Italy
Spai
n
Gre
ece
Portu
gal
Whole population Lowest incomes (low first quartile)Source: Eurobarometer-LASMAS-IdL
Northern countries Southern countries
SOCIAL PRECARITY AND SOCIAL INTEGRATIONTHE EUROPEAN OPINION RESEARCH GROUP EEIG
EUROBAROMETER 56.1. – OCTOBER 2002 Page 143
Other things being equal, women have a slightly less solidaristic attitude than men (cf.table 7.4). The under-25s and over-65s, also, are less solidaristic than the people of 35to 44 years, which tallies with the tendency already found in the case of the index ofapproval of government social policy. We may note that the unemployed are notsignificantly more solidaristic than those in paid work, though the economicallyinactive are.
We can confirm from this logistic regression that those with the lowest incomes aresignificantly less solidaristic that the other income groups; and the nationaldifferences of figure 7.4 are also as significant.
The indices of social isolation, social devaluation and task quality at work all have apositive effect on readiness to pay more taxes for the sake of the poor. Job insecurityon the other hand, has an effect negative on this attitude.
We may therefore conclude that people whose difficulties are financial or materialand whose future is uncertain find it harder than others to declare that they could paymore taxes for the sake of the poor: these people are already aware of being poorthemselves, and may have reflected that social policy is already pointing them out aspriority targets. On the other hand, people who suffer from social isolation or socialdevaluation feel more spontaneously solidaristic because they hope that an upsurge ofsolidarity will give them more chance to participate.

SOCIAL PRECARITY AND SOCIAL INTEGRATIONTHE EUROPEAN OPINION RESEARCH GROUP EEIG
EUROBAROMETER 56.1. – OCTOBER 2002 Page 144
Table 7.4 Logistic regression for the probability of agreeing with the proposition:"I would be prepared to pay more taxes if I was certain they would be used toimprove the situation of the poor"
Variables B. SigConstant 0.22*GenderMen ReferenceWomen -0.06*Age 15 - 24 -0.28***
25 - 34 -0.06 n.s.35 - 44 Reference45 - 54 -0.01 n.s.55 - 64 -0.09 n.s.65+ -0.23***
Employment status In paid work ReferenceUnemployed 0.14 n.s.Inactive 0.17**
Income below lower quartile -0.31***lower quartile to median -0.10 n.s.median to upper quartile -0.05 n.s.above upper quartile Reference
CountryNORTHERN COUNTRIES Belgium -0.55***
Denmark -0.18*Germany-West -1.07***Germany-East -0.71***France -0.39***Great Britain ReferenceIreland -0.03 n.s.Netherlands 0.05 n.s.Finland -0.24**Sweden 0.07 n.s.Austria -0.93***Luxembourg -0.04 n.s.
SOUTHERN COUNTRIES Italy 0.01 n.s.Spain 0.05 n.s.Greece 0.35***Portugal -0.24**
Negative quality of life indices Social isolation 0.04*Deterioration of localsurroundings 0.01 n.s.
Social devaluation 0.07**Work and employment Task quality 0.10**
Work pressure 0.01 n.s.Career development -0.04 n.s.Job insecurity -0.16**
*: P <0.05, **: P < 0.01, ***: P < 0,001, n.s.: not significant

SOCIAL PRECARITY AND SOCIAL INTEGRATIONTHE EUROPEAN OPINION RESEARCH GROUP EEIG
EUROBAROMETER 56.1. – OCTOBER 2002 Page 145
Severity of attitudes towards the unemployed
Lastly, we should note that a high proportion of people in each country agree with theproposition "people without a job should be forced to accept one quickly, even if it’snot as good as what they used to do" (cf. figure 7.5).
This high proportion is probably to be ascribed to the improvement in the economicclimate and the reduction of unemployment. In a period where jobs are being created,the unemployed who do not find work are more likely to be suspected of not wantingit.

SOCIAL PRECARITY AND SOCIAL INTEGRATIONTHE EUROPEAN OPINION RESEARCH GROUP EEIG
EUROBAROMETER 56.1. – OCTOBER 2002 Page 146
Figure 7.5
Attitude of severity towards the unemployed2001
0102030405060708090
100
Bel
gium
Den
mar
k
Wes
t Ger
man
y
East
Ger
man
y
Fran
ce
Gre
at B
ritai
n
Irel
and
The
Net
herla
nds
Finl
and
Swed
en
Aus
tria
Luxe
mbo
urg
Italy
Spai
n
Gre
ece
Portu
gal
Whole population Lowest incomes (low first quartile) Source: Eurobarometer-LASMAS-IdL
Northern countries Southern countries
As might be expected, the unemployed themselves do not subscribe to this notion.People under 35, people whose income is below the median, and people with little jobsecurity are also significantly less likely to agree with this proposition (cf. table 7.5).
The results of the logistic regression also confirm wide national differences. Of thenorthern countries, the Netherlands and Sweden are the most favourable to thisproposition. These two countries are well known to have developed very active jobaccess policies, and the population probably thinks quite favourably of these. We mayalso note, however, the case of Denmark, again a country with an active policy onaccess to employment, but where opinion is nonetheless significantly less inagreement with such severity towards the unemployed. Among southern countries,

SOCIAL PRECARITY AND SOCIAL INTEGRATIONTHE EUROPEAN OPINION RESEARCH GROUP EEIG
EUROBAROMETER 56.1. – OCTOBER 2002 Page 147
opinion in both Greece and Portugal is more likely to agree with it than in Italy orSpain.

SOCIAL PRECARITY AND SOCIAL INTEGRATIONTHE EUROPEAN OPINION RESEARCH GROUP EEIG
EUROBAROMETER 56.1. – OCTOBER 2002 Page 148
Table 7.5 Logistic regression for the probability of agreeing with the proposition:"people without a job should be forced to accept one quickly, even if it’s not asgood as what they used to do".
Variables B. SigConstant 1.15***GenderMen ReferenceWomen 0.05 n.s.Age 15 - 24 -0.16**
25 - 34 -0.15**35 - 44 Reference45 - 54 0.07 n.s.55 - 64 0.35***65+ 0.47***
Employment status In paid work ReferenceUnemployed -0.77***Inactive -0.24***
Income below lower quartile -0.16**lower quartile to median -0.19**median to upper quartile -0.07 n.s.above upper quartile Reference
CountryNORTHERN COUNTRIES Belgium 0.05 n.s.
Denmark -0.24**Germany-West 0.18 n.s.Germany-East -0.05 n.s.France 0.04 n.s.Great Britain ReferenceIreland -0.15 n.s.Netherlands 0.51***Finland -0.11 n.s.Sweden 0.45***Austria -0.20*Luxembourg 0.34**
SOUTHERN COUNTRIES Italy 0.20*Spain -0.24**Greece 0.90***Portugal 0.44***
Negative quality of lifeindices Social isolation -0.04 n.s.
Deterioration of localsurroundings -0.02 n.s.
Social devaluation -0.01 n.s.Work and employment Task quality -0.04 n.s.
Work pressure -0.03 n.s.Career development 0.03 n.s.Job security -0.15**
*: P <0.05, **: P < 0.01, ***: P < 0,001, n.s.: not significant

SOCIAL PRECARITY AND SOCIAL INTEGRATIONTHE EUROPEAN OPINION RESEARCH GROUP EEIG
EUROBAROMETER 56.1. – OCTOBER 2002 Page 149
Conclusion
We have shown in the first section of this chapter that dissatisfaction with the societyone lives in and dissatisfaction with the way democracy works both vary widely fromcountry to country. These two forms of dissatisfaction are very rare in Denmark, andparticularly widespread in eastern Germany, France, Italy and Greece. Theunemployed, and those with the lowest incomes are particularly prone todissatisfaction in both these areas; and the indices of negative well-being also have asignificant effect: the social isolation, run-down local surroundings and socialdevaluation make it more likely a person will be dissatisfied with society. We alsofind that job insecurity is a factor in dissatisfaction with society, while quality of worktends to promote satisfaction. We may therefore conclude that these two forms ofdissatisfaction are similar, both expressing a deep social discontent which we mayregard as more or less generally shared.
The second section showed that approval for the principle of government interventionin social policy also varies from country to country. In countries where social policy isless developed the index is particularly high, especially in southern countries, whereexpectations appear to be considerable. On the other hand, in certain northerncountries, the index is lower, especially in Denmark, western Germany, theNetherlands and Austria. We concluded that public opinion in the countries whichseem behind at present appears to be truly in favour of catching up; if so, this oughtincreasingly to find expression in greater harmonisation of European social policies.The results also confirmed that support for the principle of government intervention inthe form of social policy is stronger among the unemployed, the poorest groups, andthose who have enjoyed some career development, that is, those whose materialsituation and social status may depend – or may have depended – on suchintervention.
It will also be recalled that among the countries with the most widespread readiness topay more taxes we found Denmark, Great Britain, Sweden, and Luxembourg; and alsoItaly and Spain. The lowest income groups tend not to accept the idea of paying moretaxes, no doubt because their situation does not allow it. Job insecurity contributesnegatively to solidaristic attitudes, while task quality at work is a positive factor.Lastly, we should note that a high proportion of people in each country agree with theproposition "The unemployed should be forced to take a job quickly, even if it is notas good as their previous job". We may surmise that the reduction in unemploymentand the creation of jobs is making this view more popular, even though the issue ofoccupational insecurity still remains and is inducing those professionally concernedwith issues of job access and placement to think more and more about the quality ofjobs.

SOCIAL PRECARITY AND SOCIAL INTEGRATIONTHE EUROPEAN OPINION RESEARCH GROUP EEIG
EUROBAROMETER 56.1. – OCTOBER 2002 Page 150
Chapter 8
Conclusion
Our detailed results are presented in the summary and the text of the chapters. Herewe confine ourselves to highlighting just a few of the broader conclusions andpointing to some of their implications for the future development of welfare policies.
First, compared to 1993, there has been a decline both in the proportion of peopledirectly experiencing financial difficulty and in the visibility of poverty. This isconsistent with the marked fall in unemployment rates and the general improvementin economic conditions over this period. However, this general trend towards thereduction of poverty has to be taken in the context of considerable differencesbetween countries, with some of the Southern countries still showing very high levels(and particularly long durations) of subjective poverty. Further, the general trend toimprovement has been accompanied by an increase in some of the difficultiesexperienced by the poor for instance with respect to meeting housing costs, the lack ofsocial support and dissatisfaction with family and social life. While this pattern maybe explicable partly in terms of the changing composition of the poor as economiccircumstances improved, it is notable that there has been a marked trend over thesame period towards a less sympathetic interpretation of poverty on the part of thegeneral population which could well have made social relationships more difficult forthe poor. Hence while the problem of the precarity of living conditions may havegrown smaller in terms of the numbers involved, the demands on effective policy forhelping those who are still poor may have grown greater.
Turning to longer term determinants of the risk of social exclusion, the evidencesuggests that employment growth since 1996 had not been accompanied by animprovement in several aspects of work that are of particular importance for reducingfuture risks of marginalisation. There has been no improvement (rather a decline) intask quality, which is important for the maintenance of people’s motivation to remainin employment and for the preservation of their learning and decision-making skills.While the overall trend is still towards higher skill levels, there has been a declinecompared to the mid-1990s in the pace of upskilling. Most worryingly, there has beenno sign of progress in developing the opportunities for skill maintenance and skilldevelopment for the low-skilled, the category that is the most vulnerable to job lossand labour market marginalisation. However, we found no evidence that there hasbeen a marked intensification of work. Further, while a substantial proportion of theworkforce experienced high levels of stress at work, there has been some declinerather than a rise in stress compared with the mid-1990s.

SOCIAL PRECARITY AND SOCIAL INTEGRATIONTHE EUROPEAN OPINION RESEARCH GROUP EEIG
EUROBAROMETER 56.1. – OCTOBER 2002 Page 151
There is also evidence of improvement in short-term job security, reflecting thereduction of unemployment over the period. But, given its dependence on theeconomic cycle, short-term job security remains problematic. There is clearly a vitalneed to improve the quality of the jobs and of the work skills of the low skilled so thatthey will be in a stronger position on the labour market in periods of economicdifficulty.
Precarity in both living and work conditions appears to have serious implications notonly for people’s personal experiences but also for their attitudes to the wider society.Those in a more precarious work situation were less committed to employment, hadlower job satisfaction and higher work-related stress. Precarity in both work andliving conditions was associated with lower life satisfaction and increasedpsychological distress. Given the severe implications of precarity for people’spersonal welfare it is understandable that it also appeared to influence the way peopleviewed the society they lived in. Those who suffered from precarity, across the rangeof dimensions we studied, were significantly more dissatisfied by the society theylived in and by the functioning of its democratic institutions. In short, in addition totheir importance for the risk of marginalisation and social exclusion, precarity inliving and work conditions are deeply problematic for the social cohesion of society.
The report raises three questions concerning current policies to combat poverty andsocial exclusion. These relate to the implications of such policies for stigmatisation;the need to extend policies to issues of the quality of jobs and finally the persistingdifferences in experiences between the Northern and Southern European societies.
The policies initially developed from the late 1970s to counter the effects of a sharprise in unemployment and poverty aimed above all to reduce the level ofunemployment and to help people (and their families) who had fallen into a marginalposition on the labour market by offering a range of options to facilitate bothoccupational and social reinsertion. For most of the time these policies wereunderpinned by a type of collective empathy towards the unemployed and theexcluded, since, at the height of the employment crisis, poverty was seen as arisingabove all from social injustice. With the return to growth and the improvement in theeconomic context, this empathy has sharply diminished.
At the same time, there has been a re-orientation of employment policy, reflectingconcern about the risks of social exclusion for the long-term unemployed.Increasingly the tendency has been to move away from the social management ofmass and long-term unemployment in order to encourage job acquisition moreactively. At one level this has involved the provision of more individualisedcounselling and monitoring and increased training opportunities. At another it hasinvolved tighter control of the steps taken by the unemployed to obtain work, thecreation of financial incentives for those who get back to work and the imposition ofsanctions against those who are judged to be insufficiently active. The survey resultssuggest that this policy re-orientation is accepted by the majority of people in eachcountry, given the prevalence of agreement with the proposition that the unemployedshould be forced to take a job rapidly, even if it is less good than the one they hadpreviously.

SOCIAL PRECARITY AND SOCIAL INTEGRATIONTHE EUROPEAN OPINION RESEARCH GROUP EEIG
EUROBAROMETER 56.1. – OCTOBER 2002 Page 152
Such policies may contribute to more rapid re-insertion in employment, in particularfor those with relevant skills. However, they also have the potential risk ofentrenching a type of social dualism in a climate which we have seen has alreadybecome more unfavourable to the disadvantaged. They may increase the risk ofstigmatisation for low-skilled long-term unemployed people, who are blamed for theirdifficulties, irrespective of the problems they have encountered in their lives and thereal structural barriers to their reinsertion.
It is important, then, to assess carefully the long-term implications of the shift in thenature of policies against unemployment and social exclusion to ensure that they donot have the effect of increasing discrimination against those requiring specific typesof help or by encouraging a distinction between what were known in an earlierhistorical period as the ‘good’ and the ‘bad’ poor. Our report underlines the fact thatthe poor population in every country is heterogeneous, that the difficulties and needsencountered are highly variable and that deep and persistent poverty, often transferredfrom one generation to the next, have not disappeared in Europe. To reinforce socialcohesion, it is vital to continue to construct a diversified set of mechanisms toimprove the chances of those experiencing greatest hardship to participate in theeconomic, social and political life of their country.
For many years, policies against poverty and social exclusion have focused onunemployment and its social consequences. Given the evidence on the severity of theeffects of unemployment, policy makers have increasingly emphasised that the key tothe exit from poverty lies through access to employment. Getting people into workhas become a privileged axis of policy. Throughout this period, policy makers in mostcountries have passed in silence over the crucial question of the quality of jobs. Ourreport shows that it is not sufficient to have a job to be well integrated into the worldof work. Employment per se cannot adequately protect against poverty in the longer-run when a substantial proportion of jobs are insecure or poorly paid. There remains,as has been seen, a considerable proportion of employees in jobs that are not enrichingand that offer little in the way of career perspectives. The recent pattern of change inthis respect is not encouraging, implying a potentially increasing risk of eventualfinancial hardship and precarity for a significant sector of the workforce. There is thenan urgent need to develop policies designed to improve the skills of employeesexposed to this risk and to help them, together with the unemployed, obtain jobs thatare better adapted to facilitate long-term social integration.
Finally, our report has underlined the very marked differences between the NorthernEuropean countries, on the one hand, and the Southern European countries, on theother, with respect to poverty and the way it is perceived. It is clear that poverty ismore of a conjunctural phenomenon in the Northern countries and more of a structuralphenomenon in the Southern. Poverty was more frequently seen as resulting from a"collapse" in people’s circumstances in the North whereas in the South it was viewedto a much greater extent as "inherited poverty". There may well be pressures to reducesuch differences. It has been seen that subjective poverty is very widespread in theSouthern countries, reflecting a high level of frustration with people’s living standardsand a desire for radical change.

SOCIAL PRECARITY AND SOCIAL INTEGRATIONTHE EUROPEAN OPINION RESEARCH GROUP EEIG
EUROBAROMETER 56.1. – OCTOBER 2002 Page 153
It was also evident that expectations with respect to social policies are high. Progressin catching up with respect to both economic and social development is clearlyimportant in the interests of social cohesion within these countries and, more broadly,within the European Union. An important stimulus to achieving this in the countriesthat lag behind in terms of adequate social protection lies in the extension of Europeaninitiatives for enhanced co-ordination of policies to combat poverty and socialexclusion, thereby promoting greater convergence in levels of provision for thedisadvantaged.
SOCIAL PRECARITY AND SOCIAL INTEGRATIONTHE EUROPEAN OPINION RESEARCH GROUP EEIG
EUROBAROMETER 56.1. – OCTOBER 2002 Page 154
TECHNICAL ANNEX 1 - DATA ANALYSIS
Our approach in the use of indicators has had to be pragmatic given the constraints ofthe data available. Where possible we have grouped questionnaire items to producescores or indices of key measures. Examples of this are to be found in our measuresfor social isolation, task quality, work pressure, work strain, psychological distressand attitudes to welfare. A score or scale based on several correlated items providesmore reliable information than any of the component items. But this is only a validprocedure if there is a reasonable degree of scale reliability. Before bringing togethera group of items to form a composite measure, the items were tested by means of areliability analysis. The statistical measure used to summarise inter-item reliabilitywas Cronbach’s alpha. As a broad criterion of adequacy, we have adopted thethreshold of a Cronbach’s alpha of .60. However, in a questionnaire that is relativelywide-ranging in its objectives, it is not practical to cover all domains in this way andin many instances we have been obliged to use individual questions as indicators. Thisis also necessitated by the concern for comparability with previous surveys, sincequestions in these were often asked only in this form.
In cases where we have produced summative scales, our main procedure for analysishas been multiple regression analysis by the ordinary least squares (OLS) method.Ordinary least squares regression requires that the dependent variable should beapproximately normally distributed. It has great practical advantages by comparisonwith other methods, especially that the results have a direct numerical interpretation.
However, in cases where the outcome variable is binary (yes-no): for instance whetheror not a person has experienced unemployment in a certain period. It is notappropriate to apply ordinary regression to this case. Instead we have carried outlogistic regression analysis. For a binary outcome what one observes is the relativefrequency with which "yes" and "no" occur. In logistic regression analysis this is thenconverted into the form of odds. The term ‘odds’ is used as in betting: if the outcomeoccurs nine times out of ten, then the odds-on are 9 to 1. For computationalconvenience it is actually the natural logarithm of this ratio, or log-odds, which isused. The analysis then estimates the effects of the other variables under considerationon this outcome measure.
SOCIAL PRECARITY AND SOCIAL INTEGRATIONTHE EUROPEAN OPINION RESEARCH GROUP EEIG
EUROBAROMETER 56.1. – OCTOBER 2002 Page 155
Sometimes the outcome variable has several ordered categories, but not sufficientlymany to justify the use of ordinary regression. The definition of the response set issuch that one knows that particular categories of response are "higher" or "lower" thanothers, but it is not possible to assume that the distance between categories is equal. Inthis case, we have used an ordered logit procedure, which is an extension of logisticregression to multiple categories.
All of these regression procedures require the selection of reference categories, towhich an effect is compared. For instance, a variable for men has the referencecategory of women. In the case of the analysis of changes in work precarity, thesituation in each particular country has been compared to that of Germany. The choiceof reference country can be guided by both theoretical and statistical considerations. Itis important for the reference to have clear meaning for readers, so that they caninterpret what deviations from the reference category imply. Here it has been assumedthat there would be higher familiarity with the institutions of Germany as a countrythan would be the case with some of the smaller countries. It also has the advantage ofbeing fairly centrally placed with respect to many of our measures so that there tend tobe a range of positive and negative deviations. Finally, it provides a good base interms of sample numbers and thereby reduces the risk of results reflecting a poorlymeasured base category.

SOCIAL PRECARITY AND SOCIAL INTEGRATIONTHE EUROPEAN OPINION RESEARCH GROUP EEIG
EUROBAROMETER 56.1. – OCTOBER 2002 Page 156
TECHNICAL ANNEX 2 – RESPONSE RATES
EB56.1 B DK WG EG GR E F IRL NIRL
N° of interviewers 105 86 239 217 44 103 110 90 32
N° of sampling points 132 100 210 210 101 142 110 125 38
N° of starting points 132 100 210 210 202 174 110 125 38
N° of effective contacts 2144 2817 1363 1339 2393 1378 1397 2732 706
N° of refusals 1072 1780 345 311 1386 329 383 1691 394
N° of interviews interrupted 43 36 0 0 3 49 12 41 3
N° of completed interviews 1029 1001 1031 1009 1004 1000 1004 1000 304
Response rate (%) 48 36 76 75 42 73 72 37 43
EB56.1 I L NL A P FIN S GB
N° of interviewers 115 55 113 110 47 77 149 112
N° of sampling points 103 74 113 166 165 170 56 112
N° of starting points 115 119 113 170 180 170 210 112
N° of effective contacts 1750 904 2099 1583 1663 2497 2012 3435
N° of refusals 676 282 1025 358 628 1402 995 1708
N° of interviews interrupted 47 11 49 151 34 83 17 1019
N° of completed interviews 992 611 1025 1074 1001 1012 1000 708
Response rate (%) 56 68 49 68 60 41 50 21

SOCIAL PRECARITY AND SOCIAL INTEGRATIONTHE EUROPEAN OPINION RESEARCH GROUP EEIG
EUROBAROMETER 56.1. – OCTOBER 2002 Page 157
REFERENCE LISTBurchell, B., Lapido, D., and Wilkinson, F. (2002) Job Insecurity and Work Intensification. London:Routledge.
European Commission (2001) Employment in Europe 2001 Recent Trends and Prospects.Luxembourg: Office for Official Publications of the European Communities.
European Foundation for the Improvement of Living and Work Conditions (2001) Ten Years ofWorking Conditions in the European Union. Luxembourg: Office for Official Publications of theEuropean Community.
European Commission 2001, Employment in Europe 2001, Luxembourg,http://europa.eu.int/comm/dgs/employment_social/key_en.htm
Gallie, D. and Russell, H. (1998) "Unemployment and Life Satisfaction", Archives Européennes desociologie, XXXIX, 2: 3-35.
Gallie, D. and Paugam, S. e. (2000) Welfare Regimes and the Experience of Unemployment in Europe.Oxford: Oxford University Press.
Gallie, D (1997) Employment, Unemployment and the Quality of Life:The Employment in EuropeSurvey 1996. Report to DG Employment.
Goldberg, D. (1978) Manual of the General Health Questionnaire. Windsor: National Foundation forEducational Research.
Green, F. (1999) "It's Been a Hard Day's Night: The Concentration and Intensification of Work in late20th Century Britain". Department of Economics, University of Kent, Studies in Economics. 99/13 .
Gregg, P., Knight, G., and Wadsworth, J. (2000) "Heaven knows I'm miserable now: job insecurity inthe British labour market", in Heery, E. and Salmon, J., The Insecure Workforce. London: Routledge.
Johnson, J. V. and Johansson G.(eds) (1991) The Psychosocial Work Environment: Work Organization,Democratization and Health. Essays in Memory of Bertil Gardell. Amityville, New York: BaywoodPublishing Company, Inc.
Karesek, R. and Theorell, T. (1990) Healthy Work. Stress, Productivity and the Reconstruction of WorkLife. New York: Basic Books.
Paugam, S. (1991) La disqualification sociale. Paris: Presses Universitaires de France.
Paugam, S. (2000) Le salarié de la précarité. Les nouvelles formes de l'intégration sociale. Paris:Presses Universitaires de France.
Poverty 3 (1990) The Perception of Poverty in Europe. Brussels: European Commission. DirectorateGeneral for Employment, Industrial Relations and Social Affairs.
Riffault, H. and Rabier, J. J. (1977) The Perception of Poverty in Europe. Brussels: EuropeanCommission.
Rigaux, N. (1994) The Perception of Poverty and Social Exclusion in Europe 1994. Brussels: EuropeanCommission. Directorate General for Employment, Industrial Relations and Social Affairs.
Theorell, T. and Karesek, R. (1996) "Current Issues Relating to Psychosocial Job Strain andCardiovascular Disease Research", Journal of Occupational Health and Psychology 1: 9-26.
Townsend, P. (1979) Poverty in the United Kingdom. A survey of household resources and standardsof living. Harmondsworth: Penguin Books Ltd.
Warr, P. (1987) Work, Unemployment and Mental Health. Oxford: Clarendon Press.

SOCIAL PRECARITY AND SOCIAL INTEGRATIONTHE EUROPEAN OPINION RESEARCH GROUP EEIG
EUROBAROMETER 56.1. – OCTOBER 2001 Page 135
Questionnaire
Q.2. For each of the following, please tell me if you think it absolutely necessary to live properly nowadays or not? +----------------------------------------------------------------------------------+--------------+----------------+----------+| READ OUT | ABSOLUTELY | NOT ABSOLUTELY | || | NECESSARY | NECESSARY | DK |+----------------------------------------------------------------------------------+--------------+----------------+----------+| 1. Having a good job | 6 1 2 3 |+----------------------------------------------------------------------------------+------------------------------------------+| 2. Having a good education | 7 1 2 3 |+----------------------------------------------------------------------------------+------------------------------------------+| 3. Living with a partner with whom one has a good relationship (N) | 8 1 2 3 |+----------------------------------------------------------------------------------+------------------------------------------+| 4. Having children (N) | 9 1 2 3 |+----------------------------------------------------------------------------------+------------------------------------------+| 5. Seeing friends regularly (N) |10 1 2 3 |+----------------------------------------------------------------------------------+------------------------------------------+| 6. Having sufficient leisure time and the means to enjoy it |11 1 2 3 |+----------------------------------------------------------------------------------+------------------------------------------+| 7. Having at least one holiday a year |12 1 2 3 |+----------------------------------------------------------------------------------+------------------------------------------+| 8. Being on friendly terms with the neighbours |13 1 2 3 |+----------------------------------------------------------------------------------+------------------------------------------+| 9. Being able to go out with friends or family |14 1 2 3 |+----------------------------------------------------------------------------------+------------------------------------------+| 10. Having sufficient accommodation for everyone to have their own space |15 1 2 3 |+----------------------------------------------------------------------------------+------------------------------------------+| 11. Being able to be useful to others |16 1 2 3 |+----------------------------------------------------------------------------------+------------------------------------------+| 12. Feeling recognised by society |17 1 2 3 |+----------------------------------------------------------------------------------+------------------------------------------+| 13. Having a successful career (N) |18 1 2 3 |+----------------------------------------------------------------------------------+------------------------------------------+| 14. Participating in associations, unions or parties (M) |19 1 2 3 |+----------------------------------------------------------------------------------+------------------------------------------+ EB40 - Q.83 - TREND MODIFIED
Q.3. In your opinion, what would be the very lowest net weekly income that your household would have to have in order to make ends meet, given the present circumstances and composition of your household? Net income is after tax and social security contributions have been deducted. (ONE ANSWER ONLY) (INT: IF "DK", CODE '000000000' - IF "REFUSAL", CODE '999999999') +--+--+--+--+--+--+--+--+--+ 20 | | | | | | | | | | | | | | | | | | | | +--+--+--+--+--+--+--+--+--+ EB56.1 - NEW
Q.4. Is the total net weekly income of your household higher, lower or more or less the same as this figure? Higher.................................................................................. 21 1 Lower................................................................................... 2 More or less the same................................................................... 3 DK...................................................................................... 4 Refusal................................................................................. 5 EB5 - Q.153 - TREND MODIFIED
Q.5. How well do you get by with your household's income? (SHOW CARD - READ OUT - ONE ANSWER ONLY) With great difficulty................................................................... 22 1 GO TO Q.6 With difficulty......................................................................... 2 GO TO Q.6 Easily.................................................................................. 3 GO TO Q.9 Very easily............................................................................. 4 GO TO Q.9 DK...................................................................................... 5 GO TO Q.9 Refusal................................................................................. 6 GO TO Q.9 EB40 - D.29.g - TREND MODIFIED

SOCIAL PRECARITY AND SOCIAL INTEGRATIONTHE EUROPEAN OPINION RESEARCH GROUP EEIG
EUROBAROMETER 56.1. – OCTOBER 2001 Page 136
IF "WITH DIFFICULTY", CODE 1 OR 2 IN Q.5, OTHERS GO TO Q.9 Q.6. How long has your household been in this financial situation? (ONE ANSWER ONLY) Less than a year........................................................................ 23 1 1 year.................................................................................. 2 From 2 to 3 years....................................................................... 3 From 4 to 5 years....................................................................... 4 From 6 à 10 years....................................................................... 5 Over 10 years........................................................................... 6 DK...................................................................................... 7 Refusal................................................................................. 8 EB56.1 - NEW
Q.7. Have any of the following events had an effect on your household's current financial situation? (SHOW CARD - READ OUT - MULTIPLE ANSWERS POSSIBLE) I have a low paid job................................................................... 24 1, I lost my job........................................................................... 2, My partner lost his(her) job............................................................ 3, I broke up with the person with whom I was living....................................... 4, I had a child........................................................................... 5, My child(ren) started school............................................................ 6, I had health problems................................................................... 7, I retired............................................................................... 8, My partner retired...................................................................... 9, No, none of these (SPONTANEOUS)......................................................... 10, DK...................................................................................... 11, Refusal................................................................................. 12, EB56.1 - NEW
Q.8. When do you think your household will be out of this difficult financial situation? (SHOW CARD - READ OUT - ONE ANSWER ONLY) In less than a year..................................................................... 25 1 In 1 year............................................................................... 2 In 2 or 3 years......................................................................... 3 In 4 or 5 years......................................................................... 4 In 6 to 9 years......................................................................... 5 In 10 years or more..................................................................... 6 Never (SPONTANEOUS)..................................................................... 7 DK...................................................................................... 8 Refusal................................................................................. 9 EB56.1 - NEW

SOCIAL PRECARITY AND SOCIAL INTEGRATIONTHE EUROPEAN OPINION RESEARCH GROUP EEIG
EUROBAROMETER 56.1. – OCTOBER 2001 Page 137
ASK ALL
Q.9. In the last twelve months, have you, or any member of your household, had problems in...? (SHOW CARD WITH SCALE) +----------------------------------------------------------+-------------+-------------+-------------+-------------+----------+| READ OUT | NO | SOME | A LOT OF | ENORMOUS | || | PROBLEM | PROBLEMS | PROBLEMS | PROBLEMS | DK |+----------------------------------------------------------+-------------+-------------+-------------+-------------+----------+| 1. paying the rent or mortgage |26 1 2 3 4 5 |+----------------------------------------------------------+------------------------------------------------------------------+| | || 2. paying the water, gas, electricity or heating bills |27 1 2 3 4 5 |+----------------------------------------------------------+------------------------------------------------------------------+| 3. paying for food |28 1 2 3 4 5 |+----------------------------------------------------------+------------------------------------------------------------------+| 4. repaying loans (other than for housing) |29 1 2 3 4 5 |+----------------------------------------------------------+------------------------------------------------------------------+ EB40 - D.29.f - TREND
Q.10. In the area where you live, are there people who live in one or the other of the following situations? (SHOW CARD - READ OUT - MULTIPLE ANSWERS POSSIBLE) Situation of extreme poverty............................................................ 30 1, GO TO Q.11 Situation of poverty.................................................................... 2, GO TO Q.11 At risk of falling into poverty......................................................... 3, GO TO Q.13 Nobody in these situations.............................................................. 4, GO TO Q.13 DK...................................................................................... 5, GO TO Q.13 EB40 - Q.68.a - TREND
IF "SITUATION OF POVERTY", CODE 1 OR 2 IN Q.10, OTHERS GO TO Q.13 Q.11. Do you ever happen to see for yourself the conditions in which these people really live? (IF YES) Do you see these conditions often, sometimes or rarely? Yes, often.............................................................................. 31 1 GO TO Q.12 Yes, sometimes.......................................................................... 2 GO TO Q.12 Yes, rarely............................................................................. 3 GO TO Q.12 No, never............................................................................... 4 GO TO Q.13 DK...................................................................................... 5 GO TO Q.13 EB40 - Q.70 - TREND MODIFIED
IF "YES", CODE 1, 2 OR 3 IN Q.11 Q.12. Would you say that, for the most part, these people...? (SHOW CARD - READ OUT - ONE ANSWER ONLY) have always been in their present situation............................................. 32 1 have fallen into it after knowing something better...................................... 2 DK...................................................................................... 3 Refusal (N)............................................................................. 4 EB40 - Q.71 - TREND MODIFIED
ASK ALL Q.13. Why in your opinion are there people who live in need? Here are four opinions: which is closest to yours? (SHOW CARD - READ OUT - ONE ANSWER ONLY) Because they have been unlucky.......................................................... 33 1 Because of laziness and lack of willpower............................................... 2 Because there is much injustice in our society.......................................... 3 It's an inevitable part of modern progress.............................................. 4 None of these (SPONTANEOUS)............................................................. 5 DK...................................................................................... 6 EB40 - Q.74 - TREND

SOCIAL PRECARITY AND SOCIAL INTEGRATIONTHE EUROPEAN OPINION RESEARCH GROUP EEIG
EUROBAROMETER 56.1. – OCTOBER 2001 Page 138
Q.14. Here are some reasons, which might explain why people are socially excluded. Which three do you think are the most common? (SHOW CARD - READ OUT - MAXIMUM 3 ANSWERS) Social welfare cuts..................................................................... 34 1, Lack of concern amongst neighbours...................................................... 2, Sickness................................................................................ 3, Family break-ups........................................................................ 4, Their parents were poor................................................................. 5, Losing community spirit in our society.................................................. 6, Alcoholism.............................................................................. 7, Long-term unemployment.................................................................. 8, They live in a poor area................................................................ 9, Drug abuse.............................................................................. 10, They don't plan for the future.......................................................... 11, Lack of education....................................................................... 12, They are lazy........................................................................... 13, They have too many children............................................................. 14, They are immigrants..................................................................... 15, They have chosen to be like this........................................................ 16, DK...................................................................................... 17, EB40 - Q.72 - TREND
Q.15. Which of these statements comes closest to your view? (SHOW CARD - READ OUT - ONE ANSWER ONLY) Anyone is at risk of poverty at some point in their lives............................... 35 1 The risk of poverty is confined to certain groups of people............................. 2 None of these two statements (SPONTANEOUS).............................................. 3 DK...................................................................................... 4 EB56.1 - NEW
Q.16. In the last five years, have you ever been unemployed, or not? Yes..................................................................................... 36 1 No...................................................................................... 2 (IF YES) How many times have you been unemployed in the last five years? (INT.: IF "NEVER", CODE '00' - IF "REFUSAL", CODE '98' - IF "DK", CODE '99') +--+--+ 37 | | | | | | +--+--+ EB40 - Q.15.c - TREND
IF "YES", CODE 1 IN Q.16 Q.17. For how long in total have you been unemployed in the last five years? Less than a week........................................................................ 38 1 From a week to less than 3 months....................................................... 2 From 3 months to less than 6 months..................................................... 3 From 6 months to less than 1 year....................................................... 4 From 1 year to less than 2 years........................................................ 5 From 2 years to less than 3 years....................................................... 6 3 years or more......................................................................... 7 DK...................................................................................... 8 Refusal................................................................................. 9 EB40 - Q.15.d - TREND MODIFIED

SOCIAL PRECARITY AND SOCIAL INTEGRATIONTHE EUROPEAN OPINION RESEARCH GROUP EEIG
EUROBAROMETER 56.1. – OCTOBER 2001 Page 139
ASK ALL Q.18. For each of these statements, please tell me if it applies to your situation, or not. +------------------------------------------------------------------------------+----------+----------+----------+-------------+| READ OUT | | | | NOT || | YES | NO | DK | APPLICABLE |+------------------------------------------------------------------------------+----------+----------+----------+-------------+| 1. My partner has a paid job |39 1 2 3 4 |+------------------------------------------------------------------------------+----------------------------------------------+| 2. I have a child at home under five years of age |40 1 2 3 4 |+------------------------------------------------------------------------------+----------------------------------------------+| 3. I have close friends or family who are poor |41 1 2 3 4 |+------------------------------------------------------------------------------+----------------------------------------------+| | || 4. I have close friends or family who are much richer than I am |42 1 2 3 4 |+------------------------------------------------------------------------------+----------------------------------------------+| 5. I talk to my neighbours almost every day |43 1 2 3 4 |+------------------------------------------------------------------------------+----------------------------------------------+| 6. I meet my friends several times a week |44 1 2 3 4 |+------------------------------------------------------------------------------+----------------------------------------------+| | || 7. I meet up with relatives from outside the household several times a week |45 1 2 3 4 |+------------------------------------------------------------------------------+----------------------------------------------+| 8. Over half of my friends are unemployed |46 1 2 3 4 |+------------------------------------------------------------------------------+----------------------------------------------+| 9. Over half of my friends are in paid work |47 1 2 3 4 |+------------------------------------------------------------------------------+----------------------------------------------+| 10. I am a member of a leisure or sports club |48 1 2 3 4 |+------------------------------------------------------------------------------+----------------------------------------------+| 11. I am a member of a voluntary or charitable organisation |49 1 2 3 4 |+------------------------------------------------------------------------------+----------------------------------------------+| 12. I am a member of a political party |50 1 2 3 4 |+------------------------------------------------------------------------------+----------------------------------------------+| 13. I go regularly to church (or to another place of worship) |51 1 2 3 4 |+------------------------------------------------------------------------------+----------------------------------------------+ EB56.1 - NEW Q.19. If you had any of the following problems, is there anyone you could rely on to help you, from outside your own household? +--------------------------------------------------------------------------------------------+----------+----------+----------+| READ OUT | YES | NO | DK |+--------------------------------------------------------------------------------------------+----------+----------+----------+| 1. If you were feeling depressed |52 1 2 3 |+--------------------------------------------------------------------------------------------+--------------------------------+| | || 2. If you needed help finding a job for yourself or a member of your family |53 1 2 3 |+--------------------------------------------------------------------------------------------+--------------------------------+| 3. If you needed to borrow money to pay an urgent bill, like electricity, gas, rent or | || mortgage |54 1 2 3 |+--------------------------------------------------------------------------------------------+--------------------------------+
EB44.3 - Q.86 - TREND Q.20. I am now going to ask you to talk to me about different aspects of your everyday life. For each of them, could you tell me if you think this aspect of your life is very good, fairly good, fairly bad or very bad? (SHOW CARD WITH SCALE - ONE ANSWER ONLY) +----------------------------------------------------------------------+----------+----------+----------+----------+----------+| | | | | | || READ OUT | VERY | FAIRLY | FAIRLY | VERY | || | GOOD | GOOD | BAD | BAD | DK |+----------------------------------------------------------------------+----------+----------+----------+----------+----------+| 1. Your house or flat |55 1 2 3 4 5 |+----------------------------------------------------------------------+------------------------------------------------------+| 2. The area where you live |56 1 2 3 4 5 |+----------------------------------------------------------------------+------------------------------------------------------+| 3. Your income |57 1 2 3 4 5 |+----------------------------------------------------------------------+------------------------------------------------------+| 4. Your standard of living |58 1 2 3 4 5 |+----------------------------------------------------------------------+------------------------------------------------------+| | || 5. Travel facilities for going to work, shopping (M) |59 1 2 3 4 5 |+----------------------------------------------------------------------+------------------------------------------------------+| 6. Your state of health |60 1 2 3 4 5 |+----------------------------------------------------------------------+------------------------------------------------------+| 7. The time you have available to do the things you have to do |61 1 2 3 4 5 |+----------------------------------------------------------------------+------------------------------------------------------+| 8. The medical services in your local area (N) |62 1 2 3 4 5 |+----------------------------------------------------------------------+------------------------------------------------------+| 9. Your social entitlements in case of sickness, invalidity, | || unemployment, old age |63 1 2 3 4 5 |+----------------------------------------------------------------------+------------------------------------------------------+| 10. The consideration shown to you by other people |64 1 2 3 4 5 |+----------------------------------------------------------------------+------------------------------------------------------+| 11. The shopping facilities in your local area (N) |65 1 2 3 4 5 |+----------------------------------------------------------------------+------------------------------------------------------+| 12. The job opportunities in your local area (N) |66 1 2 3 4 5 |+----------------------------------------------------------------------+------------------------------------------------------+| 13. The level of noise where you live (N) |67 1 2 3 4 5 |+----------------------------------------------------------------------+------------------------------------------------------+ EB40 - Q.85 - TREND MODIFIED

SOCIAL PRECARITY AND SOCIAL INTEGRATIONTHE EUROPEAN OPINION RESEARCH GROUP EEIG
EUROBAROMETER 56.1. – OCTOBER 2001 Page 140
Q.21. Do you agree or disagree with the following statements? (SHOW CARD WITH SCALE - ONE ANSWER ONLY) +--------------------------------------------------+------------+----------+-------------+------------+------------+----------+| | | | NEITHER | | | || READ OUT | STRONGLY | | AGREE | | STRONGLY | || | AGREE | AGREE |NOR DISAGREE | DISAGREE | DISAGREE | DK |+--------------------------------------------------+------------+----------+-------------+------------+------------+----------+| 1. I have felt lonely at some time during the | || last two weeks |68 1 2 3 4 5 6 |+--------------------------------------------------+--------------------------------------------------------------------------+| | || 2. I don't feel that the value of what I do is | || recognised by the people I meet |69 1 2 3 4 5 6 |+--------------------------------------------------+--------------------------------------------------------------------------+| 3. It's difficult to have close friends in the | || area in which I live |70 1 2 3 4 5 6 |+--------------------------------------------------+--------------------------------------------------------------------------+| 4. I feel left out of society |71 1 2 3 4 5 6 |+--------------------------------------------------+--------------------------------------------------------------------------+| 5. I feel left out of my family |72 1 2 3 4 5 6 |+--------------------------------------------------+--------------------------------------------------------------------------+| 6. I don't feel that I have the chance to play a | || useful part in society |73 1 2 3 4 5 6 |+--------------------------------------------------+--------------------------------------------------------------------------+| | || 7. Some people look down on me because of my | || income or job situation |74 1 2 3 4 5 6 |+--------------------------------------------------+--------------------------------------------------------------------------+| 8. I feel that there is a risk that I could fall | || into poverty |75 1 2 3 4 5 6 |+--------------------------------------------------+--------------------------------------------------------------------------+| 9. The area in which I live has buildings in a | || bad state of repair |76 1 2 3 4 5 6 |+--------------------------------------------------+--------------------------------------------------------------------------+| 10. There is a lot of unemployment in the area | || in which I live |77 1 2 3 4 5 6 |+--------------------------------------------------+--------------------------------------------------------------------------+| 11. There are problems of drug abuse in the area | || in which I live |78 1 2 3 4 5 6 |+--------------------------------------------------+--------------------------------------------------------------------------+| 12. The area in which I live has a lot of | || vandalism and theft |79 1 2 3 4 5 6 |+--------------------------------------------------+--------------------------------------------------------------------------+| 13. There is a lot of violence in the area in | || which I live |80 1 2 3 4 5 6 |+--------------------------------------------------+--------------------------------------------------------------------------+| 14. The area in which I live has not got a good | || reputation |81 1 2 3 4 5 6 |+--------------------------------------------------+--------------------------------------------------------------------------+ EB56.1 - NEW

SOCIAL PRECARITY AND SOCIAL INTEGRATIONTHE EUROPEAN OPINION RESEARCH GROUP EEIG
EUROBAROMETER 56.1. – OCTOBER 2001 Page 141
D.15. a) What is your current occupation? b) (IF NOT DOING ANY PAID WORK CURRENTLY - CODES 1 TO 4 IN D.15.a) Did you do any paid work in the past? What was your last occupation? +---------------------------------------------------------------------------------------------+---------------+---------------+| | a) CURRENT | b) LAST || | OCCUPATION | OCCUPATION |+---------------------------------------------------------------------------------------------+---------------+---------------+| NOT WORKING | |---------------|| Responsible for ordinary shopping and looking after the home, or without any | |---------------|| current occupation, not working |82 1 |---------------|+---------------------------------------------------------------------------------------------+ +---------------+| Student | 2 |---------------|+---------------------------------------------------------------------------------------------+ +---------------+| Unemployed or temporarily not working | 3 |---------------|+---------------------------------------------------------------------------------------------+ +---------------+| Retired or unable to work through illness | 4 |---------------|+---------------------------------------------------------------------------------------------+ +---------------+| SELF EMPLOYED | | || Farmer | 5 |83 1 |+---------------------------------------------------------------------------------------------+ | || Fisherman | 6 | 2 |+---------------------------------------------------------------------------------------------+ | || Professional (lawyer, medical practitioner, accountant, architect, etc.) | 7 | 3 |+---------------------------------------------------------------------------------------------+ | || Owner of a shop, craftsmen, other self-employed person | 8 | 4 |+---------------------------------------------------------------------------------------------+ | || Business proprietors, owner (full or partner) of a company | 9 | 5 |+---------------------------------------------------------------------------------------------+ | || EMPLOYED | | || Employed professional (employed doctor, lawyer, accountant, architect, etc.) | 10 | 6 |+---------------------------------------------------------------------------------------------+ | || General management, director or top management (managing directors, | | || director general, other director) | 11 | 7 |+---------------------------------------------------------------------------------------------+ | || Middle management, other management (department head, junior manager, | | || teacher, technician) | 12 | 8 |+---------------------------------------------------------------------------------------------+ | || Employed position, working mainly at a desk | 13 | 9 |+---------------------------------------------------------------------------------------------+ | || | | || Employed position, not at a desk but travelling (salesmen, driver, etc.) | 14 | 10 |+---------------------------------------------------------------------------------------------+ | || Employed position, not at a desk, but in a service job (hospital, restaurant, | | || police, fireman, etc.) | 15 | 11 |+---------------------------------------------------------------------------------------------+ | || Supervisor | 16 | 12 |+---------------------------------------------------------------------------------------------+ | || Skilled manual worker | 17 | 13 |+---------------------------------------------------------------------------------------------+ | || Other (unskilled) manual worker, servant | 18 | 14 |+---------------------------------------------------------------------------------------------+---------------+ || NEVER DID ANY PAID WORK |---------------| 15 |+---------------------------------------------------------------------------------------------+---------------+---------------+ EB55.2 - D.15 - DEMO TREND
IF "UNEMPLOYED" OR "NON-ACTIVE", CODE 1, 2, 3 OR 4 IN D.15.a Q.22. Which of these statements comes closest to your personal position? (SHOW CARD - READ OUT - ONE ANSWER ONLY) I would like a full-time paid job and I am actively looking for one..................... 84 1 I would like a part-time paid job and I am actively looking for one..................... 2 I would like a paid job, but I am not actively looking for one at the moment............ 3 I do not want a paid job................................................................ 4 DK...................................................................................... 5 EB56.1 - NEW

SOCIAL PRECARITY AND SOCIAL INTEGRATIONTHE EUROPEAN OPINION RESEARCH GROUP EEIG
EUROBAROMETER 56.1. – OCTOBER 2001 Page 142
IF "EMPLOYED" OR "SELF-EMPLOYED", CODE 5 TO 18 IN D.15.a, OTHERS GO TO Q.44 Q.23. For you personally, how important do you think each of the following is in choosing a job? Would you say it is very important, important, neither important nor unimportant, not important or not important at all? (SHOW CARD WITH SCALE - ONE ANSWER ONLY) +---------------------------------------------+------------+------------+--------------+------------+------------+------------+| | | | NEITHER | | NOT | || READ OUT | VERY | |IMPORTANT NOR | NOT | IMPORTANT | || | IMPORTANT | IMPORTANT | UNIMPORTANT | IMPORTANT | AT ALL | DK |+---------------------------------------------+------------+------------+--------------+------------+------------+------------+| | || 1. A job that leaves a lot of leisure time |85 1 2 3 4 5 6 |+---------------------------------------------+-------------------------------------------------------------------------------+| 2. A secure job |86 1 2 3 4 5 6 |+---------------------------------------------+-------------------------------------------------------------------------------+| 3. A high income |87 1 2 3 4 5 6 |+---------------------------------------------+-------------------------------------------------------------------------------+| 4. A job that allows you to work | || independently |88 1 2 3 4 5 6 |+---------------------------------------------+-------------------------------------------------------------------------------+| | || 5. Friendly people to work with |89 1 2 3 4 5 6 |+---------------------------------------------+-------------------------------------------------------------------------------+| 6. A job that gives good promotion | || opportunities |90 1 2 3 4 5 6 |+---------------------------------------------+-------------------------------------------------------------------------------+| 7. A job that enables you to use your own | || initiative |91 1 2 3 4 5 6 |+---------------------------------------------+-------------------------------------------------------------------------------+| 8. A job with flexible working hours |92 1 2 3 4 5 6 |+---------------------------------------------+-------------------------------------------------------------------------------+| 9. A job that gives you the opportunity to | || use your abilities |93 1 2 3 4 5 6 |+---------------------------------------------+-------------------------------------------------------------------------------+| | || 10. Convenient hours of work |94 1 2 3 4 5 6 |+---------------------------------------------+-------------------------------------------------------------------------------+| 11. Good training provision |95 1 2 3 4 5 6 |+---------------------------------------------+-------------------------------------------------------------------------------+| | || 12. A job that allows you to work all or a | || lot of the time at home |96 1 2 3 4 5 6 |+---------------------------------------------+-------------------------------------------------------------------------------+| 13. A job with a lot of variety (N) |97 1 2 3 4 5 6 |+---------------------------------------------+-------------------------------------------------------------------------------+| | || 14. A job with an easy workload (N) |98 1 2 3 4 5 6 |+---------------------------------------------+-------------------------------------------------------------------------------+ EB44.3 - Q.77 - TREND MODIFIED
Q.24. What is the full title of your main job? (INT.: PROBE TO GET CLEAR JOB TITLE - ISCO CODING - OFFICE CODING) _______________________________________________________________________________________________________________ _______________________________________________________________________________________________________________ _______________________________________________________________________________________________________________ +--+--+ 99 | | | | | | +--+--+ EB44.3 - Q.10 - TREND
Q.25. Which of these categories best describes your job? (SHOW CARD - READ OUT - ONE ANSWER ONLY) Self-employed with employees............................................................ 100 1 Self-employed without employees......................................................... 2 Manager(ess)............................................................................ 3 Foreman or supervisor................................................................... 4 Other employee, permanent job........................................................... 5 Other employee, seasonal, temporary or casual job....................................... 6 Other employee, under contract or for fixed time period................................. 7 Other (SPONTANEOUS)..................................................................... 8 DK...................................................................................... 9 EB44.3 - Q.11 - TREND

SOCIAL PRECARITY AND SOCIAL INTEGRATIONTHE EUROPEAN OPINION RESEARCH GROUP EEIG
EUROBAROMETER 56.1. – OCTOBER 2001 Page 143
Q.26. How many people are employed at your workplace? (SHOW CARD - READ OUT - ONE ANSWER ONLY) I work entirely on my own............................................................... 101 1 Less than 10 people..................................................................... 2 From 10 to 24 people.................................................................... 3 From 25 to 49 people.................................................................... 4 From 50 to 99 people.................................................................... 5 From 100 to 499 people.................................................................. 6 500 people or more...................................................................... 7 DK...................................................................................... 8 EB44.3 - Q.13 - TREND
Q.27. What does the firm or organization that you currently work for actually make or do? (INT.: PROBE TO GET CLEAR INFORMATION - NACE CODING - OFFICE CODING) _______________________________________________________________________________________________________________ _______________________________________________________________________________________________________________ _______________________________________________________________________________________________________________ +--+--+ 102 | | | | | | +--+--+ EB44.3 - Q.14 - TREND
Q.28. How long have you been continuously employed by this employer/continuously self-employed? (INT.: IF LESS THAN A YEAR, CODE '00' FOR NUMBER OF YEARS AND FILL IN ONLY NUMBER OF MONTHS - IF "REFUSAL", CODE '98' - IF "DK", CODE '99') Number of years: +--+--+ 103 | | | | | | +--+--+ Number of months: +--+--+ 104 | | | | | | +--+--+ EB44.3 - Q.15 - TREND
Q.29. How many hours do you usually work a week in your job, including overtime? Please do not include meal breaks. If it varies, take the average over the last 4 weeks. (INT.: IF "REFUSAL", CODE '998' - IF "DK": CODE '999') Number of hours: +--+--+--+ 105 | | | | | | | | +--+--+--+ EB44.3 - Q.23.a - TREND
Q.30. a) If you were to get enough money to live as comfortably as you would like for the rest of your life, would you continue to work, not necessarily in your present job, or would you stop working? Continue to work........................................................................ 106 1 Stop working............................................................................ 2 DK...................................................................................... 3 EB44.3 - Q.40.a - TREND MODIFIED

SOCIAL PRECARITY AND SOCIAL INTEGRATIONTHE EUROPEAN OPINION RESEARCH GROUP EEIG
EUROBAROMETER 56.1. – OCTOBER 2001 Page 144
Q.30. b) If you were completely free to choose, how many hours a week would you like to work overall? (INT.: IF "REFUSAL", CODE '998' - IF "DK", CODE '999') Number of hours: +--+--+--+ 107 | | | | | | | | +--+--+--+ EB44.3 - Q.40.b - TREND MODIFIED
Q.31. For each of the following statements, please tell me if it applies to you, or not? +----------------------------------------------------------------------------------+------------+------------------+----------+| READ OUT | APPLIES | DOES NOT APPLY | DK |+----------------------------------------------------------------------------------+------------+------------------+----------+| 1. My job is a part-time job (N) |108 1 2 3 |+----------------------------------------------------------------------------------+------------------------------------------+| 2. I work for a temporary employment agency (N) |109 1 2 3 |+----------------------------------------------------------------------------------+------------------------------------------+| | || 3. The organisation I work for is in the private rather than the public sector |110 1 2 3 |+----------------------------------------------------------------------------------+------------------------------------------+| | || 4. I can use almost all of my experience, skills and abilities in my present job |111 1 2 3 |+----------------------------------------------------------------------------------+------------------------------------------+| | || 5. The total number of hours I work varies from week to week |112 1 2 3 |+----------------------------------------------------------------------------------+------------------------------------------+| | || 6. My job involves the use of computerised or automated equipment |113 1 2 3 |+----------------------------------------------------------------------------------+------------------------------------------+| 7. I work under a great deal of pressure |114 1 2 3 |+----------------------------------------------------------------------------------+------------------------------------------+| 8. I work with other employees in a group or team that has responsibility for | || organising how the work is done (N) |115 1 2 3 |+----------------------------------------------------------------------------------+------------------------------------------+| 9. I have had an injury at work in the last five years (N) |116 1 2 3 |+----------------------------------------------------------------------------------+------------------------------------------+| 10. I have been promoted while I have been with my current employer |117 1 2 3 |+----------------------------------------------------------------------------------+------------------------------------------+| | || 11. My job is funded as part of a government training or job creation scheme (N) |118 1 2 3 |+----------------------------------------------------------------------------------+------------------------------------------+| 12. I am a member of a trade union (N) |119 1 2 3 |+----------------------------------------------------------------------------------+------------------------------------------+| 13. The number of people employed in my organisation has been reduced over the | || last three years (N) |120 1 2 3 |+----------------------------------------------------------------------------------+------------------------------------------+
EB44.3 - Q.19 - TREND MODIFIED
Q.32. Here is a list of statements about your current job. For each of them, please tell me if it is very true, quite true a little true or not at all true? (SHOW CARD WITH SCALE) +--------------------------------------------------------------------+----------+----------+----------+----------+------------+| READ OUT | VERY | QUITE | A LITTLE | NOT AT | || | TRUE | TRUE | TRUE | ALL TRUE | DK |+--------------------------------------------------------------------+----------+----------+----------+----------+------------+| 1. I have a lot of say over what happens at work (M) |121 1 2 3 4 5 |+--------------------------------------------------------------------+--------------------------------------------------------+| 2. My job allows me to take part in making decisions that affect | || my work |122 1 2 3 4 5 |+--------------------------------------------------------------------+--------------------------------------------------------+| 3. There is a lot of variety in my work |123 1 2 3 4 5 |+--------------------------------------------------------------------+--------------------------------------------------------+| | || 4. My job requires that I keep learning new things |124 1 2 3 4 5 |+--------------------------------------------------------------------+--------------------------------------------------------+| 5. My job is interesting |125 1 2 3 4 5 |+--------------------------------------------------------------------+--------------------------------------------------------+| 6. My job is secure |126 1 2 3 4 5 |+--------------------------------------------------------------------+--------------------------------------------------------+| 7. I get a lot of support from management when there is pressure | || at work (N) |127 1 2 3 4 5 |+--------------------------------------------------------------------+--------------------------------------------------------+| 8. I have good friends at work (N) |128 1 2 3 4 5 |+--------------------------------------------------------------------+--------------------------------------------------------+| 9. My organisation is facing financial difficulties at the moment | || (N) |129 1 2 3 4 5 |+--------------------------------------------------------------------+--------------------------------------------------------+ EB44.3 - Q.20 - TREND MODIFIED

SOCIAL PRECARITY AND SOCIAL INTEGRATIONTHE EUROPEAN OPINION RESEARCH GROUP EEIG
EUROBAROMETER 56.1. – OCTOBER 2001 Page 145
Q.33. How much do you agree or disagree with each of the following statements describing your job? Do you strongly agree, agree, neither agree nor disagree, disagree or strongly disagree? (SHOW CARD WITH SCALE) +----------------------------------------------+------------+------------+---------------+------------+------------+----------+| READ OUT | STRONGLY | | NEITHER AGREE | | STRONGLY | || | AGREE | AGREE | NOR DISAGREE | DISAGREE | DISAGREE | DK |+----------------------------------------------+------------+------------+---------------+------------+------------+----------+| | || 1. My job requires that I work very hard |130 1 2 3 4 5 6 |+----------------------------------------------+------------------------------------------------------------------------------+| | || 2. I never seem to have enough time to get | || everything done in my job |131 1 2 3 4 5 6 |+----------------------------------------------+------------------------------------------------------------------------------+| | || 3. I often have to work extra time, over and | || above the formal hours of my job, to get | || through the work or to help out |132 1 2 3 4 5 6 |+----------------------------------------------+------------------------------------------------------------------------------+| 4. I work almost all the time at very high | || speed (N) |133 1 2 3 4 5 6 |+----------------------------------------------+------------------------------------------------------------------------------+| 5. I work almost all the time to tight | || deadlines (N) |134 1 2 3 4 5 6 |+----------------------------------------------+------------------------------------------------------------------------------+| | || 6. Most of the time my work involves short | || repetitive hand or arm movements (N) |135 1 2 3 4 5 6 |+----------------------------------------------+------------------------------------------------------------------------------+| 7. I have a great deal of influence in | || deciding what tasks I do (N) |136 1 2 3 4 5 6 |+----------------------------------------------+------------------------------------------------------------------------------+| 8. I have a great deal of influence in | || deciding how to do my tasks (N) |137 1 2 3 4 5 6 |+----------------------------------------------+------------------------------------------------------------------------------+| 9. I am willing to work harder than I have | || to in order to help this organisation | || succeed (N) |138 1 2 3 4 5 6 |+----------------------------------------------+------------------------------------------------------------------------------+| 10. I find that my values and this | || organisation's values are very similar (N) |139 1 2 3 4 5 6 |+----------------------------------------------+------------------------------------------------------------------------------+| 11. I am proud to be working for this | || organisation (N) |140 1 2 3 4 5 6 |+----------------------------------------------+------------------------------------------------------------------------------+| 12. I would turn down another job elsewhere | || with more pay in order to stay with this | || organisation (N) |141 1 2 3 4 5 6 |+----------------------------------------------+------------------------------------------------------------------------------+| | || 13. I am likely to get a better job in this | || organisation in the next three years (N) |142 1 2 3 4 5 6 |+----------------------------------------------+------------------------------------------------------------------------------+| | || 14. I am likely to get a better job with | || another employer in the next three years (N) |143 1 2 3 4 5 6 |+----------------------------------------------+------------------------------------------------------------------------------+ EB44.3 - Q.21 - TREND MODIFIED
Q.34. I would like you to compare your current job with what you were doing five years ago (even if you were in the same job). For each of the following things would you say there has been a significant increase compared to five years ago, a significant decrease or little or no change? (INT.: IF NOT IN WORK 5 YEARS AGO, GO BACK TO WHEN STARTED WORKING IN PAST 5 YEARS) +---------------------------------------------------------------------+--------------+--------------+--------------+----------+| READ OUT | SIGNIFICANT | SIGNIFICANT | LITTLE/ NO | || | INCREASE | DECREASE | CHANGE | DK |+---------------------------------------------------------------------+--------------+--------------+--------------+----------+| 1. Job security |144 1 2 3 4 |+---------------------------------------------------------------------+-------------------------------------------------------+| 2. The level of skill you use in your job |145 1 2 3 4 |+---------------------------------------------------------------------+-------------------------------------------------------+| 3. The variety of tasks you perform |146 1 2 3 4 |+---------------------------------------------------------------------+-------------------------------------------------------+| 4. The effort you have to put into your job |147 1 2 3 4 |+---------------------------------------------------------------------+-------------------------------------------------------+| 5. The responsibility involved in your job |148 1 2 3 4 |+---------------------------------------------------------------------+-------------------------------------------------------+| 6. The stress involved in your job |149 1 2 3 4 |+---------------------------------------------------------------------+-------------------------------------------------------+| 7. The provision of training |150 1 2 3 4 |+---------------------------------------------------------------------+-------------------------------------------------------+| 8. Tightness of supervision over your job |151 1 2 3 4 |+---------------------------------------------------------------------+-------------------------------------------------------+| 9. Your job satisfaction (N) |152 1 2 3 4 |+---------------------------------------------------------------------+-------------------------------------------------------+ EB44.3 - Q.22 - TREND MODIFIED

SOCIAL PRECARITY AND SOCIAL INTEGRATIONTHE EUROPEAN OPINION RESEARCH GROUP EEIG
EUROBAROMETER 56.1. – OCTOBER 2001 Page 146
Q.35. Suppose there was to be some decision made at your place of work that changed the way you do your job. Do you think that you personally would have any say in the decision about the change, or not? (IF YES) How much influence over the decision do you think that you personally would have? A great deal, quite a lot or just a little? No...................................................................................... 153 1 Yes, a great deal of influence.......................................................... 2 Yes, quite a lot of influence........................................................... 3 Yes, just a little influence............................................................ 4 DK...................................................................................... 5 EB44.3 - Q.26 - TREND
Q.36. Do you think that you should have more say in the decisions that affect your work, or are you satisfied with the way things are? Should have more say.................................................................... 154 1 Satisfied the way things are............................................................ 2 DK...................................................................................... 3 EB44.3 - Q.27 - TREND
Q.37. Did you receive any education or training in the last five years, which was paid for by your employer or former employer? (IF YES) How long in total? No...................................................................................... 155 1 Yes, a few hours - less than one day.................................................... 2 Yes, 1 or 2 days........................................................................ 3 Yes, from 3 to 5 days................................................................... 4 Yes, from 6 days to 2 weeks............................................................. 5 Yes, from 3 to 4 weeks.................................................................. 6 Yes, from 1 to 2 months................................................................. 7 Yes, from 3 to 6 months................................................................. 8 Yes, from 7 months up to 1 year......................................................... 9 Yes, more than one year................................................................. 10 DK...................................................................................... 11 EB44.3 - Q.79 - TREND
Q.38. How long do you think it would be before a person doing your sort of job would be dismissed in your organisation if they persistently...? (SHOW CARD WITH SCALE) +--------------------------------------------+----------+----------+----------+----------+--------------+----------+----------+| READ OUT | WITHIN | WITHIN | WITHIN | WITHIN | WITHIN MORE | | || | A WEEK | A MONTH | 6 MONTHS | A YEAR | THAN A YEAR | NEVER | DK |+--------------------------------------------+----------+----------+----------+----------+--------------+----------+----------+| 1. arrived late |156 1 2 3 4 5 6 7 |+--------------------------------------------+--------------------------------------------------------------------------------+| 2. did not work hard |157 1 2 3 4 5 6 7 |+--------------------------------------------+--------------------------------------------------------------------------------+ EB44.3 - Q.32 - TREND
Q.39. In general, how would you describe relations at your workplace between management and employees? Would you say they are very good, quite good, neither good nor bad, quite bad or very bad? Very good............................................................................... 158 1 Quite good.............................................................................. 2 Neither good nor bad.................................................................... 3 Quite bad............................................................................... 4 Very bad................................................................................ 5 DK...................................................................................... 6 EB44.3 - Q.34 - TREND

SOCIAL PRECARITY AND SOCIAL INTEGRATIONTHE EUROPEAN OPINION RESEARCH GROUP EEIG
EUROBAROMETER 56.1. – OCTOBER 2001 Page 147
Q.40. a) I am going to read out a list of various aspects of jobs. Please choose between the two ends of this scale. If you are completely dissatisfied with that particular aspect of your present job, you give a score of 1. If you are completely satisfied with that particular aspect of your present job, you give a score of 7. The scores between 1 and 7 allow you to say how close to either side you are. (SHOW CARD WITH SCALE) +-------------------------------------------------------------------+-------------+-----+-----+-----+-----+-----+-------------+| | 1 | | | | | | 7 || READ OUT | COMPLETELY | | | | | | COMPLETELY || |DISSATISFIED | 2 | 3 | 4 | 5 | 6 | SATISFIED |+-------------------------------------------------------------------+-------------+-----+-----+-----+-----+-----+-------------+| 1. Your pay |159 1 7 |+-------------------------------------------------------------------+---------------------------------------------------------+| 2. The opportunities to use your abilities |160 1 7 |+-------------------------------------------------------------------+---------------------------------------------------------+| 3. Being able to use your own initiative |161 1 7 |+-------------------------------------------------------------------+---------------------------------------------------------+| 4. The chance to develop yourself (N) |162 1 7 |+-------------------------------------------------------------------+---------------------------------------------------------+| 5. The scope for innovation and creativity (N) |163 1 7 |+-------------------------------------------------------------------+---------------------------------------------------------+| 6. The hours you work |164 1 7 |+-------------------------------------------------------------------+---------------------------------------------------------+| 7. The amount of work |165 1 7 |+-------------------------------------------------------------------+---------------------------------------------------------+| 8. The variety in the work |166 1 7 |+-------------------------------------------------------------------+---------------------------------------------------------+| 9. The possibility of achieving your work targets (N) |167 1 7 |+-------------------------------------------------------------------+---------------------------------------------------------+| 10. Your job security |168 1 7 |+-------------------------------------------------------------------+---------------------------------------------------------+| 11. The relations with your supervisor or manager |169 1 7 |+-------------------------------------------------------------------+---------------------------------------------------------+| 12. Your promotion prospects |170 1 7 |+-------------------------------------------------------------------+---------------------------------------------------------+| 13. The training provided |171 1 7 |+-------------------------------------------------------------------+---------------------------------------------------------+| | || 14. The ability to contribute something useful to society (N) |172 1 7 |+-------------------------------------------------------------------+---------------------------------------------------------+ EB44.3 - Q.36.a - TREND MODIFIED
Q.40. b) All in all, how satisfied would you say you are with your job? (SHOW SAME CARD) +-------------------------------------------------------------------+-------------+-----+-----+-----+-----+-----+-------------+| | 1 | | | | | | 7 || READ OUT | COMPLETELY | | | | | | COMPLETELY || |DISSATISFIED | 2 | 3 | 4 | 5 | 6 | SATISFIED |+-------------------------------------------------------------------+-------------+-----+-----+-----+-----+-----+-------------+| Your job |173 1 7 |+-------------------------------------------------------------------+---------------------------------------------------------+ EB44.3 - Q.36.b - TREND

SOCIAL PRECARITY AND SOCIAL INTEGRATIONTHE EUROPEAN OPINION RESEARCH GROUP EEIG
EUROBAROMETER 56.1. – OCTOBER 2001 Page 148
Q.41. How often do you...? (SHOW CARD WITH SCALE) +-----------------------------------------+----------+----------+------------+-----------+----------+----------+--------------+| READ OUT | | | | HARDLY | | | NOT || | ALWAYS | OFTEN | SOMETIMES | EVER | NEVER | DK | APPLICABLE |+-----------------------------------------+----------+----------+------------+-----------+----------+----------+--------------+| 1. find your work stressful |174 1 2 3 4 5 6 7 |+-----------------------------------------+-----------------------------------------------------------------------------------+| 2. work in dangerous or unhealthy | || conditions (N) |175 1 2 3 4 5 6 7 |+-----------------------------------------+-----------------------------------------------------------------------------------+| 3. have headaches as a result of work | || (N) |176 1 2 3 4 5 6 7 |+-----------------------------------------+-----------------------------------------------------------------------------------+| 4. have muscular pains as a result of | || work (N) |177 1 2 3 4 5 6 7 |+-----------------------------------------+-----------------------------------------------------------------------------------+| | || 5. get verbally abused for example by | || clients, patients or pupils (N) |178 1 2 3 4 5 6 7 |+-----------------------------------------+-----------------------------------------------------------------------------------+| 6. come home from work exhausted |179 1 2 3 4 5 6 7 |+-----------------------------------------+-----------------------------------------------------------------------------------+| | || 7. keep worrying about job problems | || after you leave work (N) |180 1 2 3 4 5 6 7 |+-----------------------------------------+-----------------------------------------------------------------------------------+| | || 8. find it difficult to unwind at the | || end of the workday (N) |181 1 2 3 4 5 6 7 |+-----------------------------------------+-----------------------------------------------------------------------------------+| | || 9. find your job prevents you from | || giving the time you want to your | || partner or family |182 1 2 3 4 5 6 7 |+-----------------------------------------+-----------------------------------------------------------------------------------+| | || 10. feel too tired after work to enjoy | || the things you would like to do at home |183 1 2 3 4 5 6 7 |+-----------------------------------------+-----------------------------------------------------------------------------------+| 11. feel too tired after work to go out | || with friends (N) |184 1 2 3 4 5 6 7 |+-----------------------------------------+-----------------------------------------------------------------------------------+| | || 12. find that your partner/family gets | || fed up with the pressure of your job |185 1 2 3 4 5 6 7 |+-----------------------------------------+-----------------------------------------------------------------------------------+ EB44.3 - Q.37 - TREND MODIFIED
Q.42. (IF "EMPLOYED", CODE 10 TO 18 IN D.15.a) How likely or unlikely is it that you will lose you job or decide to leave your employer for some reason over the next 12 months? Would you say it is very likely, quite likely, not very likely or not at all likely? (IF "SELF-EMPLOYED", CODE 5 TO 9 IN D.15.a) How likely or unlikely is it that you will be forced to close or decide to close your business/ top quit your job for some reason over the next 12 months? Would you say it is very likely, quite likely, not very likely or not at all likely? Very likely............................................................................. 186 1 GO TO Q.43 Quite likely............................................................................ 2 GO TO Q.43 Not very likely......................................................................... 3 GO TO Q.44 Not at all likely....................................................................... 4 GO TO Q.44 DK...................................................................................... 5 GO TO Q.44 EB44.3 - Q.38 - TREND
IF "LIKELY", CODE 1 OR 2 IN Q.42 Q.43. Why do you think you may leave you current employer/close your business/quit your job? (SHOW CARD - READ OUT - MULTIPLE ANSWERS POSSIBLE) The organisation/workplace will close down.............................................. 187 1, I will be declared redundant............................................................ 2, I will reach normal retirement age...................................................... 3, My contract of employment will expire................................................... 4, Running my own business is no longer financially worthwhile............................. 5, I will take early retirement............................................................ 6, I will decide to leave and work for another employer.................................... 7, I will decide to leave and work for myself as self-employed............................. 8, I will leave to look after my home/relatives/children................................... 9, Other (SPONTANEOUS)..................................................................... 10 DK...................................................................................... 11 EB44.3 - Q.39 - TREND

SOCIAL PRECARITY AND SOCIAL INTEGRATIONTHE EUROPEAN OPINION RESEARCH GROUP EEIG
EUROBAROMETER 56.1. – OCTOBER 2001 Page 149
ASK ALL Q.44. Please say how much you agree or disagree with each of the following statements? (SHOW CARD WITH SCALE) +----------------------------------------+-------------+-----------+----------------+-------------+-------------+-------------+| READ OUT | STRONGLY | SLIGHTLY | NEITHER AGREE | SLIGHTLY | STRONGLY | || | AGREE | AGREE | NOR DISAGREE | DISAGREE | DISAGREE | DK |+----------------------------------------+-------------+-----------+----------------+-------------+-------------+-------------+| 1. Differences in income in (OUR | || COUNTRY) are too large |188 1 2 3 4 5 6 |+----------------------------------------+------------------------------------------------------------------------------------+| | || 2. In our society, the rich get richer | || and the poor get poorer |189 1 2 3 4 5 6 |+----------------------------------------+------------------------------------------------------------------------------------+| 3. It is the responsibility of the | || government to reduce the differences | || between those with high and low | || incomes |190 1 2 3 4 5 6 |+----------------------------------------+------------------------------------------------------------------------------------+| 4. The government should ensure that | || all children have a decent standard of | || living |191 1 2 3 4 5 6 |+----------------------------------------+------------------------------------------------------------------------------------+| | || 5. The government should spend less on | || benefits for the poor |192 1 2 3 4 5 6 |+----------------------------------------+------------------------------------------------------------------------------------+| 6. The government should provide | || everyone with a guaranteed basic | || income |193 1 2 3 4 5 6 |+----------------------------------------+------------------------------------------------------------------------------------+| | || 7. I would be ready to pay more tax if | || it were definitely used to improve the | || situation of the poor |194 1 2 3 4 5 6 |+----------------------------------------+------------------------------------------------------------------------------------+| 8. The government should provide | || decent housing for all who cannot | || afford it |195 1 2 3 4 5 6 |+----------------------------------------+------------------------------------------------------------------------------------+| | || 9. The government should provide a job | || for everyone who wants one |196 1 2 3 4 5 6 |+----------------------------------------+------------------------------------------------------------------------------------+| 10. The government should provide a | || decent standard of living for the | || unemployed |197 1 2 3 4 5 6 |+----------------------------------------+------------------------------------------------------------------------------------+| | || 11. The unemployed should be forced to | || take a job quickly, even if it is not | || as good as their previous job |198 1 2 3 4 5 6 |+----------------------------------------+------------------------------------------------------------------------------------+| | || 12. The unemployed should be given the | || time and opportunity to improve their | || education and skills |199 1 2 3 4 5 6 |+----------------------------------------+------------------------------------------------------------------------------------+| | || 13. Workers need strong trade unions | || to protect their interests |200 1 2 3 4 5 6 |+----------------------------------------+------------------------------------------------------------------------------------+| | || 14. The fight against poverty and | || social exclusion should be a priority | || objective for the European Union |201 1 2 3 4 5 6 |+----------------------------------------+------------------------------------------------------------------------------------+| | || 15. The government should do more to | || reduce the risk of poverty and social | || exclusion among new immigrants |202 1 2 3 4 5 6 |+----------------------------------------+------------------------------------------------------------------------------------+ EB56.1 - NEW

SOCIAL PRECARITY AND SOCIAL INTEGRATIONTHE EUROPEAN OPINION RESEARCH GROUP EEIG
EUROBAROMETER 56.1. – OCTOBER 2001 Page 150
Q.45. Would you say that you have not at all, no more than usual, rather more than usual, much more than usual...? (SHOW CARD WITH SCALE - ONE ANSWER ONLY) +------------------------------------------------------------+----------+-------------+------------+---------------+----------+| READ OUT | NOT | NO MORE |RATHER MORE | MUCH MORE | || | AT ALL | THAN USUAL | THAN USUAL | THAN USUAL | DK |+------------------------------------------------------------+----------+-------------+------------+---------------+----------+| 1. lost much sleep over worry |203 1 2 3 4 5 |+------------------------------------------------------------+----------------------------------------------------------------+| 2. been feeling unhappy and depressed |204 1 2 3 4 5 |+------------------------------------------------------------+----------------------------------------------------------------+| 3. been losing confidence in yourself |205 1 2 3 4 5 |+------------------------------------------------------------+----------------------------------------------------------------+| | || 4. been feeling you could not overcome your difficulties |206 1 2 3 4 5 |+------------------------------------------------------------+----------------------------------------------------------------+| 5. been feeling constantly under strain |207 1 2 3 4 5 |+------------------------------------------------------------+----------------------------------------------------------------+| 6. been thinking of yourself as a worthless person |208 1 2 3 4 5 |+------------------------------------------------------------+----------------------------------------------------------------+| 7. had problems of high blood pressure (N) |209 1 2 3 4 5 |+------------------------------------------------------------+----------------------------------------------------------------+ EB44.3 - Q.83 - TREND MODIFIED
Q.46. Would you say you are very satisfied, fairly satisfied, not very satisfied or not at all satisfied with each of the following things? (SHOW CARD WITH SCALE) +--------------------------------------------------------------+------------+------------+------------+------------+----------+| READ OUT | VERY | FAIRLY | NOT VERY | NOT AT ALL | || | SATISFIED | SATISFIED | SATISFIED | SATISFIED | DK |+--------------------------------------------------------------+------------+------------+------------+------------+----------+| 1. With the life you lead |210 1 2 3 4 5 |+--------------------------------------------------------------+--------------------------------------------------------------+| 2. Your leisure life at home |211 1 2 3 4 5 |+--------------------------------------------------------------+--------------------------------------------------------------+| 3. Your social life outside the house |212 1 2 3 4 5 |+--------------------------------------------------------------+--------------------------------------------------------------+| 4. Your family life |213 1 2 3 4 5 |+--------------------------------------------------------------+--------------------------------------------------------------+| 5. With the way democracy works in (OUR COUNTRY) |214 1 2 3 4 5 |+--------------------------------------------------------------+--------------------------------------------------------------+| 6. With the kind of society we live in |215 1 2 3 4 5 |+--------------------------------------------------------------+--------------------------------------------------------------+ EB44.3 - Q.103 - TREND
Q.47. Before you were 18, did you experience any of the following problems? (SHOW CARD - READ OUT - MULTIPLE ANSWERS POSSIBLE) Your parents had major financial difficulties........................................... 216 1, You lived with only one parent who had to struggle to maintain the family............... 2, A parent died........................................................................... 3, Your parents' marriage broke up......................................................... 4, Your parents quarrelled frequently...................................................... 5, You were badly treated by adults........................................................ 6, You were physically or verbally bullied by other children at school..................... 7, Your school studies were disrupted...................................................... 8, One of your parents was unemployed for some time........................................ 9, You had health problems that lasted for a long time..................................... 10 None of these (SPONTANEOUS)............................................................. 11 DK...................................................................................... 12 Refusal................................................................................. 13 EB56.1 - NEW