social security spouse and survivor benefits for the ... · social security spouse and survivor...
TRANSCRIPT

Social Security Spouse and Survivor Benefits for the Modern Family
Melissa M. Favreault and
C. Eugene Steuerle
The Urban Institute
Updated for the 8th Annual Joint Conference of the Retirement Research Consortium “Pathways to a Secure Retirement”
August 10-11, 2006 Washington, D.C.
The research reported herein was pursuant to a grant from the U.S. Social Security Administration (SSA) funded as part of the Retirement Research Consortium (RRC). The findings and conclusions expressed are solely those of the authors and do not represent the views of SSA, any agency of the Federal Government, the RRC, The Urban Institute, its Board, or sponsors. We thank Sheila Zedlewski for helpful comments. All estimates in this paper are preliminary. Please consult the working paper version of this research on the Center for Retirement Research at Boston College website for final estimates.
1. Introduction
Women’s family lives have changed enormously over the past few decades, and these
shifts have had important implications for their economic security in old age. Most women work
outside of the home, even when their children are quite young (Dye 2005).1 Women are less
likely to marry, and when they do, divorce is common.2 Remarriage is becoming less common
for those who divorce. Over a third of all U.S. children are now born to unmarried women. The
implications of such trends for retirement security are sobering: aged poverty rates are very high
for unmarried women (Social Security Administration 2006b), and women who have raised
children outside of marriage are especially vulnerable (Johnson and Favreault 2004).
In the 1980s, many advocates proposed earnings sharing within Social Security as a
means for addressing the ways that women’s changing family roles would impact their
retirement security. (By earnings sharing, we refer to plans in which a husband’s and a wife’s
earnings records are combined and averaged over the duration of their marriage for the purposes
of computing Social Security benefits. Typically this occurs in concert with reductions in--or
elimination of--the program’s spouse and survivor benefits.) They particularly sought to improve
the status of the increasing number of divorced women entering middle life and retirement age
(Butrica and Iams 2000). Such proposals also sought to address inequities in Social Security’s
current law benefit structure that advantage single-earner families relative to dual-earner families
who pay the same amount in taxes. These proposals had a lot of appeal and resonance, given
their complementarities with notions of marriage as a partnership in which spouses should fully
share both incomes and obligations.
Analysts extensively examined possible consequences of earnings sharing alternatives in
this period, including simulating dozens of alternative parameterizations (e.g., Congressional
Budget Office 1986). Such proposals never gained sufficient political traction because of their
difficult implementation and some of their (often unanticipated) distributional consequences.
Ross and Upp (1993) concluded that the main reasons why these earnings sharing proposals
1 At present, about half of women who have given birth within the past year are working, with over a third working full time (Dye 2005). Among those who last gave birth 3 to 5 years ago, this increases to 63 percent, with 47 percent working full time. Socioeconomic differentials in work among mothers who have recently had a child are substantial, with more educated and black mothers quicker to return to work than mothers who are less educated, Hispanic, or white. 2 While U.S. divorce rates did level off in the 1980s, international experience suggests that a further retreat from formal marriage (for example in favor of extended non-marital cohabitation) is possible in the future.
2
eventually failed were inherent conflicts in the competing objectives, unintended consequences,
costs, and lengthy transition periods. Surprisingly, more recent OASDI reform discussions have
devoted proportionately less attention to the family benefits that the system provides, despite
continuing and rapid changes in U.S. family life. In debates over personal accounts, many did
mention the possible importance of earnings sharing for account balances, especially in the
context of divorce (see, for example, Reno et al. 2005). These debates did not, however, typically
extend to the context of updating the traditional system.
In this paper, we consider whether earnings sharing in Social Security may be worth
another look. Changes over the past few decades may have alleviated some of the challenges to
earnings sharing previously identified (e.g., transition periods may now be shorter, reducing
costs). It is also possible that society has changed so much, with later and less frequent marriage
(and remarriage), that the idea has simply passed its usefulness. We also consider whether other
changes to Social Security’s benefit computations, including features like caregiver credits,
minimum benefits, and more modest changes to the spouse/survivor benefits, could similarly
improve Social Security adequacy and horizontal equity, but without introducing the same level
of complexity as earnings sharing. Each proposal we examine entails substituting existing
spouse (and, sometimes, all or parts of the survivor) benefits with mechanisms that are more
explicit in acknowledging marital partnerships, more neutral with respect to marriage, and/or
better targeted toward people who are economically vulnerable.
The packages of Social Security proposals that we examine are all cost-equivalent in
2050. Our objective is to present three types of systems that spend roughly the same amount as
current law but improve Social Security’s performance along a set of criteria including poverty
reduction, more equitable treatment of individuals/couples who pay the same amount of Social
Security payroll tax, and increasing work incentives. We use scheduled benefits as the base for
comparison, but equivalent qualitative results apply to systems with reduced benefits under
reform. Our project uses DYNASIM3, the Urban Institute’s dynamic microsimulation model of
the U.S. population. To evaluate the three alternative systems, we compute alternative outcome
measures that reflect the system’s performance along various adequacy, efficiency, and equity
criteria, both cross-sectionally and over a lifetime.
We organize our paper as follows. First, we provide some background on Social Security
law and benefit distributions, and discuss the concerns with current auxiliary benefit payment
3
structures that prompted the earnings sharing debate. In this section, we set out some criteria for
reform of OASDI auxiliary benefits based on principles. We then describe literature that has
addressed such reforms, and identify the strengths and weaknesses that researchers have found
for various approaches. We next turn to parameterizations of our simulations, and briefly discuss
our methods. The results from the options follow. Finally we turn to our conclusions and briefly
speculate on their policy implications. We find that several parameter combinations would
render Social Security more effective at reducing poverty and would treat spouses paying the
same amount in taxes more similarly relative to current law, including some variants of earnings
sharing plans. However, the distributional properties of the reforms vary substantially, and, as
with all expenditure and tax reforms, there are losers as well as winners. This suggests that
policymakers need to carefully weigh competing objectives and interests.
2. Background and Criteria for Reform
Description of the law: Social Security awards a significant fraction of its benefits to the
spouses and survivors of retired, disabled, and deceased workers. A worker’s spouse is entitled
to a Social Security benefit equal to half the worker’s Primary Insurance Amount (PIA) while he
or she is still alive, and 100 percent of the PIA after his/her death.3 The worker does not pay any
additional payroll tax for this added protection.4 Spouses with their own work histories receive
the higher of their own benefit or the spouse/survivor benefit. A person who has a qualifying
work history but receives a higher benefit as a spouse or survivor is referred to as dually entitled.
The benefit that he/she could receive based on his/her earnings is considered a worker benefit,
and then the “top up” of the benefit is considered a spouse or survivor benefit. Divorced workers
whose marriages lasted at least 10 years can also receive spousal/survivor benefits, with special
rules applying when a worker has been married more than once.5
The extent to which Social Security benefits change before and after a spouse’s death can
vary because of these regulations. If a worker’s spouse has not worked or is a dual entitlee (and
so the family receives a spousal benefit or combined spouse/worker benefit rather than a second
3 Actuarial reductions apply if workers/spouses claim benefits before the normal retirement age, with different size reductions for workers and spouses, and delayed retirement credits apply if they collect benefits after. 4 In private pension systems, in contrast, workers often take benefit reductions to finance spouse/survivor coverage. 5 When a person has been married multiple times, he or she can usually receive a spousal benefit based only on the current marriage (if the current marriage started before one turned age 60). If one is not currently married, then one can usually collect benefits based on the highest-earning of one’s former spouses from qualifying marriages.
4
worker-only benefit), family income drops by one third upon widowhood of the lower earner
(from one and a half times PIA to one times PIA). When both spouses are workers, the family
income can drop by more, as much as fifty percent if the spouses’ earnings are equal (from two
times PIA to one times PIA), when the first spouse dies.
Rationale: The principle justification for Social Security’s spousal support subsidy is one
of replacement of adequate family, rather than just individual, income upon a workers’ disability,
death, or retirement. Social insurance allows workers to pool their risks of becoming disabled or
living an exceptionally long life (and thus outliving their economic resources). As part of this
package, auxiliary benefits contributed to the dramatic improvement in aged economic well-
being since Social Security started paying benefits in the late 1930s.
A key philosophical question is whether contributors to this social insurance program
should pay extra payroll tax for added protection for their spouses/survivors. Earlier in the
program’s history, aged poverty was widespread, especially among widows, and women’s rates
of work outside the home were relatively low. This made the case for subsidized spousal
coverage relatively non-controversial. At present, however, the aged are far less likely to be
poor than children, and about as likely to be poor as prime-aged adults (DeNavas-Walt, Proctor,
and Lee 2005). Just over half of all households (and about 68 percent of families with children)
are made up of married couples, and those households with two married people typically have
two earners. These patterns make it less clear that married families with single earners warrant
special protection at no extra cost.6
Another perspective is that the present system, by basing benefits on an ex-spouse’s
entire work history, provides a form of divorce insurance in retirement (though of course only for
those married for at least ten years). Because a person can greatly reduce his/her long-term
earnings capacity by taking off time to care for children, he/she is taking a significant economic
risk, both for later career and retirement when doing so. Again, the question arises to whether
people who have not married (and never will) should be required to pay for divorce insurance
from which they are ineligible to benefit, or whether the divorcing spouses should finance most
of this type of protection themselves (for example, through higher earning spouses compensating
lower earning spouses, either in an explicit OASDI formula or in settlements in the courts).
6 This is in contrast to disability and dependent children’s insurance, where the case is more compelling that those at higher risk should not have to pay higher rates.

5
Similar issues arise for couples that do not divorce, but where a higher-earning spouse may not
make provisions that adequately account for the lower-earning spouse’s economic well-being if
he/she (the higher-earner) dies first.
Concerns with the current system: Analysts have expressed concern about the ability of
Social Security’s system of spouse and survivor benefits to continue to limit poverty among the
elderly, while treating different groups of beneficiaries equitably as American families change.
With more people electing never to marry, high divorce rates, and more married women in the
labor force, the mismatch between OASDI payment structures--clearly rooted in the archetype of
a traditional family, with a sole breadwinner and a stay-at-home homemaker--and the
organization of American family life is ever more striking. The equity, adequacy, and efficiency
problems of Social Security auxiliary benefits as currently designed are well known and have
been extensively documented elsewhere (see, for example, Burkhauser and Holden 1982, Ferber
1993; Favreault, Sammartino, and Steuerle 2002), so we provide only a brief summary here.
One particular concern is that auxiliary benefits depend on one’s marital history and a
worker’s lifetime earnings, rather than on a spouse/survivor’s need. Spouses of workers with
higher earnings receive higher supplements than spouses of workers with lower earnings, and
can even receive higher benefits than some workers. As a consequence, and because workers do
not pay additional payroll tax for these benefits, the system can implicitly mandate transfers from
people who are less well off (single low- and middle-wage workers) to those who are better off
(spouses/survivors of high wage workers). (All else equal, groups that pay payroll taxes but are
ineligible to receive auxiliary benefits implicitly subsidize others’ benefits.) This occurs without
regard to whether such persons have raised children, as spouse/survivor benefit eligibility
depends on legal marital status, not on whether one has raised children with the spouse.7
Further, the system often grants far higher lifetime benefits—on the order of tens and
sometimes even hundreds of thousands of dollars—to couples in which spouses earn very
different amounts than to couples in which spouses earn similar amounts, even when both
couples pay the same amount in payroll taxes and the couple with different earnings levels
typically has more time for leisure and household production (because one spouse did not work,
7 In states that recognize common law marriage, such marriages allow one to qualify for Social Security spouse or survivor benefits. Even if a state recognizes gay marriage, such marriages do not qualify because of provisions of the Defense of Marriage Act (1996).
6
or works significantly fewer hours, for example). As already noted, survivors in families with
more similar earnings also frequently experience much steeper reductions in Social Security
upon the death of a spouse.
Because of the high correlation between marriage and divorce patterns with race and
socioeconomic status, another concern is that Social Security spouse and survivor benefits can
serve to exacerbate inequities by race, lifetime earnings, and education. Literature has clearly
shown that disproportionate fractions of spouse and survivor benefits go to whites (relative to
blacks and Hispanics), and projections suggest that this trend should worsen in coming decades
(Harrington Meyer 1996, Ozawa and Kim 2001, Harrington Meyer, Wolf, and Himes 2004).
OASDI’s system of auxiliary benefits also creates many anomalies surrounding marriage
and marriage-timing (Steuerle 1999). These include the following examples:
• “Cliffs” in OASDI eligibility due to the ten-year marriage duration requirement; • Steep remarriage penalties for lower earnings spouses whose spouses have died that may
suppress remarriage (Brien, Dickert-Conlin, and Weaver 2004); • Enormous marriage bonuses for some persons with multiple marriages; • Divorced spouses who are better off when their ex-spouses are dead (when they become
eligible for 100 percent of the ex’s PIA) than when the exes are alive (when they are eligible for 50 percent of the PIA);
• Variable redistribution based on spouse age differences, with those with older spouses potentially benefiting more from survivor benefits than those with younger spouses.
For many families, the current Social Security system has poor work incentives. Because
they are entitled to higher benefits on their spouses’ records than on their own, many secondary
earners have extremely high marginal tax rates and/or receive no return on their additional
payroll tax contributions (Feldstein and Samwick 1992).
Finally, and perhaps most importantly, the current system does not provide an adequate
income to all beneficiaries and their families. Poverty in retirement remains a big issue for
women (and some low-income men). Women’s elevated poverty risk stems in large part from the
fact that they live longer than men. They also tend to work at lower wages, and take more years
out of the work force (for example to care for children). Women are particularly vulnerable to
falling into poverty at divorce or at a spouse’s death, though accurately capturing such transitions
to poverty raises measurement issues (Burkhauser, Holden, and Myers 1986).
Magnitude of equity problem, past, present and future: Because increasing fractions of
women have earnings histories, some of the anomalies associated with couples with different

7
earnings shares have been reduced compared to a few decades ago.8 Sizable issues nonetheless
remain, especially among survivors. Benefits that are based solely on marriage to a qualified
worker (rather than one’s own work history) now comprise about 20 percent of aggregate Social
Security benefits to adults.9 Figure 1 breaks down the aggregate fraction of adult OASDI
benefits into earned and auxiliary types. Workers, either retired or disabled, receive about 80
percent of total benefits. (This estimate includes benefits for both retired and disabled workers,
as well as the earned portions of dual entitlees’ benefits.) Workers’ survivors (overwhelmingly
women because of male-female life expectancy differentials, coupled with the fact that men on
average marry women who are younger than themselves) receive the next largest fraction--about
ten percent of the total. Dually entitled survivors--survivors with work histories (typically of at
least ten years)--receive nearly five percent of adult benefits. “Pure” spousal benefits and benefit
top ups for dually entitled spouses comprise the remaining five percent of benefits to adults.
If we break these figures down further by age, we do see that the largest non-working
group (“pure” survivors) is disproportionately made up of older women (Social Security
Administration 2006a: Table 5.A15). As new cohorts of women enter retirement, we would
anticipate that the fraction receiving survivor only benefits will decline, reducing horizontal
inequities between working and non-working wives from this source. Projections from
DYNASIM indicate that within a few decades, the fraction of aggregate benefits that are
worker/worker portions will increase from the 80 percent level we currently observe to closer to
90 percent. So we expect significant reductions in unearned benefit fractions among adults, but
that an important percentage of total OASDI will continue to be directed to non-working adults,
who may be less economically vulnerable than some of their working counterparts.
Magnitude of adequacy problem: Poverty estimates reveal that women are still at high
risk of being poor or near poor in retirement. About 12 percent of women ages 65 and older
were poor in 2004, compared to 7 percent of men (Social Security Administration 2006a).
Women who were nearly poor (defined as having income of less than 125 percent of poverty)
approached 20 percent, compared to just over 12 percent for men. Unmarried women are almost
four times more likely to be poor than married women (17.4 vs. 4.4 percent). Within this group,
8 For example, throughout the 1950s and 1960s, less than 10 percent of aged women receiving spouse and survivor benefits were also entitled as workers, compared to 50.7 percent of wives and 44.3 percent of widows in 2004 (Social Security Administration 2006a: Table 5.G2). 9 We exclude disabled adult children (“DACs”) from these calculations.

8
never married and divorced women are worse off than widows, with respective poverty rates of
21.3, 20.7, and 15.4 percent and near poverty rates of 27.9, 30.0, and 26.9.
Criteria for reform: Given these very compelling and sizable inequities and adequacy
gaps, especially among unmarried women, we propose several criteria for evaluating reforms to
Social Security to improve the design of adult auxiliary benefits. These criteria, based on
principles of equity and efficiency, were prominent in previous examinations of earnings sharing.
We suggest that proposals in this area should meet at least some (and ideally all) of the following
objectives:
• Reduce poverty and near poverty among beneficiaries; • Equalize the lifetime benefits of individuals (or couples) who pay the same amount of
payroll tax; • Ensure that lower earners in a couple are protected at divorce and that entitlement is
portable at divorce; • Introduce closer ties to childbearing than to marriage; • Reward work, so that additional work always results in higher OASDI benefits; • Avoid creating marriage disincentives.
3. What are the ways one could deal with the problem, and what does past research say
about them?
An extensive literature addresses how Social Security spouse and survivor benefits shape
program adequacy and equity by gender, marital status, and family earnings patterns. Over the
years, there have been tensions between several different approaches for addressing some of the
system’s limitations. Some analysts propose incremental changes that leave the basic
relationships in Social Security law in tact, but alter certain parameters to achieve better
distributional results (for example, changing computation years, the percentage of PIA that a
spouse or survivor receives, or parameters in the special minimum benefit). Others have
proposed a move toward a two-tiered system, in which universal benefits would offer a floor of
protection to all, with a smaller earnings-related portion. A third group has suggested earnings
sharing. Table 1 provides a summary of selected proposals geared at improving the program’s
performance that have been prominent in recent decades. The table lists how the literature has
indicated these proposals are likely to perform along the various criteria that we have just
enumerated (with the caveat that they are rarely compared with equivalent expenditures).
Throughout the 1980s, a period of significant debate and research in this area, earnings
sharing was much of the focus (see, for example, Burkhauser and Holden 1982, Congressional
9
Budget Office 1986). Summarizing research results on earnings sharing succinctly is difficult,
given the multitude of parameterizations explored during this issue’s heyday. Such proposals
clearly could improve the program’s equity for two-earner couples, though there were significant
concerns about how survivors would fare. Plans that included specific provisions to shield
survivors from cuts helped to address this problem, but they significantly raised total costs.
Among the clear distributional trends from such plans were large gains for divorced
women (often most especially to those who had divorced after a marriage that lasted less than 10
years), which corresponded with large losses for divorced men.10 Given that divorced men tend
to lose under earnings sharing, one might question whether such plans could create marriage
disincentives for men. The way that earnings sharing options interact with the benefit formula (if
it is unadjusted) also turn out to be quite relevant, and could lead to some unusual (typically
progressive) patterns.11
In the 1990s, issues surrounding Social Security adult auxiliary benefits received less
attention relative to the earnings sharing days, with the noteworthy exception of proposals to
trade lower spouse benefits for higher survivor benefits for couples with relatively similar
earnings (for example, Hurd and Wise 1991, Burkhauser and Smeeding 1994, Sandell and Iams
1997). Such plans would typically reduce spouse benefits to a third of PIA in exchange for a
survivor benefit that would equal some multiple (usually 67 or 75 percent) of the couple’s
benefit when both were alive. Research found that this kind of plan can reduce poverty among
aged women, improve equity for spouses with more similar earnings, and improve work
incentives. Such plans do nothing to help some other vulnerable groups (like never married
mothers) and, in some cases, could increase aggregate transfers to married people (making the
proposals problematic for never married people). Careful design of caps on the survivor benefits
can help to reduce such transfers to ever-married people who do not have significant need.
A few more recent studies (Favreault and Sammartino 2002, Favreault, Sammartino, and
Steuerle 2002, Herd 2004, 2006) have renewed attention to issues related to adult auxiliary
10 Married couples with very similar earnings histories should see little change if they were married to one another for most of their working years. Never-married people would not see benefit changes under earnings sharing (unless universal changes to benefits were made to compensate for cost savings). 11 For example, intact couples with one spouse with lifetime earnings below the first bend point and the other with earnings above it would gain relative to current law while both spouses were alive. The same is true where one spouse’s earnings fall above the second bend point and the other’s fall above it. Conversely, intact couples with workers in the same band of the AIME formula would lose if the lower AIME person dies sooner than the higher AIME person.

10
benefits within Social Security. They have tended to focus on incremental changes, including
caregiver credits, minimum benefits, and also other benefit changes (e.g., expansion of eligibility
or benefit for divorced spouses).
Proposals for caregiver credits and related provisions (e.g., increasing the number of
“dropout years” for people who care for children) have often been popular because they establish
a clearer link between auxiliary benefits and childrearing (as opposed to legal marital status).
They provide a more appealing rationale than current law if one believes that a retirement system
goal is to compensate for costs (childrearing typically adds to costs, while marriage or combining
households typically reduces them). Analyses typically find that caregiver credits do better than
current law spouse benefits at reducing poverty or otherwise redistributing to those in lower
income groups, especially by race and class (Herd 2006, Holden 1982, Favreault, Sammartino,
and Steuerle 2002). In some designs, such credits could reduce work incentives, contrary to
objectives for the system. Like spouse benefits, they raise issues of who ought to pay for added
protection (Fierst 1982). The literature clearly shows that caregiver credits are more progressive
than increased dropout years for care (Herd 2006, Iams and Sandell 1994). Caregiver credits do
raise a number of design issues (for example, which parent gets the credit, whether credits need
to be applied when children are young, how to adjust for additional children, etc.).
Minimum benefits clearly have the capacity to significantly reduce poverty relative to
current law structures like the spouse benefit (Herd 2005, Favreault and Sammartino 2002,
Favreault, Sammartino, and Steuerle 2002). Like caregiver credits, they raise a number of design
issues (for example, Favreault, Mermin, and Steuerle 2006). In some designs, minimum benefits
could reduce work incentives at certain earnings levels, leading to flattening benefit distributions.
This raises concerns among many program advocates, who see the clear earnings relationship for
OASDI worker benefits as a source of political support and worry that “too much” redistribution
through a minimum or other means (e.g., adding another bend point) could undermine this.
Expansions of divorced spouse benefits (for example, reducing the marriage duration
requirement) help relatively small fractions of those at risk, but their effects tend to be large for
those who are affected (Favreault and Sammartino 2002). These approaches also tend not to
have good work incentives, and in some cases could encourage divorce.
Summary: The literature has shown that changes to adult auxiliary benefits can be most
effective if they contain packages of parameter changes. Virtually all changes in isolation fail to

11
right certain issues, and often the improvements that changes make in one area (say, adequacy)
lead to reductions in another (say, efficiency). Table 1 suggests this quite clearly. If we look
across any row, none of the proposals simultaneously improves program performance along all
the criteria, and many improve on one criterion only at the expense of another.
Our contribution to the literature is thus fourfold. First, we do focus on packages of
parameter changes. We combine Social Security equity and adequacy adjustments in the hope
that we can improve the system’s performance along both types of criteria simultaneously.
Second, we update several of these studies to take into account more recent patterns in work and
family life. This is especially important in the case of earnings sharing, where the most recent
studies are about twenty years old. Third, many of the previous studies tend to describe a policy
environment that is “add-on” in terms of Social Security expenditures relative to current law
scheduled or do not allow expenditure-neutral comparisons across different types of proposals,
especially considered in combination. We take a more realistic path of assuming approximate
expenditure neutrality (relative to scheduled benefits), thus paying for every change that we
make. Finally, we also examine horizontal equity issues, often neglected in more recent
literature that has focused on adequacy and redistribution.
4. Parameterizations of the options/alternatives
We have simulated three plausible combinations of parameters within option packages.
In all cases, we eliminate, reduce, and/or cap spousal and survivor benefits to offset the costs of
the provisions that are geared at improving the adequacy and equity of auxiliary benefits. Table
2 summarizes the details of the packages we explore.
Option 1. Earnings Sharing: Our first option is a generic earnings-sharing proposal,
much like those advanced a few decades ago. Under it, persons becoming entitled to OASDI in
2007 (those born in 1947 or later) begin sharing earnings retrospectively starting in 1961.12
Earnings sharing occurs for the full duration of the marriage, but no longer.13 In concert with
12 We re-compute covered quarters on the basis of this shared vector. 13 One might argue for extending the sharing period when children are involved, applying different sharing rules for couples with and without children, or making additional corrections for other types of career sacrifices (e.g., putting a spouse through a costly schooling program). For example, in marriages with children, there could be presumptive entitlement to share earnings for the custodial parent from birth through the age when a child is no longer dependent (though this becomes complicated if either spouse remarries before the child reached the designated age for non-dependence). Similarly, if it is earlier, one could consider a child’s birth as a better indicator of the period a couple should share over than a marriage’s start date, though this certainly stretches current OASDI law regarding spouses.

12
this change, we remove all spouse benefits. We simulate three sub-options of earnings sharing
that handle adjustments to survivor benefits differently. In the first (1a), we award survivor
benefits on the basis of the maximum shared earnings vector among a worker’s, his/her spouse’s,
and all former spouses’. This would be equivalent to removal of the survivor benefit for those
who were married to one another for their highest 35 years of earnings, but could have variable
(and somewhat unusual, sometimes undesirable) effects for those with qualifying marriages of
lesser duration. We chose this specification despite these effects because of its similarity to
current law, which now chooses the highest of ones and one’s spouses’ unshared vectors. In the
second sub-option (1b), we remove the survivor benefit altogether. This is more consistent with
earnings sharing principles as traditionally constructed. In the third version (1c), we also
eliminate all survivor benefits, but further require those who are married at the time of first
benefit entitlement to accept benefit reductions to finance a survivor benefit in case they
predecease their spouse. Such adjustments were discussed in the earlier earnings sharing debates
(e.g., Burkhauser 1982). The financing of the benefit offset to pay for the survivor is designed to
be roughly actuarially fair on a cohort basis, and uses unisex pricing. We impose this survivor
benefit mandate for both higher and lower earners.
Because in all three sub-options these changes to Social Security lead to cost reductions
relative to current law scheduled (i.e., the full or partial elimination of spouse and survivor
benefits more than offsets benefit increases certain families will receive because of changes to
fractions of total earnings in each bracket of the PIA formula), we make scalar adjustments to
worker benefits (namely, through adjustments to the formula factors). In the first instance, we
increase benefits by about 2.7 percent. In the second and third, we increase benefits more, about
4.5 percent. (One could of course make these increases more progressive, rather than
proportional to the newly defined individual benefit, for example by increasing the first two
formula factors proportionately more than the third.)
Option 2. Reduce Spousal and add a Minimum Benefit. Our second option contains far
simpler changes relative to current law. Effective for those becoming entitled in 2007, we
reduce spousal benefits from 50 percent of PIA under current law to 12.5 percent. To
compensate for this reduction, we implement a minimum benefit that anyone can qualify for,
regardless of marital status or marital history. The minimum benefit we use is fairly standard
from the literature. Under it, a worker qualifies for a benefit of 60 percent of poverty with 20
13
years of work, increasing by two percent of poverty per year of work until reaching a maximum
poverty-level benefit with 40 years of Social Security-covered work. The minimum benefit is
wage-indexed from its inception (again, 2007). This implies (assuming that wage growth
outstrips price growth, as it has historically) that the minimum’s value will increase faster than
poverty, so that in the subsequent years workers would receive greater than 100 percent of
poverty under the minimum with 40 years of covered work.
Option 3. Reduce Spousal and add Caregiver Credits. Our final option grants an
earnings credit of up to 50 percent of the average wage to individuals with children under the age
of six when determining Social Security benefit levels.14 Effective for those first entitled in
2007, one can receive the credit for up to five years (or seven years total if one has more than
one child), and it is applied retrospectively for years after 1960.15 Only one parent per family can
claim the credit, and those who already earned more than the credit amount do not benefit from
it. To offset this credit, we eliminate spousal benefits.
5. Methods
To explore these issues, we use DYNASIM3, the Urban Institute’s dynamic
microsimulation model. DYNASIM3 has a starting population based on the 1990 to 1993 panels
of the Survey of Income and Program Participation. Year by year, the model makes forecasts of
life events (births, deaths, disability, marriage, divorce), work behavior, Social Security receipt,
and other retirement income sources as far as 2050 (see Favreault and Smith 2004). The model
makes different forecasts based on individual characteristics (like education and race) and life
histories. For example, many women change their work behavior when they have marry, have
children, or divorce. We calibrate many predictions (for example, on fertility levels and wage
growth) to the assumptions of the Social Security Trustees (OASDI Board of Trustees 2005).
We code the three alternative OASDI family benefit systems into the model, and forecast
their effects through 2050. In our lifetime analyses, we forecast outcomes further (to 2100) but
using a more limited set of outcomes and differentials. We assume that individuals behave the
14 The current version of this simulation applies the credits to mothers, but not fathers. In our final draft, we hope to change the coding of the credit to extend eligibility to fathers when they are the lower/non-earner in a parenting couple. (This may require reducing the credit level to maintain cost equivalence, though at present the option is less expensive than the others, leaving room for a modest expansion.) 15 Credits are applied sequentially from the birth of the first child (rather than in a way that maximizes the credit). We recompute covered quarters after adding in the credit to the earnings history.

14
same way under the options (earnings sharing, others) as they would under current law
scheduled. So work and marriage behavior do not change because of the options’ introduction.
Our outcome measures for the simulations include average annual worker and auxiliary
benefits at points in time (for example, 2049) and average/median lifetime Social Security
benefits for select cohorts. We tabulate these outcomes along a wide variety of characteristics of
interest, including age, childrearing history (i.e., the number of years one spent raising children),
education, gender, marital status/history, lifetime earnings, and work history. Such tabulations
help us to determine the extent to which a given option makes Social Security more (or less) tied
to marital status, childbearing, earnings, relative earnings of spouses, and work history. To
capture changes in horizontal equity, we examine the extent to which individuals and couples
paying the same total amount in payroll taxes (but with different fractions of lifetime earnings
earned by each spouse) receive similar benefits. To specifically measure benefit adequacy, we
compute the reduction in the share of the population in poverty (and reduction in the gap
between Social Security benefits and poverty). In all cases, we compare Social Security
outcomes under each option to current law along these dimensions.
6. Results
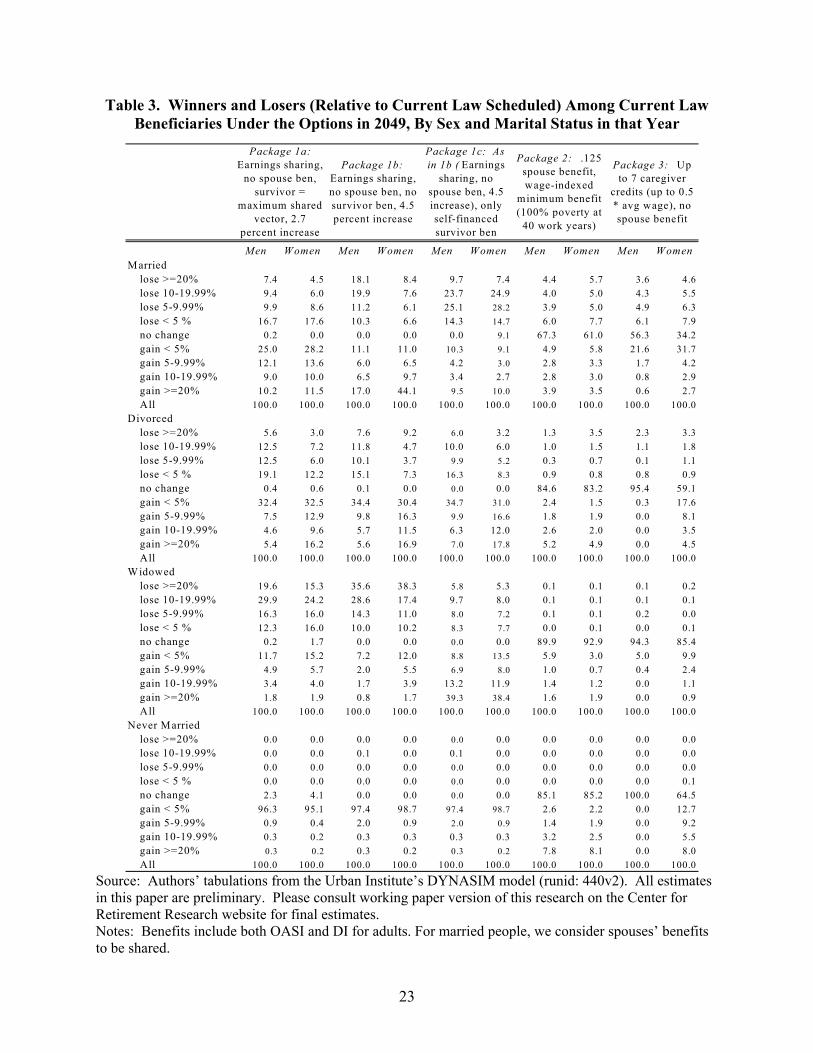
We begin our discussion with some summary results on winners and losers from the
options (Table 3). This table shows the fractions of beneficiaries with benefit changes of varying
magnitudes (expressed as a percent of current law benefit) by sex and in different marital status
groups in the year 2049 across the three options (plus the three earnings sharing sub-options).
For earnings sharing, the sorts of basic patterns we would expect to find given our
selected parameterizations (and the previous literature) are apparent. These include transfers to
divorced women, about 16 percent of whom experienced benefit increases of over 20 percent
relative to current law in the first parameterization. Divorced men are more likely to lose
benefits, with 18 percent losing greater than 10 percent. (Substantial fractions of the former
husbands of the divorced women who gain are likely fall into the married category, as are some
formerly divorced women, given remarriage, which is somewhat more prevalent among men
than among women.) Never married people receive small benefit increases (because of the
benefit adjustment that compensates for the elimination of spouse and survivor benefits) under
this first earnings sharing option. Married people experience a mix of gains and losses. The
largest gains are concentrated among lower-earnings spouses whose higher-earnings spouses
15
have not yet claimed benefits (gains will be reduced when the second earner claims his/her
benefit that has now been reduced because of sharing) and among those where spouses have
earnings that occupied different brackets of the AIME formula.16 Losses are concentrated among
those families that had been receiving sizable spouse benefits (whether spouse only or dual
entitlement top ups). The gains that the divorced, some married, and never married receive come
largely at the expense of widowed men and women. About three-quarters receive a loss of some
size, and about a fifth of widowers and widows (20 and 15 percent, respectively) experience
benefit losses of twenty percent or higher. When the earnings sharing option includes no
survivor benefit (rather than one based on the highest shared vector) and benefits are increased in
a scalar way accordingly, we see more significant fractions with large losses among both the
married and, especially, the widowed. Fractions of widows with losses of greater than 20
percent increase to 36 percent of men and 38 percent of women under this option. Mandating
survivor annuitization, in contrast, leads to more substantial losses among married people (notice
the concentration of losses in the 5 to 20 percent range for this group), but leads to gains among
many widow(er)s [results preliminary].
The option that reduces spouse benefits and adds a minimum benefit has a very different
pattern of gains and losses than the earnings sharing options. Most people fall into the no change
category, with widows and widowers the groups least likely to experience a change. About 15
percent of never married people see increased benefits because of the new minimum benefit.
Losers, of course, are concentrated among the married people who experienced the spouse
benefit reduction. About a fifth of married men and a quarter of married women lose, compared
to about 15 percent who gain. Divorced people have mixed experiences. A small fraction
(presumably former divorced spousal beneficiaries) receives very large reductions, while a
somewhat larger fraction experiences large increases (presumably because of the new minimum).
Caregiver credits with a spousal benefit reduction have a broad reach. More people have
changes to their benefits than under the minimum benefit option, but the sizes of benefit changes
16 One odd thing that happens under earnings sharing is that quite a few spouse beneficiaries can actually “win” (i.e., receive higher benefits), both at a point in time and over a lifetime. Most commonly, this occurs when more of the couple earnings fall below the lower two bend points and thus are subject to higher replacement rate. There are also instances where a spouse may have had 8 or 9 years of covered earnings that were not being counted under current law. With the earnings sharing (which recomputes covered quarters based on the shared husband and wife earnings vector), these earnings now count toward Social Security. Other times, a spouse is now receiving benefits on a more lucrative total vector (if, say, the current spouse was not the spouse with the highest lifetime earnings).

16
tend to be fairly modest. Gains and losses are asymmetrical, with losses (presumably primarily
from the spouse only beneficiaries) much larger than the gains, which are concentrated in the
range of less than five percent of original benefits.
We compare lifetime OASDI tax benefit ratios across individuals by the relative earnings
of spouses (within lifetime tax payment groups) to highlight the options’ performance on equity
criteria.17 Such measures allow us to expand on the winners and losers at a point in time, and
accumulate experience throughout a career. Table 4 presents these data on individuals born
between 1960 and 1980 (who effectively experience the new systems when they are essentially
fully phased in).18 A ratio of greater than one indicates that a person receives lifetime benefits
that exceed his/her payroll tax contributions, accumulated at a two percent real rate of return. A
ratio of less than one indicates that contributions exceeded benefits (so accumulated). The
declining ratios across increasing lifetime tax groups in the current law column illustrate the
system’s progressivity.
We see that the three earnings sharing options clearly reduce the high ratios of those
couples with disparate relative earnings (Table 4). Ratios for single-earner families and those
couples with highly or very highly skewed earnings (couples in which one spouse earned more
than 80 percent of the total) decline or remain flat in all three lifetime tax groups that we
examine. The spouse minimum benefit option similarly improves the balance of ratios across
earnings fraction groups (within tax groups), though in some cases somewhat less so than
earnings sharing. Caregiver credits with spousal reductions do similarly to the minimum benefit.
It is striking how muted the patterns are on this outcome, with a lot of noise around the general
trends. This appears to be due to variation within the earnings/tax category, plus the fact that so
many people have relatively complex work and marriage trajectories (with a lot of shifting
between family earnings type, significant amounts of remarriage, and/or spouses whose ages are
relatively far apart, meaning that one collects on the shared record before the other).
To weigh the proposals’ adequacy effects, we turn to our results on poverty reduction
(Table 5). The earnings sharing option that allows one to collect survivor benefits based on the
17 In constructing this measure, we sum contributions and benefits from age 16 to death, using a discount rate of two percent. We evaluate outcomes as of age 65, and consider only persons who survive to age 30. We include people who survive to age 30 but die prior to collecting Social Security benefits in the population. (They have benefit to contribution ratios of zero.) 18 We calculate these ratios on the individual level, and then average them. This implies that our measure is the average ratio for a member of a group, but not the average for the group as a whole.
17
highest shared earnings vector and increased benefits by 2.7 percent reduced poverty relative to
current law scheduled for the population at large (with a poverty rate of 4.96 percent, compared
to 5.17 under current law). The earnings sharing option with mandated survivor protection does
even better, reducing poverty to a rate of 4.79 percent [results preliminary]. The minimum
benefit reducing spouse benefits has the greatest effect on poverty, reducing it to 4.59 percent.
The caregiver credit has poverty effects that fall between the earnings sharing with modified
survivor and the minimum benefit, 4.91 percent. The earnings sharing proposal with elimination
of all survivor benefit, in contrast, increases poverty, to 5.48 percent of the population. While
these differences in poverty may appear modest (a range of 0.9 percentage points from highest to
lowest), a shift of just 0.1 percentage points reflects almost 93,500 people in this 2050
population. So potentially hundreds of thousands of people could be removed from poverty
(relative to current law scheduled) across the options.
The poverty change effects are differentiated by marital status across all of the options,
largely mirroring the patterns of gains and losses we showed earlier. Earnings sharing options
reduce poverty among the divorced (and even some of the married) at the expense of the
widowed. Earnings sharing with mandated survivor protection, however, can mitigate the effect
on the widowed, though at the expense of the married [results are preliminary]. The minimum
benefit package reduces poverty among all the marital status groups, but is less successful for the
divorced than is earnings sharing. The caregiver helps women in virtually all of the marital
status groups, at the expense of men in single-earner families in this specification.
7. Caveats
Our projections depend on accurate modeling of the relative earnings of men and women
several decades from now. Given challenges in forecasting such tends over even short periods,
we suggest conservative interpretation of our results. Because we balance costs for the various
options at a point in time (2050), the long-term equivalence of these proposals is not assured
(tables with the time paths of costs are available on request). We assume no behavioral
responses in these analyses. If any of the options were to improve work incentives, they may
reduce Social Security financing problems and increase individual and family-level benefits. If
they were to promote or discourage marriage and/or divorce, results could differ significantly.
8. Conclusions and policy implications

18
All three of our packages—earnings sharing, replacement of most of the spouse benefit
with a minimum, and full spouse replacement with caregiver credits—reduced poverty modestly
and made lifetime benefits more similar for couples paying the same amount in taxes relative to
current law scheduled, though the earnings sharing proposal only achieved the poverty reduction
when significant adjustments were made to the treatment of surviving spouses. Some of the
packages, but not all, also made modest improvements in work incentives. The packages do
reveal important tradeoffs among different beneficiary groups. The (crudely) cost-neutral
environment in which we work underscores how improving adequacy for some groups has
significant repercussions for others in an underfunded system.
Of course, the options that we have simulated are relatively stylized ones, meant
primarily to illustrate some possible ways the system might evolve to meet the needs of today’s
increasingly diverse American families. The performance of all could be improved along our
criteria through additional parameter adjustments. Our hope is that we have encouraged renewed
attention to examining these issues using methods that enable one to identify distributional
effects and outcome measures that are based on objectives that improve the system’s fairness and
capacity to help those in need in retirement and disability.
References: Burkhauser, Richard V. 1982. “Earnings Sharing: Incremental and Fundamental Reform.” In
Burkhauser, R.V. and K. C. Holden, eds. 1982. A Challenge to Social Security: The Changing Roles of Women and Men in American Society. New York: Academic Press.
Burkhauser, Richard V. and Karen C. Holden, eds. 1982. A Challenge to Social Security: The Changing Roles of Women and Men in American Society. New York: Academic Press.
Burkhauser, Richard V., Karen C. Holden, and D. Myers. 1986. “Widowhood and Poverty: The Role of Survey Procedures in Artificially Creating Poverty.” Demography 23(4): 621-631.
Burkhauser, Richard V. and Timothy M. Smeeding. 1994. Social Security Reform: A Budget Neutral Approach to Older Women’s Disproportionate Risk of Poverty. Syracuse, NY: Syracuse University, Center for Policy Research, Maxwell School.
Butrica, Barbara A. and Howard M. Iams. 2000. “Divorced Women at Retirement: Projections of Economic Well-Being in the Near Future.” Social Security Bulletin 63(3): 3-12.
Congressional Budget Office (CBO). 1986. Earnings Sharing Options for the Social Security System. January.
Brien, Mike, Stacy Dickert-Conlin, and David Weaver. 2004. “Widows Waiting to Wed? (Re)Marriage and Economic Incentives in Social Security Widow Benefits.” Journal of Human Resources 39(3): 585-623.

19
DeNavas-Walt, Carmen, Bernadette D. Proctor, and Cheryl Hill Lee. 2005. Income, Poverty, and Health Insurance Coverage in the United States: 2004. U.S. Census Bureau, Current Population Reports, P60-229. Washington, DC: U.S. Government Printing Office. www.census.gov/prod/2004pubs/p60-229.pdf (accessed September 2005).
Dye, Jane Lawler. 2005. “Fertility of American Women: June 2004.” Current Population Reports P20-555. http://www.census.gov/prod/2005pubs/p20-555.pdf (accessed June 2006).
Favreault, Melissa M. and Frank J. Sammartino. 2002. “Impact of Social Security Reform on Low-Income and Older Women.” Washington, DC: AARP. [Project Report for AARP Public Policy Institute, Number 2002-11.]
Favreault, Melissa M., Frank J. Sammartino, and C. Eugene Steuerle, eds. 2002. Social Security and the Family: Addressing Unmet Needs in an Underfunded System. Washington, DC: Urban Institute Press.
Favreault, Melissa M. and Karen E. Smith. 2004. “A Primer on the Dynamic Simulation of Income Model (DYNASIM3).” Discussion Paper, Retirement Project, The Urban Institute. http://www.urban.org/UploadedPDF/410961_Dynasim3Primer.pdf (accessed December 2004).
Feldstein, Martin and Andrew Samwick. 1992. “Social Security and Marginal Tax Rates.” National Tax Journal 45(1): 1-22.
Ferber, Marianne A. 1993. “Women’s Employment and the Social Security System.” Social Security Bulletin 56(3): 33-55.
Fierst, Edith U. 1982. “Discussion.” In R.V. Burkhauser and K. C. Holden, eds. A Challenge to Social Security: The Changing Roles of Women and Men in American Society. New York: Academic Press.
Harrington Meyer, Madonna. 1996. “Making Claims as Workers or Wives: The Distribution of Social Security Benefits.” American Sociological Review 61(3): 449-465.
Harrington Meyer, Madonna, Douglas A. Wolf, and Christine L. Himes. 2004. “Linking Benefits to Marital Status: Race and Diminishing Access to Social Security Spouse and Widow Benefits in the U.S.” Center for Retirement Research at Boston College. WP #2004-05. http://www.bc.edu/centers/crr/wp_2004-05.shtml (accessed July 2006).
Herd, Pamela. 2006. “Crediting Care or Marriage? Reforming Social Security family benefits.” Journals of Gerontology, Series B: Psychological and Social Sciences, 61: S24-34.
Herd, Pamela. 2005. “Ensuring a Minimum: Social Security Reform and Women.” The Gerontologist 45(1): 12-25.
Herd, Pamela. 2004. “Reforming Social Security Family Benefits: Balancing Equity and Adequacy.” Pp. 114-126 in K. Buto, M. Priddy Patterson, W. E. Spriggs, M. Rockeymore, eds. Strengthening Community: Social Security in a Diverse America. Washington, DC: Brookings Institution Press.
Holden, Karen C. 1979. “The Inequitable Distribution of OASI Benefits Among Homemakers.” Gerontologist 19(3): 250-256.
Holden, Karen C. 1982. “Supplemental OASI Benefits to Homemakers Through Current Spouse Benefits, a Homemaker Credit, and Child-Care Drop-Out Years.” In R. V. Burkhauser and K. C. Holden, eds. 1982. A Challenge to Social Security: The Changing Roles of Women and Men in American Society. New York: Academic Press.
Hurd, Michael D. and David A. Wise. 1991. “Changing Social Security Survivorship Benefits and the Poverty of Widows.” Working Paper no. 3833. Cambridge, MA: National
20
Bureau of Economic Research. (Also in M.D. Hurd and N. Yashiro, eds. 1997. The Economic Effects of Aging in the United States and Japan. Chicago: University of Chicago Press.)
Iams, Howard M. and Steven H. Sandell. 1998. “Cost-Neutral Policies to Increase Social Security Benefits for Widows: A Simulation for 1992.” Social Security Bulletin 61(1): 34-43.
Iams, Howard M. and Steven H. Sandell. 1994. “Changing Social Security Benefits to Reflect Child-Care Years: A Policy Proposal Whose Time Has Passed?” Social Security Bulletin 57(4): 10-23.
Johnson, Richard W. and Melissa M. Favreault. 2004. “Economic Status in Later Life Among Women Who Raised Children Outside of Marriage.” Journal of Gerontology: Social Sciences 59B(6): S315-S323.
OASDI Board of Trustees. 2005. 2005 Annual Report of the Board of Trustees of the Federal Old-Age and Survivors Insurance and Disability Insurance Trust Funds. Washington, DC: Author.
Ozawa, Martha N. and Hak-Ju Kim. 2001. “Money’s Worth in Social Security Benefits: Black-White Differences.” Social Work Research.
Reno, Virginia P., Michael J. Graetz, Kenneth S. Apfel, Joni Lavery, and Catherine Hill, eds. 2005. Uncharted Waters: Paying Benefits from Individual Accounts in Federal Retirement Policy. Study Panel Final Report. Washington, DC: National Academy of Social Insurance.
Ross, Jane L. and Melinda M. Upp. 1993. “Treatment of Women in the U.S. Social Security System, 1970-88.” Social Security Bulletin 56(3): 56-67.
Sandell, Steven H. and Howard M. Iams. 1997. “Reducing Women’s Poverty by Shifting Social Security Benefits from Retired Couples to Widows.” Journal of Policy Analysis and Management 16(2): 279-297.
Smeeding, Timothy M., Carroll L. Estes, and Lou Glasse. 1999. “Social Security and Older Women: Improving the System.” Income Security Policy Series Paper Number 22. Syracuse, NY: Maxwell School.
Social Security Administration. 2006a. Annual Statistical Supplement, 2005 to the Social Security Bulletin. Washington, DC: Author. www.ssa.gov/policy/docs/statcomps/supplement/2005/ (accessed October 2005).
Social Security Administration. 2006b. Income of the Population 55 or Older, 2004. Office of Policy. Washington, DC: Author.
Steuerle, C. Eugene. 1999. Statement before the Committee on Aging, United States Senate, “The Treatment of the Family and Divorce in the Social Security Program,” February 22.
U.S. Department of Health and Human Services. 1985. Report on Earnings Sharing Implementation Study, January.
U.S. Department of Health, Education, and Welfare. 1979. Social Security and the Changing Roles of Men and Women. Washington, DC: Author.
Weaver, David A. 1997. “The Economic Well-Being of Social Security Beneficiaries, with and Emphasis on Divorces Beneficiaries.” Social Security Bulletin 60(4): 3-17.
Zedlewski, Sheila Rafferty. 1984. “The Distributional Consequences of an Earnings Sharing Proposal.” Project Report No. 3344. Washington, DC: The Urban Institute.

21
Table 1. Performance of Selected Proposals to Improve Social Security's Family Benefits Along Various Criteria:
Findings from the Literature
Never married
Divorced after < 10
years marriage
1
Increase survivor benefit for those w ith own earnings similar to a spouse's (base on a percentage--typically 67 to 75% --of combined benefit when both are alive)
no no yes yes no yes no
Burkhauser and Smeeding (1994); Hurd and W ise (1997); Sandell and Iams (1997); Favreault, Sammartino, and Steuerle (2002)
2Create a minimum benefit (usually based on work years and the poverty threshold)
yes yes ambiguous ambiguous potential yes ambiguousHerd (2005); Favreault, M ermin, Steuerle (2006); Favreault, Sammartino, and Steuerle (2002)
3 Create caregiver credits yes yes ambiguous no potential yes yes Herd (2006); Favreault, Sammartino, and Steuerle (2002)
4 Additional dropout years for care potential yes no no no yes ambiguousHolden (1982); Iams and Sandell (1994); Herd (2006)
5 Cap spouse and/or survivor benefit potential potential yes yes yes no yes
6Benefit formula changes (add new bendpoint, etc) yes potential ambiguous ambiguous yes yes ambiguous
Favreault, M ermin, Steuerle (2006)
7Implement earnings sharing w ith no change to survivor no yes yes yes yes potential yes CBO (1986)
8 Implement benefit sharing no yes no ambiguous yes ambiguous yes
9 Reduce marriage duration in event of divorce no yes no no no potential potential
W eaver (1997); Favreault and Sammartino (2002)
10 Divorced widow expansion no potential no no ambiguous potential potential Favreault and Sammartino (2002)
among workers). To the extent that studies have used particular cost-offsets, they have typically been reduction or elimination of the spousal benefits.
Expand eligibility
Notes: Evaluations of the performance on the criteria are typically made relative to current law (under the assumption that funds saved, if any, are redistributed
Avoid un-desirable marriage
anomalies
Incremental formula changes
Sharing options
Proposal
Criteria
Previous Studies
Help single parents Equalize LT benefits of
couples with same total earnings
Reduce work dis-incentives
Reduce w indfalls to
wealthy families
Reduce poverty

22
Table 2. Details of the Social Security Packages Simulated
P ro p o sa l D eta ils C o st O ffse t Im p lem en ta tio n Issu es (e .g ., p h a se-in s , trea tm en t o f D I)
1 a
E arn in g s sh a rin g w ith m o d ified su rv iv o rs ' b en efits , g lo b a l b en efit in crease o f 2 .7 1 p e rcen t
S p o u ses sh a re a ll earn in g s (cap p ed a t th e tax ab le m ax im u m p rio r to sh a rin g ) o v e r th e d u ra tio n o f m arriag e . W e ap p ly sh a rin g re tro sp ec tiv e ly to earn in g s b eg in n in g in 1 9 6 1 . W e reco m p u te q u arte rs o f co v erag e b ased o n th e sh a red ea rn in g s v ec to r.
E lim in a te sp o u sa l b en efit. R ed u ce su rv iv o r b en efits , a llo w in g su rv iv o r to rece iv e o n th e m ax im u m sh ared ea rn in g s v ec to r.
W e im p lem en t sh a rin g a t tim e o f b en efic ia ry en titlem en t to a ll ev er m arried p e rso n s . W e d o n o t w a it u n til b o th sp o u ses a re re tired /d isab led o r d iv o rce o ccu rs to sp lit. P a rtia l y ea rs o f m arriag e a re trea ted as if sp o u ses w ere m arried a ll y ea r. Im m ig ran ts sh a re th e ir tim e ab ro ad (ze ro y ea rs) w ith a sp o u se . W e im p lem en t b en efit h ik es th ro u g h sca lar in c rease to b en d p ercen tag es.
1 b
E arn in g s sh a rin g w ith n o su rv iv o rs ' b en efits , g lo b a l b en efit in crease o f 4 .5 p e rcen t
S am e as 1 a , ex cep t n o su rv iv o r b en efit w h a tso ev er
B en efit in c rease fro m su rv iv o r/ sp o u se rem o v a l is h ig h er th an in 1 a .
A s in 1 a , ex cep t fo r su rv iv o r p ro v is io n s as in d ica ted .
1 c
E arn in g s sh a rin g w ith se lf-fin an c in g su rv iv o rs ' b en efits , g lo b a l b en efit in crease o f 4 .5 p e rcen t
S am e as 1 b , ex cep t req u ire p eo p le m arried a t th e tim e o f en titlem en t to "p u rch ase" su rv iv o r in su ran ce (2 /3 o f o w n b en efit) th ro u g h a b en efit red u ctio n .
A s in 1 b .
A s in 1 a , p lu s an n u ity p riced o n u n isex b asis u s in g in d iv id u al- an d sp o u se -sp ec ific co h o rt ra tes fo r se lf an d sp o u se . In te rest ra te fo r an n u ity is 4 .6 p e rcen t rea l. W h en sp o u ses a re d iffe ren t ag es an d /o r tak e u p in d iffe ren t y ea rs , w e n o n e th e less m an d a te p u rch ase a t tim e o f firs t co llec tio n . T h e sam e is tru e in cases o f d isab ility .
2 M in im u m b en efit to p h ase o u t sp o u se b en efit
M in im u m b en efit p ro v id es 6 0 p e rcen t o f p o v erty a t 2 0 y ea rs o f w o rk (d efin ed b ased o n 4 co v ered q u arte rs ), in c reas in g b y tw o p ercen t p er y ea r th ro u g h each ad d itio n a l w o rk y ea r u p to 4 0 ; is w ag e-in d ex ed s ta rtin g in 2 0 0 8 .
R ed u ce sp o u sa l b en efit to 1 2 .5 p e rcen t o f P IA .
W o rk y ears req u irem en ts fo r th e m in im u m b en efit a re p ro -ra ted fo r th o se o n D I. M in im u m is a ttach ed to P IA ca lcu la tio n s, so ac tu a ria l red u c tio n s ap p ly .
3 C areg iv e r c red its to p h ase o u t sp o u se b en efit
U p to 5 y ea rs p e r ch ild , w ith a m ax im u m o f 7 y ears w ith m o re th an o n e ch ild . C red it eq u als u p to h a lf th e av e rag e w ag e (le ss fo r p aren ts w ith n o n -zero ea rn in g s, w h o rece iv e a to p u p to th a t lev e l) .
R ed u ce sp o u se b en efit to ze ro .
A p p lied to th e firs t y ears a fte r ch ild 's b irth w h en ea rn in g s a re b e lo w c red it (n o t y ears w ith m ax im u m c red it) . Y ears req u ired to b e w h en th e ch ild is y o u n g . L im it o n e p e r co u p le (cu rren tly ap p lied to w iv es firs t, w ill ex p an d in la te r d raft) .
N o tes : In a ll cases , th e im p lem en ta tio n tak es e ffec t in 2 0 0 7 , an d o n ly fo r th o se firs t en titled to O A S D I th a t y ea r o r la te r. (O ld e r c o h o rts a re g ran d fa th e red in to th e o ld sy stem , an d m ay n o t b e e lig ib le to rece iv e en h an cem en ts , lik e a m in im u m b en efit o r g lo b al b en efit h ik e .)
23
Table 3. Winners and Losers (Relative to Current Law Scheduled) Among Current Law Beneficiaries Under the Options in 2049, By Sex and Marital Status in that Year
Source: Authors’ tabulations from the Urban Institute’s DYNASIM model (runid: 440v2). All estimates in this paper are preliminary. Please consult working paper version of this research on the Center for Retirement Research website for final estimates. Notes: Benefits include both OASI and DI for adults. For married people, we consider spouses’ benefits to be shared.
Men Women Men Women Men Women Men Women Men WomenMarried
lose >=20% 7.4 4.5 18.1 8.4 9.7 7.4 4.4 5.7 3.6 4.6lose 10-19.99% 9.4 6.0 19.9 7.6 23.7 24.9 4.0 5.0 4.3 5.5lose 5-9.99% 9.9 8.6 11.2 6.1 25.1 28.2 3.9 5.0 4.9 6.3lose < 5 % 16.7 17.6 10.3 6.6 14.3 14.7 6.0 7.7 6.1 7.9no change 0.2 0.0 0.0 0.0 0.0 9.1 67.3 61.0 56.3 34.2gain < 5% 25.0 28.2 11.1 11.0 10.3 9.1 4.9 5.8 21.6 31.7gain 5-9.99% 12.1 13.6 6.0 6.5 4.2 3.0 2.8 3.3 1.7 4.2gain 10-19.99% 9.0 10.0 6.5 9.7 3.4 2.7 2.8 3.0 0.8 2.9gain >=20% 10.2 11.5 17.0 44.1 9.5 10.0 3.9 3.5 0.6 2.7All 100.0 100.0 100.0 100.0 100.0 100.0 100.0 100.0 100.0 100.0
Divorced lose >=20% 5.6 3.0 7.6 9.2 6.0 3.2 1.3 3.5 2.3 3.3lose 10-19.99% 12.5 7.2 11.8 4.7 10.0 6.0 1.0 1.5 1.1 1.8lose 5-9.99% 12.5 6.0 10.1 3.7 9.9 5.2 0.3 0.7 0.1 1.1lose < 5 % 19.1 12.2 15.1 7.3 16.3 8.3 0.9 0.8 0.8 0.9no change 0.4 0.6 0.1 0.0 0.0 0.0 84.6 83.2 95.4 59.1gain < 5% 32.4 32.5 34.4 30.4 34.7 31.0 2.4 1.5 0.3 17.6gain 5-9.99% 7.5 12.9 9.8 16.3 9.9 16.6 1.8 1.9 0.0 8.1gain 10-19.99% 4.6 9.6 5.7 11.5 6.3 12.0 2.6 2.0 0.0 3.5gain >=20% 5.4 16.2 5.6 16.9 7.0 17.8 5.2 4.9 0.0 4.5All 100.0 100.0 100.0 100.0 100.0 100.0 100.0 100.0 100.0 100.0
Widowed lose >=20% 19.6 15.3 35.6 38.3 5.8 5.3 0.1 0.1 0.1 0.2lose 10-19.99% 29.9 24.2 28.6 17.4 9.7 8.0 0.1 0.1 0.1 0.1lose 5-9.99% 16.3 16.0 14.3 11.0 8.0 7.2 0.1 0.1 0.2 0.0lose < 5 % 12.3 16.0 10.0 10.2 8.3 7.7 0.0 0.1 0.0 0.1no change 0.2 1.7 0.0 0.0 0.0 0.0 89.9 92.9 94.3 85.4gain < 5% 11.7 15.2 7.2 12.0 8.8 13.5 5.9 3.0 5.0 9.9gain 5-9.99% 4.9 5.7 2.0 5.5 6.9 8.0 1.0 0.7 0.4 2.4gain 10-19.99% 3.4 4.0 1.7 3.9 13.2 11.9 1.4 1.2 0.0 1.1gain >=20% 1.8 1.9 0.8 1.7 39.3 38.4 1.6 1.9 0.0 0.9All 100.0 100.0 100.0 100.0 100.0 100.0 100.0 100.0 100.0 100.0
Never Marriedlose >=20% 0.0 0.0 0.0 0.0 0.0 0.0 0.0 0.0 0.0 0.0lose 10-19.99% 0.0 0.0 0.1 0.0 0.1 0.0 0.0 0.0 0.0 0.0lose 5-9.99% 0.0 0.0 0.0 0.0 0.0 0.0 0.0 0.0 0.0 0.0lose < 5 % 0.0 0.0 0.0 0.0 0.0 0.0 0.0 0.0 0.0 0.1no change 2.3 4.1 0.0 0.0 0.0 0.0 85.1 85.2 100.0 64.5gain < 5% 96.3 95.1 97.4 98.7 97.4 98.7 2.6 2.2 0.0 12.7gain 5-9.99% 0.9 0.4 2.0 0.9 2.0 0.9 1.4 1.9 0.0 9.2gain 10-19.99% 0.3 0.2 0.3 0.3 0.3 0.3 3.2 2.5 0.0 5.5gain >=20% 0.3 0.2 0.3 0.2 0.3 0.2 7.8 8.1 0.0 8.0All 100.0 100.0 100.0 100.0 100.0 100.0 100.0 100.0 100.0 100.0
Package 1b: Earnings sharing, no spouse ben, no survivor ben, 4.5 percent increase
Package 2: .125 spouse benefit, wage-indexed
minimum benefit (100% poverty at
40 work years)
Package 3: Up to 7 caregiver
credits (up to 0.5 * avg wage), no spouse benefit
Package 1a: Earnings sharing,
no spouse ben, survivor =
maximum shared vector, 2.7
percent increase
Package 1c: As in 1b ( Earnings
sharing, no spouse ben, 4.5 increase), only self-financed survivor ben

24
Table 4. Average Ratio of Lifetime Social Security Benefits to Payroll Tax Contributions by Relative Lifetime Earnings of Spouses (within Lifetime Tax Groups) for Married
Persons born 1960 through 1980
Source: Authors’ tabulations from the Urban Institute’s DYNASIM model (runid: 440v2). All estimates in this paper are preliminary. Please consult working paper version of this research on the Center for Retirement Research website for final estimates. Notes: Table includes individuals born 1960 to 1980 who survive to at least age 30. Benefit and tax totals are computed on a couple basis for married people. We apply a discount rate of 2 percent to both taxes and benefits, and evaluate in the year an individual turns 65. Lifetime earnings are defined from age 22 to age 62 (for former spouses, they are defined based on when the beneficiary was 22 to 62). PV=present value.
Fraction of total lifetime earnings (ages 22 to 62) each spouse earned (lower earner fraction)
Current Law Scheduled
Package 1a: Earnings
sharing, no spouse ben, survivor = maximum
shared vector, 2.7 percent
increase
Package 1b: Earnings
sharing, no spouse ben, no survivor
ben, 4.5 percent increase
Package 1c: Earnings
sharing, no spouse ben, only self-financed
survivor ben
Package 2: .125 spouse
benefit, wage-indexed
minimum benefit (100% of poverty at
40 work years)
Package 3: Up to 7
caregiver credits (up to
0.5 * avg wage), no
spouse benefit
Single earner 1.65 1.52 1.47 1.58 1.57 1.56V. highly skewed (<.10) 1.34 1.24 1.19 1.26 1.26 1.26Highly skewed (.10-.199) 1.46 1.38 1.33 1.42 1.44 1.43Moderately skewed (.20-.33) 1.38 1.36 1.30 1.40 1.39 1.38Approaching close (.33-.4499) 1.34 1.35 1.31 1.38 1.35 1.34Close (.45-.4799) 1.45 1.46 1.42 1.47 1.45 1.46Very close (.48-.50) 1.40 1.42 1.35 1.46 1.40 1.39
Single earner 1.23 1.14 1.15 1.17 1.16 1.13V. highly skewed (<.10) 1.09 1.05 1.04 1.05 1.03 1.04Highly skewed (.10-.199) 1.09 1.05 1.02 1.06 1.07 1.06Moderately skewed (.20-.33) 1.08 1.06 1.04 1.09 1.08 1.08Approaching close (.33-.4499) 1.11 1.11 1.10 1.13 1.11 1.12Close (.45-.4799) 1.21 1.22 1.19 1.25 1.21 1.22Very close (.48-.50) 1.11 1.12 1.11 1.14 1.11 1.11
PV of lifetime payroll tax 350-399k
Single earner 1.11 1.06 1.06 1.06 1.06 1.05V. highly skewed (<.10) 0.96 0.93 0.94 0.95 0.92 0.92Highly skewed (.10-.199) 0.95 0.96 0.96 0.96 0.93 0.93Moderately skewed (.20-.33) 0.95 0.96 0.96 0.98 0.95 0.95Approaching close (.33-.4499) 0.93 0.94 0.93 0.96 0.93 0.93Close (.45-.4799) 0.98 0.98 0.98 1.00 0.98 0.98Very close (.48-.50) 0.97 0.98 0.98 0.99 0.97 0.97
PV of lifetime payroll tax 150-199k
PV of lifetime payroll tax 250-299k

25
Table 5. Poverty Impacts of the Options: Percent of Adult Current Law Scheduled OASDI Beneficiaries with Income Below Poverty in Year 2049
Source: Authors’ tabulations from the Urban Institute’s DYNASIM model (runid: 440v2). All estimates in this paper are preliminary. Please consult working paper version of this research on the Center for Retirement Research website for final estimates. Notes: Sample includes DI worker beneficiaries ages 25 and older and OASI beneficiaries ages 62 and older. For married couples, benefits are shared. Computations use aged poverty thresholds for both older (age 65+) and younger beneficiaries.
Figure 1. Percentage of Aggregate Social Security Benefits for Adults by Type, 2004 (Excludes DACs)
66.0%
13.9%
4.8%
10.3%
0.3%
1.3%
3.1%
0.1%
0.3%
Retired workers, incl worker part DEs
Disabled workers
Dual survivor secondary portion
Nondisabled widow(er)s
Disabled widow(er)s
Dual spouse secondary portion
Wives/husbands of retired workers
Wives/husbands of disabled workers
Mothers and fathers
Source: Authors' calculations based on Tables 5.A16 and 5.G3 from Social Security Administration (2006a)Notes: DE=Dual Entitlees, DACs=Disabled Adult Children
Current Law Scheduled
Package 1a: Earnings
sharing, no spouse ben, survivor = maximum
shared vector, 2.7 percent
increase
Package 1b: Earnings
sharing, no spouse ben, no survivor
ben, 4.5 percent increase
Package 1c: Earnings
sharing, no spouse ben, only self-financed
survivor ben
Package 2: .125 spouse
benefit, wage-indexed
minimum benefit (100% of poverty at
40 work years)
Package 3: Up to 7
caregiver credits (up to
0.5 * avg wage), no
spouse benefit
All Women 5.43 5.16 6.01 4.88 4.98 4.87 Married, spouse beneficiary 1.97 1.14 1.14 1.14 1.67 1.29 Married, spouse not beneficiary 3.73 3.73 3.71 3.86 3.70 3.73 Never married 8.06 7.42 7.13 7.13 6.03 5.40 Divorced 7.83 6.23 7.10 5.95 7.65 7.03 Widowed 5.90 6.31 8.87 5.47 5.47 5.72
All Men 4.89 4.74 4.89 4.68 4.17 4.96
All People 5.17 4.96 5.48 4.79 4.59 4.91