social security: ssi children06
TRANSCRIPT
8/14/2019 Social Security: ssi children06
http://slidepdf.com/reader/full/social-security-ssi-children06 1/42
Year All ages
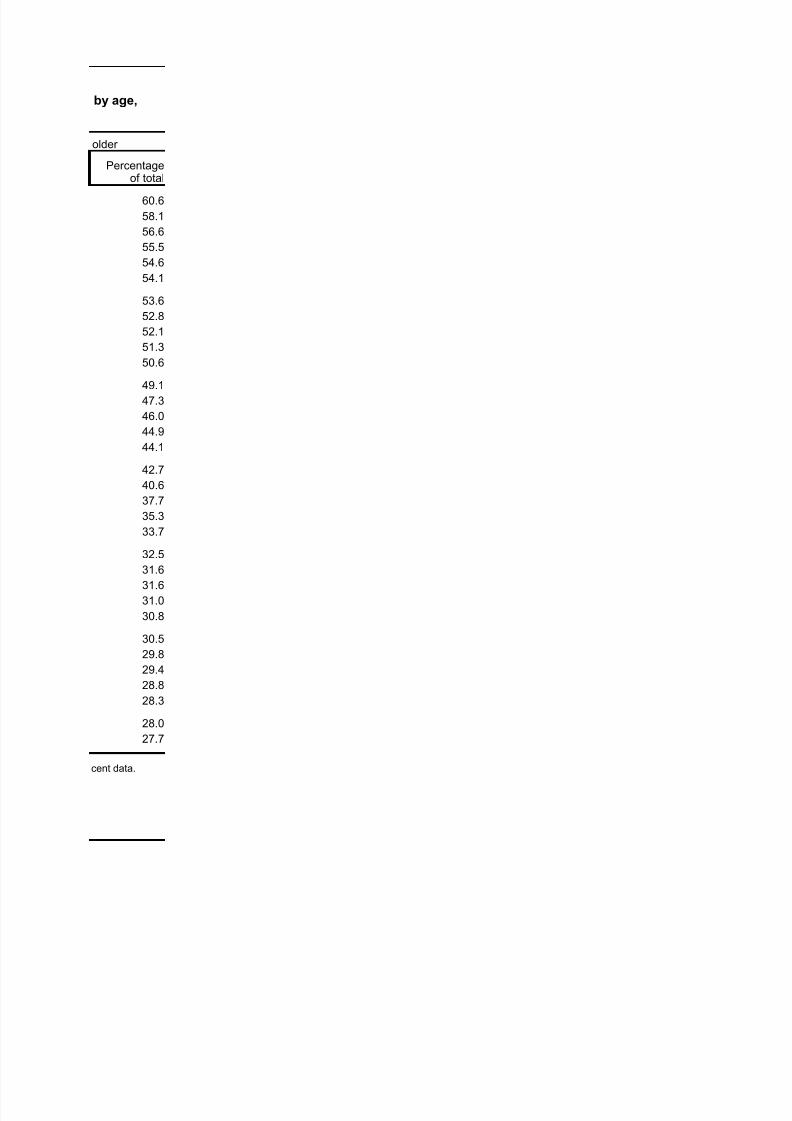
65 or
Number Number Number
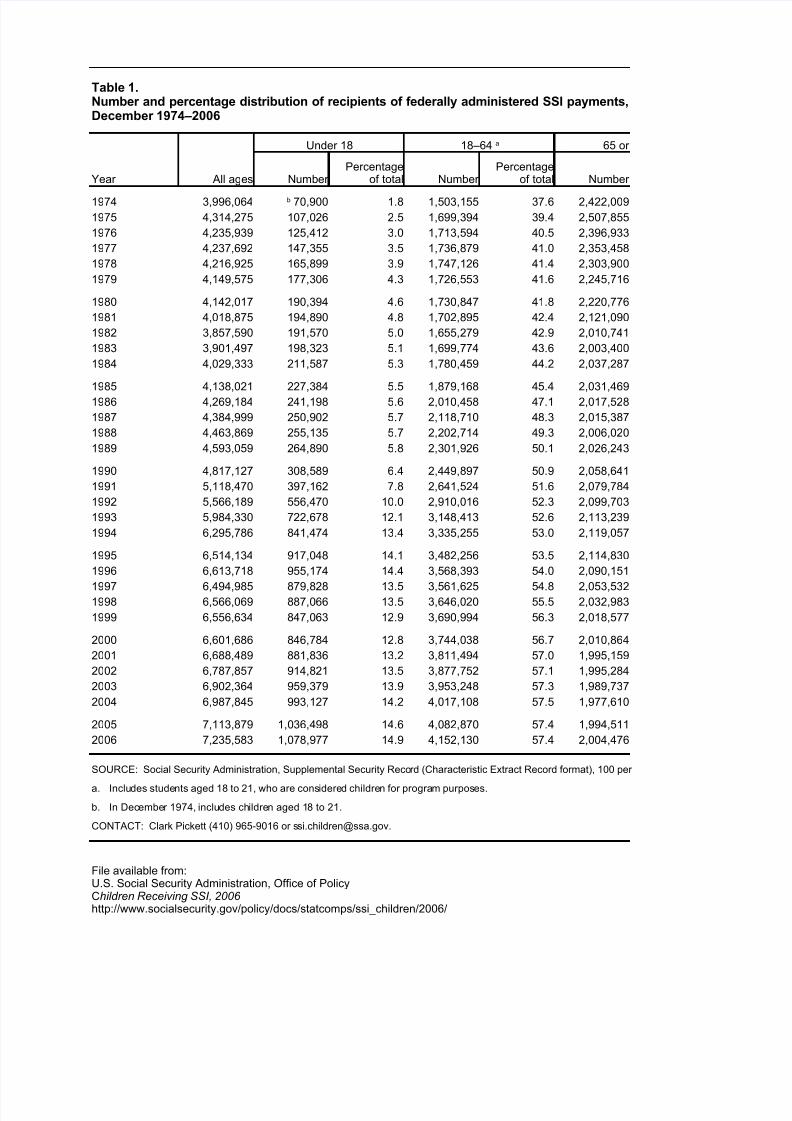
1974 3,996,064 1.8 1,503,155 37.6 2,422,009
1975 4,314,275 107,026 2.5 1,699,394 39.4 2,507,855
1976 4,235,939 125,412 3.0 1,713,594 40.5 2,396,933
1977 4,237,692 147,355 3.5 1,736,879 41.0 2,353,458
1978 4,216,925 165,899 3.9 1,747,126 41.4 2,303,900
1979 4,149,575 177,306 4.3 1,726,553 41.6 2,245,716
1980 4,142,017 190,394 4.6 1,730,847 41.8 2,220,776
1981 4,018,875 194,890 4.8 1,702,895 42.4 2,121,090
1982 3,857,590 191,570 5.0 1,655,279 42.9 2,010,741
1983 3,901,497 198,323 5.1 1,699,774 43.6 2,003,400
1984 4,029,333 211,587 5.3 1,780,459 44.2 2,037,287
1985 4,138,021 227,384 5.5 1,879,168 45.4 2,031,4691986 4,269,184 241,198 5.6 2,010,458 47.1 2,017,528
1987 4,384,999 250,902 5.7 2,118,710 48.3 2,015,387
1988 4,463,869 255,135 5.7 2,202,714 49.3 2,006,020
1989 4,593,059 264,890 5.8 2,301,926 50.1 2,026,243
1990 4,817,127 308,589 6.4 2,449,897 50.9 2,058,641
1991 5,118,470 397,162 7.8 2,641,524 51.6 2,079,784
1992 5,566,189 556,470 10.0 2,910,016 52.3 2,099,703
1993 5,984,330 722,678 12.1 3,148,413 52.6 2,113,239
1994 6,295,786 841,474 13.4 3,335,255 53.0 2,119,057
1995 6,514,134 917,048 14.1 3,482,256 53.5 2,114,830
1996 6,613,718 955,174 14.4 3,568,393 54.0 2,090,151
1997 6,494,985 879,828 13.5 3,561,625 54.8 2,053,532
1998 6,566,069 887,066 13.5 3,646,020 55.5 2,032,983
1999 6,556,634 847,063 12.9 3,690,994 56.3 2,018,577
2000 6,601,686 846,784 12.8 3,744,038 56.7 2,010,864
2001 6,688,489 881,836 13.2 3,811,494 57.0 1,995,159
2002 6,787,857 914,821 13.5 3,877,752 57.1 1,995,284
2003 6,902,364 959,379 13.9 3,953,248 57.3 1,989,737
2004 6,987,845 993,127 14.2 4,017,108 57.5 1,977,610
2005 7,113,879 1,036,498 14.6 4,082,870 57.4 1,994,511
2006 7,235,583 1,078,977 14.9 4,152,130 57.4 2,004,476
SOURCE: Social Security Administration, Supplemental Security Record (Characteristic Extract Record format), 100 per a. Includes students aged 18 to 21, who are considered children for program purposes.
b. In December 1974, includes children aged 18 to 21.
CONTACT: Clark Pickett (410) 965-9016 or [email protected].
Table 1.Number and percentage distribution of recipients of federally administered SSI payments,December 1974–2006
Under 18 18–64 a
Percentageof total
Percentageof total
b 70,900
File available from:U.S. Social Security Administration, Office of PolicyChildren Receiving SSI, 2006 http://www.socialsecurity.gov/policy/docs/statcomps/ssi_children/2006/
8/14/2019 Social Security: ssi children06
http://slidepdf.com/reader/full/social-security-ssi-children06 2/42
older
60.6
58.1
56.6
55.5
54.6
54.1
53.6
52.8
52.1
51.3
50.6
49.147.3
46.0
44.9
44.1
42.7
40.6
37.7
35.3
33.7
32.5
31.6
31.6
31.0
30.8
30.5
29.8
29.4
28.8
28.3
28.0
27.7
cent data.
by age,
Percentageof total
8/14/2019 Social Security: ssi children06
http://slidepdf.com/reader/full/social-security-ssi-children06 3/42
Year
18–64 65 or
Number Number Number
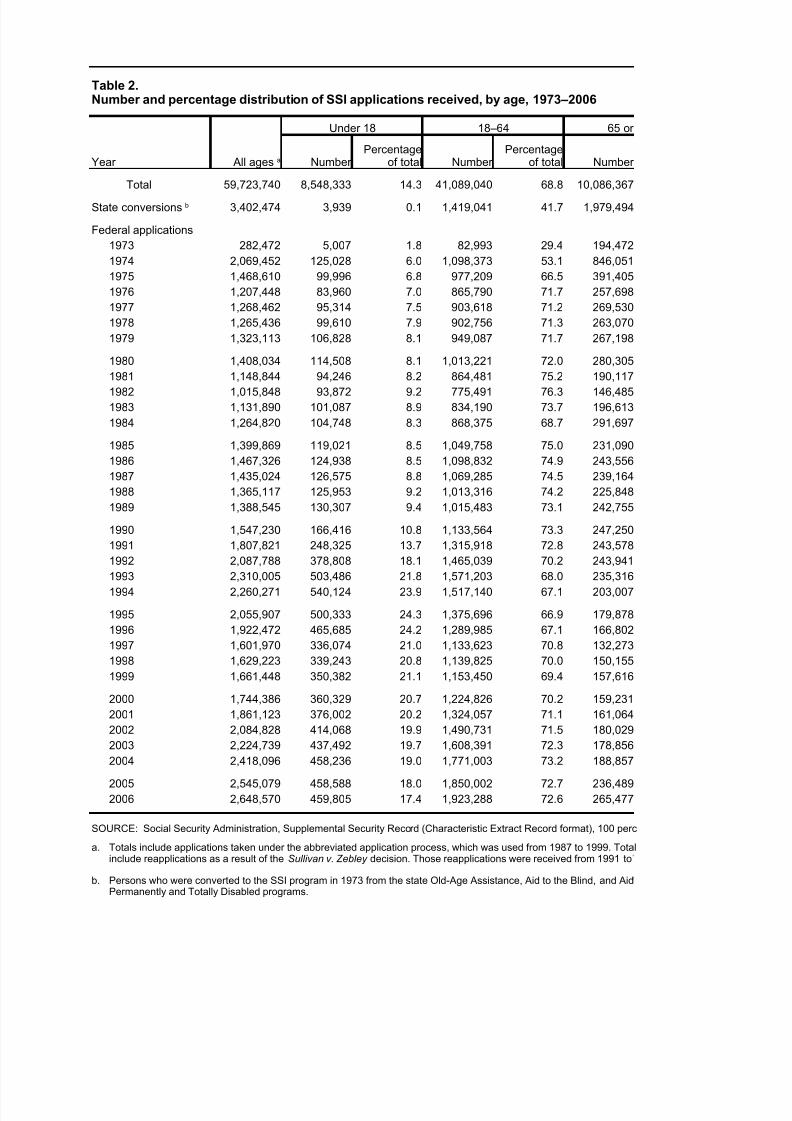
Total 59,723,740 8,548,333 14.3 41,089,040 68.8 10,086,367
3,402,474 3,939 0.1 1,419,041 41.7 1,979,494
Federal applications
1973 282,472 5,007 1.8 82,993 29.4 194,472
1974 2,069,452 125,028 6.0 1,098,373 53.1 846,051
1975 1,468,610 99,996 6.8 977,209 66.5 391,405
1976 1,207,448 83,960 7.0 865,790 71.7 257,698
1977 1,268,462 95,314 7.5 903,618 71.2 269,530
1978 1,265,436 99,610 7.9 902,756 71.3 263,070
1979 1,323,113 106,828 8.1 949,087 71.7 267,198
1980 1,408,034 114,508 8.1 1,013,221 72.0 280,305
1981 1,148,844 94,246 8.2 864,481 75.2 190,117
1982 1,015,848 93,872 9.2 775,491 76.3 146,485
1983 1,131,890 101,087 8.9 834,190 73.7 196,613
1984 1,264,820 104,748 8.3 868,375 68.7 291,697
1985 1,399,869 119,021 8.5 1,049,758 75.0 231,090
1986 1,467,326 124,938 8.5 1,098,832 74.9 243,556
1987 1,435,024 126,575 8.8 1,069,285 74.5 239,164
1988 1,365,117 125,953 9.2 1,013,316 74.2 225,848
1989 1,388,545 130,307 9.4 1,015,483 73.1 242,755
1990 1,547,230 166,416 10.8 1,133,564 73.3 247,250
1991 1,807,821 248,325 13.7 1,315,918 72.8 243,578
1992 2,087,788 378,808 18.1 1,465,039 70.2 243,941
1993 2,310,005 503,486 21.8 1,571,203 68.0 235,3161994 2,260,271 540,124 23.9 1,517,140 67.1 203,007
1995 2,055,907 500,333 24.3 1,375,696 66.9 179,878
1996 1,922,472 465,685 24.2 1,289,985 67.1 166,802
1997 1,601,970 336,074 21.0 1,133,623 70.8 132,273
1998 1,629,223 339,243 20.8 1,139,825 70.0 150,155
1999 1,661,448 350,382 21.1 1,153,450 69.4 157,616
2000 1,744,386 360,329 20.7 1,224,826 70.2 159,231
2001 1,861,123 376,002 20.2 1,324,057 71.1 161,064
2002 2,084,828 414,068 19.9 1,490,731 71.5 180,029
2003 2,224,739 437,492 19.7 1,608,391 72.3 178,856
2004 2,418,096 458,236 19.0 1,771,003 73.2 188,857
2005 2,545,079 458,588 18.0 1,850,002 72.7 236,489
2006 2,648,570 459,805 17.4 1,923,288 72.6 265,477
SOURCE: Social Security Administration, Supplemental Security Record (Characteristic Extract Record format), 100 perc
a.
b.
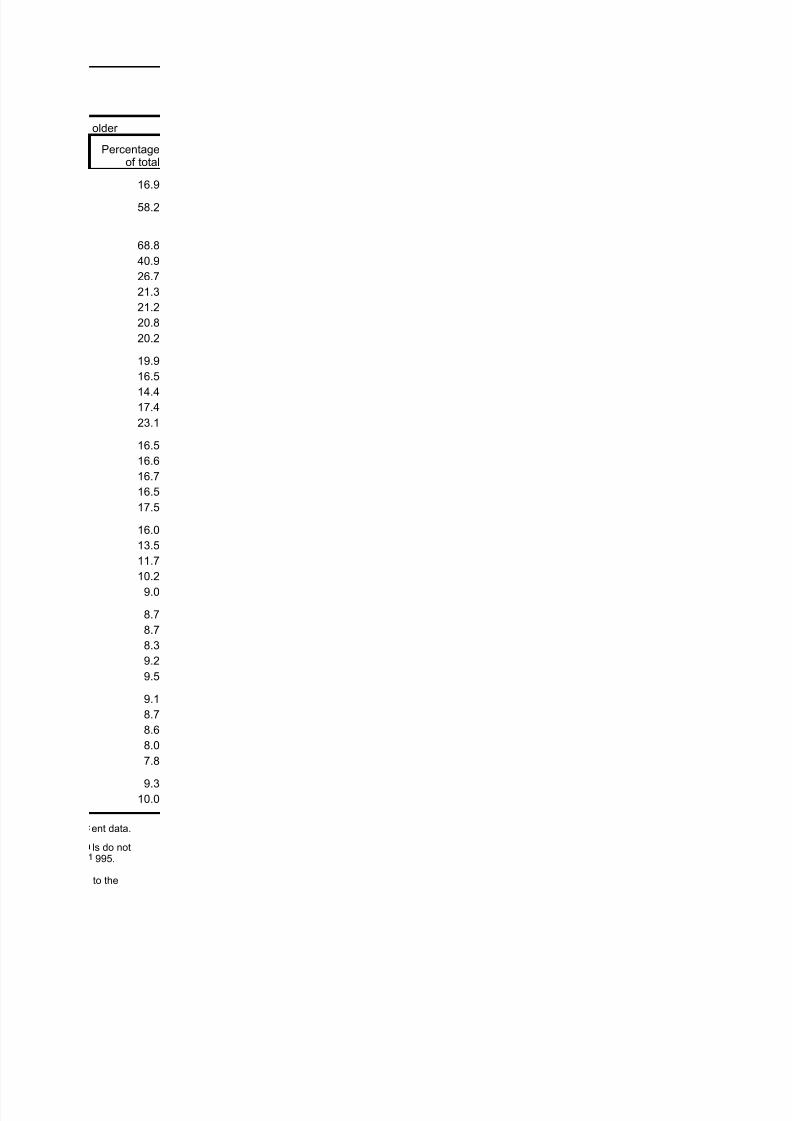
Table 2.Number and percentage distribution of SSI applications received, by age, 1973–2006
All ages a
Under 18
Percentageof total
Percentageof total
State conversions b
Totals include applications taken under the abbreviated application process, which was used from 1987 to 1999. Totalinclude reapplications as a result of the Sullivan v. Zebley decision. Those reapplications were received from 1991 to
Persons who were converted to the SSI program in 1973 from the state Old-Age Assistance, Aid to the Blind, and AidPermanently and Totally Disabled programs.

8/14/2019 Social Security: ssi children06
http://slidepdf.com/reader/full/social-security-ssi-children06 4/42
CONTACT: Clark Pickett (410) 965-9016 or [email protected].
File available from:U.S. Social Security Administration, Office of PolicyChildren Receiving SSI, 2006 http://www.socialsecurity.gov/policy/docs/statcomps/ssi_children/2006/
8/14/2019 Social Security: ssi children06
http://slidepdf.com/reader/full/social-security-ssi-children06 5/42
older
16.9
58.2
68.8
40.9
26.7
21.3
21.2
20.8
20.2
19.9
16.5
14.4
17.4
23.1
16.5
16.6
16.7
16.5
17.5
16.0
13.5
11.7
10.29.0
8.7
8.7
8.3
9.2
9.5
9.1
8.7
8.6
8.0
7.8
9.3
10.0
ent data.
Percentageof total
ls do not995.
to the

8/14/2019 Social Security: ssi children06
http://slidepdf.com/reader/full/social-security-ssi-children06 6/42
8/14/2019 Social Security: ssi children06
http://slidepdf.com/reader/full/social-security-ssi-children06 7/42
Year All ages
18–64 65 or
Number Number Number
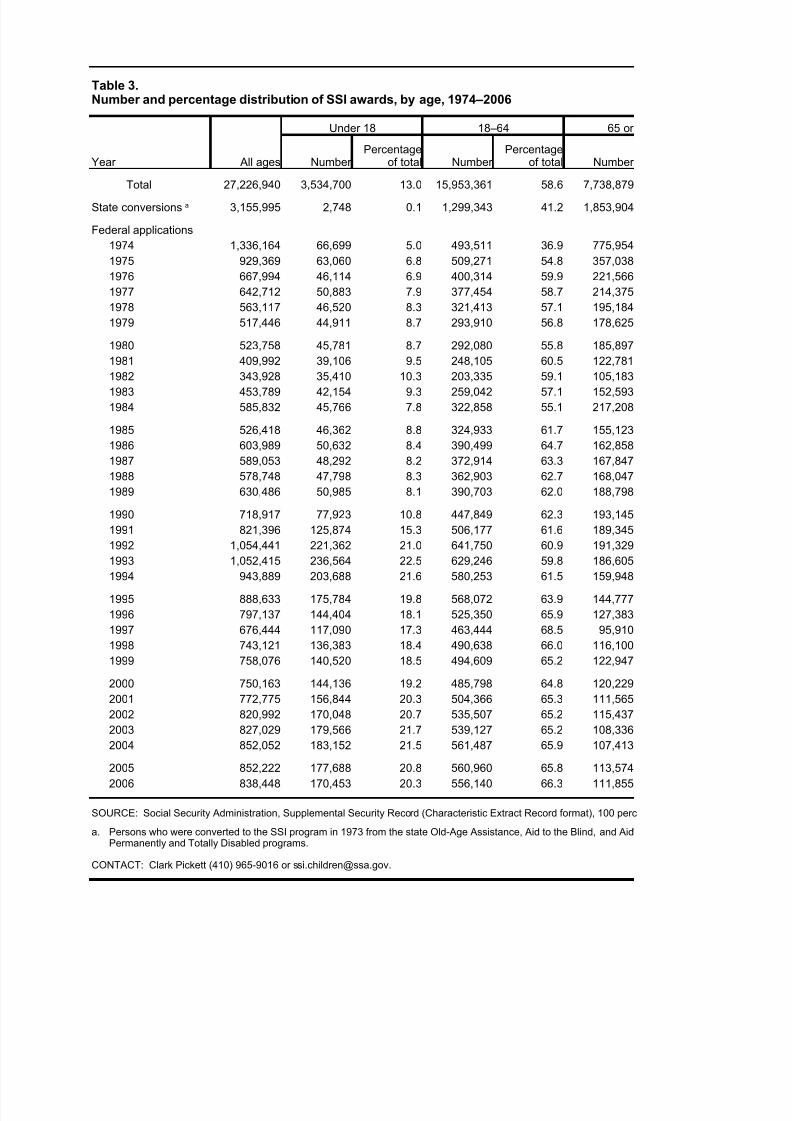
Total 27,226,940 3,534,700 13.0 15,953,361 58.6 7,738,879
3,155,995 2,748 0.1 1,299,343 41.2 1,853,904
Federal applications
1974 1,336,164 66,699 5.0 493,511 36.9 775,954
1975 929,369 63,060 6.8 509,271 54.8 357,038
1976 667,994 46,114 6.9 400,314 59.9 221,566
1977 642,712 50,883 7.9 377,454 58.7 214,375
1978 563,117 46,520 8.3 321,413 57.1 195,184
1979 517,446 44,911 8.7 293,910 56.8 178,625
1980 523,758 45,781 8.7 292,080 55.8 185,897
1981 409,992 39,106 9.5 248,105 60.5 122,781
1982 343,928 35,410 10.3 203,335 59.1 105,183
1983 453,789 42,154 9.3 259,042 57.1 152,593
1984 585,832 45,766 7.8 322,858 55.1 217,208
1985 526,418 46,362 8.8 324,933 61.7 155,123
1986 603,989 50,632 8.4 390,499 64.7 162,858
1987 589,053 48,292 8.2 372,914 63.3 167,847
1988 578,748 47,798 8.3 362,903 62.7 168,047
1989 630,486 50,985 8.1 390,703 62.0 188,798
1990 718,917 77,923 10.8 447,849 62.3 193,145
1991 821,396 125,874 15.3 506,177 61.6 189,345
1992 1,054,441 221,362 21.0 641,750 60.9 191,329
1993 1,052,415 236,564 22.5 629,246 59.8 186,605
1994 943,889 203,688 21.6 580,253 61.5 159,948
1995 888,633 175,784 19.8 568,072 63.9 144,777
1996 797,137 144,404 18.1 525,350 65.9 127,383
1997 676,444 117,090 17.3 463,444 68.5 95,910
1998 743,121 136,383 18.4 490,638 66.0 116,100
1999 758,076 140,520 18.5 494,609 65.2 122,947
2000 750,163 144,136 19.2 485,798 64.8 120,229
2001 772,775 156,844 20.3 504,366 65.3 111,565
2002 820,992 170,048 20.7 535,507 65.2 115,437
2003 827,029 179,566 21.7 539,127 65.2 108,336
2004 852,052 183,152 21.5 561,487 65.9 107,413
2005 852,222 177,688 20.8 560,960 65.8 113,5742006 838,448 170,453 20.3 556,140 66.3 111,855
SOURCE: Social Security Administration, Supplemental Security Record (Characteristic Extract Record format), 100 perc
a.
CONTACT: Clark Pickett (410) 965-9016 or [email protected].
Table 3.Number and percentage distribution of SSI awards, by age, 1974–2006
Under 18
Percentageof total
Percentageof total
State conversions a
Persons who were converted to the SSI program in 1973 from the state Old-Age Assistance, Aid to the Blind, and AidPermanently and Totally Disabled programs.
8/14/2019 Social Security: ssi children06
http://slidepdf.com/reader/full/social-security-ssi-children06 8/42
File available from:U.S. Social Security Administration, Office of PolicyChildren Receiving SSI, 2006 http://www.socialsecurity.gov/policy/docs/statcomps/ssi_children/2006/

8/14/2019 Social Security: ssi children06
http://slidepdf.com/reader/full/social-security-ssi-children06 9/42
older
28.4
58.7
58.1
38.4
33.2
33.4
34.7
34.5
35.5
29.9
30.6
33.6
37.1
29.5
27.0
28.5
29.0
29.9
26.9
23.1
18.1
17.7
16.9
16.3
16.0
14.2
15.6
16.2
16.0
14.4
14.1
13.1
12.6
13.313.3
ent data.
Percentageof total
to the

8/14/2019 Social Security: ssi children06
http://slidepdf.com/reader/full/social-security-ssi-children06 10/42
8/14/2019 Social Security: ssi children06
http://slidepdf.com/reader/full/social-security-ssi-children06 11/42
Characteristic
Applications Aw
Number Number
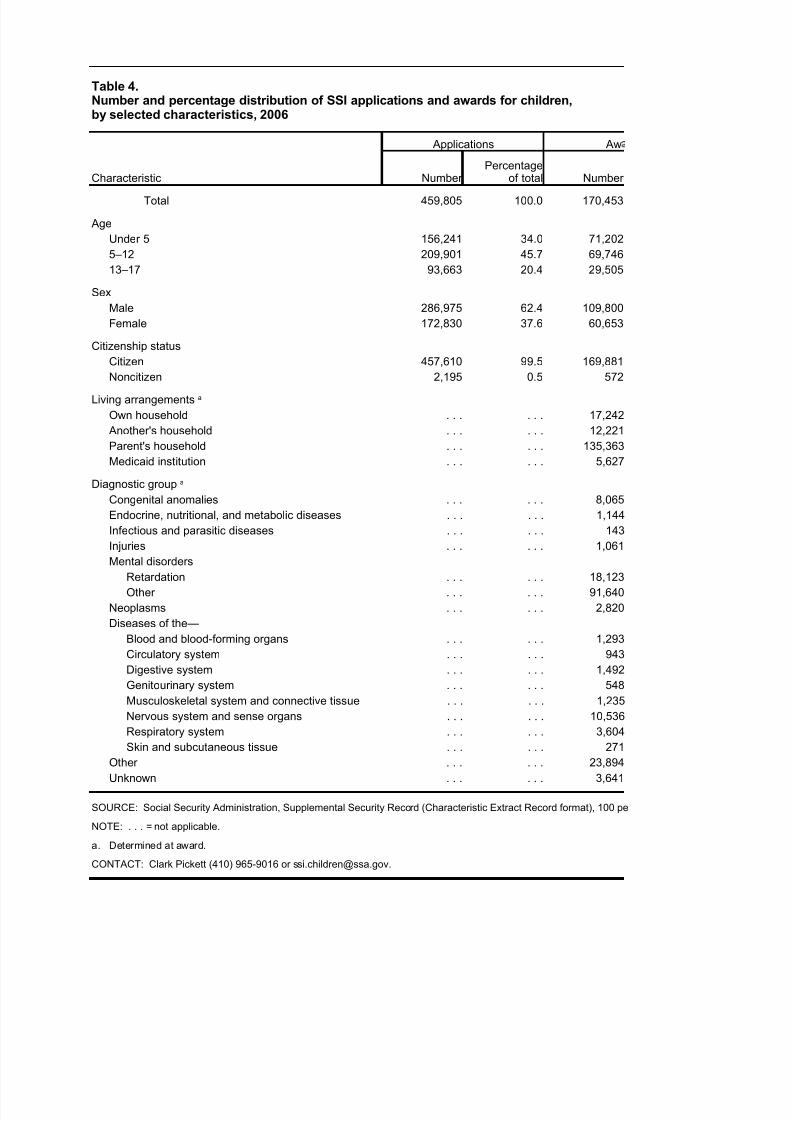
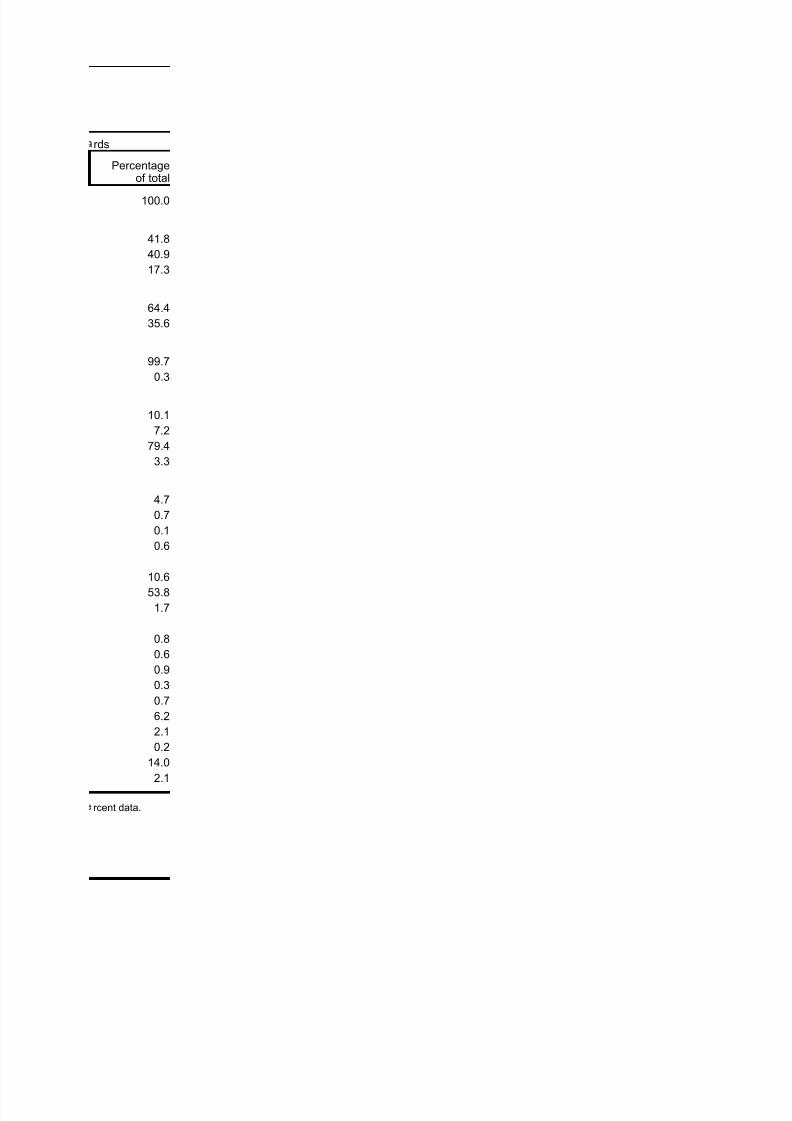
Total 459,805 100.0 170,453
Age
Under 5 156,241 34.0 71,202
5–12 209,901 45.7 69,746
13–17 93,663 20.4 29,505
Sex
Male 286,975 62.4 109,800
Female 172,830 37.6 60,653
Citizenship status
Citizen 457,610 99.5 169,881
Noncitizen 2,195 0.5 572
Own household . . . . . . 17,242
Another's household . . . . . . 12,221
Parent's household . . . . . . 135,363
Medicaid institution . . . . . . 5,627
Congenital anomalies . . . . . . 8,065
Endocrine, nutritional, and metabolic diseases . . . . . . 1,144
Infectious and parasitic diseases . . . . . . 143
Injuries . . . . . . 1,061
Mental disorders
Retardation . . . . . . 18,123Other . . . . . . 91,640
Neoplasms . . . . . . 2,820
Diseases of the—
Blood and blood-forming organs . . . . . . 1,293
Circulatory system . . . . . . 943
Digestive system . . . . . . 1,492
Genitourinary system . . . . . . 548
Musculoskeletal system and connective tissue . . . . . . 1,235
Nervous system and sense organs . . . . . . 10,536
Respiratory system . . . . . . 3,604
Skin and subcutaneous tissue . . . . . . 271
Other . . . . . . 23,894
Unknown . . . . . . 3,641
SOURCE: Social Security Administration, Supplemental Security Record (Characteristic Extract Record format), 100 pe
NOTE: . . . = not applicable.
a. Determined at award.
CONTACT: Clark Pickett (410) 965-9016 or [email protected].
Table 4.Number and percentage distribution of SSI applications and awards for children,by selected characteristics, 2006
Percentageof total
Living arrangements a
Diagnostic group a

8/14/2019 Social Security: ssi children06
http://slidepdf.com/reader/full/social-security-ssi-children06 12/42
File available from:U.S. Social Security Administration, Office of PolicyChildren Receiving SSI, 2006 http://www.socialsecurity.gov/policy/docs/statcomps/ssi_children/2006/
8/14/2019 Social Security: ssi children06
http://slidepdf.com/reader/full/social-security-ssi-children06 13/42
rds
100.0
41.8
40.9
17.3
64.4
35.6
99.7
0.3
10.1
7.2
79.4
3.3
4.7
0.7
0.1
0.6
10.653.8
1.7
0.8
0.6
0.9
0.3
0.7
6.2
2.1
0.2
14.0
2.1
rcent data.
Percentageof total

8/14/2019 Social Security: ssi children06
http://slidepdf.com/reader/full/social-security-ssi-children06 14/42
8/14/2019 Social Security: ssi children06
http://slidepdf.com/reader/full/social-security-ssi-children06 15/42
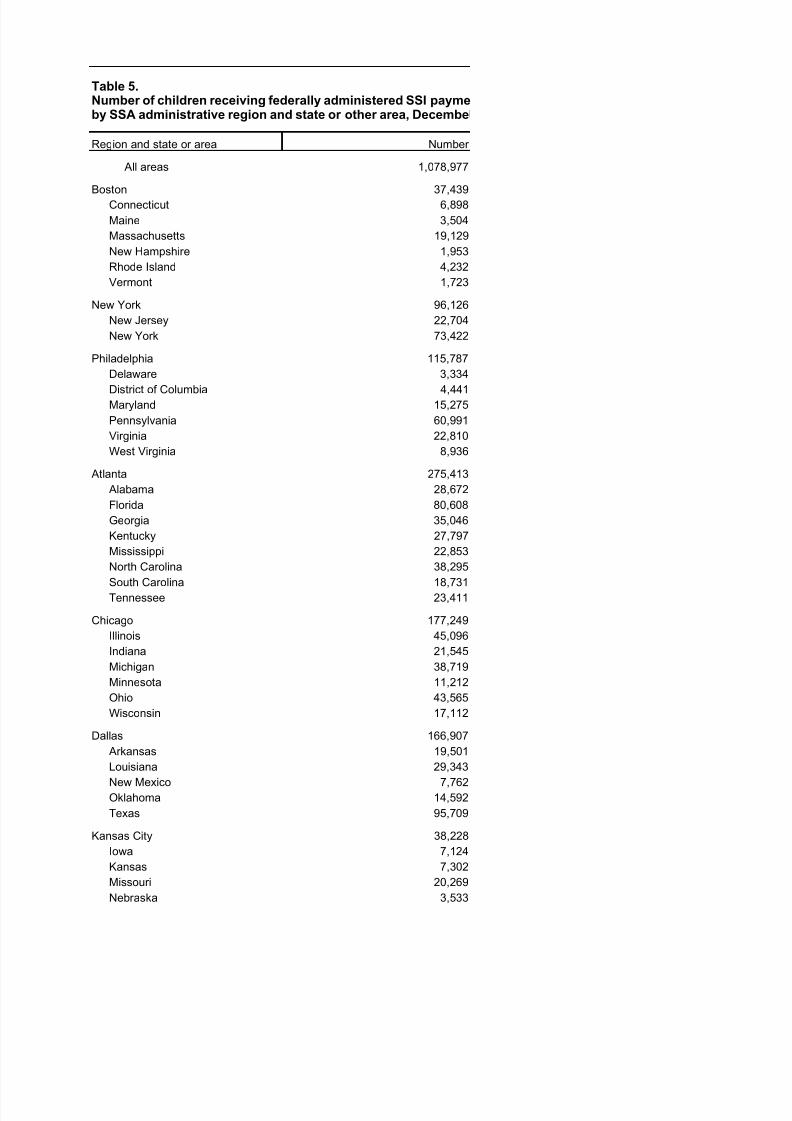
Region and state or area Number
All areas 1,078,977
Boston 37,439Connecticut 6,898
Maine 3,504
Massachusetts 19,129
New Hampshire 1,953
Rhode Island 4,232
Vermont 1,723
New York 96,126
New Jersey 22,704
New York 73,422
Philadelphia 115,787
Delaware 3,334
District of Columbia 4,441Maryland 15,275
Pennsylvania 60,991
Virginia 22,810
West Virginia 8,936
Atlanta 275,413
Alabama 28,672
Florida 80,608
Georgia 35,046
Kentucky 27,797
Mississippi 22,853
North Carolina 38,295
South Carolina 18,731Tennessee 23,411
Chicago 177,249
Illinois 45,096
Indiana 21,545
Michigan 38,719
Minnesota 11,212
Ohio 43,565
Wisconsin 17,112
Dallas 166,907
Arkansas 19,501
Louisiana 29,343New Mexico 7,762
Oklahoma 14,592
Texas 95,709
Kansas City 38,228
Iowa 7,124
Kansas 7,302
Missouri 20,269
Nebraska 3,533
Table 5.Number of children receiving federally administered SSI paymeby SSA administrative region and state or other area, Decembe
8/14/2019 Social Security: ssi children06
http://slidepdf.com/reader/full/social-security-ssi-children06 16/42
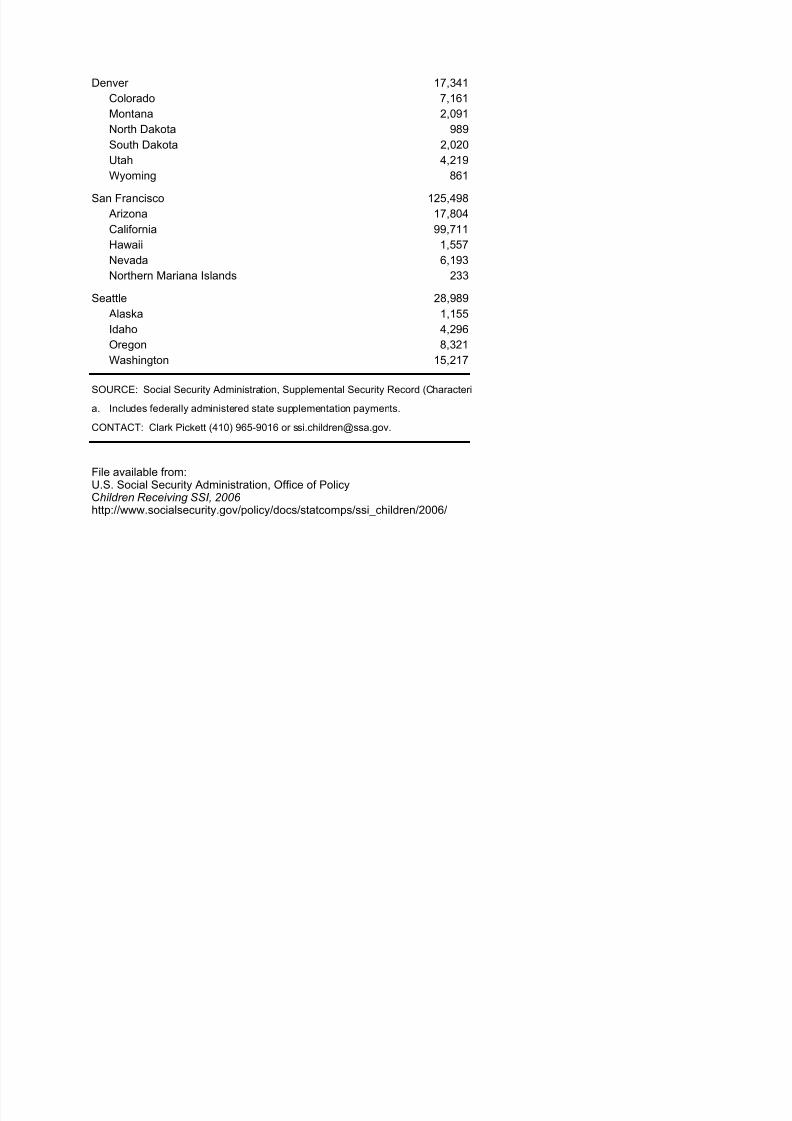
Denver 17,341
Colorado 7,161
Montana 2,091
North Dakota 989
South Dakota 2,020
Utah 4,219
Wyoming 861
San Francisco 125,498
Arizona 17,804
California 99,711
Hawaii 1,557
Nevada 6,193
Northern Mariana Islands 233
Seattle 28,989
Alaska 1,155
Idaho 4,296
Oregon 8,321
Washington 15,217
SOURCE: Social Security Administration, Supplemental Security Record (Characteri
a. Includes federally administered state supplementation payments.
CONTACT: Clark Pickett (410) 965-9016 or [email protected].
File available from:U.S. Social Security Administration, Office of PolicyChildren Receiving SSI, 2006 http://www.socialsecurity.gov/policy/docs/statcomps/ssi_children/2006/
8/14/2019 Social Security: ssi children06
http://slidepdf.com/reader/full/social-security-ssi-children06 17/42
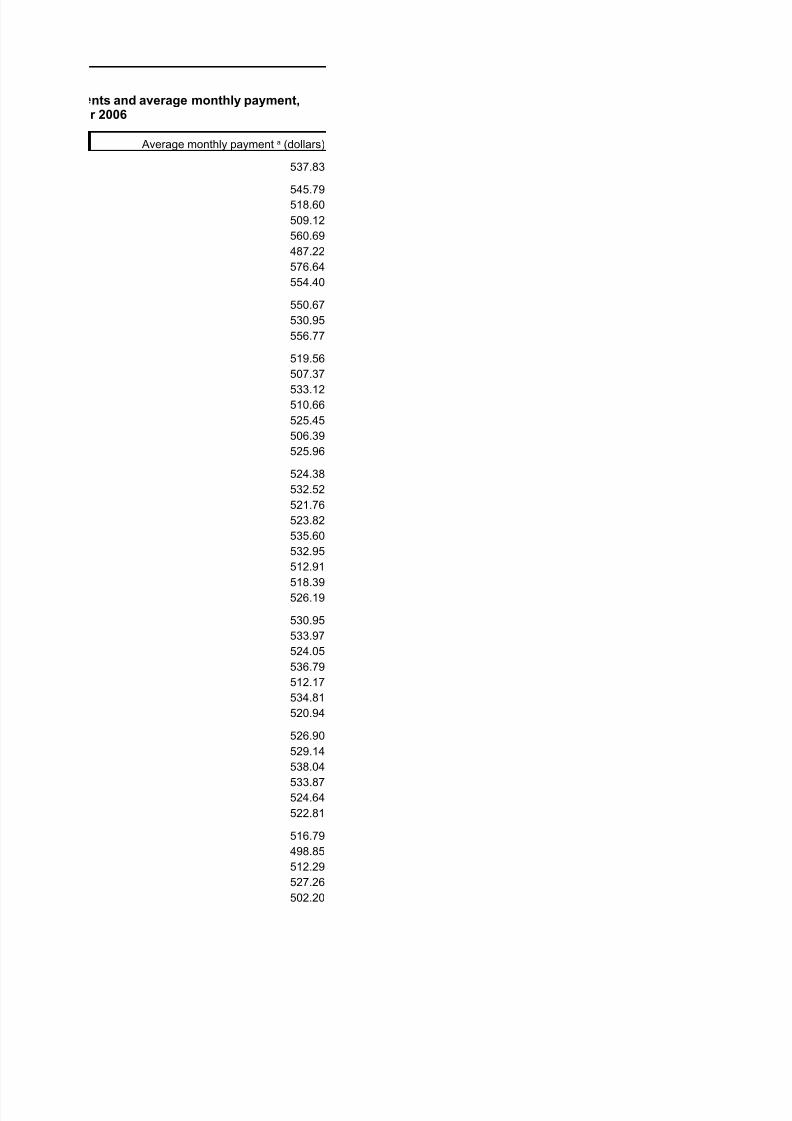
537.83
545.79518.60
509.12
560.69
487.22
576.64
554.40
550.67
530.95
556.77
519.56
507.37
533.12510.66
525.45
506.39
525.96
524.38
532.52
521.76
523.82
535.60
532.95
512.91
518.39526.19
530.95
533.97
524.05
536.79
512.17
534.81
520.94
526.90
529.14
538.04533.87
524.64
522.81
516.79
498.85
512.29
527.26
502.20
nts and average monthly payment,r 2006
Average monthly payment a (dollars)
8/14/2019 Social Security: ssi children06
http://slidepdf.com/reader/full/social-security-ssi-children06 18/42
493.20
497.05
514.85
478.69
491.01
482.51
482.76
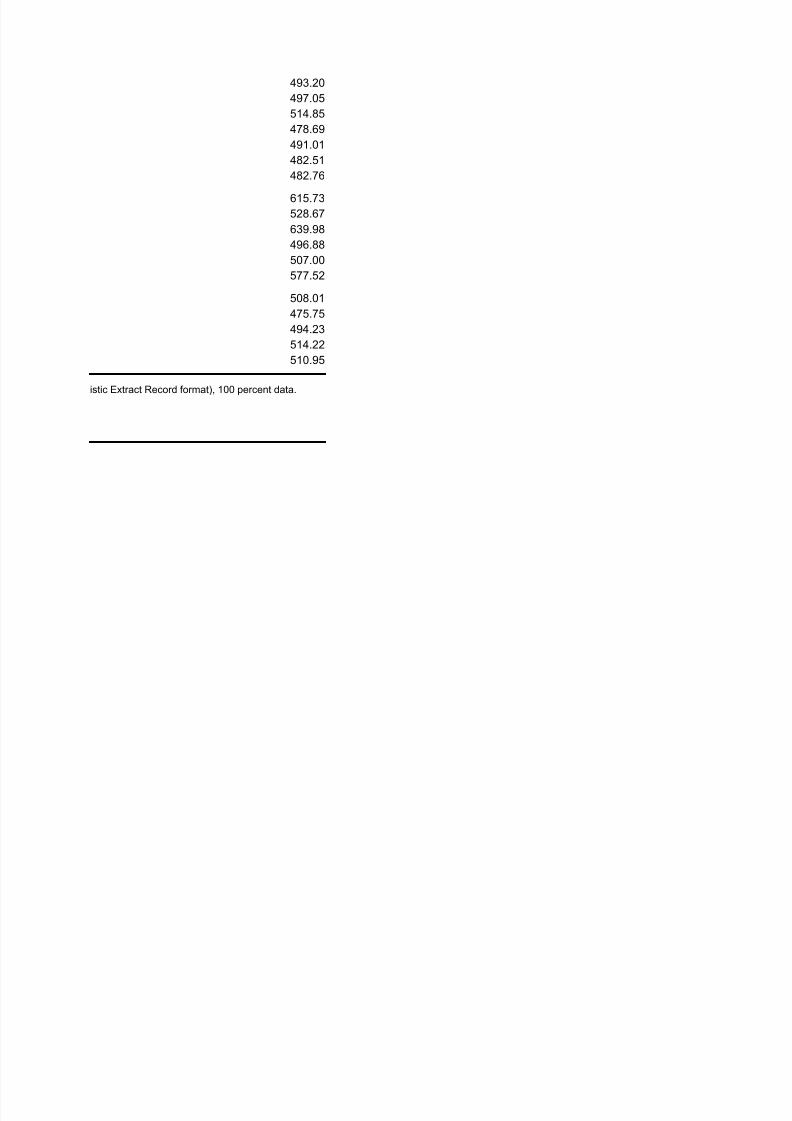
615.73
528.67
639.98
496.88
507.00
577.52
508.01
475.75
494.23
514.22
510.95
istic Extract Record format), 100 percent data.

8/14/2019 Social Security: ssi children06
http://slidepdf.com/reader/full/social-security-ssi-children06 19/42
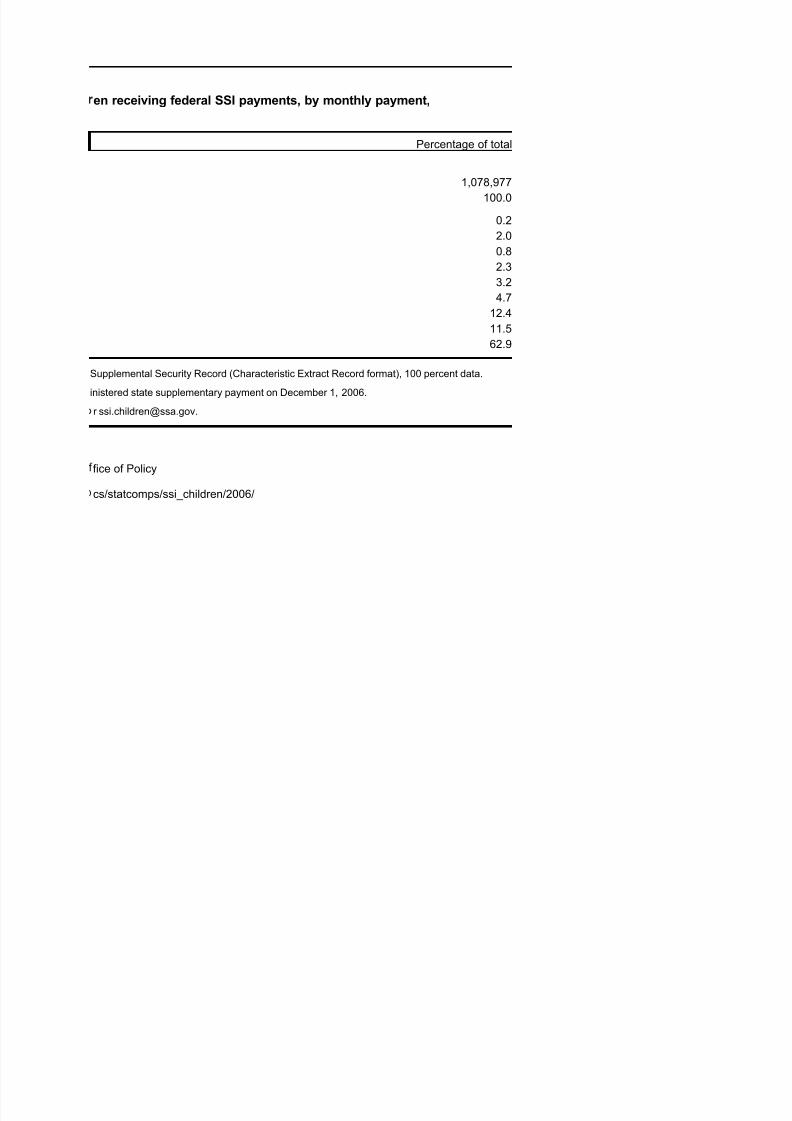
Payment (dollars)
Total
Number
Percent
Under 50
50–99
100–199
200–299
300–399
400–499
500–602
603
SOURCE: Social Security Administration,
a. Persons receiving only a federally admi
CONTACT: Clark Pickett (410) 965-9016 o
Table 6.Percentage distribution of childDecember 2006
None a
File available from:U.S. Social Security Administration, OChildren Receiving SSI, 2006 http://www.socialsecurity.gov/policy/do
8/14/2019 Social Security: ssi children06
http://slidepdf.com/reader/full/social-security-ssi-children06 20/42
Percentage of total
1,078,977
100.0
0.2
2.0
0.8
2.3
3.2
4.7
12.4
11.5
62.9
Supplemental Security Record (Characteristic Extract Record format), 100 percent data.
inistered state supplementary payment on December 1, 2006.
en receiving federal SSI payments, by monthly payment,
fice of Policy
cs/statcomps/ssi_children/2006/
8/14/2019 Social Security: ssi children06
http://slidepdf.com/reader/full/social-security-ssi-children06 21/42
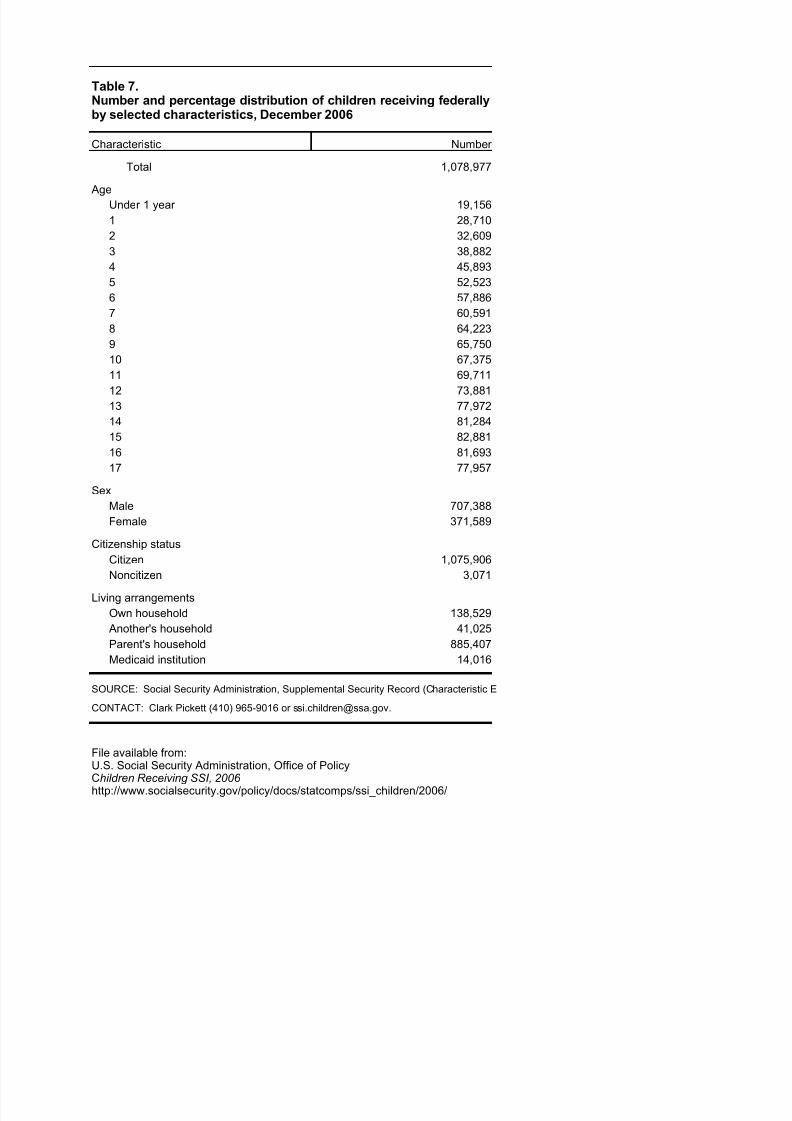
Characteristic Number
Total 1,078,977
AgeUnder 1 year 19,156
1 28,710
2 32,609
3 38,882
4 45,893
5 52,523
6 57,886
7 60,591
8 64,223
9 65,750
10 67,375
11 69,711
12 73,881
13 77,972
14 81,284
15 82,881
16 81,693
17 77,957
Sex
Male 707,388
Female 371,589
Citizenship status
Citizen 1,075,906
Noncitizen 3,071Living arrangements
Own household 138,529
Another's household 41,025
Parent's household 885,407
Medicaid institution 14,016
SOURCE: Social Security Administration, Supplemental Security Record (Characteristic E
CONTACT: Clark Pickett (410) 965-9016 or [email protected].
Table 7.Number and percentage distribution of children receiving federallyby selected characteristics, December 2006
File available from:U.S. Social Security Administration, Office of PolicyChildren Receiving SSI, 2006 http://www.socialsecurity.gov/policy/docs/statcomps/ssi_children/2006/
8/14/2019 Social Security: ssi children06
http://slidepdf.com/reader/full/social-security-ssi-children06 22/42
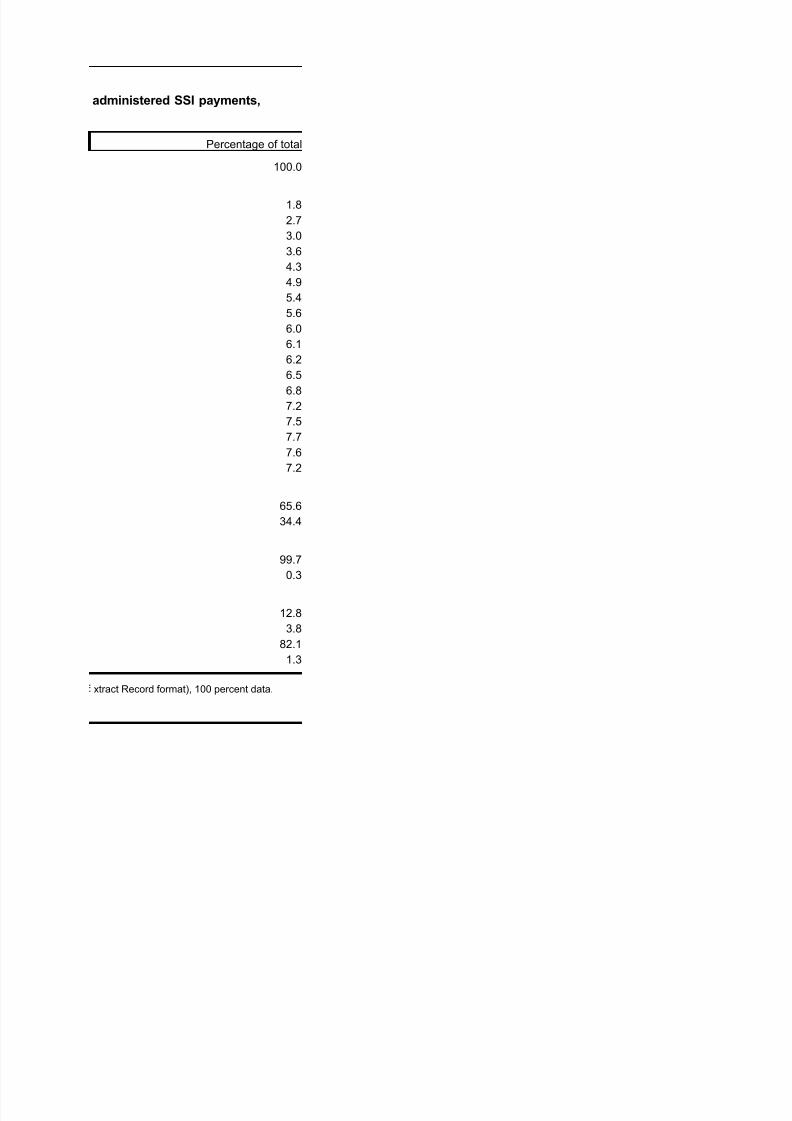
Percentage of total
100.0
1.8
2.7
3.0
3.6
4.3
4.9
5.4
5.6
6.0
6.1
6.2
6.5
6.8
7.2
7.5
7.7
7.6
7.2
65.6
34.4
99.7
0.3
12.8
3.8
82.1
1.3
xtract Record format), 100 percent data.
administered SSI payments,
8/14/2019 Social Security: ssi children06
http://slidepdf.com/reader/full/social-security-ssi-children06 23/42
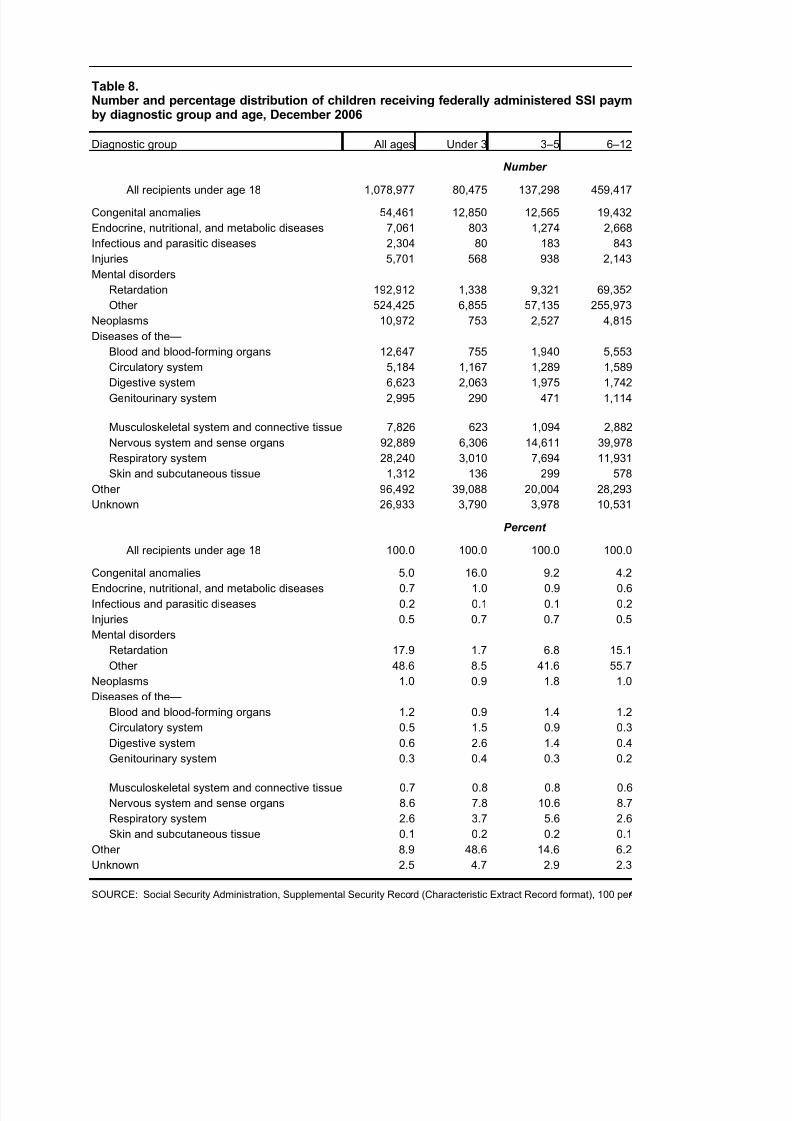
Diagnostic group All ages Under 3 3–5 6–12
Number
All recipients under age 18 1,078,977 80,475 137,298 459,417
Congenital anomalies 54,461 12,850 12,565 19,432
Endocrine, nutritional, and metabolic diseases 7,061 803 1,274 2,668
Infectious and parasitic diseases 2,304 80 183 843
Injuries 5,701 568 938 2,143
Mental disorders
Retardation 192,912 1,338 9,321 69,352
Other 524,425 6,855 57,135 255,973
Neoplasms 10,972 753 2,527 4,815
Diseases of the—
Blood and blood-forming organs 12,647 755 1,940 5,553
Circulatory system 5,184 1,167 1,289 1,589
Digestive system 6,623 2,063 1,975 1,742Genitourinary system 2,995 290 471 1,114
Musculoskeletal system and connective tissue 7,826 623 1,094 2,882
Nervous system and sense organs 92,889 6,306 14,611 39,978
Respiratory system 28,240 3,010 7,694 11,931
Skin and subcutaneous tissue 1,312 136 299 578
Other 96,492 39,088 20,004 28,293
Unknown 26,933 3,790 3,978 10,531
Percent
All recipients under age 18 100.0 100.0 100.0 100.0
Congenital anomalies 5.0 16.0 9.2 4.2Endocrine, nutritional, and metabolic diseases 0.7 1.0 0.9 0.6
Infectious and parasitic diseases 0.2 0.1 0.1 0.2
Injuries 0.5 0.7 0.7 0.5
Mental disorders
Retardation 17.9 1.7 6.8 15.1
Other 48.6 8.5 41.6 55.7
Neoplasms 1.0 0.9 1.8 1.0
Diseases of the—
Blood and blood-forming organs 1.2 0.9 1.4 1.2
Circulatory system 0.5 1.5 0.9 0.3
Digestive system 0.6 2.6 1.4 0.4
Genitourinary system 0.3 0.4 0.3 0.2
Musculoskeletal system and connective tissue 0.7 0.8 0.8 0.6
Nervous system and sense organs 8.6 7.8 10.6 8.7
Respiratory system 2.6 3.7 5.6 2.6
Skin and subcutaneous tissue 0.1 0.2 0.2 0.1
Other 8.9 48.6 14.6 6.2
Unknown 2.5 4.7 2.9 2.3
SOURCE: Social Security Administration, Supplemental Security Record (Characteristic Extract Record format), 100 per
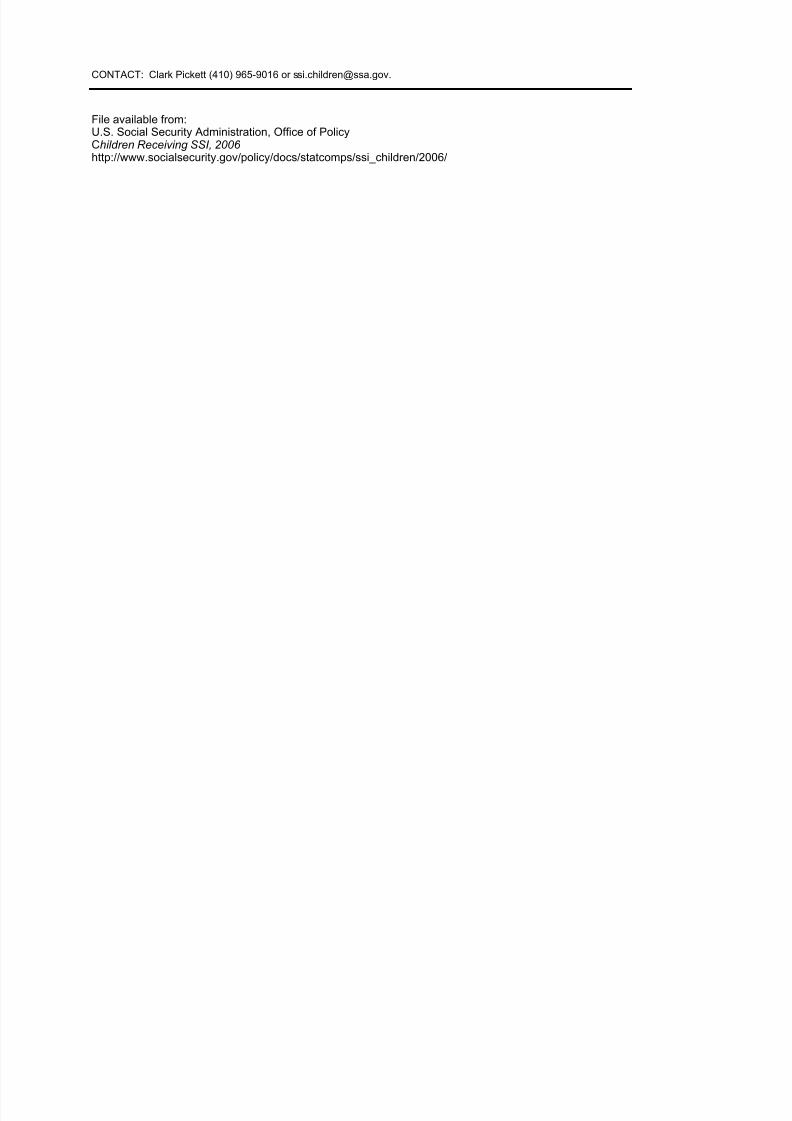
Table 8.Number and percentage distribution of children receiving federally administered SSI paymby diagnostic group and age, December 2006
8/14/2019 Social Security: ssi children06
http://slidepdf.com/reader/full/social-security-ssi-children06 24/42
CONTACT: Clark Pickett (410) 965-9016 or [email protected].
File available from:U.S. Social Security Administration, Office of PolicyChildren Receiving SSI, 2006 http://www.socialsecurity.gov/policy/docs/statcomps/ssi_children/2006/
8/14/2019 Social Security: ssi children06
http://slidepdf.com/reader/full/social-security-ssi-children06 25/42
13–17
401,787
9,614
2,316
1,198
2,052
112,901
204,462
2,877
4,399
1,139
8431,120
3,227
31,994
5,605
299
9,107
8,634
100.0
2.40.6
0.3
0.5
28.1
50.9
0.7
1.1
0.3
0.2
0.3
0.8
8.0
1.4
0.1
2.3
2.1
ent data.
ents,

8/14/2019 Social Security: ssi children06
http://slidepdf.com/reader/full/social-security-ssi-children06 26/42

8/14/2019 Social Security: ssi children06
http://slidepdf.com/reader/full/social-security-ssi-children06 27/42
Diagnostic group
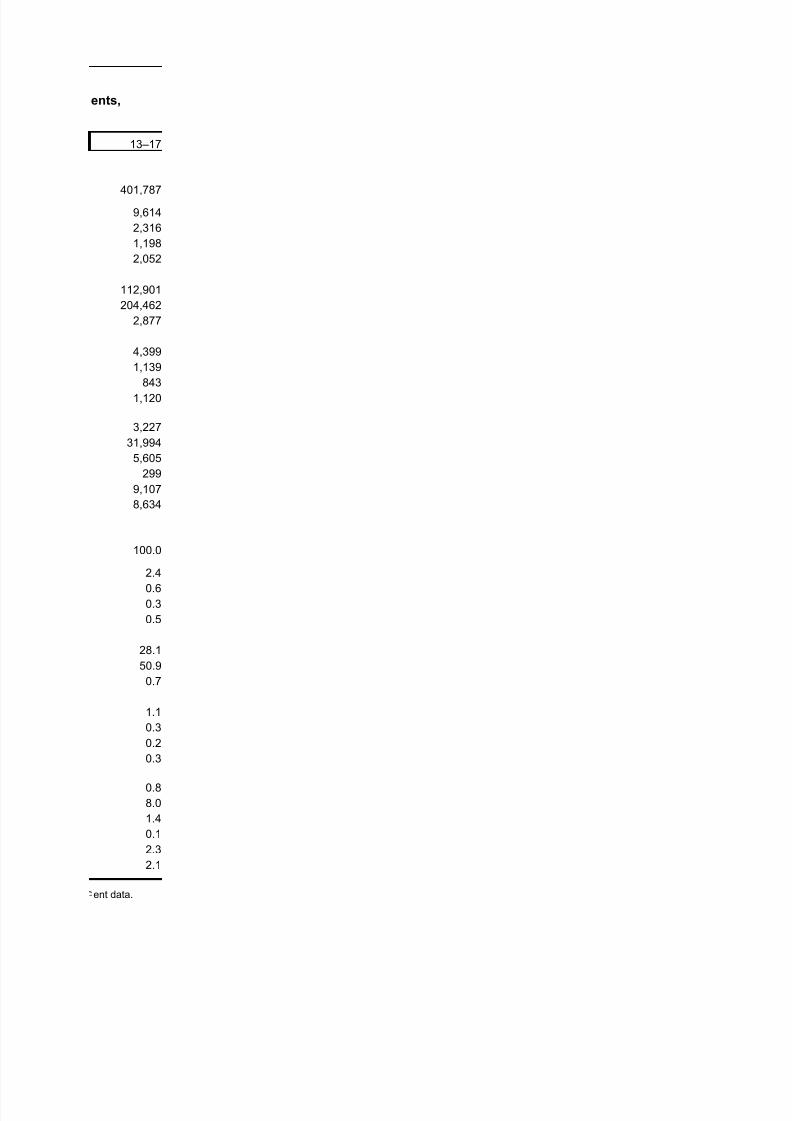
Total Male Fe
Number Percent Number Percent Number
All recipients under age 18 1,078,977 100.0 707,388 100.0 371,589
Congenital anomalies 54,461 5.0 29,259 4.1 25,202
7,061 0.7 3,647 0.5 3,414
Infectious and parasitic diseases 2,304 0.2 1,155 0.2 1,149
Injuries 5,701 0.5 3,366 0.5 2,335
Mental disorders
Retardation 192,912 17.9 119,256 16.9 73,656
Other 524,425 48.6 385,132 54.4 139,293
Neoplasms 10,972 1.0 6,060 0.9 4,912
Diseases of the—
Blood and blood-forming organs 12,647 1.2 7,166 1.0 5,481
Circulatory system 5,184 0.5 2,839 0.4 2,345
Digestive system 6,623 0.6 3,615 0.5 3,008
Genitourinary system 2,995 0.3 1,774 0.3 1,221
7,826 0.7 3,823 0.5 4,003
Nervous system and sense organs 92,889 8.6 51,956 7.3 40,933
Respiratory system 28,240 2.6 18,170 2.6 10,070
Skin and subcutaneous tissue 1,312 0.1 675 0.1 637
Other 96,492 8.9 53,236 7.5 43,256
Unknown 26,933 2.5 16,259 2.3 10,674
SOURCE: Social Security Administration, Supplemental Security Record (Characteristic Extract Record format), 100 perc
CONTACT: Clark Pickett (410) 965-9016 or [email protected].
Table 9.Number and percentage distribution of children receiving federally administered SSI paymby diagnostic group and sex, December 2006
Endocrine, nutritional, and metabolicdiseases
Musculoskeletal system andconnective tissue
File available from:U.S. Social Security Administration, Office of PolicyChildren Receiving SSI, 2006 http://www.socialsecurity.gov/policy/docs/statcomps/ssi_children/2006/
8/14/2019 Social Security: ssi children06
http://slidepdf.com/reader/full/social-security-ssi-children06 28/42
ale
Percent
100.0
6.8
0.9
0.3
0.6
19.8
37.5
1.3
1.5
0.6
0.8
0.3
1.1
11.0
2.7
0.2
11.6
2.9
nt data.
nts,
8/14/2019 Social Security: ssi children06
http://slidepdf.com/reader/full/social-security-ssi-children06 29/42
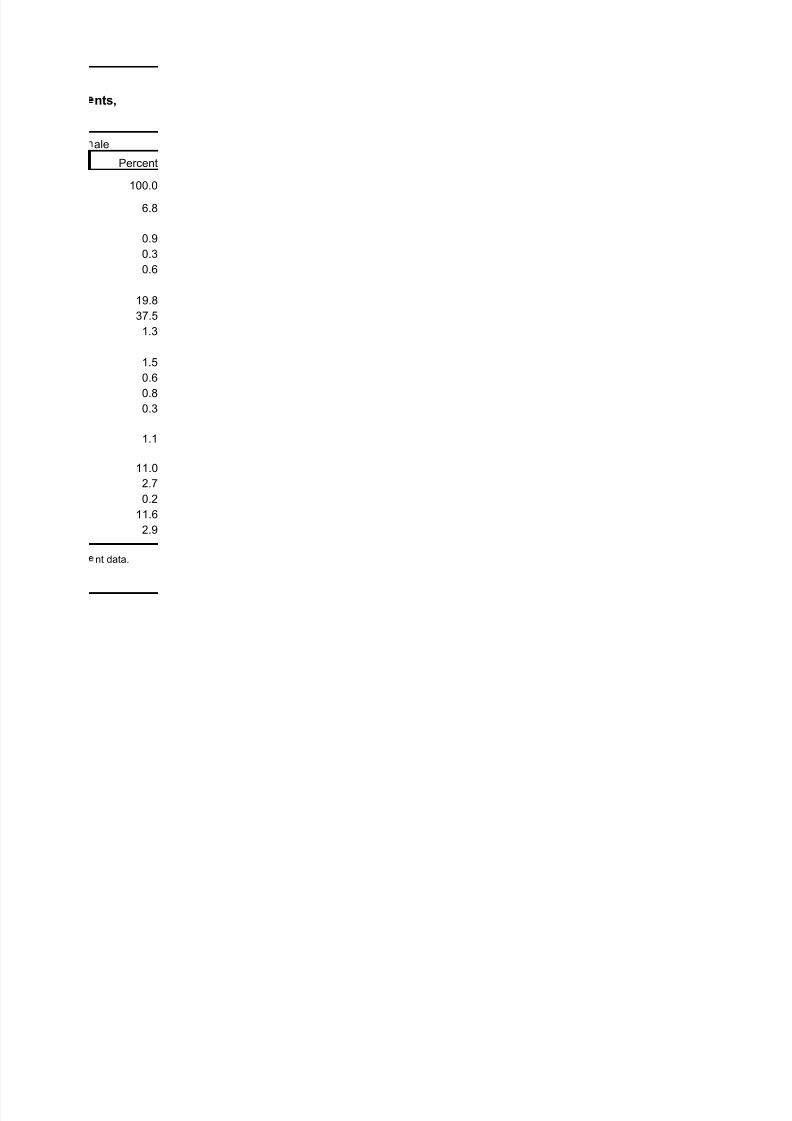
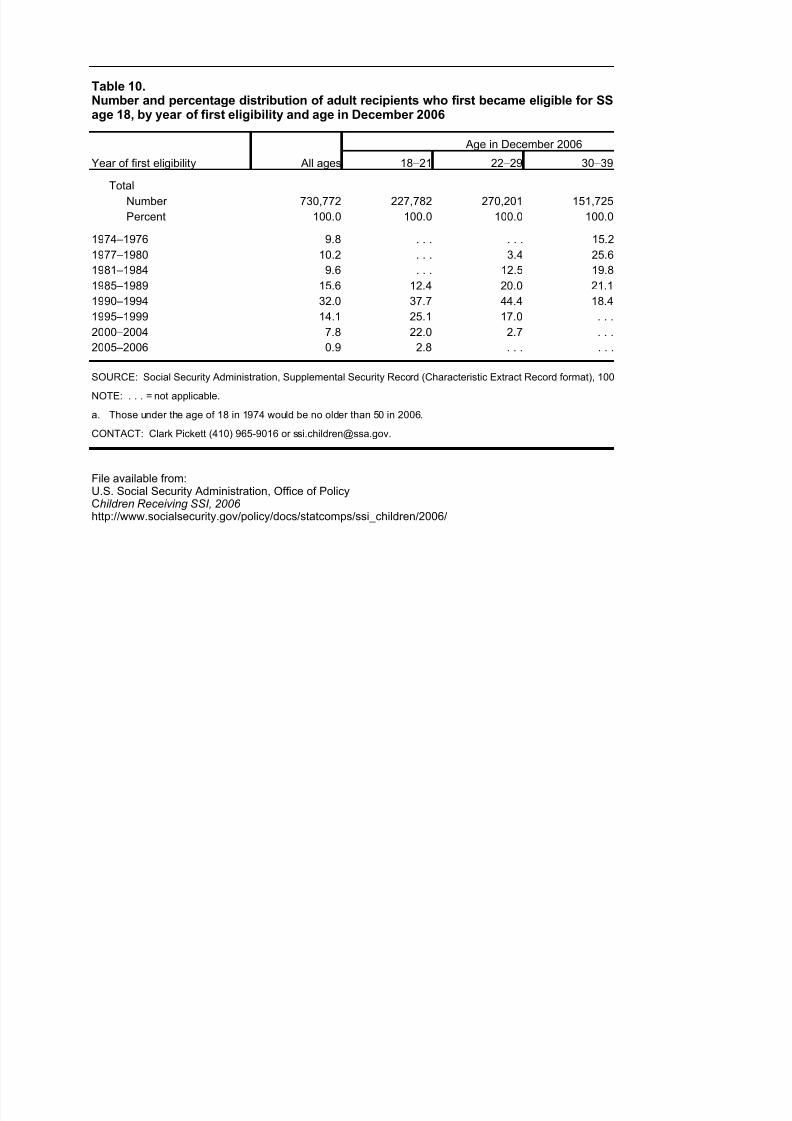
Year of first eligibility All ages
Age in December 2006
18–21 22–29 30–39
Total
Number 730,772 227,782 270,201 151,725
Percent 100.0 100.0 100.0 100.0
1974–1976 9.8 . . . . . . 15.2
1977–1980 10.2 . . . 3.4 25.6
1981–1984 9.6 . . . 12.5 19.8
1985–1989 15.6 12.4 20.0 21.1
1990–1994 32.0 37.7 44.4 18.4
1995–1999 14.1 25.1 17.0 . . .
2000–2004 7.8 22.0 2.7 . . .
2005–2006 0.9 2.8 . . . . . .
SOURCE: Social Security Administration, Supplemental Security Record (Characteristic Extract Record format), 100
NOTE: . . . = not applicable.
a. Those under the age of 18 in 1974 would be no older than 50 in 2006.
CONTACT: Clark Pickett (410) 965-9016 or [email protected].
Table 10.Number and percentage distribution of adult recipients who first became eligible for SSage 18, by year of first eligibility and age in December 2006
File available from:U.S. Social Security Administration, Office of PolicyChildren Receiving SSI, 2006 http://www.socialsecurity.gov/policy/docs/statcomps/ssi_children/2006/
8/14/2019 Social Security: ssi children06
http://slidepdf.com/reader/full/social-security-ssi-children06 30/42
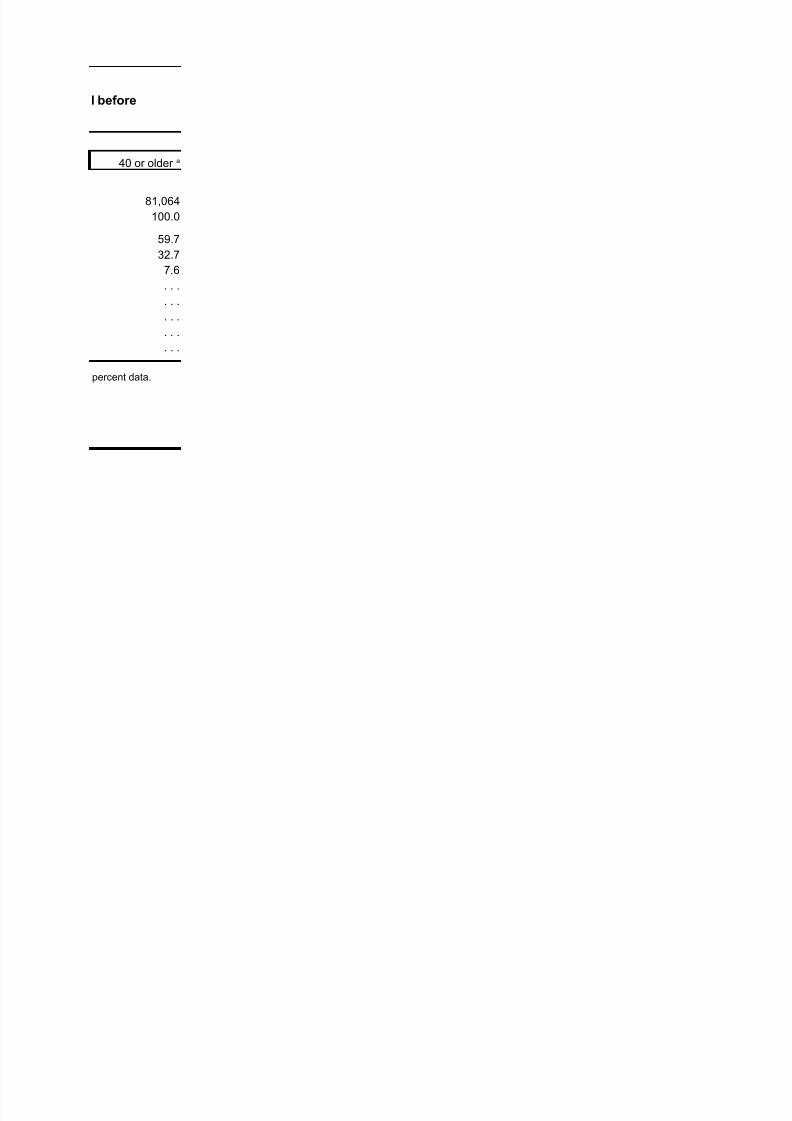
81,064
100.0
59.7
32.7
7.6
. . .
. . .
. . .
. . .
. . .
percent data.
I before
40 or older a
8/14/2019 Social Security: ssi children06
http://slidepdf.com/reader/full/social-security-ssi-children06 31/42
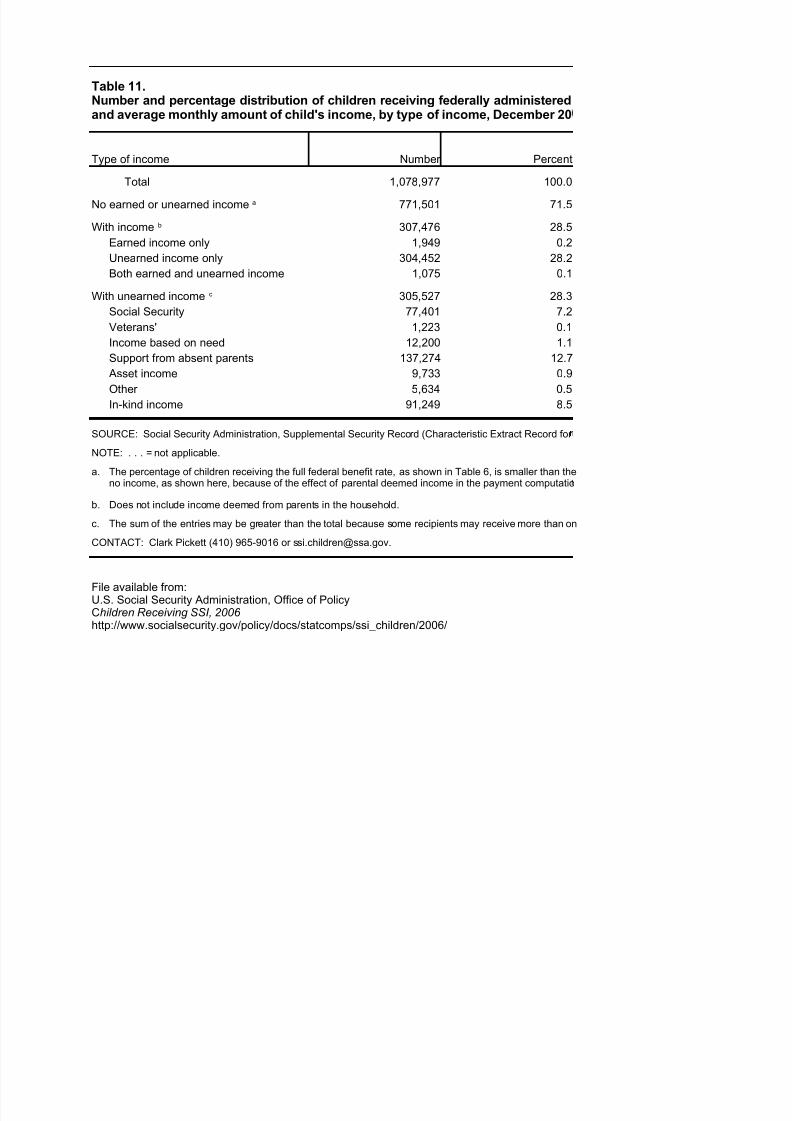
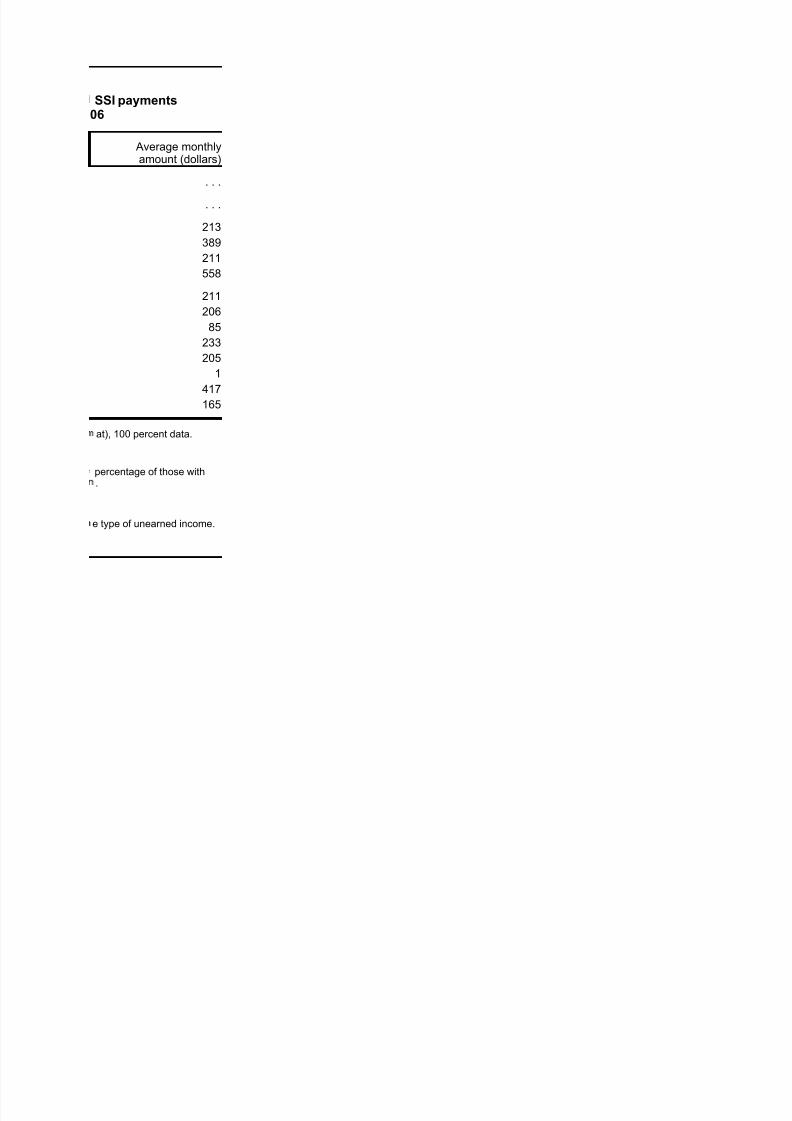
Type of income Number Percent
Total 1,078,977 100.0
771,501 71.5
307,476 28.5
Earned income only 1,949 0.2
Unearned income only 304,452 28.2
Both earned and unearned income 1,075 0.1
305,527 28.3
Social Security 77,401 7.2
Veterans' 1,223 0.1
Income based on need 12,200 1.1
Support from absent parents 137,274 12.7
Asset income 9,733 0.9
Other 5,634 0.5In-kind income 91,249 8.5
SOURCE: Social Security Administration, Supplemental Security Record (Characteristic Extract Record for
NOTE: . . . = not applicable.
a.
b. Does not include income deemed from parents in the household.
c. The sum of the entries may be greater than the total because some recipients may receive more than on
CONTACT: Clark Pickett (410) 965-9016 or [email protected].
Table 11.Number and percentage distribution of children receiving federally administeredand average monthly amount of child's income, by type of income, December 20
No earned or unearned income a
With income b
With unearned income c
The percentage of children receiving the full federal benefit rate, as shown in Table 6, is smaller than theno income, as shown here, because of the effect of parental deemed income in the payment computatio
File available from:U.S. Social Security Administration, Office of PolicyChildren Receiving SSI, 2006 http://www.socialsecurity.gov/policy/docs/statcomps/ssi_children/2006/
8/14/2019 Social Security: ssi children06
http://slidepdf.com/reader/full/social-security-ssi-children06 32/42
. . .
. . .
213
389
211
558
211
206
85
233
205
1
417165
at), 100 percent data.
e type of unearned income.
SSI payments06
Average monthlyamount (dollars)
percentage of those with.
8/14/2019 Social Security: ssi children06
http://slidepdf.com/reader/full/social-security-ssi-children06 33/42
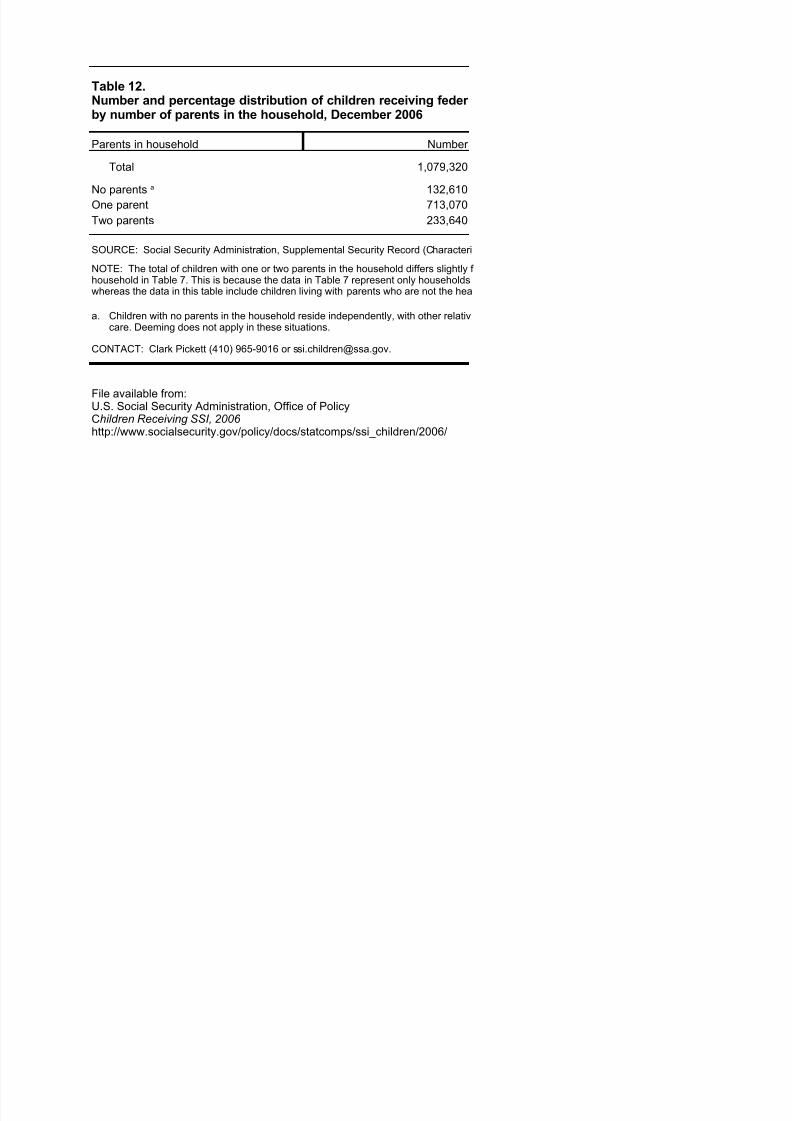
Parents in household Number
Total 1,079,320
132,610One parent 713,070
Two parents 233,640
SOURCE: Social Security Administration, Supplemental Security Record (Characteri
a.
CONTACT: Clark Pickett (410) 965-9016 or [email protected].
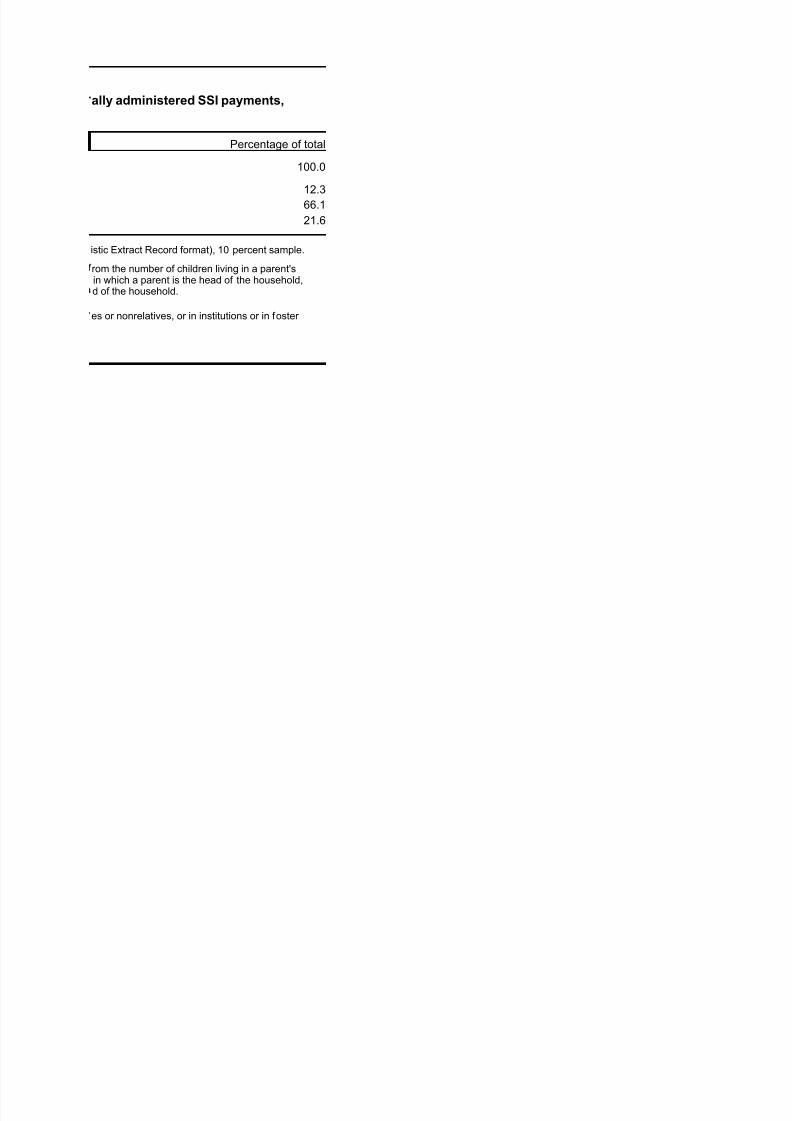
Table 12.Number and percentage distribution of children receiving feder by number of parents in the household, December 2006
No parentsa
NOTE: The total of children with one or two parents in the household differs slightly f household in Table 7. This is because the data in Table 7 represent only householdswhereas the data in this table include children living with parents who are not the hea
Children with no parents in the household reside independently, with other relativcare. Deeming does not apply in these situations.
File available from:U.S. Social Security Administration, Office of PolicyChildren Receiving SSI, 2006 http://www.socialsecurity.gov/policy/docs/statcomps/ssi_children/2006/
8/14/2019 Social Security: ssi children06
http://slidepdf.com/reader/full/social-security-ssi-children06 34/42
Percentage of total
100.0
12.366.1
21.6
istic Extract Record format), 10 percent sample.
ally administered SSI payments,
rom the number of children living in a parent'sin which a parent is the head of the household,d of the household.
es or nonrelatives, or in institutions or in foster

8/14/2019 Social Security: ssi children06
http://slidepdf.com/reader/full/social-security-ssi-children06 35/42
Parental income
Children living with—
Mother only Fathe
Number Percent Number Percent Number
Total 713,070 100.0 673,420 100.0 39,650
No parental income 324,220 45.5 309,690 46.0 14,530
388,850 54.5 363,730 54.0 25,120
Earned income 249,280 35.0 231,650 34.4 17,630
Unearned income 163,350 22.9 154,660 23.0 8,690
Total income (dollars)
None 324,220 45.5 309,690 46.0 14,530
Under 200 72,620 10.2 70,740 10.5 1,880
200–399 31,240 4.4 29,760 4.4 1,480
400–599 35,680 5.0 33,770 5.0 1,910
600–999 80,820 11.3 75,950 11.3 4,8701,000 or more 168,490 23.6 153,510 22.8 14,980
Earned income (dollars)
None 463,790 65.0 441,770 65.6 22,020
Under 200 5,110 0.7 4,860 0.7 250
200–399 9,960 1.4 9,540 1.4 420
400–599 18,400 2.6 17,730 2.6 670
600–999 56,210 7.9 53,800 8.0 2,410
1,000 or more 159,600 22.4 145,720 21.6 13,880
Unearned income (dollars)
None 549,720 77.1 518,760 77.0 30,960
Under 200 84,510 11.9 82,120 12.2 2,390
200–399 26,020 3.6 24,710 3.7 1,310400–599 19,990 2.8 18,660 2.8 1,330
600–999 26,970 3.8 24,220 3.6 2,750
1,000 or more 5,860 0.8 4,950 0.7 910
SOURCE: Social Security Administration, Supplemental Security Record (Characteristic Extract Record format), 10 perce
a. The sum of the entries may be greater than the total because some parents may receive both earned and unearned in
CONTACT: Clark Pickett (410) 965-9016 or [email protected].
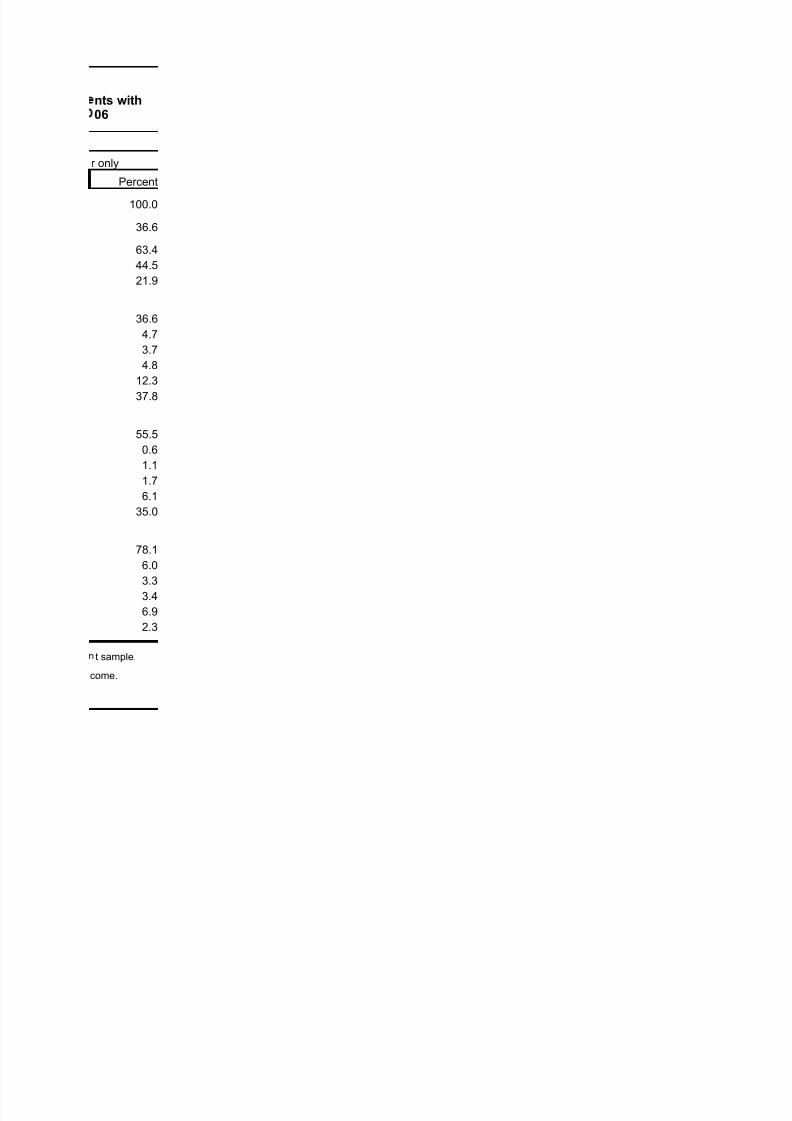
Table 13.Number and percentage distribution of children receiving federally administered SSI paymone parent in the household, by type and monthly amount of parental income, December 2
All children livingwith one parent
Parental income a
File available from:U.S. Social Security Administration, Office of PolicyChildren Receiving SSI, 2006 http://www.socialsecurity.gov/policy/docs/statcomps/ssi_children/2006/
8/14/2019 Social Security: ssi children06
http://slidepdf.com/reader/full/social-security-ssi-children06 36/42
r only
Percent
100.0
36.6
63.4
44.5
21.9
36.6
4.7
3.7
4.8
12.337.8
55.5
0.6
1.1
1.7
6.1
35.0
78.1
6.0
3.33.4
6.9
2.3
t sample.
come.
nts with06

8/14/2019 Social Security: ssi children06
http://slidepdf.com/reader/full/social-security-ssi-children06 37/42
Parental income
Mother Fat
Number Percent Number Percent Number
Total 233,640 100.0 233,640 100.0 233,640
No parental income 41,300 17.7 150,200 64.3 71,330
192,340 82.3 83,440 35.7 162,310
Earned income 158,480 67.8 55,940 23.9 129,700
Unearned income 55,350 23.7 31,800 13.6 40,940
Total income (dollars)
None 41,300 17.7 150,200 64.3 71,330
Under 200 7,970 3.4 17,620 7.5 8,930
200–399 6,330 2.7 6,950 3.0 4,840
400–599 7,780 3.3 9,060 3.9 7,990
600–999 23,280 10.0 16,480 7.1 22,970
1,000 or more 146,980 62.9 33,330 14.3 117,580
Earned income (dollars)
None 75,160 32.2 177,700 76.1 103,940
Under 200 1,570 0.7 2,430 1.0 1,560
200–399 2,490 1.1 3,540 1.5 2,040
400–599 4,140 1.8 5,520 2.4 3,410
600–999 14,370 6.2 12,340 5.3 11,530
1,000 or more 135,910 58.2 32,110 13.7 111,160
Unearned income (dollars)
None 178,290 76.3 201,840 86.4 192,700
Under 200 13,750 5.9 18,330 7.8 11,600
200–399 8,490 3.6 4,190 1.8 4,760400–599 7,830 3.4 3,950 1.7 5,510
600–999 16,120 6.9 4,500 1.9 13,120
1,000 or more 9,160 3.9 830 0.4 5,950
SOURCE: Social Security Administration, Supplemental Security Record (Characteristic Extract Record format), 10 perce
a. The sum of the entries may be greater than the total because some parents may receive both earned and unearned in
CONTACT: Clark Pickett (410) 965-9016 or [email protected].
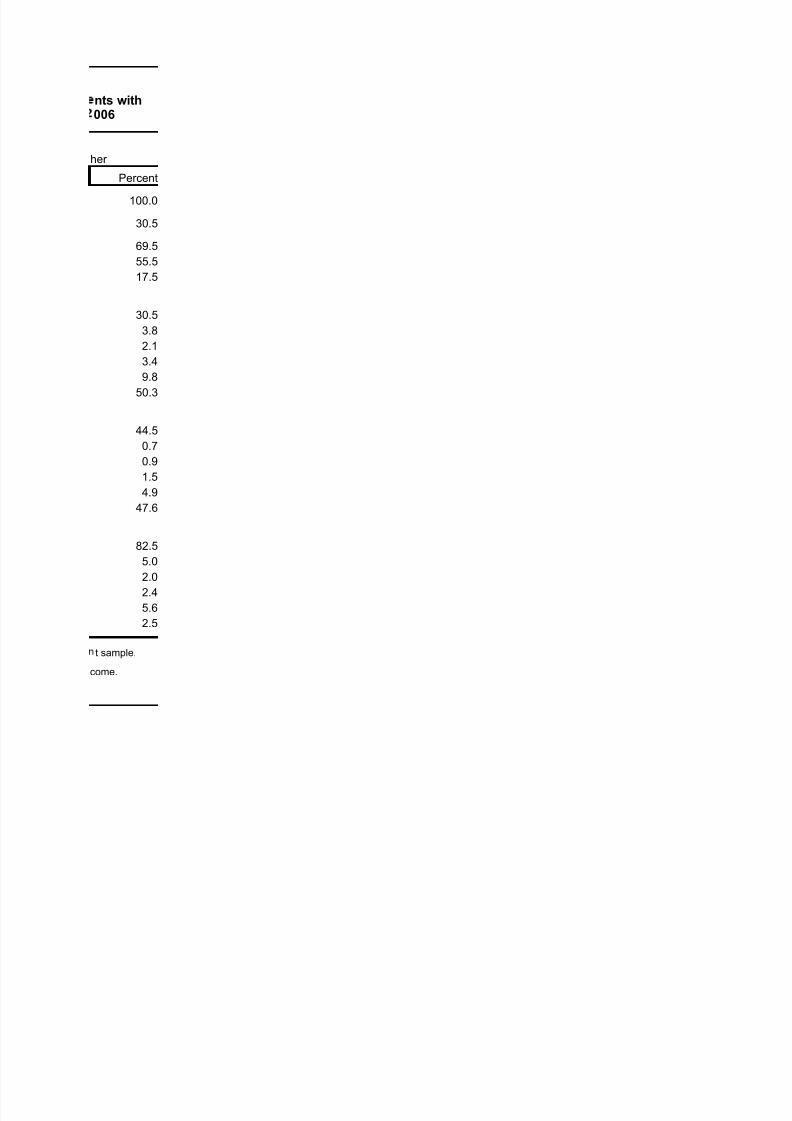
Table 14.Number and percentage distribution of children receiving federally administered SSI paymtwo parents in the household, by type and monthly amount of parental income, December
All children livingwith two parents
Parental income a
File available from:U.S. Social Security Administration, Office of PolicyChildren Receiving SSI, 2006
http://www.socialsecurity.gov/policy/docs/statcomps/ssi_children/2006/
8/14/2019 Social Security: ssi children06
http://slidepdf.com/reader/full/social-security-ssi-children06 38/42
her
Percent
100.0
30.5
69.5
55.5
17.5
30.5
3.8
2.1
3.4
9.8
50.3
44.5
0.7
0.9
1.5
4.9
47.6
82.5
5.0
2.02.4
5.6
2.5
t sample.
come.
nts with006

8/14/2019 Social Security: ssi children06
http://slidepdf.com/reader/full/social-security-ssi-children06 39/42
Type of income
Children with parental income fr
Mother Fat
Number Number Number
581,190 1,231 447,170 925 187,430
Earned income 407,760 1,547 287,590 1,240 147,330
218,700 388 186,460 305 49,630
Social Security 75,660 609 58,940 501 23,810
Other pensions 5,310 405 3,040 328 3,010
Public income-maintenance 97,900 137 92,750 125 11,350
Asset income 15,080 45 11,730 35 4,750
Other 37,280 607 27,870 516 9,900
SOURCE: Social Security Administration, Supplemental Security Record (Characteristic Extract Record format), 10 perce
a.
b. The sum of the entries may be greater than the total because some parents may receive more than one type of unearn
CONTACT: Clark Pickett (410) 965-9016 or [email protected].
Table 15.Number of children receiving federally administered SSI payments with one or more parenthave income and average monthly amount of parental income, by type of income, Decemb
All children withparental income
Averagemonthlyamount(dollars)
Averagemonthlyamount(dollars)
Total a
Unearned income b
The sum of the entries may be greater than the total because some parents may receive more than one type of earnedincome or both earned and unearned income.
File available from:U.S. Social Security Administration, Office of PolicyChildren Receiving SSI, 2006 http://www.socialsecurity.gov/policy/docs/statcomps/ssi_children/2006/

8/14/2019 Social Security: ssi children06
http://slidepdf.com/reader/full/social-security-ssi-children06 40/42
m—
her
1,611
1,860
563
696
383
154
55
832
t sample.
ed income.
s whor 2006
Averagemonthlyamount(dollars)
d or unearned
8/14/2019 Social Security: ssi children06
http://slidepdf.com/reader/full/social-security-ssi-children06 41/42
Deeming factors
Children living with—
One parent Two p
Number Percent Number Percent Number
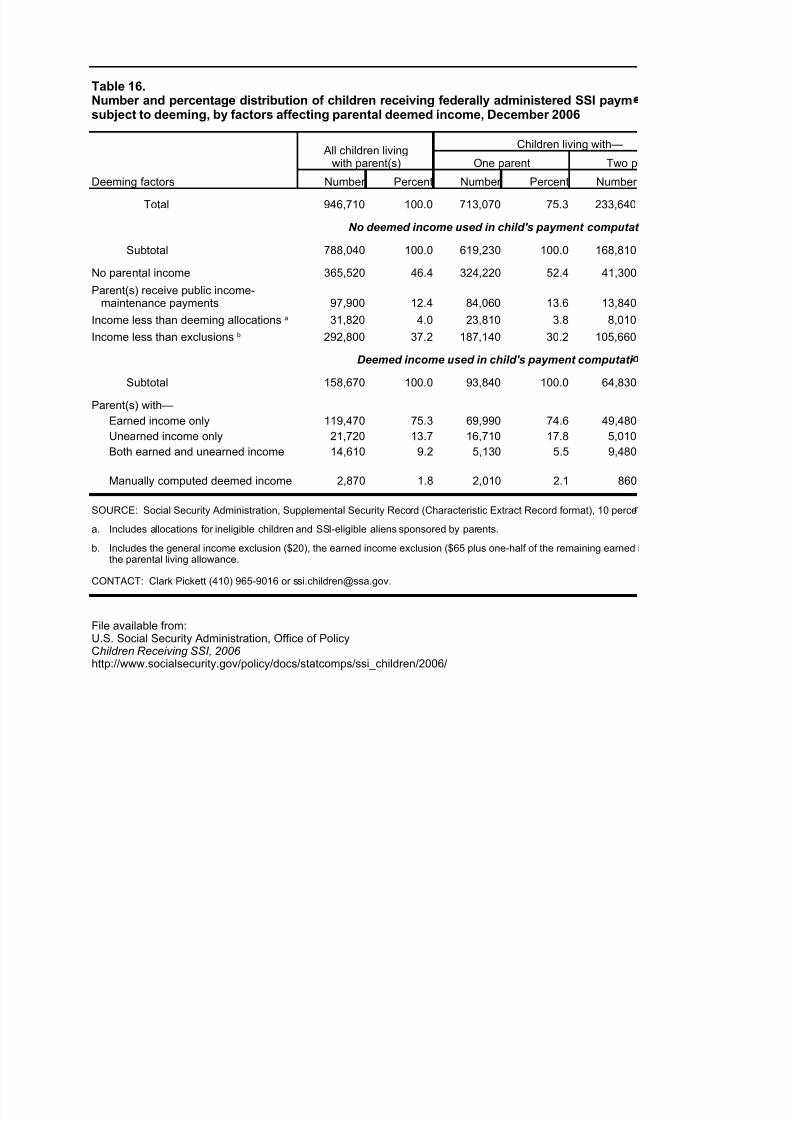
Total 946,710 100.0 713,070 75.3 233,640
No deemed income used in child's payment computat
Subtotal 788,040 100.0 619,230 100.0 168,810
No parental income 365,520 46.4 324,220 52.4 41,300
97,900 12.4 84,060 13.6 13,840
31,820 4.0 23,810 3.8 8,010
292,800 37.2 187,140 30.2 105,660
Deemed income used in child's payment computati
Subtotal 158,670 100.0 93,840 100.0 64,830
Parent(s) with—
Earned income only 119,470 75.3 69,990 74.6 49,480
Unearned income only 21,720 13.7 16,710 17.8 5,010
Both earned and unearned income 14,610 9.2 5,130 5.5 9,480
Manually computed deemed income 2,870 1.8 2,010 2.1 860
SOURCE: Social Security Administration, Supplemental Security Record (Characteristic Extract Record format), 10 perce
a. Includes allocations for ineligible children and SSI-eligible aliens sponsored by parents.
b.
CONTACT: Clark Pickett (410) 965-9016 or [email protected].
Table 16.Number and percentage distribution of children receiving federally administered SSI paymsubject to deeming, by factors affecting parental deemed income, December 2006
All children livingwith parent(s)
Parent(s) receive public income-maintenance payments
Income less than deeming allocations a
Income less than exclusions b
Includes the general income exclusion ($20), the earned income exclusion ($65 plus one-half of the remaining earned ithe parental living allowance.
File available from:U.S. Social Security Administration, Office of PolicyChildren Receiving SSI, 2006 http://www.socialsecurity.gov/policy/docs/statcomps/ssi_children/2006/

8/14/2019 Social Security: ssi children06
http://slidepdf.com/reader/full/social-security-ssi-children06 42/42
arents
Percent
24.7
ion
100.0
24.5
8.2
4.7
62.6
n
100.0
76.3
7.7
14.6
1.3
t sample.
nts
ncome), and