socially responsible investment
TRANSCRIPT

Board of Study in Economics
School of Natural and Social Sciences
Socially Responsible Investment
A Case Study Of A Negatively Screened S&P 500 Fund From 1990-2018
Tyler M. Van Gilder
Advisor: Cédric Ceulemans, Ph.D.
Second Reader: Shruti Rajagopalan, Ph.D.
State University of New York at Purchase
735 Anderson Hill Road
Purchase, NY 10577
May 2019

Socially Responsible Investment: A Case Study Of A Negatively
Screened S&P500 Fund From 1990-2018
Tyler M. Van Gilder
Friday, May 17th, 2019
ABSTRACT
In daily life, humans tend to not exhibit pure selfishness. Some level of altruism is in
most individuals’ self-interest. Does the same hold true for investment? This paper argues that it
is in an individual’s interest to invest in a cause he supports. I examine socially responsible
investing and its impact on fund performance. I then construct my own socially responsible fund
by negatively screening components (yielding a separate, ‘unethical’ fund) from Standard and
Poor’s S&P500 Index. I examine the ethical and unethical funds’ performance on a semi-annual
basis from 1990-2018 and compare each portfolio’s total return and risk-adjusted return to the
underlying index and sets of random portfolios. I conclude that ethical funds do not outperform
either traditional or ‘unethical’ funds.

Tyler M. Van Gilder Table of Contents
Table of Contents
INTRODUCTION ..................................................................................................................... 1
HISTORY ................................................................................................................................ 4
LITERATURE REVIEW ............................................................................................................ 10
MEASURES OF PERFORMANCE ............................................................................................. 15
DATA AND METHODOLOGY ................................................................................................. 18
RESULTS AND ANALYSIS ....................................................................................................... 21
Robustness .................................................................................................................................. 23
Discussion .................................................................................................................................... 24
Limitations................................................................................................................................... 25
CONCLUSION ....................................................................................................................... 28
Appendix A: Quick Reference Tables and Figures ................................................................. A-1
Table 1: GICS Sub-Industry Screening .......................................................................................... A-1
Figure 1: Return of $100,000 from 1990-2018; Pre-Outlier ........................................................... A-3
Figure 2: Return of $100,000 from 1990-2018; Post-Outlier (Log-Scaled Vertical Axis) .................. A-4
Table 2: Ethical Portfolio Regression of Excess Portfolio Return on Excess Market Return ............ A-5
Table 3: Sin Portfolio Regression of Excess Portfolio Return on Excess Market Return .................. A-5
Table 4: Random 1 Portfolio Regression of Excess Portfolio Return on Excess Market Return ....... A-5
Table 5: Random 2 Portfolio Regression of Excess Portfolio Return on Excess Market Return ....... A-6
Table 6: Random 3 Portfolio Regression of Excess Portfolio Return on Excess Market Return ....... A-6
Table 7: Random 4 Portfolio Regression of Excess Portfolio Return on Excess Market Return ....... A-6
Table 8: Random 5 Portfolio Regression of Excess Portfolio Return on Excess Market Return ....... A-7
Table 9: Summary Table of Regression Results, Pre-Outlier ......................................................... A-8
Table 10: Sin Portfolio Regression of Excess Portfolio Return on Excess Market Return ................ A-9
Table 11: Random 1 Portfolio Regression of Excess Portfolio Return on Excess Market Return ..... A-9
Table 12: Random 2 Portfolio Regression of Excess Portfolio Return on Excess Market Return ..... A-9
Table 13: Random 3 Portfolio Regression of Excess Portfolio Return on Excess Market Return ... A-10
Table 14: Random 4 Portfolio Regression of Excess Portfolio Return on Excess Market Return ... A-10
Table 15: Random 5 Portfolio Regression of Excess Portfolio Return on Excess Market Return ... A-10
Table 16: Summary Table of Regression Results, Post-Outlier .................................................... A-12
Appendix B ......................................................................................................................... B-1

Tyler M. Van Gilder Table of Contents
The Valdez Principles ................................................................................................................. B-1
Appendix C: Stata Do-Files and Output ............................................................................... C-1
Output 1: Standard Portfolios & Random Portfolios .................................................................... C-1
Output 2: Portfolio Random 1 Generation ................................................................................. C-13
Table 17: Portfolio, Random Number Generator Seed, and corresponding GICS Codes ................ C-15
Output 3: Outlier Analysis ......................................................................................................... C-16
Figure 3: Scatterplot of Sin Portfolio Outliers ............................................................................. C-20
Figure 4: Scatterplot of Portfolio Random 1 Outliers .................................................................. C-21
Figure 5: Scatterplot of Portfolio Random 2 Outliers .................................................................. C-21
Figure 6: Scatterplot of Portfolio Random 3 Outliers .................................................................. C-22
Figure 7: Scatterplot of Portfolio Random 4 Outliers .................................................................. C-22
Figure 8: Scatterplot of Portfolio Random 5 Outliers .................................................................. C-23
Output 4: Regression Analysis Post Outlier Removal .................................................................. C-24
Random 1 Portfolio Post Outlier ................................................................................................ C-27
Random 2 Portfolio Post Outlier ................................................................................................ C-30
Random 3 Portfolio Post Outlier ................................................................................................ C-33
Random 4 Portfolio Post Outlier ................................................................................................ C-36
Random 5 Portfolio Post Outlier ................................................................................................ C-39
REFERENCES ................................................................................................................... REF-1

Tyler M. Van Gilder Introduction
1
INTRODUCTION
Humans act in their self-interest, but they are not selfish. We observe varying levels of
altruism in our everyday life; holding the door for a stranger, helping an old lady across the
street, giving food to a panhandler. These activities all come at personal cost to individuals, yet
they still take place. People act in this way because the personal benefit that their actions bring
outweigh their personal cost; furthermore, there is social benefit gained through their actions.
These positive externalities are the premise by which socially responsible investment shapes
myriad industry.
This paper compares the return of a socially responsible investment (SRI) portfolio, its
underlying index, and a ‘sin’ portfolio. I assert that the socially responsible portfolio will
outperform the other two portfolios. A cause can be anything: gun control, environmental
protection, Christian values, Muslim values, Jewish values, pro-choice, pro-life, pro-cat, pro-dog,
etc. Causes frequently have a normative judgment associated with them. Abortion is ‘wrong,’ or
guns are ‘evil.’ Gun control is ‘right’ or pro-life is ‘good.’ We can oppose wrong or evil causes
by ‘negatively screening’ them from our lives. With a negative screen we remove or subtract the
opposed cause from our lives; we might avoid going to an abortion clinic or never purchase a
gun. The other option would be ‘positive screening.’ We can add or include a cause by actively
protesting outside of an abortion clinic or advocating for gun control legislation. In applying
these screens we hope to make the world a better place for current and future generations.
Just like how we screen causes in our personal lives so too can we screen for causes in
investments. Most people invest in the financial profit cause; however, doing so puts them in a
perverse equilibrium where they are funding the very causes they actively fight. Cause-based

Tyler M. Van Gilder Introduction
2
investing is the solution to this problem. With cause-based investing, people are incentivized to
invest in companies whose causes they support while shunning causes they disapprove of.
This paper conducts a case study of the S&P 500 Index (the ‘underlying index’) from
1990 – 2018. I construct a socially responsible fund (SRF) by analyzing the historical
constituents of the S&P 500 on a semi-annual basis. From these constituents I negatively screen
companies based on their Global Industry Classification Standard (GICS) code. The negative
screen has a ‘left-leaning’ association or cause to it; I am screening out coal & consumable fuels
(10102050), aerospace & defense (20101010), tobacco (30203010), casinos (25301010), and
alcohol (30201010 and 30201020)).
Once the underlying index has been screened, I compare my SRF, the underlying index,
and the removed ‘sin’ portfolio. I compare total return and risk-adjusted return, using the Sharpe
Ratio and Jensen’s Alpha. Sharpe’s Ratio allows for ordinal ranking of the funds while Jensen’s
Alpha is used to determine how much additional performance is gained (lost) as a result of the
investment strategy. A higher Sharpe Ratio indicates a higher risk-adjusted return; portfolios are
may be ranked ordinally using this concept. I find that the unethical portfolio outperforms both
the ethical portfolio and the SP500 on an absolute basis but has an inferior return on a risk-
adjusted basis. No strategy has statistically significant excess performance.
To assess the robustness of the primary results of this paper, portfolios consisting of
random subsets of the S&P500 are constructed, and their performance is measured. These
subsets are used to demonstrate that the ‘unethical’ strategy is, in fact, generating excess absolute
return or lower-risk adjusted return due to non-chance factors. As a final check, outliers are
removed from each of the sin and random portfolios and their performance is then recalculated.

Tyler M. Van Gilder Introduction
3
This further demonstrates that the fundamental underlying investment strategy is the cause of
any excess return, as opposed to luck.
The rest of the paper is broken down as follows: the history section explores SRI from
biblical times to modern day. The literature review explores common academic approaches to
SRI analysis and how they are relevant to this study. Data and methodology describe the data
used in this paper, as well as the explicit steps to manipulate the data and create the portfolio
returns. Results & analysis discusses the paper’s primary findings and implications; conclusion is
eponymous.

Tyler M. Van Gilder History
4
HISTORY
Socially responsible investment (SRI) has primarily religious origins. The Bible, Torah,
and Quran all impose restrictions on the activities of individuals. These restrictions can be both
dietary and financial; both types of restrictions have economic implications. The Torah (and the
Old Testament) outlines financial restrictions on loans in Ezekiel 18:13 and 18:17:
“….he that hath not given forth upon interest, neither hath taken any increase, that
hath withdrawn his hand from iniquity, hath executed true justice between man
and man…that hath withdrawn his hand from the poor, that hath not received
interest nor increase, hath executed Mine ordinances, hath walked in My statutes;
he shall not die for the iniquity of his father, he shall surely live…” (Ezekiel 18:8,
18:17).
The Torah proscribes loans with (excessive) interest. It is in line with Jewish law to give
out fair loans; unfair loans are implied to beget a death penalty. Further restricted loan activity is
listed in Exodus 22:25 – 22:27. Leviticus 25:36 – 25:55 also deals with loan restrictions and
prohibits slavery. There are even rules for land use -- Exodus 23:10 - 23:11 outline six years of
farming with a mandatory seventh year of rest for the land. How are these rules socially
responsible? The interest rules are an attempt to prevent a ‘poverty trap’ for some very poor
individuals in Jewish society. A high interest rate for an indigent borrower may make the
borrower incapable of ever repaying his loan and he will therefore remain in poverty indefinitely.
The land restriction is a common farming technique (though not necessarily in a six years on,
one year off format) to not wear down arable land. This technique sacrifices short term profit of
the farmer, since he ‘loses’ some of his crop yield 14% of the time. It is a socially responsible
rule in the sense that long term profits of both the farmer and society are increased; i.e. the land
is not depleted as quickly and continues to produce crops for a much longer time period. Note

Tyler M. Van Gilder History
5
also a sense of ‘responsibility’ or ‘respect’ for the Earth in this example; this is the very premise
of ‘eco-friendly’ movements today.
Kashrut, or the Jewish dietary laws, place restrictions on which animals the Jewish
people may eat. Kashrut compliant food is colloquially referred to as kosher. Leviticus 11 and
Deuteronomy 14 outline most of the dietary restrictions. Any animal that is “…wholly cloven-
footed, and cheweth the cud…” may be eaten (Leviticus 11:3). Sheep, goats and cows are kosher
while pigs and rabbits are not. The link to social responsibility by imposing restrictions on a
community’s diet is slightly more complicated. Economic harm is easy to see; farmers/shepherds
cannot raise certain animals and society has less food as a whole. The gains are primarily in the
form of fewer sick individuals. Much of the foods proscribed are scavengers and animals with an
unknown cause of death. In light of this, the rules are clearly intended to prevent people from
getting sick by consuming tainted meat. An animal with an unknown cause of death is most
likely diseased. Scavengers may have posed a higher risk (greater chance of carrying harmful
bacteria) than non-scavengers. In this way any losses from a restricted food supply are
presumably negated by gains in well-being and health. Sick worshipers are, after all, not very
productive worshipers.
The Quran also imposes financial and dietary restrictions upon Muslim worshipers. The
Quran 2:173,4:43, and 5:3 explain the dietary restrictions for Muslims. Quran compliant foods
are called halal (lawful). The Quran imposes financial restrictions in Quran 2:275, 3:130, 4:161,
and 30:39. These restrictions are designed to prevent what is called riba (usury); these verses
provide the basis for modern day Shariah complaint investing, i.e. they outline what is halal and
what is haram (unlawful). Muslim individuals do not invest in companies that charge compound
interest, as they consider it to be riba. Furthermore, they do not invest in companies that produce

Tyler M. Van Gilder History
6
alcohol or pork, and they do not invest in gambling (casinos). The foregoing proscriptions are
likely intended to increase worker productivity. Drunks cannot work as hard as sober individuals;
pork is hard to cook thoroughly and is a common carrier of trichinella, a bacterium that can cause
diarrhea and vomiting. Furthermore, this bacterium can be passed along from pigs to other
livestock; therefore, harming the pig industry produces a positive externality for the other
livestock industries, i.e. fewer sick animals. Interest provisions are again intended to prevent a
‘poverty trap.’ I assume that Mosques prefer revenues come to them rather than casinos; those
prohibitions may also be designed to protect women and children from husbands who are serial
gamblers.
Fast forward a millennium to the mid-1700s. The Reverend John Wesley, an English
Methodist, gave a sermon titled “The Use of Money.” Based on Luke 16:9, Wesley outlines how
to operate in the economy in an ethical manner. He prohibits poaching, pawning goods, charging
excessive interest and even selling below market price to put others out of business (Wesley,
Section 1 Paragraph 3). He also prohibits the consumption of ‘liquid fire,’ or alcohol (Section 1
Paragraph 1). Wesley is yet another example of religion at the forefront of socially responsible
investment. His sermon encourages worshippers to use their funds in an ethical manner by
avoiding certain industries and practices, such as alcohol and high interest loans.
Around the same time period in America, the Quakers (Society of Friends) began to
publicly denounce slavery; Quakers were prohibited from investing in the slave trade. The
Quakers would actively lobby and petition local governments to prohibit slavery; this grassroots
movement would influence the abolition movement in America for centuries to come, persisting
through the Civil Rights movement in the 1960s and possibly to present-day America through
Tyler M. Van Gilder History
7
anti-discrimination laws and reforms. The Quakers highlight how a community can use its
financial and political power to support a socially responsible cause.
Modern day SRI began around the mid-20th century. Three of its major contributions
during that time period, from the mid-1900’s to present, was the creation of the Valdez
Principles (1990), mass divestment from South Africa as a result of the South African National
Party’s Apartheid policy (1960-1988) and providing financial support to facets of the Civil
Rights movement (1954-1968). Beginning in 1960s, churches and businesses began to invest in
minority groups and divest from or protest against businesses that were perceived as unethical.
The 1967 Dow Chemical protests over the use of napalm in Vietnam is the first example of
investors excluding arms manufacturers from their portfolios. Also in 1967, the Ford Foundation
announced “higher-risk, lower-return investments in minority businesses, housing, and
conservation projects” (Bruyn 1987, p.1). In 1968, the General Assembly of the Presbyterian
Church established the Presbyterian Economic Development Corporation. Their goal was to
invest in minority housing, minority businesses, and banks that had a strong record of providing
loans to minorities (Bruyn 1987, p.2). In 1977, General Motors, through pressure by board
member Reverend Leon Sullivan, divested its holdings in South Africa. Groups that failed to
divest their South African assets, such as Dutch Royal Shell and Coca-Cola, were met with
consumer boycotts (Judd 1990, p. 42). In 1988, the United States passed a tax code change that
prevented businesses from deducting their operating expenses in South Africa. The South
African National Party ended their Apartheid policy in 1994; whether or not this decision was
the direct result of socially responsible investment is unclear. However, the constant financial
pressure the South African government faced surely didn’t assist their situation. These tiny
victories, propagating into wide-scale success, are the basis for an individual to undertake

Tyler M. Van Gilder History
8
socially responsible investment; who can say with certainty widespread economic sanctions
would have emerged were it not for the smaller individual sanctions placed on South Africa?
Socially responsible investment’s other major success was the Valdez Principles
(Appendix B), a set of environmentally friendly guidelines established in 1990 that companies
may adopt. Companies that adopt these principles signal to investors that they are
environmentally friendly; whether or not they follow through on their promises, only time can
tell. However, it can be a differentiating factor between two different companies in helping an
investor decide where to place his funds. In line with most environmentally friendly practices,
the Valdez Principles provide economic benefit by helping to distribute resources, especially
non-renewable resources, across time. Environmental socially responsible investment aims to
preserve resources, and the Earth, for future generations. In the present day, if a company
adopted and followed the Valdez Principles, it would contribute to that company’s
environmental, social, and governance (ESG) score.
Modern day SRI has three forms: shareholder activism, guideline portfolio investment,
and community development investing (Shapiro 1992, p. 5). Shareholder activism involves
using publicly traded shares of a company to try and effect change within said company’s
management, typically through corporate voting. An activist shareholder would generally try to
obtain representation on the board of directors or assume a large enough ownership position in
the company to bring forth a motion. There are many types of shareholder activism and not all
are necessarily socially responsible in the context of this paper.
Guideline portfolio investment is self-explanatory and involves setting rules for a
portfolio and then following them. Guideline portfolio investment does not have to be socially
responsible, but it is one of the tools which socially responsible investors can use. An SRI

Tyler M. Van Gilder History
9
guideline might be ‘do not invest in tobacco companies.’ These guidelines can involve both
negative and positive screening as the strategies are not mutually exclusive. This form of modern
day socially responsible investment is the primary focus of this paper. Much of the historical
forms of socially responsible investment we have seen were guideline portfolio investment and
community development investment.
Community development investing might involve investing in parks or schools for local
communities. It sometimes refers to investment in poor communities; examples range in size and
scope and include affordable housing, food drives/pantries, or urban renewal projects. This paper
does not address the efficacy of community development or community investment, nor does it
attempt to analyze the returns of community development investing but does include it as a tool
that some socially responsible investors use.

Tyler M. Van Gilder Literature Review
10
LITERATURE REVIEW
Socially responsible investment (SRI) is a subset of portfolio management. Some people
interpret it as a form of active management while others view it as passive, rules-based investing.
Therefore, much of the literature is focused on case studies and performance measurements. The
literature is generally diverse and provides evidence for outperformance of both ethical funds
and ‘sin’ based funds.
Jonas Nilsson (2008) examines investor attitude and perceived financial performance of
SRI funds in Sweden. The author conducted a survey of 2200 Swedish mutual fund investors in
order to determine investor attitude towards socially responsible investments; he collected data
“regarding age, gender, place of residence, income, and education” (Nilsson 2008, p. 314). He
also collected data regarding SRI characteristics, pro-social attitudes, and the percentage of total
portfolio invested in SRI funds. He found that a majority of investors, 72.9%, perceived a similar
or higher return of SRI funds relative to normal funds, and that 84.7% perceived a similar or
lower risk of SRI funds relative to normal funds (p. 317). The author then ran a regression to see
how the foregoing characteristics affected what percentage of their portfolio investors placed into
SRI funds. He found that “perception of return is significantly related to SR-investment” and that
“…people with high levels of pro-social attitudes…were more likely to invest a greater
proportion of their portfolio in SRI profiled mutual funds” (p. 319). Nilsson’s research indicates
that investors have both financial and social motivations for investing in socially responsible
funds. The greater the cause premium, consisting of both financial and social gain, the more
likely an individual is to invest in a cause. His research does not hint at the existence of a cause
premium, but rather indicates that investors are amenable to cause-based investing if the
financial returns are similar to traditional investing.

Tyler M. Van Gilder Literature Review
11
In an effort to explore the cause premium further, we turn to Berry and Yeung (2013) to
investigate investor willingness to further support socially responsible causes. They use a postal
questionnaire, sent to existing ethical clients of an investment firm, to gauge whether investors
will avoid ethical funds if a financial penalty exists for acting ethically. The clients were asked to
allocate a hypothetical £100,000 among financial and ethical portfolios. The clients were
grouped into three categories based on their responses to the survey: materialistic (35%),
opportunistic (11%), and committed (54%) (Berry and Yeung 2013, p. 485). Materialistic
investors preferred financial gain to ethical gain, opportunistic investors were indifferent
between financial and ethical gain, and committed investors preferred ethical gain to financial
gain. These results strongly support the existence of a mental cause premium. A majority of
respondents remained committed to their ethical investing strategies even though a larger
financial gain could be had. Their research is also indicative that the mental premium is not as
large as I believe it to be; the flip side to my previous statement is that 35% of respondents broke
with the ethical investment strategy to secure further financial gain. Further research extending
Berry and Yeung’s work could help to quantify the mental cause premium.
Humphrey, Warren and Boon (2016) investigate how socially responsible funds differ
from traditional funds. The authors analyzed manager characteristics and fund performance of
socially responsible and non-socially responsible funds. They found that socially responsible
funds are not significantly different from non-socially responsible funds, in both manager
characteristics and performance related measures. The authors’ results indicate that this paper’s
socially responsible fund should not be inferior, financial return-wise, to the underlying index. If
these results are accurate, then investors should benefit by investing in a cause-based fund, since
they will harness the proposed mental cause premium.

Tyler M. Van Gilder Literature Review
12
Statman and Glushkov (2016) investigate the financial return of socially responsible
funds. They use a six factor model: (1) small-large capitalization, (2) value-growth, (3)
momentum, (4) market returns in excess of treasury bills, S&P500 returns in excess of treasury
bills, KLD 400 return in excess of treasury bills, (5) ‘top-bottom factor’ (TMB) and (6)
‘accepted-shunned factor’ (AMS) (Statman and Glushkov 2016, p. 144). Overall, their model
found no statistically significant outperformance of socially responsible companies (p. 148). Of
interest are their TMB and AMS factors. TMB is essentially a positive screen, where investors
seek out companies with pro-social factors and AMS is a negative screen, where investors shun
negative characteristics. The authors find that TMB provides statistically significant positive
alpha to a fund’s return while AMS provides statistically insignificant negative alpha to a fund’s
return (p.149). Their research bodes poorly for this paper’s socially responsible fund; since I am
utilizing a negative screen, I should end up with negative alpha associated with the AMS factor.
The general problem in this field, illustrated in Statman and Glushkov (2016) but not specific to
them, is the lack of statistical significance of most performance measures.
Fernandez-izquierdo and Matallin-saez (2008), Bertrand and Lapointe (2015), and Mallin
and Briston (1995) all analyze the performance of ethical investment funds relative to traditional
investment funds. They all generally find that socially responsible funds have slightly superior
returns, but they fail to achieve statistical significance in their return measures.
Trinks and Scholten (2017) provide evidence to the contrary. They use mean-variance
analysis to analyze the performance of ‘sin portfolios’ relative to the market and of negatively
screened portfolios relative to the market (Trinks and Scholten 2017, p. 195, 200). They find that
sin portfolios statistically outperform the market, while negatively screened portfolios
statistically underperform. Different sins have different levels of (out)performance, primarily due

Tyler M. Van Gilder Literature Review
13
to their size; for example, negatively screening alcohol results in a significant decrease in overall
market capitalization relative to negatively screening adult entertainment (p. 201-202). Trinks
and Scholten make a strong case for the outperformance of ‘sin portfolios’ and the
underperformance of negatively screened portfolios. Restricting the investment universe
naturally makes a portfolio less diversified and generally reduces risk-adjusted performance
measures. The main issue with Trinks and Scholten is that their analysis is for a single time
period of 1991-2012, with no sub-period analysis. Return analysis is, in general, highly sensitive
to the time period being analyzed. They would make a more compelling argument with a larger
case study involving sub-period analysis.
I field an additional argument from Adler and Kritzman (2008) regarding the
underperformance of socially responsible investment. Adler and Kritzman perform Monte Carlo
analysis to simulate the returns of restricted investment portfolios, a proxy for a socially
responsible fund (Adler and Kritzman 2008, p. 53-4). The authors find that the greater the skill
an investor has, the higher the opportunity cost to restricting their investment universe (Adler
and Kritzman, p. 55). A restricted investment universe is a common argument used to oppose
socially responsible investment. The authors make a strong case that a highly skilled investor
incurs an opportunity cost when restricting his investment universe. The problem with their study
lies with the ‘skill’ factor and the inclusion of some costs but not others. The authors are clearly
writing about institutional investors, as their baseline portfolio value is $1 billion. This paper
targets a much smaller, likely non-institutional, investor. As such, the skill level of this paper’s
investor declines, most likely to chance or sub-chance levels. It is therefore highly unlikely these
unskilled investors have an opportunity cost; in fact, the authors’ own paper indicates that at a
50% correctness level, investors realize a gain by restricting their investment universe (Adler and

Tyler M. Van Gilder Literature Review
14
Kritzman, p. 55). Furthermore, the calculation of opportunity cost in this paper is purely
financial. It does not take into account gains from less pollution, less environmental damage,
fewer gun deaths, etc. that may be realized from significant investment in socially responsible
funds.

Tyler M. Van Gilder Measures of Performance
15
MEASURES OF PERFORMANCE
Harry M. Markowitz, William F. Sharpe, Jack L. Treynor, Michael C. Jensen, and
Eugene Fama all made seminal contributions to the field of portfolio management and analysis.
Most of the other papers involving SRI use their analytical framework to assess socially
responsible portfolios. Markowitz (1952) provides the framework for choosing a portfolio. His
work demonstrates that investors should not only be concerned with total return of a portfolio but
also with the variance of those returns. Through the use of geometric proofs, he describes a set of
‘efficient portfolios,’ for which variance is minimized while return is maximized (Markowitz
1952, p. 87). Speaking plainly, Markowitz identifies portfolios for which an investor receives the
greatest return for the risk he takes. This type of analysis, mean-variance analysis, is the primary
system this paper uses to assess the performance of the three funds (socially responsible,
underlying index, sin fund) and five random funds. This paper will not remark on whether or not
a fund is efficient in a global sense, but rather whether or not a fund is efficient relative to the
other funds being measured.
William F. Sharpe’s “The Sharpe Ratio” (1994) remarks on his ratio and its potential
uses for mean-variance analysis. His ratio may be used both ex ante and ex post; this paper will
use the ex-post ratio, defined as:
𝑆ℎ ≡ √�̅�
𝜎𝐷
(1)

Tyler M. Van Gilder Measures of Performance
16
Sharpe (1994, p. 50, equation 6). Sh is the ex-post Sharpe Ratio, D is the average value of the
return of a fund in excess of the risk-free rate, and σD is the standard deviation of the fund. The
ratio “indicates the historic average differential return per unit of historic variability of the
differential return” (Sharpe 1994, p. 50). A higher Sharpe ratio indicates greater return for a
given level of risk. In Markowitz’s terms, a higher Sharpe ratio would indicate a more efficient
portfolio. The Sharpe Ratio will thus allow for an ordinal ranking of the three funds. As a test of
the statistical significance of the Sharpe Ratio, I use the method outlined in Bailey and Lopez de
Prado (2012).
The Treynor ratio is an additional ordinal ranking measure. It is designed to measure
return in excess of market return. Its general form is 𝑇 ≡𝑟𝑖−𝑟𝑓
𝐵𝑖 , where T is the Treynor ratio, ri
is the return of the fund, rf is the risk-free rate and Bi is the beta of the portfolio (covariance with
the market) (Treynor 1965). Bi will use the SP500 for the market when calculating the
covariance between my funds and the ‘market.’ This would mean that the underlying index will
have B = 1; the socially responsible portfolio will also have a B near 1.
While the previous measures allow for ordinal ranking between funds, Michael C.
Jensen’s alpha (1968) is a measure which represents the financial gain from a particular strategy.
Jensen’s alpha is defined as:
𝛼𝑗 ≡ 𝑅𝑖 − [𝑅𝑓 + 𝛽𝑖𝑀 ∗ (𝑅𝑀 − 𝑅𝑓)]
(2)
(Jensen 1968, p. 400, equation 8). αj is Jensen’s alpha, Ri is the return of the portfolio, Rf is the
risk-free rate, βiM is the beta (covariance) of the portfolio with the market, and RM is the return of
the market. This paper will use historical 90-day Treasury Bill rates for the risk-free rate (Rf) and

Tyler M. Van Gilder Measures of Performance
17
use historical average S&P 500 6 month returns for beta and market return. Note that one of the
three portfolios studied in this paper, the underlying index, will have an alpha of zero. A positive
alpha for the SRI portfolio is evidence of a cause premium. A negative alpha for the SRI
portfolio is evidence of a cause sacrifice.
Note also that Jensen’s alpha can be rewritten as a regression equation:
𝑅𝑖 − 𝑅𝑓 = 𝛼𝑗 + [𝛽𝑖𝑀 ∗ (𝑅𝑀 − 𝑅𝑓)]+ ∈ (3)
Where the excess return of the portfolio relative to the risk-free rate is regressed on the excess
return of the market relative to the risk-free rate. Jensen’s alpha is the y-intercept of this
regression.

Tyler M. Van Gilder Data and Methodology
18
DATA AND METHODOLOGY
Data of the historical constituents in the SP500 is taken from the Bloomberg terminal
(and ultimately is from Thomson Reuters), through their SPX <Index> MEMB <GO> function.
A custom screen of ticker, price, GICS sub-industry identifier, and market capitalization is
generated and imported into Microsoft Excel. The data is taken for the period of 1990-2018.
From this list, I screen for and remove the GICS sub-industry companies outlined in Appendix
A, Table 1. This screen was constructed with religious-historical preferences in mind, i.e. screen
for alcohol, tobacco, gambling, weapons, and environmental health (oil). Application of the
negative screen resulted in an ethical portfolio of average size 481 and an unethical portfolio of
average size 19 over the time period. The risk-free rate of return used is the 3-month treasury bill
(T-bill), available online at the US Treasury website.
Once the foregoing industries are removed, I separate the three funds by composition.
I then sum the market capitalization of the individual companies within the three funds. This
process is repeated for the data every 6 months, from January 1st, 1990 until June 31st, 2018. Of
note is that I track the performance of each fund for a 6-month period (the holding period) and, at
the end of the period, screen the SP500 again to re-form the three funds. This process generates
56 data points representing market capitalizations of the socially responsible fund, the unethical
fund, and the SP500 at 6-month intervals. Using these data points, I calculate the total return for
every period across all 28 years, resulting in 55 return data points. Dividends are not included in
this analysis; this may impact the results, particularly because the negatively screened industries
generally provide higher dividend yields than the remaining industries. Table 1.1 on the
following page summarizes the above information.

Tyler M. Van Gilder Data and Methodology
19
Table 1.1: Descriptive Statistics; Returns by Portfolio
Portfolio Obs No. Comp.
Mean Geo. Mean
Std.Dev. Min Max Skew. Kurt.
SP500 55 1260 .051 0.045 .1 -.35 .208 -1.159 6.074 Ethical 55 1118 .051 0.045 .102 -.351 .211 -1.128 5.937 Sin 55 36 .058 0.050 .131 -.323 .384 -.416 4.471 Ran1 55 36 .074 0.062 .152 -.486 .422 -.745 5.314 Ran2 55 19 .129 0.087 .424 -.328 2.391 4.335 22.161 Ran3 55 35 .055 0.045 .142 -.5 .484 -.645 6.794 Ran4 55 28 .088 0.077 .151 -.324 .642 .427 6.056 Ran5 55 22 .155 0.092 .608 -.389 4.35 6.139 42.792
Note: All observations are within the time period 1990-2018.
These returns are then annualized, and the annualized returns are used to calculate the
total returns, Sharpe Ratios, and alphas of the three funds. Total return for the period is
calculated by computing the geometric mean of the returns. The alpha is generated by regressing
the excess return of the fund on the excess return of the market, as shown in equation 3; the
constant term in the regression is the alpha of the fund. Sharpe Ratios are calculated by dividing
the arithmetic mean of the excess-return of the portfolio by the portfolio excess-return’s standard
deviation. This provides a best case upper-bound for the Sharpe Ratio and is primary reason why
the arithmetic mean is used rather than the geometric mean. As a check on the robustness of
these results, further analysis is undertaken to examine whether or not any outliers are driving the
returns of either portfolio; returns of specific companies within the sin portfolios are also
generated across all periods and tracked. Any company exceeding 1/20th of the total portfolio
return for that period is marked, removed, and then the total returns of the portfolios are
recalculated.
Finally, as an additional robustness check, random portfolios are also generated by
randomly sampling 5 GICS codes and then screening out those companies from the portfolio.
These random portfolios are then compared to the ethical, sin, and market portfolios. These
portfolios are created due to the relatively small size of the sin portfolio; rather than comparing a
portfolio of size 18 to a portfolio of size 482, the sin portfolio can be compared more fairly

Tyler M. Van Gilder Data and Methodology
20
(particularly on a risk-adjusted basis) to other portfolios of similar size. The process by which the
returns are calculated, as well as outlier identification and removal, is the same as in the
foregoing paragraph. Table 1.2 on the following page summarizes the regression results for the
pre-outlier portfolios.
For specific, step-by-step reference for how these returns were calculated, see Appendix
C for the Stata Do-files and corresponding Stata output. All of the Stata output was generated on
a Late 2011 MacBook Pro, macOS High Sierra, Version 10.13.6. Stata Version 15.1 for Mac, 64
bit.

Tyler M. Van Gilder Results and Analysis
21
RESULTS AND ANALYSIS
The unethical portfolio was more volatile and, while it had a higher absolute return, had a
lower risk-adjusted return relative to the ethical and market portfolios. The unethical portfolio
similarly had a greater alpha than that of the ethical portfolio; however, the alpha of both
strategies was statistically insignificant.
Figure 1 in Appendix A Table 1.2 on the following page shows the performance of the
separate funds; Figure 1 is an indicator of the excess volatility (of the unethical portfolio)
incurred by negatively screening the SP500 (i.e., restricting the investment set). Figure 1 further
indicates that the unethical portfolio outperforms the other investment strategies. Table 1.2 on
page 23 quantifies the visual; we see that the sin portfolio outperforms the market and ethical
portfolios in absolute terms, but when adjusting the annualized returns for risk, underperforms
the ethical and SP500 portfolios (i.e. has a lower Sharpe Ratio). Table 1.2, the regression results
of excess return of the portfolios on excess return of the market, indicate that both the ethical and
sins’ alphas are statistically insignificant; neither strategy yields an excess return that is
statistically different from zero.
In Table 1.2, we see that the ethical portfolio is nearly identical to the SP500 in returns; a
more robust screening procedure must be used to adequately screen companies from the SP500.
It is likely that rather than screening only unethical companies, ethical companies should also be
screened. Additionally, a more robust screening procedure, such as one that incorporates
Environmental, Social, and Governance (“ESG”) scores for each company (i.e. a movement
towards a factor-based screening), another MSCI-owned measure this paper discovered while
using their GICS sub-sectors; a transition from sub-sectors to ESG scores would be a marked
methodological improvement over the methods used in this study.

Tyler M. Van Gilder Results and Analysis
22
It is also possible that the SP500 is already too restricted an investment set to solely
negatively screen unethical companies. Macroeconomic trends have made the SP500 more
“ethical” in the traditional sense of the term; fewer polluters are capable of making it into the
SP500, which makes screening companies by sector a suboptimal strategy. A trend towards
services and technology has made the SP500 more “green,” or environmentally friendly, over
time. M&A activity, particularly reverse mergers, has further removed traditionally ‘unethical’
companies from the SP500, i.e. taken them private or merged them with a larger umbrella, which
hinders the ability to determine if said umbrella is ‘unethical’. Further research is required to
determine whether or not the SP500 can be effectively screened for superior performance.
The random portfolios, Random 1 through Random 5, also have insignificant alpha with
the exception of Random 4, which is significant at the 5% level. The returns vary from 9% to
19% for each of the portfolios, and the Sharpe ratios similarly vary from 0.25 to 0.49 (not
corresponding 1:1 to the prior range). Looking at each individual portfolio, Random 1 had an
absolute return slightly in excess of the market, ethical, and sin portfolios. Its volatility was
similar to that of those portfolios as well, as evidenced by the similar Sharpe Ratio of 0.49.
Random 1’s alpha was not statistically significant. Random 2 had a large absolute return and
alpha, but this return generated excess volatility as well, as seen by its Sharpe Ratio of 0.30.
Again, Random 2’s alpha was not statistically significant. Random 3 had a similar absolute
return to the market but exhibited greater volatility (Sharpe Ratio 0.39). Random 4 was the only
portfolio with a significant alpha (at 4.4% of the return attributable to the strategy). Its absolute
return was in excess of the market and it exhibited less volatility relative to its return as well
(Sharpe Ratio of 0.58). Random 5 had the highest absolute return at 19.33%; however, it had
extreme volatility (Sharpe Ratio 0.25). Overall, the random portfolios did not outperform the

Tyler M. Van Gilder Results and Analysis
23
market on a risk-adjusted basis; in general, a higher absolute return was accompanied by ever
increasing risk for that higher return. Lack of statistical significance, of course, prevents much
judgment on the efficacy of certain strategies relative to each other. The table below summarizes
the regression results of each portfolio before any outliers are handled.
Table 1.2 : Regression results, Excess Return of Portfolio on Excess Return of Market, Pre-Outlier
(1) (2) (3) (4) (5) (6) (7) (Ethical) (Sin) (Ran1) (Ran2) (Ran3) (Ran4) (Ran5)
exc_mkt 1.010*** 0.672*** 1.267*** 1.773*** 1.071*** 0.863*** 0.388 (0.004) (0.154) (0.113) (0.526) (0.126) (0.169) (0.830) _cons -0.001 0.024 0.010 0.040 0.001 0.044** 0.135 (0.000) (0.017) (0.013) (0.059) (0.014) (0.019) (0.093) Obs. 55 55 55 55 55 55 55 R-squared 0.999 0.264 0.703 0.176 0.578 0.330 0.004
Standard errors are in parenthesis *** p<0.01, ** p<0.05, * p<0.1
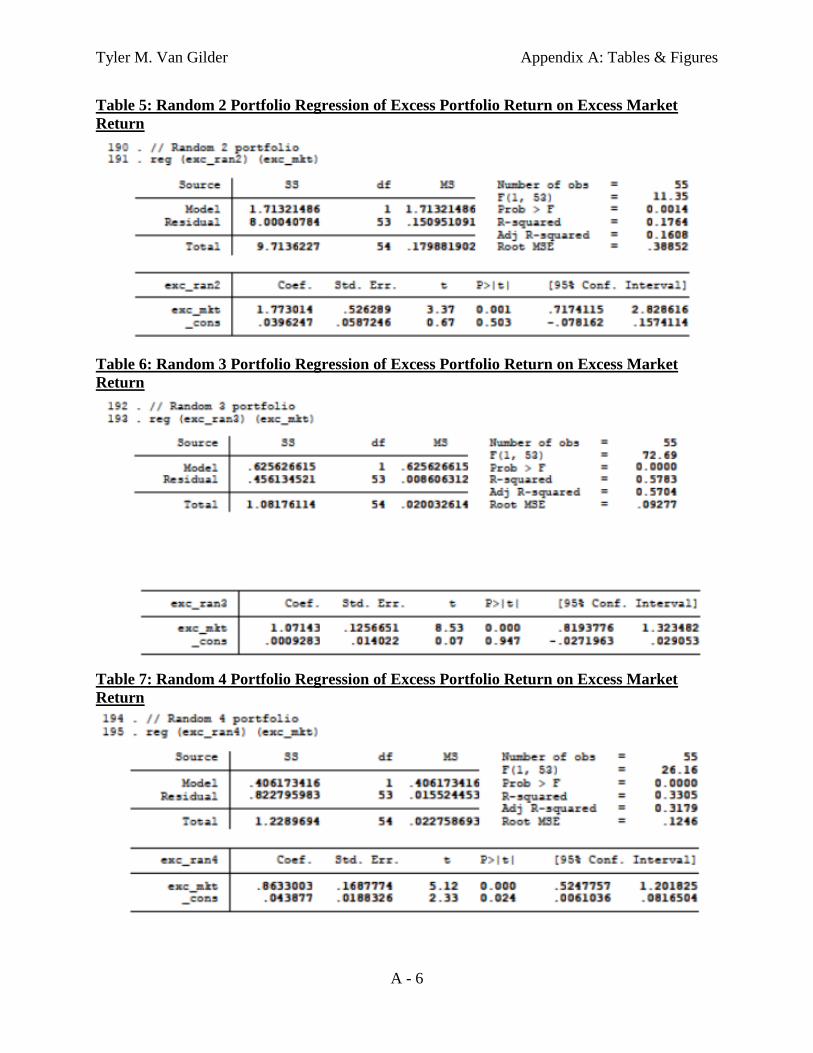
The in-depth regression results for the previous paragraphs may be found in Appendix A,
Tables 2 through 8. Table 9 summarizes the regression results as well as return data from
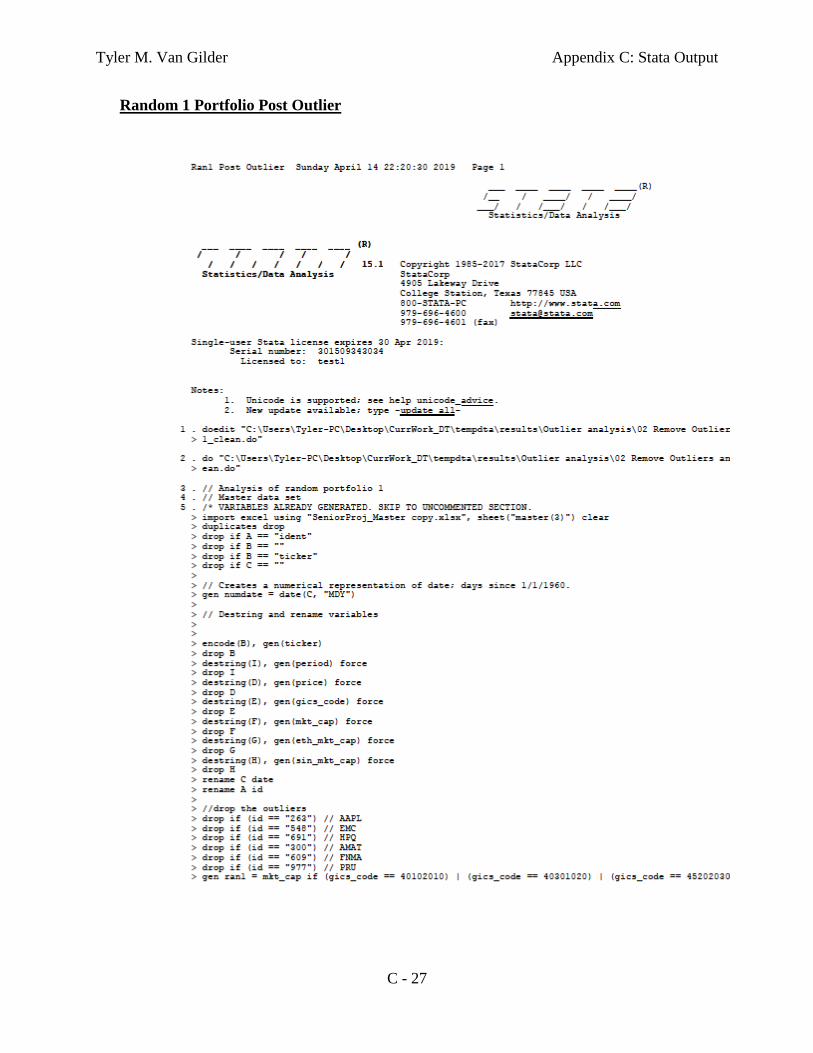
Appendix C, pp. C-1 to C-12. How the random portfolios were generated, and the steps by which
to replicate this process, may be found in Appendix C, pp. C-13 to C-15. Table 17 on p. C-15
highlights the seeds used in generating the random portfolios for quick reference. This concludes
the standard analysis; outlier analysis follows.
Robustness
Next, I analyzed each screened portfolio for outliers, such as the Sin and Random 1
through 5 portfolios, removed those outliers (if they existed), and then repeated the analysis for
outlier free portfolios. A company as considered an outlier if, for at least two periods, its return
was greater than 1/20th the return of the entire portfolio for those periods (i.e. a ‘size’ outlier).
This had similar (identical) results to flagging companies based on their return exceeding 3
standard deviations of the portfolio return; since the prior strategy is simpler to implement in

Tyler M. Van Gilder Results and Analysis
24
Stata, it was chosen over the latter strategy. A size outlier is removed from all periods; we will
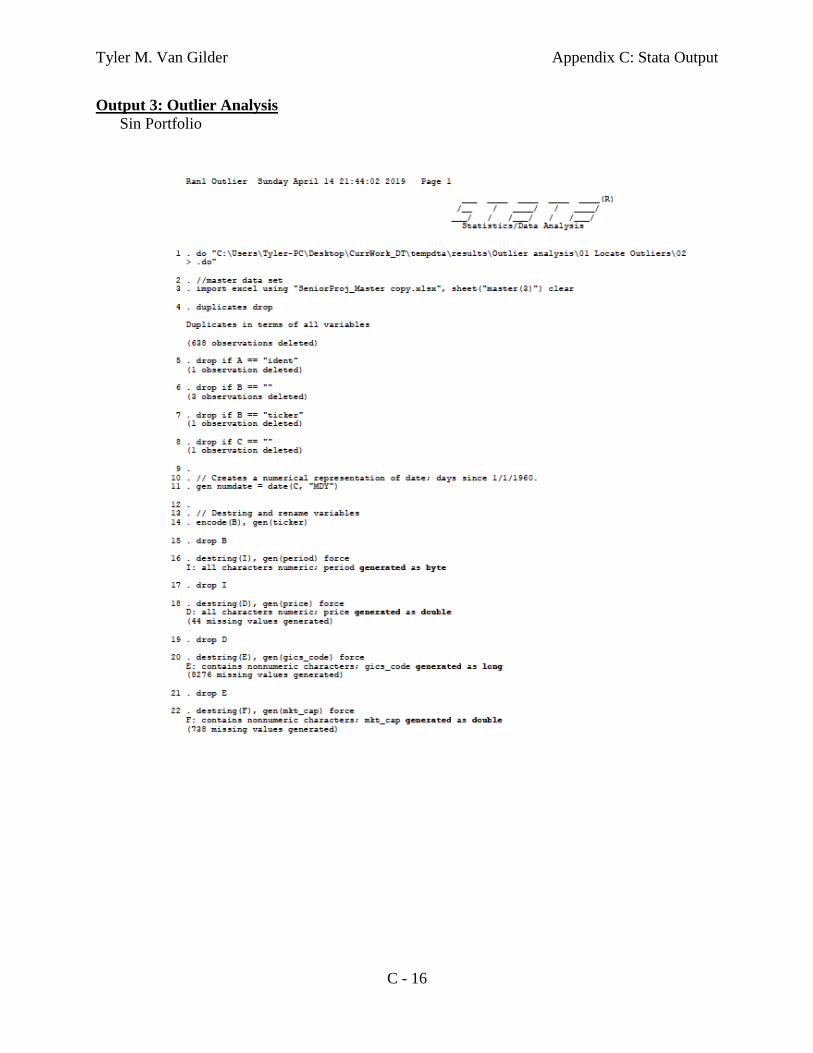
discuss the implications of this later. Appendix C, Output 3, pp. C-16 to C-18 outlines the
specific, step-by-step instructions for identifying and removing outliers from a portfolio. Figures
3 through 8, Appendix C, pp. C-20 to C-23 identify the outliers removed from their respective
portfolio.
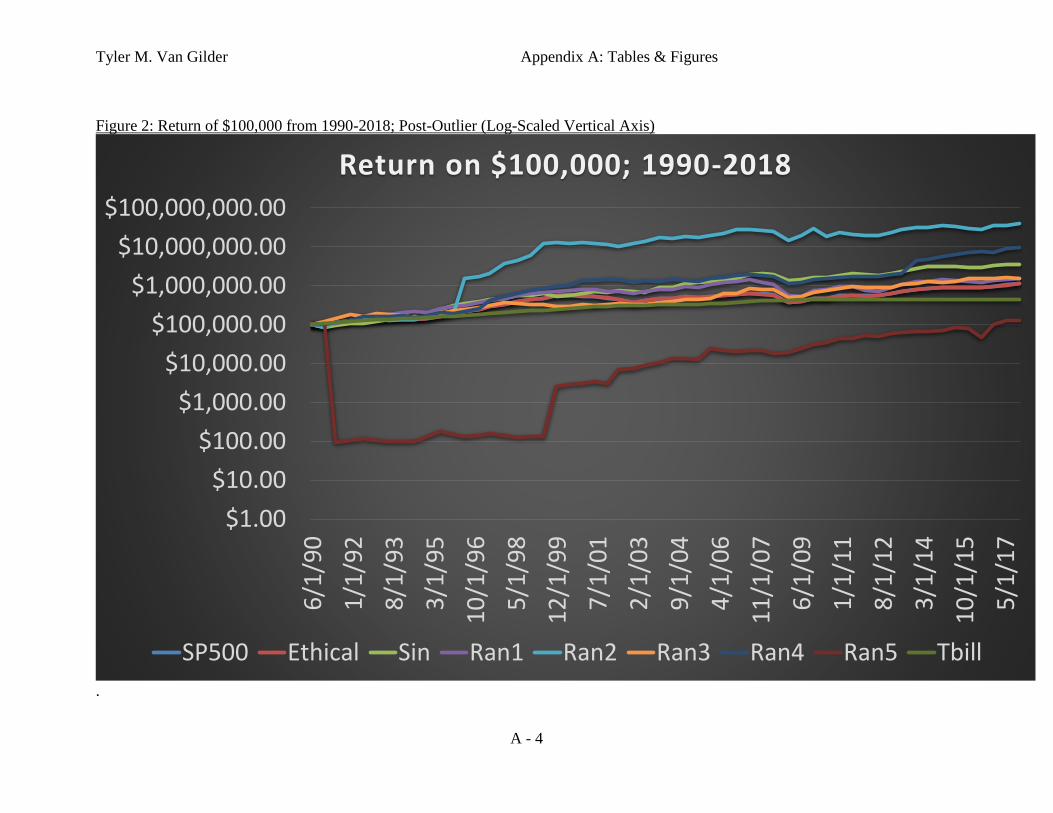
Table 1.3 below shows the performance of the separate portfolios; immediately apparent
is that Random 2 tremendously outperforms the other portfolios, and Random 5 suffers nearly a
total loss early on. It also appears as though the performance of the portfolios that had outliers
removed generally increased (barring, of course, the total loss). Table 1.3 below also summarizes
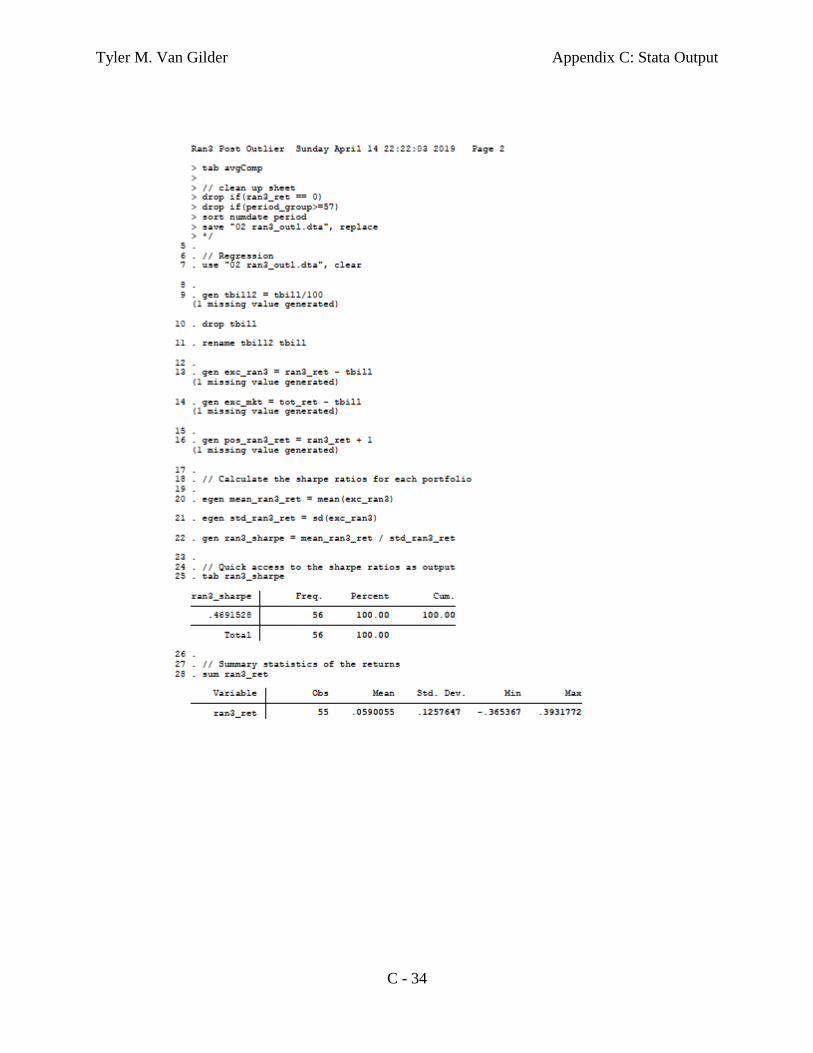
the returns of the set of portfolios. Most portfolios again have insignificant alpha; of note is that
the volatility of the portfolios generally seemed to decline as a result of removing the outliers
(i.e. most Sharpe Ratios seemed to increase). Also of note is that the post-outlier Sin portfolio
has a significant alpha and exhibits superior absolute and risk-adjusted return, relative to its pre-
outlier self as well as to the market and ethical funds.
Table 1.3 : Regression results, Excess Return of Portfolio on Excess Return of Market, Post-Outlier
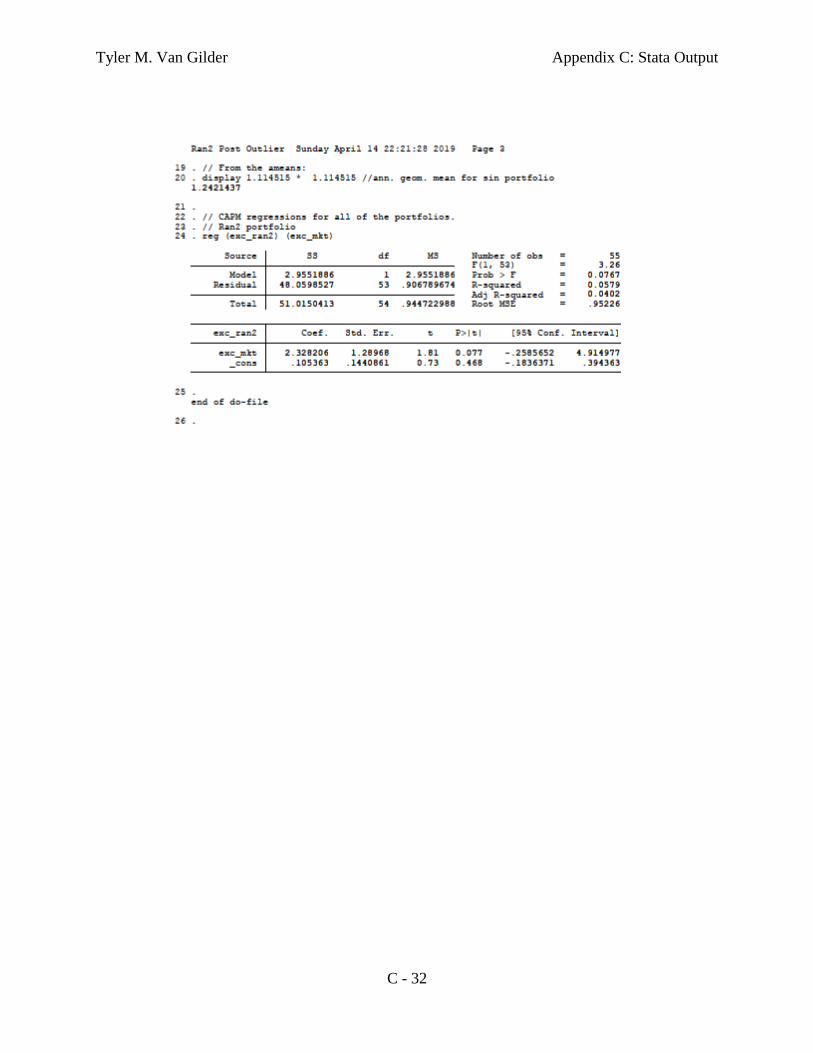
(1) (2) (3) (4) (5) (6) (Sin) (Ran1) (Ran2) (Ran3) (Ran4) (Ran5)
exc_mkt 0.793*** 1.100*** 2.328* 0.601*** 0.939*** 3.956 (0.150) (0.112) (1.290) (0.151) (0.235) (3.412) _cons 0.035** 0.006 0.105 0.029* 0.053** 0.230 (0.017) (0.013) (0.144) (0.017) (0.026) (0.381) Obs. 55 55 55 55 55 55 R-squared 0.344 0.645 0.058 0.231 0.231 0.025
Discussion
The prior results are likely due to some element of survivorship bias being introduced to
the analysis as a result of removing outliers across all periods; this transforms the problem from

Tyler M. Van Gilder Results and Analysis
25
an ex-ante analysis into an ex-post manipulation of the results. Even if an outlier is removed in
an ex-ante fashion, i.e. an outlier is flagged in one period, t, is then removed in the next period,
t + 1, then (possibly) reintroduced in time period t+2, this treatment is still questionable as it
changes the fundamental investment strategy (which, for this paper, is buy-and-hold with
rebalancing). A better design choice would be to control for size rather than accommodate size as
an outlier, such as in the common Fama-French 3- and 5-factor models (Fama and French, 1992,
2014). Another treatment, which was taken into account in this paper, is to incorporate the
volatility into the return itself, a-la Sharpe’s Ratio. Handling of outliers through removal begs a
further question: when is it good enough to stop? One round of outlier removal could result in a
second round, which could result in a third, etc. It’s unclear how many rounds are ‘acceptable’ or
‘methodologically sound;’ rather, controlling for size (or controlling for changes in volatility
implied by having a size outlier) is a sounder design choice.
The regression results for the post-outlier analysis are in Appendix A, Tables 10 through
15. Table 16 summarizes the results found in the regressions and Appendix C, pp. C-16 to C-23.
The specific outliers removed are shown in Appendix C, Figures 3 through 8.
The overall results for this paper are in-line with other literature reviewed; my results are
in line with Fernandez-izquierdo and Matallin-saez (2008), Bertrand and Lapointe (2015),
Statman and Glushkov (2016), Humphrey, Warren and Boon (2016), and Mallin and Briston
(1995). The foregoing papers fail to find statistically significant returns.
Limitations
Not including dividends is a significant methodological decision that could impact these
results. It is possible that, with dividend inclusion (and reinvestment), the alpha of one or more
strategies either improves or becomes significant. This analysis does not include any sort of cash

Tyler M. Van Gilder Results and Analysis
26
flow constraint either; for example, assume that the return from period 3 to period 4 is -50%. In
this paper’s strategy, there is a rebalancing from the end of period 3 to the start of period 4.
However, there may not be enough cash in the fund to rebalance and purchase the requisite
shares after incurring a 50% loss. The failure to consider cash flow constraints could, again,
significantly impact the practical implications of this paper.
Another significant methodological improvement successive studies should incorporate is
to screen using some combination of socially responsible factors, rather than screening by
subsector. For example, Altria is an enormous cigarette manufacturer and would be screened out
in this paper’s study. However, it is also one of the larger employers of women and minorities,
both on an absolute level and on a relative scale (i.e. they employ a ‘balanced’ amount of men
and women). While transitioning to a factor-based screening method would then beg the question
of who is creating and evaluating the socially responsible factors, this is still likely to be a more
robust screening method than crudely screening by industry sector.
The statistical insignificance of most of the strategies is likely attributable to the smaller
sample size used in generating the portfolio returns (i.e. every 6 months). While this time period
was chosen for tractability reasons, at 55 observations it likely limited the explanatory power of
this paper’s analysis. A more frequent sampling period (i.e. monthly, weekly, daily, etc.) would
result in a more robust analysis; replication with access to more frequent sampling periods, and
dividends, would be an interesting subsequent project.
All of the prior methodological issues present severe limitations for the results of this
paper. The tractability assumptions made in this paper, such as the lack of dividend inclusion, a
6-month sampling period, and sub-sector screening, greatly handicap the findings herein. These

Tyler M. Van Gilder Results and Analysis
27
results should not be used to provide investment advice to any individuals, should not be
generalized, and should not be used for policy decisions.
Statistical insignificance means that I cannot state whether one strategy is superior
(inferior) to the other; however, this outcome actually bodes well for socially responsible
investment. Choosing to ethically screen the SP500 does not have a significantly different impact
on the investment returns; thus, investors may harvest an ethical or ‘feel-good’ premium without
necessarily sacrificing performance.

Tyler M. VanGilder Conclusion
28
CONCLUSION
This paper analyzed a negatively screened S&P500 ‘socially responsible fund’ from
1990-2018. I find evidence that socially responsible investment has inferior absolute return but
superior risk-adjusted returns relative to unethical investment. Neither return attributable to the
strategy was statistically significant. Thus, this paper fails to provide evidence for the argument
that socially responsible investment is superior to traditional investment strategies. These
implications are typical in the literature, in the sense that most papers on the topic are either
contradictory or fail to find significant returns. Nevertheless, fund managers should consider
offering, and investors should similarly consider, a broad variety of socially responsible funds, in
order to provide an outlet for an ‘ethical’ or ‘feel-good’ premium and similar financial return to
other funds.

Tyler M. Van Gilder Appendix A: Tables & Figures
A - 1
Appendix A: Quick Reference Tables and Figures
Table 1: GICS Sub-Industry Screening
Industry Sub-Industry Name
Sub-Industry (GICS
Identifier)
Oil, Gas & Consumable Fuels
Coal & Consumable
Fuels
10102050
Oil & Gas Storage &
Transportation
10102040
Aerospace & Defense
Aerospace & Defense 20101010
Hotels, Restaurants, and Leisure
Casinos & Gaming 25301010
Beverages
Brewers 30201010
Distillers & Vintners 30201020
Tobacco
Tobacco 30203010
Descriptions of the sub-industries (found at: https://www.msci.com/gics):
Coal & Consumable Fuels (10102050): “Companies primarily involved in the production and
mining of coal, related products and other consumable fuels related to the generation of energy.
Excludes companies primarily producing gases classified in the Industrial Gases sub-industry
and companies primarily mining for metallurgical (coking) coal used for steel production.”
(MSCI).
Oil & Gas Storage & Transportation (10102040): “Companies engaged in the storage and/or
transportation of oil, gas and/or refined products. Includes diversified midstream natural gas
companies facing competitive markets, oil and refined product pipelines, coal slurry pipelines
and oil & gas shipping companies.” (MSCI).

Tyler M. Van Gilder Appendix A: Tables & Figures
A - 2
Aerospace & Defense (20101010): “Manufacturers of civil or military aerospace and defense
equipment, parts or products. Includes defense electronics and space equipment.” (MSCI)
Casinos & Gaming (25301010): “Owners and operators of casinos and gaming facilities.
Includes companies providing lottery and betting services.” (MSCI)
Brewers (30201010): “Producers of beer and malt liquors. Includes breweries not classified in
the Restaurants Sub-Industry.” (MSCI)
Distillers & Vintners (30201020): “Distillers, vintners and producers of alcoholic beverages not
classified in the Brewers Sub-Industry.” (MSCI)
Tobacco (30203010): “Manufacturers of cigarettes and other tobacco products.” (MSCI)

Tyler M. Van Gilder Appendix A: Tables & Figures
A - 3
Figure 1: Return of $100,000 from 1990-2018; Pre-Outlier
$0
$2,000,000
$4,000,000
$6,000,000
$8,000,000
$10,000,000
$12,000,000
$14,000,000
6/1
/90
6/1
/92
6/1
/94
6/1
/96
6/1
/98
6/1
/00
6/1
/02
6/1
/04
6/1
/06
6/1
/08
6/1
/10
6/1
/12
6/1
/14
6/1
/16
Return on $100,000, 1990-2018
SP500 Ethical Sin Ran1 Ran2 Ran3 Ran4 Ran5 Tbill
Tyler M. Van Gilder Appendix A: Tables & Figures
A - 4
Figure 2: Return of $100,000 from 1990-2018; Post-Outlier (Log-Scaled Vertical Axis)
.
$1.00
$10.00
$100.00
$1,000.00
$10,000.00
$100,000.00
$1,000,000.00
$10,000,000.00
$100,000,000.00
6/1
/90
1/1
/92
8/1
/93
3/1
/95
10
/1/9
6
5/1
/98
12
/1/9
9
7/1
/01
2/1
/03
9/1
/04
4/1
/06
11
/1/0
7
6/1
/09
1/1
/11
8/1
/12
3/1
/14
10
/1/1
5
5/1
/17
Return on $100,000; 1990-2018
SP500 Ethical Sin Ran1 Ran2 Ran3 Ran4 Ran5 Tbill

Tyler M. Van Gilder Appendix A: Tables & Figures
A - 5
Table 2: Ethical Portfolio Regression of Excess Portfolio Return on Excess Market Return
Table 3: Sin Portfolio Regression of Excess Portfolio Return on Excess Market Return
Table 4: Random 1 Portfolio Regression of Excess Portfolio Return on Excess Market
Return
Tyler M. Van Gilder Appendix A: Tables & Figures
A - 6
Table 5: Random 2 Portfolio Regression of Excess Portfolio Return on Excess Market
Return
Table 6: Random 3 Portfolio Regression of Excess Portfolio Return on Excess Market
Return
Table 7: Random 4 Portfolio Regression of Excess Portfolio Return on Excess Market
Return

Tyler M. Van Gilder Appendix A: Tables & Figures
A - 7
Table 8: Random 5 Portfolio Regression of Excess Portfolio Return on Excess Market
Return

Tyler M. Van Gilder Appendix A: Tables & Figures
A - 8
Table 9: Summary Table of Regression Results, Pre-Outlier
Information assembled from Appendix C, pp. C-1 to C-12.
Portfolio Return
(G. Mean) Alpha
Significant
(Level)
Sharpe
Ratio No. Outliers
Market 9.3% - - 0.50 -
Ethical 9.26% 0% N 0.50 -
Sin 10.16% 2.4% N
0.44 6
Random 1 12.82% 1.0% N 0.49 6
Random 2 18.14% 4.0% N 0.30 6
Random 3 9.12% 1.0% N 0.39 9
Random 4 16.06% 4.4% Y (0.05) 0.58 7
Random 5 19.33% 13.5% N 0.25 7

Tyler M. Van Gilder Appendix A: Tables & Figures
A - 9
Table 10: Sin Portfolio Regression of Excess Portfolio Return on Excess Market Return
Table 11: Random 1 Portfolio Regression of Excess Portfolio Return on Excess Market
Return
Table 12: Random 2 Portfolio Regression of Excess Portfolio Return on Excess Market
Return

Tyler M. Van Gilder Appendix A: Tables & Figures
A - 10
Table 13: Random 3 Portfolio Regression of Excess Portfolio Return on Excess Market
Return
Table 14: Random 4 Portfolio Regression of Excess Portfolio Return on Excess Market
Return
Table 15: Random 5 Portfolio Regression of Excess Portfolio Return on Excess Market
Return

Tyler M. Van Gilder Appendix A: Tables & Figures
A - 11

Tyler M. Van Gilder Appendix A: Tables & Figures
A - 12
Table 16: Summary Table of Regression Results, Post-Outlier
Information assembled from Appendix C, pp. C-16 to C-41
Portfolio Return
(G. Mean)
Alpha Significant
(Level)
Sharpe Ratio
Market 9.3% - - 0.50
Ethical 9.26% 0% N 0.50
Sin 13.80% 3.5% Y(0.05) 0.55
Random 1 10.48% 0.5% N 0.45
Random 2 24.21% 10.54% N 0.23
Random 3 10.53% 2.85% N 0.47
Random 4 18.18% 5.34% Y (0.05) 0.51
Random 5 0.87% 22.95% N 0.17

Tyler M. Van Gilder Appendix B
B - 1
Appendix B
The Valdez Principles
1. Minimizing or eliminating the release of pollutants that harm air, water, the earth, or its
inhabitants.
2. Minimizing practices that contribute to the Greenhouse Effect, ozone depletion, acid rain,
or smog.
3. Conserving nonrenewable natural resources and protecting wildlife and wilderness.
4. Minimizing the creation of waste, especially hazardous waste.
5. Recycling when possible, and when not, disposing of waste responsibly.
6. Using safe and sustainable energy supplies.
7. Employing safe technologies and taking precautions to minimize health, environmental,
and safety risks.
8. Marketing environmentally safe products.
9. Informing consumers of the environmental impact of the products they buy.
10. Compensating victims of damage.
11. Disclosing environmentally harmful operations.
12. Appointing a board member qualified to represent environmental interests.
13. Evaluating progress and working toward environmental audit procedures that will be
available to the public.
Judd 1990, pp. 17-18.

Tyler M. Van Gilder Appendix C: Stata Output
C - 1
Appendix C: Stata Do-Files and Output
Output 1: Standard Portfolios & Random Portfolios

Tyler M. Van Gilder Appendix C: Stata Output
C - 2

Tyler M. Van Gilder Appendix C: Stata Output
C - 3

Tyler M. Van Gilder Appendix C: Stata Output
C - 4

Tyler M. Van Gilder Appendix C: Stata Output
C - 5

Tyler M. Van Gilder Appendix C: Stata Output
C - 6

Tyler M. Van Gilder Appendix C: Stata Output
C - 7

Tyler M. Van Gilder Appendix C: Stata Output
C - 8

Tyler M. Van Gilder Appendix C: Stata Output
C - 9

Tyler M. Van Gilder Appendix C: Stata Output
C - 10

Tyler M. Van Gilder Appendix C: Stata Output
C - 11

Tyler M. Van Gilder Appendix C: Stata Output
C - 12

Tyler M. Van Gilder Appendix C: Stata Output
C - 13
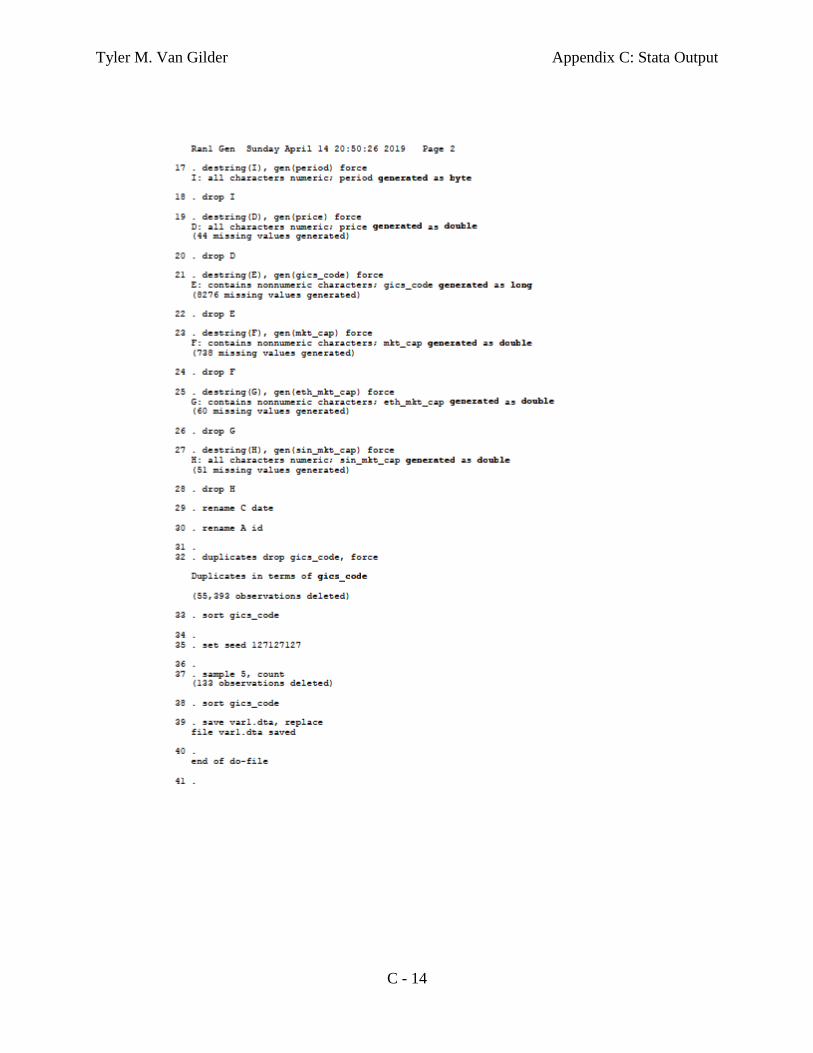
Output 2: Portfolio Random 1 Generation
Tyler M. Van Gilder Appendix C: Stata Output
C - 14

Tyler M. Van Gilder Appendix C: Stata Output
C - 15
Resulting Random Portfolio 1 GICS codes:
The rest of the random portfolio code is not reproduced; the process is identical. The seeds
used are as follows:
Table 17: Portfolio, Random Number Generator Seed, and corresponding GICS Codes
Portfolio Seed GICS Codes
Sin -- 10102050, 20101010, 25301010, 30201010, 30201020,
30203010
Random 1 127127127 40102010, 40301020, 45202030, 45301010, 60101040
Random 2 323232323 15101030, 25504040, 40101010, 40203020, 50101020
Random 3 989989989 10101020, 15105010, 25401030, 30202030, 40301030
Random 4 484484484 10102050, 25102020, 30301010, 35102010, 45101010
Random 5 147258369 15101030, 15102010, 25201030, 25302010, 25401025
Tyler M. Van Gilder Appendix C: Stata Output
C - 16
Output 3: Outlier Analysis
Sin Portfolio

Tyler M. Van Gilder Appendix C: Stata Output
C - 17

Tyler M. Van Gilder Appendix C: Stata Output
C - 18

Tyler M. Van Gilder Appendix C: Stata Output
C - 19

Tyler M. Van Gilder Appendix C: Stata Output
C - 20
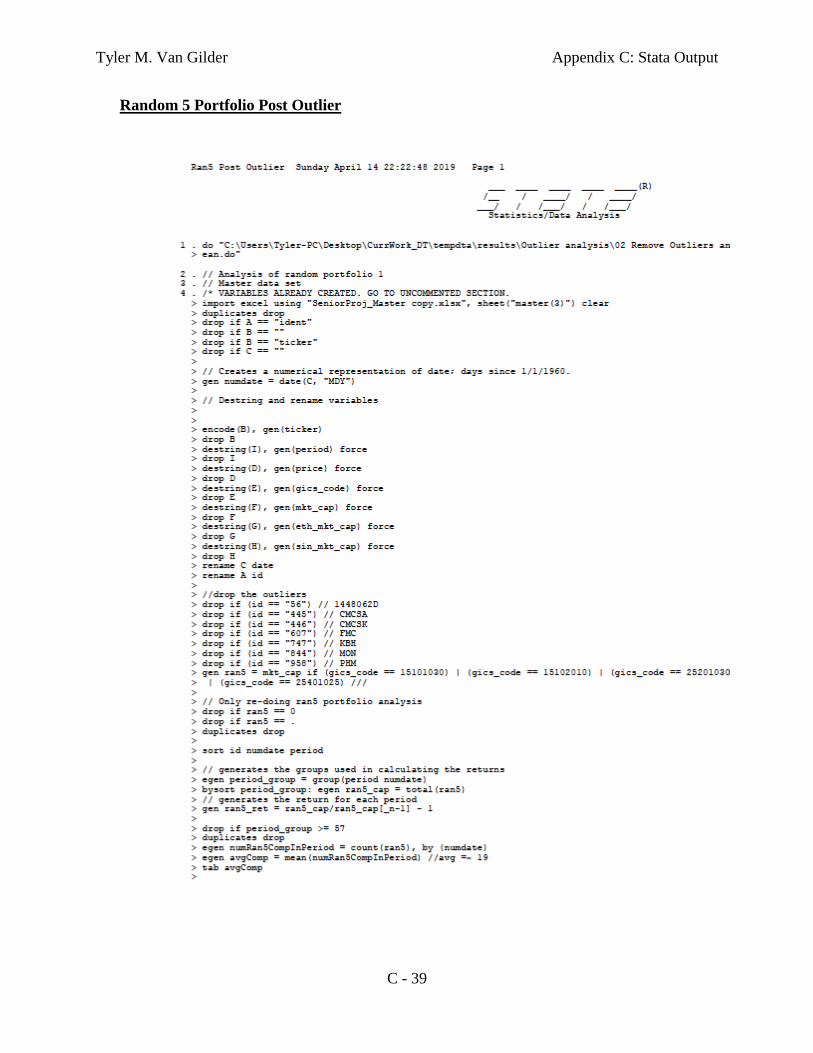
The rest of the Stata files, for portfolios Ran1-Ran5, are omitted; the process is identical to
that used in the Sin Portfolio documentation. The following figures show the outliers for each
portfolio.
Figure 3: Scatterplot of Sin Portfolio Outliers

Tyler M. Van Gilder Appendix C: Stata Output
C - 21
Figure 4: Scatterplot of Portfolio Random 1 Outliers
Figure 5: Scatterplot of Portfolio Random 2 Outliers

Tyler M. Van Gilder Appendix C: Stata Output
C - 22
Figure 6: Scatterplot of Portfolio Random 3 Outliers
Figure 7: Scatterplot of Portfolio Random 4 Outliers

Tyler M. Van Gilder Appendix C: Stata Output
C - 23
Figure 8: Scatterplot of Portfolio Random 5 Outliers

Tyler M. Van Gilder Appendix C: Stata Output
C - 24
Output 4: Regression Analysis Post Outlier Removal

Tyler M. Van Gilder Appendix C: Stata Output
C - 25

Tyler M. Van Gilder Appendix C: Stata Output
C - 26
Tyler M. Van Gilder Appendix C: Stata Output
C - 27
Random 1 Portfolio Post Outlier

Tyler M. Van Gilder Appendix C: Stata Output
C - 28

Tyler M. Van Gilder Appendix C: Stata Output
C - 29

Tyler M. Van Gilder Appendix C: Stata Output
C - 30
Random 2 Portfolio Post Outlier

Tyler M. Van Gilder Appendix C: Stata Output
C - 31
Tyler M. Van Gilder Appendix C: Stata Output
C - 32

Tyler M. Van Gilder Appendix C: Stata Output
C - 33
Random 3 Portfolio Post Outlier
Tyler M. Van Gilder Appendix C: Stata Output
C - 34

Tyler M. Van Gilder Appendix C: Stata Output
C - 35

Tyler M. Van Gilder Appendix C: Stata Output
C - 36
Random 4 Portfolio Post Outlier

Tyler M. Van Gilder Appendix C: Stata Output
C - 37

Tyler M. Van Gilder Appendix C: Stata Output
C - 38
Tyler M. Van Gilder Appendix C: Stata Output
C - 39
Random 5 Portfolio Post Outlier

Tyler M. Van Gilder Appendix C: Stata Output
C - 40

Tyler M. Van Gilder Appendix C: Stata Output
C - 41

Tyler M. Van Gilder References
REF - 1
REFERENCES
Adler, Timothy, and Mark Kritzman. 2008. “The Cost of Socially Responsible Investing.” Journal of
Portfolio Management 35 (1): 52–56.
Berry, R. H., and F. Yeung. 2013. “Are Investors Willing to Sacrifice Cash for Morality?” Journal of
Business Ethics: JBE; Dordrecht 117 (3): 477–92. http://dx.doi.org/10.1007/s10551-012-1529-6.
Bertrand, Philippe, and Vincent Lapointe. 2015. “How Performance of Risk-Based Strategies Is
Modified by Socially Responsible Investment Universe?” International Review of Financial
Analysis 38 (March): 175–90.
Fama, Eugene F. 1970. “Efficient Capital Markets: A Review of Theory and Empirical Work.” The
Journal of Finance 25 (2): 383. https://doi.org/10.2307/2325486.
Fama, Eugene F., and K. R. French. 1992. “Common risk factors in the returns on stocks and bonds.”
Journal of Financial Economics 33 : 3-56.
Fama, Eugene F. and K.R. French. 2014. “A five-factor asset pricing model.” Journal of Financial
Economics 116 : 1-22.
Fernandez-izquierdo, Angeles, and Juan Carlos Matallin-saez. 2008. “Performance of Ethical Mutual
Funds in Spain: Sacrifice or Premium?” Journal of Business Ethics: JBE; Dordrecht 81 (2):
247–60. http://dx.doi.org/10.1007/s10551-007-9492-3.
Humphrey, Jacquelyn, Geoffrey Warren, and Junyan Boon. 2016. “What Is Different about Socially
Responsible Funds? A Holdings-Based Analysis.” Journal of Business Ethics 138 (2): 263-263–
77. https://doi.org/10.1007/s10551-015-2583-7.
Jensen, Michael C. 1968. “The Performance of Mutual Funds in the Period 1945–1964.” The Journal
of Finance 23 (2): 389–416. https://doi.org/10.1111/j.1540-6261.1968.tb00815.x.
Jonas Nilsson. 2008. “Investment with a Conscience: Examining the Impact of Pro-Social Attitudes
and Perceived Financial Performance on Socially Responsible Investment Behavior.” Journal of
Business Ethics 83 (2): 307–25.
Judd, Elizabeth. 1990. Investing With A Social Conscience. First. New York, New York: Pharos
Books.
Mallin, C. A., B. Saadouni, and R. J. Briston. 1995. “The Financial Performance of Ethical
Investment Funds.” Journal of Business Finance & Accounting; Oxford 22 (4): 483–96.
Mamre, Mechon. 2016. “Hebrew - English Bible / Mechon-Mamre.” A Hebrew - English Bible. 2016.
https://www.mechon-mamre.org/p/pt/pt0.htm.
Markowitz, Harry M. 1952. “Portfolio Selection.” The Journal of Finance 7 (1): 77–91.

Tyler M. Van Gilder References
REF - 2
Shakir, M.H. n.d. “The Quran.” The Quran - English. Accessed May 6, 2018.
http://www.perseus.tufts.edu/hopper/text?doc=Perseus%3Atext%3A2002.02.0006.
Shapiro, Joan. 1992. “The Movement Since 1970.” In The Social Investment Almanac, First, 8–23.
New York, New York: Henry Holt and Company, Inc.
Sharpe, William F. 1994. “The Sharpe Ratio.” Journal of Portfolio Management; New York 21 (1):
49.
Standard and Poor’s. n.d. “GICS - MSCI.” Accessed May 6, 2018. https://www.msci.com/gics.
Statman, Meir, and Denys Glushkov. 2016. “Classifying and Measuring the Performance of Socially
Responsible Mutual Funds.” Journal of Portfolio Management 42 (2): 140–51.
Treynor, Jack L. 1965. “How to Rate Management of Investment Funds.” Harvard Business Review
43 (1): 63–75.
Trinks, Pieter Jan, and Bert Scholtens. 2017. “The Opportunity Cost of Negative Screening in
Socially Responsible Investing.” Journal of Business Ethics 140 (2): 193-193–208.
Wesley, John. 1872. “Sermon 50 - The Use of Money.” Global Ministries The United Methodist
Church. 1872. https://www.umcmission.org/Find-Resources/John-Wesley-Sermons/Sermon-50-
The-Use-of-Money.