societal and macroeconomic assessment of alternative
TRANSCRIPT

1
PREPARED FOR:
The American Chemistry Council and American Water Works Association
June 2012
Societal and Macroeconomic Assessment of Alternative Technologies for Disinfecting
Drinking Water

2
Copyright © 2012 by Whitfield & Associates ALL RIGHTS RESERVED.
Reproduction or distribution of this report in whole or in part is prohibited except by permission of Whitfield & Associates, the American Chemistry Council,
or American Water Works Association.

3
1. EXECUTIVE SUMMARY Objective: Why the study? The disinfection of drinking water using chlorine gas and chlorine-containing products has been practiced for over 100 years. Consumers usually take the availability of safe drinking water for granted because the treatment plants that perform these functions operate so reliably and they are generally out of the public’s eye. Disinfection practices vary by treatment objective, by the source of water being treated, and by the size of the population being served. Various groups have made proposals to modify these well-established practices by restricting the movement of chlorine gas on the rail transportation system due to potential security concerns or by promoting alternative disinfection technologies. Many of these proposals sound simple to implement yet few have examined the implications of these changes on the U.S. economy or society at large. The objective of this research is to develop a better understanding of the societal and macroeconomic impacts of these potential regulatory actions and technology choices. Specifically, we have developed a detailed quantitative model of U.S. disinfection practices, and used this model to estimate the impact of these proposed changes along three important dimensions for the United States economy:
• the impact on the nation’s electrical energy consumption, • the impact on the nation’s greenhouse gas emissions, and • the impact on the nation’s transportation system.
This research is intended to provide a broad perspective on this issue. When sweeping changes are being considered for something as critical as the nation’s safe drinking water supply, the public expects regulators and experts to act on the basis of valid and reliable information. This study is intended to begin to close the information gap and contribute to a fact-based and balanced evaluation of alternative disinfectant technologies. Major Findings Whitfield and Associates assembled data from government, industry, trade association, direct interviews, and other sources to develop a model of the disinfectant supply chain. The sources of information are listed in Appendix 1. The starting point of the supply chain is a salt mine and the ending point is the water utility distribution system. We call this model the Disinfectant Supply Chain Model. The model depicts the behavior patterns of almost 52,000 community water systems in all fifty states, Puerto Rico, the Virgin Islands and the Pacific Territories.1 The model considers eight different disinfectant options: use of chlorine gas; use of bulk sodium hypochlorite made from salt or from the recombination of chlorine and caustic soda; two different types of on-site hypochlorite generation technologies; on-site generation of chlorine dioxide; use of calcium hypochlorite; and use of ultraviolet light and on-site generation of ozone 1 Puerto Rico, the Virgin Islands and the Pacific Territories are estimated to have less than 600 CWSs serving about 5.7 million people, representing roughly 1-2% of the populations evaluated in this research.
4
in combination with the use of secondary disinfectants. The model considers three different transportation modes: ship, rail, and truck. Along each segment of the supply chain, energy is consumed, greenhouse gases are generated, and physical products are transported around the country, sometimes for very long distances. Major findings include:
• Energy Consumption - Use of chlorine gas reduces electric power consumption compared to the other disinfectants. On a supply chain basis, chlorine gas uses 36% less electricity than its best available and most widely used substitute, bulk sodium hypochlorite. The average power consumption multiple for all disinfectants is more than two times that of chlorine gas on a per capita basis.
• Greenhouse Gas – Use of chlorine gas reduces per capita greenhouse gas emissions compared to the other disinfectants. Greenhouse gases are released in the production of the electricity used to manufacture the disinfectants and in the transportation of the products along the supply chain. On a supply chain basis, the use of the best available substitute for chlorine produces more than 50% more greenhouse gas. Most of this gap can be attributed to efficiencies in the production of the chlorine and the remainder to efficiencies in the supply chain.
• Transportation – Use of chlorine gas reduces the total amount of material transported compared to most other chemical disinfectants except ozone. Considering all the other disinfectants on a supply chain basis, the alternatives require 30% more material movement at current consumption patterns when compared to chlorine gas on a per capita served basis. On a unit consumption basis only on-site generation of hypochlorite and disinfection with ozone and UV involve less material movement because these technologies require the use of only small amounts of raw materials and secondary disinfectants.
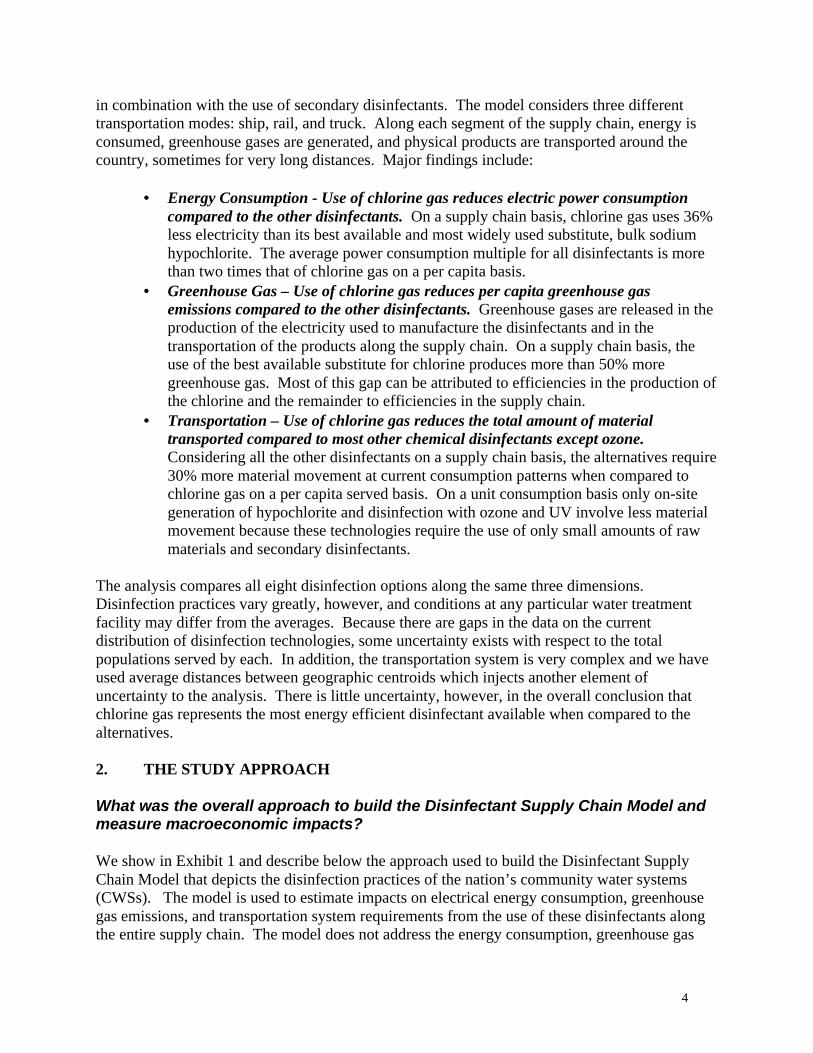
The analysis compares all eight disinfection options along the same three dimensions. Disinfection practices vary greatly, however, and conditions at any particular water treatment facility may differ from the averages. Because there are gaps in the data on the current distribution of disinfection technologies, some uncertainty exists with respect to the total populations served by each. In addition, the transportation system is very complex and we have used average distances between geographic centroids which injects another element of uncertainty to the analysis. There is little uncertainty, however, in the overall conclusion that chlorine gas represents the most energy efficient disinfectant available when compared to the alternatives. 2. THE STUDY APPROACH What was the overall approach to build the Disinfectant Supply Chain Model and measure macroeconomic impacts? We show in Exhibit 1 and describe below the approach used to build the Disinfectant Supply Chain Model that depicts the disinfection practices of the nation’s community water systems (CWSs). The model is used to estimate impacts on electrical energy consumption, greenhouse gas emissions, and transportation system requirements from the use of these disinfectants along the entire supply chain. The model does not address the energy consumption, greenhouse gas

5
emissions, or transportation system requirements associated with other activities in the CWSs such as water softening, clarification, pH adjustment or other routine operational and maintenance activities. The model can be used to inform decision makers regarding the likely impacts of changes to current disinfection practices – such as severe restrictions on the rail transportation of chlorine gas or regulations promoting the use of on-site generation of sodium hypochlorite. While the model estimates the consequences of disinfection practices on a state-by-state basis, the results presented are aggregated to the national level. Because of large differences in the sizes of the facilities and the amounts and quality of the water being treated, the disinfection practices used, and site-specific operational and economic constraints, the overall conclusions appropriate at a national level may not apply at any given treatment plant.
Exhibit 1 Disinfection Supply Chain Model
Amount of water treatedby CWS size
Site location for raw materials,disinfectant plants & distribution
Disinfectant consumption by type per unit water consumption
Distribution of disinfectantuse by CWS size
Number, size, pop. servedof CWS facilities by state
GHG emissions by fuel andtransportation mode
Manufacturing energy consumption by disinfectant
GHG emissions for powerby location
Total disinfectant consumptionby type, plant size
Specific consumption of raw mat’ls & intermed. by disinf.
Transport mode & distribution chain by disinfectant
Distances between sites and to CSW facilities
Power consumption & GHG emissions by disinfectant
Material movement by disinfectant
GHG emissions in transportation by disinfectant
Source: Whitfield & Associates
Disinfecting Drinking Water: Basic facts What is the total size of the market? This research focused on disinfectant consumption in community water systems in the United States, Puerto Rico, the Virgin Islands and the Pacific Territories. In 2009, the U.S. Environmental Protection Agency (EPA) estimated that there were almost 52,000 CWSs. We did not examine in this research other community water systems such as those in schools and

6
factories or seasonal campgrounds that provide their own water.2 Table 1 presents the characteristics of the community water systems evaluated in this study.
Table 1
Community Water Systems in the United States, 2009
System Size Very Small Small Medium Large
Very Large
Population served in systems of each size
500 or less 501-3,300 3,301-10,000 10,001-100,000
100,000 or more
Number of systems of each size
28,804 13,820 4,871 3,746 410
Percent of each size using surface water
7.3 11.9 24.7 42.9 57.5
Percent of total population served in systems of each size
1.6 6.7 9.7 36.3 45.7
Source: EPA 2000 Community Water System Survey and FY 2009 Drinking Water Factoids. In terms of the total number of systems, the median system size is Very Small. In terms of the total population served and the total amount of water treated, however, the median system sizes are Large and Very Large respectively. Almost 56% of the systems in this sample provide water to only about 1.6% of the total population served, while only about 0.8% of the systems serve almost 46% of the population. In addition, most Small, Very Small and Medium systems rely mainly on ground water that generally is of higher quality than the surface waters treated in the larger plants. This, along with other factors such as cost, ease of operation, and regulatory requirements, can lead to the adoption of different disinfection technologies in CWSs of different sizes. The 2009 EPA report provides a tabulation of the total number of CWSs in each state and the total population served by them. However, the report does not include information on the size distribution of the facilities by state. For our model, we developed an estimate of the size distribution by state that is consistent with the EPA report – i.e., we maintain the same total number of systems per state and the same total number of systems of each size in the country as tabulated in the 2009 report. What disinfectants are used in these community water systems?
2 These are sometimes referred to as non-transient non-community water systems (NTNCWS) and transient non-community water systems (TNCWS). There are more than 100,000 of these systems serving almost 19 million people over the course of a year. However, the vast majority of them are Very Small, serving less than 100 people per system, and many operate only seasonally. As such, they are not representative of CWS’s that serve the majority of the populations shown in Table 1.

7
The EPA’s community water survey for 2000 provides information on 52,186 CWSs, slightly more than the 2009 survey, and it reports the data in eight size categories rather than in the five categories in the 2009 report. In addition, the 2000 survey provides further detail on the type of water treated (e.g., surface water, ground water), the average daily water production for each size system and, most importantly for our purposes, the disinfection practices for each size system for pretreatment, disinfectant use, and the use of other technologies and treatments to meet water quality requirements. Data are presented on the percentage of systems using chlorination only and on systems that use chlorine gas, chlorine dioxide, chloramines, ozone and ultraviolet light (UV) for disinfection.3 The data analysis of the 2000 survey conducted by Awwa Research Foundation in 2002 provides additional information on the practices in a subset of generally large systems treating surface water, including information on the distribution of disinfectant dosage requirements and the consumption of secondary disinfectants. Three issues arise in the use of these data to describe current disinfection practices in community water systems.
• When the term “chlorine” is applied to describe the disinfectant used in the 2000 survey, there is no distinction between the use of chlorine gas, bulk sodium hypochlorite solution, hypochlorite solution that is generated on-site, and the use of solid calcium hypochlorite.
• Most systems disinfect in more than one place in the treatment plant and in the distribution system – typically once in the plant for primary disinfection and again to provide residual disinfection in the distribution system. Therefore, the percentages of disinfectants used will sum to more than 100%. Information on the use of secondary disinfectants presented in the 2002 Awwa Research Foundation report, “Information Collection Rule Data Analysis,” is not comprehensive.
• These data sources do not reflect current practice since there have been significant changes in disinfection practices over the years since their publication.
The American Water Works Association (AWWA) periodically conducts surveys of disinfection practices and the most recent results were published in 2007 and 2008. The 2007 survey is not only more up to date than the EPA survey but the AWWA survey distinguishes between the different chlorine-based disinfection technologies, and shows the changes in usage patterns that have occurred over the previous ten years within the subset of treatment plants in their sample. Furthermore, the AWWA survey presents information on operating practices such as target dose and residual levels, the forms in which the materials are used (e.g., gaseous or aqueous ammonia, chlorine delivered in railcars, 1-ton containers or 150-pound cylinders), operating practices (e.g., use of air or oxygen in ozone generation), operating experiences with the various disinfectants, factors driving technology conversion decisions, and the major advantages and disadvantages that treatment plant operators perceive to be associated with each disinfectant technology.
3 For convenience in this study we refer to the use of UV light as a disinfectant, even though it is a process rather than a chemical.

8
We used the information from the AWWA survey to update the results from the EPA 2000 CWS survey and the 2002 Information Collection Rule Data Analysis. However, the data cannot be used directly because:
• The AWWA survey does not break down the results by system size as the EPA survey does.
• While the AWWA sample size is small, there is generally some representation across the spectrum of water systems. The sample may over-represent mid- to large-sized systems, however, and the results may not reflect practices in the very large number of Small and Very Small systems.
• The identity and size distribution of the plants sampled was not the same in the most recent and earlier AWWA surveys, so there is some uncertainty in estimating the degree to which practices have changed over the time period.
In addition to the EPA and AWWA surveys, we obtained information on various disinfection practices in interviews with some CWS operators. Additional information was provided by technology vendors to fill in gaps on certain disinfection practices. We combined information from these sources and developed estimates of current disinfection practices for all the nation’s CWS facilities. The estimating methodology involved changing the disinfectant distribution patterns shown in the 2000 EPA survey to reflect the changes identified in the most recent AWWA survey. Since the AWWA survey may not have adequately sampled Small and Very Small systems, we used our knowledge of the operating characteristics of the various technologies, information from disinfectant suppliers, and our best judgment to estimate the extent of their current use across all facility sizes. In this way we estimated disinfectant use by system size by applying the estimated percentages of each disinfectant to the population served by each sized system in each state. The resulting estimated distribution of disinfectant use for all of facilities in the United States and the calculated percentage of the total population that is served by each are shown below.
Table 2 Weighted Average Distribution of
Disinfectant Use in Community Water Systems Disinfectant % of CWSs
Using* % of Population Served
by Disinfectant Chlorine gas 62.7 53.8 Bulk sodium hypochlorite 33.3 31.9 OSG Case 1 2.3 1.4 OSG Case 2 0.4 0.1 Calcium hypochlorite 1.4 0.1 Chlorine dioxide 1.7 6.7 Ozone 1.0 4.7 Ultraviolet light 0.5 1.2 Chloramine 5.7 20.4
* Total is greater than 100% due to the use of multiple disinfectant systems.

9
While chlorine gas is the most common disinfectant consumed in systems of all sizes, it is used most frequently in Very Large systems. Bulk hypochlorite is also consumed widely in all sized systems, but less frequently in Very Large systems than in smaller ones so that the percentage of the total population served is somewhat lower than the percentage of CWSs using this disinfectant. On-site generation systems, on the other hand, are used most frequently in Small to Medium systems. The use of solid calcium hypochlorite is concentrated in Small and Very Small systems, while chlorine dioxide and ozone use are more common in Medium to Very Large systems. The very large differences in the average populations served by systems in each size category account for the differences between the estimated plant populations and the percentage of the total population served by each type of disinfectant. As a consequence, small uncertainties in the estimated size distribution for the consumption of each disinfectant can lead to larger uncertainties in the estimate of the populations served by each disinfectant. Disinfectant practices differ greatly seasonally as well as by treatment objective, size of the population served, quality of the source water, energy costs, transportation issues, and other factors. Thus, there is likely to be a wide dispersion of state and regional values around the national weighted average distribution of disinfectant use shown above. The significant differences in practice with respect to the amount of chlorine consumed in a sample of surface water treatment plants are illustrated in the Exhibit 2.
Exhibit 2 Average Total Chlorine Dosages
(mg Cl2/l) Percentile of Plants
Source: After Awwa Research Foundation and Microbial/Disinfection By-Products Research Council, “Information Collection Rule Data Analysis,” 2002, Figure 15.6 The chlorine dosage data in Exhibit 2 include both chlorine gas and chlorine derived from bulk hypochlorite. The dosage concentrations include the amount of chlorine required to meet the oxidation requirements of the water being treated, called the demand, as well as that required to
0
10
20
30
40
50
60
70
80
90
100
0 2 4 6 8 10 12

10
provide residual disinfection in the distribution system. Chlorine is consumed in oxidizing both inorganic and organic compounds in the water as well as in the destruction of pathogens by oxidation. Since all of the disinfectants considered in this research (except for UV systems) are oxidants, all show similar wide ranges of dosage requirements across a sample of facilities. Therefore, while the methodology described below is appropriate to present an overall picture of disinfection practices in the United States, it should be recognized that the situation at individual plants could differ significantly from the average values developed in this analysis. How much energy is used in the production of the disinfectants, and what are the associated greenhouse gas emissions? Developing a comprehensive estimate of electrical energy consumption and greenhouse gas emissions in the production of any material can be a daunting task unless the boundaries of the analysis are defined carefully and the scope is limited. In this study we focused on the energy requirements to manufacture the disinfectants starting from the point at which the raw materials for the production process are obtained. Thus, for example, we developed estimates of the energy required to produce chlorine gas from salt or brine based on the cell technology used, and have included the energy required to mine the salt and create the brine. The methodology used to estimate the energy requirements and greenhouse gas emissions associated with the transportation of the salt from the mines to the chlor-alkali plants and of the chlorine from the production sites to disinfection facilities are described below. The energy requirements involved in the application of disinfectants to the water being treated in the CWS facilities are negligible compared to the energy required for their production. Values for the direct consumption of energy and major raw materials in the production of disinfectants are available in the general literature and from information published by technology vendors. Bulk sodium hypochlorite can be manufactured directly from salt using a variation of the technology used conventionally in chlor-alkali plants or, more commonly, can be manufactured by recombining chlorine with the co-product caustic soda produced in chlor-alkali plants. Large merchant chlor-alkali, bulk hypochlorite, calcium hypochlorite and ammonia manufacturing plants are located far from most CWS facilities, but the generation of hypochlorite on-site (here called OSG Cases 1 and 2), chlorine dioxide, chloramines, ozone and the use of UV light take place at the treatment sites. All disinfectants are in use throughout the country and bulk hypochlorite is produced in many states, but most chlor-alkali plants are located in the Gulf Coast region or in locations with historically low-cost electric power. This is because electricity is a major component of the cost of producing chlorine and co-product caustic soda, and it is the major source of energy used in the production of all of the alternative disinfectants. Our estimates of the average electrical energy and salt requirements to produce each of the disinfectants are summarized below.

11
Table 3 Estimated Electricity and Salt Consumption
For the Production of Disinfectants
Disinfectant Electricity Consumption, kWh/t Chlorine
Salt Consumption, t/t Chlorine
Chlorine gas 1,360 1.69 Bulk hypochlorite from salt 2,500 1.86 Bulk hypochlorite from Cl2 and caustic soda
2,220 1.69
OSG case 1 4,400 3.0 OSG case 2 6,600 3.0 Calcium hypochlorite 5,460 5.15 Chlorine dioxide 18,910 2.25 Ozone 10,000/t O3 N/A Ultraviolet light 15-30 kWh/MM liter N/A Chloramine 2,930 3.64
Sources: see Appendixes 1and 2 These estimates were obtained from the sources presented in Appendixes 1 and 2, and are average values for each technology. Other technology vendors may offer systems with somewhat different characteristics, and individual CWSs using the technologies may obtain different results for a variety of operating reasons. Therefore these estimates are best defined as representative or typical values for energy and salt consumption for purposes of estimating national averages, and not for the values that will be obtained at any particular CWS. The average electricity consumption for the production of chlorine gas, 1,360 kilowatt hours per metric ton (kWh/t), is based on the estimated distribution of cell technologies used in merchant chlor-alkali plants and our estimate of the disposition of the energy content of the co-product hydrogen. Energy allocation issues in the production of chlorine are discussed in Appendix 2. Chlorine gas, bulk hypochlorite from salt, OSG hypochlorite, ozone and ultraviolet light use electricity directly in their production. The electricity to produce bulk hypochlorite from chlorine and caustic soda, calcium hypochlorite and chloramine consists of relatively small amounts consumed in the production facilities proper plus the electricity required to produce the chlorine and caustic soda that are consumed in their manufacture. Much larger amounts of electricity are required to produce chlorine dioxide and ozone from their starting materials. This comparison demonstrates that chlorine gas requires substantially less electricity and consumes fewer raw materials per unit of disinfectant produced than the other disinfectants. This conclusion is robust and independent of the location at which the disinfectants are produced or the size of the facility in which they are consumed. The information in Table 3 is used to estimate the amount of electricity required to produce the mix of primary and secondary disinfectants consumed in the treatment facilities, and the amount of greenhouse gases emitted in the generation of the electricity, by applying the methodology outlined in Exhibit 3.

12
Exhibit 3 Methodology for the Electrical Energy and Greenhouse Gas Sectors of the Model
• Step 1. Using the distribution of CWS systems by size in each state and the overall distribution of disinfection technologies by size (summarized in Table 2), we estimate the number of systems by size in each state using each disinfection technology.
• Step 2. Using the average daily amount of water treated in systems by size, we estimate the total amount of water treated by each technology in each state.
• Step 3. Using the distribution of dosages for each disinfectant (shown for chlorine gas and
hypochlorites in Exhibit 2), we estimate the amount of each disinfectant consumed per day in each sized system in each state. We use the 75th percentile dosage for Large and Very Large systems treating mostly surface water and the 25th percentile for Medium and smaller systems treating mostly ground water.
• Step 4. Using data on the distribution of secondary disinfectants, we estimate the amount of chlorine gas, hypochlorite and chloramine consumed along with each primary disinfectant for systems by size in each state.
• Step 5. Based on the electricity and salt requirements shown in Table 3, we estimate the total electricity required to produce the disinfectant amounts in Steps 3 and 4 for systems by size in each state and the amounts of salt and other materials consumed in their production. The estimates are then summed to the state, regional and national levels.
• Step 6. The amount of greenhouse gases released in the production of the electricity are estimated from state-specific emission factors and are then summed to the state, regional and national levels.
The amount of greenhouse gas released in the production of electricity depends on how the electricity was generated, and there are significant state and regional variations in the generation mix. We used estimates of the electricity emission factors by state developed by U.S. Department of Energy and factored them into the Disinfectant Supply Chain Model. The model contains information on the locations of chlor-alkali, bulk hypochlorite, and calcium hypochlorite production plants in the country. The result is an estimate of the greenhouse gas emissions associated with the production of these disinfectants. The greenhouse gases emitted from the on-site production of other disinfectants in each state is estimated based on the state-specific electricity emission factors. How are the primary raw materials transported to the disinfectant manufacturing sites, and the disinfectants transported to the CWS facilities? The distribution system used to transport raw material to production sites and disinfectants to treatment facilities is complex since it depends on many factors, including the properties of the materials being transported, the availability of road and rail networks, and local transportation

13
costs. Some key elements in the transportation of disinfection materials are shown schematically in Exhibit 4.
Exhibit 4 Chlorine Disinfectant Supply Chain
Salt
Bulk hypochlorite
Chlor-‐alkali Bulk hypo Distributor
Salt selection orpurification OSG hypo
Distributor ConsumersRepackager
Cl2 large consumers
Repackager Consumers
Notes: Distribution is done mainly by rail ( between 500 and 1,000 miles) and truck ( about 250 miles); rail shipments of bulk hypo use 20,000 gallon cars; for chlorine gas, 90 ton cars; truck movements for bulk hypo use 5,000 gallon trucks; 1,000, 330, and 55 gallon containers; for chlorine gas, 1 ton containersor 150 lb. cylinders; for calcium hypochlorite, 100 lb. drums; salt shipment sizes vary.
Distributor Cl2 medium/small consumersRepackager
Direct consumptionOn-‐site chlorinedioxide
Power
On-‐site UV system
On-‐site ozone generator Direct consumption
Direct consumption
Chloramine hypo, Cl2Oxygen
Cl2
Direct consumption
Source: Whitfield & Associates
On-Site Generation (OSG) Salt is transported to chlor-alkali plants and salt-based bulk hypochlorite plants by rail or truck and the brines made from it, or brines produced directly from local salt deposits, are purified at the plant sites. Salt consumed at the CWS facilities for both types of OSG hypochlorite technologies is delivered in bulk to repackagers/distributors that make final delivery to the points of use by truck. The OSG technologies require high quality salt that can be obtained only from select deposits. Otherwise the salt would need to be purified before delivery to the facility to forestall the onset of severe operational problems including fouling of the cells and potentially elevated levels of bromate, and this would increase energy requirements significantly. Chlorine Gas Less than 5% of the chlorine used for disinfection is delivered directly to the facility as liquefied gas under pressure by rail. Some is transported by truck, but most is transported by rail to repackagers/distributors that break down the shipments into one ton containers and 150 pound cylinders of compressed gas. These chlorine containers and cylinders are then delivered by truck to the CWS facilities for direct use or for conversion to chlorine dioxide or chloramine. Empty cylinders are returned to be refilled.

14
Bulk Sodium Hypochlorite Chlorine and caustic soda, usually as a 50% solution, are shipped from chlor-alkali plants to bulk hypochlorite manufacturing plants by rail or truck, depending on the distance and the plant’s access to rail transportation. The bulk hypochlorite produced in these plants, and from plants using salt as a raw material, can be transported by truck directly to CWS facilities if they are located close to the hypochlorite plant. Alternatively, the hypochlorite can be produced at a chlor-alkali plant and transported to distributors by rail or truck, depending on distance and rail access. Rail and truck shipments of hypochlorite typically are made in nominal volumes of 20,000 and 5,000 gallons respectively, and are broken down for delivery by truck to the CWS facilities into smaller volumes, typically of 1,000, 330 or 55 gallons. Hypochlorite solutions can degrade into perchlorate and chlorate over time, particularly in warm climates, so the distribution chain is managed as efficiently as possible to minimize the amounts held in inventory. Ammonia The ammonia used for chloramines production is transported in a manner similar to chlorine – it is shipped long distances by rail as a liquid under pressure and is broken down into smaller lots for delivery as compressed gas by truck to the CWS facilities. In addition, the distributors convert a significant portion of the ammonia to 30% aqueous solutions for use in the facilities. Calcium Hypochlorite Solid calcium hypochlorite is made by reacting slaked lime with chlorine gas and then treating the products of that reaction with sodium hypochlorite to upgrade it. Major calcium hypochlorite producers are associated with chlor-alkali plants. The finished product is packaged at the manufacturing plants and is delivered by rail or truck to distribution points from which the drums of material are delivered by truck to the CWS facilities. How much greenhouse gas is generated solely by the transportation of materials from the salt mines to the CWS facilities? Information is available on the amount of greenhouse gas generated when transportation fuels are consumed as well as on the specific fuel consumptions, in gallons per net ton-mile shipped, for materials transported by rail, truck and ocean-going vessels. In order to estimate the greenhouse gases generated solely by the transportation of disinfectant-associated materials along the supply chain, we gathered information on the modes of transportation used, shipping distances and the amounts of materials moved. We estimated the amount of materials moved from available data on the production processes and disinfection plant practices as described above. However, the complexity of the distribution systems makes it more difficult to determine the modes of transportation and shipping distances for all production plants, distribution facilities and CWS facilities across the United States. Rail access is limited in many locations and the various production and distribution sites are widely distributed as shown Exhibit 5.

15
Exhibit 5 Location of Merchant Chlor-Alkali, Sodium Hypochlorite
and Chlorine Repackagers
Source: Whitfield & Associates
It is beyond the scope of this study to conduct a rigorous analysis of the transportation logistics throughout the disinfectant supply chain, so a simplified approach was developed to facilitate estimation of greenhouse gas production in transportation. The steps in the approach are summarized in Exhibit 6.
Exhibit 6 Methodology for the Transportation Sector of the Model
• Step 1. We determined the locations of all major salt production areas, merchant chlor-alkali plants and salt-based hypochlorite production plants. We assumed that salt distribution locations were located near the most heavily populated areas in each state. The shortest over-the-road distances from the salt production areas to the chlor-alkali plants and distribution locations were obtained from distance estimation software, and the routes were reviewed to determine the correspondence between rail and road routes.
• Step 2. We assumed that rail transport was the favored mode for distances greater than about 250 miles where rail access existed; otherwise we assumed truck transport. We assumed truck transport for all distances less than 250 miles to the production plants.
• Step 3. We estimated typical over-the-road distances from the salt distribution locations to other significant population centers in each state in order to estimate a population-weighted average transportation distance from the distribution site to the CWSs located within the states. We assumed truck transport for all salt deliveries to the CWS facilities.
• We followed Steps 1-3 to estimate modes and distances for chlorine movements from the

16
production sites to the chlorine-based bulk hypochlorite plants and to the distribution centers, except that the locations of the repackagers/distributors and the bulk hypochlorite plants were known and did not have to be estimated. We estimated population-weighted average transportation distances from the repackagers/distributors to the CWSs as described above.
• We followed Steps 1-3 to estimate modes and distances for ammonia movements from the production sites to distribution centers and then to the CWS facilities and for movement of calcium hypochlorite from the major manufacturing plants to the CWSs. The steps were expanded to include ocean transport to Hawaii, Alaska, Puerto Rico, the Virgin Islands and the Pacific Territories, with ocean shipping distances estimated from the closest appropriate mainland port.
• We reviewed the results for each state to determine if shorter or more efficient modes and routes might exist by transporting material from production or distribution sites in adjacent states. If such a condition appeared likely, we made a subjective estimate of the fraction of material consumed within a state that would be supplied from adjacent states and revised the model accordingly.
• The amount of material passing over each segment of the supply chain was multiplied by the estimated distances to compute the ton-miles moved. We estimated greenhouse gas emissions from the fuel emission factor and specific fuel consumption for the transportation mode used.
As noted above, many CWS facilities use more than one disinfectant or disinfect in more than one location, and the greenhouse gas emissions from transportation for each disinfectant will differ due to variations in routes along the supply chain and differences in the amount of material transported. The amount transported depends on the disinfectant and the form in which it is transported. For example, the weight of a one ton container for chlorine gas increases the gross weight by about 75% over the net weight delivered, and return of the empty containers imposes another 75% penalty. The same situation applies to the transport of ammonia under pressure, and transportation of a 30% aqueous solution increases the gross weight by more than 3.3 times the weight of ammonia moved. Sodium hypochlorite is typically sold as a 12.5% solution of free available chlorine so that the ratio of material transported to active disinfectant consumed is 8:1. How can all these factors be put together and understood? The Disinfectant Supply Chain Model combines all of these factors in one place so that we are better able to understand the economy-wide implications of various policies and use the model to perform “what-if” analyses. To summarize the factors that the model considers:
• Estimates of the population of CWSs by size and by state to determine the total volume of water disinfected and the total population served, since the average amounts treated and average population served in facilities of each size range are known.

17
• Information is also available on the dosage rates and residual disinfectant levels for most disinfectants and we have developed estimates of the percentage of facilities using each disinfectant so that we can determine the total amount of each disinfectant consumed.
• Given the total consumption of each disinfectant, we can examine each segment of the supply chain and determine the amount of material being transported in each segment, the greenhouse gas emitted in their transportation, and the energy required and greenhouse gas produced in their manufacture. The population served by each disinfectant can be calculated in the same way.
Since there is wide variation in the amount of material moved and the percentages of CWS facilities using each disinfectant, simply viewing the total amounts of electricity consumed, materials moved, or greenhouse gas emitted does not illustrate the fundamental differences between the disinfectants. A more appropriate way to compare the characteristics of the various disinfectants is to normalize the total electricity consumption, transportation requirements and greenhouse gas emissions for each disinfectant by dividing these values by the total population served by each or by the amount of each disinfectant consumed. In this manner, we can perform meaningful comparisons and gain better insight into the impacts of possible changes in the current disinfectant usage patterns that may be driven by changes in technology, economic parameters or regulatory policies. The per-capita and per unit consumption metrics for the various disinfectants, their key drivers and some of the considerations that influence disinfectant selection are discussed below. What are the performance and operational differences between the disinfectants? Chlorine Gas Chlorine gas has been used to disinfect water supplies for more than a century. It is effective and nearly all CWSs are familiar with its use. Chlorine gas is produced in large, energy efficient plants together with co-product caustic soda.4 Large chlor-alkali producers benefit from economies of scale due to technology and marketing advantages, bulk purchasing, and cost structure. It is easy to use chlorine gas as a disinfectant since it can be metered and dispensed directly into the water being treated and the application systems are simple and reliable. This is important since both the quality of waters being disinfected and the volume being supplied to the community vary both from location to location and seasonally at a given location. Many community water systems have multiple treatment facilities or multiple sources of water and control of disinfection by chlorine gas can be done reliably with automated systems. The chlorine gas dosage rate and contact times are set so as to insure effective disinfection and to leave sufficient residual chlorine content to provide secondary disinfection throughout the distribution system, although some systems that use chlorine gas as a primary disinfectant use chloramine or hypochlorite for secondary disinfection. Ozone Treating water with ozone-containing gas is another well established, effective disinfection method that is slowly growing in use. Proper operation of ozone generation plants requires careful maintenance and control and a supply of highly reliable power. Ozone cannot be stored onsite to serve as back-up in case of failure. The ozone is generated and applied at the treatment 4 See Table 3 and the discussion on energy efficiency in Appendix 2.

18
facility and no other chemicals are brought in for primary disinfection, although most operators use some oxygen gas to improve the efficiency of the ozone generating process. Since ozone degrades very rapidly, it does not provide residual disinfection capability and secondary disinfectants such as chlorine gas, sodium hypochlorite, or chloramines must be used as well. Ultraviolet light The use of UV light typically reduces the need for chemical disinfection. However, as is the case with ozone, UV systems still need a source of chlorine for maintaining residual disinfection in the distribution system. Ultraviolet light is effective against parasites as well as bacteria. Increasing use of these systems is also fairly recent, and a variety of problems have been reported in maintaining the lamp life and cleanliness required for effective disinfection. 5 Chlorine Dioxide Chlorine dioxide gas has been used for decades as a disinfectant. The systems used to generate chlorine dioxide from chlorine gas are complex and achieving the degree of process control required for safe and efficient operation can be difficult. Costs can be high if large amounts of sodium chlorite, an essential intermediate in the manufacturing process, are not readily available. Systems using chlorine dioxide as a primary disinfectant also can use chlorine gas, hypochlorite or chloramine for secondary disinfection. Chloramine The disinfectant properties of chloramine also have been known for a very long time. It is formed by adding the proper amount of ammonia to produce monochloroamine from chlorine dissolved in the water being treated. The ammonia may be added in either gaseous or aqueous form and mixed with the chlorine in a variety of ways, so use of chloramines is simple and efficient. It has been in widespread use for many years and there is a large body of experience regarding the most effective and efficient techniques for its formation and application. Use of chloramine has been increasing in recent years, especially in Large and Very Large systems. Calcium hypochlorite Solid calcium hypochlorite is also an effective disinfectant since it is a highly reactive oxidizing material. It is produced commercially in tablet form containing a mixture of sodium and calcium chlorides, calcium hydroxide, and calcium hypochlorite. It is used mainly in Small and Very Small CWS facilities where disinfectant consumption is low and advantages are realized in the storage and handling of small amounts of a solid material. Sodium hypochlorite Despite the availability of all of these options, the most widely used disinfectant alternative to chlorine gas is bulk solutions of sodium hypochlorite. It is manufactured throughout the United States and is widely available through an extensive network of distributors. It is often considered an attractive alternative because of its relatively low cost, ease of use, reliable performance, and the advantage of eliminating the need to handle hazardous compressed gases at the CWS facilities. Some modifications to a facility are required when converting from chlorine gas to bulk hypochlorite, however, since new storage and feeding systems have to be installed. In
5 AWWA, “Selecting Disinfectants in a Security-Conscious Environment,” 2009, pg. 17.

19
addition, operators and maintenance personnel must be trained in the proper handling of bulk hypochlorite solutions that can degrade rapidly if handled improperly. On-site generation In recent years some facilities have chosen to convert from chlorine gas to disinfectants that are generated on-site. This approach eliminates the need to bring in and store chlorine or bulk hypochlorite since salt is converted directly into dilute hypochlorite solutions that are then metered into the water being treated. We included two OSG cases in this analysis. In both cases, the conversion of salt to disinfectant takes place in electrolytic cells that are much smaller and less efficient electrochemically than those used in chlor-alkali plants or the much larger plants that produce bulk hypochlorite from salt as shown in Table 3. Furthermore, both the water and salt fed to the OSG systems must be purified carefully to prevent fouling and malfunctioning of the cells, and the need for brine disposal can be a significant issue in the operation of this process. The vendor base for these systems has been limited, and some problems have arisen with design issues, reliability and lack of vendor support, the need for back-up systems in case of failure, and salt quality. Careful operating and maintenance training is required to manage these complex systems safely since hydrogen is produced as a byproduct of the OSG process. In the second OSG case, the production of the oxidants is somewhat less efficient in its consumption of electricity than the first case because of differences in the system designs. 3. MACROECONOMIC FINDINGS Use of chlorine reduces per-capita electricity consumption compared to other disinfectants Chlorine gas is produced in large, energy efficient plants. It is transported to consumers in CWS facilities in a relatively simple distribution chain, needing only to be repackaged to one ton containers and 150 pound cylinders for transportation to most facilities. Because the co-product caustic soda is sold for other uses, it must carry its proportionate share of the plant electricity consumption, which is 25% of the total ECU.6 We estimate that the average electricity consumption attributed to chlorine for all merchant plants is 1,360 kWh/t. Production of bulk sodium hypochlorite requires more energy per unit of contained chlorine for two main reasons. The salt-based plants are smaller, do not recover byproduct energy from hydrogen and are somewhat less efficient. More importantly, the energy requirements to separate and then concentrate the co-product caustic soda must now be included for plants that consume both chlorine and caustic soda to make hypochlorite. The increased energy requirements to produce hypochlorites are partially offset by the fact that they are more efficient oxidants than chlorine gas per unit of contained chlorine. OSG plants that produce hypochlorite also must recognize the energy costs of separating the salt into its constituents electrochemically, although they do not concentrate the products. However, they are far smaller and more consumptive of salt and electrical energy than are merchant chlor-alkali plants or plants producing bulk hypochlorite from salt.
6 An electrochemical unit, or ECU, includes 1.127 units of sodium hydroxide, 0.028 units of hydrogen and 1 unit of chlorine, the ratio at which they are produced from salt.

20
Production of chlorine-containing calcium hypochlorite and chlorine dioxide carry the energy costs of producing the chlorine component as well as the energy consumed in manufacturing the disinfectants themselves. Manufacture of both products converts significant amounts of the input chlorine to byproducts that are not disinfectants, such as calcium chloride, and the chlorine dioxide manufacturing process is complex and highly consumptive of electrical energy in its operation. Ozone is produced by passing air, usually enriched with oxygen, through a stabilized electrical discharge. The conversion efficiency of the process is rather low (on the order of 10%), so consumption of electricity is very high per unit of ozone produced. In addition, any oxygen that is used to enrich the air must carry the energy cost of separating and concentrating it for use, most likely in small on-site PSA plants.7 The consumption of electricity in the disinfection of water by UV light is lower than that required for disinfection by ozone. However, both technologies require the addition of secondary disinfectants to protect the distribution system. We have assumed that this would be done using chloramine, chlorine gas and sodium hypochlorite in the ratios indicated in the 2002 ICR data analysis, so that the ozone and UV disinfection technologies also carry the energy requirements to produce an associated disinfectant residual. Table 4 presents the estimated ratio of the electricity consumption for each disinfectant relative to the value for chlorine gas on a per-capita served basis and on the basis of electricity consumption per unit of disinfectant consumed.
Table 4 Electricity Consumption Relative to Chlorine Gas
Primary Disinfectant
Per-Capita Electricity Consumption Multiple
Disinfectant Unit
Consumption Electricity Multiple
Chlorine gas
1.0
1.0
Bulk sodium hypochlorite
1.6
1.6
OSG Case 1
2.3
2.9
OSG Case 2
2.6
4.3
Calcium hypochlorite
0.9
1.8
Chlorine dioxide
2.3
12.6
Ozone
5.3
6.5
Ultraviolet light
3.4
N/A Note: Values relative to the per capita and per unit disinfectant consumed electricity consumption attributed to chlorine gas. All values include the electricity consumptions attributed to the secondary disinfectants used as well, which can amount to as much as 15% of the total.
7 Pressure Swing Absorption plants are typically used in industrial settings.

21
The average electricity consumption multiple for disinfectants other than chlorine gas at their current consumption patterns is more than twice that of chlorine gas on a per-capita basis, so shifting from chlorine gas to alternative disinfectants will consume additional energy and generate more greenhouse gases. If all current users switched from chlorine gas to disinfection with bulk hypochlorite, the most widely used alternative to chlorine gas, an additional 15 MW of power would be drawn from the national grid. If chlorine gas-based disinfection practices switched to chlorine dioxide, an additional 310 MW of power would be required. This is because chlorine dioxide production is highly energy consumptive per unit of chlorine produced, as shown in Table 3, although is more efficient with respect to the population served because its current use is favored in large systems as shown in Table 2. The electricity consumption for the primary and secondary disinfectants can also be normalized to the amount of disinfectants consumed (except for UV-based systems because the disinfection is done by light). With this normalization approach the electricity consumption ratios to chlorine gas follow the ratios that would be computed directly from the data in Table 3 more closely, differing somewhat because of the impacts of secondary disinfectant consumptions. On a unit consumption of equivalent disinfectant basis, the average multiple for all other disinfectants is about 2.5 times the electricity consumption for chlorine gas at current use patterns. Use of chlorine reduces per-capita emissions of greenhouse gas compared to other disinfectants Greenhouse gas is released in the production of the electricity that is required to manufacture these disinfectants by all fossil fuel-based generation technologies, and the mix of these technologies and greenhouse gas-free technologies such as nuclear, hydroelectric, geothermal and wind-based varies significantly from state to state. These differences appear in the different amounts of greenhouse gas emitted in the states that produce chlorine gas, for instance, and the states where it is consumed. Greenhouse gas is also produced by the combustion of fuel when raw materials and disinfectants are transported through the supply chain to the CWS facilities where they are consumed. Table 5 presents estimates of the ratio of greenhouse gas emissions by these disinfectants relative to the value for chlorine gas. We also show the percentage of the total that is attributed to the transportation component.

22
Table 5 Greenhouse Gas Emissions Relative to Chlorine Gas
Primary Disinfectant
Per-Capita GHG
Emissions Multiple
Unit Consumption
GHG Emissions Multiple
% of GHG Emissions
From Transportation
Chlorine gas
1.0
1.0
4.5
Bulk sodium hypochlorite
1.8
1.8
7.5
OSG Case 1
1.2
1.5
3.0
OSG Case 2
1.3
2.2
1.9
Calcium hypochlorite
1.5
2.9
2.0
Chlorine dioxide
2.2
12.4
0.9
Ozone
5.3
6.4
0.4
Ultraviolet light
4.0
N/A
1.1 Note: Values relative to the per capita and per unit consumption GHG emissions attributed to chlorine gas. All values include the GHG emissions attributed to the secondary disinfectants used as well. The average per capita GHG multiple based on current consumption patterns is about 2.3 times that of chlorine, and on average approximately 4.5% of the total greenhouse gas emissions from use of these disinfectants arise from the transportation supply chain. Greenhouse gas emissions to transport salt to chlor-alkali plants and chlorine to CWS facilities amounts to 4.5% of the total for chlorine gas. The transportation component of GHG emissions is higher only in the case of 12.5% bulk hypochlorite solutions. Even the disinfectants that are produced on-site require that some raw material be brought into the CWS facilities,8 sometimes in amounts that exceed that required for the production of chlorine gas. The main reason that the percentage of transportation-driven greenhouse gas emissions is lower for these materials than for chlorine gas, however, is that the amount generated in providing the electricity required for their formation is much higher, as shown in the Table 3. When the greenhouse gas emissions for these disinfectants are normalized to the equivalent amount of chlorine consumed rather than to the populations served, the average multiple at current consumption patterns is 2.7 times that for chlorine gas. These ratios generally follow those shown in Table 4 for electricity consumption relative to chlorine because GHG emissions are dominated by electricity consumption, not by transportation.
8 UV reduces chemicals demand for primary disinfection, but chlorine and ammonia are required to produce chloramine for secondary disinfection.

23
Use of chlorine reduces the total amount of materials transported compared to all other chemical disinfectants except ozone We calculated the amounts of disinfectants transported to the CWS facilities based on an analysis of volume of water treated for primary and secondary disinfection, dosage rates required to achieve target concentration levels, and other factors. The dosage rates are highly site-specific, depending on operating practices, water quality and the disinfectant used, but target residual levels are generally in the range of 0.5-1.5mg/l. The required dosage rates also can vary seasonally. We used the dosage rates indicated in the ICR data analysis (see Exhibit 2 for chlorine). These rates represent yearly averages and are sufficient to meet the disinfectant demand and residual concentration requirements. One pound of chlorine gas typically will disinfect about 50,000 gallons of water and about 1.69 pounds of salt per pound of chlorine must be brought into the chlor-alkali plant.9 The chlorine gas then is typically transported by rail to distributors and then by truck to the CWS facility in 1 ton containers and 150 pound cylinders. Counting the separate movements of materials by rail and truck, about four pounds of materials and containers are moved in order to deliver 1 pound of chlorine gas for consumption. Table 6 presents the ratios of the amounts of material movement required on a per capita basis and per amount of active disinfectant consumed relative to the value for chlorine gas. We also show the estimated percentage of the total for each disinfectant that is moved by truck.
9 Many chlor-alkali plants produce salt-containing brine for their own consumption. We consider the electricity required for forming and pumping brines to these plants a part of chlorine production, not transportation.

24
Table 6 Transportation Relative to Chlorine Gas
Primary Disinfectant
% Moved by Truck
Per-Capita Materials
Movement Multiple
Unit
Consumption Materials
Movement Multiple
Chlorine gas
62
1.0
1.0
Bulk sodium hypochlorite
53
1.7
1.7
OSG Case 1
59
0.5
0.7
OSG Case 2
59
0.4
0.7
Calcium hypochlorite
48
0.6
1.1
Chlorine dioxide
60
0.3
1.7
Ozone
75
0.2
0.3
Ultraviolet light
64
0.6.
N/A Note: Values relative to the total transport of materials moved attributed to chlorine gas. All values include transportation of secondary disinfectants used as well.
The average materials movement at current consumption patterns for these disinfectants is 1.3 times that for chlorine gas on a per capita basis and almost 1.6 times on a unit consumption basis, with about 55% of the materials moving by truck. More material must be brought in for the on-site production of chlorine dioxide than for direct use of chlorine gas because the chlorine dioxide production process converts some of the starting material into inactive forms, and more material movement is required for calcium hypochlorite because the solid form contains only 35% active chlorine. Per capita materials movement is more efficient for chlorine dioxide than for chlorine gas because it is consumed mainly in large systems whereas chlorine gas is the most frequently used disinfectant in systems of all sizes. While only salt is required for OSG technologies, the processes are less efficient with respect to its consumption so that more material must be handled to produce the same amount of active disinfectant as shown in Table 3. The relatively low materials movements for ozone and UV systems are a consequence of the need to transport only secondary disinfectants to systems using them and to deliver oxygen to some ozone generation systems. The high multiple for bulk hypochlorite results from having to transport chlorine and 50% caustic solution to bulk hypochlorite manufacturing plants that do not use salt, and from shipping the active disinfectant as a 12.5% aqueous solution from the manufacturing point to the CWSs.

25
Delivery frequencies to the CWSs depend on the amounts of material brought to the facility from the distributors on each trip, and this is not known with any certainty. We have estimated average frequencies based on information on “typical” practices, but these are likely to be highly site specific, depending on the disinfectant storage capacity at the facility and the distance from the supplier, for example. We find, however, that delivery frequency generally increases with the size of the facility because greater amounts of water are being treated even though larger amounts of disinfectant materials may be delivered to them on each trip. Our estimates suggest that, except in the case of ozone and ultraviolet light, delivery frequencies to facilities that do not use chlorine gas are about the same or somewhat higher than those to facilities that do. 4. CONCLUSIONS The procedures used to evaluate and select disinfectants for a particular CWS facility focus generally only on site-specific factors and do not consider the impacts of these decisions at the regional or national level. Neither do they necessarily consider externalities such as the need for more capacity to produce electricity, greater greenhouse gas emissions, or increased demands on the transportation system. The objective of this research was to develop a better understanding of the nation’s community water system disinfection practices, and then to develop a quantitative supply chain model to analyze the macroeconomic impacts if these practices changed. The starting point of the model is a salt mine and the ending point is the water utility distribution system. We call this the Disinfectant Supply Chain Model. The model depicts the behavior patterns of almost 52,000 community water systems in all fifty states, Puerto Rico, the Virgin Islands and the Pacific Territories.10 Specifically, we used this model to estimate the macroeconomic impact along three important dimensions:
• the impact on the nation’s electrical energy consumption, • the impact on the nation’s greenhouse gas emissions, and • the impact on the nation’s transportation system.
Major findings include:
• Energy Consumption - Use of chlorine gas reduces electric power consumption compared to the other disinfectants. On a supply chain basis, chlorine gas uses 36% less electricity than its best available and most widely used substitute, bulk sodium hypochlorite. The average power consumption multiple for all disinfectants is more than two times that of chlorine gas on a per-capita basis.
• Greenhouse Gas – Use of chlorine gas reduces per capita greenhouse gas emissions compared to the other disinfectants. Greenhouse gases are released in the production of the electricity used to manufacture the disinfectants and in the transportation of the products along the supply chain. On a supply chain basis, the
10 Puerto Rico, the Virgin Islands and the pacific Territories have about 1.1% of the CWSs and 1.9% of the population examined in this research. Collectively they consume about 1% of the electricity and generate about 0.9% of the GHGs generated. They generate about 1.6% of the GHGs from transportation, however, of which about 75% is from ocean freight.

26
use of the best available substitute for chlorine produces more than 50% more greenhouse gas. Most of this gap can be attributed to efficiencies in the production of the chlorine and the remainder to efficiencies in the supply chain.
• Transportation – Use of chlorine gas reduces the total amount of material transported compared to most other chemical disinfectants except ozone. Considering all the other disinfectants on a supply chain basis, the alternatives require 30% more material movement at current consumption patterns when compared to chlorine gas on a per capita served basis. On a unit consumption basis only on-site generation of hypochlorite and disinfection with ozone and UV involve less material movement because these technologies require only the use of small amounts of raw materials and secondary disinfectants.
These advantages of using chlorine gas compared to other disinfectants represent average values for the entire United States. Disinfection practices vary greatly, however, and conditions at any particular water treatment facility may differ from the averages. Because there are gaps in the data on the current distribution of disinfection technologies, some uncertainty exists with respect to the total populations served by each. In addition, the transportation system is very complex and we used average distances between geographic centroids which injects another element of uncertainty to the analysis. There is little uncertainty, however, in the overall conclusion that chlorine gas represents the most energy efficient disinfectant available when compared to alternatives. In conclusion, we find significant differences in these metrics among the disinfectants. These results are significant because these factors have not been considered in the public debate about disinfectant choice. The use of chlorine gas offers advantages vis-à-vis any of the alternatives along all three macroeconomic dimensions – energy consumption, greenhouse gas emissions, and impacts on the transportation system. Chlorine is produced more efficiently than any of the alternatives, resulting in lower electricity consumption and fewer greenhouse gas emissions. Less chlorine is moved to produce the active disinfectant than for the alternatives except for ozone and UV, and this reduces impacts on the nation’s transportation system. These factors are worthy of consideration in the disinfectant selection process. Various groups have made proposals to modify these well-established practices by restricting the movement of chlorine gas on the rail transportation system due to potential security concerns or by promoting alternative disinfection technologies. Many of these proposals sound simple to implement yet few have examined the implications of these changes on the U.S. economy or society at large. This research is intended to provide a broad perspective on this issue. When sweeping changes are being considered for something as critical as the nation’s safe drinking water supply, the public expects regulators and experts to act on the basis of valid and reliable information. This study is intended to begin to close the information gap and contribute to a fact-based and balanced evaluation of alternative disinfectant technologies. Evaluation guidelines at the national level have consequences beyond those usually considered.

27
APPENDIX 1 The major sources of published information used in this study are presented below. The authors collected additional information in interviews with industry participants, including both suppliers and consumers of disinfectants. Sources of Information Number of treatment plants by population served and location
Factoids: Drinking Water and Ground Water Statistics for 2009, U.S. Environmental Protection Agency
Disinfection technology practices by population served, water volume, and type
“Community Water System Survey 2000, Volume III,” U.S. EPA; “Information Collection Rule Data Analysis”, Awwa Research Foundation, 2002, “Tracking Utility Disinfection over Four Decades of Change, Disinfection Survey 2007~Preliminary Summary,” and “Committee Report: Disinfection Survey, Part 2-Alternatives, Experiences, and Future Plans,” AWWA, 2008.
Population of the States US Bureau of the Census, 2010 Projections, 2005 Disinfectant materials and energy consumptions Chlorine and caustic soda Bulk hypochlorite from salt On-site generation Cases 1 and 2 Chlorine dioxide Ozone Ultraviolet disinfection systems
Euro Chlor, 2010 General Electric Power and Water, Ineos Technologies Severn Trent, MIOX Corporation Aker Chemetics ESCO International Corp Siemens
Fuel consumption and greenhouse gas emissions Domestic electricity emission factors by state Specific fuel consumptions: ocean, barge, rail and truck freight. Greenhouse gas emissions from fuels
“Appendix F, Form 1605(b), Energy Information Administration,” U.S. Department of Energy “Greenhouse Gas Emissions from the US Transportation Sector, 1990-2003,” U.S. Environmental Protection Agency, 2006; Iowa State University, University Extensions, 2010. “Fuel Emission Factors, Appendix H, form 1605,” Energy Information Association, U.S. Department of Energy
Plant Locations Merchant chlorine and bulk hypochlorite producers; chlorine and hypochlorite repackagers Salt production locations Ammonia production and distribution Oxygen distribution
Whitfield and Associates, various sources Salt Institute “Technical Support Document for Ammonia Production,” U.S. Environmental Protection Agency, 2009 ; Ammonia Distribution, Manta.com Industrial Oxygen, Manta.com
Transportation modes and distances Land distances Sea routes Transportation method
Google maps SeaRates.com Whitfield and Associates

28
APPENDIX 2 ENERGY ALLOCATION ISSUES IN THE
PRODUCTION OF CHLORINE GAS The electrical energy required for the production of chlorine and its co-products is normally denominated as kWh/electrochemical unit, or ECU. An ECU consists of the products of electrolysis in their stochiometric ratio, which is one mole of Cl2, two moles of NaOH, or caustic soda, and one mole of H2. The weight ratio of these products is 1:1.127:0.028. The numerical value of an ECU depends on the cell technology used to carry out the reactions and the units chosen for the production, commonly either short tons or metric tons. In this analysis we have used the following values for the power consumption in the electrolysis cells per metric ton ECU: for mercury cells, 3,360 kWh; for diaphragm cells, 2,720 kWh; and for membrane cells, 2,650 kWh. In addition we have used the following values for general plant power consumption: for mercury cell plants, 200 kWh; for diaphragm cell plants, 250 kWh; and for membrane cell plants, 140 kWh per metric ton ECU. Electricity is required to drive the chemical reactions that occur in the cells. The major reactions are the oxidation of chloride ions to chlorine gas at the anode, the dissociation of water to form the hydroxide ion that produces the caustic co-product, and the reduction of the hydrogen ion at the cathode to form the co-product hydrogen gas. From an electrochemical perspective the electrons released during chlorine oxidation serve to reduce the hydrogen ions formed by the dissociation of water, which drives the dissociation reaction. Thus, half of the energy is consumed in the production of chlorine gas and half in the production of hydrogen gas plus hydroxide ions. In the absence of other reactions the latter would be apportioned half to the hydrogen gas and half to the hydroxide, which ultimately appears in the form of co-product caustic soda. For mercury cells this would allocate 1,680 kWh to chlorine and 840 kWh each to caustic and hydrogen. The general plant power could be allocated in the same way, but there is no fundamental reason to do so. A large amount of plant power is consumed in the operation of pumps, compressors and other equipment whose electricity requirements depend on the mass of materials moved. Thus a reasonable allocation scheme for the 200kWh/ECU for a mercury cell plant would be about 92.8 kWh to chlorine, 104.6 kWh to caustic and 2.6 kWh to hydrogen, reflecting the weight ratios in which they are formed. While chlorine and sodium hydroxide are the major products of chlor-alkali production, the co-product hydrogen also has value. It can be reacted with chlorine to produce hydrogen chloride or sold for its chemical value in other applications. If these markets are not available, the hydrogen can be burned for its fuel value or simply vented or flared. We estimate that about 80% of the merchant chlor-alkali capacity in the United States has the ability to burn hydrogen for its fuel value, either in boilers to raise steam for the plant or in cogeneration systems to produce power and steam for plant use. In fact, some plants supplement the hydrogen with purchased natural gas and produce power or steam in excess of the requirements of the chlor-alkali plant itself. Since we do not know the distribution of hydrogen generally, we have assumed that across the merchant industry half of it is burned in combined cycle power plants to generate power for the

29
chlor-alkali plant and half is disposed in other ways. The allocation of this power back to the cells would provide energy credits of about 114 kWh to chlorine and 57 kWh each to caustic and hydrogen. The result of this allocation approach is that we estimate that the average net electricity requirement for a mercury cell plant is approximately 1,659 kWh/t for chlorine and 888 kWh/t for caustic. The estimated allocated electricity requirements for chlorine from diaphragm and membrane cell plants are 1,362 kWh and 1, 276 kWh respectively, and at the mix of cell technologies currently in use in the merchant industry, we estimate that the overall average is 1,360 kWh/t chlorine produced. The estimated overall average electricity allocated to caustic is only 737 kWh/t, but additional energy is required for its production in diaphragm and membrane plants because it must be recovered from the depleted brine solutions that exit the cells. Typically, evaporation of the brines is estimated to require about 2.17 metric tons of steam per metric ton of caustic in diaphragm plants and about 0.64 t/t in membrane plants. The fuel value of hydrogen is sufficient to generate all of the steam required in a membrane plant but only about half of the amount required in diaphragm plants. Whether the hydrogen is used to generate electricity, raise steam, or cogenerate steam and electricity, however, it would do so without forming any greenhouse gases and would reduce the environmental footprint of the chlor-alkali plant.