societal impact of novo nordisk foundation grants...
TRANSCRIPT

Societal impact ofNovo Nordisk FoundationGrants 2018
The Foundation´svision is to contribute significantly to research and development that improves people’s lives and the sustainability of society.
The Foundation´svision is to contribute significantly to research and development thatimproves people’s lives and the sustainability of society.

Societal impact ofNovo Nordisk FoundationGrants 2018

Creation of knowledge and research talent
4
25
25
31
7
9
10
1Creation of knowledge and research talent
1.1Creation of knowledge: journal articles and collaboration across institutions, fields of science and countries
1.2Research talent: PhD students and postdoctoral fellows
Foreword
The Impact Report 2018 at a glance
Summary
Contents
→
CONTENTS
Chapter 1Chapter 1

Dissemination and use of knowledge within the private sector
Dissemination and use of knowledge within the public sector
5
47
47
76
87
99
99
110
120
2Dissemination and use of knowledge in the public sector
2.1Dissemination and use of knowledge in academia
2.2Public healthcare
2.3Three cancer projects
3Dissemination and use of knowledge in the private sector
3.1Grant recipient collaboration with companies
3.2Dissemination and use of public research in patents
3.3Impact of innovation programmes
CONTENTS
Chapter 2Chapter 2 Chapter 3Chapter 3

6
7
The Novo Nordisk Foundation has a vision to contribute significantly to research and development that improves the lives of people and the sustainability of society. Through our grant-awarding activities for public research, we want to promote excellent research and innovation, devel-opment of talent at all career stages and world-class education.
We are a Danish foundation with corporate interests. We see investment in science in the public and private sector as vital to continuing growth and for improving the health and welfare of people. One of our missions is to develop knowledge-based environments in which innovative and talented people can carry out research of the highest quality and trans-late discoveries into new treatments and solutions. Through our invest-ment in public research, we promote the creation of new knowledge, we improve education, and we support innovation and the development of new medicine, prevention and treatment to benefit people and society.
This Impact Report 2018 provides analyses about the outputs, outcomes and impact of the research activities of our grant recipients. It documents the results of the activities in 2018 and earlier years.
We hope you will enjoy reading the analysis.
ForewordForeword
FOREWORD
" T h e o v e ra l l c o n c l u s i o n o f t h e re p o r t i s t h a t i n v e s t i n g i n re s e a rc h a n d d e v e l o p m e n t i n s o c i e t y c o n t r i b u t e s t o c re a t i n g k n o w l e d g e , e m p l o y m e n t , g ro w t h , i n n o v a t i o n a n d i n v e n t i o n o f p ro d u c t s a n d s e r v i c e s t o b e n e f i t p e o p l e .”L a r s R e b i e n S ø r e n s e n , C h a i r m a n , B o a r d o f D i r e c t o r s , N o v o N o r d i s k F o u n d a t i o n .
8
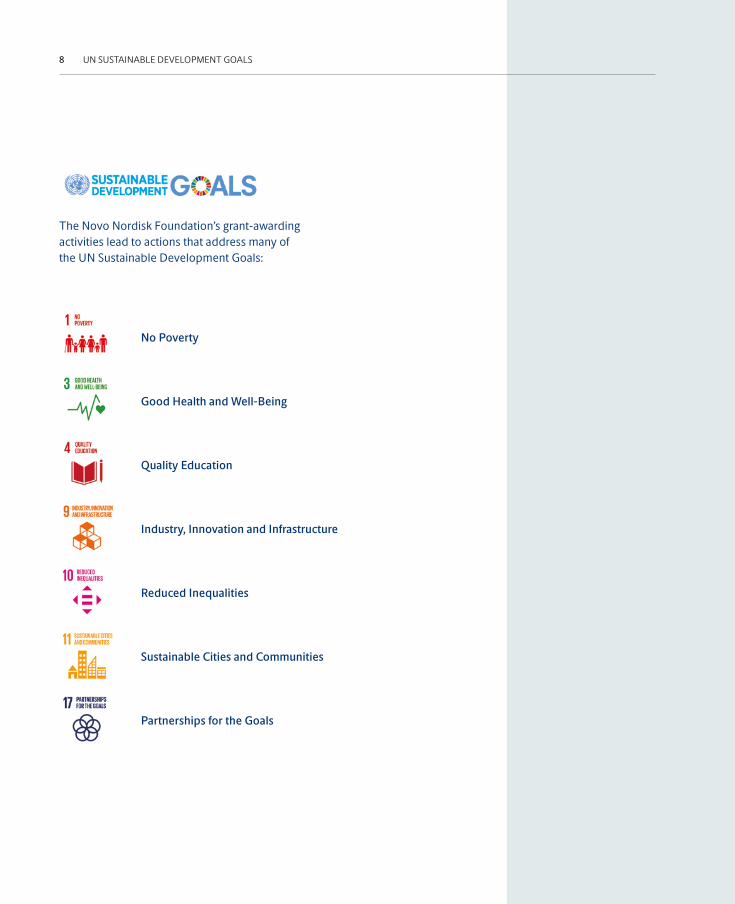
The Novo Nordisk Foundation’s grant-awarding activities lead to actions that address many of the UN Sustainable Development Goals:
No Poverty
Industry, Innovation and Infrastructure
Good Health and Well-Being
Reduced Inequalities
Quality Education
Partnerships for the Goals
Sustainable Cities and Communities
UN SUSTAINABLE DEVELOPMENT GOALS
99THE IMPACT REPORT 2018 AT A GLANCE
The Impact Report 2018 at a glance
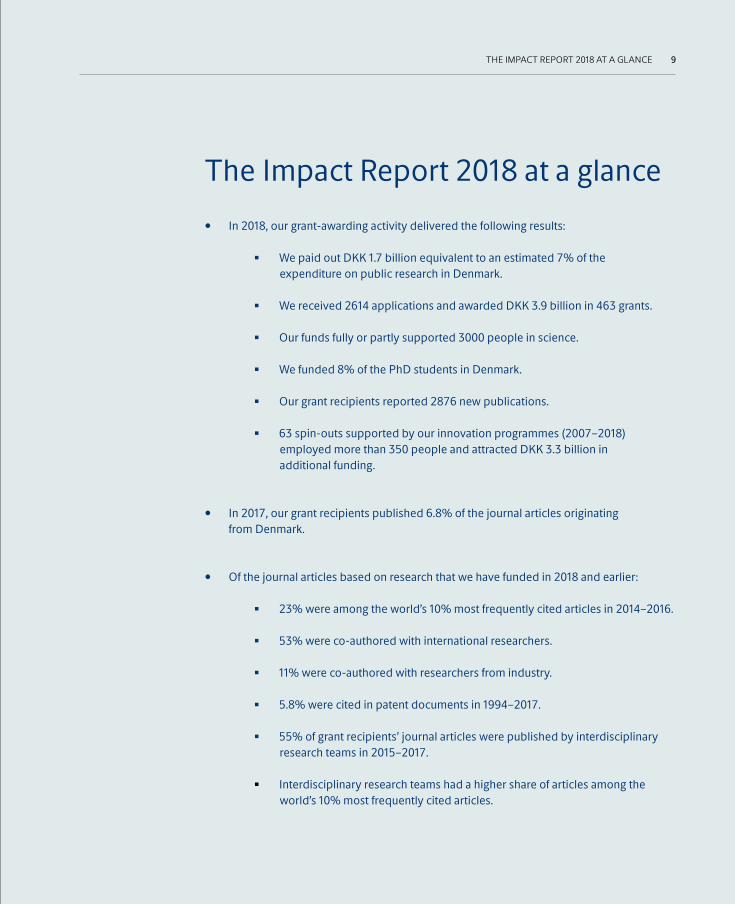
✸ 23% were among the world’s 10% most frequently cited articles in 2014–2016.
✸ 53% were co-authored with international researchers.
✸ 11% were co-authored with researchers from industry.
✸ 5.8% were cited in patent documents in 1994–2017.
✸ 55% of grant recipients’ journal articles were published by interdisciplinary research teams in 2015–2017.
✸ Interdisciplinary research teams had a higher share of articles among the world’s 10% most frequently cited articles.
✸ We paid out DKK 1.7 billion equivalent to an estimated 7% of the expenditure on public research in Denmark.
✸ We received 2614 applications and awarded DKK 3.9 billion in 463 grants.
✸ Our funds fully or partly supported 3000 people in science.
✸ We funded 8% of the PhD students in Denmark.
✸ Our grant recipients reported 2876 new publications.
✸ 63 spin-outs supported by our innovation programmes (2007–2018) employed more than 350 people and attracted DKK 3.3 billion in additional funding.
• In 2018, our grant-awarding activity delivered the following results:
• In 2017, our grant recipients published 6.8% of the journal articles originating from Denmark.
• Of the journal articles based on research that we have funded in 2018 and earlier:
10
This summary recaps the broad findings in Chapters 1, 2 and 3 of the Impact Report 2018. Chapter 1 focuses on creation of knowledge and research talent. Chapter 2 analyses the dis-semination and use of knowledge in the public sector. The focus is on the research community and the public health sec-tor. Chapter 3 presents analyses of the private sector dissemi-nation and use of Foundation-funded public research and the impact of the innovation programmes of the Foundation.
The three chapters also present results from the following in-depth analyses and evaluations
• analysis of interdisciplinary collaboration in Foundation- funded journal articles;
• study on PhD students and postdoctoral fellows funded by the Foundation;
• study on three cancer research projects;
• citation peak analysis – how long journal articles take to peak in citations;
• analysis of citation spread across open-competition grants;
• analysis on the disruptive content of Foundation-funded research; and
• study on the Foundation’s pre-seed and exploratory pre-seed grants.
SUMMARY
SummarySummaryChapters 1, 2 and 3 of the Impact Report 2018
11
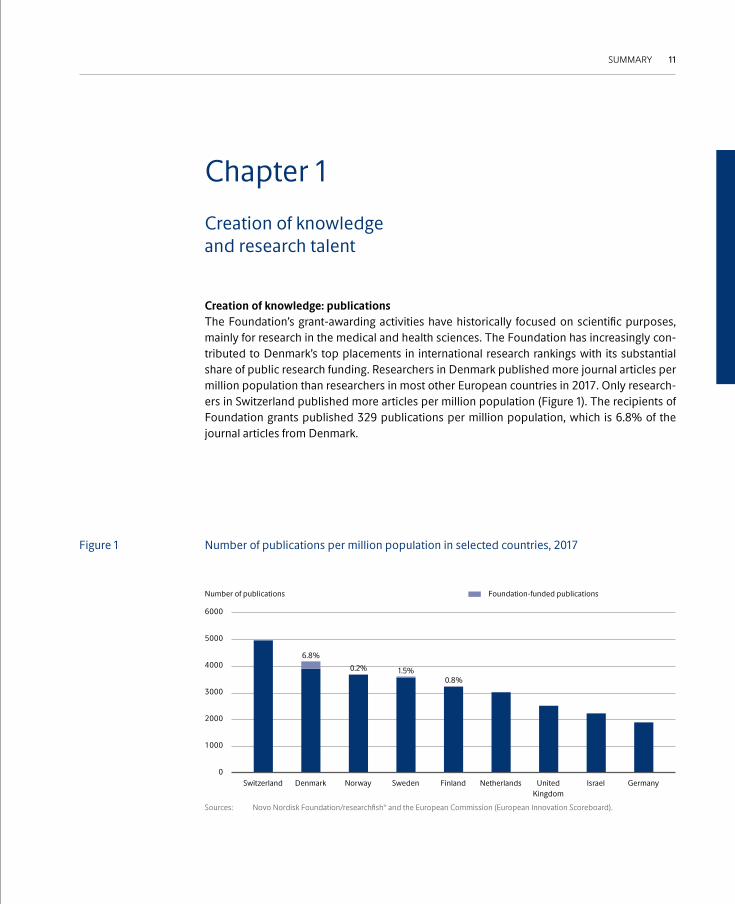
Number of publications per million population in selected countries, 2017Figure 1
Creation of knowledge: publications The Foundation’s grant-awarding activities have historically focused on scientific purposes, mainly for research in the medical and health sciences. The Foundation has increasingly con-tributed to Denmark’s top placements in international research rankings with its substantial share of public research funding. Researchers in Denmark published more journal articles per million population than researchers in most other European countries in 2017. Only research-ers in Switzerland published more articles per million population (Figure 1). The recipients of Foundation grants published 329 publications per million population, which is 6.8% of the journal articles from Denmark.
6000
5000
4000
3000
2000
1000
0Switzerland Denmark Norway Sweden Finland Netherlands United
KingdomIsrael Germany
Number of publications Foundation-funded publications
Sources: Novo Nordisk Foundation/researchfish® and the European Commission (European Innovation Scoreboard).
6.8%0.2% 1.5%
0.8%
SUMMARY
Creation of knowledge and research talent
Chapter 1

12
Journal articles with international co-authors per million population in selected countries, 2017Figure 2
International research collaborationIn 2017, 2346 academic journal articles with international co-authors were published per million population in Denmark, second to Switzerland (2946 per million population). The number for Denmark includes 173 articles per million population by the recipients of Foun-dation grants (Figure 2). Grant recipients account for 7.4% of the journal articles across all scientific fields in Denmark. Moreover, 53% of their journal articles were co-authored with international researchers in 2014–2018.
3500
3000
2500
2000
1500
1000
500
0
Number of journal articles Foundation-funded publications
Sources: Novo Nordisk Foundation/researchfish® and the European Commission (European Innovation Scoreboard 2018).
Switzerland Denmark NorwaySweden Finland Netherlands United Kingdom
Israel Germany
7.4%
SUMMARY

13
Number of people in science supported fully or partly by Foundation grants, 2014–2018 Figure 3
Research talent: PhD students and postdoctoral fellowsIn 2018, the Foundation’s grant-awarding activity fully or partly funded 2998 people within science. This was 203 people more than in 2017. The Foundation’s direct support for people within science has been steadily increasing since 2014, (Figure 3).
3000
2500
2000
1500
1000
500
0
Number of people
Source: Novo Nordisk Foundation/researchfish®.
2014 2015 2016 2017 2018
Other people in science Postdoctoral fellowsPhD students
SUMMARY

SUMMARY14
New PhD graduates per 1000 population 25–34 years old in selected countries in 2016Figure 4
4
3
2
1
0
Number of people
Sources: Novo Nordisk Foundation/researchfish® and European Commission (European Innovation Scoreboard 2018).
7%
Switzerland Denmark NorwaySwedenFinland NetherlandsUnited Kingdom
IsraelGermany
Foundation-funded PhD students
In 2018, the Foundation fully or partly funded 506 PhD students and 719 postdoctoral fellows, an increase from 2014 (Figure 5). The Foundation currently funds about 8% of all PhD students in Denmark. In 2017, the Foundation funded 14.1% within the medical and health sciences and 6.6% within the natural sciences.
Denmark has the second highest number of new PhD graduates per 1000 population in Eu-rope. Figure 4 shows that the number of new PhD graduates per 1000 population 25–34 years old in Denmark is higher than in all other countries except Switzerland in 2016 (data for 2017 or 2018 are not yet available). In 2016, Denmark produced 3.2 new PhD graduates per 1000 population. Of all new PhD graduates, the Foundation funded about 0.2 per 1000 population (equivalent to 7% of all new graduates).

SUMMARY 15
Share of all journal articles in the top 10% most frequently cited articles worldwide in selected countries, 2015
Figure 5
Dissemination of journal articles within academia Denmark ranks high worldwide in terms of the world’s 10% most frequently cited articles per million population. In terms of cited articles, the Foundation’s grants support activities that increases the average level in Denmark, since 21% of the grant recipients’ journal articles (in 2015) are among the world’s 10% most frequently cited articles versus 13% for all journal articles from Denmark (2015-figures). This overall share is higher for researchers in the Nether-lands, United Kingdom and Switzerland (Figure 5).
25%
20%
15%
10%
5%
0%
Share of journal articles
Sources: Novo Nordisk Foundation/researchfish® and European Commission (European Innovation Scoreboard 2018).
Grant recipients
Switzerland United Kingdom
Nethederlands Denmark Sweden Germany Finland Norway Israel
World averageAll publications of the countriesFoundation-funded publications
Dissemination and use of knowledge within the public sector
Chapter 2

SUMMARY16
Share of all journal articles by recipients of Foundation grants in the top 1% and top 10% most frequently cited articles worldwide
Figure 6
Figure 6 shows the trend in citation impact of Foundation-funded journal articles from 2008 to 2016. The share of journal articles of the grant recipients of the Foundation among the 10% most frequently cited journal articles in the world increased from 20.6% in 2011–2013 to 23.4% in 2014–2016. The share for 1% most frequently cited journal articles increased from 3.2% in 2011–2013 to 4.6% in 2014–2016.
25%
20%
15%
10%
5%
0%
Share of journal articles
Sources: Novo Nordisk Foundation/researchfish® and the Danish Centre for Studies in Research and Research Policy.
2008–2010 2011–2013 2014–2016
World average PP(top 10%)World average PP(top 1%)
PP(top 10%) PP(top 1%)

SUMMARY 17
Treatment of patientsThrough the public–private partnership model of the Steno Diabetes Centers, the Founda-tion will support the advancement of all aspects of diabetes care in Denmark throughout the lifespan of people with diabetes. Until 2016, the Foundation supported the Steno Diabetes Center, which treated 5500 people in 2016. In 2017, it became Steno Diabetes Center Copen-hagen. In 2018, an additional three Steno Diabetes Centers were established in Aarhus, Aal-borg and Odense. In 2018 the four centres treated 20,480 people with diabetes: 45% with type 1 diabetes, 44% with type 2 diabetes and 4% children and young people. A Steno Diabetes Center will also be established in Region Zealand.
The services provided at the Steno Diabetes Centers include a wide range of diabetes health-care services, including endocrinological examinations and diagnoses, treatment of diabetes, eye scanning and examination, podiatry, dietary guidance and courses in a food laboratory. The Steno Diabetes Centers conduct clinical research activities, health promotion and educa-tion within diabetes.

SUMMARY18
Academia-industry co-publicationsAcademia–industry co-publication and collaboration are important channels for disseminating public research to companies. Researchers in Denmark publish more academia-industry co-authored journal articles per million population than researchers in most other European countries (Figure 7). In 2017, Denmark published 163 academia–industry co-authored journal articles per million population; researchers in Switzerland had the highest production at 260 per million population. The recipients of Foundation grants published the equivalent of 26 academia–industry co-authored journal articles per million population based on Foundation grants. The Foundation funded 16% of the Danish academia-industry publications.
Number of journal articles co-author by academia and industry per million populations in selected countries, 2017
Figure 7
300
250
200
150
100
50
0
Number of journal articles per million population
Sources: Novo Nordisk Foundation/researchfish® and European Commission, (European Innovation Scoreboard 2018).
Switzerland Denmark NorwaySweden FinlandNetherlands United Kingdom
IsraelGermany
Foundation-funded publications
16%
Dissemination and use of knowledge within the private sector
Chapter 3

SUMMARY 19
Percentage of journal articles cited by patent documents worldwide, 1994–2017 Figure 8
Use of public research in patentsThe Foundation’s analysis shows that two-thirds of research-active companies in Denmark depend on access to public research and collaboration with universities. Further, Founda-tion-funded public research has led to 1 of 18 journal articles being cited in patents and pat-ent applications – an indication of the quality, novelty and applicability. This share is three times higher than the world average share within the scientific fields the Foundation supports (Figure 8).
6%
5%
4%
3%
2%
1%
0%
Share of journal articles
Note: The world average is based on a stratified random sample of 4842 journal articles matching the distribution of subject categories of Foundation-funded journal articles.Source: Novo Nordisk Foundation.
Grant recipient journal articles Comparable journal articles worldwide
5.8%
1.9%

SUMMARY20
Spin-outs from universitiesThe Foundation’s innovation grants have created 63 spin-outs; of which 89% exist today, with total employment of 350 people in 2018. Figure 9 shows the distribution among universities and other institutions.
Origin of university spin-outs generated by exploratory pre-seed and pre-seed grantsFigure 9
25
20
15
10
5
0
Number of spin-out companies
Sources: Novo Nordisk Foundation/researchfish® and Accelerace.
Uni
vers
ity o
f Cop
enha
gen
Uni
vers
ity o
f Lin
köpi
ng
Tech
nica
l Uni
vers
ity o
f Den
mar
k
Uni
vers
ity o
f Oslo
Aar
hus U
nive
rsity
Uni
vers
ity o
f Ber
gen
Lund
Uni
vers
ity
Stoc
khol
m U
nive
rsity
Rigs
hosp
itale
t
Dan
ish C
ance
r Soc
iety
Uni
vers
ity o
f Sou
ther
n D
enm
ark
Karo
linsk
a In
stitu
tet
Uni
vers
ity o
f Hel
sinki
Chal
mer
s Uni
vers
ity o
f Tec
hnol
ogy
Um
eå U
nive
rsity
Aal
borg
Uni
vers
ity
Aal
borg
Uni
vers
ity H
ospi
tal
Uni
vers
ity o
f Got
henb
urg

SUMMARY 21
Grants and payouts from the Novo Nordisk Foundation, 2014–2018Figure 10
Trends in the Foundation’s grant-awarding and payouts Since its beginning more than 90 years ago, the Foundation has primarily supported public research at universities and hospitals in Denmark and the other Nordic countries. The duration of a grant can vary from 1 to 13 years. From 2014 to 2018, the amount paid out doubled. In 2017 and 2018 combined, the Foundation awarded grants totalling nearly DKK 10 billion and paid out more than DKK 3 billion (Figure 10).
6000
5000
4000
3000
2000
1000
0
DKK million
2014 2015 2016 2017 2018
Note: In 2018, the Foundation received 2614 applications and awarded DKK 3.9 billion in 463 grants.Source: Novo Nordisk Foundation/researchfish®.
GrantsPayouts
1.749
1.3081.133914733
975 1.159
4.202
5.839
3.891
Background on funding public research in Denmark
Background

SUMMARY22
Expenditure in public research in Denmark as a percentage of GDP by funding sourceFigure 11
1.0%
0.8%
0.6%
0.4%
0.2%
0.0%
% of GDP
Source: Statistics Denmark.
20082007 2009 2010 2011 2012 2013 2014 2015 2016 2017
Domestic foundations and organisations Domestic companiesEU and other foreign sourcesDomestic public sources
The Foundation is one of many private domestic foundations and organisations supporting public research in Denmark. In 2017, their total share of funding for public research was 0.14% of GDP, up from approximately 0.06% of GDP in 2007 (Figure 11). In 2018, the Foundation’s share of public research is expected to be approximately 0.08% of GDP, or almost half of that provided by the domestic foundations and organisations.
The Foundation’s share of spending in public research in DenmarkInvestment in public and private research in 2017 was DKK 66 billion, equivalent to 3% of gross domestic product (GDP). DKK 22.4 billion was invested in public research. The payout from the Foundation for public research amounted to 5.5% of the total investment in 2017. This share was expected to increase to 7% in 2018. Across the fields of research, this amounts to 15% of total public research spending in Denmark within the medical and health sciences, 7% within engineering and technical sciences, 3% within the natural sciences and 2% within the humanities.

23

CHAPTER 124
Creation of knowledge and research talent
Chapter 1Chapter 1

CREATION OF KNOWLEDGE AND RESEARCH TALENT 25
Total number of publications published by recipients of Foundation grants, 2014–2018Figure 1.1
1. CREATION OF KNOWLEDGE AND RESEARCH TALENT
The Foundation supports public research through a variety of grant types such as centres, programmes, projects and individual fellowships. This chapter presents the creation of knowl-edge and the support for research talent based on the Foundation’s grants. The increase in grant amounts and payouts resulting from the Foundation’s Strategy 2014–2018 has affected the level of activity, outputs and outcomes. In 2018, the Foundation paid out 30% more than in 2017, comprising an estimated 7% of the expenditure on public research in Denmark.
1.1 Creation of knowledge: journal articles and collaboration across institutions, fields of science and countries
1.1.1 Production of journal articles Since 1927, the recipients of Foundation grants have published more than 23,500 publica-tions of which more than 10,700 have been published from 2014 to 2018. Because recipients of Foundation grants typically obtain additional funding and multiple authors contribute to a publication, the Foundation does not exclusively fund all these publications.
Researchers supported by the Foundation are required to report annually on the outputs and outcomes from the funded research. In January 2019 grant recipients reported 2876 new pub-lications of which most were published in 2018. Of the publications published from 2014 to 2018 funded by Foundation grants, about 80% were journal articles (original research arti-cles and reviews) and 20% were other types of publications, such as policy papers, technical reports, letters and book chapters (Figure 1.1).
2500
2000
1500
1000
500
0
Number of publications
2014 2015 2016 2017 2018
Source: Novo Nordisk Foundation/researchfish®.
Research articlesReviewsOther

CHAPTER 126
1.1.2 Fields of science for journal articles Journal articles in the citation database Web of Science are registered according to the subject category assigned to the journal of publication. The OECD has aggregated these detailed sub-ject categories into fields of science and technology. Figure 1.3 and Figure 1.4 show the number of Foundation-funded journal articles across the OECD-defined fields of science.
The number of journal articles increased substantially from 2008–2013 to 2014–2018. Because of delayed reporting, the 2014–2018 production will continue to increase. In 2014–2018, med-ical and health sciences (55%) was the most common field for Foundation-funded journal ar-ticles to be published in followed by natural sciences (37%) and engineering and technology (6%). The number of journal articles for the remaining fields (Figure 1.4) is very small, compris-ing 2% of all Foundation-funded journal articles.
Researchers in Denmark published more journal articles per million population in 2017 than researchers in most other European countries. Only researchers in Switzerland published more articles per million population (Figure 1.2). Grant recipients published 329 publications per million population based on Foundation grants, or 6.8% of the journal articles from Denmark.
Number of publications per million population in selected countries, 2017 Figure 1.2
6000
5000
4000
3000
2000
1000
0Switzerland Denmark Norway Sweden Finland Netherlands United
KingdomIsrael Germany
Number of publications per million population Foundation-funded publications
Sources: Novo Nordisk Foundation/researchfish® and the European Commission (European Innovation Scoreboard).
6.8%

CREATION OF KNOWLEDGE AND RESEARCH TALENT 27
Journal articles within the natural sciences, engineering and technology, and medical and health sciences
Journal articles within agricultural sciences, social sciences and humanities
Figure 1.3
Figure 1.4
5000
4000
3000
2000
1000
0
Number of journal articles
Sources: Novo Nordisk Foundation/researchfish® and Danish Centre for Studies in Research and Research Policy.
Natural sciences Engineering and technology Medical and health sciences
2008–20132014–2018
80
60
40
20
0
Number of journal articles
Note: Researchers within the humanities publish few journal articles. More often they publish books, book chapters, monographs and other formats.Sources: Novo Nordisk Foundation/researchfish® and Danish Centre for Studies in Research and Research Policy.
Agricultural sciences Social sciences Humanities
2008–20132014–2018

CHAPTER 128
1.1.3 Co-authorship – sectoral and geographical collaboration This section describes the co-authorship patterns of journal articles. The affiliations of the co-authors are used here to identify the nature of the sectoral and the geographical collab-oration. Collaboration is important for research outcomes. Research collaboration crosses national borders and can involve both public researchers at such institutions as universities, hospitals, and industrial researchers. Collaboration results from a search- and match process between researchers with the main purpose of improving research outcomes. It can involve collaboration between disciplines (interdisciplinary collaboration) and lead to cross-discipli-nary research. It can improve the dissemination and wider use of the knowledge generated, such as knowledge spillover from public sector research to private sector use and research and vice versa.
The journal articles are divided into the following types of collaboration: 1) articles co-au-thored with researchers from two or more national academic research institutions only, 2) articles co-authored with researchers from international, academic research institutions, and 3) articles co-authored with industrial researchers employed in companies. The remaining fourth group covers journal articles with a single author or with authors from the same organ-ization (called “no cross-institutional co-authorship”). Figure 1.5 shows the number of articles by type of co-authorship.
Number of journal articles by co-authorshipFigure 1.5
4000
2000
0
Number of journal articles
Sources: Novo Nordisk Foundation/researchfish® and Danish Centre for Studies in Research and Research Policy.
2018–2013 2014–2018
No cross-institutional co-authorshipCo-authorship with national research institutionsCo-authorship with international research institutionsCo-authorship with industry

CREATION OF KNOWLEDGE AND RESEARCH TALENT 29
Journal articles co-authored with researchers from international research institutions had the largest increase in the number and percentage of journal articles involving co-authors from 2008–2013 to 2014–2018. This number nearly doubled, from 2207 to 3954 (see Figure 1.5), and 53% of journal articles from 2014 to 2018 were published with international researchers. This type of collaboration was also the most common type in both periods (see Figure 1.6).
Share of journal articles by co-authorshipFigure 1.6
100%
90%
80%
70%
60%
50%
40%
30%
20%
10%
0%
Number of journal articles
Sources: Novo Nordisk Foundation/researchfish® and Danish Centre for Studies in Research and Research Policy.
Co-authorship with industryCo-authorship with international research institutionsCo-authorship with national research institutionsNo cross-institutional co-authorship
2018–2013 2014–2018
10.5%12.2%
21.6%23.9%
15.1%19.3%
52.9%44.6%

CHAPTER 130
Journal articles with international co-authors per million population in selected countries, 2017Figure 1.7
3500
3000
2500
2000
1500
1000
500
0
Number of journal articles per million population Foundation-funded publications
Sources: Novo Nordisk Foundation/researchfish® and the European Commission (European Innovation Scoreboard 2018).
Switzerland Denmark NorwaySweden Finland Netherlands United Kingdom
Israel Germany
1.1.4 Benchmark of journal articles with international co-authorshipIn 2017, 2346 academic journal articles with international co-authors were published per million population in Denmark, second to Switzerland (2946 per million population) within all scientific fields. The number for Denmark includes 173 (7.4%) articles per million population by the recipients of Foundation grants (Figure 1.7).
7.4%

CREATION OF KNOWLEDGE AND RESEARCH TALENT 31
Number of people in science supported fully or partly by Foundation grants, 2008–2018Figure 1.8
1.2 Research talent: PhD students and postdoctoral fellows The Foundation aims to promote the development of research talent at all career stages through grants for research and education, including support for researcher education and training for PhD students and postdoctoral fellows. This applies to research centre grants, research programmes, project grants and investigator grants as well as individual PhD and postdoctoral grants.
In 2018, the Foundation’s grant-awarding activity fully or partly funded 2998 people within science. This was 203 people more than in 2017. The Foundation’s direct support for people within science has been steadily increasing since 2008. Figure 1.8 shows the distribution be-tween Foundation-funded postdoctoral fellows, PhD students and other persons in science grants.
3000
2500
2000
1500
1000
500
0
Number of people
2014 2015 2016 2017 2018
Note: The numbers of team members were not collected before 2015 and are therefore estimated.Source: Novo Nordisk Foundation/researchfish®.
Other people in sciencePhD studentsPostdoctoral fellows
2008 2009 2010 2011 2012 2013
CHAPTER 132
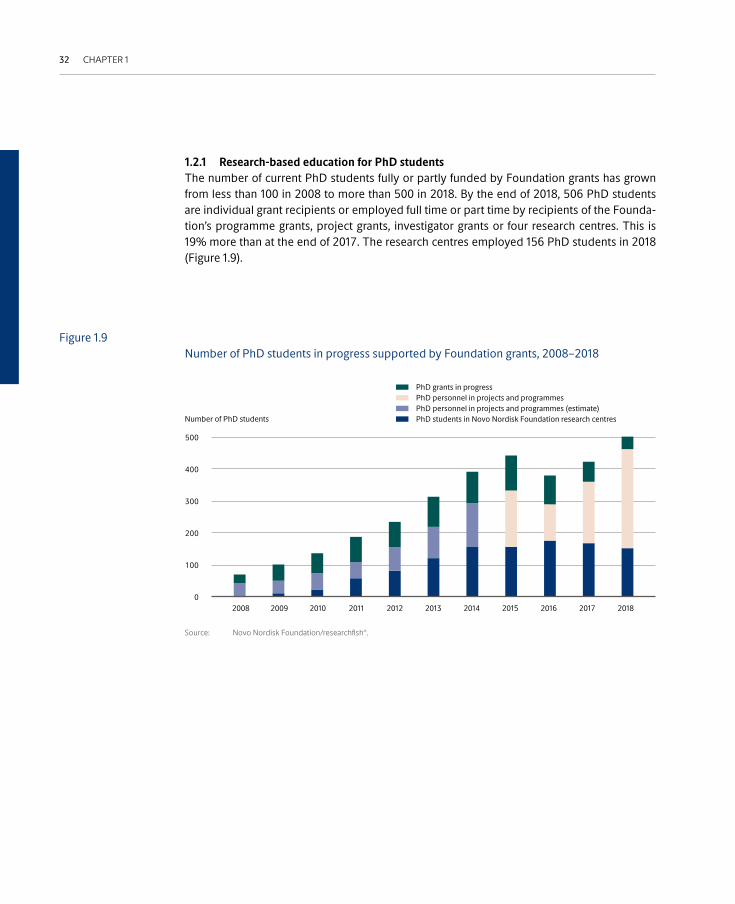
Number of PhD students in progress supported by Foundation grants, 2008–2018Figure 1.9
1.2.1 Research-based education for PhD students The number of current PhD students fully or partly funded by Foundation grants has grown from less than 100 in 2008 to more than 500 in 2018. By the end of 2018, 506 PhD students are individual grant recipients or employed full time or part time by recipients of the Founda-tion’s programme grants, project grants, investigator grants or four research centres. This is 19% more than at the end of 2017. The research centres employed 156 PhD students in 2018 (Figure 1.9).
500
400
300
200
100
0
Number of PhD students
Source: Novo Nordisk Foundation/researchfish®.
PhD grants in progressPhD personnel in projects and programmesPhD personnel in projects and programmes (estimate)PhD students in Novo Nordisk Foundation research centres
2014 2015 2016 2017 20182008 2009 2010 2011 2012 2013

CREATION OF KNOWLEDGE AND RESEARCH TALENT 33
Number of postdoctoral fellows in progress supported by Foundation grants, 2008–2018Figure 1.10
1.2.2 Research training for postdoctoral fellows The number of current postdoctoral fellows (a fellowship typically lasts 1–3 years) either fully or partly funded by the Foundation has increased from less than 100 in 2008 to more than 700 in 2018 (Figure 1.10). At the end of 2018, 719 postdoctoral fellows were individual grant recip-ients supported full time or part time by the Foundation’s project grants, programme grants, investigator grants or four research centres. This is 30% more than in 2017. The research cen-tres employed 286 postdoctoral fellows in 2018.
700
600
500
400
300
200
100
0
Number of fellows
Source: Novo Nordisk Foundation.
Postdoctoral grants in progressPostdoctoral personnel in projects and programmesPostdoctoral personnel in projects and programmes (estimate)Postdoctoral fellows in Novo Nordisk Foundation research centres
2014 2015 2016 2017 20182008 2009 2010 2011 2012 2013

CHAPTER 134
Share of PhD students in progress supported by Foundation grants within the six fields of science, 2017
Figure 1.11
1.2.3 PhD students in the six fields of science in Denmark in 2017In 2017, Denmark had 6974 current PhD students across the six fields of science (OECD fields of science and technology). In the same year, 426 current PhD students worked on individual grants or were employed full time or part time by the Foundation’s programme grants, project grants, investigator grants or four research centres. The Foundation funded or partly funded 14.1% of the PhD students within the health and medical sciences and 6.6% of the PhD stu-dents within the natural sciences in Denmark (Figure 1.11).
2500
2000
1500
1000
500
0
Number of students
Sources: Novo Nordisk Foundation and Statistics Denmark.
DenmarkNovo Nordisk Foundation
Medical and health sciences
Natural sciences
Humanities Engineering and technical sciences
Social sciences
Agricultural sciences
14.1%
6.6%
1.6%
0.8%
0.6%0%

CREATION OF KNOWLEDGE AND RESEARCH TALENT 35
New PhD graduates per 1000 population in selected countries, 2016Figure 1.12
1.2.4 International benchmark of new PhD graduates Denmark has the second highest number of new PhD graduates per 1000 population in Europe. Figure 1.12 shows that the number of new PhD graduates per 1000 population is high-er than in all other countries except Switzerland in 2016 (data for 2017 or 2018 are not yet available). In 2016, Denmark produced 3.2 new PhD graduates per 1000 population. Of all new PhD graduates, the Foundation funded an estimated 0.2 per 1000 population (equivalent to 6.2% of all new PhD graduates).
4
3
2
1
0
Number of people per 1000 population
Sources: Novo Nordisk Foundation/researchfish® and European Commission (European Innovation Scoreboard 2018).
Switzerland Denmark NorwaySwedenFinland NetherlandsUnited Kingdom
IsraelGermany
Foundation-funded PhD students
6.2%

CHAPTER 136
1 The benchmark group consists of individuals who received a Danish health science PhD degree during the period analysed (2008–2015). Some individuals may have continued in postdoctoral positions, as is also the case for the PhD students receiving a grant from the Foundation.
1.2.5 A study of Foundation-funded PhD students and postdoctoral fellows The Foundation-funded PhD students and postdoctoral fellows can receive a grant either directly from the Foundation or indirectly. Those who are indirectly funded by the Foundation can have a position in a research project or programme supported by the Foundation, receive a grant from an organization supported by the Foundation, such as the Danish Diabetes Acad-emy, or be working at a research centre supported by the Foundation. The Foundation has tracked publication activities, citation impact and collaboration patterns of PhD students and postdoctoral fellows benchmarked against all medical and health science PhD students from Aarhus University and the University of Copenhagen in the period 2008–2015. The bench-mark was chosen because most PhD students and postdoctoral fellows funded by the Foun-dation work at these two institutions. This section presents the results.1
In the period analysed, 1715 individuals received funding for PhD studies or postdoctoral re-search. Of these, 1284 (75%) were identified in Web of Science and analysed for their research output and outcomes. Figures 1.13 and 1.14 show the number of PhD students and postdoc-toral fellows for each year for each funding source. The main funding source for PhD students and postdoctoral fellows is indirect funding through large grants such as project grants and employment at Foundation research centres.

CREATION OF KNOWLEDGE AND RESEARCH TALENT 37
Number of distinct PhD students, by type of source, 2008–2015Figure 1.13
200
150
100
50
0
Number of PhD students
Sources: Novo Nordisk Foundation/researchfish® and Danish Centre for Studies in Research and Research Policy.
PhD students at the Novo Nordisk Foundation research centresPhD students supported by a Foundation-funded organizationPhD students in projects and programmesPhD grants
2014 20152008 2009 2010 2011 2012 2013
Number of distinct postdoctoral fellows, by type of source, 2008–2015Figure 1.14
Number of Postdoctoral fellows
Postdoctoral fellows at the Novo Nordisk Foundation research centresPostdoctoral fellows supported by Foundation-funded organizationsPostdoctoral fellows in projects and programmes Postdoctoral fellowship grants
300
250
200
150
100
50
0
Sources: Novo Nordisk Foundation/researchfish® and Danish Centre for Studies in Research and Research Policy.
2014 20152008 2009 2010 2011 2012 2013

CHAPTER 138
Figure 1.15
Field of science Applying the disaggregated version of the OECD classification of the fields of science and technology (OECD field of science, minor field), Figure 1.15 shows the overall distribution of scientific fields within which the supported individuals primarily conduct their research for the PhD students and postdoctoral fellows funded by the Foundation and the benchmark group.
The benchmark group, all PhD students from Aarhus University and the University of Copen-hagen, has published less within the biological sciences and a residual group of natural scienc-es and more within clinical medicine.
100%
90%
80%
70%
60%
50%
40%
30%
20%
10%
0%
Share of focus areas (OECD minor fields) covered
Sources: Novo Nordisk Foundation/ researchfish® and Danish Centre for Studies in Research and Research Policy.
Biological sciencesClinical medicineOther natural sciences
Basic medical researchChemical sciencesHealth sciencesOther total
Postdoctoral fellows PhD students Benchmark
Share of OECD minor fields covered by PhD students and postdoctoral fellows supported by Foundation grants and the benchmark group

CREATION OF KNOWLEDGE AND RESEARCH TALENT 39
Share of postdoctoral fellows and PhD students supported by Foundation grants with at least one publication since 2017
Figure 1.16
PublicationsFigure 1.16 shows the proportion of PhD students and postdoctoral fellows who have published at least one publication since 2017. The full height of the bar represents the proportion of individuals funded in 2008–2015 still publishing in 2017 or later. The light blue represents in-dividuals publishing only in 2017, and the dark blue represents individuals also publishing in 2018–2019.
Share of PhD students and Postdoctoral fellows
Sources: Novo Nordisk Foundation/researchfish® and Danish Centre for Studies in Research and Research Policy.
Postdoctoral fellows
2018–20192017
60%
50%
40%
30%
20%
10%
0%PhD students Benchmark

CHAPTER 140
There is a lag in the Web of Science author classifications, explaining the low proportion of the dark blue. The share of Foundation-funded PhD students who continue to publish in 2017 or later, 48%, is close to the benchmark share, 52%. The Foundation-funded PhD students rela-tively often start publishing during their grant period compared with the benchmark.
Most postdoctoral fellows remain active researchers during the first 5 years after their initial publication. The PhD student sample is limited to those who had their first publication in 2013 at the latest, to enable the comparison. Postdoctoral fellows are more likely to continue pub-lishing activities (Figure 1.17).
Share of postdoctoral fellows and PhD students supported by Foundation grants with no more than 2 years without publications in the first 5 years since the first publication year
Figure 1.17
Share of PhD students and Postdoctoral fellows
Sources: Novo Nordisk Foundation/ researchfish® and Danish Centre for Studies in Research and Research Policy.
Postdoctoral fellows
70%
60%
50%
40%
30%
20%
10%
0%PhD students Benchmark

CREATION OF KNOWLEDGE AND RESEARCH TALENT 41
Proportion of active researchers among postdoctoral fellows and PhD students supported by Foundation grants, years after first publication
Figure 1.18
Proportion of active researchersFigure 1.18 shows the share of individuals having at least one publication in each year up to 5 years after their first publication. The PhD student group has the lowest share.
Porportion of active researchers, years after first publication
Sources: Novo Nordisk Foundation/ researchfish® and Danish Centre for Studies in Research and Research Policy.
First publication
100%
80%
60%
40%
20%
0%1 year 2 years
Postdoctoral fellowsPhD students Benchmark
3 years 4 years 5 years

CHAPTER 142
Citation impactFor all three groups in the analysis, the share of journal articles authored or co-authored by post-doctoral fellows or PhD students cited among the 10% most frequently cited worldwide within their research field, PP(top 10%), exceeds the 10% world average (Figure 1.19). For com-parison the Foundation grant recipients have a PP(top 10%) at 23.4% within all sciences for 2014–2016.
Collaborations and co-authorshipFigures 1.20 and 1.21 show the shares of journal articles by funded PhD students and post-doctoral fellows and by the benchmark group co-authored with industrial researchers and international researchers, respectively.
Citation impact of postdoctoral fellows and PhD students supported by Foundation grants, measured by PP(top 10%)
Figure 1.19
Share of journal articles
Sources: Novo Nordisk Foundation/researchfish® and Danish Centre for Studies in Research and Research Policy.
30%
20%
10%
0%
Postdoctoral fellowsPhD students Benchmark
2014 20152008 2009 2010 2011 2012 2013

CREATION OF KNOWLEDGE AND RESEARCH TALENT 43
Share of journal articles co-authored with researchers from industry
Share of journal articles co-authored with international academic researchers
Figure 1.20
Figure 1.21
Share of journal articles
Sources: Novo Nordisk Foundation/researchfish® and Danish Centre for Studies in Research and Research Policy.
20%
10%
0%
Postdoctoral fellowsPhD students Benchmark
2014 20152008 2009 2010 2011 2012 2013
Share of journal articles
Sources: Novo Nordisk Foundation/researchfish® and Danish Centre for Studies in Research and Research Policy.
50%
40%
30%
20%
10%
0%
Postdoctoral fellowsPhD students Benchmark
2014 20152008 2009 2010 2011 2012 2013

CHAPTER 144
Median number of the average number of authors per journal articleFigure 1.22
Expanding on the analysis of collaboration, Figure 1.22 shows the median number of authors per journal article across each of the three samples. The results of Figure 1.22 imply that 50% of the postdoctoral fellows have 7.5 or fewer authors on their average journal article, and the other 50% of the postdoctoral fellows have 7.5 or more authors on their average journal ar-ticle. The PhD students typically have 7.6 authors on their average journal article, and the benchmark articles have 7.
Number of authors
Sources: Novo Nordisk Foundation/researchfish® and Danish Centre for Studies in Research and Research Policy.
Postdoctoral fellows
8
6
4
2
0PhD students Benchmark
77.67.5

CHAPTER 246
Dissemination and use of knowledge within the public sector
Chapter 2Chapter 2

DISSEMINATION AND USE OF KNOWLEDGE WITHIN THE PUBLIC SECTOR 47
2. DISSEMINATION AND USE OF KNOWLEDGE IN THE PUBLIC SECTOR
This chapter analyses the dissemination and use of Foundation-funded knowledge in the public sector. It focuses on the dissemination and use of knowledge in public research com-munities. Further, it presents the outcomes from Foundation-funded public research activities related to public healthcare and findings from an evaluation of three completed cancer pro-jects funded by the Foundation.
2.1 Dissemination and use of knowledge in academiaThis section focuses on how knowledge created by the recipients of the Foundation’s research grants is disseminated and used within academia. The Foundation’s research grant portfolio comprises several types of grants. The duration of grants varies: for example, 1–4 years for postdoctoral fellowships and projects, 3–7 years for investigator grants and programmes and up to 13 years for research centres. The dissemination and use of the outcomes of different types of grants should therefore be expected to vary. The analysis uses Leiden University’s bibliometric indicators, which is an internationally recognized benchmarking system for cita-tion analysis.

CHAPTER 248
Share of journal articles by recipients of Foundation grants among the top 10% most frequently cited in the world by type of grant - PP(top 10%)
Figure 2.1
40%
35%
30%
25%
20%
15%
10%
5%
0%
Share of journal articles
Note: Programme grants and postdoctoral fellowships in 2014–2016 have insufficient number of journal observations to calculate PP(top 10%). The number of journal articles 659 for 2008–2013 and 1140 for 2014–2016.Sources: Novo Nordisk Foundation/researchfish® and Danish Centre for Studies in Research and Research Policy.
Novo Nordisk Foundation
research centres
Innovationgrants
Programmegrants
Investigatorgrants
Steno DiabetesCenter
Projectgrants
Postdoctoralfellowships
World averagePP(top 10%) 2008–2013PP(top 10%) 2014–2016
2.1.1 Citation impact of journal articles reported by all grant recipients, according to type of grant within all sciences Figure 2.1 and Figure 2.2 present the share of Foundation-funded journal articles (all subject categories, all fields of research) among the world’s top 10% and 1% most frequently cited journal articles within 2008–2013 and 2014–2016 by all grant recipients according to the type of grant. Project grants and investigator grants have a higher share of frequently-cited journal articles in the period 2014–2016 compared with 2008–2013. The citation analysis is based on a 3-year citation period starting from the year of publication. The Foundation’s research centres have the highest share of citations above the world average among type of grants. However, this share was lower in 2014–2016 than in 2008–2013. The time lag (because of how citations are measured) may explain some of the differences in the number of citations between the two time periods.

DISSEMINATION AND USE OF KNOWLEDGE WITHIN THE PUBLIC SECTOR 49
Share of journal articles by recipients of Foundation grants among the top 1% most frequently cited in the world by type of grant - PP(top 1%)
Figure 2.2
12%
10%
8%
6%
4%
2%
0%
Share of journal articles
Note: Programme grants and postdoctoral fellowships in 2014–2016 have insufficient number of journal observations to calculate PP(top 1%). The number of journal articles 659 for 2008–2013 and 1140 for 2014–2016.Sources: Novo Nordisk Foundation/researchfish® and Danish Centre for Studies in Research and Research Policy.
Novo Nordisk Foundation
research centres
Innovationgrants
Programmegrants
Investigatorgrants
Steno DiabetesCenter
Projectgrants
Postdoctoralfellowships
PP(top 1%) 2008–2013PP(top 1%) 2014–2016
World average

CHAPTER 250
Benchmark of citation impact of journal articles within the biomedical and health sciences - PP(top 10%), 2014–2016
Figure 2.3
2.1.2 Citation impact of journal articles by grant recipients related to grants within the biomedical and health sciencesA benchmark of citation impact for the grant recipients of Foundation grants shows, that they are just a few percentage points lower than the university with the highest citation impact score in Europe for the 10% most frequently cited publications in 2014–2016 within the bio-medical and health sciences (Figure 2.3). Further, the citation impact of the Foundation’s four research centres is 3 percentage points lower than for articles from the university with the highest citation impact score in the world and 18 percentage points lower than articles from the Whitehead Institute, a leading independent research centre affiliated with the Massachu-setts Institute of Technology (MIT).
60%
40%
20%
0%
Share of journal articles
Novo Nordisk Foundation research centres
Grant recipients University of Oxford MIT Whitehead Institute
PP(top 10%)World average
Sources: Novo Nordisk Foundation/researchfish® and Danish Centre for Studies in Research and Research Policy.
DISSEMINATION AND USE OF KNOWLEDGE WITHIN THE PUBLIC SECTOR 51
Benchmark of citation impact of journal articles within the biomedical and health sciences - PP(top 1%), 2014–2016
Figure 2.4
15%
10%
5%
0%
Share of journal articles
Novo Nordisk Foundation research centres
Grant recipients University of Oxford MIT Whitehead Institute
PP(top 1%)World average
Sources: Novo Nordisk Foundation/researchfish® and Danish Centre for Studies in Research and Research Policy.
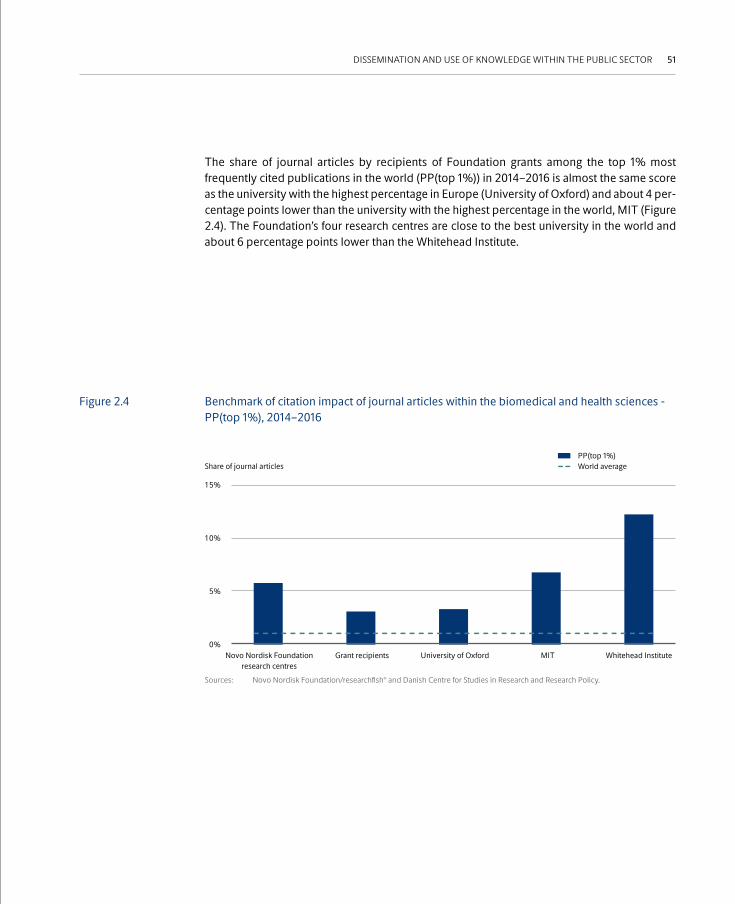
The share of journal articles by recipients of Foundation grants among the top 1% most frequently cited publications in the world (PP(top 1%)) in 2014–2016 is almost the same score as the university with the highest percentage in Europe (University of Oxford) and about 4 per-centage points lower than the university with the highest percentage in the world, MIT (Figure 2.4). The Foundation’s four research centres are close to the best university in the world and about 6 percentage points lower than the Whitehead Institute.
CHAPTER 252
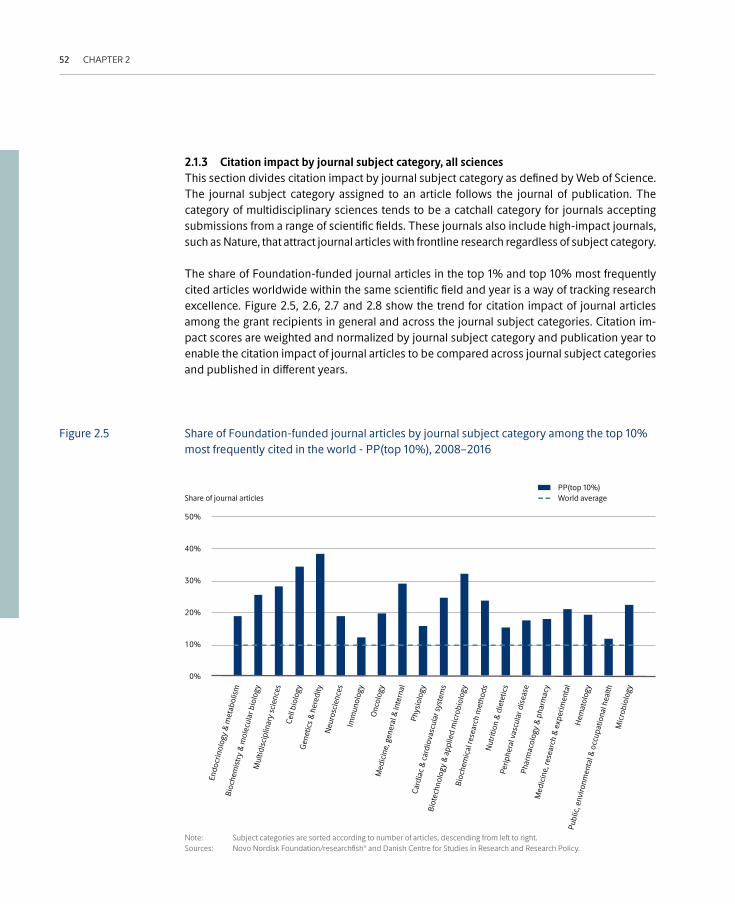
2.1.3 Citation impact by journal subject category, all sciences This section divides citation impact by journal subject category as defined by Web of Science. The journal subject category assigned to an article follows the journal of publication. The category of multidisciplinary sciences tends to be a catchall category for journals accepting submissions from a range of scientific fields. These journals also include high-impact journals, such as Nature, that attract journal articles with frontline research regardless of subject category.
The share of Foundation-funded journal articles in the top 1% and top 10% most frequently cited articles worldwide within the same scientific field and year is a way of tracking research excellence. Figure 2.5, 2.6, 2.7 and 2.8 show the trend for citation impact of journal articles among the grant recipients in general and across the journal subject categories. Citation im-pact scores are weighted and normalized by journal subject category and publication year to enable the citation impact of journal articles to be compared across journal subject categories and published in different years.
Share of Foundation-funded journal articles by journal subject category among the top 10% most frequently cited in the world - PP(top 10%), 2008–2016
Figure 2.5
50%
40%
30%
20%
10%
0%
Share of journal articles
Note: Subject categories are sorted according to number of articles, descending from left to right. Sources: Novo Nordisk Foundation/researchfish® and Danish Centre for Studies in Research and Research Policy.
Endo
crin
olog
y &
met
abol
ism
Card
iac
& ca
rdio
vasc
ular
syst
ems
Bioc
hem
istry
& m
olec
ular
bio
logy
Biot
echn
olog
y &
appl
ied
mic
robi
olog
y
Mul
tidisc
iplin
ary
scie
nces
Bioc
hem
ical
rese
arch
met
hods
Cell
biol
ogy
Nut
ritio
n &
diet
etic
s
Gen
etic
s & h
ered
ity
Perip
hera
l vas
cula
r dise
ase
Neu
rosc
ienc
es
Phar
mac
olog
y &
phar
mac
y
Imm
unol
ogy
Med
icin
e, re
sear
ch &
exp
erim
enta
l
Onc
olog
y
Publ
ic, e
nviro
nmen
tal &
occ
upat
iona
l hea
lthM
icro
biol
ogy
Hem
atol
ogy
Med
icin
e, g
ener
al &
inte
rnal
Phys
iolo
gy
PP(top 10%)World average

DISSEMINATION AND USE OF KNOWLEDGE WITHIN THE PUBLIC SECTOR 53
Share of journal articles by grant recipients of Foundation grants among the top 10% most frequently cited in the world - PP(top 10%), 2008–2016
Figure 2.6
25%
20%
15%
10%
5%
0%
Share of journal articles
2008–2010 2011–2013 2014–2016
Sources: Novo Nordisk Foundation/researchfish® and Danish Centre for Studies in Research and Research Policy.
PP(top 10%)World average
Share of journal articles by grant recipients of Foundation grants among the top 1% most frequently cited in the world - PP(top 1%), 2008–2016
Figure 2.7
5%
3%
1%
-1%
Share of journal articles
2008–2010 2011–2013 2014–2016
Sources: Novo Nordisk Foundation/researchfish® and Danish Centre for Studies in Research and Research Policy.
PP(top 1%)World average

CHAPTER 254
Share of journal articles by recipients of Foundation grants by journal subject category among the top 1% most frequently cited in the world - PP(top 1%), 2008–2016
Figure 2.8
Main results:• Altogether, 23.4% of the grant recipient’s journal articles are among the world’s top 10%
and 4.6% in the world’s top 1% most frequently cited in 2014–2016.
• 18% of the journal articles by grant recipients are published within endocrinology & metabolism. Of these, 19% are among the top 10% most frequently cited worldwide, and 3% are among the top 1% most frequently cited worldwide.
• In multidisciplinary sciences, which has the third largest number of journal articles, 28% of the journal articles by grant recipients are in the top 10%, and 9% are in the 1% most frequently cited worldwide.
• In general medicine and internal medicine, 29% of the journal articles by recipients of Foundation grants are among the top 10% most frequently cited worldwide within their field, and more than 5% are among the 1% most frequently cited.
10%
8%
6%
4%
2%
0%
Share of journal articles
Note: The subject categories are sorted according to the number of articles, descending from left to right. Sources: Novo Nordisk Foundation/researchfish® and Danish Centre for Studies in Research and Research Policy.
Endo
crin
olog
y &
met
abol
ism
Card
iac
& ca
rdio
vasc
ular
syst
ems
Bioc
hem
istry
& m
olec
ular
bio
logy
Biot
echn
olog
y &
appl
ied
mic
robi
olog
y
Mul
tidisc
iplin
ary
scie
nces
Bioc
hem
ical
rese
arch
met
hods
Cell
biol
ogy
Nut
ritio
n &
diet
etic
s
Gen
etic
s & h
ered
ity
Perip
hera
l vas
cula
r dise
ase
Neu
rosc
ienc
es
Phar
mac
olog
y &
phar
mac
y
Imm
unol
ogy
Med
icin
e, re
sear
ch &
exp
erim
enta
l
Onc
olog
y
Publ
ic, e
nviro
nmen
tal &
occ
upat
iona
l hea
lthM
icro
biol
ogy
Hem
atol
ogy
Med
icin
e, g
ener
al &
inte
rnal
Phys
iolo
gy
PP(top 1 %)World average

DISSEMINATION AND USE OF KNOWLEDGE WITHIN THE PUBLIC SECTOR 55
2.1.4 Interdisciplinary co-authorship in journal articlesThis section divides citation impact by journal subject category as defined by Web of Science. Interdisciplinarity is one of the grant-awarding principles of the Foundation. This principle im-plies that the Foundation facilitates connectivity across disciplines to generate new ways of discovery and to solve complex problems in the search for solutions to significant global and societal challenges. The Foundation believes that interdisciplinary research will drive future waves of discovery and innovation. It advocates and supports the removal of barriers between traditional disciplines and fields of research.
This section investigates interdisciplinary collaboration on journal articles published by re-cipients of Foundation grants. First, the background – academic specialization and field of sci-ence – of the authors who have written an article together is investigated. Second, the citation impact of journal articles with monodisciplinary co-authorship and interdisciplinary co-au-thorship is analysed. The co-authors’ background on an article defines whether an article is monodisciplinary or interdisciplinary.
The reader should bear in mind that investigating the social and cognitive phenomena in in-terdisciplinary research is challenging and no single method captures the whole picture. The analysis presented here does not investigate the interdisciplinary nature of the research car-ried out, it solely investigates interdisciplinary collaboration by the background of the co-au-thors on a journal article.

CHAPTER 256
Two definitions of interdisciplinary collaboration
• Interdisciplinary collaboration can be said to take place if the co-au-thors on a journal article have different academic specializations such as endocrinology, microbiology, genetics, physiology, biotechnology, chemistry and biochemistry.
• Interdisciplinary collaboration can also be said to take place if the co-authors on a journal article have a background from more than one field of science according to OECD’s definition: medical and health sciences, natural sciences, engineering and technology, agricultural sciences, social sciences and humanities.
The analysed data comprises 914 journal articles randomly selected from 4569 Foundation- funded journal articles published in 2015–2017. Only articles with 20 co-authors or less are included in the analysis. The 914 articles had 6605 authors; the academic specialization was identified for 96% of the authors resulting in 159 identified academic specializations such as endocrinology, biotechnology and chemistry. The academic specializations were further mapped to the six field of science defined by the OECD: medical and health sciences, natural sciences, engineering and technology, agricultural sciences, social sciences and humanities. The Foundation’s Impact Report 2017 (http://impact.novonordiskfonden.dk/wp-content/up-loads/NNF_impact_report.pdf) describes the methods used to identify, harmonize and map the backgrounds of authors.

DISSEMINATION AND USE OF KNOWLEDGE WITHIN THE PUBLIC SECTOR 57
Diversity in the number of authors writing a journal articleIn the sample, the average number of authors writing a journal article is 10 and the most frequent number of authors writing an article is 6, ranging from 1 to 20. Most frequently, 5–6 co-authors write an article (Figure 2.9). One third of the teams only have authors from institu-tions or other organizations in Denmark.
Number of journal articles by number of authors in a sample of Foundation-funded journal articles, 2015–2017
Figure 2.9
70
60
50
40
30
20
10
0
Number of journal articles
Sources: Novo Nordisk Foundation and DAMVAD Analytics.
1 7 123 9 155 11 172 8 144 10
Number of authors in a journal article
166 13 18 2019
Teams only with Danish co-authorsTeams not only with Danish co-authors

CHAPTER 258
The co-authors’ academic specializations and fields of scienceThe most common academic specializations among the co-authors are endocrinology, cardiology and epidemiology (Figure 2.10). Looking at the fields of sciences overall, 72% of the authors’ academic specializations are within the medical and health sciences and 23% within the natural sciences, engineering and technology, and social sciences and humanities comprise 5%.
Number of authors within the 20 most common academic specializationsFigure 2.10
Academic specialization
Sources: Novo Nordisk Foundation and DAMVAD Analytics.
Number of authors
Natural sciencesMedical and health sciences
Clinical nutritionMicrobiology
Human heneticsPublic health
ChemistryCell biology
Internal medicineHepatology
GeneticsNeurology
RheumatologyPhysiology
PharmacologyNeuroscience
OncologyMolecular biology
BiochemistryEpidemiology
CardiologyEndocrinology
81
95
97
99
115
142
148
199
238
523
83
96
98
115
124
142
165
211
291
768

DISSEMINATION AND USE OF KNOWLEDGE WITHIN THE PUBLIC SECTOR 59
Diversity of the co-authors’ academic specializations and fields of science for articlesFigure 2.11 shows the number of journal articles co-authored by the numbers of academic specializations among co-authors. For 7% of the journal articles published between 2015 and 2017, all authors have the same academic specialization. About 65% of journal articles involve authors with two to five academic specializations. The co-authors on journal articles are cat-egorized as teams with all co-authors from Denmark (“teams only with Danish co-authors”) and teams with at least one co-author from outside Denmark (“teams not only with Danish co-authors”). The greater the diversity in the academic specializations among the authors, the more often the teams only have co-authors from Denmark.
Journal articles by number of academic specializations among co-authors in a sample of Foundation-funded journal articles
Figure 2.11
120
100
80
60
40
20
0
Number of journal articles
Sources: Novo Nordisk Foundation and DAMVAD Analytics.
1 73 952 84 10+
Number of different academic specializations between co-authors
6
Teams only with Danish co-authorsTeams not only with Danish co-authors

CHAPTER 260
Journal articles by number of fields of science among co-authors in a sample of Foundation-funded journal articles
Figure 2.12
Figure 2.12 shows the number of journal articles by number of fields of science among the authors. In 55% of the journal articles the authors are from two to four fields of science. The greater the diversity among the co-authors, the more often the teams do not only have Danish authors. It is very rare to observe journal articles with authors from five or six fields of science.
350
300
250
200
150
100
50
0
Number of journal articles
Sources: Novo Nordisk Foundation and DAMVAD Analytics.
1 3 and 42
Number of fields of science among co-authors
Teams only with Danish co-authorsTeams not only with Danish co-authors
212 198
120
286
82
16
Citation analysisThe citation analysis of the 914 journal articles shows, that journal articles involving collabo-ration between co-authors from at least two fields of science have higher citation impact than journal articles published by co-authors from the same field of science (Figures 2.13 and 2.14).
The share of journal articles in the world’s 10% most frequently cited articles is 31.5% for journal articles published by authors from two or more fields of science and 25.1% for journal articles published by authors within the same field of science.

DISSEMINATION AND USE OF KNOWLEDGE WITHIN THE PUBLIC SECTOR 61
PP(top 10%) by number of fields of science among co-authors in a sample of Foundation-funded journal articles, 2015–2017
PP(top 1%) by number of fields of science among co-authors in a sample of Foundation-funded journal articles, 2015–2017
Figure 2.13
Figure 2.14
35%
30%
25%
20%
15%
10%
5%
0%
Share of journal articles
Sources: Novo Nordisk Foundation and Danish Centre for Studies in Research and Research Policy.
1 3 and 42
Different number of fields of science among co-authors
PP(top 10 %)World average
12%
10%
8%
6%
4%
2%
0%
Share of journal articles
Sources: Novo Nordisk Foundation and Danish Centre for Studies in Research and Research Policy.
1 3 and 42
Different number of fields of science among co-authors
PP(top 1 %)World average

CHAPTER 262
The citation impact changes with the number of academic specializations among the authors. PP(top 10%) is higher for journal articles published by co-authors with more than one aca-demic specialization (Figure 2.15). Figure 2.16 shows no clear correlation between the number of academic specializations among co-authors and the PP(top 1%) score.
PP(top 10%) by number of academic specializations among co-authors, 2015–2017Figure 2.15
50%
40%
30%
20%
10%
0%
Share of journal articles
Sources: Novo Nordisk Foundation and Danish Centre for Studies in Research and Research Policy.
1 73 52 8-144
Different number of fields of sciences among co-authors
6
PP(top 10 %)World average
23%
31%29%
25%
29%26% 27%
39%
PP(top 1%) by number of academic specializations among co-authors, 2015–2017Figure 2.16
Share of journal articles
Sources: Novo Nordisk Foundation and Danish Centre for Studies in Research and Research Policy.
1 73 52 8-144
Different number of fields of sciences among co-authors
6
PP(top 1 %)World average
12%
10%
8%
6%
4%
2%
0%
7.1%
4.8%5.2%
4.4% 4.3%3.4%
6.7%
10.0%

DISSEMINATION AND USE OF KNOWLEDGE WITHIN THE PUBLIC SECTOR 63
2.1.5 Peak year of annual citations and the three-year citation windowThis section analyses how long it takes articles to receive the peak number of citations within a year. This approach to citations compared with the standard citation analysis presented else-where in the report shows a different side of the absorption and recognition of knowledge since it considers the time perspective. The approach demonstrates that many journal articles take more than 3 years to reach peak annual citations. Because many journal articles take more than 3 years to reach peak annual citations, the validity of the 3-year citation window used in the citation analysis above is addressed. The analysis in this section uses all journal articles by grant recipients published in 2012 or earlier to observe delayed citation peaks.
Figure 2.17 shows the distribution of articles by the number of years between the publication year and the year a journal article receives its peak annual citations. 56% have a citation peak at most 3 years after the publication year. The share of articles peaking within 5 years is 79%. Two years is the most common period in which annual citations peak.
Number of years before a journal article by a grant recipient reaches its peak annual citation yearFigure 2.17
Share of journal articles
Note: The data include a sample of Foundation-funded journal articles published in 2012 and earlier.Sources: Novo Nordisk Foundation/researchfish® and Danish Centre for Studies in Research and Research Policy.
10 73 52 8 or more4
Time lag in years to peak in annual citations
6
25%
20%
15%
10%
5%
0%
16%
1%
22%
16%
13%
10%
7%
4%
9%

CHAPTER 264
Figure 2.18 shows the share of journal articles that are among the top 10% most frequently cited worldwide. The weighted average for all articles (published in 2012 or earlier), regardless of peak citation year, is 19% based on the standard 3-year citation window. This aggregated share is broken down into shares for articles according to their time lag to peak citation. The result shows that articles that peak after 2 years contribute positively to PP(top 10%), while articles peaking after 1 year or in 3 to 7 years are somewhat above or below the 19% average share.
Share of journal articles by grant recipients among the 10% most frequently cited worldwide, according to citation time lag peak
Figure 2.18
Share of journal articles
Note: The data include a sample of Foundation-funded journal articles published in 2012 and earlier.Sources: Novo Nordisk Foundation/researchfish® and Danish Centre for Studies in Research and Research Policy.
10 73 52 8 or more4
Time lag in years to peak in annual citations
6
30%
25%
20%
15%
10%
5%
0%
PP(top 10 %) average across time lags

DISSEMINATION AND USE OF KNOWLEDGE WITHIN THE PUBLIC SECTOR 65
This suggests that the 3-year citation-window somewhat also captures the performance of articles that have not peaked within the first 3 years of being published. By comparing the median values of the cumulative citations from publication to peak year with the total number of citations they receive, Figure 2.19 shows that:
• the total number of citations tends to be higher for articles that peak later rather than earlier; and
• looking across the years required to reach peak-level citations, the cumulative citation share of total citations grows steadily from 25% for articles peaking in year 1 after being published to +77% for articles peaking in year 8.
This suggests that the 3-year citation window picks up trends from articles that peak late, because the cumulative citation shares build up steadily (as they contribute considerably to the citation impact score), and the 3-year citation window also picks up articles that are rapidly cited or absorbed by the research community (since they increase the average citation score).
Median number of citations of journal articles by grant recipients in the peak year and median number of total citations
Figure 2.19
Number of citations
Note: The data include a sample of journal articles published in 2012 and earlier.Sources: Novo Nordisk Foundation/researchfish® and Danish Centre for Studies in Research and Research Policy.
10 73 52 8 or more4
Time lag in years to peak in annual citations
6
50
45
40
35
30
25
20
15
10
5
0
Cumumlated citations at peakTotal citations

CHAPTER 266
2.1.6 Developing or disruptive research: An application of a new theory for identifying the nature of research This section applies a new theory for the identification of the nature of research according to the developing or disruptive tendency in the content of journal articles.1 A so-called “disrup-tion score” is calculated for each journal article (call it the reference article). The score varies from -1 to +1, from developing to disruptive, and expresses the degree of overlap in citations made by the reference article and other articles that cite the reference article.
For example, if a reference article is cited by newer journal articles and the reference article and the journal article citing the reference article have no citations to previous literature in common, the article receives a score of 1. Wu et al. (2019) argue that such an article contains disruptive research which starts new strains of research. At the other end of the scale, a refer-ence article will receive a score of -1 if the journal articles citing that reference article also cite the previous literature that the reference article cites. Wu et al. (2019) argue that such an article contains research that further develops an existing strain of research. Therefore, the disruption score varies from complete overlap in the citations made by a reference article and articles citing that reference article (developing article) to reference articles with a 50% overlap of citations (neutral articles) to a reference article with no citations in common with articles citing that reference article (disruptive article).
1 Wu L, Wang D, Evans JA. Large teams develop and small teams disrupt science and technology. Nature 2019; 566:378–382 (https://www.nature.com/articles/s41586-019-0941-9).

DISSEMINATION AND USE OF KNOWLEDGE WITHIN THE PUBLIC SECTOR 67
Degree of overlap in citation pattern between a reference article and literature that cites the reference article determines its disruption score
Figure 2.20
Source: Wu L, Wang D, Evans JA. Large teams develop and small teams disrupt science and technology. Nature 2019;566:378–382 (https://www.nature.com/articles/s41586-019-0941-9).
Developing article Neutral article Disruptive article
Literature cited by the reference
article
Publication year
= Reference article
Developing < 0
Neutral
0-1 1Disruptive > 0
Top 1%Bottom 1%
Disruption score
Newer literature citing the
reference article
Newer literature citing the
reference article
Newer literature citing the
reference article
Literature cited by the reference
article
Literature cited by the reference
article
Figure 2.20 sums up the two extreme cases of no and complete citation overlap, respectively, and the case of a neutral article. The actual scores lie in between these three article examples. Most articles in the global sample from Wu et al (2019) are centred relatively far from -1 and +1 and thus close to zero. The cut-off score for the highest top 1% scores is +0.063, and the cut-off score for the world’s lowest 1% scores is -0.049.

CHAPTER 268
Wu et al (2019) address a recent discussion concerning novelty in research.2 The findings of Wu et al (2019) highlight a tendency of more disruptive articles coming from small research teams defined as the number of authors of an article, and more developing articles from large re-search teams. They further highlight a strong tendency for “Nobel Prize articles” to be disrup-tive (top 2%). However, the disruption score does not express research quality. As an example, the authors highlight an article by K. B. Davis et al (1995)3 on Bose-Einstein condensate with a disruption score of -0.58, a strong indication of developing content. This article represented a refined experimental study that further developed a well-established theory dating back to the 1920’s proving, that the Bose-Einstein condensate could be created. In 2001, Wolfgang Ketterle, last author on K. B. Davis et al (1995) and head of the lab of the discovery, received one-third of the Nobel Prize for this breakthrough in science “for the achievement of Bose-Ein-stein condensation in dilute gases of alkali atoms, and for early fundamental studies of the properties of the condensates” (Nobel Prize website).4
Table 2.1 shows the placement of journal articles by grant recipients relative to the worldwide distribution of disruption scores. The sample is limited to 2000–2014, when the disruption scores are available for funded journal articles by grant recipients. An estimated three journal articles by grant recipients are in the top 1% most disruptive worldwide, 0.04% of the funded journal articles by grant recipients. A total of 149 journal articles by grant recipients are among the top 10% worldwide (1.9%). Journal articles by grant recipients are therefore less frequent-ly represented among the 1% and the 10% most disruptive journal articles than the world average. An underlying and potentially important cause may be unknown details about the distribution by field of science in the Foundation sample compared with the full sample from Wu et al (2019) in the data for this analysis.
2 See also Stephan P, Veugelers R, Wang J. Reviewers are blinkered by bibliometrics. Nature 2019, 544, 411–4123 Davis K. B., Mewes M. -O., Andrews M. R., van Druten N. J., Durfee D. S., Kurn D. M., and Ketterle W. Bose-Einstein Condensation in a Gas of Sodium Atoms. Physical Review Letters 1995, 39694 https://www.nobelprize.org/prizes/physics/2001/ketterle/facts/

DISSEMINATION AND USE OF KNOWLEDGE WITHIN THE PUBLIC SECTOR 69
As mentioned, positive scores indicate that the research behind the journal article has more disruptive content than development content. Of the journal articles examined for recipients of Foundation grants, 739 (9.6%) published in 2000–2014 have positive disruption scores. The percentage for journal articles by grant recipients with positive disruption scores is about half the worldwide percentage (26.4%). The scores of articles by grant recipients are more com-pressed than the worldwide distribution of scores: ranging from –0.31 to +0.019, with a vari-ance one tenth of the worldwide distribution but with a similar mean and median. However, the tails of the distributions matter greatly for the estimated differences in variance.
Disruptive content of journal articles by recipients of Foundation grantsTable 2.1
0.04%
1.9%
9.6%
26.4%
3
149
739
Percentage of journal articles by grant recipientsJournal articles by grant recipients:
Among the top 1% disruption scores worldwide
Among the top 10% disruption scores worldwide
With positive disruption scores
Worldwide percentage of journal articles with positive disruption scores
Note: James Evans & Lingfei Wu generously provided the disruption scores from the original article. The Foundation is solely responsible for the further interpretation and calculations it performs. Data cover journal articles published in 2000–2014. Th global sample from Wu et al (2019) covers 7.33 million publications within the period, while the Foundation sample covers 7609 journal articles and 106 citable letters.Sources: Wu L, Wang D, Evans JA. Large teams develop and small teams disrupt science and technology. Nature 2019;566:378–382 (https://www.nature.com/articles/s41586-019-0941-9); Novo Nordisk Foundation/researchfish®; Danish Centre for Studies in Research and Research Policy and CWTS Leiden.
Number of journal articles

CHAPTER 270
The cap of DKK 11 million ensures the inclusion of the five-year Hallas-Møller Investigator grant. All other grants are at most DKK 10 million with 89% below DKK 5 million and 70% below DKK 1 million.
The grant recipients in this sample have reported 1992 journal articles, 96% of which were published in 2012–2016. The grants cover 963 researchers funded through the 316 grants of which 647 were team members and 316 were the reporting principal investigators.
2.1.7 Citation score dynamics from the grant team perspectiveCitation analysis in general shows that most journal articles are rarely cited, a few are relatively frequently cited and a few of the frequently cited articles are disproportionately highly cit-ed. The citation impact results in the previous sections do not reveal how the various articles linked to Foundation grants contribute to the overall distribution of all Foundation-funded ar-ticles. Does a subset of highly successful grants or a broad range of grants deliver high-impact articles? Answering this question requires data that link grant recipients to journal articles and team members of the grant recipient’s funded research team, their academic titles and how team members are represented in the articles reported for a specific grant.
The analysis uses a sample of 316 open-competition grants that have been concluded be-tween 2013–2017 with grant amounts between DKK 100,000 and DKK 11 million. Table 2.2 sums up the sample distribution of grants, articles and funding.
Distribution of grants and articles, and the funding size in the analysed sampleTable 2.2
Grant type
Project grants
Investigator grants
Innovation grants
Other
Note: The total number of grants in the analysed sample is 316. The total number of grants in the table, 386, reflects that 61 grants share 74 journal articles.Source: Novo Nordisk Foundation/researchfish®
274 (71.0%)
74 (19.2%)
17 (4.4%)
21 (5.4%)
1482 (66.4%)
606 (27.2%)
62 (2.8%)
82 (3.7%)
Min.
0.15
0.15
0.5
0.13
Median
0.8
2.5
2.5
2.5
Max.
10
11
3.0
3.9
Funding, MDKK Share of grants, # (%) Share of articles, # (%)

DISSEMINATION AND USE OF KNOWLEDGE WITHIN THE PUBLIC SECTOR 71
Distribution of journal articles by recipients of open-competition grants by normalized citation score, benchmarked against world distribution
Figure 2.21
Note: The figure shows the distribution of the journal articles according to normalized citation score. A score of 1 indicates the world average score. For 95% of the articles, the minimum score for being cited among the 10% most cited worldwide within a Web of Science subject category is 1.64. However, the cut-off varies across subject categories. The world distribution is based on 4914 journal articles sample based on a stratification that matches the distribution of Foundation-funded journal articles according to subject categories.Sources: Novo Nordisk Foundation/researchfish®, Web of Science, CWTS Leiden and Danish Centre for Studies in Research and Research Policy.
10 2 3 4 5
Normalized citation score
Density
World average score (1)
World distribution of journal articles within Foundation-funded field
PP(top10%) minimum score for 95% of Foundation-funded journal articles (1.64)
0.8
0.6
0.4
0.8
0.2
27% in PP(top10%)
49% below the world average of 1
Figure 2.21 shows the distribution for 93% of the sample journal articles that have a normal-ized citation score of less than 5 times the world average. The peak of the density curve (the mode) indicates the most common scores in the distribution. The journal articles to the left of the vertical line at 1 have a normalized citation score below the world average score (of 1). A to-tal of 49% of the journal articles have a citation score below 1 and are centred around 0.4 to 0.6.
Variation in citation scores of journal articles across and within grantsThe citation scores vary substantially both across and within grants. A small group of highly successful grant recipients produces most of the disproportionately highly cited journal arti-cles (normalized citation score above 5); however, more than half the grants deliver at least one article cited among the top 10% most frequently cited worldwide (most of which have normalized citation scores below. Further, not all grants result in frequently cited journal ar-ticles, and many of the grants deliver both frequently cited and infrequently cited or uncited journal articles.

CHAPTER 272
61% of the grant teams deliver at least one PP(top 10%) journal articleFigure 2.22
Note: These results are based on the analysed sample of 309 open-competition grants that led to 1957 journal articles.Sources: Novo Nordisk Foundation/researchfish®, Web of Science, CWTS Leiden and Danish Centre for Studies in Research and Research Policy.
The share of Foundation grants with at least one PP(top 10%)-articleOf all journal articles by recipients of open-competition Foundation grants, 27% are among the 10% most frequently cited worldwide(Figure 2.22) – a sign of research excellence. How-ever, these articles originate from 61% of the grants, demonstrating that Foundation-funded success is based on a broad range of grants and not only a small subset of especially successful grants.
27% of the articles in are PP(top 10%)

DISSEMINATION AND USE OF KNOWLEDGE WITHIN THE PUBLIC SECTOR 73
20% of the grant teams deliver at least one journal article in PP(top 10%) and at least one journal article with zero citations
Figure 2.23
Note: These results are based on the analysed sample of 309 open-competition grants that led to 1957 journal articles.Sources: Novo Nordisk Foundation/researchfish®, Web of Science, CWTS Leiden and Danish Centre for Studies in Research and Research Policy.
Zero-citation journal articles are also distributed on multiple grants. Of the 316 grants analysed, 86 grants (27%) produced at least one of the 143 of the 1992 (7%) journal articles in the sample with zero citations. Of the 86 grants that produced at least one zero-citation article, 63 or 20% also produced articles in the PP(top 10%) (Figure 2.32).
27% of the articles in are PP(top 10%)
7% of the articles have zero citations

CHAPTER 274
Listed first or last in author list Not listed first or last in author list
Team member 92%8%
Principal investigator
Sources: Novo Nordisk Foundation/researchfish®, Web of Science, CWTS Leiden and Danish Centre for Studies in Research and Research Policy.
32% 68%
Share of principal investigators and share of open-competition grants with team members listed as the first or last author of PP(top 10%) journal articles
Figure 2.24
First or last author of Foundation-funded journal articlesMany of the journal articles by grant recipients are in the biomedical and health sciences and the natural sciences. Here the sequence of authors matters somewhat, since the first author is usually the main author and the last author often heads the research activity. Figure 2.24 shows that 32% of the principal investigators (the grant recipients) are listed as the first or last author of journal articles that are among the 10% most frequently cited worldwide. Other team mem-bers from 8% of the grant teams are also listed as the first or last author of journal articles that are among the 10% most frequently cited worldwide. These other team members were either postdoctoral fellows or PhD students.
These results indicate that the principal investigator tends to have a more secondary role in the research behind frequently cited publications arising from two thirds of the grants. How-ever, because this type of analysis requires information on how and who is funded for the research conducted (grant recipient or team member), there is no well-defined benchmark for the results.

DISSEMINATION AND USE OF KNOWLEDGE WITHIN THE PUBLIC SECTOR 75
Within-group share of journal articles based on grants in open competition in PP (top 10%) categorised according to the principal investigator’s position in the sequence
Figure 2.25
Figure 2.25 compares the PP(top 10%) shares for journal articles in which the principal investi-gators are the first or last author with other reported journal articles in the PP(top 10%). A total of 25% of journal articles with the principal investigator as the first or last author are among the 10% most frequently cited worldwide, whereas the corresponding number for journal articles without the principal investigator as the first or last author is higher, at 29%.
35%
30%
25%
20%
15%
10%
5%
0%
Share of journal articles
Note: Based on 536 journal articles among the 1957 articles analysed in the open-competition sample of 309 grants.Sources: Novo Nordisk Foundation/researchfish® and Danish Centre for Studies in Research and Research Policy.
Principal investigator for first or last author
Principal investigator NOT first or last author
All
29%25%27%
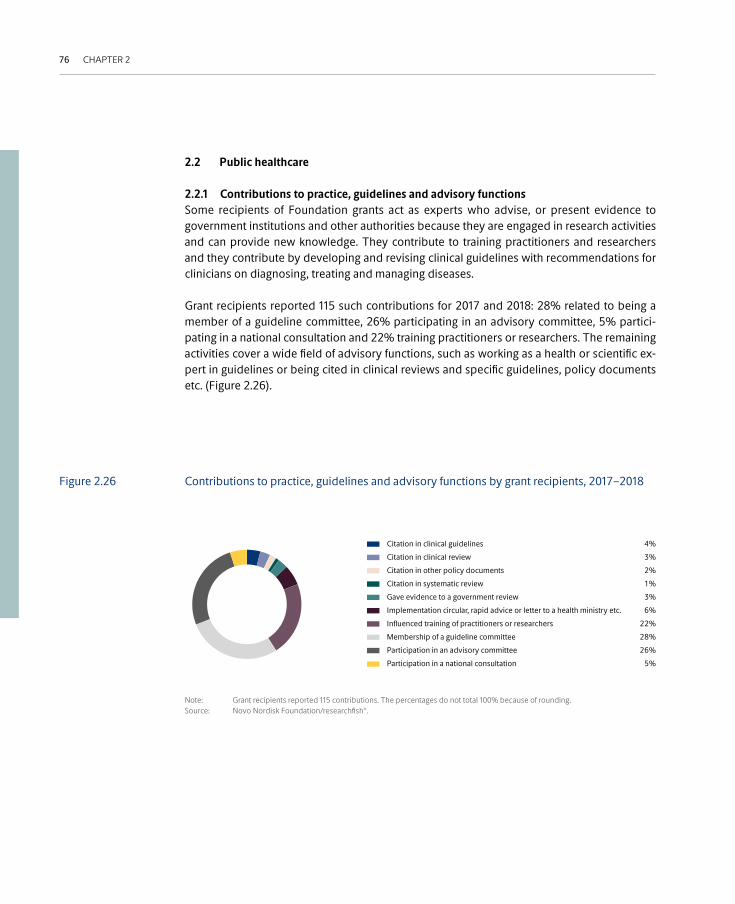
CHAPTER 276
2.2 Public healthcare
2.2.1 Contributions to practice, guidelines and advisory functions Some recipients of Foundation grants act as experts who advise, or present evidence to government institutions and other authorities because they are engaged in research activities and can provide new knowledge. They contribute to training practitioners and researchers and they contribute by developing and revising clinical guidelines with recommendations for clinicians on diagnosing, treating and managing diseases.
Grant recipients reported 115 such contributions for 2017 and 2018: 28% related to being a member of a guideline committee, 26% participating in an advisory committee, 5% partici-pating in a national consultation and 22% training practitioners or researchers. The remaining activities cover a wide field of advisory functions, such as working as a health or scientific ex-pert in guidelines or being cited in clinical reviews and specific guidelines, policy documents etc. (Figure 2.26).
Contributions to practice, guidelines and advisory functions by grant recipients, 2017–2018Figure 2.26
4%
3%
2%
1%
3%
6%
22%
28%
26%
5%
Citation in clinical guidelines
Citation in clinical review
Citation in other policy documents
Citation in systematic review
Gave evidence to a government review
Implementation circular, rapid advice or letter to a health ministry etc.
Influenced training of practitioners or researchers
Membership of a guideline committee
Participation in an advisory committee
Participation in a national consultation4+3+2+1+3+6+22+28+26+5LNote: Grant recipients reported 115 contributions. The percentages do not total 100% because of rounding.Source: Novo Nordisk Foundation/researchfish®.

DISSEMINATION AND USE OF KNOWLEDGE WITHIN THE PUBLIC SECTOR 77
2.2.2 Research-based teaching activity for healthcare professionals Research-based teaching activity for professionals is an important part of the impact of research in the public sector, both within and beyond academia.
The Foundation’s grant recipients disseminate their knowledge to professionals in the public sector through courses, conferences, speeches, reports and meetings. They also do this by contributing to training practitioners and researchers. For 2017–2018, the Foundation’s grant recipients reported 1422 dissemination activities targeting healthcare professionals. Most dis-semination activities stem from recipients of one-off project grants (strategic awards) and the four Foundation research centres (Figure 2.27).
Dissemination targeting health professionals, patients and caregivers, 2017–2018Figure 2.27
400
350
300
250
200
150
100
50
0
Number of dissemination activities
Project grants
Novo Nordisk Foundation
research centres
Programme grants
Innovation grants
PhD and Postdoctoral fellowships
Investigator grants
Education and outreach awards &
strategic awards
Note: The number of dissemination activities for this group for 2017–2018 was 1422.Source: Novo Nordisk Foundation/researchfish®.

CHAPTER 278
The recipients of Foundation grants had more than 1400 dissemination activities in 2017–2018 targeting health professionals, patients and caregivers. The dissemination activities reached a large audience. More than 50% of the activities reached an audience of more than 100 people for each activity (Figure 2.28).
Number of participants in dissemination activities targeting health professionals, patients and caregivers, 2017–2018
Figure 2.28
500
400
300
200
100
0
Number of dissemination activities
Audience size unknown
1–10 11–50 51–100 101–500 More than 500
Note: The number of dissemination activities in 2017–2018 was 1422.Source: Novo Nordisk Foundation/researchfish®.
Number of audience

DISSEMINATION AND USE OF KNOWLEDGE WITHIN THE PUBLIC SECTOR 79
2.2.3 Steno Diabetes Center activitiesThe Steno Diabetes Centers specialize in treating people with diabetes. The services provided at the Centers include a wide range of healthcare services related to diabetes, including endo-crinological examination and diagnosis, treatment of diabetes, eye scanning and examination, podiatry, dietary guidance and courses in a food laboratory.
A substantial part of the donation is allocated to supplementary treatment developing new, innovative treatment for diabetes and preventing the complications of diabetes. Centre activi-ties also include clinical research, health promotion and education, all interacting to ensure the vision of a longer life and better quality of life for people with diabetes.
Each Steno Diabetes Center has taken the lead in developing an important diabetes-related issue:
• Steno Diabetes Center Copenhagen: education and health promotion
• Steno Diabetes Center North Denmark: digital health
• Steno Diabetes Center Aarhus: integrated health care
• Steno Diabetes Center Odense: type 2-diabetes
• Steno Diabetes Center Zealand: inequality in health and comorbidities
Steno Diabetes Center Copenhagen was established in 2017. Steno Diabetes Center North Denmark, Steno Diabetes Center Aarhus and Steno Diabetes Center Odense were all estab-lished in 2018. Steno Diabetes Center Zealand was established in January 2019. The Founda-tion grants to the Steno Diabetes Centers total DKK 7.5 billion.
At the end of 2018, 514 people, corresponding to 462 full-time employees, were involved in research, clinical or other activities at one of the four active Steno Diabetes Centers. The numbers of personnel were: Steno Diabetes Center Copenhagen 356, Steno Diabetes Center Aarhus 63, Steno Diabetes Center Odense 72 and Steno Diabetes Center North Denmark 23.

CHAPTER 280
Only Steno Diabetes Center Copenhagen organized courses in 2018. The courses target various healthcare professionals, including dietitians, nurses, occupational therapists, physi-otherapists, podiatrists, professional practitioners, psychologists, social care and healthcare workers, and target caregivers and/or patients. The number of courses by geographical reach and primary audience are shown in Tables 2.3 and 2.4 and Figure 2.30.
Number of publications from the Steno Diabetes Centers by type, 2018Figure 2.29
Geographical reach of courses by Steno Diabetes Center Copenhagen, 2018Table 2.3
330
30
142
46
Research article
Review
Conference proceedings or abstract
Other61+5+26+8+LSource: Novo Nordisk Foundation/researchfish®.
Geographical reach
Local
Regional
National
International
Total
Source: Novo Nordisk Foundation/researchfish®.
1
11
11
1
24
4%
46%
46%
4%
100%
Number of courses Percentage
A total of 330 peer-reviewed journal articles, 142 conference proceedings or abstracts and 46 publications of other types were registered in 2018 for the Steno Diabetes Centers (Figure 2.29). Because the Centers were established relatively recently, the citation impact cannot be determined for the journal articles.
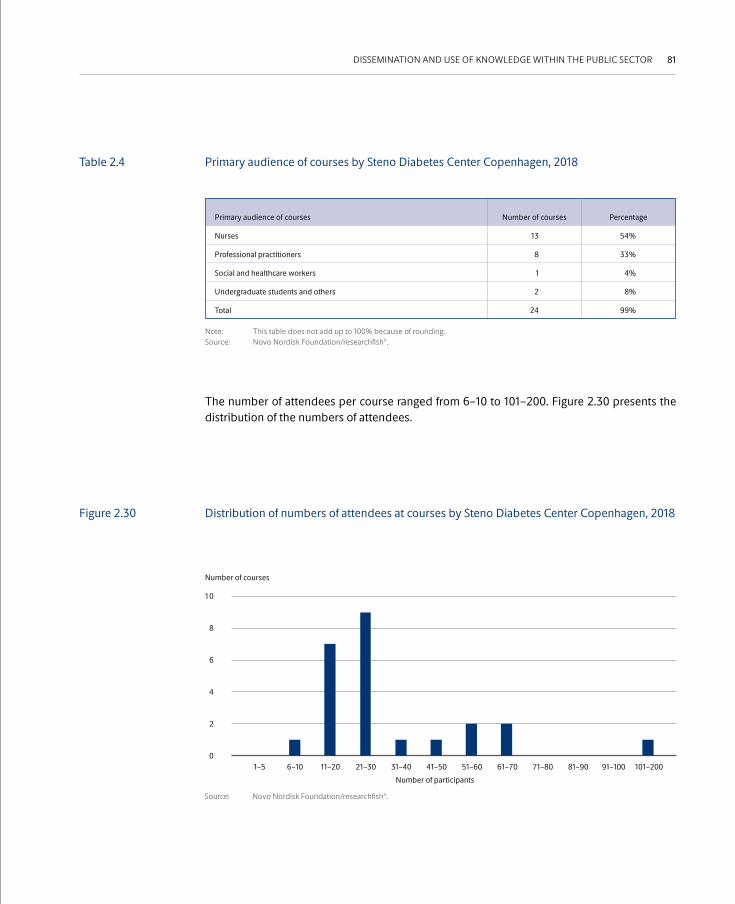
DISSEMINATION AND USE OF KNOWLEDGE WITHIN THE PUBLIC SECTOR 81
The number of attendees per course ranged from 6–10 to 101–200. Figure 2.30 presents the distribution of the numbers of attendees.
Primary audience of courses by Steno Diabetes Center Copenhagen, 2018Table 2.4
Distribution of numbers of attendees at courses by Steno Diabetes Center Copenhagen, 2018Figure 2.30
Primary audience of courses
Nurses
Professional practitioners
Social and healthcare workers
Undergraduate students and others
Total
Note: This table does not add up to 100% because of rounding.Source: Novo Nordisk Foundation/researchfish®.
13
8
1
2
24
54%
33%
4%
8%
99%
Number of courses Percentage
Number of courses
Source: Novo Nordisk Foundation/researchfish®.
Number of participants
10
8
6
4
2
01–5 6–10 11–20 21–30 31–40 41–50 51–60 61–70 71–80 81–90 91–100 101–200

CHAPTER 282
Steno Diabetes Center collaborationsCollaboration between researchers and other stakeholders can help increase the dissemination of knowledge, and collaboration can promote cross-disciplinary research and foster novel research results. Project collaboration can provide a variety of opportunities for research, in-novation and dissemination. The constellation of collaborations can be complex since a single collaboration may involve more collaboration partners. These partners may vary as the collab-orative activity develops over time. The Steno Diabetes Centers reported 274 collaborations (Table 2.5 and Figure 2.31) in 2017–2018.
The Steno Diabetes Centers had collaboration partners from 22 countries. Most of the collab-oration partners were in Denmark; 35% of the collaborators were located in countries outside Denmark such as the United Kingdom (8%) and the United States (5%).
Shares of collaboration partners in countries with the most partners, 2017–2018 Table 2.5
Country
Denmark
United Kingdom
United States
Australia
Germany
Ireland
Kenya
Sweden
Total
Source: Novo Nordisk Foundation/ researchfish®.
65%
8%
5%
2%
1%
1%
1%
1%
84%
Share of total
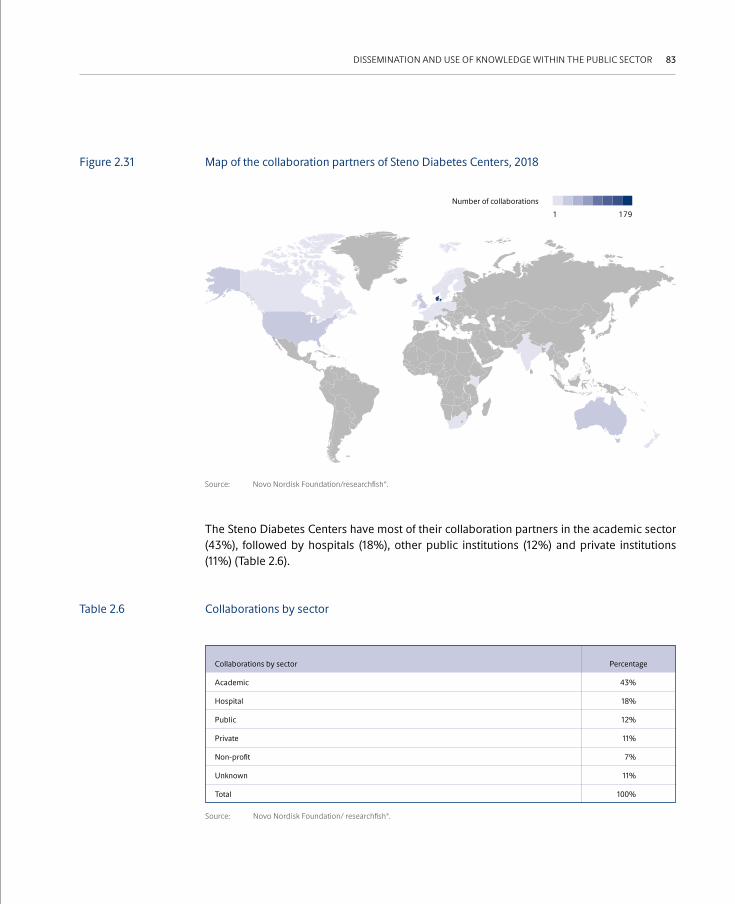
DISSEMINATION AND USE OF KNOWLEDGE WITHIN THE PUBLIC SECTOR 83
Map of the collaboration partners of Steno Diabetes Centers, 2018Figure 2.31
The Steno Diabetes Centers have most of their collaboration partners in the academic sector (43%), followed by hospitals (18%), other public institutions (12%) and private institutions (11%) (Table 2.6).
Collaborations by sectorTable 2.6
Collaborations by sector
Academic
Hospital
Public
Private
Non-profit
Unknown
Total
Source: Novo Nordisk Foundation/ researchfish®.
43%
18%
12%
11%
7%
11%
100%
Percentage
Source: Novo Nordisk Foundation/researchfish®.
Number of collaborations
1 179

CHAPTER 284
Number of people with diabetes treated at the Steno Diabetes Centers by type of diabetes and age
Figure 2.32
The additional treatment initiatives are a key part of the Foundation’s grants to the Steno Diabetes Centers and are designed to develop and document new and improved therapies. The Steno Diabetes Centers launched almost 50 treatment initiatives in 2018.
2.2.4 Treatment at the Steno Diabetes CentersThe Steno Diabetes Centers specialize in treating people with diabetes. Until 2016, the Foundation supported the Steno Diabetes Center, the predecessor to Steno Diabetes Center Copenhagen, which treated 5500 people in 2016. In 2018, the four Centers treated a total of 20,480 people with diabetes, which is far more than in 2017, when Steno Diabetes Center Copenhagen, as the only Steno Diabetes Center, treated 6503 people. The Steno Diabetes Centers aim to treat 44,000 people with diabetes annually by 2023. The distribution of people treated at the Steno Diabetes Centers is 45% type 1–diabetes, 44% type 2–diabetes and 4% children and young people (Figure 2.32).
10000
8000
6000
4000
2000
0
Number of people
Note: Steno Diabetes Center Copenhagen (SDCC), Steno Diabetes Center Odense (SDCO) and Steno Diabetes Center Northern Denmark(SDCN) and Steno Diabetes Center Aarhus (SDCA).Source: Novo Nordisk Foundation.
Type-1 diabetesType-2 diabetesChildren and young people Other
SDCC SDCN SDCA SDCO

DISSEMINATION AND USE OF KNOWLEDGE WITHIN THE PUBLIC SECTOR 85
Three examples of treatment initiatives:
1. Steno Diabetes Center Copenhagen has launched an intersectoral initiative. The purpose of this is to target and strengthen the intersec-toral collaboration that already exists between the Capital Region of Denmark, the City of Copenhagen and the practice sector. The collab-oration focuses on people with diabetes or those who are at risk of developing diabetes through tracking, prevention and targeted initia-tives for vulnerable groups. There are also collaborations on optimiz-ing seamless treatment for people with diabetes, patient education, quality development, tools, knowledge, skills and competencies.
2. Steno Diabetes Center Aarhus has initiated a shared patient clinic together with the Department of Renal Medicine of Aarhus University Hospital. The purpose is to strengthen the collaboration between clin-ical efforts in diabetes and renal medicine by increasing coordination, organizing multidisciplinary conferences and establishing a shared pa-tient clinic.
3. Steno Diabetes Center North Denmark has an initiative targeting pregnant women with pregestational and gestational diabetes. They are offered optimized control and treatment during their pregnancy. This includes extra consultations with endocrinologists and dietitians stage of their pregnancy for women who live remotely from the hospital.
Steno Collaborative GrantsThe Foundation attempts to ensure collaboration between research groups from the established Steno Diabetes Centers and research communities outside the Centers in Denmark. The Foundation launched this new pro-gramme in 2018 and awarded nine grants totalling DKK 50 million within the following fields: clinical research in the broadest sense, including trans-lational research, epidemiology and big data; research on the characteris-tics of the Steno Diabetes Centers, including digital health and diabetes; continuity in patient care; type 2 diabetes; and health promotion research and education.

CHAPTER 286
2.2.5 Nursing programmeThe Foundation awards grants for research-based nursing in Denmark focusing on research on disease prevention and health promotion, rehabilitation and palliative care and manage-ment and organization with the aim of improving treatment for patients. In 2018, the Foun-dation awarded 15 grants: one programme grant of DKK 7.5 million, three PhD scholarships totalling DKK 5.4 million, three postdoctoral fellowships totalling DKK 5.4 million and eight projects totalling DKK 3 million. The goals are to strengthen nursing research through long-term research funding, to attract and develop talented researchers, to base nursing research on current problem-solving by health professionals, to accelerate the development of new treatment methods within nursing and/or to create project constellations in which nursing re-searchers may obtain research experience at the highest level.
The Foundation has awarded grants for nursing research since 2013. Tables 2.7 and 2.8 show some of the outcomes and outputs. It is still too early to measure the results of the programme, but several outputs have already been reported.
Dissemination activities related to the Foundation’s nursing programme, 2013–2018Table 2.7
Dissemination
A formal working group, expert panel or dialogue
A press release, press conference or response to a media enquiry/interview
A talk or presentation
Participation in an activity, workshop or similar
Scientific meeting: conference or symposium etc.
Total
Source: Novo Nordisk Foundation/researchfish®.
7
29
61
4
2
103
Dissemination activities

DISSEMINATION AND USE OF KNOWLEDGE WITHIN THE PUBLIC SECTOR 87
Publication activities related to the Foundation’s nursing programme, 2013–2018Table 2.8
Publications
Conference proceedings or abstracts
Journal articles
Other, including book chapters, theses, guides and monographs
Total
Source: Novo Nordisk Foundation/researchfish®.
11
71
8
90
Number of publications
2.3 Three cancer projects This section demonstrates how grant recipients from the Foundation’s three cancer projects (Cancer 1, Cancer 2, and Cancer 3 from 2006 to 2018) contributed outputs and how they com-plemented and inspired Denmark’s and international cancer plans and guidelines.
In the early 2000s, the waiting time for cancer treatment in Denmark was long and the regional differences were excessive. Waiting for cancer to be diagnosed and treated may cause great mental health stress. This called for more systematic measuring and monitoring of cancer-re-lated healthcare processes. Lack of capacity and long waiting times were identified as impor-tant obstacles for implementing national cancer plans in Denmark. In 2005, the Foundation initiated research projects with the aim of obtaining well-documented evidence on ways of reducing delays in cancer treatment, improving healthcare pathways and communication in Denmark’s healthcare system on cancer treatment. The following box describes the specific purposes of each project.

CHAPTER 288
Cancer 1 – Coherence Treatment for Cancer Patients (2006–2009). This aimed to enhance coherence for cancer patients without delay in the many treatment processes for the individual patient, especially when sev-eral areas of the health sector are involved. The focus was on continuity, coordination and logistics for cancer treatment. In addition, the project aimed to identify the best solutions in terms of enhancing communication, organization and economic and cultural conditions for cancer treatment plans. This project also included an education component in terms of cre-ating PhD projects.
Cancer 2 – From Symptom to Treatment (2009–2013).This aimed to identify the reasons for the extended time between people experiencing the first symptoms and treatment being initiated. Some of the objectives for this project relate to the following questions. What influences people’s behaviour in reporting their symptoms late? How can family phy-sicians and general practitioners be trained to identify people with cancer symptoms more quickly? How can the collaboration in the health sector related to people with cancer be optimized?
Cancer 3 – Returning to Daily Life (2010–2018).This focused on the optimal way of helping people who have completed treatment back to a normal life after cancer. In 2009, more than 30,000 people in Denmark completed cancer treatment, and although some re-lapsed, more than half the people who survive cancer are expected to die from other causes. They continue to live, although many people have after effects of surgery, chemotherapy and radiation therapy and worries about their future.

DISSEMINATION AND USE OF KNOWLEDGE WITHIN THE PUBLIC SECTOR 89
The Foundation awarded grants totalling DKK 45 million, and additional funding from the Danish Cancer Society and other funders made the total grants for the three projects DKK 116 million from 2006 until 2018. Table 2.9 shows the distribution of grants over the years.
Grants for the Cancer 1–3 projects (DKK millions)Table 2.9
Novo Nordisk Foundation
Danish Cancer Society
Other external funders
Total
Sources: Novo Nordisk Foundation and Copenhagen Economics.
15
-
-
≥15
15
15
8-10
38-40
15
15
33
63
45
30
41-43
�118
Cancer 1 (2006–2009) Cancer 2 (2009–2013) Cancer 3 (2010–2018) Total (2006–2018)
The Foundation and the Danish Cancer Society collaborated on Cancer 2 and Cancer 3. In total, the three projects received DKK 75 million from the two organizations. The projects suc-ceeded in attracting additional external funding. In Cancer 1, additional funding for an unspec-ified amount was also attracted to supplement the grant. Cancer 2 received DKK 8–10 million in additional funding and Cancer 3 obtained additional external funds for DKK 33 million. The additional funding was used to cover PhD students’ salaries, additional studies and other ex-penses.
In addition to the Foundation’s cancer projects (Cancer 1, Cancer 2 and Cancer 3), the Founda-tion has funded many cancer research projects. This can be identified in various outputs that are not presented here.

CHAPTER 290
Figure 2.33
2000 2005
Cancer plan I, 2000Focused on the epidemiology of cancer in Den-mark compared with the other Nordic countries and on increasing capacity in relation to radiation therapy and pharmaceutical and surgical treatment.
Cancer plan II, 2005Focused on improving the coherence and organi-zation of the patient course, which resulted in the subsequent preparation of the package courses. In addition, there was a focus on preventing smoking and strengthening cancer surgery. In 2007, the Danish Health Authority followed with a professional review, which indicated a need for increased efforts to develop cancer packages, can-cer surgery, clinical guidelines, monitoring, coher-ence in patient care and prevention of smoking.
Cancer 1
Coherence for Cancer Patients 2006–2009
The faster the course, the higher the survival rate.
The Foundation's three cancer projects (Cancer 1–3 from 2006–2018)
Problem
→
→
Cancer 1 – 2006–2009
Denmark’s national cancer plans
"In 1999, an 18-year-old cancer patient asked fora fitness bicycle."
Lis AdamsenProfessor
The Foundation’s cancer projects interacted with Denmark’s national cancer plans (Cancer plan I, Cancer plan II, Cancer plan III and Cancer plan IV). Figure 2.33 shows the timeline for the cancer projects and Denmark’s national cancer plans.

DISSEMINATION AND USE OF KNOWLEDGE WITHIN THE PUBLIC SECTOR 91
Impact of cancer projects in Sweden and Norway
2010 2016
Cancer plan III, 2010Focused on improving and expanding the parts of the patient care before and after treatment in the hospital, including early detection, rehabilitation and palliative care. In addition, the cancer packages were revised.
Cancer plan IV, 2016 Focuses on the previous cancer plans, and the ambition behind cancer plan IV is to strengthen prevention so that fewer people develop cancer and to improve diagnosis and treatment, so that more people survive cancer. Everyone must find that their course of treatment was well designed and that they were involved along the way.
Cancer 3
Returning to Daily Life 2010–2018
The purpose of the project was to optimize the rehabilitation of cancer patients after treatment has been completed. The project focused on how to give patients the best possible support in their life after cancer.
Cancer 2
From Symptom to Treatment 2009–2013
Optimizing the diagnosis of cancer, focusing on rapid and efficient assessment and referral of the cancer patient. Research therefore focused on cancer symptoms, new technol-ogies and how to organize progress for patients.
Cancer 3 – 2010–2018
Cancer 2 – 2009–2013
Sources: Novo Nordisk Foundation/researchfish® and Copenhagen Economics A/S.

CHAPTER 292
2.3.1 Output and outcomes of the cancer projects Cancer 2 and Cancer 3 each created a centre, and both were integrated with a university or research hospital. After the grants were awarded for Cancer 2, the Research Centre for Cancer Diagnosis in Primary Care at Aarhus University was established in 2010. Cancer 3 established the Centre for Integrated Rehabilitation of Cancer Patients at the University of Copenhagen and Rigshospitalet the year after receiving the grants.
Table 2.11 shows a low share of journal articles among the 10% most frequently cited articles worldwide. The reason is that the cancer projects were applied research and instead cited in policy papers and official documents leading to Denmark’s official national cancer plans.
Numbers of publications and authors for Cancer 1–3 projects Table 2.10
Cancer 1 (2006–2009)
Cancer 2 (2009–2013)
Cancer 3 (2010–2018)
Total
Source: Cancer project publication overview, Copenhagen Economics A/S.
45
93
68
206
65
144
174
356
Number of publications Total number of authors
Citation impact of journal articles produced by Cancer 1–3 projectsTable 2.11
Cancer 1 (2006–2009)
Cancer 2 (2009–2013)
Cancer 3 (2010–2018)
Sources: Danish Centre for Studies of Research and Research Policy.
41
82
34
12%
9%
1%
Journal articles PP(top 10%)
The number of references in public policy documents, such as the scientific decisions and documents for the national cancer plans and clinical guideline service, indicate an effect of the cancer projects. Tracking the references from the cancer project publications cited in the public policy documents identified such publications, especially in Denmark’s third national cancer plan. In the documents leading to Denmark’s second national cancer plan, 2 of 12 doc-uments contain a reference from the cancer project’s grant recipients.
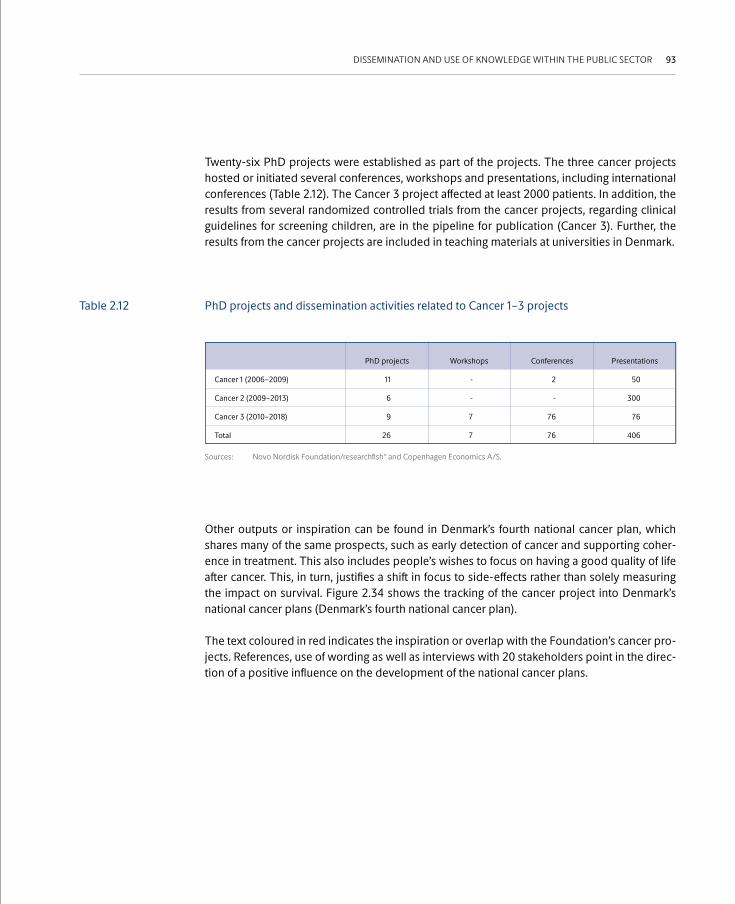
DISSEMINATION AND USE OF KNOWLEDGE WITHIN THE PUBLIC SECTOR 93
Twenty-six PhD projects were established as part of the projects. The three cancer projects hosted or initiated several conferences, workshops and presentations, including international conferences (Table 2.12). The Cancer 3 project affected at least 2000 patients. In addition, the results from several randomized controlled trials from the cancer projects, regarding clinical guidelines for screening children, are in the pipeline for publication (Cancer 3). Further, the results from the cancer projects are included in teaching materials at universities in Denmark.
PhD projects and dissemination activities related to Cancer 1–3 projectsTable 2.12
Cancer 1 (2006–2009)
Cancer 2 (2009–2013)
Cancer 3 (2010–2018)
Total
Sources: Novo Nordisk Foundation/researchfish® and Copenhagen Economics A/S.
2
-
76
76
50
300
76
406
-
-
7
7
11
6
9
26
Conferences PresentationsWorkshopsPhD projects
Other outputs or inspiration can be found in Denmark’s fourth national cancer plan, which shares many of the same prospects, such as early detection of cancer and supporting coher-ence in treatment. This also includes people’s wishes to focus on having a good quality of life after cancer. This, in turn, justifies a shift in focus to side-effects rather than solely measuring the impact on survival. Figure 2.34 shows the tracking of the cancer project into Denmark’s national cancer plans (Denmark’s fourth national cancer plan).
The text coloured in red indicates the inspiration or overlap with the Foundation’s cancer pro-jects. References, use of wording as well as interviews with 20 stakeholders point in the direc-tion of a positive influence on the development of the national cancer plans.

CHAPTER 294
Relations between Denmark’s fourth national cancer plan and the Cancer 1–3 projectsFigure 2.34
Note: At least 2000 patients were affected by the cancer 3 project.Sources: Novo Nordisk Foundation/researchfish® and Copenhagen Economics A/S.
August 2016
PATIENTERNES KRÆFTPLAN KRÆFTPLAN IV
• Smoke-free generation – no children or young people who smoke in 2030
• Help for special groups and cancer patients who smoke• HPV-vaccination for young people
The Patient first and foremost
Patients’ cancer plan
Prevention targeted children, youth and special groups
Timely diligence by ambitiously improving the capacity of hospitals, using resources efficiently, developing new and targeted treatment and improving the use of data for research and developing quality
Increased quality and improved survival
• The patient’s doctor must support coherence in treatment• The patient’s opinions must be considered• Treatment in or closer to the home• Targeted treatment plans at hospitals for young people with cancer• Overview of the treatment plan – in accordance with the patient’s
personal plan• Standard treatment plan with flexibility to consider the patient’s
wishes
• Cancer must be detected earlier• High and uniform quality treatment for cancer patients throughout
the country• A good life after cancer• A worthy and good palliative effort

DISSEMINATION AND USE OF KNOWLEDGE WITHIN THE PUBLIC SECTOR 95
2.3.2 International outcome of the cancer projects Denmark’s national cancer plans have been disseminated, especially in Scandinavia, in developing other national cancer treatment plans. In Sweden, this is called the Danish model; in Norway, where Denmark’s principles were adopted, the programme is called “within 48 hours”. Several of the grant recipients from the cancer projects established and influenced international network activities. Several of the principal investigators from the cancer projects were deeply involved in developing the national cancer plans for Sweden and Norway by pro-viding knowledge from Denmark’s national cancer plans and Cancer 1–3 projects. Several of the principal investigators and key stakeholders were invited to facilitate workshops, and one received a cancer prize in Norway. As an example, Figure 2.35 shows how Sweden’s national cancer plans (Figure 2.35) were influenced by publications by grant recipients in the cancer projects.
2.3.3 Key drivers for the success of the projectsTo analyse the importance of contributions to Denmark’s national cancer plans and guidelines, several key stakeholders of the three projects were interviewed. The interviews indicate that Cancer 1 acted as a filter for promising research. One subproject from Cancer 1 on diagnosis became the focus in Cancer 2, which created the Research Centre for Cancer Diagnosis in Primary Care at Aarhus University.
The key stakeholders of the projects greatly emphasized direct face-to-face communication and disseminating results to relevant recipients, which also inspired Denmark’s national can-cer plans and the multidisciplinary Cancer Group clinical guidelines. The interviews indicated that the results from especially Cancer 2 and Cancer 3 were disseminated in a process beyond the ordinary. The research results were communicated at different levels. Policy-makers and decision-makers were addressed at conferences and by the Danish Cancer Society and the Danish Health Authority’s Committee on Cancer. The direct dissemination of the research re-sults has also been decisive for the projects’ subsequent impact. The key stakeholders were both high-level decision-makers who directly and indirectly influenced Denmark’s national cancer plans and physicians who implemented the results in their daily routines.

CHAPTER 296
References to journal articles produced by Foundation grant recipients in Sweden’s national cancer plans
Figure 2.35
Prioriterade insatser i patientprocessarbetet
Evidence of increasing mortality with longer diagnostic intervals for five com-mon cancers: a cohort study in primary care, Törring ML et al. Eur J Cancer 2013;49:2187-98.
TumÖrer i hjärna och ryggmärg
Piil K, Juhler M, Jakobsen J, Jarden M. Controlled rehabilitative and supportive care intervention trials in patients with highgrade gliomas and their caregivers: a systematic review. BMJ Support Palliat
Cancer i urinbläsa, njurbacken, urinledare och urinrÖr
Hansen RP, Vedsted P, Sokolowski I et al. Time intervals from first symptom to treat-ment of cancer: a cohort study of 2,212 newly diagnosed cancer patients. BMC Health Serv Res. 2011;11: 284
Tjock- och ändtarmscancer
Törring ML, Frydenberg M, Hamilton W, Hansen RP, Lautrup MD, Vedsted P. Diagnos-tic interval and mortality in colorectal cancer: U-shaped association demonstrated for three different datasets. J Clin Epidemiol 2012 Jun;65(6):669-78
Torring ML, Frydenberg M, Hansen RP, Olesen F, Vedsted P. Evidence of increasing mortality with longer diagnostic intervals for five common cancers: A cohort study in primary care. Eur J Cancer.
Standardiserade vardfÖrlopp i cancervården
Larsen, MB, Hansen, RP, Hansen, DG, Olesen, F, Vedsted, P. Secondary care intervals before and after the introduction of urgent referral guidelines for suspected cancer in Denmark: a comparative before-after study. BMC Health Serv Res. 2013; 13:348.
Svendsen, RP, Stovring, H, Hansen, BL, Kragstrup, J, Sondergaard, J, Jarbol, DE. Prevalence of cancer alarm symptoms: a populationbased cross-sectional study. Scand J Prim Health Care. 2010; 28(3):132-7.
Hansen, RP, Vedsted, P, Sokolowski, I, Sondergaard, J, Olesen, F. Time intervals from first symptom to treatment of cancer: a cohort study of 2,212 newly diagnosed cancer patients. BMC Health Serv Res. 2011; 11:284.
Weller, D, Vedsted, P, Rubin, G, Walter, FM, Emery, J, Scott, S, et al. The Aarhus statement: improving design and reporting of studies on early cancer diagnosis. Br J Cancer. 2012; 106(7):1262-7.
Ingeman, ML, Christensen, MB, Bro, F, Knudsen, ST, Vedsted, P. The Danish cancer pathway for patients with serious non-specific symptoms and signs of cancer-a cross- sectional study of patient characteristics and cancer probability.
Sources: Novo Nordisk Foundation/researchfish® and Copenhagen Economics A/S.


CHAPTER 398
Dissemination and use of knowledge within the private sector
Chapter 3Chapter 3

DISSEMINATION AND USE OF KNOWLEDGE WITHIN THE PRIVATE SECTOR 99
3. DISSEMINATION AND USE OF KNOWLEDGE IN THE PRIVATE SECTOR
This chapter focuses on three types of private sector uptake of research-based knowledge generated from Foundation-funded public research activities: collaboration with companies, use of research in patents and the Foundation’s innovation grants for start-up companies ex-ploring the commercial potential of public research.
3.1 Grant recipient collaboration with companiesThis section presents evidence on the transmission channel from public research to the private sector through research collaboration. Figure 3.1 presents the number of distinct companies collaborating or co-publishing with recipients of Foundation grants per year. Figure 3.2 shows the number of Foundation-funded journal articles co-authored with industrial researchers, and the number of active project collaborations.
The number of journal articles co-published with industrial researchers and active project col-laborations with private companies increased rapidly from 2008 to 2018. A total of 196 distinct companies collaborated with grant recipients in 2018 versus 165 distinct companies in 2017 (see Figure 3.1).
Number of distinct companies, by location, co-publishing with grant recipients and number of distinct collaborations between companies and grant recipients, 2008–2018
Figure 3.1
250
200
150
100
50
0
Number of companies
Note: The nationality of companies refers to the country in which a legal entity is registered and located regardless of the nationality of ownership. For example, Novo Nordisk A/S is a Danish company, but Novo Nordisk Inc. is a United States company.Sources: Novo Nordisk Foundation/researchfish® and DAMVAD Analytics based on Scopus data.
DenmarkOther Nordic CountriesRest of the World
2014 2015 2016 2017 20182008 2009 2010 2011 2012 2013

CHAPTER 3100
In 2018, the companies jointly collaborated on 234 journal articles and 34 projects (Figure 3.2). In 2017 the numbers were 199 journal articles and 51 projects.
The collaboration with companies outside Denmark has grown the most in recent years. Grant recipients primarily collaborate with small companies, measured by the number of employ-ees, at all three geographical levels (Denmark, the other Nordic countries and the rest of the world). Medium and large collaborating companies are mainly located outside the Nordic countries (Figure 3.3).
Grant recipients collaborated with 339 biotechnology companies and 99 pharmaceutical companies during the past decade. The companies in Denmark are primarily within biotech-nology and hospital and healthcare. The companies outside Denmark are primarily within bio-technology and pharmaceuticals, and some are within software and hospitals and healthcare.
Number of distinct collaborations such as co-publications and project collaborations between companies and grant recipients, 2008–2018
Figure 3.2
Number of co-publications and projects
Sources: Novo Nordisk Foundation/researchfish® and DAMVAD Analytics based on Scopus data.
Distinct co-publications with companiesProject collaboration with companies
2018
2017
2016
2015
2014
2013
2012
2011
2010
2009
2008
0 30025020015010050

DISSEMINATION AND USE OF KNOWLEDGE WITHIN THE PRIVATE SECTOR 101
Companies collaborating with the recipients of Foundation grants by number of employees and location
Companies collaborating with the recipients of Foundation grants by industry
Figure 3.3
Figure 3.4
200
150
100
50
0
Number of companies
Small (1-49)Medium (50-249)Large (≥250)
Denmark Nordic countries Rest of the world
Note: Time period: 2014–2018. The number of companies are distinct for each type of grant. Sources: Novo Nordisk Foundation/researchfish® and DAMVAD Analytics based on Scopus data.
200
150
100
50
0
Number of companies
DenmarkNordic countriesRest of the world
Biotechnology Pharmaceutical Hospital & Health Care
Note: Time period: 2014–2018. The categories of industries follow the international standard classification codes. The number of companies are distinct for each type of grant, but companies may collaborate with more then one grant recipient and therefore be counted more than once across types of grants.Sources: Novo Nordisk Foundation/researchfish® and DAMVAD Analytics based on Scopus data.
Software Chemicals Medical Devices

CHAPTER 3102
Companies collaborating with the recipients of Foundation grants by typesFigure 3.5
300
250
200
150
100
50
0
Number of companiesNon-Danish companies Danish companies
Education and
Stand alone
Innovation Investigator Novo Nordisk Foundation
Research Centres
Other Postdoctoral fellowships and
PhD scholarships
Program Project grants
Steno Diabetes Centres
Note: Time period: 2014–2018. Sources: Novo Nordisk Foundation/researchfish® and DAMVAD Analytics based on Scopus data.

DISSEMINATION AND USE OF KNOWLEDGE WITHIN THE PRIVATE SECTOR 103
3.1.1 Co-authored journal articles with researchers from industryThe data used in this section cover Foundation-funded journal articles between 2008 and 2018. Table 3.1 shows that 11.1% of the journal articles in 2008–2018 were co-authored with companies. About half of these were co-authored by industrial researchers working for com-panies in Denmark. A somewhat comparable share for all journal articles co-authored by re-searchers located in Denmark for 2013–2017 is 7% (Forskningsbarometer 2018, the Denmark’s Ministry of Higher Education and Science).
Foundation-funded journal articles according to the type of collaboration, 2008–2018Table 3.1
Total articles based on the Foundation’s grants
Articles only co-published with academia
Articles in collaboration with one or more companies
- Articles in collaboration with Danish companies only
- Articles in collaboration with non-Danish companies only
- Articles in collaboration with both Danish and non-Danish companies
Note: Time period: 2008–2018. Sources: Novo Nordisk Foundation/researchfish® and DAMVAD Analytics based on Scopus data.
100
88.9
11.1
4.9
6.2
0.04
14,990
13,323
1667
731
936
64
%Number

CHAPTER 3104
International benchmark of academia–industry co-publicationsResearchers in Denmark publish more public-private (academia–industry) co-authored journal articles per million population than researchers do in most other European countries (Figure 3.6). In 2017, Danish researchers published 163 academia–industry co-authored arti-cles per million population in; researchers in Switzerland had the highest production at 260 per million population. The recipients of Foundation grants published the equivalent of 26 academia–industry co-authored journal articles per million population based on Foundation grants.
Academia-industry co-publications per million population, 2017Figure 3.6
300
250
200
150
100
50
0
Number of journal articles Foundation-funded publications
Sources: Novo Nordisk Foundation/researchfish® and European Commission, (European Innovation Scoreboard 2018).
Switzerland Denmark NorwaySweden FinlandNetherlands United Kingdom
IsraelGermany

DISSEMINATION AND USE OF KNOWLEDGE WITHIN THE PRIVATE SECTOR 105
Subject categories for public–private co-publicationsFigure 3.7 shows the numbers of journal articles by the recipients of Foundation grants co-authored with industrial researchers in companies in Denmark and the rest of the world across journal subject categories according to the location of the industrial co-authors.
The numbers for Denmark reflect journal articles with industrial co-authors located only in Denmark. The numbers for the rest of the world always includes industrial co-authors located outside Denmark but may also include industrial co-authors located in Denmark.
Journal articles by recipients of Foundation grants co-authored with industrial researchers according to location and top 10 journal subject categories, 2014–2018
Figure 3.7
100
90
80
70
60
50
40
30
20
10
0
Number of journal articles
Note: Time period: 2014–2018. Subject categories from Web of Science.Sources: Novo Nordisk Foundation/researchfish®; DAMVAD Analytics based on Scopus data; and Danish Centre for Studies in Research and Research Policy and Web of Science.
Endo
crin
olog
y, D
iabe
tes
and
Met
abol
ism
nter
nal M
edic
ine
Gen
etic
s (cl
inic
al)
Card
iolo
gy a
nd
Card
iova
scul
ar M
edic
ine
Gen
eral
Med
icin
e
Onc
olog
y
Med
icin
e (m
iscel
lane
ous)
Obs
tetri
cs a
nd G
ynae
colo
gy
Imm
unol
ogy
and
Alle
rgy
Nep
hrol
ogy
DenmarkRest of the world

CHAPTER 3106
Journal articles co-authored with industrial researchers both in and outside Denmark have high citation impact. Co-authored collaborations with industrial researchers outside Denmark have the highest impact (Figure 3.8).
Citation impact of publications by recipients of Foundation grants co-authored with Danish and non-Danish companies, 2016–2017
Figure 3.8
50%
45%
40%
35%
30%
25%
20%
15%
10%
5%
0%
Share of journal articles
Sources: Novo Nordisk Foundation/researchfish® and DAMVAD Analytics.
PP(top 10%) - World averagePP(top1%) - World average
PP(top 10%)PP(top 1%)
Industry collaboration, Denmark Industry collaboration, rest of the world

DISSEMINATION AND USE OF KNOWLEDGE WITHIN THE PRIVATE SECTOR 107
3.1.2 Companies’ experience in research collaboration with grant recipients What types of motivational factors, incentives and other factors influence collaboration between research companies and recipients of Foundation grants? This section focuses on the companies’ experience with and motivational factors for entering into research collaboration with grant recipients at public research institutions. It presents results from survey interviews from 152 research-active companies in Denmark about their research collaboration culture, motivation for collaborating with public researchers and publishing research; 37 of the compa-nies in the sample (about 24%) have collaborated with recipients of Foundation grants.
The survey sample of companies was generated from a sample of 1200 companies from Den-mark’s Central Business Registry, which were matched to publication data. Then 314 research companies were identified, and 152 were interviewed (the rest were not successfully reached or did not pass the screening questions).
Among the surveyed companies, all of which publish articles in scientific journals, 85% have co-published with public researchers. Most of the companies have collaborated with public researchers for more than 6 years.
According to the research literature, companies collaborate, publish and share knowledge with public researchers for many reasons, some of which this analysis explores. It demon-strates that public research plays an important role in the companies.
Figures 3.9 and 3.10 present the degree of importance of the motivational factors for collabo-ration between companies and public researchers. The responding companies rated the mo-tivational factors on a scale including “not at all”, “less”, “some”, “high” or “very high”. These figures only show the share rating the answers high or very high degree.
Many companies reported positively that enhancing competencies is a motivational factor for collaboration: 50% of research companies collaborating with recipients of Foundation grants have answered that strengthened competencies to a high or a very high degree is a motivat-ing factor for collaboration. The value is 37% for research companies not collaborating with recipients of Foundation grants companies.
Further, access to research infrastructure at public research institutions is a highly or very high-ly motivating factor for 45% of research companies collaborating with recipients of Founda-tion grants versus 26% for research companies not collaborating with recipients of Foundation grants. Research companies collaborating with recipients of Foundation grants generally weight various causes for motivational factors for collaboration higher that research companies not collaborating with recipients of Foundation grants, except for “access to applied research” (Figures 3.9 and 3.10).

CHAPTER 3108
Share of companies that attribute high or very high value to collaboration with public research in various categories
Figure 3.10
50%
40%
30%
30%
20%
10%
0%
Share of companiesCompanies collaborating with grant recipientsCompanies not collaborating with grant recipients
Access to researchinfrastructure
Access to applied research Access to basic research
45%
26%
32%35%
18%
11%
Sources: Novo Nordisk Foundation and Jysk Analyse.
Share of companies that attribute high or very high value to collaboration with public research in various categories
Figure 3.9
60%
50%
40%
30%
30%
20%
10%
0%
Share of companiesCompanies collaborating with grant recipientsCompanies not collaborating with grant recipients
Sources: Novo Nordisk Foundation and Jysk Analyse.
Strengthen competencies
Research dependent on the collaboration with
public researchers
Assistance with field studies
Strengthen public research to benefit
the company
50%
43%
37% 35%37% 36%
21% 23%

DISSEMINATION AND USE OF KNOWLEDGE WITHIN THE PRIVATE SECTOR 109
Based on the answers to six of the seven survey questions shown in Figures 3.9 and 3.10 on the specific motives for collaborating with public researchers (strengthening competencies; obtaining assistance with field studies; strengthening public research to benefit the company; accessing infrastructure; accessing applied research; and accessing basic research), the com-mon motivational factor across companies is especially strong for accessing infrastructure, ac-cessing applied research and obtaining assistance field studies.
Twenty-nine percent of the companies in the survey consider themselves companies perform-ing basic research. Within this group, companies differ greatly in their motivation for collabo-rating with public researchers to improve access to basic research. Thirty-seven percent of the basic research companies attribute high or very high value to accessing basic public research, whereas 39% only less value or not at all. Only 4% of companies referring to themselves as applied research companies (and not basic research companies) attribute high or very high value to accessing basic public research and 76% at-tribute little or no value to accessing pub-lic research (Figure 3.11).
Value attributed to accessing public basic research as motivation for collaborating with public researchers
Figure 3.11
100%
75%
50%
25%
0%
Share of answersCompanies performing basic and applied researchCompanies performing applied but not basic research
No or less value Some value High value or very high value
39%
76%
24%20%
37%
4%
Sources: Novo Nordisk Foundation and Jysk Analyse.

CHAPTER 3110
3.2 Dissemination and use of public research in patentsPatents linked to Foundation-funded public research constitute two identifiable channels of knowledge flow from public researchers to the private sector for commercial use. The first channel is grant recipients who file for patents based on Foundation-funded research, which links research grants to inventions based on reported patenting activity. The second channel is any patent application or patent that cites journal articles stemming from research funded by the Foundation, which is a traceable share of the wider dissemination of research-based knowledge.
3.2.1 Self-reported patent activity by grant recipientsFrom 2015 to 2018, grant recipients reported publishing 76 patent applications and 10 granted patents (Figure 3.12). The Foundation collected patent activities reported by grant recipients for the first time in 2015. Grant recipients reported activities in 2014 and earlier in the 2015 reporting round. These reported activities are sporadic and are not included in the further analysis below.
Number of distinct, published patent applications and patents reported by recipients of Foundation grants, 2009–2018
Figure 3.12
30
20
10
0
Number of patent applications and patentsPatent applications publishedPatent granted
Note: Patent applications and patents are pinned to the publication year of the patent application.Source: Novo Nordisk Foundation/researchfish®.
2014 2015 2016 2017 20182009 2010 2011 2012 2013

DISSEMINATION AND USE OF KNOWLEDGE WITHIN THE PRIVATE SECTOR 111
The most common types of Foundation grants involved in patent activity are pre-seed and exploratory pre-seed grants. These grants target research-based inventions and their com-mercialization (Figure 3.13). Section 3.3 further evaluates the impact of these two grant types.
Number of patent applications and patents reported by recipients of Foundation grants according to the type of grant
Figure 3.13
Number of patent applications and patents
Note: The data cover patent applications and patents for which the patent application was published in 2015–2018.Sources: Novo Nordisk Foundation/researchfish® and European Patent Office DOCDB database.
Pre-seed and exploratory pre-seed
Novo Nordisk Foundation Center for Biosustainability
Biotechnology-based synthesis and production
Clinical and basic biomedical research projects
Endocrinological and metabolic research
Other grant types
0 50454035302520155 10

CHAPTER 3112
Linking types of grants (Figure 3.13) and the main broad technology areas (Figure 3.14) shows that pre-seed and exploratory pre-seed grants are the main drivers for patent applications and patents by grant recipients within medical or veterinary science and organic chemistry (Figure 3.15). Patent activity reported by the Novo Nordisk Foundation Center for Biosustainability mostly applies to the protection of biochemical inventions and, secondly, to inventions focus-ing on measuring and testing and organic chemistry.
Grant recipient patenting activity distributed on main technology areas(Cooperative Patent Classification level 2)
Figure 3.14
Note: The first three Cooperative Patent Classification codes listed in order of priority for each patent are used as a proxy for main technology areas.Sources: Novo Nordisk Foundation/researchfish® and European Patent Office DOCDB database.
Medical or veterinary science
Biochemistry
Organic chemistry
Measuring; testing
Other
Agriculture and forestry
0% 40%35%30%25%20%15%5% 10%
The patent classifications reveal that the main broad technology areas of the reported patents are medical or veterinary science, biochemistry and organic chemistry (Figure 3.14). Within each of these, the technologies primarily focus on:
• preparations for medical or dental purposes, within medical or veterinary science;
• microorganisms or enzymes and fermentation or enzyme-using processes to synthesize a desired chemical compound, within biochemistry; and
• peptides and heterocyclic compounds, within organic chemistry.

DISSEMINATION AND USE OF KNOWLEDGE WITHIN THE PRIVATE SECTOR 113
Links between types of grants and the main broad technology areas for patent applications and patents (Cooperative Patent Classification level 2)
Figure 3.15
Medical or veterinary science(Medicinal preparations containing organic active ingredients, peptides, antigens or antibodies, and other)
Pre-seed and exploratory pre-seed
Novo Nordisk FoundationCenter for Biosustainability
Biosustainability-basedsynthesis and production
Clinical and biomedicalresearch projects
Endocrinological and metabolic research
Other grant types
Biochemistry(Microorganisms or enzymes and testing processes involving enzymes or microorganisms)
Organic chemistry(Peptides, heterocyclic compounds)
Measuring; testing
Other
Grant types Technology areas of patented inventions
Note: The first three Cooperative Patent Classification codes listed in order of priority for each patent are used as a proxy for the main technology areas. The types of grants on the left side are ordered according to the number of reported patent applications and patents but deviate relative in size compared with Figure 3.13 because the number of technology areas attached to each patent varies. CPC level 2 codes applied.Sources: Novo Nordisk Foundation/researchfish® and European Patent Office DOCDB database.

CHAPTER 3114
3.2.2 References to journal articles in patent documentsThis section investigates how patent documents (applications and granted patents) refer to public research and, specifically, to Foundation-funded public research. Research-based pat-ents may contain references to journal articles. These links between journal articles and patent documents constitute an observable channel of knowledge transfer from academia to indus-try, estimating the wider benefit of public research and indicating research-based innovation. References provided personally by the applicants clearly comprise the strongest link between public research cited in patent documents and the patented inventions. With 89.9% of these links added by the applicants, in the patent documents identified in this analysis, the links are reliable. Other sources of references added to patent documents include search reports (10.05%), patent examiners (0.01%) and third-party interventions (0.04%).
Journal articles are cited worldwide in patents and patent applications. The Foundation has access to the DOCDB patent database of the European Patent Office (EPO), with worldwide coverage from more than 90 reporting countries, including the countries behind the five big-gest offices (the IP5) in the United States (USPTO), the EU (EPO), Japan (JPO), South Korea (KIPO) and China (SIPO).
More than 30 million references to non-patent-literature publications in more than 6 million patent documents were searched from within the DOCDB database and matched with re-search publications from the Foundation’s publication database, which comprises publica-tions funded or co-funded by Foundation grants. The DOCDB database contains all citations of other patents and non-patent literature such as peer-reviewed original articles and review articles, white papers, grey literature research papers, research working papers, letters, notes, books, news items, web pages and others.

DISSEMINATION AND USE OF KNOWLEDGE WITHIN THE PRIVATE SECTOR 115
Number of distinct, published patent applications and patents reported by recipients of Foundation grants, 2009–2018
Figure 3.16
Sources: Novo Nordisk Foundation/researchfish®, European Patent Office DOCDB database; Danish Centre for Studies in Research and Research Policy and CWTS Leiden.
1060 Foundation-funded
journal articles cited by patent documents
2238 distinct patent documents citing
Foundation-funded researchin 1712 patent families
From 1994 to 2017, 2238 distinct patent applications or patents cited 1060 distinct journal articles from the Foundation’s publication database (Figure 3.16). This is an increase of 80 dis-tinct publications and 124 distinct patent applications or patents compared with last year’s search for 1994–2016. Last year, 2114 distinct patents or patent applications cited 980 distinct publications by recipients of Foundation grants.

CHAPTER 3116
Journal articles by grant recipients appear three times more often in patent documents worldwide than to comparable journal articles registered in Web of Science (Figure 3.17).
Share of Foundation-funded journal articles versus comparable sample of journal articles worldwide cited by patent documents, 1994–2017
Figure 3.17
6%
5%
4%
3%
2%
1%
0%
Share of journal articles
Note: The world average is based on a stratified random sample of 4842 journal articles matching the distribution of subject categories of Foundation-funded journal articles.Sources: Novo Nordisk Foundation/researchfish®, European Patent Office DOCDB database; Danish Centre for Studies in Research and Research Policy and CWTS Leiden.
Journal articles by grant recipients Journal articles worldwide
1.9%
5.8%
The EPO groups patents and patent applications for similar technologies into simple patent families. The 1060 publications are included in more than one patent document or family of patent documents, which is why the total distinct number of patent families at 1712 exceeds the number of journal articles cited.

DISSEMINATION AND USE OF KNOWLEDGE WITHIN THE PRIVATE SECTOR 117
Fields of Science and technology for Foundation-funded journal articles cited in patent documents
Table 3.2
Note: The research classification follows the OECD fields of science and technology (minor fields).Sources: Novo Nordisk Foundation/researchfish®, European Patent Office; Danish Centre for Studies in Research and Research Policy and CWTS Leiden.
OECD field of science, minor field
Biological sciences
(50% of the journal categories absorbed in patent documents)
Clinical medicine
(23% of the journal categories absorbed in patent documents)
Basic medical research
(16% of the journal categories absorbed in patent documents)
42
27
31
27
20
15
7
31
33
21
13
10
22
Biochemistry & molecular biology
Cell biology
Other
Endocrinology & metabolism
Oncology
Haematology
Cardiac & cardiovascular systems
Other
Medicine, research & experimental
Immunology
Pharmacology & pharmacy
Neurosciences
Other
Share of fields of science, %Web of Science subject category
Table 3.2 shows the distribution of journal subject categories within each of the three predom-inant OECD minor fields of science and technology: biological sciences, clinical medicine and basic medical research. Research within these three fields covers 89% of the variation in the fields of science and technology associated with the journal articles.
The subject categories biochemistry & molecular biology and cell biology comprise most biological sciences. Within clinical medicine, the main subject categories are endocrinology & metabolism, oncology and haematology; within basic medical research, the major subject cat-egories are medicine, research & experimental; immunology; and pharmacology & pharmacy.

CHAPTER 3118
Table 3.3 presents the mirror image of Table 3.2, showing the main broad technology area classifications of the patent documents citing Foundation-funded research. One system wide-ly used is the Co-operative Patent Classification (CPC). The CPC codes on a patent document are listed in order of priority. In the data, patent documents on average have 7.5 detailed CPC codes. For the analysis presented in Table 3.3, the first three codes were used to determine broad technology areas (from aggregated CPC-level codes).
Distribution of patents according to broad technology areas for articles by recipients of Foundation grants cited in patent documents
Table 3.3
Note: The first three Cooperative Patent Classification codes listed in order of priority for each patent are used as a proxy for the main technology areas. CPC levels 2 and 3 codes applied.Sources: Novo Nordisk Foundation/researchfish®; European Patent Office DOCDB- database; Danish Centre for Studies in Research and Research Policy and CWTS Leiden.
Broad technology area, CPC level 2
Medical or veterinary science
(38% of the absorption of journal
articles by grant recipients)
Organic chemistry
(27% of the absorption of journal
articles by grant recipients)
Biochemistry
(18% of the absorption of journal
articles by grant recipients)
76
19
5
57
34
9
CPC-level 3Share of broad
technology area, %
The results in Table 3.3 show that 38% of the absorption of Foundation-funded research-based knowledge through journal articles is linked to inventions within the broad technology area medical or veterinary science. Almost all activity, 93%, is tied to preparations for medical, dental or toilet purposes. Within organic chemistry, the second largest group of broad tech-nologies, links to peptides dominate, comprising 76% of the group. The subgroup microor-ganisms or enzymes; compositions thereof and the subgroup measuring or testing processes involving enzymes or microorganisms jointly comprise 91% of the activity within the third of the three largest broad technology areas: biochemistry. Jointly, the three broad technology areas comprise 83% of the total dispersion of broad technologies among patent documents citing Foundation-funded public research.
Peptides
Heterocyclic compounds
Other
Microorganisms or enzymes; compositions thereof
Measuring or testing processes involving enzymes or microorganisms
Other
Other
Preparations for medical, dental, or toilet purposes 93
7

DISSEMINATION AND USE OF KNOWLEDGE WITHIN THE PRIVATE SECTOR 119
Figure 3.18 shows that major links between research published in journals directed towards biological sciences and clinical medicine are relatively well represented in the three largest broad technology areas medical or veterinary science, organic chemistry and biochemistry. Biological sciences constitute about 40% of the research and have a similar citation share in the three largest broad technology areas, as does clinical medicine. The flows from basic med-ical research, in contrast, being more skewed towards the two largest broad technology areas and less towards biochemistry.
How Foundation-funded research is used for different technology inventionsFigure 3.18
Medical or veterinary science(Medicinal preparations containing organic active ingredients, peptides, antigens or antibodies, and other)
Biological sciences(Biochemistry &
molecular biology, cell biology and other)
Clinical medicine(Endocrinology & metabolism,
oncology, haematology and cardiac & cardiovascular
systems and other)
Basic medical research(Medicine, research & experimental,
immunology, pharmacology, neurosciences)
Other natural sciences
Environmental biotechnology
Other
Organic chemistry(Peptides, heterocyclic compounds)
Biochemistry(Microorganisms or enzymes and testing processes involving enzymes or microorganisms)
Measuring; testing
Agriculture and forestry
Other
Note: Research classification (left side) follows the OECD Field of Science and Technology (minor fields). The Cooperative Patent Classification was used to map research to patent technology area (right side) at level 2. The first three detailed CPC-codes listed in order of priority on each patent document are used as a proxy for main technology areas.Sources: Novo Nordisk Foundation/researchfish®; European Patent Office DOCDB-database; Danish Centre for Studies in Research and Research Policy and CWTS Leiden.
Research area funded by the Foundation
Technology areas of patented inventions

CHAPTER 3120
Exploratory Pre-seed and Pre-seed grantsTable 3.4
Note: Grant recipients can receive more than one grant, which is why the total number of grants add up to more than the number of distinct grant recipients. a) Follow-up grants have been added to the original grant recipient. b) Fourteen grant recipients have received both exploratory pre-seed and pre-seed grants. Sources: Novo Nordisk Foundation/researchfish® and Accelerace.
Programme
Exploratory Pre-seed Program
- Follow up grants
Pre-seed Grant Program
- Follow up grants
Total grants
Distinct grant recipients
-
-
7
-
7
7
2014
19
2
7
1
26
25
2011
-
-
3
-
3
3
2015
18
3
6
1
24
20
2012
27
-
4
1
31
30
2016
20
6
8
-
28
24
2018
9
2
6
-
15
12
2013
20
-
7
1
27
24
2017
17
6
9
-
26
21
130
19a
57
4a
187
165b
67.8
4.3
148.1
2.2
222.5
222.5
Number of grants
Total,DKK mill.
Pre-2011
3.3 Impact of innovation programmesThis section describes the outcome and impact of grants awarded through the Exploratory Pre-seed Programme and Pre-seed Programme 2007–2018 established by the Foundation to support academic research projects with commercial potential. The analysis combines data from the Foundation’s grant data and researchfish® reporting data from grant recipients with other private and public data sources. The dataset established the tracking of each grant re-cipient’s progress from university project to a spin-out company (defined as a new company that depends on licensing or being assigned the institution’s technology to be initiated). This enables short-term outcomes to be assessed, company characteristics to be compared, devel-opment trajectories to be mapped and the relative increase in human and financial resources before, during and after participating in the programmes.
3.3.1 The Foundation’s innovation programmes and control group spin-outs from public innovation programmesThe Exploratory Pre-seed Programme aims to accelerate the commercialization of biomedical research findings at a very early stage and the development of novel techniques within the health sciences. It seeks to support researchers based at universities and hospitals in the Nor-dic countries. The goal is to stimulate entrepreneurship and to test new ideas that may lead to the development of new medical treatments, disease prevention, devices and diagnostic methods.

DISSEMINATION AND USE OF KNOWLEDGE WITHIN THE PRIVATE SECTOR 121
1 Except for two grants, which received DKK 700,000 DKK and DKK 661,024, respectively. Follow-up grants for Exploratory Pre-seed Pro-gramme have in 2018 a maximum of DKK 500,000.2 The Pre-seed grant and follow-up grant cannot exceed DKK 3.5 million. 3 Control group data were constructed using only publicly available sources, whereas data for the Foundation group draw on reports from the recipients as well as public sources. Control group data may therefore be more prone to underreporting of spin-outs and public funding than the Foundation sample.
The Exploratory Pre-seed Programme provides grants with a maximum of DKK 0.5 million per grant.1 Since 2012, 130 exploratory pre-seed grants have been awarded out of 698 appli-cations, with 19 follow-up grants awarded for specific commercialization-related activities (see Table 3.4). Each grant recipient is allocated an adviser from Novo Seeds (part of Novo Holdings A/S) to provide commercial advice and to help to develop the research project to a stage at which applying for additional funding may be appropriate.
The Pre-seed Programme awards up to DKK 3.5 million per grant to early-stage, academic research projects with promising commercial potential. It has resulted in 57 pre-seed grants and four follow-up grants being awarded.2 An exploratory pre-seed grant is not required to receive a pre-seed grant, but a project that receives an exploratory pre-seed grant can also receive a pre-seed grant.
The research projects supported by the Exploratory Pre-seed Programme and Pre-seed Programme are long-term in nature, and most grant recipients have started their commer-cial endeavours within the past few years. The time span of the data excludes the observa-tion of long-term outcomes and thus also wider benefit and the socioeconomic impact of the programme. Instead, several short-term outcomes are used to measure programme quality and short-term impact: 1) attracted funding after spinout (public funding and private funding); 2) spin-out rate; 3) survival rate; 4) employment growth; 5) PhD graduates; and 6) compe-tencies in the companies. The short-term outcomes of recipients of Foundation grants are benchmarked against a matched control group of non-participants from two public early stage innovation programmes: Copenhagen Spin-outs and the Danish National Proof-of-Concept Programme.3

CHAPTER 3122
Description of the public innovation programmes used as control group
Copenhagen Spin-outsCopenhagen Spin-outs is a collaboration between the academic research environment and industry to foster innovation and to accelerate up the commercialization of biotechnology research between universities, re-search parks and investors in the Capital Region of Denmark. A spin-out is defined as a new company that depends on licensing or being assigned the institution’s technology to be initiated. From 2012 to March 2015, Copenha-gen Spin-outs supported 64 potential spin-out projects with DKK 61 million in funding, which led to 41 patent applications, 20 licensing agreements, and 21 spin-out companies in the areas of medical devices, diagnostics, pharmaceuticals, industrial biotechnology and food. Copenhagen Spin-outs was funded with DKK 20 million from the European Regional Devel-opment Fund, DKK 8 million from the Growth Forum for the Capital Region of Denmark and DKK 12 million from the partners.
The Danish National Proof-of-Concept ProgrammeThe Danish National Proof-of-Concept Programme of the Ministry of Education and Science was active from 2006 to 2013 with an annual budget of DKK 20-25 million to support researchers at public research institutions with the early development of projects to a stage at which they were mature enough to apply for funding from incubators, professional investors and private companies. The Programme provided up to DKK 0.75 million per grant to support a period of 18 months.4 From 2008 to 2013, the consortium in eastern Denmark anchored at the Technical University of Denmark sup-ported 127 projects with DKK 86.3 million. This led to 64 new or improved patent applications, 7 licensing agreements and 32 spin-out companies in the areas of biotechnology, cleantech, software and manufacturing.
The control group includes in total 33 identified spin-out companies based on the two public innovation programmes.
4 In 2009 the upper grant limit for larger and more complex projects was raised from one to two times DKK 0.75 million.

DISSEMINATION AND USE OF KNOWLEDGE WITHIN THE PRIVATE SECTOR 123
3.3.2 Spin-outsThe Exploratory Pre-seed Programme and Pre-seed Programme constitute a virtual pipeline to project maturation, and the recipients of Foundation grants created 63 spin-out companies partly or fully based on the exploratory pre-seed and pre-seed grants. Fifty-four of these have existed for more than 2 years and are used as a benchmark in this analysis and are referred to as the Foundation group.5 A total of 36% of the Foundation’s grant recipients that have received exploratory pre-seed and/or pre-seed grants created spin-out companies from 17 universities in the Nordic countries of which most are located in Denmark (77%) and Sweden (16%) (Figure 3.19).
Figure 3.19 provides an overview of the university affiliations. The spin-out companies develop research projects in biotechnology (68%), pharmaceuticals (19%) and medical devices (11%). These new products and drugs address unmet medical needs and could change therapeutic (65%), industrial (9%) and diagnostic (24%) areas of intervention.
Origin of university spin-outs generated by exploratory pre-seed and pre-seed grants Figure 3.19
5 Including spin-outs registered until April 2017.
25
20
15
10
5
0
Number of spin-out companies
Sources: Novo Nordisk Foundation/researchfish® and Accelerace.
Uni
vers
ity o
f Cop
enha
gen
Uni
vers
ity o
f Lin
köpi
ng
Tech
nica
l Uni
vers
ity o
f Den
mar
k
Uni
vers
ity o
f Oslo
Aar
hus U
nive
rsity
Uni
vers
ity o
f Ber
gen
Lund
Uni
vers
ity
Stoc
khol
m U
nive
rsity
Rigs
hosp
itale
t
Dan
ish C
ance
r Soc
iety
Uni
vers
ity o
f Sou
ther
n D
enm
ark
Karo
linsk
a In
stitu
tet
Uni
vers
ity o
f Hel
sinki
Chal
mer
s Uni
vers
ity o
f Tec
hnol
ogy
Um
eå U
nive
rsity
Aal
borg
Uni
vers
ity
Aal
borg
Uni
vers
ity H
ospi
tal
Uni
vers
ity o
f Got
henb
urg

CHAPTER 3124
Pipeline graduatesThe Foundation’s Exploratory Pre-seed Programme and Pre-seed Programme are part of a greater Foundation ecosystem. Fourteen of the 130 exploratory pre-seed grants also received a pre-seed grant, and 9 of the 14 created a spin-out which gives a spin-out rate of 64%. The remaining 116 exploratory pre-seed grants generated 25 spin-outs and the 43 pre-seed grants that did not receive a prior exploratory pre-seed grant generated 29 spin-outs, giving spin-out rates of 22% and 60%, respectively. Figure 3.20 illustrates the pipeline.
Some of the 63 spin-outs arising from the two innovation programmes succeeded in other Foundation initiatives. Nine spin-outs received equity investments from Novo Seeds, includ-ing Biosyntia ApS, BioPhero ApS and Antag Therapeutics ApS. Orphazyme A/S went from a pre-seed grant in 2009 to a pre-seed equity investment in 2010 from Novo Seeds to a series A investment by Novo Ventures in 2011. Today Novo Holding A/S owns 15% of Orphazyme A/S.
The spin-outs are also represented in other initiatives by the Novo Nordisk Foundation. For-ty-one percent of the companies in the portfolio of the Nordic Mentor Network for Entre-preneurship are spin-outs from the Exploratory Pre-seed and Pre-seed Programmes, and the share for the BioInnovation Institute is 50%.

DISSEMINATION AND USE OF KNOWLEDGE WITHIN THE PRIVATE SECTOR 125
Overview of spin-outs of the Foundation’s pipeline from the Foundation’s Exploratory Pre-seed and Pre-seed Programmes
Figure 3.20
Note: a) Two companies no longer exist and one company moved to Novo Ventures. The number of companies on the right side of the figure does not add up to 63 because three spin-outs are present in multiple initiatives.Sources: Novo Nordisk Foundation/researchfish® and Accelerace.
EXPLORATORYPRE-SEED GRANTS
(Novo Nordisk Foundation)
PRE-SEED GRANTS(Novo Nordisk Foundation)
NOVO SEEDS(Novo Holdings A/S)
(6a out of 25portfolio companies)
INCUBATION(BioInnovation Institute)
(7 out of 14portfolio companies)
NOVO VENTURES(Novo Holdings A/S)
(1 out of 55 portfolio companies)
SPIN-OUTS
25
14 38130 57 63 7
9
1
NORDIC NETWORK FOR ENTREPRENEURSHIP
(Accelerace)(7 out of 17 portfolio companies)
OUTSIDE THE FOUNDATION’S PIPELINE
7
42

CHAPTER 3126
3.3.3 Additional public and private funding The ability of grant recipients to attract additional funding for commercialization is a key market-based indication of the application value of the research projects. Two years after grant start, 30% of the Foundation group companies had attracted private funding versus 24% in the control group. The Foundation group companies had raised DKK 366 million in public funding and DKK 88 million in private funding. The control group raised DKK 44 million in public funding and DKK 15 million in private funding during the first 2 years. By the end of first quarter 2019, the Foundation group companies have raised DKK 774 million in public funding and DKK 2.57 billion in private funding. The control group companies have also changed the ratio between public funding and private funding, with DKK 238 million in public funding and DKK 249 million in private funding raised currently (Figure 3.22).
The spin-out companies from the Foundation group and the control group have ratios exceeding 80% for attracting additional funding (Figure 3.21). However, the total amount raised shows the difference between the two groups (Figure 3.22). The Foundation group raised more than four times as much per spin-out company as the control group. However, three very successful companies accounted for 62% of the total funding in the Foundation group. The additional funding for the companies in the Foundation group ranges from less than DKK 1 million to more than DKK 500 million (Figure 3.23). Apart from the top three com-panies the Foundation group raised an average of DKK 30 million per spin-out company.
Public organizations drove about 81% of the observed growth in funding levels 2 years after the first grant was awarded. Of the DKK 366 million in public funding after 2 years, most was provided by government institutions (47%), foundations that support innovative research (39%) and universities (6%). The largest public grant was DKK 63 million provided to Pluvia AS by the Research Council of Norway to support the development of drug candidates to target rare diseases caused by protein misfolding. The European Commission (EU), Tekes (Finnish Funding Agency for Technology and Innovation), Vinnova (Sweden), the Research Council of Norway and Innovation Fund Denmark have provided DKK 500 million in funding through 90 grants to the recipients of Foundation grants so far.

DISSEMINATION AND USE OF KNOWLEDGE WITHIN THE PRIVATE SECTOR 127
Cases of private funding
The spin-out company Orphazyme A/S, which received a pre-seed grant in 2009, managed to raise DKK 600 million in an initial public offering (IPO), which is the highest amount raised by companies originating out of the Ex-ploratory Pre-seed Programme and the Pre-seed Programme.
However, Galecto Biotech AB secured the largest round of private financing, raising DKK 590 million in series C funding to advance galectin modulators for treating severe diseases, including fibrosis and cancer. Galecto Biotech AB was built based on a pre-seed grant received in 2010. NMD Pharma ApS, which received a pre-seed grant in 2014, raised DKK 267 million in series A funding to advance novel treatments of neuromuscular disorders. The NMD round was led by new investors Inkef Capital and Roche Ven-ture Fund, and existing investors Lundbeck Emerge and Novo Seeds also participated. More evidence of the commercial potential of the spin-out companies is represented by the decision by Swedish healthcare company BioGaia AB to further extend its holdings in MetaboGen AB in 2018, re-sulting in a shareholding of 92% of equity in the company. MetaboGen AB received its pre-seed grant in 2013.
So far, 23% of the spin-out companies have raised more than DKK 10 million in funding from private investors, including Avilex Pharma ApS (DKK 11.5 million), Biosyntia ApS (DKK 42.3 million), UNION Therapeutics A/S (DKK 49.4 million), MonTa Biosciences (DKK 25.8 million), Var2 Pharmaceuticals ApS (DKK 67 million), Gesynta Pharma AB (DKK 15.8 million) and BioPhero ApS (DKK 26.3 million).

CHAPTER 3128
Funding ratios for spin-outs since the grants were awarded
Funding for spin-outs since the grants were awarded
Figure 3.21
Figure 3.22
Total funding ratio
Public funding ratio
Private funding ratio
0% 40% 50% 60% 70% 80% 90%30%20%10%
Control groupFoundation group
Note: Based on 54 Foundation group spin-outs and 33 control group spin-outs. Sources: Novo Nordisk Foundation/researchfish® and Accelerace.
Total funding
Public funding
Private funding
0 2 2,5 3 3,51,510,5
Control groupFoundation group
Note: Based on 54 Foundation group spin-outs and 33 control group spin-outs. Sources: Novo Nordisk Foundation/researchfish® and Accelerace.
DKK billions

DISSEMINATION AND USE OF KNOWLEDGE WITHIN THE PRIVATE SECTOR 129
Funding attracted by Foundation group spin-outs since the grants were awarded Figure 3.23
Number of spin-outs
Sources: Novo Nordisk Foundation/researchfish® and Accelerace.
1-5< 1 500+10-25 50-1005-10 25-50
Addintional funding in DKK million
100-500
16
14
12
10
8
6
4
2
0
5
14
56
3
7
4
2
3.3.4 PatentsOf the grant recipients in the Foundation group, 22.2% created 85 patent applications. Compared with the control group, the number of patents per total amount of awarded funding is less than half for the exploratory pre-seed and pre-seed grants. Of the 85 patent applica-tions, 28 came from just three grants.

CHAPTER 3130
Increase in employment rate of spin-outs since grant-awarding Figure 3.24
1 2 3 4 5 60
Control groupFoundation group
Note: Based on 54 Foundation group spin-outs and 33 control group spin-outs. Sources: Novo Nordisk Foundation/researchfish® and Accelerace.
Number of employees per spin-out
Total increase in employment in programme (hundreds)
3.3.5 Employment and survival rateBefore receiving the grants, the spin-out companies in the Foundation group had an average of 1.86 founders and 0.24 employees. The average increase in the number of employees per spin-out since a grant was awarded is 5.03 employees6 for the Foundation group and 3.57 em-ployees for the control group. By the end of first quarter 2019, the Foundation group created 352 new jobs versus 176 new jobs in the control group (Figure 3.24).
The spin-out companies employ 74 PhD graduates and postdoctoral fellows7 in the Founda-tion group and 39 in the control group. These young researchers were employed in 44% of the spin-out companies in the Foundation group and in 39% of the control group. Companies that have attracted many young researchers include Biosyntia ApS, Orphazyme A/S and NMD Pharma A/S.
The survival rate of spin-outs by the end of first quarter 2019 was 89% for the Foundation group versus 93% in the control group.
6 The number of employees does not include full-time founders, but they are included in all other statistics.7 Defined as team members who have just finished a PhD or postdoctoral fellowship before engaging in the spin-out.

DISSEMINATION AND USE OF KNOWLEDGE WITHIN THE PRIVATE SECTOR 131
Overall experience levels of spin-out companies since grant-awardingFigure 3.25
3.3.6 Attracting senior experts to spin-outsFigure 3.25 shows the change in the total years of experience in the spin-out companies in the Foundation group versus the control group. The average number of years added per spin-out company is almost the same for the Foundation group and the control group on academic and industrial experience. The control group spin-out companies have in average 70% more entrepreneurial years added per spin-out company than the Foundation group. By the end of first quarter 2019, the Foundation’s exploratory pre-seed and pre-seed grants have added 776 years of academic expertise, 1577 years of industrial expertise and 108 years of entrepre-neurial expertise.
180
160
140
120
100
80
60
40
20
0
Total yearsControl groupFoundation group
Note: Based on 54 Foundation group spin-outs and 33 control group spin-outs. Sources: Novo Nordisk Foundation/researchfish® and Accelerace.
Total academic years added/10 Total industrial years added/10 Total entrepreneurial years added

CHAPTER 3132
The ability of grant recipients to form partnerships with other researchers, universities and companies is an indicator of the spin-outs’ ability to seek and attract the competencies re-quired to enable research ideas to develop and translate into new commercial applications. By forging partnerships with international organizations with long track records of producing high quality research outputs or generating commercial revenue, grant recipients can reduce technology risks by stimulating new research activities in collaboration with key stakeholders. These interactions can help in providing early validation of the technology in question and attract interest from private investors.
A total of 49% of the recipients of Foundation grants formed 220 partnerships with partners in 21 countries; 124 (56%) were from the Nordic countries and 35 (16%) from the United States (Figure 3.26). These partnerships included organizations such as Stanford University and Harvard University and major pharmaceutical companies like Johnson & Johnson and Pfizer. Most partnerships were formed with universities (50%), hospitals (23%) and private compa-nies (21%). These partnerships provide grant recipients with access to research facilities to test ideas, opportunities to collaborate with like-minded researchers and insight into commercial-ization routes. Grant recipients have reported that 85 of the new partnerships provided value in areas of impact such as economic (71%), policy (67%), social (22%) and cultural (7%). 8 The rest of the partnerships either had no impact at the time or no answer was given.
8 The percentages sum up to more than 100 because a partnership can have more than one area of impact.

DISSEMINATION AND USE OF KNOWLEDGE WITHIN THE PRIVATE SECTOR 133
Geographical location of partnership organizations for recipients of Foundation exploratory pre-seed and pre-seed grants
Figure 3.26
Sources: Novo Nordisk Foundation/researchfish® and Accelerace.
Sweden
Poland
Japan
South Africa
Finland
Georgia
China
Australia
Canada
Spain
Denmark
Norway
United Kingdom
United States
Belgium
France
Netherlands
Germany
Czech Republic
Hungary
Switzerland
28
2
2
2
8
1
1
3
2
2
6
62
10
3
26
1
2
9
35
3
12


Novo Nordisk FoundationTuborg Havnevej 19DK–2900 HellerupDenmark
TEW
©2019 Novo Nordisk FoundationAll rights reservedISBN: 978-87-994858-7-1
Layout: Marianne Siem
Novo Nordisk FoundationTuborg Havnevej 19DK–2900 HellerupDenmark
ISBN: 978-87-994858-7-1
TEW
+45 3527 [email protected]
CreatingknowledgeCreatingknowledge