socio-demographic variation in experience of shared ...€¦ · socio-demographic variation in...
TRANSCRIPT

Socio-demographic variation in
experience of shared decision-making
with GPs in England
Anas El Turabi, Gary Abel, Georgios Lyratzopoulos, Martin Roland

Acknowledgements
• GPPS respondents and programme
• Dr Gary Abel
• Dr Georgios Lyratzopoulos
• Prof Martin Roland

Patient involvement in decision-making is
an important aspect of quality of care
• Patient experience is an important dimension of
quality of care
• Involvement in decisions about tests and treatment
are key aspects of patient experience
• Satisfaction with involvement in decision-making
may be associated with improved psychological
outcomes
Gattellari et al, Soc Sci Med (2001)

The extent to which this varies in primary
care is not known

The General Practice Patient Survey allows us
to examine variation of patient experience
• Annual survey sent to
over 3.5 million patients
in England
• Response rate 38% in
2011/12
• Asks a range of
questions intended to
evaluate various
aspects of care
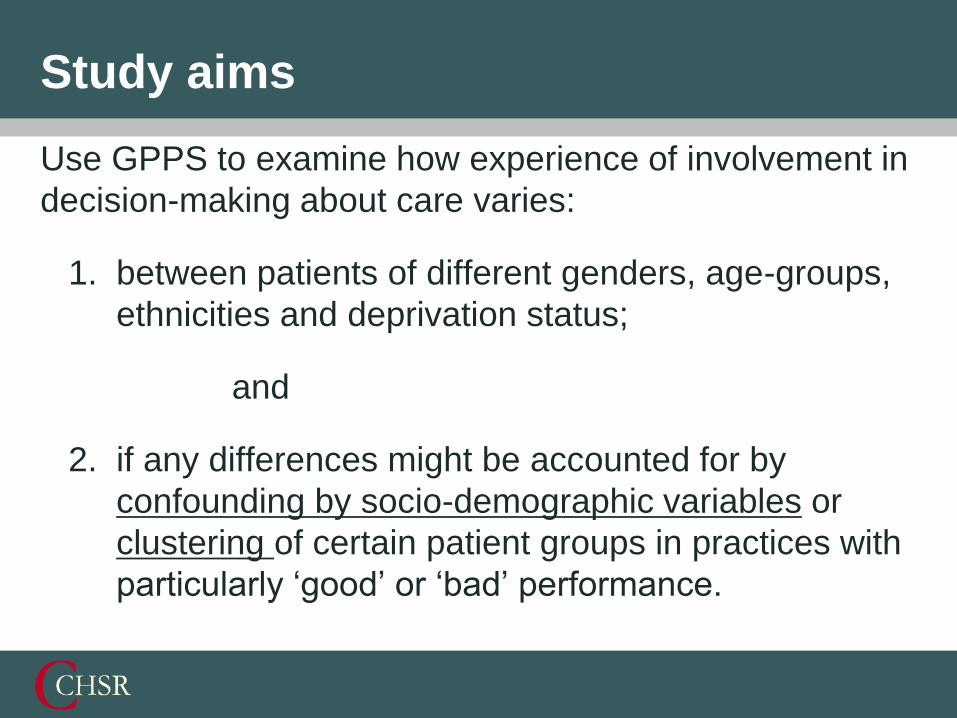
Study aims
Use GPPS to examine how experience of involvement in
decision-making about care varies:
1. between patients of different genders, age-groups,
ethnicities and deprivation status;
and
2. if any differences might be accounted for by
confounding by socio-demographic variables or
clustering of certain patient groups in practices with
particularly ‘good’ or ‘bad’ performance.

A single question evaluated experience of
involvement in decisions about care
page 3Please turn over
LAST GP APPOINTMENT
Q21 Last time you saw or spoke to a GP from
your GP surgery, how good was that GP at
Giving you enough time
Very good
Good
Neither good nor poor
Poor
Very poor
Doesn’t apply
Listening to you
Very good
Good
Neither good nor poor
Poor
Very poor
Doesn’t apply
Explaining tests and treatments
Very good
Good
Neither good nor poor
Poor
Very poor
Doesn’t apply
Very good
Good
Neither good nor poor
Poor
Very poor
Doesn’t apply
Very good
Good
Neither good nor poor
Poor
Very poor
Doesn’t apply
Q22 GP you saw or spoke to?
Yes, to some extent
No, not at all
Don’t know / can’t say
LAST NURSE APPOINTMENT
Q23 Last time you saw or spoke to a nurse from
your GP surgery, how good was that nurse
Giving you enough time
Very good
Good
Neither good nor poor
Poor
Very poor
Doesn’t apply
Listening to you
Very good
Good
Neither good nor poor
Poor
Very poor
Doesn’t apply
Explaining tests and treatments
Very good
Good
Neither good nor poor
Poor
Very poor
Doesn’t apply
Very good
Good
Neither good nor poor
Poor
Very poor
Doesn’t apply
Very good
Good
Neither good nor poor
Poor
Very poor
Doesn’t apply
Q24 nurse you saw or spoke to?
Yes, to some extent
No, not at all
Don’t know / can’t say
EXAMPLE

How good was your GP at involving you in decisions
about your care?
Overall responses
Very good 44%
Good 34%
Neither good nor poor
11%
Poor 2%
Very poor 1%
Doesn't apply 8%
n=963,516* * excludes respondents with
missing socio-demographic data
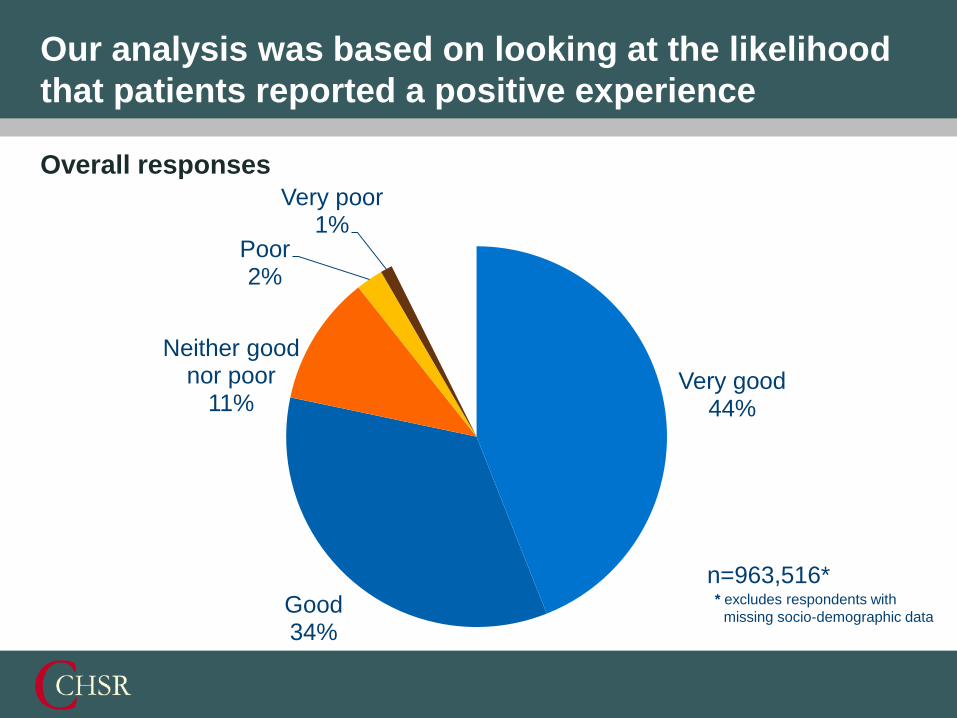
Our analysis was based on looking at the likelihood
that patients reported a positive experience
Overall responses
Very good 44%
Good 34%
Neither good nor poor
11%
Poor 2%
Very poor 1%
n=963,516* * excludes respondents with
missing socio-demographic data

Very good 48%
Good 37%
Neither good nor poor
12%
Poor 2%
Very poor 1%
Our analysis was based on looking at the likelihood
that patients reported a positive experience
Informative responses
n=892,606* * excludes respondents with
missing socio-demographic data

Positive 85%
Not positive 15%
Our analysis was based on looking at the likelihood
that patients reported a positive experience
Informative responses
n=892,606* * excludes respondents with
missing socio-demographic data
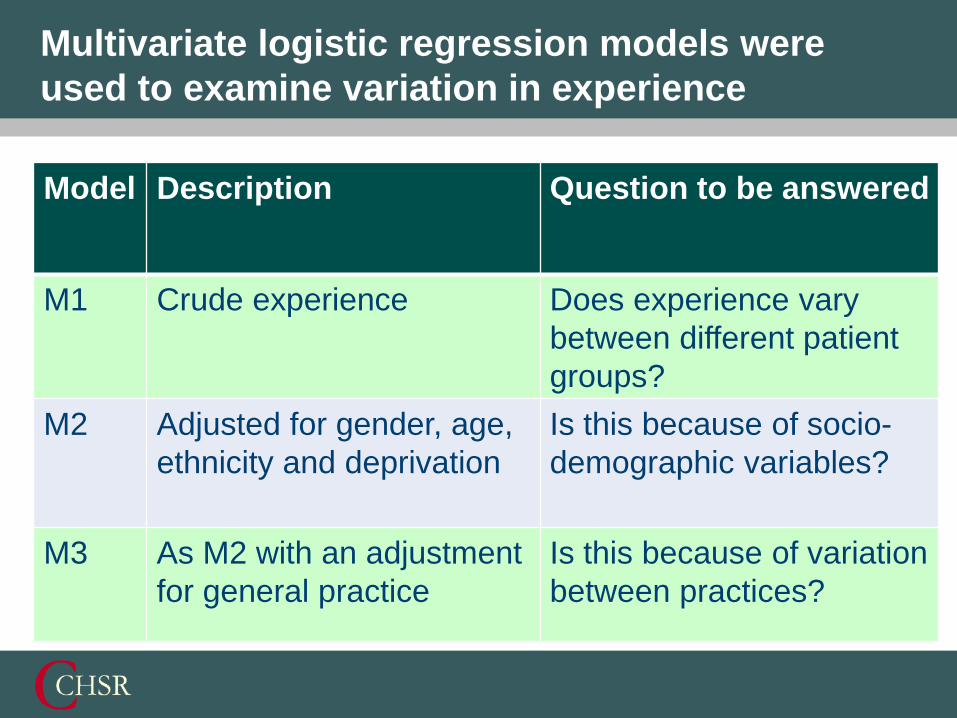
Model Description Question to be answered
M1 Crude experience Does experience vary
between different patient
groups?
M2 Adjusted for gender, age,
ethnicity and deprivation
Is this because of socio-
demographic variables?
M3 As M2 with an adjustment
for general practice
Is this because of variation
between practices?
Multivariate logistic regression models were
used to examine variation in experience

Odds ratios of reporting experience of involvement in
decision-making as positive as the reference group*
*Adjusted for gender, age-group, ethnicity
and deprivation

Women report marginally more positive experience
of involvement in care decision-making than men
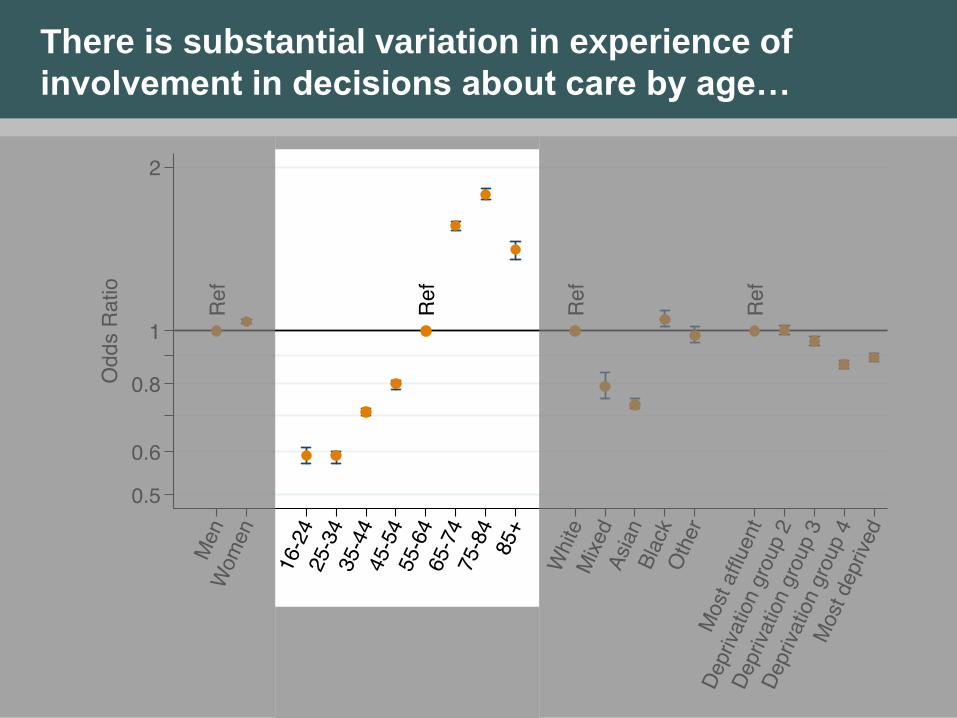
There is substantial variation in experience of
involvement in decisions about care by age…

… and ethnicity …

… with modest variation by socio-economic status

How much variation is explained by concentration of
certain groups in particularly ‘good’ or ‘bad’ practices?
*Adjusted for gender, age-group, ethnicity
and deprivation

*Adjusted for gender, age-group, ethnicity
and deprivation and practice
How much variation is explained by concentration of
certain groups in particularly ‘good’ or ‘bad’ practices?

Variation in patient experience might suggest an
opportunity to improve quality of care
Patient factors
• Differing expectations of ‘involvement’
• Patient morbidity
Service factors
• Treating patients differently
• Treating patients the same
• Clustering of patients in ‘poorly performing’ practices
Measure artefact
• Confounding by other measured variables
• Confounding by unmeasured variables
Variation in reported experience

Placing our findings in a broader context
• Similar response patterns across a range of
items in GPPS
• National Cancer Patient Experience Survey
showed similar response patterns for gender,
age and deprivation but not ethnicity
• Sources of potential bias: survival, non-response,
etc.
• Construct validity of single item
Summary
• Substantial variation exists in experience of involvement
in care decision-making by age and ethnicity with
modest variation by socio-economic status
• This variation is not fully explained by confounding by
other socio-demographic factors or clustering of
different patient groups in certain practices
• A better understanding of the mechanisms
underlying these apparent disparities is needed to
improve the quality of patient experience of decision-
making in primary care