socio-economic impact assessment tools for climate change workshop
TRANSCRIPT

SOCIO-ECONOMIC IMPACT ASSESSMENT TOOLS FOR
CLIMATE CHANGE WORKSHOP
24 – 25 November 2008 Klana Resort, Seremban
Negeri Sembilan
Organised by: Institute for Environment and Development (LESTARI)
Universiti Kebangsaan Malaysia (UKM)
Supported by: Ministry of Natural Resources and Environment Malaysia
Second National Communications Project, United Nations Development Programme
Report
CONTENTS INTRODUCTION WORKSHOP PROCEEDINGS WORKSHOP OUTCOMES APPENDIX 1: Programme APPENDIX 2: List of Participants APPENDIX 3: Presentation Material INTRODUCTION The workshop on Socio-Economic Impact Assessment Tools for Climate Change was held from 24 to 25 November 2008 by the Socio-Economic Impacts and Responses Support Group (SEI&R-SG) chaired by Institute for Environment and Development (LESTARI), UKM. The workshop was supported by Ministry of Natural Resources and Environment Malaysia and Second National Communications Project, United Nations Development Programme (UNDP). The workshop was proposed and discussed by members during the fourth meeting of SEI&R-SG which was held on 10 October 2008 at LESTARI, UKM. Members agreed for a workshop to discuss specifically on the socio-economic impact assessment tools for climate change. The workshop also provided a platform for members to present the methodology application and challenges from different sectors. The workshop was attended by a total of 19 members.
1

WORKSHOP PROCEEDINGS The workshop was chaired by Raja Datuk Zaharaton Raja Zainal Abidin. Prof. Dr. Joy Jacqueline Pereira, LESTARI, UKM presented an overview of the structure and functions of the support group in her capacity as Chair of the Socio-Economic Impacts and Responses Support Group (SEI&R-SG). Prof. Dr. Joy then raised the issues and challenges pertaining to vulnerability and adaptation which are the main focus of the support group. Issues had been identified to be resolved in future research. Among the issues were conceptual method for sectoral analysis, approach to cross-sectoral analysis and relevance of anticipated outputs to policy and decision-makers. Different methodologies and case studies were presented by each sector. Energy sector had shared three methods for the economic impact analysis and national vulnerability and adaptation matrix of energy sector. Water sector presented the projected effects of climate change on water resources and suggestions for adaptation. It also shared case study on impacts in selected irrigation and domestic and industrial water users and analysis approach. Agricultural sector meanwhile specified types of crop chosen and data needed for the study. A framework for analysis was presented and three methodologies were identified for analysis. A more detailed research overview was presented from public health sector. The presentation outline the research objectives, research scope in accordance to WHO, research areas with their main economic activities, lists of data needed for different scopes of analysis, and methodologies and challenges. There were five study subjects identified for biodiversity sector. Therefore, presentation focused on the key variables, measurement and data collection for each study subject. An example regarding the impacts of climate change resulted the death of Rafflesia was presented. Meanwhile, forestry sector showcased the role and importance of forest and highlighted the impacts of climate change on forest. As for marine and coastal resources sector, the National Coastal Vulnerability Index Study was presented. An overview of the study was presented with focus on the socio-economic assessment. WORKSHOP OUTCOMES The outcomes of the workshop are listed below: 1. Framework for the report: Members of SEI&R-SG agreed with a reporting framework as
shown in Table I. The reporting framework will record not only the analysis process but also the gaps and constraint and recommendations for further actions to be taken.
2. Capacity needs and requirement: Members raised few concerns for further attention and
actions to facilitate the socio-economic assessment research in future. These included tools and software required for economic assessments in different sectors. Members are looking forward for future research collaboration and cooperation with relevant government agencies such as NAHRIM, Forestry Department, MARDI and national universities. In addition, the education, training and public awareness needs in future also rose by the members. Lastly, the financial sources and other assistances are concerns by members for them to undertaken the economic assessments research activities. All these issues are to be articulated in the report of the sub-group.
3. Discussion on Input-Output Model: Further discussion and relevant training on Input-
Output Model will be undertaken in future. The SEI&R-SG Chair will convene a meeting to discuss this matter as soon as feasible.
4. Finalisation of SEI&R-SG Report to NC2: The reports to be submitted from each sector
are currently compiled by SEI&R-SG Chair. A meeting will be arranged to meet and finalise the report with SEI&R-SG members. The economists for the sub-sectors are listed in Table II.
2

TABLE 1: REPORTING FRAMEWORK AND CONTENT Font: Times New Roman size 12; single spacing; borders 2.5cm 1. Sectoral Analysis
o Scope of vulnerability assessment [All agencies] – ½ page o Proposed conceptual approaches, methodology and tools [All agencies] – 2 pages
Procedures and arrangements to collect data [All agencies, if relevant] o Expected/Key findings [All agencies] – ½ page o Gaps and uncertainty analysis [All agencies] – ½ page
Limitations, challenges and issues o Capacity requirements [All agencies] – ½ page
Facilities and other resources, software, infrastructure o Research requirements [All agencies] – ½ page o Education, training and public awareness [All agencies, if any] – ½ page
Human resources o Information and networking [All agencies] – ½ page
Agencies/Stakeholders o Sources of financial, technical and capacity building support for National Communication
process [All agencies] – ½ page Existing monetary and in-kind contribution
o Proposed future projects requiring financial and other assistance [All agencies] – ½ page o Recommended good practice [All agencies] – ½ page
Coordination of physical and socio-economic aspects [Prof. Shahwahid] Planning for integration [LESTARI] Inter-agency collaboration [All agencies, if relevant]
o Action Plan [All agencies] – ½ page Activity (Potential implementer, timeline [immediate: 2009-2010; medium:
RMK10], budget) Priority works for key sectors
2. Cross Sectoral and Integrated Analysis [LESTARI] 3. National Procedural Manual [LESTARI]
o Background o Institutional arrangements
TABLE 2: ECONOMISTS FOR THE SUB-SECTORS
No. Sector Agency Economist
1. Water Resources Pn. Hj. Zalilah Selamat, NAHRIM
Prof. Dr. Shahwahid Hj. Othman, UPM
2. Agriculture Dr. Mohad Zabawi Abdul Ghani, MARDI
Prof. Chamhuri Siwar, LESTARI, UKM
3. Forestry Tn. Hj. Yusoff Muda, JPSM Pn. Tuan Marina bt. Tuan Ibrahim, JPSM
4. Public Health Dr. Lokman Hakim, IMR Dr. Er. Ah Choy, FSSK, UKM
5. Biodiversity Dr. Saw Leng Guan, FRIM Dr. Lim Hin Fui, FRIM
6. Energy En. Azman Zainal Abidin, PTM
Prof. Madya Dr. Abdul Hamid Jaafar, FEP, UKM
7. Marine and Coastal Resources
Pn. Siti Aishah Hashim, JPS
Dr. Rawshan Ara Begum, LESTARI, UKM
3

APPENDIX II: PROGRAMME
SOCIO-ECONOMIC IMPACT ASSESSMENT TOOLS FOR CLIMATE CHANGE
Date: 24 – 25 November 2008 Venue: Klana Resort, Seremban, Negeri Sembilan
24 November 2008
10.30 am Registration of Participants
11.00 am Welcoming Remarks
Chairperson: Raja Datuk Zaharaton Raja Zainal Abidin, Visiting Scholar LESTARI, UKM
An overview of the Socio-Economic Impacts and Responses Support Group – Prof. Dr. Joy Jacqueline Pereira, LESTARI, UKM
Socio-Economic Impact Assessment: Methodology and Challenges for the Energy Sector by Assoc. Prof. Dr. Abdul Hamid Jaafar, Faculty of Economics and Business, UKM
11.10 am –12.10 pm
Q & A
12.30 pm Lunch at Restaurant Selera CH
2.00 pm Check-in
Socio-Economic Impact Assessment: Methodology and Challenges for the Water Sector by Prof. Dr. Mohd. Shahwahid Hj. Othman, Graduate School of Management, UPM
Socio-Economic Impact Assessment: Methodology and Challenges for the Agriculture Sector by Dr. Mohamad Zabawi Abdul Ghani, Malaysian Agricultural Research and Development Institute (MARDI)
2.30 – 4.00 pm
Q & A
4.00 – 4.30 pm Coffee / Tea Break
Socio-Economic Impact Assessment: Methodology and Challenges for the Marine and Coastal Resources Sector by Dr. Rawshan Ara Begum, LESTARI, UKM
Socio-Economic Impact Assessment: Methodology and Challenges for the Public Health Sector by Dr. Er Ah Choy, Faculty of Social Sciences and Humanities, UKM
4.30 – 6.00 pm
Q & A
6.00 – 8.30 pm Break and Dinner at Restaurant Selera CH
Socio-Economic Impact Assessment: Methodology and Challenges for the Biodiversity Sector by Dr. Lim Hin Fui, Forest Research Institute Malaysia (FRIM)
8.30 – 10.00 pm Socio-Economic Impact Assessment: Methodology and Challenges for the Forestry Sector by Forestry Department of Peninsular Malaysia (JPSM)
10.30 pm Supper
4

25 November 2008
9.30 - 10.00 am Discussion 1:
Consolidation of scope and tools for socio-economic impact assessment
SEI&R-SG – NC2 Reporting Format
10.30 am Coffee / Tea Break
10.45 am – 12.30 pm
Discussion 2:
Recommendation for future research
Expansion of research network
12.30 pm Check-out and lunch
5

APPENDIX III: LIST OF SPEAKERS, TRAINER AND PARTICIPANTS
No. Name Organisation
Chairperson
1. Raja Datuk Zaharaton Raja Zainal Abidin
LESTARI, UKM
Participants
1. Prof. Dr. Joy Jacqueline Pereira
Ketua Kumpulan Sokongan Impak Sosio-Ekonomi dan Tindakan, LESTARI
3. Dr. Mohamad Zabawi Abdul Ghani
Institut Penyelidikan dan Kemajuan Pertanian Malaysia (MARDI)
4. Dr. Lim Hin Fui Institut Penyelidikan Perhutanan (FRIM)
5. Tuan Marina Bt. Tuan Ibrahim Jabatan Perhutanan Semenanjung Malaysia (JPSM)
6. Prof. Dr. Shahwahid Hj. Othman Graduate School of Management, Universiti Putra Malaysia (UPM)
7. Dr. Leela Anthony Institut Penyelidikan Perubatan (IMR)
8. Dr. Rawshan Ara Begum LESTARI, UKM
9. Dr. Er Ah Choy Fakulti Sains Sosial dan Kemanusiaan, UKM
10. Azman Zainal Abidin Pusat Tenaga Malaysia
11. Siti Indati Pusat Tenaga Malaysia
12. Radin Diana Pusat Tenaga Malaysia
13. Prof. Madya Dr. Abdul Hamid Jaafar
Fakulti Ekonomi dan Perniagaan, UKM
14. Siti Khadijah Bt. Abd. Rasaid Jabatan Pengairan dan Saliran Malaysia (JPS)
15. Norzilla Mohammed United Nations Development Programme (UNDP)
16. Zawina Bt. Ahmad NRE/UNDP – NC2 Project Assistant Coordinator
17. Tan Ching Tiong LESTARI, UKM
18. Koh Fui Pin LESTARI, UKM
19. Mohd. Khairul Zain Ismail LESTARI, UKM
6

1
SocioSocio--economic Impacts and economic Impacts and Responses Support Group: Responses Support Group:
An OverviewAn Overview
Joy Jacqueline PereiraJoy Jacqueline PereiraInstitute for Environment and Development (LESTARI) Institute for Environment and Development (LESTARI)
UniversitiUniversiti KebangsaanKebangsaan MalaysiaMalaysia
Climate Change –An Overview
Global Emissions of Greenhouse Gases (1)
Contributing Sectors in 2000
Global Emissions of Greenhouse Gases (2)
Contributing Countries (Cumulative, 1840-2004)
Global Emissions of Greenhouse Gases (3)
Snapshots of Top Emitters in 1990 & 2004
Top 30 CO2 emittersShare of World Total (%)
CO2 emm. (t CO2) per capita
1. US2. China8. UK
22. Thailand26. Malaysia
14. Indonesia
21.2
10.6
2.6
0.4
0.2
0.9
20.9
17.3
2.0
0.9
0.6
1.3
19.3
2.1
10.0
1.7
3.0
1.2
20.6
3.8
9.8
4.2
7.5
1.7
1990 2004 1990 2004
Strategies for MitigationStrategies for Mitigation
Mitigation example from Pakistan
2
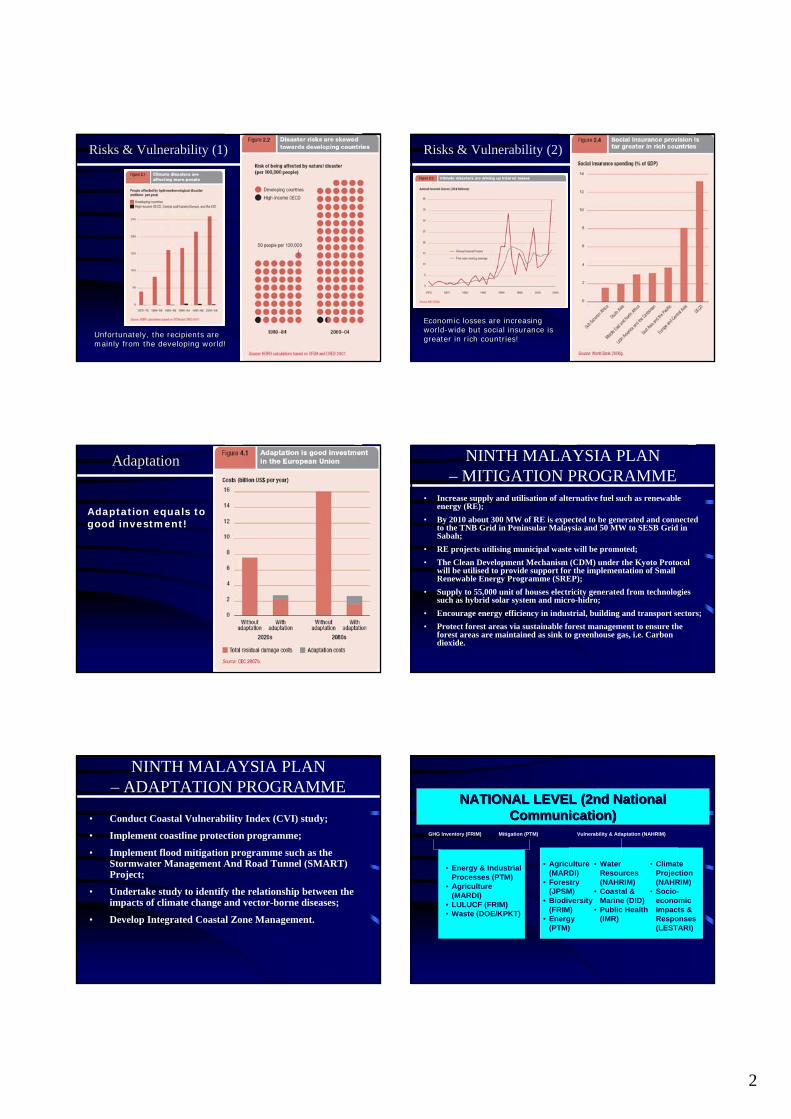
Risks & Vulnerability (1)
Unfortunately, the recipients are Unfortunately, the recipients are mainly from the developing world!mainly from the developing world!
Risks & Vulnerability (2)
Economic losses are increasing Economic losses are increasing worldworld--wide but social insurance is wide but social insurance is greater in rich countries!greater in rich countries!
Adaptation Adaptation
Adaptation equals to good investment!
NINTH MALAYSIA PLAN – MITIGATION PROGRAMME
• Increase supply and utilisation of alternative fuel such as renewableenergy (RE);
• By 2010 about 300 MW of RE is expected to be generated and connectedto the TNB Grid in Peninsular Malaysia and 50 MW to SESB Grid in Sabah;
• RE projects utilising municipal waste will be promoted;• The Clean Development Mechanism (CDM) under the Kyoto Protocol
will be utilised to provide support for the implementation of SmallRenewable Energy Programme (SREP);
• Supply to 55,000 unit of houses electricity generated from technologies such as hybrid solar system and micro-hidro;
• Encourage energy efficiency in industrial, building and transport sectors;• Protect forest areas via sustainable forest management to ensure the
forest areas are maintained as sink to greenhouse gas, i.e. Carbon dioxide.
NINTH MALAYSIA PLAN – ADAPTATION PROGRAMME
• Conduct Coastal Vulnerability Index (CVI) study;
• Implement coastline protection programme;
• Implement flood mitigation programme such as the Stormwater Management And Road Tunnel (SMART) Project;
• Undertake study to identify the relationship between the impacts of climate change and vector-borne diseases;
• Develop Integrated Coastal Zone Management.
NATIONAL LEVEL (2nd National NATIONAL LEVEL (2nd National Communication)Communication)
GHG Inventory (FRIM) Mitigation (PTM)
• Energy & Industrial Processes (PTM)
• Agriculture (MARDI)
• LULUCF (FRIM)• Waste (DOE/KPKT)
Vulnerability & Adaptation (NAHRIM)
• Agriculture (MARDI)
• Forestry (JPSM)
• Biodiversity (FRIM)
• Energy (PTM)
• Water Resources (NAHRIM)
• Coastal & Marine (DID)
• Public Health (IMR)
• Climate Projection (NAHRIM)
• Socio-economic Impacts & Responses (LESTARI)
3
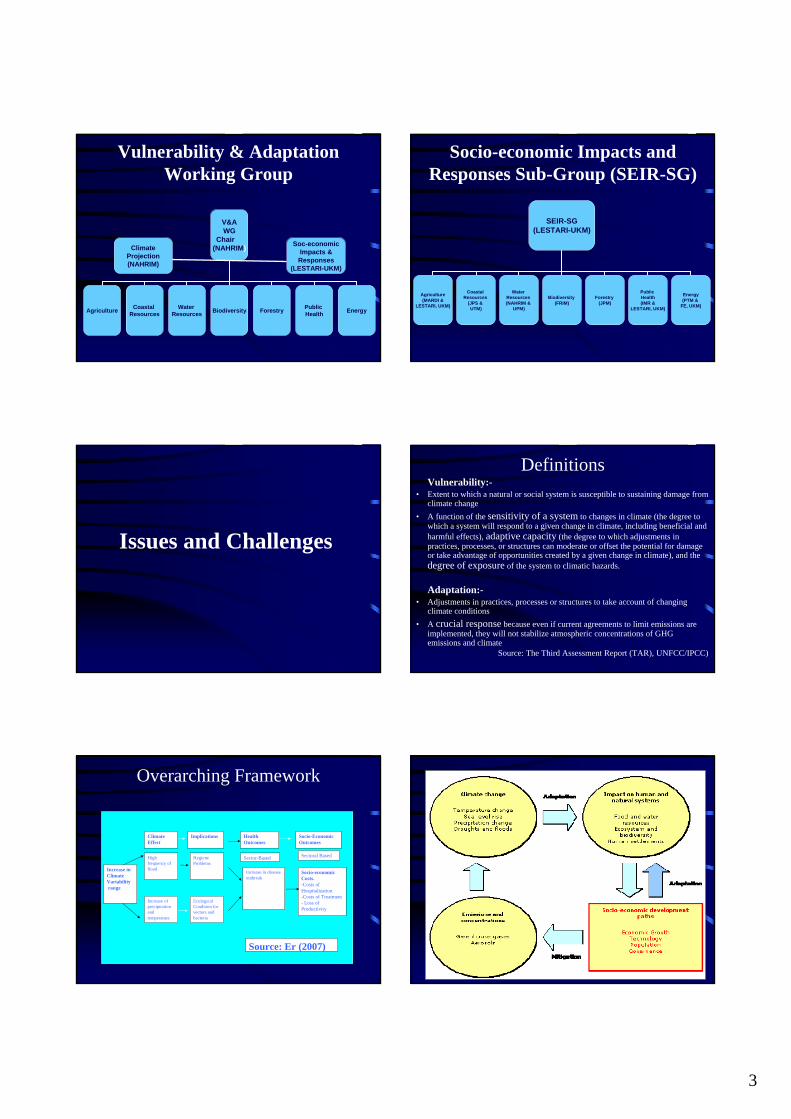
Vulnerability & Adaptation Working Group
V&AWG
Chair (NAHRIM)
Agriculture Water Resources
PublicHealthForestryBiodiversity EnergyCoastal
Resources
Soc-economic Impacts & Responses
(LESTARI-UKM)
Climate Projection(NAHRIM)
Socio-economic Impacts and Responses Sub-Group (SEIR-SG)
SEIR-SG(LESTARI-UKM)
Agriculture(MARDI &
LESTARI, UKM)
Water Resources (NAHRIM &
UPM)
Public Health(IMR &
LESTARI, UKM)
Forestry (JPM)
Biodiversity (FRIM)
Energy(PTM &
FE, UKM)
Coastal Resources
(JPS & UTM)
Issues and Challenges
DefinitionsVulnerability:-
• Extent to which a natural or social system is susceptible to sustaining damage from climate change
• A function of the sensitivity of a system to changes in climate (the degree to which a system will respond to a given change in climate, including beneficial and harmful effects), adaptive capacity (the degree to which adjustments in practices, processes, or structures can moderate or offset the potential for damage or take advantage of opportunities created by a given change in climate), and the degree of exposure of the system to climatic hazards.
Adaptation:-• Adjustments in practices, processes or structures to take account of changing
climate conditions • A crucial response because even if current agreements to limit emissions are
implemented, they will not stabilize atmospheric concentrations of GHG emissions and climate
Source: The Third Assessment Report (TAR), UNFCC/IPCC)
Overarching Framework
Increase in Climate Variabilityrange
High frequency of flood
Increase of precipitation and temperature
Hygiene Problems
Ecological Condition for vectors and bacteria
Increase in disease outbreak
Socio-economic Costs.-Costs of Hospitalization-Costs of Treatment- Loss of Productivity
Sector-Based Sectoral Based
ImplicationsClimate Effect
Health Outcomes
Socio-Economic Outcomes
Source: Er (2007)

4
Adaptive Capacity: Definition & Evolution of Understanding
• Adaptive capacity – ability of a system to:– Moderate the impacts– Take advantage of the opportunities– Cope with the consequences
• Evolution of understanding – links closely with vulnerability
– End-point approach– Starting-point approach
Source: Tan et al. (2008)
Adaptive Capacity: End-Point Approach• Design and implementation of adaptation:
– Future climate change– Vulnerability in biophysical factors
• Uncertainties in the approach:– Climate scenarios– Climatic effects on sectors– Future socio-economic conditions– Unknown if adaptive capacity assets will be drawn in
time of need
• Shortcomings: – Highly dependent on climate scenarios (CC may alter in
a different way than expected) adaptation measures may become inappropriate
Source: Tan et al. (2008)
Adaptive Capacity: Starting-Point Approach
• Adaptive capacity of the present’s system:– Socio-economic factors + Biophysical factors– Enhancing the present’s ability to respond to
stressors and secure livelihood
• Pro:– Practical for coping with changes and
uncertainties– Promote sustainable development– Facilitate cheaper adaptation strategies– Target the poor and vulnerable groups more
effectively Source: Tan et al. (2008)
Precipitation1990 2041 2050
2041
Soil Surface Temperature
1990 2050
Source: NAHRIM (2006)
Environmentally Sensitive Areas in Highlands of Selangor
Source: LESTARI (2006)
Climate Change – Additional Stressors to Existing Sensitivity?
Skala0 1 2 3 4 5 KM
PETUNJUK PENGELASANKEKERAPAN BANJIR
Jarang(1 - 4 Kejadian)
Sederhana kerap(5 - 7 Kejadian)
Kerap(8 - 10 Kejadian)
Sangat Kerap(11 - 15 Kejadian)
Sangatkerap11 – 15
Kg. Kebun Bunga, Batu Tiga, Tmn. Sri Muda, Kg. Paya JarasHulu & Bandar Baru Sg. Buloh
Kerap8 – 10Kg. Merbau Sempak, Kg. KubuGajah, Kg. Paya Jaras Hilit & Kg. Paya Jaras Tengah
Sederhanakerap5 – 7
Kg. Lembah Bina, Kg. Padang Jawa, Sg. Rasau, Kg. MelayuSubang, Bt. Kemuning, Kg. Jln. Kebun & Kg. Paya Jaras Dalam
Jarang1 – 4
Lebuhraya Persekutuan (Sg. Rasau), Jln. Subang Airport, Kg. Subang, Kg. Lanchong Jaya, Kg. Melayu Kebun Bunga, Tmn. Sri Kilat, Tmn. Maznah, Kg. Bukit Naga, Tmn. Rashna, Kg. Lombong, Kg. Baru Hicom, Kg. Baru Subang, Jln. Glenmarie, NKVE (Plaza Tol Shah Alam), NKVE (Batu Tiga), Shah Alam, Ladang Elmina, Kg. Sg. Pelong & Kg. Baru Sg. Buloh
Kekerapan(1990-98)
Bil. kejadianNama tempat
Sumber: Bachat, J. 2006
5
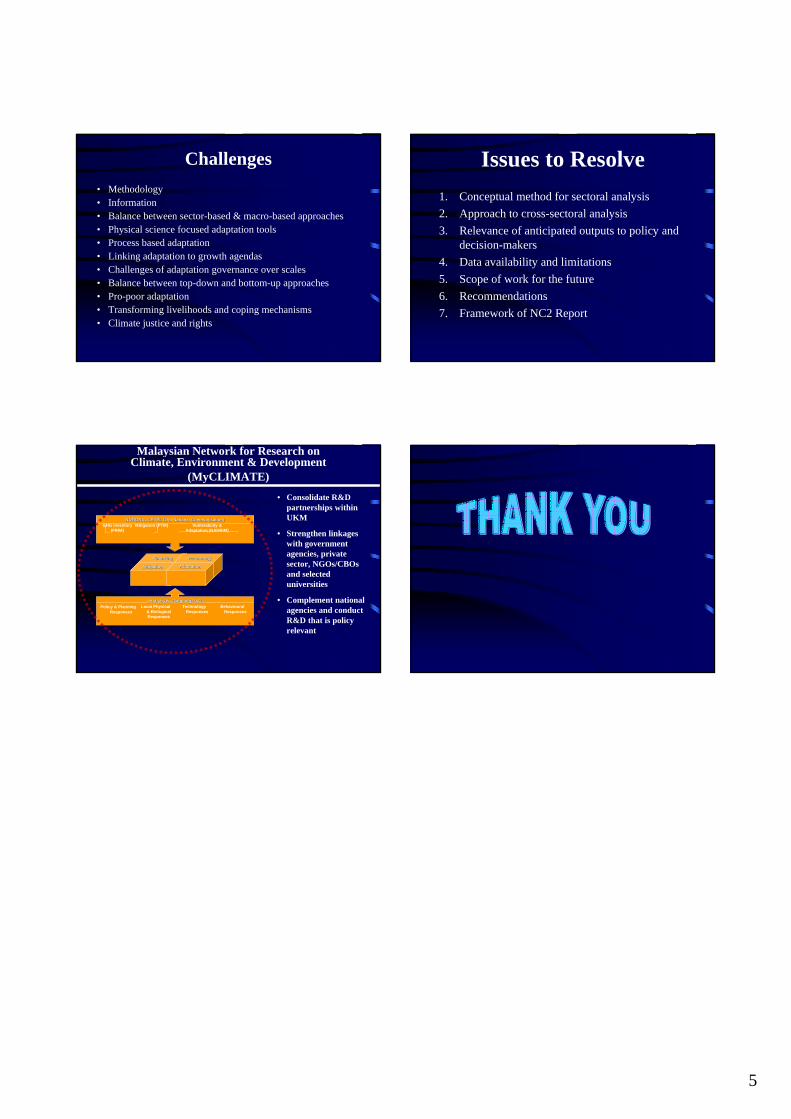
Challenges• Methodology• Information • Balance between sector-based & macro-based approaches• Physical science focused adaptation tools• Process based adaptation• Linking adaptation to growth agendas• Challenges of adaptation governance over scales• Balance between top-down and bottom-up approaches• Pro-poor adaptation• Transforming livelihoods and coping mechanisms• Climate justice and rights
1. Conceptual method for sectoral analysis2. Approach to cross-sectoral analysis3. Relevance of anticipated outputs to policy and
decision-makers 4. Data availability and limitations5. Scope of work for the future6. Recommendations 7. Framework of NC2 Report
Issues to Resolve
aaaFinancingFinancing TechnologyTechnology
MitigationMitigation AdaptationAdaptation
NATIONAL LEVEL (2nd National Communication)NATIONAL LEVEL (2nd National Communication)GHG Inventory
(FRIM)Mitigation (PTM) Vulnerability &
Adaptation (NAHRIM)
UKM LEVEL (Ongoing R&D)UKM LEVEL (Ongoing R&D)Policy & Planning
ResponsesLocal Physical
& Biological Responses
Technology Responses
Behavioural Responses
Malaysian Network for Research on Climate, Environment & Development
(MyCLIMATE)
• Consolidate R&D partnerships within UKM
• Strengthen linkages with government agencies, private sector, NGOs/CBOsand selected universities
• Complement national agencies and conduct R&D that is policy relevant

1
SOCIO-ECONOMIC IMPACT ASSESSMENT : METHODOLOGY
AND CHALLENGES FOR THE FORESTRY SECTOR
TUAN MARINA BT TUAN IBRAHIMFORESTRY DEPARTMENT PENINSULAR MALAYSIA
BY
JABATAN PERHUTANAN SEMENANJUNG MALAYSIAJABATAN PERHUTANAN SEMENANJUNG MALAYSIAJALAN SULTAN SALAHUDDIN, 50660 KUALA LUMPURJALAN SULTAN SALAHUDDIN, 50660 KUALA LUMPUR
TEL :03 26164488 FAX:03 26925657TEL :03 26164488 FAX:03 26925657
FOREST – FAO DEFINITONFOREST TYPEFUNCTION OF THE FORESTFOREST AREATHE ROLE OF FORESTIMPACT OF ECONOMY FORESTRY
OUTLINE
JABATAN PERHUTANAN SEMENANJUNG MALAYSIAJABATAN PERHUTANAN SEMENANJUNG MALAYSIAJALAN SULTAN SALAHUDDIN, 50660 KUALA LUMPURJALAN SULTAN SALAHUDDIN, 50660 KUALA LUMPUR
TEL :03 26164488 FAX:03 26925657TEL :03 26164488 FAX:03 26925657
Land with tree crown cover of more than 10 percent and area of more 0.5 hectares (ha). The trees should be able to reach a minimum height of 5 meters (m) at maturity in situ. May consist either of closed forest formations where trees of various storeysand undergrowth cover a high proportion of ground; or open forest formation with a continuous vegetation cover in which tree crown exceeds 10 percent. Young natural sands and all plantations established for forestry purposes which have yet to reach a crown density of percent of tree height of 5m are included under forest, as are areas normally forming part of theforest area which are temporarily unstocked as a result of umanintervention or natural causes but which are expected to reventforest.
FOREST – FAO DEFINITION
JABATAN PERHUTANAN SEMENANJUNG MALAYSIAJABATAN PERHUTANAN SEMENANJUNG MALAYSIAJALAN SULTAN SALAHUDDIN, 50660 KUALA LUMPURJALAN SULTAN SALAHUDDIN, 50660 KUALA LUMPUR
TEL :03 26164488 FAX:03 26925657TEL :03 26164488 FAX:03 26925657
FOREST TYPE
JABATAN PERHUTANAN SEMENANJUNG MALAYSIAJABATAN PERHUTANAN SEMENANJUNG MALAYSIAJALAN SULTAN SALAHUDDIN, 50660 KUALA LUMPURJALAN SULTAN SALAHUDDIN, 50660 KUALA LUMPUR
TEL :03 26164488 FAX:03 26925657TEL :03 26164488 FAX:03 26925657
FOREST FUNCTION
PRODUCTIVE FORESTTimber production forest
PROTECTIVE FORESTSoil Protection ForestSoil Reclamation ForestFlood Control ForestWater Catchments Forest
JABATAN PERHUTANAN SEMENANJUNG MALAYSIAJABATAN PERHUTANAN SEMENANJUNG MALAYSIAJALAN SULTAN SALAHUDDIN, 50660 KUALA LUMPURJALAN SULTAN SALAHUDDIN, 50660 KUALA LUMPUR
TEL :03 26164488 FAX:03 26925657TEL :03 26164488 FAX:03 26925657
AMENITY FORESTForest Sanctuary for WildlifeVirgin Jungle ReservesAmenity ForestEducation ForestResearch ForestForest for Federal Purposes
JABATAN PERHUTANAN SEMENANJUNG MALAYSIAJABATAN PERHUTANAN SEMENANJUNG MALAYSIAJALAN SULTAN SALAHUDDIN, 50660 KUALA LUMPURJALAN SULTAN SALAHUDDIN, 50660 KUALA LUMPUR
TEL :03 26164488 FAX:03 26925657TEL :03 26164488 FAX:03 26925657
2
5,841,195Total
700,574Wildlife Reserve
444,991Stateland
469,630Permanent Reserved Forest
HectareLand Area
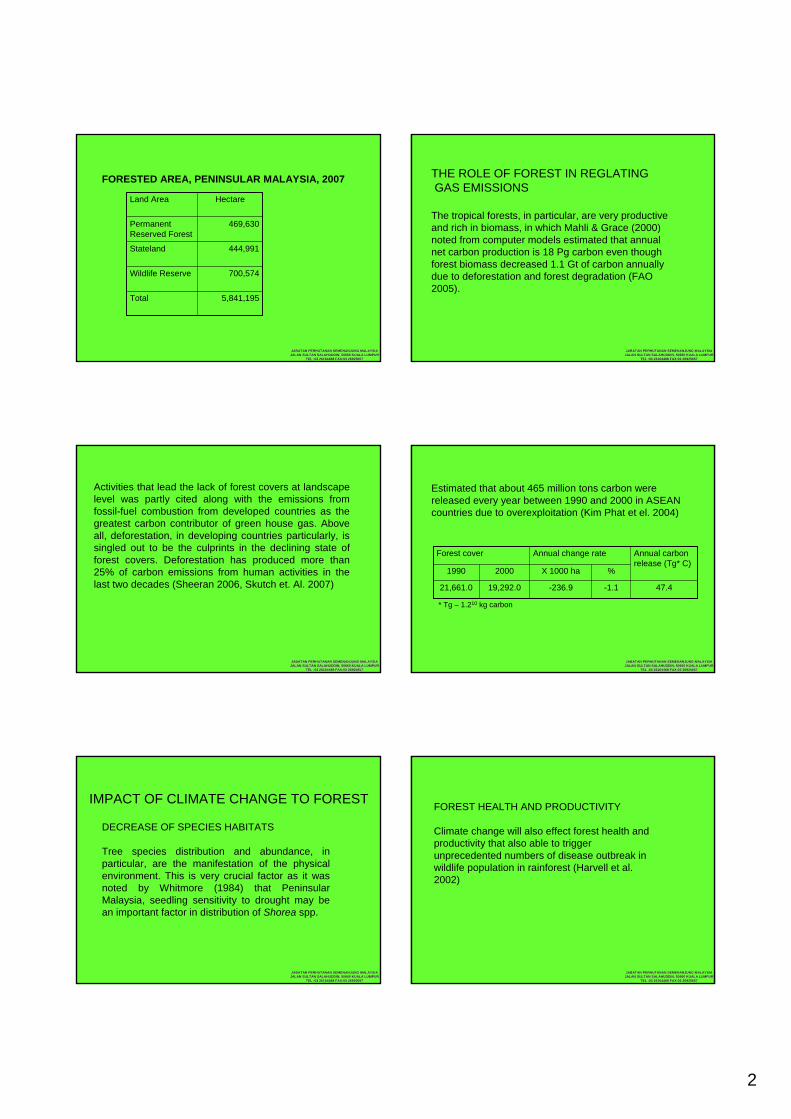
FORESTED AREA, PENINSULAR MALAYSIA, 2007
JABATAN PERHUTANAN SEMENANJUNG MALAYSIAJABATAN PERHUTANAN SEMENANJUNG MALAYSIAJALAN SULTAN SALAHUDDIN, 50660 KUALA LUMPURJALAN SULTAN SALAHUDDIN, 50660 KUALA LUMPUR
TEL :03 26164488 FAX:03 26925657TEL :03 26164488 FAX:03 26925657
THE ROLE OF FOREST IN REGLATINGGAS EMISSIONS
The tropical forests, in particular, are very productive and rich in biomass, in which Mahli & Grace (2000) noted from computer models estimated that annual net carbon production is 18 Pg carbon even though forest biomass decreased 1.1 Gt of carbon annually due to deforestation and forest degradation (FAO 2005).
JABATAN PERHUTANAN SEMENANJUNG MALAYSIAJABATAN PERHUTANAN SEMENANJUNG MALAYSIAJALAN SULTAN SALAHUDDIN, 50660 KUALA LUMPURJALAN SULTAN SALAHUDDIN, 50660 KUALA LUMPUR
TEL :03 26164488 FAX:03 26925657TEL :03 26164488 FAX:03 26925657
Activities that lead the lack of forest covers at landscape level was partly cited along with the emissions from fossil-fuel combustion from developed countries as the greatest carbon contributor of green house gas. Above all, deforestation, in developing countries particularly, is singled out to be the culprints in the declining state of forest covers. Deforestation has produced more than 25% of carbon emissions from human activities in the last two decades (Sheeran 2006, Skutch et. Al. 2007)
JABATAN PERHUTANAN SEMENANJUNG MALAYSIAJABATAN PERHUTANAN SEMENANJUNG MALAYSIAJALAN SULTAN SALAHUDDIN, 50660 KUALA LUMPURJALAN SULTAN SALAHUDDIN, 50660 KUALA LUMPUR
TEL :03 26164488 FAX:03 26925657TEL :03 26164488 FAX:03 26925657
Estimated that about 465 million tons carbon were released every year between 1990 and 2000 in ASEAN countries due to overexploitation (Kim Phat et el. 2004)
47.4-1.1-236.919,292.021,661.0
%X 1000 ha20001990
Annual carbon release (Tg* C)
Annual change rateForest cover
* Tg – 1.210 kg carbon
JABATAN PERHUTANAN SEMENANJUNG MALAYSIAJABATAN PERHUTANAN SEMENANJUNG MALAYSIAJALAN SULTAN SALAHUDDIN, 50660 KUALA LUMPURJALAN SULTAN SALAHUDDIN, 50660 KUALA LUMPUR
TEL :03 26164488 FAX:03 26925657TEL :03 26164488 FAX:03 26925657
IMPACT OF CLIMATE CHANGE TO FOREST
DECREASE OF SPECIES HABITATS
Tree species distribution and abundance, in particular, are the manifestation of the physical environment. This is very crucial factor as it was noted by Whitmore (1984) that Peninsular Malaysia, seedling sensitivity to drought may be an important factor in distribution of Shorea spp.
JABATAN PERHUTANAN SEMENANJUNG MALAYSIAJABATAN PERHUTANAN SEMENANJUNG MALAYSIAJALAN SULTAN SALAHUDDIN, 50660 KUALA LUMPURJALAN SULTAN SALAHUDDIN, 50660 KUALA LUMPUR
TEL :03 26164488 FAX:03 26925657TEL :03 26164488 FAX:03 26925657
FOREST HEALTH AND PRODUCTIVITY
Climate change will also effect forest health and productivity that also able to trigger unprecedented numbers of disease outbreak in wildlife population in rainforest (Harvell et al. 2002)
JABATAN PERHUTANAN SEMENANJUNG MALAYSIAJABATAN PERHUTANAN SEMENANJUNG MALAYSIAJALAN SULTAN SALAHUDDIN, 50660 KUALA LUMPURJALAN SULTAN SALAHUDDIN, 50660 KUALA LUMPUR
TEL :03 26164488 FAX:03 26925657TEL :03 26164488 FAX:03 26925657

3
GROWTH AND YIELD
The alteration of physiological processes in trees and soil, influencing growth and yield forest over time. The relative loss of tree growth will be less if precipitation is reduced and increased of temperature (Andalo et. Al. 2005) On the other hand, Fearnside (2004) cited that night time temperatures are critical in La Selva Research Station in Costa Rica, whereby tree growth is less in hot years.
JABATAN PERHUTANAN SEMENANJUNG MALAYSIAJABATAN PERHUTANAN SEMENANJUNG MALAYSIAJALAN SULTAN SALAHUDDIN, 50660 KUALA LUMPURJALAN SULTAN SALAHUDDIN, 50660 KUALA LUMPUR
TEL :03 26164488 FAX:03 26925657TEL :03 26164488 FAX:03 26925657
IMPACT OF THE ECONOMY FORESTRY
Economic analyses for several different climate scenarios indicate that forest productivity and yield are likely to have and impact. It also envisaged that changes in climate and consequent impact of forests are likely to change market incentives to harvest and plant trees.
JABATAN PERHUTANAN SEMENANJUNG MALAYSIAJABATAN PERHUTANAN SEMENANJUNG MALAYSIAJALAN SULTAN SALAHUDDIN, 50660 KUALA LUMPURJALAN SULTAN SALAHUDDIN, 50660 KUALA LUMPUR
TEL :03 26164488 FAX:03 26925657TEL :03 26164488 FAX:03 26925657
IMPACT OF THE ECONOMY FORESTRY
XLocal community
XForest Area
XForest Recreation
XXWater and water catchment
XWildlife
INDIRECT IMPACT
XGrowth and Yield
XHealth and Productivity
XSpecies habitatLONG-TERMSHORT-TERMDIRECT IMPACT
JABATAN PERHUTANAN SEMENANJUNG MALAYSIAJABATAN PERHUTANAN SEMENANJUNG MALAYSIAJALAN SULTAN SALAHUDDIN, 50660 KUALA LUMPURJALAN SULTAN SALAHUDDIN, 50660 KUALA LUMPUR
TEL :03 26164488 FAX:03 26925657TEL :03 26164488 FAX:03 26925657
IMPACT OF THE ECONOMY FORESTRY
Travel cost MethodForest Recreation
Residual Value TechniqueInventoryForest Area
Market Based ApproachLocal community
Residual MethodProductivity SurveyWater and water catchment
Market Based ApproachInventoryWildlife
INDIRECT IMPACT
Stumpage ValueInventoryGrowth and Yield
Change in Productivity Approach
Productivity SurveyHealth and Productivity
Stumpage ValueInventorySpecies habitatMonitoring Impact StudyPhysical Impact StudyDIRECT IMPACT
APPROACH VALUING
JABATAN PERHUTANAN SEMENANJUNG MALAYSIAJABATAN PERHUTANAN SEMENANJUNG MALAYSIAJALAN SULTAN SALAHUDDIN, 50660 KUALA LUMPURJALAN SULTAN SALAHUDDIN, 50660 KUALA LUMPUR
TEL :03 26164488 FAX:03 26925657TEL :03 26164488 FAX:03 26925657
IO MULTIPLIER
OUTPUT MULTIPLIER
INCOME MULTIPLIER
EMPLOYMENT MULTIPLIER
JABATAN PERHUTANAN SEMENANJUNG MALAYSIAJABATAN PERHUTANAN SEMENANJUNG MALAYSIAJALAN SULTAN SALAHUDDIN, 50660 KUALA LUMPURJALAN SULTAN SALAHUDDIN, 50660 KUALA LUMPUR
TEL :03 26164488 FAX:03 26925657TEL :03 26164488 FAX:03 26925657
Table 1. List of Forest Resources by Major Categories
Microclimate regulationCarbon sequestrationRecreationSoil protectionWatershed protectionAsthetic/amenityWildlife habitatHuman habitatSecurityLandscapeGenetic conservation areasLand physical structurePollinationNutrient cyclingAir pollution controlNoise pollution controlSeed dispersalShoreline stabilizationSediment retentionWater transportCultural heritageNatural museumArboretumGames/huntingResearchEducationTraining
TimberRattanBambooMedicinal plantsFruitsNutsVegetablesFibre/ThatchOrnamentalLatex/ResinDyes/TanninsFeed plants (fodder)Occult magicFuelwood/polesEssential oilsVegetable oilsHoneyClimbersWaterWildlifeMineralsGenetic resourcesForest seedlingsSeedsPalms
Forest ServicesForest Goods
JABATAN PERHUTANAN SEMENANJUNG MALAYSIAJABATAN PERHUTANAN SEMENANJUNG MALAYSIAJALAN SULTAN SALAHUDDIN, 50660 KUALA LUMPURJALAN SULTAN SALAHUDDIN, 50660 KUALA LUMPUR
TEL :03 26164488 FAX:03 26925657TEL :03 26164488 FAX:03 26925657

4
Contingent valuation method (CVM) and Choice Model (CM)
Stated PreferenceConservation value (option and existence)
Residual Value Technique/Ethnobotanical technique
Market-basedLocal community dependence on forest (including orang asli)
Residual Value Technique/CVMMarket-based/Stated PreferenceInsect and Honey
Residual Value Technique/CVMMarket-based/Stated PreferenceWildlife
Travel Cost MethodRevealed PreferenceRecreation areas
Residual Value Technique/CVMMarket-based/Stated PreferenceWater (as commodity)
Residual Value Technique/CVMMarket-based/Stated PreferenceOrnamental plants
Residual Value TechniqueMarket-basedKaras/Gaharu
Residual Value TechniqueMarket-basedKeruing Oil
Residual Value TechniqueMarket-basedFruit Trees
Residual Value TechniqueMarket-basedMedicinal Plants
Residual Value TechniqueMarket-basedBamboo
Residual Value TechniqueMarket-basedRattan
Residual Value TechniqueMarket-basedTimber
TechniqueApproachForest Goods/Services
Forest Goods and Services and Valuation Methods
JABATAN PERHUTANAN SEMENANJUNG MALAYSIAJABATAN PERHUTANAN SEMENANJUNG MALAYSIAJALAN SULTAN SALAHUDDIN, 50660 KUALA LUMPURJALAN SULTAN SALAHUDDIN, 50660 KUALA LUMPUR
TEL :03 26164488 FAX:03 26925657TEL :03 26164488 FAX:03 26925657
JABATAN PERHUTANAN SEMENANJUNG MALAYSIAJABATAN PERHUTANAN SEMENANJUNG MALAYSIAJALAN SULTAN SALAHUDDIN, 50660 KUALA LUMPURJALAN SULTAN SALAHUDDIN, 50660 KUALA LUMPUR
TEL :03 26164488 FAX:03 26925657TEL :03 26164488 FAX:03 26925657
1
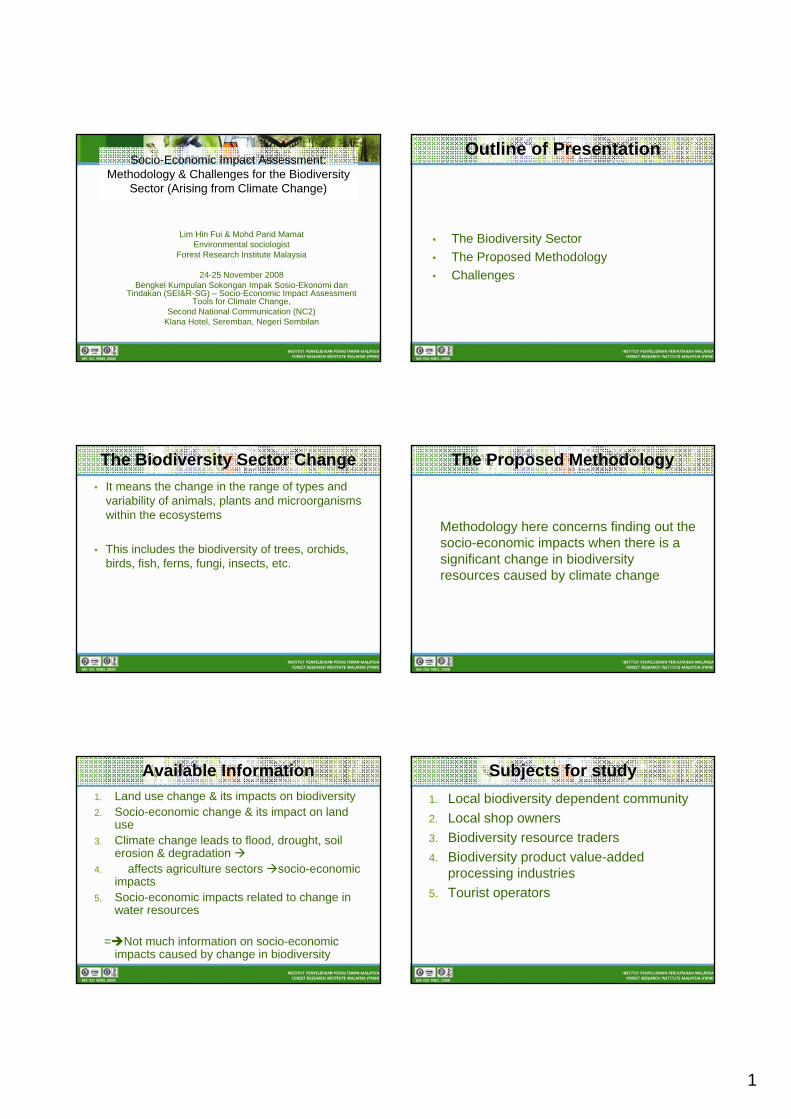
Socio-Economic Impact Assessment: Methodology & Challenges for the Biodiversity
Sector (Arising from Climate Change)
Lim Hin Fui & Mohd Parid MamatEnvironmental sociologist
Forest Research Institute Malaysia
24-25 November 2008Bengkel Kumpulan Sokongan Impak Sosio-Ekonomi dan
Tindakan (SEI&R-SG) – Socio-Economic Impact Assessment Tools for Climate Change,
Second National Communication (NC2)Klana Hotel, Seremban, Negeri Sembilan
Outline of Presentation
• The Biodiversity Sector• The Proposed Methodology• Challenges
The Biodiversity Sector Change• It means the change in the range of types and
variability of animals, plants and microorganisms within the ecosystems
• This includes the biodiversity of trees, orchids, birds, fish, ferns, fungi, insects, etc.
The Proposed Methodology
Methodology here concerns finding out the socio-economic impacts when there is a significant change in biodiversity resources caused by climate change
Available Information1. Land use change & its impacts on biodiversity2. Socio-economic change & its impact on land
use3. Climate change leads to flood, drought, soil
erosion & degradation 4. affects agriculture sectors socio-economic
impacts5. Socio-economic impacts related to change in
water resources
= Not much information on socio-economic impacts caused by change in biodiversity
Subjects for study1. Local biodiversity dependent community2. Local shop owners3. Biodiversity resource traders4. Biodiversity product value-added
processing industries5. Tourist operators

2
Initial Task
• Identifying the extent of the 5 target groups
1. local community, 2. local shop owners, 3. traders, 4. industries, 5. tourist operators
Rapid Rural Appraisal
A quick way of data collection to have a general overall views of:
1. The socio-economic conditions of a target group & its environment2. The socio-impacts of change in biodiversity
Sampling
• Selecting the number to be study(a) Small number of subject – census(b) Big number of subject – sampling based on some knowledge of the characteristics of the population being sampled
Key Variables, Measurement
A. Local biodiversity dependent communities1. Occupation (harvesters)2. Employment status (employer, self-employed, 3. employee, unpaid family worker)4. Use of biodiversity resources (subsistence, sale or both)5. Yield of products (Quantity) & Price (RM/unit)6. Income (cash & non-cash)7. Rural-urban migration (number of out-migrants)8. Remittance (RM)9. Poverty (per capita income poverty line)10. Loss of traditional knowledge (frequency use of medicine)
Methods of Data Collection
• Socio-economic survey or census
• Field observation on community as a whole& households
Key Variables, Measurement
B. Local shop owners1. Employment of workers2. Sales & profits3. Income of workers4. Poverty (per capita income poverty line)

3
Methods of Data Collection
1. Socio-economic survey or census
2. Field observation on community as a whole& households
Key Variables, Measurement & Data Collection
C. Biodiversity product traders1. Yield of products (Quantity)2. Price (RM/unit)3. Gross income (RM)4. Net profit (RM)
Method of data collection: 1. Socio-economic survey on traders
Key Variables, Measurement & Data Collection
D. Resource-dependent down-stream processing industries1. Employment (number of workers employed)2. Biodiversity materials supplied (quantity) & price (RM)3. Annual sale (RM)4. Net profit (RM)5. Income per worker (RM)
Method of data collection: Socio-economic survey on (a) biodiversity resource processing industries(b) workers
E. Local tourist operators1. Employment (Number of workers employed)2. Visitors (Number of visitors)3. Annual sale (RM)4. Net profit of operators (RM)5. Income tourism guides (RM)
Method of data collection: Socio-economic survey & field observation on
(a) tourist operators(b) tourist guides
Data collectionOption 1:If there is a base year data, use it to compare with the
current research data, where appropriate.Option 2:If there is no relevant base year data, then gather time
series data (actual or estimated) from the socio-economic survey
Option 3:If time is not a constraint, make comparison between
current year data with data to gather in the future, assuming that climate change is expected to continually affecting biodiversity change.
Primary Reference period
Last 12 months

4
Multiplier Effects
Change in BioD
Reduced income of villagers
Impacts on other sectors of economy(retail trade, transportation, agriculture investment)
ExampleHow change in climate results in the death of
Rafflesia spp in a particular forest reserve
1. Income to indigenous peoples harvesting Rafflesia for own use and for sale
2. Employment and income of indigenous peoples and tour operators running business by bringing tourists to the Raffesia site
3. Income and employment of factories processing Rafflesia
4. Income of local sundry shops5. Multiplier effects on local agriculture investment
Challenges
Difficulty in obtaining cooperation from traders and industriesMeasurement of multiplier effectsLack of secondary data
Thank You
MAY ALL OF US BE HAPPY & HEALTHY
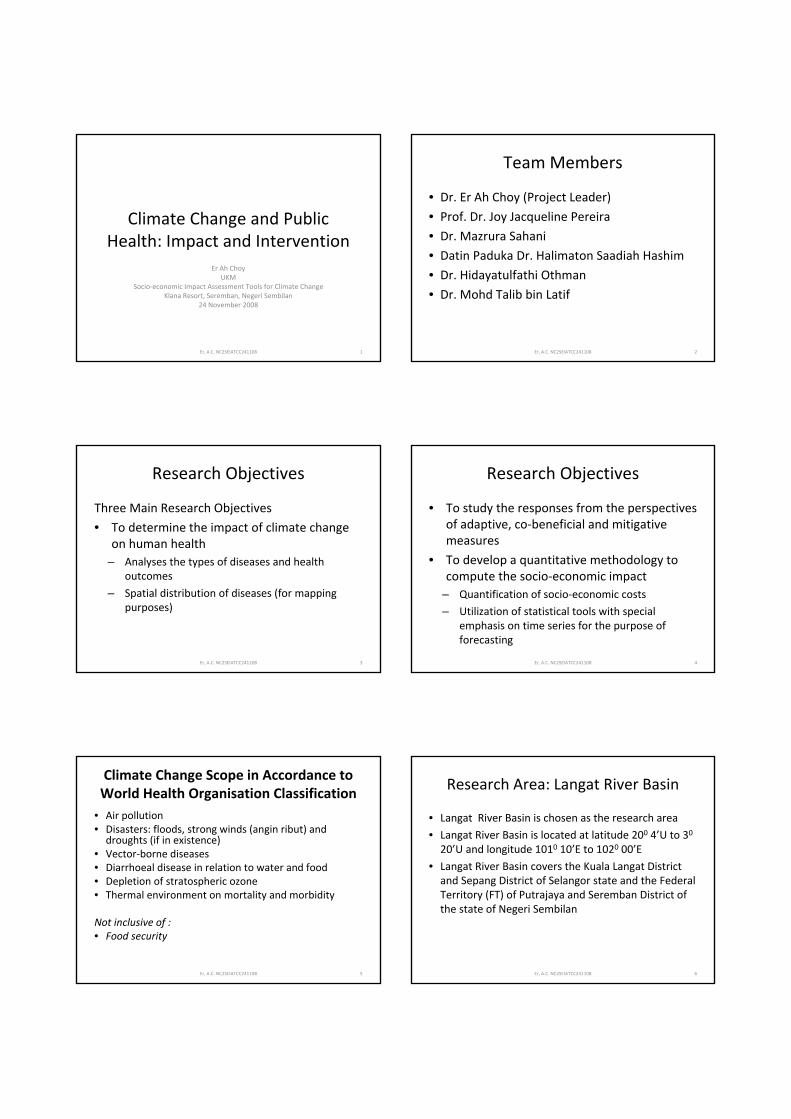
Climate Change and Public Health: Impact and Intervention
Er Ah Choy UKM
Socio‐economic Impact Assessment Tools for Climate ChangeKlana Resort, Seremban, Negeri Sembilan
24 November 2008
Er, A.C. NC2SEIATCC241108 1
Team Members
• Dr. Er Ah Choy (Project Leader)
• Prof. Dr. Joy Jacqueline Pereira
• Dr. Mazrura Sahani
• Datin Paduka Dr. Halimaton Saadiah Hashim
• Dr. Hidayatulfathi Othman
• Dr. Mohd Talib bin Latif
Er, A.C. NC2SEIATCC241108 2
Research Objectives
Three Main Research Objectives
• To determine the impact of climate change on human health
– Analyses the types of diseases and health outcomes
– Spatial distribution of diseases (for mapping purposes)
Er, A.C. NC2SEIATCC241108 3
Research Objectives
• To study the responses from the perspectives of adaptive, co‐beneficial and mitigative measures
• To develop a quantitative methodology to compute the socio‐economic impact
– Quantification of socio‐economic costs
– Utilization of statistical tools with special emphasis on time series for the purpose of forecasting
Er, A.C. NC2SEIATCC241108 4
Climate Change Scope in Accordance to World Health Organisation Classification
• Air pollution• Disasters: floods, strong winds (angin ribut) and droughts (if in existence)
• Vector‐borne diseases• Diarrhoeal disease in relation to water and food• Depletion of stratospheric ozone• Thermal environment on mortality and morbidity
Not inclusive of :• Food security
Er, A.C. NC2SEIATCC241108 5
Research Area: Langat River Basin
• Langat River Basin is chosen as the research area
• Langat River Basin is located at latitude 200 4’U to 30
20’U and longitude 1010 10’E to 1020 00’E
• Langat River Basin covers the Kuala Langat District and Sepang District of Selangor state and the Federal Territory (FT) of Putrajaya and Seremban District of the state of Negeri Sembilan
Er, A.C. NC2SEIATCC241108 6

Research Area: Langat River Basin
Amongst the main economic activities:• Agriculture• Manufacturing• Housing• Commercial inclusive of wholesaling and retailing• Aviation hub• IT hub• Higher education and training
Er, A.C. NC2SEIATCC241108 7
Health‐Related Socio‐economic Costing as a Result of Air Pollution
Specific Environmental Data Required:
– Air Pollutant Index (API)
Diseases, patients, social & economic costs’ data required:
– Types of diseases for each district/FT
– Total number of patients per disease per district/FT
– Medical costs per disease per district/FT
– Medical leave granted per disease per district/FT
– Other economic costs that can be quantified per disease per district/FT
– Social costs that can be quantified per disease per district/FT
Er, A.C. NC2SEIATCC241108 8
Health‐Related Socio‐economic Costing as a Result of Disasters: Floods and Droughts (if in existence)
Specific Environmental Data Required:
• Total rainfall per district/FT
• Affected Areas – for the purpose of mapping– Floods
– Droughts
• Value of properties destroyed
• Value of furniture and fitting destroyed
• Emergency leave
Diseases, patients, social & economic costs’ data required:
– Types of diseases for each district/FT
– Total number of patients per disease per district/FT
– Medical costs per disease per district/FT
– Medical leave granted per disease per district/FT
– Other economic costs that can be quantified per disease per district/FT
– Social costs that can be quantified per disease per district/FT
Er, A.C. NC2SEIATCC241108 9
Health Related Socio‐economic Costing as a Result of Vector‐Borne Diseases
Specific Environmental Data Required:
• Areas infected by dengue, malaria and chikungungya –for mapping purposes
• Temperature, humidity, rainfall and soil humidity (if in existence) per district/FT
Diseases, patients, social & economic costs’ data required:
– Types of diseases for each district/FT
– Total number of patients per disease per district/FT
– Medical costs per disease per district/FT
– Medical leave granted per disease per district/FT
– Other economic costs that can be quantified per disease per district/FT
– Social costs that can be quantified per disease per district/FT
Er, A.C. NC2SEIATCC241108 10
Health‐Related Socio‐economic Costing as a Result of Water‐Borne and Food‐Borne Diseases
Specific Environmental Data Required:
• Temperature and rainfall per district/FT
Diseases, patients, social and economic costs’data required:
– Types of diseases for each district/FT
– Total number of patients per disease per district/FT
– Medical costs per disease per district/FT
– Medical leave granted per disease per district/FT
– Other economic costs that can be quantified per disease per district/FT
– Social costs that can be quantified per disease per district/FT
Er, A.C. NC2SEIATCC241108 11
Health‐Related Socio‐economic Costing as a Result of Depletion of Stratospheric Ozone
Specific Environmental Data Required:
• Ground‐level ultra‐violet radiation– If not in existence, a proxy
needs to be developed• (e.g. temperature above a particular level/sunlight hours)
Diseases, patients, social & economic costs’ data required:
– Types of diseases for each district/FT
– Total number of patients per disease per district/FT
– Medical costs per disease per district/FT
– Medical leave granted per disease per district/FT
– Other economic costs that can be quantified per disease per district/FT
– Social costs that can be quantified per disease per district/FT
Er, A.C. NC2SEIATCC241108 12

Health‐Related Socio‐economic Costing as a Result of Thermal Temperature On Mortality and Morbidity
Specific Environmental Data Required:
• Temperature per district /FT
Diseases, patients, social and economic costs’ data required:
– Types of diseases for each district/FT
– Total number of patients per disease per district/FT
– Medical costs per disease per district/FT
– Medical leave granted per disease per district/FT
– Other economic costs that can be quantified per disease per district/FT
– Social costs that can be quantified per disease per district/FT
Er, A.C. NC2SEIATCC241108 13
Statistical Methods and Quantification of Socio‐economic Costs
• Time series data will be used for forecasting
• Costs of illness (COI) method employed for mortality and morbidity:
– Direct expenses (hospital, doctors, medicines, etc.)
– Opportunity costs (loss of earnings/productivity, etc.)
– Disability‐adjusted life years (DALYs) • if data is available for the whole Langat River Basin
• Preventative costs employed for adaptive measures (to be discussed later)
• If existing data is not available in Malaysia or accessible to the researcher, a proxy will be developed.
Er, A.C. NC2SEIATCC241108 14
Definition of Adaptation
• Adaptation– Adjustment in natural or human system in response to actual or expected climatic stimuli or their effects which moderates harm or exploits beneficial opportunities. Various types of adaptation can be distinguished, including anticipatory and reactive adaptation, private and public adaptation, and autonomous and planned adaptation (IPCC, FAR 2007).
– Actions taken to help communities and ecosystems cope with changing climate conditions (website UNFCCC Secretariat).
Er, A.C. NC2SEIATCC241108 15
Mapping
• Utilization of GIS to map temporal and spatial distribution of diseases as a result of climate change.
Er, A.C. NC2SEIATCC241108 16
Implementation Challenges
• Challenges of secondary data acquisition for diseases– Time‐line data for the various diseases
• Fairly complete for vector‐borne diseases
• For other diseases, collation of data requires a heavy input with possibility of missing data
• Missing data requires specific statistical techniques
• Developing appropriate proxies might entail a wide literature review of outside and within Malaysia.
– The proxies developed will have to take into account peculiarities in Malaysia
Er, A.C. NC2SEIATCC241108 17
Implementation Challenges
• Challenges of secondary data acquisition for environmental variables
• Time‐line data for the various environmental variables
• Air Pollutant Indices data are complete and available
• Other environmental variables may not be complete or as complete with heavy input required for data collation
• Missing data requires specific statistical techniques
Er, A.C. NC2SEIATCC241108 18

Implementation Challenges
• Challenges of secondary data acquisition for environmental variables (cont.)
• Developing appropriate proxies might entail a wide literature review of outside and within Malaysia
– The proxies developed will have to take into account the peculiarities in Malaysia
Er, A.C. NC2SEIATCC241108 19

Socio-Economic Impact Assessment: Methodology and Challenges for the Marine and Coastal Resources Sector
Dr. Rawshan Ara Begum
Institute for Environment and Development (LESTARI)Universiti Kebangsaan Malaysia (UKM)
www.lestari.ukm.my
Workshop: Socio-economic Impact Assessment Tools for Climate Change (24-25 November 2008)
Introduction Introduction
National Coastal Vulnerability Index (NCVI) Study - initiated by the Dept. of Irrigation & Drainage, Ministry of Natural Resources and Environment (NRE) conducted by BUREAU FOR INNOVATION & CONSULTANCY UNIVERSITI TEKNOLOGI MALAYSIA
Completed December, 2007
Objectives of the StudyObjectives of the Study
To formulate a national Coastal Vulnerability Index (CVI) and to test/apply in two (2) pilot sites with widely varying characteristics, so that in the long term, the CVI will be applicable for the entire coastal zone of Malaysia
Preliminary Coastal Vulnerability Index Study (CVI) - two pilot sites in West Coast of Peninsular Malaysia which has been commissioned to identify the susceptibility of coastal areas to the impacts of sea level rise
CVI Study has adopted:CVI Study has adopted:
1)USGS methodology to compute the CVI for the Physical Vulnerability Index
2)South Pacific Applied Geo-science Commission for the Biological/Environmental Vulnerability Index
3)3)UNEP Handbook Methodology for the Total of UNEP Handbook Methodology for the Total of Composite Vulnerability Index which includes socioComposite Vulnerability Index which includes socio--economic variables economic variables
A Coastal Vulnerability Index (CVI) could be defined as a means to combine a number of separate variables to create a single indicator
A comprehensive development of the CVI carried out to consider the physical, biological, and socio-economic contribution to the vulnerability of the coastline to sea level rise
The total CVI is an average of the above variables with each variable being of equal weightage

Flowchart for Flowchart for the the
DevelopmentDevelopmentof CVI of CVI
(Figure 4.1.1) (Figure 4.1.1)
Two (2) pilot sites Two (2) pilot sites - with widely varying characteristics
Pilot Site 1 Pilot Site 1 –– coastal stretches from coastal stretches from TgTg PiaiPiai to to SgSgPulaiPulai Estuary, Estuary, JohorJohor
Pilot Site 2 – western shorelines of PulauLangkawi from Tg Belikit to Tg Malai, Langkawi
9
Sea Levels Rise Case Scenarios: Sea Levels Rise Case Scenarios: TgTg PiaiPiai, , JohoreJohoreSocioSocio--economic Assessmenteconomic Assessment
In terms of ranking coastal vulnerability on socio-economic aspects, ranking can be defined in two categories:
1.Qualitative terms (e.g high, medium and low vulnerability)
2. Quantitative terms (e.g numerical value)
SocioSocio--economic Assessmenteconomic Assessment
The ranking of vulnerability on socio-economic features involved two steps:
Step 1: Identification and classification of coastal vulnerability in terms of social economic importance
Step 2: Ranking socio-economic features in terms of vulnerability to sea level rise
All socio-economic features have been reported in three categories such as characteristics, impact and vulnerability ranking
Data CollectionData Collection
The following data for the socio-economic variables were collected:
Population and other demographic factors Cultural heritageRoad, railways and other infrastructures present in the areasLand use and conservation statusThe existing and potential of sea-based socio-economic and tourism activities in the related areas
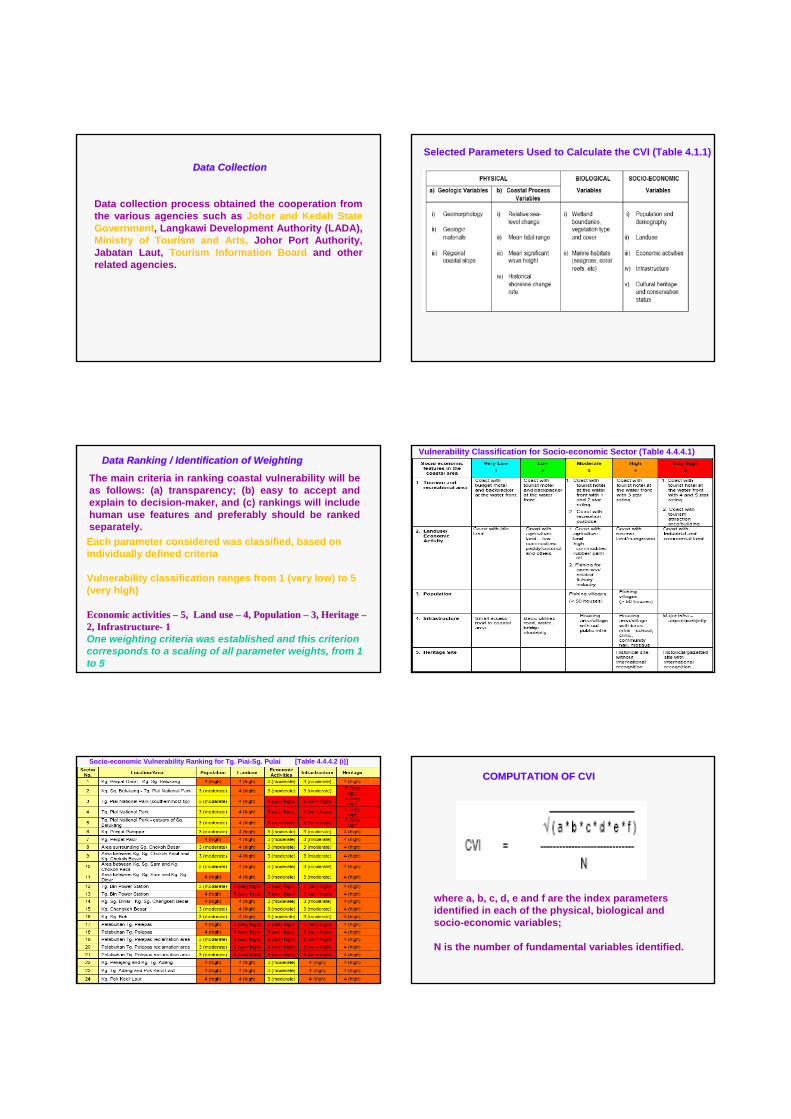
Data CollectionData Collection
Data collection process obtained the cooperation from the various agencies such as Johor and Kedah State Government, Langkawi Development Authority (LADA), Ministry of Tourism and Arts, Johor Port Authority, Jabatan Laut, Tourism Information Board and other related agencies.
Selected Parameters Used to Calculate the CVI (Table 4.1.1)
The main criteria in ranking coastal vulnerability will be as follows: (a) transparency; (b) easy to accept and explain to decision-maker, and (c) rankings will include human use features and preferably should be ranked separately.
Data Ranking / Identification of Weighting Data Ranking / Identification of Weighting
Each parameter considered was classified, based on individually defined criteria
Vulnerability classification ranges from 1 (very low) to 5 (very high)
Economic activities Economic activities –– 5, Land use 5, Land use –– 4, Population 4, Population –– 3, Heritage 3, Heritage ––2, Infrastructure2, Infrastructure-- 11One weighting criteria was established and this criterion corresponds to a scaling of all parameter weights, from 1 to 5
Vulnerability Classification for Socio-economic Sector (Table 4.4.4.1)
Socio-economic Vulnerability Ranking for Tg. Piai-Sg. PulaiEstuary
[Table 4.4.4.2 (i)]
COMPUTATION OF CVICOMPUTATION OF CVI
where a, b, c, d, e and f are the index parameters identified in each of the physical, biological and socio-economic variables;
N is the number of fundamental variables identified.

Summary of CVI Computational Methods used (Table 4.5.1) Socio-economic Vulnerability Index (SVI) for Tg Piai –Sg. Pulai Estuary [Table 4.5.2 (c)]
SVI Value & SVI Score
Range of SVI Scores for Shoreline Categorisation at Tg. Piai
where x = Relative or calculated SVI obtained by using the weighting factor equation
Total Composite Vulnerability Index (TCVI) for Tg Piai –Sg. Pulai Estuary [Table 4.5.2 (d)]
ArcGIS/ArcView where a CVI map for each category
VULNERABILITY MAPSVULNERABILITY MAPS
For each pilot site, the following maps have been produced:
1) Physical Vulnerability Index (PVI) Map2) Biological or Environmental Vulnerability Index (EVI) Map3) Socio-economic Vulnerability Index (SVI) Map4) Total Composite Vulnerability (TCVI) Map
Appraisal of the Socio-economic Vulnerability Distribution
i) Due to the high economic activities, infrastructure, and landuse at Tg. Pelepas Port and Tg. Bin, the shoreline along these areas have been classified to be very highly and highly vulnerable to sea level rise.
ii) Areas along the southern tip of Tg. Piai National Park, due to the very high heritage values and ecotourism activities, have been categorized as highly vulnerable.
iii) Both highly and very highly vulnerable areas make up 41.7% of the total shoreline.
iv) The rest of the shoreline between Tg. Piai and Tg. Bin are under category 1 (very low) and 2 (low). These account for about 25.0% and 20.8% of the total shoreline respectively.
v) The less developed areas along the south and east of PTP are of moderate vulnerability to sea level rise.

Summary of Potential Impacts and Recommended Adaptive Measures for Tg. Piai – Sg. Pulai Estuary (Based on case 4: Global High / worst scenario (10.0mm/yr) [Table 6]
A = Accommodate P = Protection R = Retreat
Challenges for the CVI MethodChallenges for the CVI Method
Major challenge in formulating the CVI is quantifying socio-economic variables that contribute to the response of the specific area to sea level rise
CVI can be extended more areas to see vulnerable status
Limited Socio-economic variables incorporated into this CVI
Other important socio-economic variables could be included eg. household distribution (family headed, family size, ethnics…), income level, occupation, gender, demographic sub-groups (children, elderly people, indigenous….), economic development, quality & availability of public health care and so on
VI method can also be applicable for other sectors -water, agriculture, health, ……
Thank You Thank You

1
Methodology on Socio-Economics Impact Analysis
of Climate Change on Agriculture
Crop involved
Oil palmRubber CocoaVegetablesFloricultureFruitsPaddy
Data
Agriculture GDPGDP overallYield/ ha/cropHectarage/ crop
This work utilized secondary data, employed yearly data undertaken from 1990 - 2006
Framework
GDP
Hectarage
Yield/ haImplication
Increase in Climate Variability RangeRainfallSea level riseTemperature rise
Methodology 1Regression Analysis
Generalizing the two variable population regression function as below:Yi = β1 + β2X2i + β3X3i + μI
where Y is the dependent variable, X2 and X3 the explanatory variables, μ the stochastic disturbance term, and i the ith observation in case the data are time series. This models are sets of equations that the structure of the economy and predict variables such as GDP, yield and hectarage.
Risk1. Lack of time series data 2.Statistical problem such as auto-correlation and multi-collinearity may influence the magnitude of coefficients
Methodology 2
Mathematical programmingThis methods involves a technique whereby an objective function is maximized given certain restrictions. This method of which linear and quadratic programming are the best known can be used in impact analysis (Powell et al, 1985:6)Advantage:
Can be construct without detail time series dataRisk:
The objective function which has to be maximized does however restrict its applicability in impact analyses

2
Methodology 3
Time series econometrics
Forecasting the effects of the variables on the implications of the rainfall, sea level rise and rise in temperature to those variables:GDP overallGDP on agricultureYield/ ha/ cropHectarage/ crop
Expected Output of Socio-economics Impacts on Agriculture Sector
Reduce the income of the agriculture household playersReduce the GDPReduced the yieldIncreased expenditure on agriculture inputsLoss of income and productivity
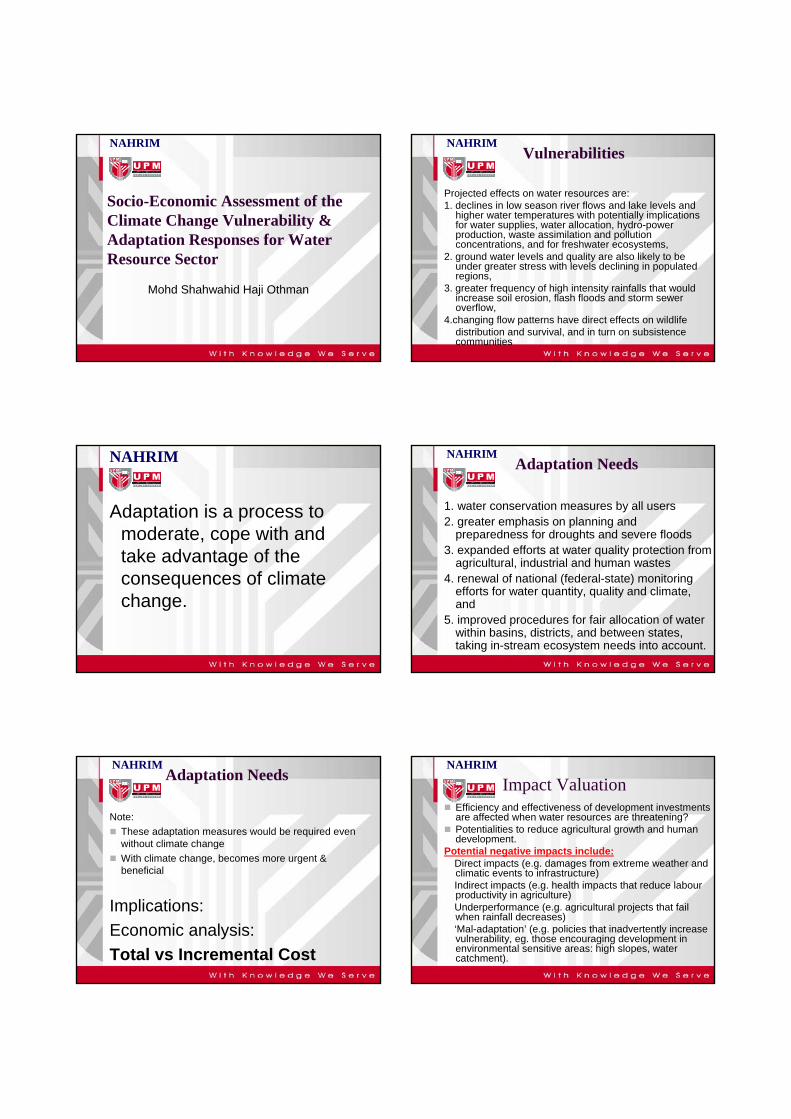
Socio-Economic Assessment of the Climate Change Vulnerability & Adaptation Responses for Water Resource Sector
Mohd Shahwahid Haji Othman
NAHRIM Vulnerabilities
Projected effects on water resources are:1. declines in low season river flows and lake levels and
higher water temperatures with potentially implications for water supplies, water allocation, hydro-power production, waste assimilation and pollution concentrations, and for freshwater ecosystems,
2. ground water levels and quality are also likely to be under greater stress with levels declining in populated regions,
3. greater frequency of high intensity rainfalls that would increase soil erosion, flash floods and storm sewer overflow,
4.changing flow patterns have direct effects on wildlifedistribution and survival, and in turn on subsistence communities
NAHRIM
NAHRIM
Adaptation is a process to moderate, cope with and take advantage of the consequences of climate change.
Adaptation Needs
1. water conservation measures by all users2. greater emphasis on planning and
preparedness for droughts and severe floods3. expanded efforts at water quality protection from
agricultural, industrial and human wastes4. renewal of national (federal-state) monitoring
efforts for water quantity, quality and climate, and
5. improved procedures for fair allocation of water within basins, districts, and between states, taking in-stream ecosystem needs into account.
NAHRIM
Adaptation Needs
Note:These adaptation measures would be required even without climate changeWith climate change, becomes more urgent & beneficial
Implications:Economic analysis: Total vs Incremental Cost
NAHRIM
Impact ValuationEfficiency and effectiveness of development investments are affected when water resources are threatening?Potentialities to reduce agricultural growth and human development.
Potential negative impacts include:� Direct impacts (e.g. damages from extreme weather and
climatic events to infrastructure)� Indirect impacts (e.g. health impacts that reduce labour
productivity in agriculture)� Underperformance (e.g. agricultural projects that fail
when rainfall decreases)� ‘Mal-adaptation’ (e.g. policies that inadvertently increase
vulnerability, eg. those encouraging development in environmental sensitive areas: high slopes, water catchment).
NAHRIM
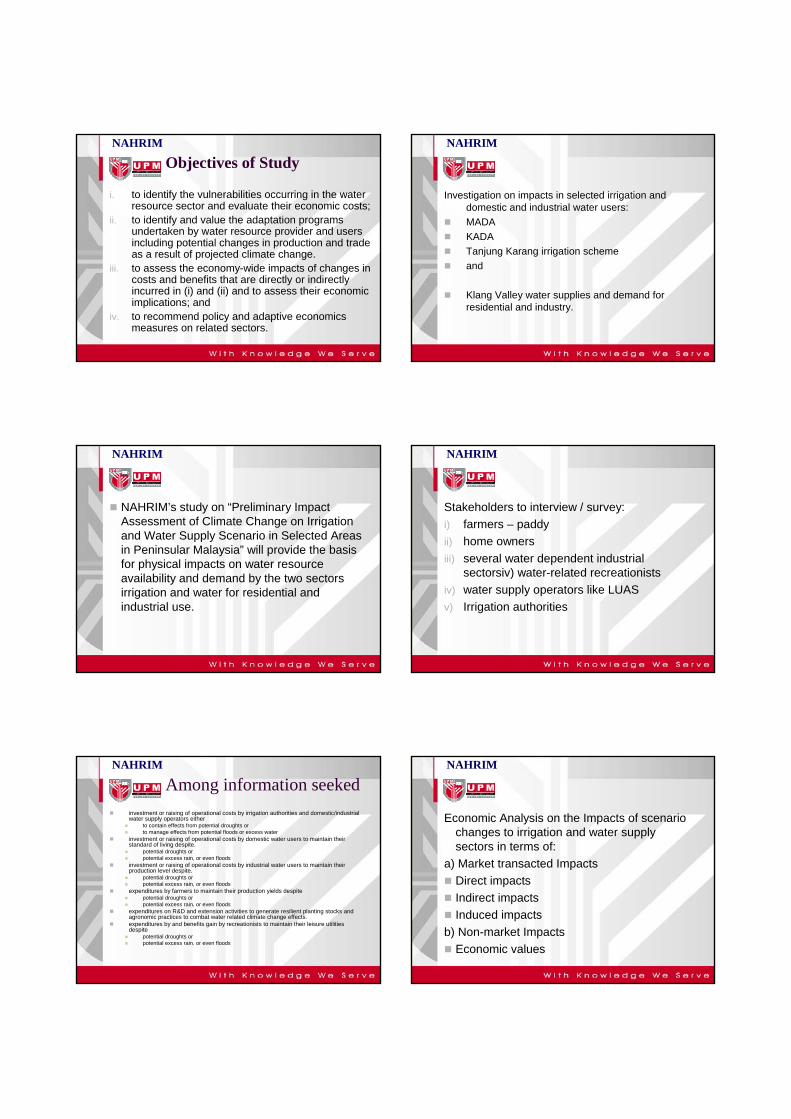
Objectives of Study
i. to identify the vulnerabilities occurring in the water resource sector and evaluate their economic costs;
ii. to identify and value the adaptation programs undertaken by water resource provider and users including potential changes in production and trade as a result of projected climate change.
iii. to assess the economy-wide impacts of changes in costs and benefits that are directly or indirectly incurred in (i) and (ii) and to assess their economic implications; and
iv. to recommend policy and adaptive economics measures on related sectors.
NAHRIM
Investigation on impacts in selected irrigation and domestic and industrial water users:MADAKADATanjung Karang irrigation schemeand
Klang Valley water supplies and demand for residential and industry.
NAHRIM
NAHRIM’s study on “Preliminary Impact Assessment of Climate Change on Irrigation and Water Supply Scenario in Selected Areas in Peninsular Malaysia” will provide the basis for physical impacts on water resource availability and demand by the two sectors irrigation and water for residential and industrial use.
NAHRIM
Stakeholders to interview / survey:i) farmers – paddyii) home ownersiii) several water dependent industrial
sectorsiv) water-related recreationistsiv) water supply operators like LUASv) Irrigation authorities
NAHRIM
Among information seekedinvestment or raising of operational costs by irrigation authorities and domestic/industrial water supply operators either
to contain effects from potential droughts orto manage effects from potential floods or excess water
investment or raising of operational costs by domestic water users to maintain their standard of living despite.
potential droughts orpotential excess rain, or even floods
investment or raising of operational costs by industrial water users to maintain their production level despite.
potential droughts orpotential excess rain, or even floods
expenditures by farmers to maintain their production yields despitepotential droughts orpotential excess rain, or even floods
expenditures on R&D and extension activities to generate resilient planting stocks and agronomic practices to combat water related climate change effects.expenditures by and benefits gain by recreationists to maintain their leisure utilities despite
potential droughts orpotential excess rain, or even floods
NAHRIM
Economic Analysis on the Impacts of scenario changes to irrigation and water supply sectors in terms of:
a) Market transacted Impacts Direct impacts Indirect impacts Induced impacts
b) Non-market ImpactsEconomic values
NAHRIM

Economic Analytical Approach
Direct Impact Analysis
Indirect Impact Valuation
Economy wide Impacts
Total Economic Valuation (TEV)
Climate Change Impact Tangible (Traded) Impacts Intangible (Non-traded Impacts - Market-price based approaches - change in productivity -Change in productivity approach - Contingent Valuation Method - Choice Modelling - Cost-based approach - - Input-Output Analysis & Economic impact
NAHRIM
Output and BenefitsEconomic costs of vulnerability of water resources and water users to climate changeEconomic costs of adaptation activities by water resource suppliers and water users, to adjust to climate changeAssessment of economic-wide impacts of the vulnerability and adaptation activities upon major economic sectors dependent on (using) water resourcesRecommendation of policy framework and further proposed R&D on a more detailed socio-economic assessment of the impact of climate change to water resources and users.
NAHRIM
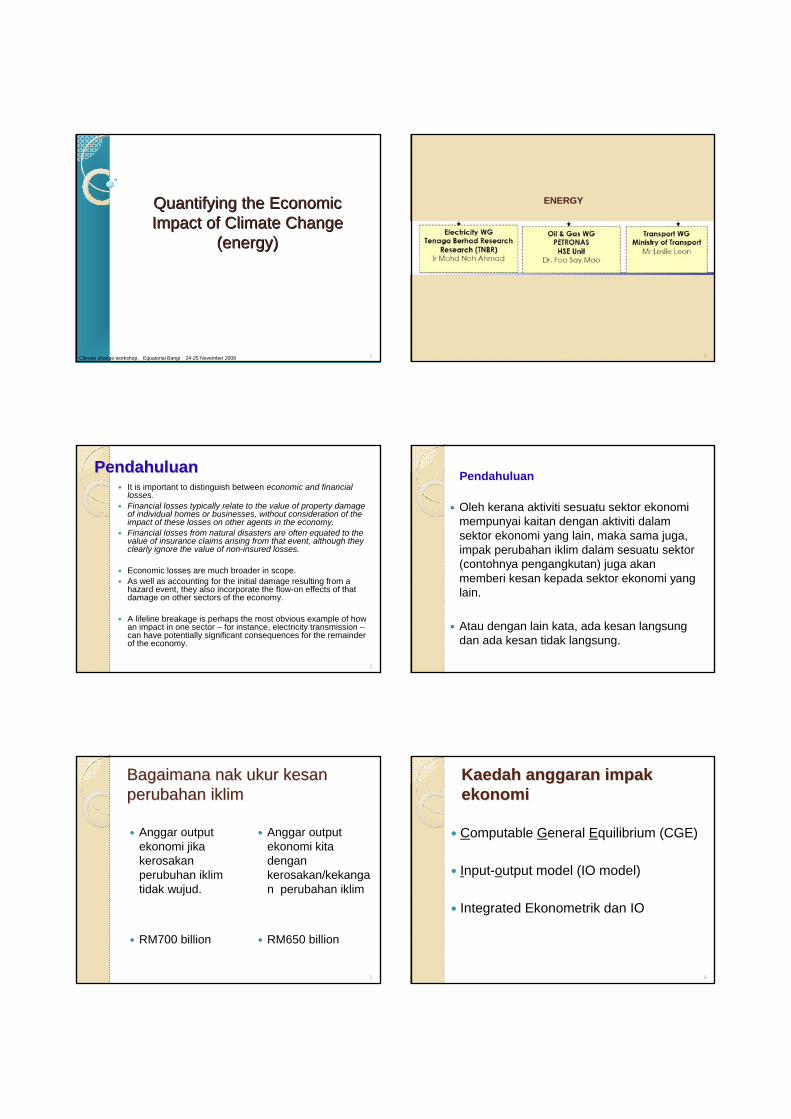
Quantifying the Economic Quantifying the Economic Impact of Climate Change Impact of Climate Change
(energy)(energy)
1Climate change workshop, Equatorial Bangi 24-25 November 2008
ENERGYENERGY
2
PendahuluanPendahuluanIt is important to distinguish between economic and financial losses. Financial losses typically relate to the value of property damage of individual homes or businesses, without consideration of the impact of these losses on other agents in the economy. Financial losses from natural disasters are often equated to thevalue of insurance claims arising from that event, although theyclearly ignore the value of non-insured losses.
Economic losses are much broader in scope. As well as accounting for the initial damage resulting from a hazard event, they also incorporate the flow-on effects of that damage on other sectors of the economy.
A lifeline breakage is perhaps the most obvious example of how an impact in one sector – for instance, electricity transmission –can have potentially significant consequences for the remainder of the economy.
3
Oleh kerana aktiviti sesuatu sektor ekonomimempunyai kaitan dengan aktiviti dalamsektor ekonomi yang lain, maka sama juga, impak perubahan iklim dalam sesuatu sektor(contohnya pengangkutan) juga akanmemberi kesan kepada sektor ekonomi yang lain.
Atau dengan lain kata, ada kesan langsungdan ada kesan tidak langsung.
Pendahuluan
BagaimanaBagaimana naknak ukurukur kesankesanperubahanperubahan iklimiklim
Anggar output ekonomi jikakerosakanperubuhan iklimtidak wujud.
RM700 billion
Anggar output ekonomi kitadengankerosakan/kekangan perubahan iklim
RM650 billion
5
KaedahKaedah anggarananggaran impakimpakekonomiekonomi
Computable General Equilibrium (CGE)
Input-output model (IO model)
Integrated Ekonometrik dan IO
6

KajianKajian lepaslepas
CGEprent link\Pages from IO UE highway scge.pdfprent link\rose2 IOcge.pdf
IO modelprent link\Pages from rose IO.pdfprent link\Pages from 04_DonaghyREIM.pdf
Integrated Ekonometrik dan IO prent link\Pages from 0 cc2IEIO.pdf
7 8
Model IOModel IOModel ini berasaskan jadual input-output yang diterbitkan oleh Jabatan PerangkaanMalaysia setiap beberapa tahun.Yang terkini ialah Jadual IO 2000, sebelumitu ialah Jadual IO 1991.Jadual I-O yang pertama SemenanjungMalaysia: 1960Kemudian: 1965 dan 1970, 1978, 1983, 1987
Jadual IO 20009
Navigation sectorNavigation sector
10
NavigationNavigation
11
VA matrixVA matrix
Our VA matrix
12

13
SekianTerima kasih
Mohon pandangan tuan/puan