socio-economic impact of pet packaging & its recycling
TRANSCRIPT
Presentation For Honourable Prime Minister and
Leadership of Govt. of India
4th September 2019
Socio-Economic Impact of PET packaging & its Recycling

PET value chain: Stake Holders
Resin Manufacturers
Converters (Preform & Blowers)
Brand Owners
RetailersRagpickers
& Kabadiwala
Flake Manufacturers
Fibres and sheet
ManufacturersGarments

Segment-wise PET Resin consumption in Containers
*Miscellaneous make 5.6%
(Straps and Sheets)
Segment-wise PET Resin
consumption – 1,000 KT
in 2018-19
CSD/Fruit
Drinks
Personal
Care
Liquor
Pharmaceuticals
25.5%
19.9%
11.1%
10.6%
8.9%7.6%
6.7%
1.8%
1.2%
1.1%
Wide mouth Jar
Edible oil
Homecare
Dairy
Agro-chemicals
Bottled
Water
Packaging*

Resin
Manufacturers Converters
Brand Owners
/ Producers
Indian forward PET Revenue Chain 100%
Indian Reverse PET Revenue Chain
(Organized + Unorganized)
No of Units: 4
Revenue: 8,500 Cr
No of Units: 2600
Revenue: 27,000 Cr
No of units: 15500
Revenue: 3.7 Lac Cr
90%
Equipment
Manufacturers
No of Units: 28
Revenue: 7,000 Cr
PET Forward Revenue Chain ~ INR 4.1 Lac Crores

Ragpickers /
KabadiwalasBailers
Flake
Manufacturers
Fibre / Strap/ Sheet
Manufacturers
Garment
Manufacturers
Indian Reverse PET Revenue Chain
No of Units: 2,70,000
Revenue: INR 1,440 Cr
90%
Indian GDP value of PET Packaging + Recycling Ecosystem
~ INR 7.5 Lac Crores
No of Units: 3,000
Rev: INR 2,800 Cr
No of Units: 100
Rev: INR 450 Cr
No of Units: 157
Rev: INR 10,725 Cr
No of Units: 25,000
Rev: INR 3.25 L Cr
PET Reverse Revenue Chain ~ INR 3.4 Lac Crores

PET Value Chain – Employs over 71,60,800 across India
Resin ManufacturersNumber of Units: 4
Employees: 3,000
Equipment ManufacturerNumber of Units: 28
Employees: 1,500
Preform & BlowersNumber of Units: 3,600
Employees: 100,000
Brand OwnersNumber of Units: 15,500
Employees: 9,20,000
Ragpickers/ Kbadiwala/ bailersNumber of Units: 27,78,100
Employees: 36,62,000
Flake ManufacturerNumber of Units: 100
Employees: 2,000
Fibre / Strap/ Sheet Number of Units: 157
Employees: 12,300
Garment ManufacturersNumber of Units: 25,000
Employees: 25,00,000

PET Resin consumption – Size (in ML)
Below 200ml
392 KTA
41% Share
Equal to 200ml
but <500 ml
206 KTA
22% Share
<= 1000 ml till
20 Litres
185 KTA
20 % Share
Below 500 ml
but <1,000 ml
160 KTA
17% Share

Use of Material
(eg. 180 ml)
Energy Requirement
SecondaryPackaging
Space Savings
Occupationalsafety
• 35 % more space
required for
storing Glass
• Higher Transport
Cost
• Higher Pollution
(through Diesel)
• Higher
warehousing cost
• Lower ply
cartons incase of
PET (5 vs 3)
• Shrink Wrapping
of PET Bottles
• For 1 MT paper
25 KL of water
required
• For 1 MT paper,
17 trees are cut
(source: Dartmouth College)
• Glass is
produced at
1,600OC
• PET
production
requires
275OC
• 90 dB ( Glass) vs
50 dB ( PET)
while filling
(low noise level)
• Injuries to
workers due to
Glass breaking
Weight:
Glass – 150 gm
PET – 12 gm
1,200% higher
weight in Glass
Breakage:
5% in Glass
Nil in PET
Sand Mining is
hazardous (Silicosis)
8
PET : Economic Use of Resources & Eco-friendliness

PET Recycling Process
Spinning &
Drawing
Polyester
Staple Fibre
Used Bottles Bottle Baling Bottle Sorting
Flake washing
2

PET Recycling trends in India – 2018-19
10
FY18-19 Value UoM
Cons of Virgin PET 1,000 KTA
Export of Preforms / filled bottles 90 KTA
Amount of PET consumed in India 910 KTA
PET used in non bottle applications 40 KTA
PET used in bottle applications 870 KTA
rPET Based RPSF 675 KTA
rPET Based PET Straps 40 KTA
rPET Based APET sheets 20 KTA
rPET Based other products
(monofilament/films/MB etc)5 KTA
Total rPET based products 740 KTA
Recycling Rate +85 %
Fiber / Yarns : 91%
Straps : 5%
Sheets : 3%
Others : 1%
In India more than 92% recycling rate for PET (Inclusive of home reuse)
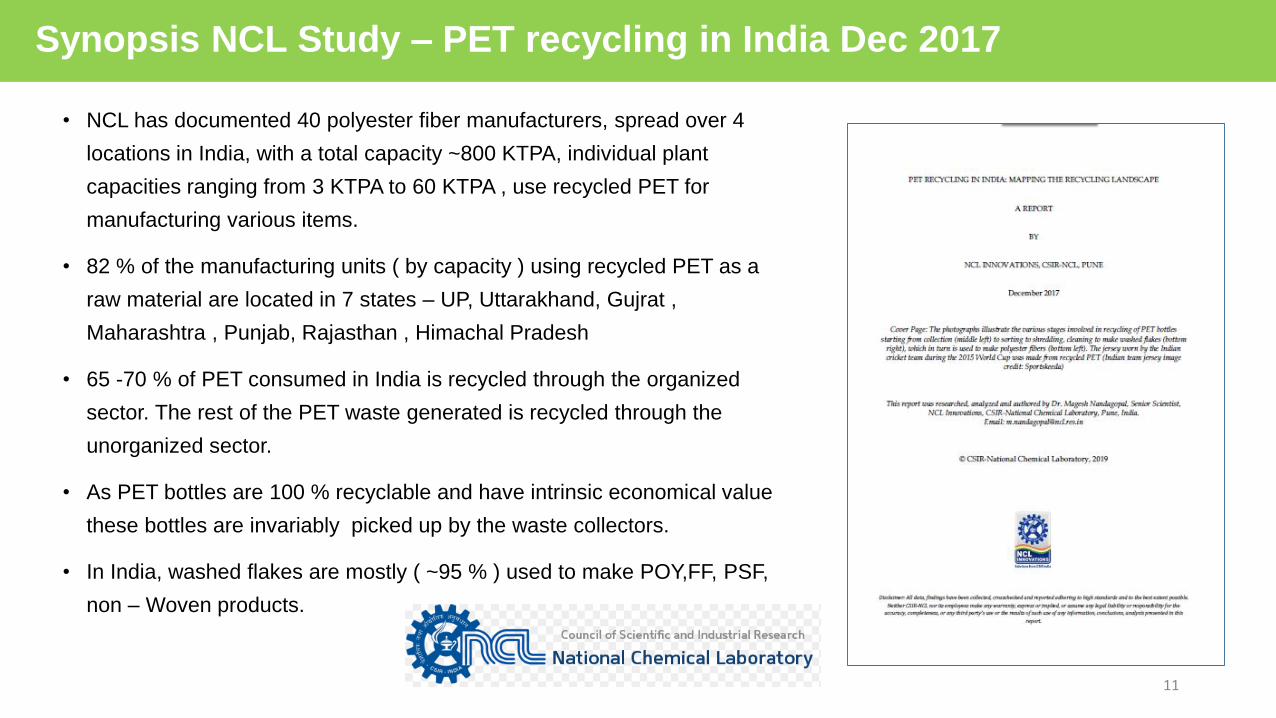
Synopsis NCL Study – PET recycling in India Dec 2017
• NCL has documented 40 polyester fiber manufacturers, spread over 4
locations in India, with a total capacity ~800 KTPA, individual plant
capacities ranging from 3 KTPA to 60 KTPA , use recycled PET for
manufacturing various items.
• 82 % of the manufacturing units ( by capacity ) using recycled PET as a
raw material are located in 7 states – UP, Uttarakhand, Gujrat ,
Maharashtra , Punjab, Rajasthan , Himachal Pradesh
• 65 -70 % of PET consumed in India is recycled through the organized
sector. The rest of the PET waste generated is recycled through the
unorganized sector.
• As PET bottles are 100 % recyclable and have intrinsic economical value
these bottles are invariably picked up by the waste collectors.
• In India, washed flakes are mostly ( ~95 % ) used to make POY,FF, PSF,
non – Woven products.
11

Value Chain of PET Recycling : Indian Landscape
12
Waste Collectors
• Collects all recyclable waste
• Gets Rs 12-14/kg
Kabadiwala
• Buys all the waste from waste colelctors such as glass, plastics, steel etc.
• Gets Rs 18-20/kg
Aggregator
• Sgregates only plastic from the waste received from Kabadiwala
• Gets Rs 22-25/kg
Trader / Baler
• Receives PET waste in bulk, sorts, bales and sends to recyclers
• Gets Rs 33-35/kg
Recyclers
• Removes labels, caps, rings, washes, makes flakes, spins to fibers.
• Gets Rs 55-60/kg
Institutions
• Waste from institutions such as offices / hotels / malls etc.
• Gets Rs 18-20/kg

RPET consumption in PSF / PFF (MTM)
13
Reliance, Barabanki1800
Pashupati, Kashipur 4800
Ganesh Ecosphere Rudrapur , 3000
Ganesh Ecosphere Kanpur, 3000
Ganesh Ecosphere, Bilaspur 4000
Reliance, Hoshiarpur 1350
Shiva, Kala Amb1200
Acqua Fibre, Dera Bassi2100
Shiva, Macchiwada4800
RSWM, Bhilwara 1500
Tejaria, Jaipur 1200
Salasar, Jaipur , 1200
Shakti Polymers, 1200
BLS, Alwar/Jaipur5000
Agarwal Polyfibre, Kolkata 1200
Jai Ambe, Bhayandar 900
Saroj Microchem600
Unitec, Tarapur1200
Obeetee, Pantnagar1200
Nirmal Fiber , Moradabad 1800
Jai Narayan, Meerut 2100
Mahalaxmi Spintex, Solan 600
Himalaya, Baddi1530
Pacific Harish, Nasik 600
Divine Polymer, Kandla1800
Capitol, Nasik360
Bhavesh Polymer, Nasik450
Suncity , Jodhpur 900
Eminent, Bhilwara 1800
Badri , Bhopal, 1200
Amicotex , Nala Garh1200
Allied, Kashipur 1200
Rijwan, Kashipur 600
RPG, Meerut 1800
Sulochana , Tirupur1800
Arora, Silvassa1200
Next Gen Fibre300
VMS, Innl.900
Alliance, Surat 2160
Vishal Polyfab600
JB Ecotex5000
Polyole Daman 1200
Komal Fibre 1200
Dharmesh Textile, Bhiwani 900
Rishiraj, Khopoli1200
Shri Renga , Karur600
More than 80% of rPET is consumed in PSF / PFF production
Aero fibre Daman 1200
Safar , Rajkot1200
Polygenta Nasik800
K K Fibre , Ludhiana 1200
Zone (MTM) Capacity Utilization
North 33,250 25,125
West 29,820 21,960
South 1,800 1,260
East 1,200 840
Total 66,070 49,185
Total KTA 793 590

Numerous Reincarnations of Post Consumer PET Bottles

Sustainability Initiatives - rPET
• Installation of RVM’s at tourist
places.
• Creating RPET awareness in
various institutes.
• Apprising government bodies all
over the India on “PET
Sustainability”.
• Supporting different associations in
representation on government
bodies.

Ms. Priya Dutt inaugarting RVM @ Santa Cruz and donning a
R|Elan scarf – Her demand for scarf goes viral
The R|Elan scarf from rPET makes Women look SMARTer in
Denim

R|Elan bags can help REDUCE litter from light weight plastic Carry Bags
R|Elan bags can be REUSED 1,000s of times
R|Elan bags are made from RECYCLED PET Bottles
Hottest item in Town for Masses – R|Elan Recycled Fabric Bags

Shri. Parimal Nathwani , Rajya Sabha MP displaying a Ecofriendly
Modi Jacket from 45% rPET and 55% wool
Increasing demand for Modi Jackets with 45% rPET content

A walk through the Recycling Process & Value Added Products
The Honourable President of India & Secretary – Urban & Home Affairs walk through & understand PET Recycling and how Couponsfrom RVM makes recycling interesting

Earth Tee Shirts by Anita Dongre from recycled PET Bottles
Fashion Designers Love R|Elan Fabrics from rPET Bottles

GLIMPSES FROM LAKME FASHION WEEK – R|Elan for Alcis X Nari Clothing
Walking the RAMP with clothing made of Recycled PET

97m x 70m & 4 MT - by Plastindia Foundation – several T-shirts made for
Ocean Foundation from this large symbolic T-Shirt
Worlds largest T-Shirt from 2 Lac recycled PET Bottles – Made in India

23
Waste to Wealth

24
Make up Your Office or Home with rPET

More than 300 million MT already used globally
More than 15 trillion bottles packed and consumed
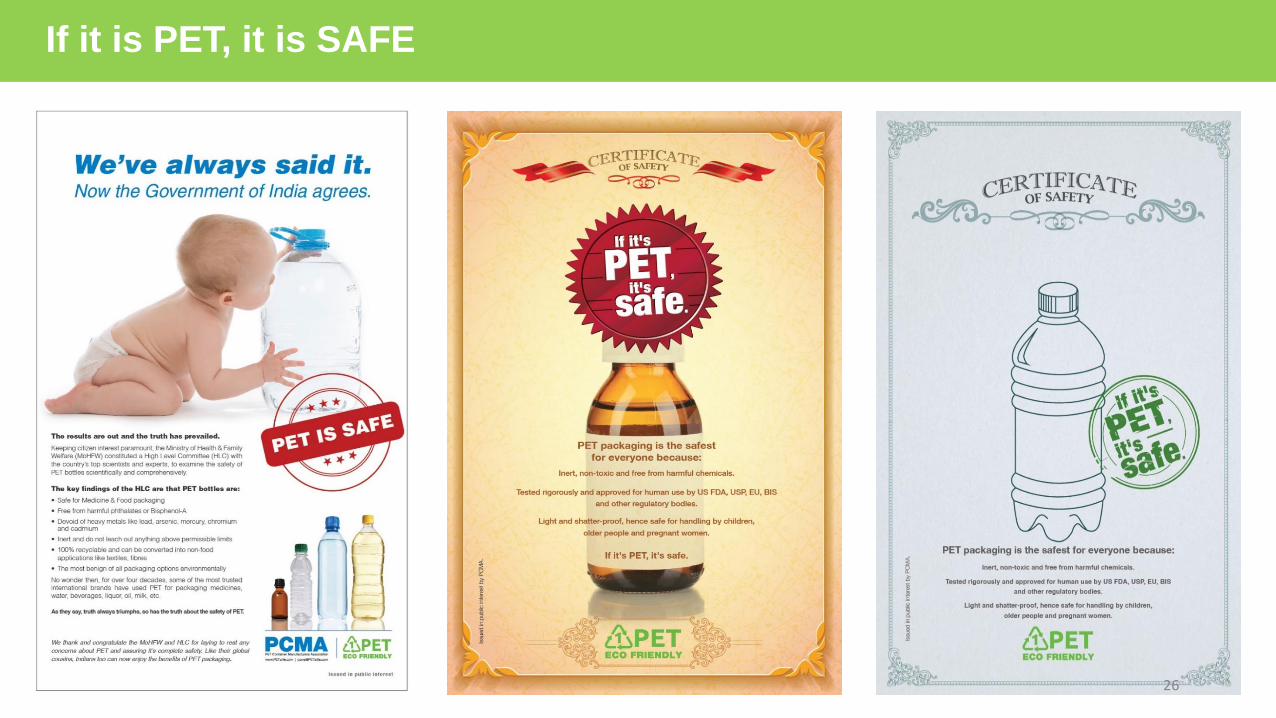
“A EPIDEMIOLOGICAL EVIDENCE OF SAFETY” 25
The Safety Ecosystem of PET Packaging
26
If it is PET, it is SAFE

Thank you for your attention!
For any clarifications, please contact PACE OfficeMr. Pankaj Uppal – Manager Public Policy
313, Third Floor, New Delhi House, 27 BarakhambaRoad, New Delhi – 110 001
LL: +91 11-43528729, E-mail: [email protected]