socio-economic impacts of the forest industry - … impacts of the forest industry queensland ......
TRANSCRIPT

Socio-economic impacts of the forest industry
Queensland
2nd edition, May 2018
Jacki Schirmer1,2, Mel Mylek1, Anders Magnusson3, Dominic Peel1 and Julian Morison3
1 Health Research Institute, University of Canberra 2 Institute for Applied Ecology, University of Canberra 3 EconSearch

i
Contents
Acknowledgments ................................................................................................................................... v Executive Summary ................................................................................................................................ vi Introduction ............................................................................................................................................ 1 Methods .................................................................................................................................................. 2 Overview of the industry – Queensland ................................................................................................. 3
Industry structure ............................................................................................................................... 3 Industry sectors ................................................................................................................................... 5
Native eucalypt forest sector .......................................................................................................... 7 Native cypress pine sector .............................................................................................................. 7 Softwood plantation sector – Araucaria ......................................................................................... 7 Softwood plantation sector – southern pine .................................................................................. 7 Hardwood plantation sector ........................................................................................................... 8 Other activities ................................................................................................................................ 8
Regions analysed in this report ........................................................................................................... 8 Economic value ..................................................................................................................................... 10
Measuring economic impact ............................................................................................................. 10 Categories of economic impact .................................................................................................... 10 Value of output ............................................................................................................................. 11 Industry expenditure..................................................................................................................... 11 Industry contribution to Gross Regional Product (GRP) ............................................................... 12 Employment .................................................................................................................................. 13
Direct economic value ...................................................................................................................... 13 Direct value of output of the Queensland forest industry ........................................................... 13 Direct expenditure by the Queensland forest industry ................................................................ 14 Contribution of the forest industry to Gross Regional Production ............................................... 17
Total economic value including both direct and flow-on effects ..................................................... 18 Employment .......................................................................................................................................... 21
Direct employment ........................................................................................................................... 21 Defining ‘direct’ employment ....................................................................................................... 21 Direct employment generated by the industry in 2017 ............................................................... 22 Direct employment by local government area ............................................................................. 26
Flow-on employment ........................................................................................................................ 29 Comparing employment estimates................................................................................................... 31 Direct employment over time ........................................................................................................... 37
Working conditions ............................................................................................................................... 40 Working hours ................................................................................................................................... 40 Income .............................................................................................................................................. 42
Workforce diversity and sustainability ................................................................................................. 44 Gender .............................................................................................................................................. 44 Age .................................................................................................................................................... 45 Aboriginal and Torres Strait Islanders ............................................................................................... 46 Recruiting workers and contractors.................................................................................................. 47
Industry skills and training needs ......................................................................................................... 49 Formal skills attainment.................................................................................................................... 52
Business and market outlook ................................................................................................................ 54 Overall business conditions .............................................................................................................. 54 Future business expectations ........................................................................................................... 54 Business challenges ........................................................................................................................... 56
ii
Community perceptions of the social, economic, service and infrastructure effects of the forest industry ................................................................................................................................................. 58
Quality of life and liveability ............................................................................................................. 58 Perceptions of regional industries .................................................................................................... 63
Conclusions ........................................................................................................................................... 70 References ............................................................................................................................................ 71 Appendix 1 Data tables ......................................................................................................................... 73 Appendix 2 Using ABS Census data to identify employment in secondary processing ........................ 87 Appendix 3: Direct forest industry – comparison of employment recorded in the 2016 ABS Census by place of work and place of residence ................................................................................................... 90
iii
Figures
Figure 1 Stylised structure of the forest and wood products industry ................................................................... 5
Figure 2 Distribution of native forest and plantations harvested for commercial timber production, Queensland
(reproduced from State of Queensland, 2016) ...................................................................................................... 6
Figure 3 Derivation of direct contribution to GRP, Queensland – all parts of the industry ................................. 18
Figure 4 Derivation of total contribution to GRP, Queensland – all parts of the industry ................................... 20
Figure 5 Level of difficulty involved in recruiting different types of workers, as rated by Queensland forest
industry businesses............................................................................................................................................... 47
Figure 6 Key issues preventing recruitment of skilled workers into the Queensland forest industry .................. 48
Figure 7 Expectations for business revenue, profitability, workforce size and investment over the next 12
months .................................................................................................................................................................. 55
Figure 8 Challenges experienced by Queensland forest industry businesses ...................................................... 57
Figure 9 Perceptions of overall liveability and economy of local region – Regional Wellbeing Survey 2016 ...... 60
Figure 10 Perceptions of friendliness, safety and crime ....................................................................................... 61
Figure 11 Perceptions of landscape aesthetics and environmental health .......................................................... 62
Figure 12 Proportion of residents who views the forest industry as an ‘important industry’ in their local
community ............................................................................................................................................................ 64
Figure 13 Proportion of Wide Bay Burnett residents who felt the forestry, farming and tourism industries had a
positive impact on different aspects of their local community ............................................................................ 66
Figure 14 Proportion of North and Central region residents who felt the forestry, farming and tourism
industries had a positive impact on different aspects of their local community ................................................. 67
Figure 15 Proportion of South East and Southern residents who felt the forestry, farming and tourism
industries had a positive impact on different aspects of their local community ................................................. 67
Figure 16 Proportion of Wide Bay Burnett residents who felt the forestry, farming and tourism industries had a
negative impact on different aspects of their local community ........................................................................... 68
Figure 17 Proportion of North and Central region residents who felt the forestry, farming and tourism
industries had a negative impact on different aspects of their local community ................................................ 68
Figure 18 Proportion of South East and Southern region residents who felt the forestry, farming and tourism
industries had a negative impact on different aspects of their local community ................................................ 69
Tables
Table 1 Direct expenditure generated by the Queensland forest industry in different region, 2015-16, by supply
chain stage ............................................................................................................................................................ 15
Table 2 Direct expenditure generated by different parts of the Queensland forest industry, 2015-16, by supply
chain stage ............................................................................................................................................................ 16
Table 3 Economic impacts of the Queensland forest industry, by region – all parts of the industry ................... 19
Table 4 Direct employment generated by the forest industry in Queensland , 2017, by sector (Data source:
2017 industry survey, unless otherwise noted) .................................................................................................... 24
Table 5 Direct employment generated by the plantation industry, 2017, by region (Data source: 2017 industry
survey, unless otherwise noted) ........................................................................................................................... 25
Table 6 Direct employment generated by the Queensland industry, 2017, by local government area .............. 27
Table 7 Employment multipliers: indirect employment generated by the Queensland forest industry, by sector
.............................................................................................................................................................................. 30
Table 8 Employment multipliers: indirect employment generated by the Queensland forest industry, by region
.............................................................................................................................................................................. 30

iv
Table 9 Comparison of forest industry employment generated up to point of sale of primary processed
products: 2016 Census and 2017 Forest Industry Survey .................................................................................... 33
Table 10 Forest industry employment recorded in the ABS Census of Population and Housing over time (data
source: ABS Census 2006, 2011, 2016) ................................................................................................................. 38
Table 11 Full-time, part-time and casual work in the Queensland forest industry, 2017 – industry survey results
.............................................................................................................................................................................. 40
Table 12 Proportion of Queensland workforce employed full-time and part-time, 2006-2016 – ABS Census of
Population and Housing ....................................................................................................................................... 41
Table 13 Working hours by industry sector, 2006-2016 – ABS Census of Population and Housing ..................... 42
Table 14 Income earned by workers, 2006-2016 – ABS Census of Population and Housing ............................... 43
Table 15 Income earned by full-time workers, 2006-2016 – ABS Census of Population and Housing ................. 43
Table 16 Workforce characteristics: gender (2017 Industry survey) .................................................................... 44
Table 17 Workforce by gender composition, 2006-2016 – ABS Census of Population and Housing ................... 44
Table 18 Workforce by age, 2006-2016 – ABS Census of Population and Housing .............................................. 45
Table 19 Aboriginal and Torres Strait Islander participation in workforce, 2006-2016 – ABS Census ................. 46
Table 20 Skills and accreditation needs reported by businesses in Queensland ................................................. 50
Table 21 Types of training used by forest industry businesses in Queensland .................................................... 51
Table 22 Formal educational attainment: rates of attainment of high school and post-school qualifications in
the Queensland forest industry, 2006 to 2016 ..................................................................................................... 53
Table A1.1 Expenditure by the forest industry, 2015-16, by region ..................................................................... 73
Table A1.2 Expenditure by the forest industry, 2015-16, by industry sector ....................................................... 74
Table A1.3 Economic impacts of the Queensland forest industry, by sector, on the South East region ............. 75
Table A1.4 Economic impacts of the Queensland forest industry, by sector, on the Southern Region ............... 76
Table A1.5 Economic impacts of the Queensland forest industry, by sector, on the Wide Bay Burnett Region . 77
Table A1.6 Economic impacts of the Queensland forest industry, by sector, on the Central Region .................. 78
Table A1.7 Economic impacts of the Queensland forest industry, by sector, on the North Region .................... 79
Table A1.8 Economic impacts of the Queensland native eucalypt forest industry, by sector ............................. 80
Table A1.9 Economic impacts of the Queensland native cypress forest industry, by sector ............................... 81
Table A1.10 Economic impacts of the Queensland softwood pine plantation industry, by sector ...................... 82
Table A1.11 Economic impacts of the Queensland Araucaria plantation industry, by sector ............................. 83
Table A1.12 Economic impacts of the Queensland forest industry, by sector – all of Queensland, all parts of the
industry ................................................................................................................................................................. 84
Table A1.13 Proportion of Wide Bay Burnett residents who reported the forest, farming and tourism industries
had a NEGATIVE impact on different aspects of community life ......................................................................... 85
Table A1.14 Proportion of Wide Bay Burnett residents who reported the forest, farming and tourism industries
had a POSITIVE impact on different aspects of community life ........................................................................... 86
Table A3.1 Employment in the forest industry in the 2016 ABS Census, by place of usual residence and place of
work ...................................................................................................................................................................... 90
v
Acknowledgments This study was funded by Forest and Wood Products Australia, and conducted in partnership with
the Queensland Department of Agriculture and Fisheries. We thank these organisations for their
support for the study, and in particular Kerrie Catchpoole, Senior Project Officer, DAF. Many
businesses in Queensland contributed considerable time to this study, providing detailed
information about their operations and about the industry in the region more generally. We thank
all those who provided their time, effort and expertise to help inform the study.
Revised edition of report This second edition replaces the March edition of this report. The first edition underestimated
employment in the Queensland forest industry, due to accidental exclusion from employment
estimates of some mills processing small volumes and/or relying largely or wholly on privately-
owned forest resource. This edition of the report includes this employment and provides updated
estimates of both employment and economic value of the forest industry in Queensland.

vi
Executive Summary
Introduction
The forest industry in Australia contributes to jobs and economic activity in many communities.
During the last decade, there has been little information on how the industry is changing in different
regions, including change in the number of jobs generated, dependence of different communities on
the economic activity generated by the industry, the type and quality of work generated in the
industry, and how residents of forest-industry dependent communities view the industry and its
effects. Forest and Wood Products Australia has invested in research to produce up-to-date
information on the socio-economic impacts of the forest industry. This report presents findings for
the forest industry in Queensland.
The data analysed for this report was drawn from (i) a survey of forest industry businesses
conducted in 2016 to 2017, in which 61% of businesses completed the survey, while data on the
remaining 39% was obtained from industry experts, other businesses, and publicly available
information; (ii) the 2006, 2011 and 2016 Australian Bureau of Statistics (ABS) Census of Population
and Housing; (iii) economic modelling using EconSearch’s RISE regional input-output model; and (iv)
the 2016 Regional Wellbeing Survey, used to examine perceptions of the forest industry by residents
living in communities in which the forest industry operates.
Understanding the forest industry
Queensland’s forest industry is diverse, and includes wood and fibre production from native
eucalypt forest, native cypress forest, southern pine plantations and Araucaria plantations, as well as
a small area of hardwood plantations. It has a supply chain with three distinct parts. In the first two
parts – primary production and primary processing - native forest and plantations are grown and
harvested (primary production), and logs are processed into primary products such as sawntimber
and woodchips (primary processing). In primary production and primary processing the jobs
generated depend almost entirely on harvest of wood and fibre from native forest and plantations
grown in Queensland, with only small volumes of logs imported for processing from nearby locations
in New South Wales. These ‘primary’ products are then either sold directly into end-use markets, for
example into industries such as construction; or are sold for further processing into ‘secondary’
products by other processors. In the third part of the supply chain, the ‘secondary processing’ sector,
those primary wood and fibre products that were not sold for direct use are further processed into a
range of products (for example, cabinets, furniture, and paper packaging products). While secondary
processing jobs still rely on wood and fibre as a key input in processing, the wood or fibre used can
be sourced either from Queensland-grown wood and fibre or from wood and fibre that has been
grown and undergone primary processing in other parts of Australia or other countries.
Which parts of the forest industry are analysed in this report?
This report principally examines the primary production and primary processing parts of the forest
industry. A limited amount of data on secondary processing is also provided, drawing on
employment data from the Australian Bureau of Statistics (ABS) Census of Population and Housing.
This report focuses on the employment and economic activity generated as a result of harvesting of
wood and fibre from native forest and plantations, processing of these into wood products, as well

vii
as secondary processing of wood and paper products. The plantations and native forest managed for
timber production in Queensland also often provide a base for other socio-economic activities, such
as bee keeping, livestock grazing, mountain biking, bushwalking, horse riding, and hunting. These
activities are not examined in this report.
In this report, forest industry activities in Queensland are analysed for the state as a whole. Data are
also produced for the sub-regions of the South East, Southern, Wide Bay Burnett, Central and
Northern regions. Each of these is described in the report, including the types of forest industry
activities occurring in each region, and the economic activity and employment generated in each
region by the industry.
Economic value
In 2015-16, the direct value of output generated by the Queensland forest industry at the point of
sale of primary processed products was $743 million, increasing to $1,762 million when flow-on
effects generated in other industries as a result of spending by the forest industry are included. This
total included $432 million in the South East, $112 million in the Southern, $775 million in the Wide
Bay Burnett, $60 million in the Central and $70 million in the Northern region. However, value of
output is not always a good indicator of the industry’s overall contribution to the local economy, as
it does not identify the extent to which the economy of a given region benefited from the industry’s
activity in the form of returns to business owners, wages and salaries, and taxes. Measuring the
industry’s contribution to Gross Regional Product (GRP – the regional equivalent of Gross Domestic
Product) helps address this. Measures of GRP quantify the value added by the industry to the local
economy as a whole, meaning value contributed after subtracting non-wage expenditure from
revenue. In 2015-16, the forest industry directly contributed around $299 million to GRP in
Queensland, and a total of $806 million once flow-on effects through the entire economy were
included. This total included $181 million from business activities dependent on eucalypt native
forests, $36 million dependent on native cypress forest, $448 million dependent on southern pine
plantations, and $122 million dependent on Araucaria plantations. The contributions to total GRP by
region were $200 million in the South East, $60 million in the Southern, $326 million in the Wide Bay
Burnett, $33 million in the Central and $35 million in the Northern region.
Employment
The forest industry in Queensland generated a total of 3,661 direct jobs up to the point of primary
processing in 2017. A further estimated 5,137 further direct jobs were generated by secondary
processing activities that use wood and fibre products both from the Queensland forest industry and
imported from interstate or overseas (as of August 2016), based on data from the ABS Census. This
means an estimated total of 8,798 direct jobs were generated in the Queensland forest industry in
2017.
Of the 3,661 jobs generated up to the point of primary processing in 2017, 991 were generated by
the native eucalypt sector, 271 by the native cypress sector, 1,666 by the southern pine plantation
sector, and 608 by araucaria plantations. In the secondary processing sector, it was not possible to
identify how many jobs were dependent on different types of native forest and plantation grown in
Queensland or on timber imported from other regions.
viii
The number of direct jobs generated by the industry varied by region. Of the 8,798 direct jobs
generated up to and including secondary processing, 5,243 were generated in the South East region
(most being secondary processing jobs located in major urban areas such as Brisbane), 1,919 were
generated in the Wide Bay Burnett region (mostly in primary processing), 660 were generated in the
Southern region, 604 jobs in the North region and 372 in the Central region.
Many of the direct jobs generated by the Queensland forest industry are located in just a few local
government areas (LGAs): 54.7% of employment up to primary processing was located in the LGAs of
Gympie, Fraser Coast, Moreton Bay and Brisbane City. The LGAs with the highest dependence on the
forest industry for employment were Gympie, with 4.6% of jobs directly dependent on the forest
industry, North Burnett (2.6%) and Fraser Coast (2.3%). In all other LGAs less than 2% of jobs were
directly dependent on the forest industry, with the next highest levels of job dependence occurring
in Maranoa Regional Council (1.9%), and South Burnett Regional Council (1.5%).
For every direct job generated in the Queensland forest industry up to and including primary
processing, one job is created in the broader economy as a result of the flow-on activities generated
in other industries by demand from the forest industry. The activities of the people employed in the
3, 661 jobs generated up to primary processing in 2017 created a further 3,610 flow-on jobs in
industries outside the forest industry. The flow-on effects varied in size in different parts of the
industry, with the largest flow-on effects generated by the processing of wood products, and
silviculture and harvest and haulage activities having smaller flow-on effects to the rest of the
economy.
There is little information available on how employment is changing in the forest industry over time.
The only source of data on change over time is the ABS Census of Population and Housing (Census).
Census data showed a 40.7% decline in total employment in the forest industry between 2006 and
2016, including a 19.8% decline from 2006 to 2011, and a 26.1% decline between 2011 and 2016.
This overall trend masked some differing trends within different industry sectors. Between 2011 and
2016, ABS Census data recorded growth of 9.5% in employment in the primary production part of
the industry. During the same period, employment in wood and paper product manufacturing
(including both primary and secondary processing) declined by 31.8%.
Working conditions
Successfully recruiting and maintaining a strong workforce can be challenging for a regionally-based
industry, with many rural and regional areas having a relatively small labour force compared to
larger urban areas. The Queensland forest industry generates more full-time jobs than other
industries, with 86% of those employed in the industry working full-time, compared to 65% of the
broader workforce in Queensland. Workers in some parts of the industry work longer hours than is
typical in most industries, particularly those employed in harvest and haulage contracting firms.
Forest industry workers are slightly less likely than those in other industries to earn lower incomes
(less than $600 per week), and less likely to earn high incomes (above $1,250 per week).
Workforce diversity and sustainability
To be sustainable over time, every industry needs to successfully recruit and retain workers. In the
Queensland forest industry, only 18% of workers are female (compared to 48% of the broader

ix
employed labour force). The industry’s workforce is ageing at a similar rate to the labour force as a
whole, and as of 2016 had a similar age structure to the broader employed labour force working in
the same regions of Queensland that the industry operates in. In total, 3% of the industry’s
workforce identifies as Aboriginal or Torres Strait Islander, slightly higher than the 2% amongst
Queensland workers more generally.
When asked how easy or difficult they found it to recruit different types of workers, a majority of
businesses reported finding it difficult to recruit heavy machine operators, managers and
professional staff. Factors that made recruitment challenging included low availability of workers
with appropriate skills, the time required to build the required skills, and difficulty competing with
wages offered by other businesses. Almost half of businesses had challenges related to workers
being unwilling to shift to the community the business was based in.
Industry skills and training needs
Forest industry businesses were asked what types of skills were needed by their workforce, whether
they required workers to have formal accreditation in these skills, and how they currently provided
training. Businesses most commonly reported needing workers with skills in heavy machinery
operation (82% of businesses), occupational health and safety training (76%), operation of hand-held
machinery such as chainsaws (71%), compliance training (67%), fire-fighting (53%) and business and
financial management (40%). There was variation in needs for skills and accreditation between
businesses types, with some skills specialised to particular parts of the industry.
Businesses were also asked to identify whether they delivered skills training in different competency
areas via in-house training by other staff, in-house training by an expert, or training via a registered
training organisation (RTO). RTOs were most commonly used to provide training in business and
financial management, occupational health and safety training and heavy machinery operation; they
were also the most common methods for training in compliance, fire-fighting and hand-held
machinery operation, although for the latter many businesses also provided in-house training. In-
house training was more common than use of a RTO for forest ecology and silviculture, forest
operations, and IT.
As of 2016, forest industry workers in most parts of the industry were less likely to have completed
high school than those working in other industries, although high school attainment rates did
increase between 2006 and 2016. However, forest industry workers were more likely to have
completed a certificate qualification than those in other parts of the workforce. Completion of a
Bachelor degree or other university qualification was lower than the average for the employed
labour force in most parts of the industry.
Business and market outlook
Businesses were asked about the business and market conditions and challenges they were
experiencing, and the extent to which they could cope with difficult business conditions. These
questions help identify both areas of strength and areas of challenge being experienced by the
industry. Around one in five (21%) of businesses in Queensland reported that conditions were ‘easier
than usual’, another 21% reported that they were ‘more challenging than usual’, and the majority
(58%) reported that conditions were ‘about the same as usual’. A little less than half (45%) felt

x
demand would remain the same, and the remaining businesses (55%) felt that demand would grow.
No businesses indicated that they felt demand would shrink over the next 12 months. Native forest-
dependent businesses were more likely to expend demand to remain stable (75%), while those in
the plantation sector more commonly felt demand would grow (61%).
Businesses were asked to rate the extent to which different factors had been a challenge or
problems for their business in the last three years. The most common challenges in the last three
years were difficulty obtaining labour (65% of businesses reporting this as a big challenge),
increasing cost of labour (58%), government regulations (47%), rising input costs (47%) and lack of
demand for their goods or services (44%).
Community perceptions of the social, economic, service and infrastructure effects of the forest
industry
To further evaluate the socio-economic effects of the forest industry in the communities in which it
operates, residents living in different regions were asked about (i) their overall views about quality
of life and liveability of their community, and (ii) the extent to which they felt the different industries
that operated in their region affected different social and economic aspects of their lives. Overall,
the results suggest that those living in regions with higher dependence on the forest industry are just
as or likely to rate their community as highly liveable, friendly, safe and aesthetically pleasant as
those living in nearby communities with less dependence on the forest industry.
Of those living in local government areas in the Wide Bay Burnett with higher dependence on the
forest industry, 54% reported that the forest industry was important to their local community,
although only 24% felt that wood product manufacturing was important locally, despite this being
the part of the industry generating the most employment.
When asked to assess the effects they felt the forest industry had on their community, most people
who felt the forest industry was an important contributor to their community also felt it had positive
impacts on local employment. However, when asked about contributions other than employment,
residents generally perceived the forest industry as having fewer positive effects than the farming
and tourism industries, with fewer than 30% feeling the industry had positive impacts on aspects of
communities such as friendliness of the community, cost of living, or health of the local
environment. When views about negative impacts were examined, the most common concerns
reported about the forest industry were related to road impacts and landscape aesthetics, with 40%
to 50% reporting concerns about impacts of the industry on the quality of and traffic on local roads,
and concerns about negative impacts on the attractiveness of the local landscape also reported in
some regions.
Conclusions
This report quantifies the employment and economic activity generated by the forest industry, and
identifies the communities in which the industry generates a significant proportion of local jobs. The
analysis shows that the Queensland forest industry has declined in size over time, despite some
growth in employment in primary production jobs between 2011 and 2016. As of 2017, the industry
generated 8,798 direct jobs, of which the majority were secondary processing jobs (not all of which
rely on forest or plantation grown in Queensland). The majority of jobs generated by the industry

xi
are generated by the processing sector, as is the majority of the flow-on economic impact of the
industry. This highlights the importance of local processing of wood and fibre for generation of jobs
from the industry; far fewer jobs are created if logs are harvested and exported with no or little
processing. Many of these jobs are clustered in the Wide Bay Burnett and South East regions. There
is relatively high business confidence, with businesses expecting demand for their products to
remain the same or increase. However, many businesses find it difficult to recruit workers,
particularly due to a lack of skilled workers and competition from other industries.
1
Introduction The forest industry in Australia contributes to jobs and economic activity in many communities. This
contribution results from the growing, management and harvesting of plantations and native
forests, and processing of logs into wood and fibre products such as sawn timber for use in
construction, appearance products such as flooring and decking, woodchips for export, pulp and
paper.
Like many other industries, Australia’s forest, wood and paper industries are changing rapidly, with
ongoing investment in new technology, skills and changing markets all contributing to evolving skills,
training and technology needs. During the last decade, there has been little information on how the
industry is changing in different regions, including change in the number of jobs generated,
dependence of different communities on the economic activity generated by the industry, the type
and quality of work generated in the industry, and how residents of forest-industry dependent
communities view the industry and its effects.
Forest and Wood Products Australia has invested in research to produce up-to-date information on
the socio-economic impacts of the forest industry in Queensland, South Australia, Tasmania,
Victoria, and parts of New South Wales. This report presents findings for the forest industry in
Queensland.
This report examines activity dependent on the harvest of timber from softwood plantation
(southern pine and Araucaria), native cypress forest and native eucalypt forests in Queensland. It
examines the following aspects of the Queensland forest industry:
• Employment generated by the industry, including direct and flow-on jobs
• Economic value of the industry, including direct and flow-on economic activity
• Working conditions, workforce diversity, and workforce sustainability
• Skills and training needs for the forest industry
• Business and market outlook reported by businesses operating in the industry, and
• Community perceptions of the industry.

2
Methods The data analysed for this report was drawn from the following sources:
• 2016-17 Industry Survey: A survey of forest industry businesses operating in Queensland
conducted in 2017. Of 95 key businesses (including nurseries, plantation management
businesses, silvicultural contractors, harvest and haulage contractors, and wood processors),
61% took part in the survey, while 39% did not take part. Most non-participants managed
smaller businesses, particularly contracting businesses. Paper product manufacturers were
not captured as part of the survey process, as they predominantly use recycled paper
product and feedstock in Queensland. A further approximately 99 small mills (typically
employing less than eight people) and contracting businesses (predominantly harvest,
haulage and silvicultural contractors) were not asked to take part, with information instead
obtained via data provided by forest/plantation managers, publicly available information,
forest industry experts, and (in the case of some contractors) primary processors who used
their services. Of the 61% of the surveyed businesses who completed the survey, 45%
completed a longer version of the survey (including most larger businesses), and 55% a
shorter version which asked for less information about issues such as market trends and
certification. Information on non-responding businesses was identified based on (i)
information provided by forest and plantation managers on their use of contracting services,
(ii) information from past surveys, (iii) advice from industry experts familiar with the
businesses, and (iv) publicly available data on non-responding businesses.
• 2006, 2011 and 2016 Census: Data from the Australian Bureau of Statistics (ABS) Census of
Population and Housing were drawn on to examine working conditions and socio-
demographic characteristics of the industry’s workforce.
• Economic modelling: Economic modelling using EconSearch’s RISE regional input-output
model has been used to identify flow-on jobs and economic activity generated by the forest
industry.
• 2016 Regional Wellbeing Survey: Perceptions of the forest industry by residents living in
communities in which the forest industry operates were measured as part of the Regional
Wellbeing Survey, a large survey of 13,000 Australians living in regional and rural areas.
3
Overview of the industry – Queensland Queensland’s forest industry is diverse, and includes wood and fibre production from forests and
plantations grown in the state including native eucalypt forest, native cypress forest, softwood
plantations and a small area of hardwood plantations; as well as the processing of timber imported
from other states and countries. This section briefly describes the industry. First, the structure of the
industry is examined, focusing understanding the industry in terms of the supply chain from
plantation and native forest management in Queensland to processing of a range of products based
on both Queensland-grown wood and fibre and wood and fibre imported from other locations. The
second part then examines the industry dependent on native forest and plantations in more detail,
focusing on the locations of the forests and plantations these three key industry sectors depend on,
and the type of processing activity that utilises wood and fibre from each.
Industry structure
The forest industry in Queensland, like most of Australia, has a supply chain with three distinct parts:
primary production, primary processing and secondary processing. Primary production involves the
establishing, growing and harvesting of logs ready for primary processing. Primary processing
involves processing of roundwood (harvested logs) into initial products such as sawn timber and
woodchips, and usually uses logs from plantation or native forest grown within a relatively short
distance of the processing plant (less than 200 kilometres in most cases). Secondary processing
involves further processing of these initial products into a wide range of further processed products,
and is less reliant on locally-grown timber, with secondary processors often importing their wood
and paper inputs from other states or other countries as well as purchasing them from local primary
processors. Each stage is described in more detail below.
1. Jobs generated in primary production of wood and fibre products. In this part of the industry,
trees are grown and harvested to produce roundwood (logs), in native forests (cypress, eucalypt)
and plantations (southern pine, Araucaria, and a small amount of eucalypt plantations). The
activities involved in primary production include management of native forest and plantation by
forest management businesses and agencies, silvicultural contractors, and harvesting and haulage of
logs to primary processors.
2. Jobs generated up to and including primary processing of wood and fibre products. Primary
processing means processing of logs into initial products. In Queensland, primary processing jobs are
generated in wood product manufacturing. Whereas in other states primary processing also includes
production of pulp and initial paper products from pulplogs, in Queensland all paper processors are
secondary processors1.
Primary processing activities are based almost entirely on wood and fibre grown in Queensland. This
means that the primary production of logs and primary processing combine to create a strongly
inter-linked supply chain within Queensland. This supply chain generates employment and economic
activity based on the management and harvesting of mostly Queensland-grown logs for wood and
fibre production from native forests and plantations. Harvested logs are processed from logs into a
range of primary products including sawn timber, composite wood products such as particleboard,
1 In Queensland, all paper product manufacturing was considered to be secondary processing, as no paper manufacturers manufacture pulp from roundwood or woodchips harvested in Queensland.
4
and woodchips. The products from primary processing are then either sold directly into end use
markets such as the construction industry, or sold for further processing into ‘secondary’ products
by other processors.
3. Jobs generated in ‘secondary’ processing. Secondary processing involves further processing of
primary processed wood and fibre (for example, rough sawn timber or paper) into a range of further
products (for example, cabinets, furniture, paper-based packaging products). While these jobs still
rely on wood and fibre as a key input in processing, the wood and fibre inputs are often combined
with other products (for example, fabric covers on furniture, plastic components), and may be
sourced from Queensland-grown wood and fibre, or from wood and fibre that has been grown and
undergone primary processing in other parts of Australia or other countries. In addition to this, many
of the residues produced in primary processing (for example, bark, sawdust and docking ends of
logs) are sold to businesses such as firewood sellers, agricultural businesses for use as animal
bedding, and garden and landscape businesses.
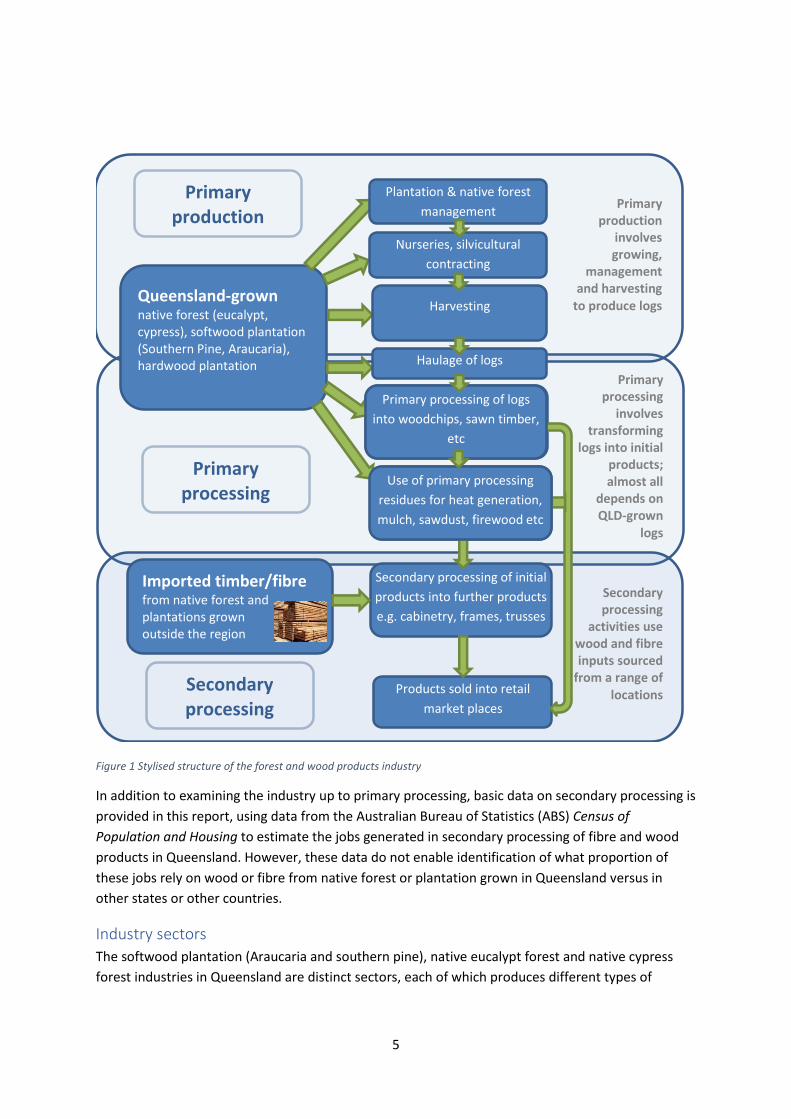
Figure 1 provides a stylised representation of this structure. This report focuses primarily on
understanding the employment and activity generated by the industry up to and including the
‘primary processing’ stage. The primary processing stage was defined for this report as including all
processors who take roundwood (logs) harvested from native forest or plantations, and includes all
products from those processors. In some cases, a single processor may process roundwood into
multiple products on a single site, including engaging in some activities often considered part of the
secondary processing sector. In these cases, all that processor’s activities were included in the
analysis.
5
Figure 1 Stylised structure of the forest and wood products industry
In addition to examining the industry up to primary processing, basic data on secondary processing is
provided in this report, using data from the Australian Bureau of Statistics (ABS) Census of
Population and Housing to estimate the jobs generated in secondary processing of fibre and wood
products in Queensland. However, these data do not enable identification of what proportion of
these jobs rely on wood or fibre from native forest or plantation grown in Queensland versus in
other states or other countries.
Industry sectors
The softwood plantation (Araucaria and southern pine), native eucalypt forest and native cypress
forest industries in Queensland are distinct sectors, each of which produces different types of
Primary processing of logs
into woodchips, sawn timber,
veneer, MDF, particleboard
etc
Use of primary processing
residues for heat generation,
mulch, sawdust, firewood etc
Primary processing
involves transforming
logs into initial products; almost all
depends on QLD-grown
logs
Primary production
involves growing,
management and harvesting
to produce logs Queensland-grown native forest (eucalypt, cypress), softwood plantation (Southern Pine, Araucaria), hardwood plantation
Nurseries, silvicultural
contracting
Plantation & native forest
management
Harvesting
Haulage of logs
Secondary processing
activities use wood and fibre inputs sourced
from a range of locations
Imported timber/fibre from native forest and plantations grown outside the region
Secondary processing of initial
products into further products
e.g. cabinetry, frames, trusses
Products sold into retail
market places
Primary processing of logs
into woodchips, sawn timber,
etc
Use of primary processing
residues for heat generation,
mulch, sawdust, firewood etc
Primary production
Primary processing
Secondary processing

6
products and services different markets. As shown in Figure 2, in many cases these also have specific
geographic distributions within Queensland.
Figure 2 Distribution of native forest and plantations harvested for commercial timber production, Queensland (reproduced from State of Queensland, 2016)
7
These different sectors are described briefly below, followed by an overview of economic activities
other than wood and fibre production that also occur in native forest and plantation areas.
Native eucalypt forest sector
A large part of the 20 million hectares of state-owned native forests available for commercial timber
production in Queensland is native eucalypt forest; another approximately one million hectares of
native forest is also located on private land (State of Queensland 2016). As shown in Figure 2,
publicly owned eucalypt forests that are harvested commercially are predominantly located in
south-east Queensland, with the majority located south of Rockhampton and smaller areas
extending to the northernmost parts of the state; the western-most extent is just west of Injune.
A total of 22 larger primary processors (employing more than 10 people) are engaged in sawmilling
or other processing of logs harvested from publicly and privately owned native eucalypt forests, of
which all but five are dedicated solely to processing native eucalypt roundwood (logs). About 37
additional mills (around half employing between 6 and 10 people, and the remainder employing less
than 5 people) process small amounts of roundwood harvested from a mixture of publicly owned
and privately owned native eucalypt forest.
Native cypress pine sector
A significant processing industry utilises native cypress pine. Cypress pine dominated forest is
located further inland than most eucalypt dominated forest, and stretches in an inland band from
Tambo in the north to the southern border, with Dalby marking the typical easternmost extent of
the commercially harvested forest areas. Almost all logs harvested from native cypress pine forest
are processed at one of the 14 operating cypress mills, the majority of which are located relatively
close to the forests.
Softwood plantation sector – Araucaria
Queensland is unique in having a plantation estate based on a native softwood species, with an
estate of 44,300 hectares of Araucaria (hoop pine), established predominantly in the south-eastern
parts of Queensland (around Imbill, Jimna, Gallangowan and Blackbutt), with some additional areas
in Central Queensland (near Monto and Mackay) and in North Queensland near Atherton (HQ
Plantations n.d.[a]). Many of these plantations were originally established as early as the 1920s, and
they are typically grown on long rotations (45 years or longer) (HQ Plantations n.d.; MBAC 2005).
The harvested timber is processed for use in a range of decorative timber applications such as
veneer, furniture, door and window framing, and musical instruments. The majority of harvested
logs are sent to eight processing sites and processed into a wide range of products, many of which
are then sent to secondary processors such as wooden component manufacturers who further
process them. Most of these processors focus solely on Araucaria processing, although a small
number process both Araucaria and other species.
Softwood plantation sector – southern pine
The majority of Queensland’s plantations are southern pine (constituting a combination of slash
pine, Caribbea pine, and a hybrid of the two species), with just under 149,000 hectares established.
These plantations are located in (HQ Plantations n.d. [b]):
• South East Queensland (largest areas of plantation), with plantations at Beerburrum, Fraser
Coast, Gympie, Pechey/Passchendaele and near Bundaberg

8
• Central Queensland in estates located near Yeppoon and Mackay
• North Queensland near Ingham and Atherton.
The majority of logs harvested are processed at one of 18 processing sites across Queensland,
almost all of which solely process southern pine.
Hardwood plantation sector
There are approximately 15,000 hectares of hardwood plantation in Queensland, most of which is
not of harvestable age. This is a substantial decline from the approximately 40,000 hectares of
hardwood plantation established by managed investment scheme companies in the early and mid-
2000s, most of which did not grow successfully and have been cleared with land being reverted to
use for agriculture (State of Queensland 2016).
Other activities
In addition to producing wood to supply the wood processing industry in Queensland, the
plantations and native forest managed for timber production in Queensland provide a base for other
socio-economic activities. These activities include substantial areas of land used for livestock grazing,
and bee keeping, as well as a large proportion of both native forest and plantation estate being
available for recreational activities including mountain biking, bush walking, picnics and camping,
dirt biking, and horse riding. Recreational hunting does not typically occur in native forest and
plantation managed for commercial timber production. The economic value of these other activities
has not been estimated as part of this report, which includes only the economic value of wood
products produced from plantations and native forest.
Regions analysed in this report
In this report, forest industry activities in Queensland are analysed based on examining the region as
a whole, and five subregions:
• South East: The South East region encompasses urban and peri-urban areas in the south east
and includes the local government areas of Brisbane, Gold Coast, Ipswich, Lockyer Valley,
Logan, Moreton Bay, Noosa, Redland, Scenic Rim, Somerset and Sunshine Coast. While this
region does not have substantial areas of plantation or native forest available for commercial
timber harvest, many people employed in managing forests and plantations are based in this
region, and several primary processors (including processors of native eucalypt forest, Araucaria
and southern pine) are located in the region. The large majority of secondary processing in
Queensland occurs in this region.
• Southern: The Southern region includes LGAs further inland from the South East, including
Balonne, Goondiwindi, Maranoa, Southern Downs, Toowoomba, and Western Downs. Most
employment in the industry in this region is in primary processing: almost all cypress pine jobs
are located in this region, together with around 20% of jobs dependent on Araucaria and a
small number dependent on native eucalypt forest and southern pine.
• Wide Bay Burnett: The Wide Bay Burnett region includes a large proportion of Queensland’s
plantation estate, and the majority of jobs in primary processing are also located in this region,
which includes the LGAs of Bundaberg, Fraser Coast, Gympie, North Burnett and South Burnett.
The majority of jobs reliant on southern pine and native eucalypt forest are located in this
region.

9
• Central: The Central region has smaller areas of plantation and of native forest, with a relatively
small forest industry developed around these. It includes the LGAs of Banana, Blackall Tambo,
Central Highlands, Gladstone, Isaac, Livingstone, Mackay, Rockhampton, and Whitsunday.
• North: The North region has a small forest industry based on both plantations and native
eucalypt forest, and includes the LGAs of Burdekin, Cairns, Cassowary Coast, Charters Towers,
Cook, Douglas, Hinchinbrook, Mareeba, Napranum, Tablelands and Townsville.

10
Economic value This section examines the economic value generated by the Queensland forest industry. As
economic value can be estimated using multiple approaches, we first describe the measures used in
this report. This is followed by analysis of:
(i) the direct value of the industry – the value of the activity generated by the forest
industry, without including flow-on effects of this activity through the broader economy,
and
(ii) the total economic value of the industry, which includes both economic activity
generated directly by forest industry businesses, and the flow-on effects of this activity
through the broader economy.
Measuring economic impact
A number of economic indicators can be used to examine the value of an industry and estimate its
impact on a specific regional economy. These range from simple measures of expenditure, to
modelled estimates of the net contribution of an industry to the total value of economic activity in a
given region (Gross Regional Production, or GRP). This section explains the measures used in this
report, and why each is used.
Categories of economic impact
When using any measure of economic impact – whether it is value of output, expenditure by an
industry, contribution of an industry to GRP, or generation of employment – it is possible to model
this with a focus solely on the industry’s direct activities, or with a broader focus on how these
activities flow-on through the economy. In this report, we model economic impact based on (i)
direct impacts of the industry, and (ii) total impacts which are the sum of direct impacts plus flow-on
(indirect) impacts of the industry across the whole economy:
• Direct impact is generated directly by firms, businesses and organisations engaged in a
particular industry, in this case the forest industry.
• Flow-on or indirect impacts are the economic activity generated in other industries as a
result of the activity of the forest industry. Total flow-on or indirect impact is the sum of
production-induced and consumption-induced impacts.
o Production-induced impact is generated by businesses outside the forest industry
that supply forest industry businesses. It also includes impacts generated by the
suppliers of those suppliers and so on as successive waves of impact occur in the
economy.
o Consumption-induced impact is generated when workers involved in the forest
industry, and in businesses that supply the forest industry, spend their wages on
goods and services. The impact generated as a result of spending of wages on these
goods and services is consumption-induced.
• Total impact is the sum of direct and flow-on (or indirect) impacts.
When calculating direct and total economic value in this report, the forest industry is treated as a
vertically integrated industry (one part of the industry supplies goods and services to the next in a
chain of supply), in which there are transfers between different parts of the industry at each point in
the supply chain. When calculating economic value, transfers between forest industry businesses are

11
cancelled out so economic value can be quantified in terms of the interaction between the forest
industry and the rest of the economy. Unless otherwise specified, all economic value estimates
exclude transfers occurring within the forest industry.
Direct and flow-on (indirect) impacts of the industry are estimated using four key measures of
economic impact: value of output, value of industry expenditure, contribution to GRP, and
employment.
Value of output
The total value of output of an industry is a relatively simple measure: it is the total revenue earned
by forest industry businesses from sales of goods and services. This provides useful information
about the total economic size of an industry and its output. When reporting value of output, it is
important to estimate value at a specific ‘end point of sale’ – i.e. a particular point in the supply
chain. In this report, the ‘end point of sale’ is the value of the sale of goods from primary processing.
Note that this value excludes sales of products and services between industry businesses at earlier
points in the forest industry supply chain to avoid double counting.
While this indicator provides a useful estimate of total value of an industry at a particular stage of
production – in this case, at the point of sale of primary processed wood products (with no primary
processing by paper processors in Queensland) – it does not provide substantial information about
how that industry has contributed to the local economy, for two key reasons. First, it doesn’t
consider the cost of producing the output. For example, an industry with a turnover (output) of two
billion dollars and expenditure on goods and services of two billion dollars creates less value-add
than one that has a turnover of two billion dollars and expenditure on goods and services of one
billion dollars. Secondly, it matters where expenditures occur when considering flow-on impact. For
example, an industry might generate two billion dollars of sales in a given region, but rely largely on
imported goods and services to produce its output, generating very little local spending or
employment as a result. Another industry, meanwhile, might also generate two billion dollars of
sales, but do this through a locally-based supply chain, generating substantial jobs and expenditure
in the local area as a result. To better understand this, economic modelling can be used to estimate
how much additional value of output is generated in other industries in a given region as a result of
the expenditure of the forest industry in that region. This can be done by modelling production-
induced and consumption-induced effects, as defined earlier.
Given the importance of expenditure to understand how an industry contributes to an economy, it
follows that the amount and location of expenditure should be considered when determining the
economic value of an industry to a region.
Industry expenditure
Industry activity can also be measured by examining value of expenditure. This indicator measures
how much is spent by the industry on goods and services as part of generating the final goods and
services sold. When measured at regional level, this indicator provides an idea of the extent to which
the industry contributes to the economy locally, as it will show how much the industry has spent
within the region versus outside it.
Measures of expenditure differ to value of output, for a range of reasons. In particular, expenditure
excludes business profits (which are captured in value of output), expenditure can sometimes be

12
higher than value of sales over a given period depending on business investment and timing of
production; and not all the expenditure used to produce a given amount of output will have
occurred in the region in which expenditure is being estimated. For example, a business may
generate $1 million in sales in a given region, but only spend $200,000 in that region as part of
generating those sales, with the business purchasing most goods and services from other regions as
part of the production process.
Value of expenditure can be measured in two ways, both of which are presented in this report:
• Gross expenditure – total expenditure by all forest industry businesses, including spending
within and outside the industry. This means some expenditure is ‘double counted’ as it
involves ‘within industry transfers’. For example, if expenditure by a wood processor
purchasing logs from a plantation growing company is included as well as the expenditure
incurred by that company in growing the plantations, this results in ‘double counting’: the
gross expenditure includes the amount spent by the processor on the logs, and also includes
the amount spent by growers to produce those logs. Because of this double counting, gross
expenditure does not indicate the extent to which spending by the whole industry
contributes to the broader economy.
• Net expenditure – expenditure by the forest industry excluding transfers within the industry.
This measure excludes payments made by businesses in one part of the industry to
businesses in another part of the industry. It is a better indicator of the overall economic
activity the industry provides to the local economy, as it identifies the net expenditure the
industry as a whole contributes to the rest of the economy.
Industry expenditure is a useful indicator and provides more concrete data on the extent to which
production of wood products in Queensland results in local economic activity compared to value of
output measures. However, it is still subject to some problems of double counting: if the net
expenditure of all industries in a region is added together, it will result in a value that is larger than
the total value of production in that economy. This is due to the multiple transactions occurring
between different industries in any given economy, some of which are double counted when
expenditure of each individual industry is added together. This potential for double counting means
it is also important to identify the net contribution of the industry to a regional economy, after
taking into account the interactions between all sectors of the economy. This is done through
identifying industry contribution to Gross Regional Production (GRP), described below.
Industry contribution to Gross Regional Product (GRP)
Gross Regional Product (GRP) is the total value of economic production in a region over a period of
time. This can be defined as the sale value of all final goods and services produced in a region over a
given period, less the expenditure on goods and services used to produce them (such as fuel,
utilities, wood and fibre, accountants, office supplies, etc.). Operating a business requires more than
just goods and services as inputs, it also requires capital (such as vehicles, machines and buildings),
labour and land. These are known as ‘primary factors of production’ and GRP is the total amount
paid to the owners of these primary factors. Workers ‘own’ labour and are paid a wage for it,
business owners own land and/or capital and are paid a profit for them. Different types of
businesses use different amounts of each primary factor.
13
GRP includes taxes because it concerns the whole economy, not just the business sector. Even
though the business sector pays some profit to governments, that value is just a transfer within the
economy of value that each business produced. By the same logic, donations made by businesses
are also included in GRP. Annuities paid by growers are payments to the owner of the land used in
production. While these are costs to businesses, they are income to owners of land so are included
in GRP.
This report describes the direct and total contribution to GRP of the forest industry. The direct
contribution to GRP is the GRP created by forest businesses themselves. Total contribution to GRP is
the GRP created by forest businesses, plus the proportion of GRP created in the rest of the economy
of Queensland due to the flow-on activity created by the forest industry (the production-induced
and consumption induced flow-on effects described earlier). GRP is the preferred measure of
economic contribution because it avoids the problem of double counting that can arise from using
value of output or industry expenditure.
Employment
Subsequent parts of this report describe the employment generated by the forest industry in detail.
Employment is defined in this report as the total number of people employed in the industry. It is
measured as both direct employment (generated by the forest industry) and flow-on/indirect
employment generated in other industries as a result of forest industry activity. Employment in this
report is reported based on the total number of people employed, rather than full-time equivalents
(FTE). This is done for two reasons: first, because a person whose job is in the industry is likely to rely
on that income for their livelihood irrespective of whether the job is part-time or full-time; and
second, because data from other sources such as the Australian Bureau of Statistics (ABS) measure
jobs in terms of numbers of people, not FTE.
Direct economic value
This section examines the ‘direct’ value of the Queensland forest industry, meaning the value of the
output produced by the industry, expenditure made by the industry, and the subsequent
contribution of the industry to GRP. These direct estimates do not take into account the flow-on, or
indirect, activity that is generated in other parts of the economy as a result of forest industry
activity. This information provides context on the overall economic size of the industry and its
activities. The next section then examines the total economic contribution of the industry after
taking into account interactions between the forest industry and other parts of the economy.
Direct value of output of the Queensland forest industry
In 2015-16, the direct value of output from the Queensland forest industry at the point of sale of
primary processed products was $743 million. This excludes sales of products or services occurring
at earlier points in the supply chain prior to primary processing, to avoid double counting. This
included $144 million from business activities dependent on eucalypt native forests, $30 million
dependent on native cypress forest, $438 million dependent on southern pine plantations, $115
million dependent on Araucaria plantations, and $26 million dependent on hardwood plantations2.
These figures do not include the value of the output generated beyond this point by secondary
2 There is very little harvest and sale of products from hardwood plantations in Queensland, and the value of output here largely reflects the sale of services involved in managing hardwood plantations as well as value of log sales from the small amount of timber harvested.
14
processing which, as described earlier, generates additional value and draws on both wood and fibre
produced in Queensland, and on wood and fibre products imported from other states or from other
countries.
The ABS Australian Industry series (2017) reports sales and services income for Wood Product
Manufacturing in Queensland in 2015-16 as $2,593 million. This differs from the value reported in
this report for three reasons:
• Scope (the key reason) – the ABS publication includes secondary processing, this report
does not.
• Sampling error – like this report, the ABS uses a survey to collect industry data. Each survey
captured a different sample of businesses which naturally led to ‘survey error’ between the
results.
• Modelling method – like this report, the ABS uses a model to estimate the business activity
that was not captured in the survey sample. Differences between the two models also
contributes to the difference between the results.
Direct expenditure by the Queensland forest industry
Value of output does not provide a picture of the extent to which an industry contributes directly to
the region it is located in. Examining expenditure helps to answer questions such as whether
industry expenditure largely occurs locally, or is mostly occurring some distance from the region in
which the business is located.
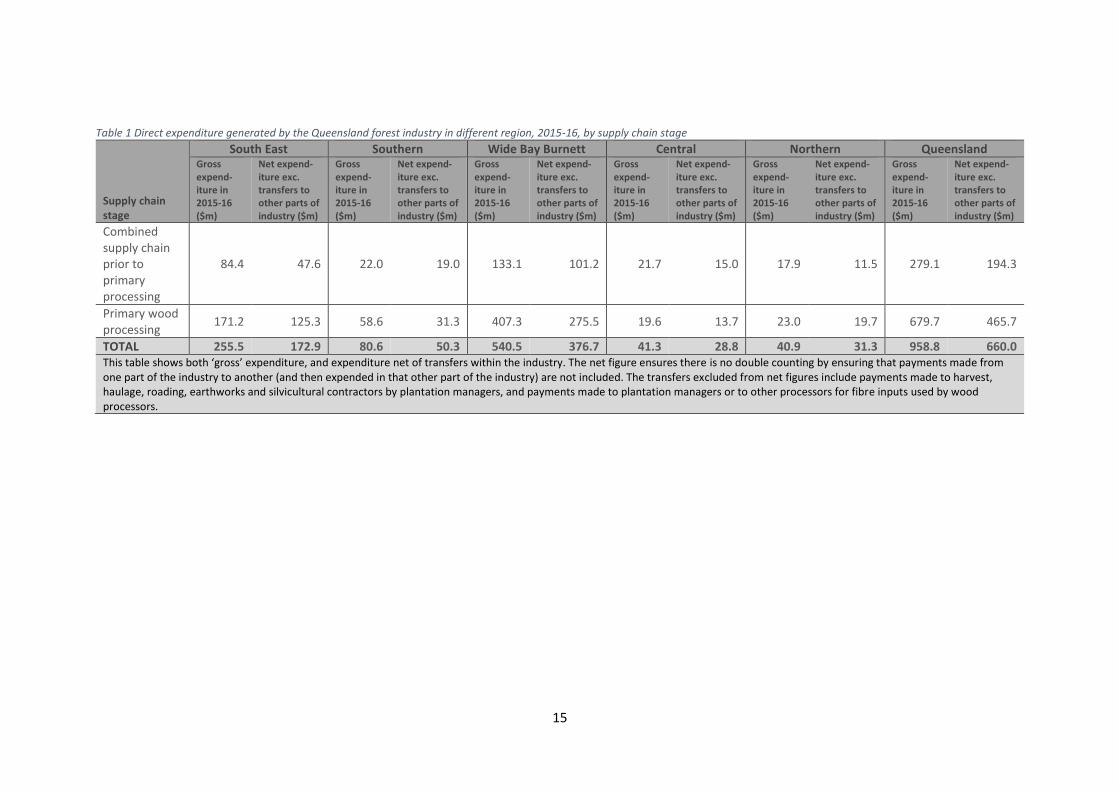
In total, in 2015-16, the Queensland forest industry generated $660 million in direct net expenditure
as a whole, up to and including primary processing, including $173 million in the South East, $50
million in the Southern, $377 million in the Wide Bay Burnett, $29 million in the Central and $31
million in the Northern region.
To help understand where industry expenditure is generated, Tables 1 and 2 show both gross and
net expenditure: while gross expenditure is not a true measure of economic contribution, as it
double counts some expenditure that involves transfers within the industry, it shows the relative
size of different parts of the supply chain. Net expenditure is a measure of economic contribution
and shows how much expenditure outside of the forest industry is added at different points in the
supply chain. Most expenditure is generated at the stage of primary processing of wood products, as
shown in Tables 1 and 2.
15
Table 1 Direct expenditure generated by the Queensland forest industry in different region, 2015-16, by supply chain stage
Supply chain stage
South East Southern Wide Bay Burnett Central Northern Queensland Gross expend-iture in 2015-16 ($m)
Net expend-iture exc. transfers to other parts of industry ($m)
Gross expend-iture in 2015-16 ($m)
Net expend-iture exc. transfers to other parts of industry ($m)
Gross expend-iture in 2015-16 ($m)
Net expend-iture exc. transfers to other parts of industry ($m)
Gross expend-iture in 2015-16 ($m)
Net expend-iture exc. transfers to other parts of industry ($m)
Gross expend-iture in 2015-16 ($m)
Net expend-iture exc. transfers to other parts of industry ($m)
Gross expend-iture in 2015-16 ($m)
Net expend-iture exc. transfers to other parts of industry ($m)
Combined supply chain prior to primary processing
84.4 47.6 22.0 19.0 133.1 101.2 21.7 15.0 17.9 11.5 279.1 194.3
Primary wood processing
171.2 125.3 58.6 31.3 407.3 275.5 19.6 13.7 23.0 19.7 679.7 465.7
TOTAL 255.5 172.9 80.6 50.3 540.5 376.7 41.3 28.8 40.9 31.3 958.8 660.0 This table shows both ‘gross’ expenditure, and expenditure net of transfers within the industry. The net figure ensures there is no double counting by ensuring that payments made from one part of the industry to another (and then expended in that other part of the industry) are not included. The transfers excluded from net figures include payments made to harvest, haulage, roading, earthworks and silvicultural contractors by plantation managers, and payments made to plantation managers or to other processors for fibre inputs used by wood processors.
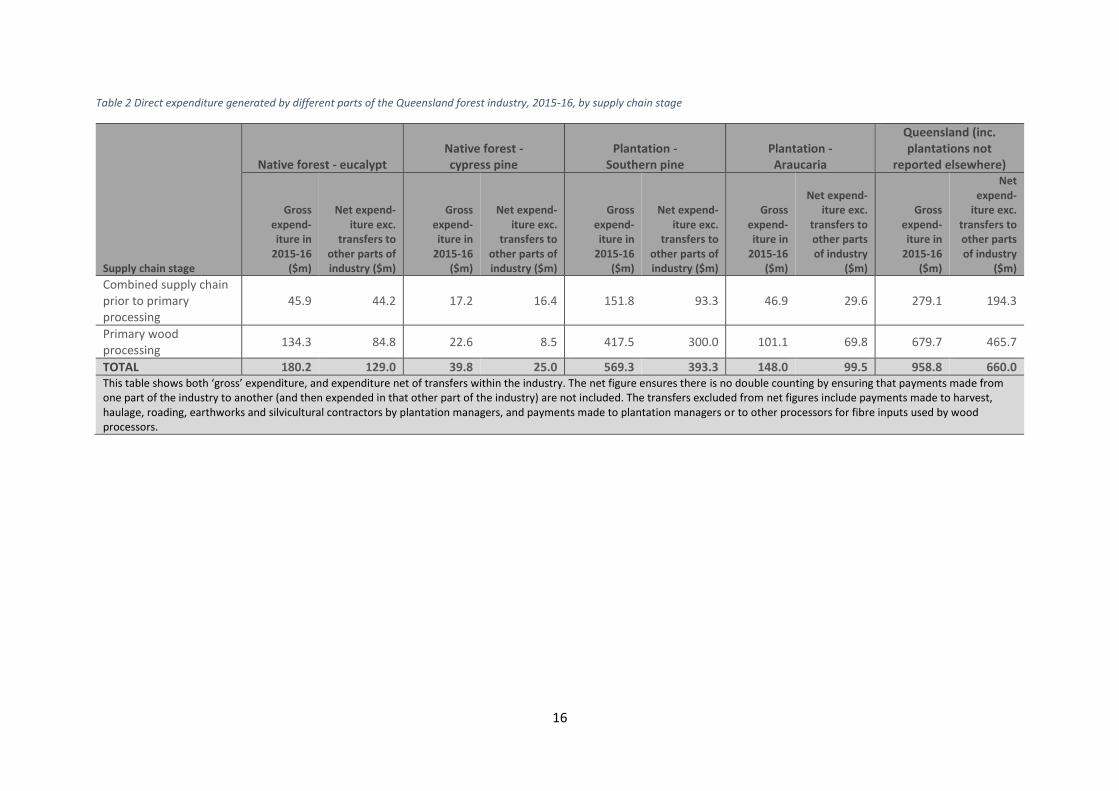
16
Table 2 Direct expenditure generated by different parts of the Queensland forest industry, 2015-16, by supply chain stage
Supply chain stage
Native forest - eucalypt Native forest - cypress pine
Plantation - Southern pine
Plantation - Araucaria
Queensland (inc. plantations not
reported elsewhere)
Gross expend-iture in
2015-16 ($m)
Net expend-iture exc.
transfers to other parts of industry ($m)
Gross expend-iture in
2015-16 ($m)
Net expend-iture exc.
transfers to other parts of industry ($m)
Gross expend-iture in
2015-16 ($m)
Net expend-iture exc.
transfers to other parts of industry ($m)
Gross expend-iture in
2015-16 ($m)
Net expend-iture exc.
transfers to other parts of industry
($m)
Gross expend-iture in
2015-16 ($m)
Net expend-
iture exc. transfers to other parts of industry
($m)
Combined supply chain prior to primary processing
45.9 44.2 17.2 16.4 151.8 93.3 46.9 29.6 279.1 194.3
Primary wood processing
134.3 84.8 22.6 8.5 417.5 300.0 101.1 69.8 679.7 465.7
TOTAL 180.2 129.0 39.8 25.0 569.3 393.3 148.0 99.5 958.8 660.0 This table shows both ‘gross’ expenditure, and expenditure net of transfers within the industry. The net figure ensures there is no double counting by ensuring that payments made from one part of the industry to another (and then expended in that other part of the industry) are not included. The transfers excluded from net figures include payments made to harvest, haulage, roading, earthworks and silvicultural contractors by plantation managers, and payments made to plantation managers or to other processors for fibre inputs used by wood processors.
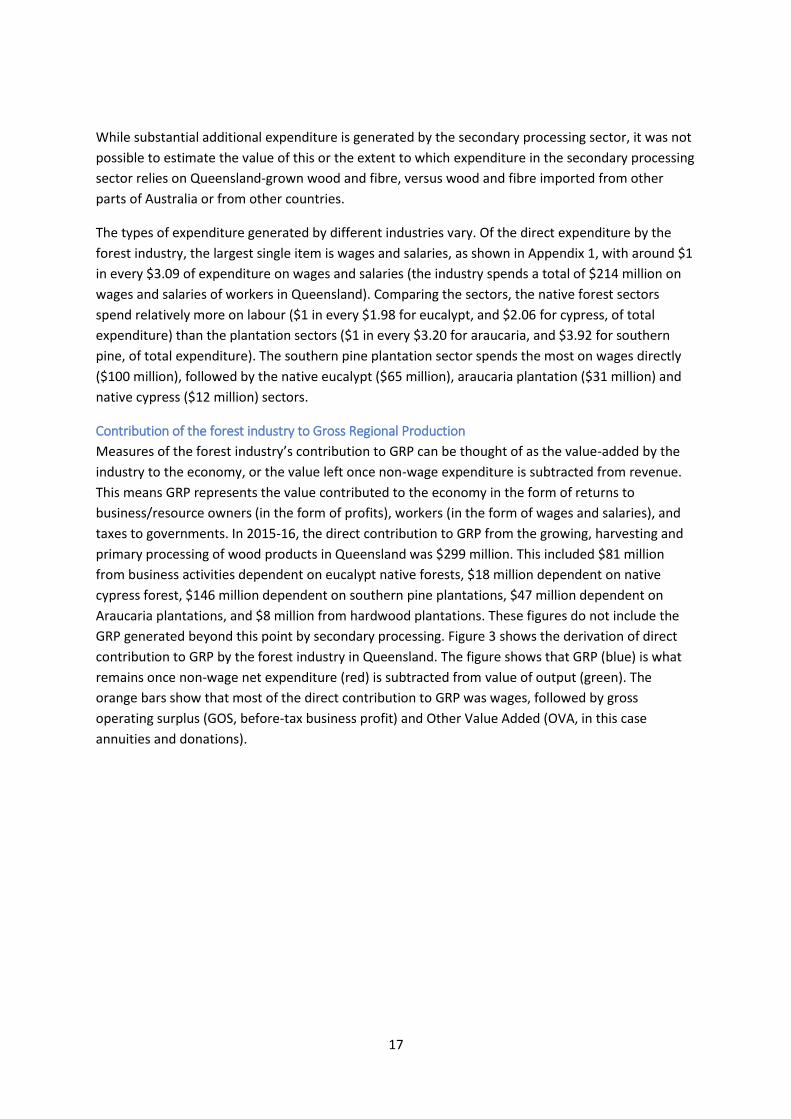
17
While substantial additional expenditure is generated by the secondary processing sector, it was not
possible to estimate the value of this or the extent to which expenditure in the secondary processing
sector relies on Queensland-grown wood and fibre, versus wood and fibre imported from other
parts of Australia or from other countries.
The types of expenditure generated by different industries vary. Of the direct expenditure by the
forest industry, the largest single item is wages and salaries, as shown in Appendix 1, with around $1
in every $3.09 of expenditure on wages and salaries (the industry spends a total of $214 million on
wages and salaries of workers in Queensland). Comparing the sectors, the native forest sectors
spend relatively more on labour ($1 in every $1.98 for eucalypt, and $2.06 for cypress, of total
expenditure) than the plantation sectors ($1 in every $3.20 for araucaria, and $3.92 for southern
pine, of total expenditure). The southern pine plantation sector spends the most on wages directly
($100 million), followed by the native eucalypt ($65 million), araucaria plantation ($31 million) and
native cypress ($12 million) sectors.
Contribution of the forest industry to Gross Regional Production
Measures of the forest industry’s contribution to GRP can be thought of as the value-added by the
industry to the economy, or the value left once non-wage expenditure is subtracted from revenue.
This means GRP represents the value contributed to the economy in the form of returns to
business/resource owners (in the form of profits), workers (in the form of wages and salaries), and
taxes to governments. In 2015-16, the direct contribution to GRP from the growing, harvesting and
primary processing of wood products in Queensland was $299 million. This included $81 million
from business activities dependent on eucalypt native forests, $18 million dependent on native
cypress forest, $146 million dependent on southern pine plantations, $47 million dependent on
Araucaria plantations, and $8 million from hardwood plantations. These figures do not include the
GRP generated beyond this point by secondary processing. Figure 3 shows the derivation of direct
contribution to GRP by the forest industry in Queensland. The figure shows that GRP (blue) is what
remains once non-wage net expenditure (red) is subtracted from value of output (green). The
orange bars show that most of the direct contribution to GRP was wages, followed by gross
operating surplus (GOS, before-tax business profit) and Other Value Added (OVA, in this case
annuities and donations).
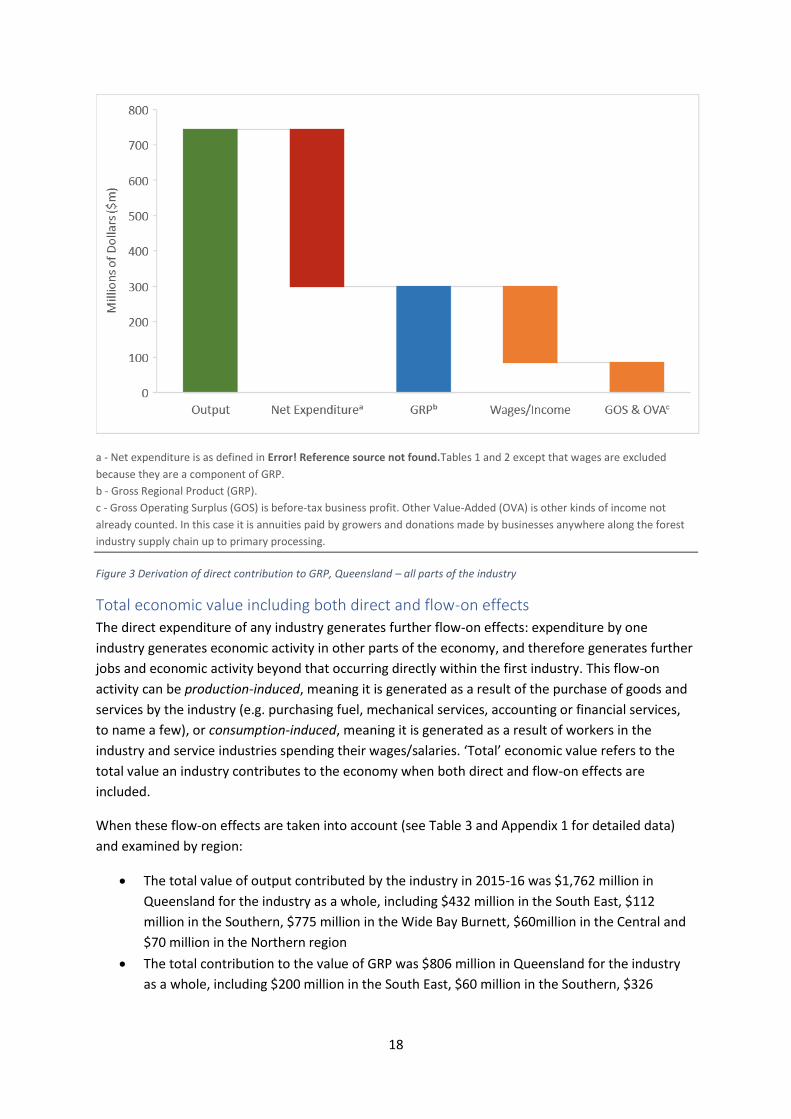
18
a - Net expenditure is as defined in Error! Reference source not found.Tables 1 and 2 except that wages are excluded
because they are a component of GRP.
b - Gross Regional Product (GRP).
c - Gross Operating Surplus (GOS) is before-tax business profit. Other Value-Added (OVA) is other kinds of income not
already counted. In this case it is annuities paid by growers and donations made by businesses anywhere along the forest
industry supply chain up to primary processing.
Figure 3 Derivation of direct contribution to GRP, Queensland – all parts of the industry
Total economic value including both direct and flow-on effects
The direct expenditure of any industry generates further flow-on effects: expenditure by one
industry generates economic activity in other parts of the economy, and therefore generates further
jobs and economic activity beyond that occurring directly within the first industry. This flow-on
activity can be production-induced, meaning it is generated as a result of the purchase of goods and
services by the industry (e.g. purchasing fuel, mechanical services, accounting or financial services,
to name a few), or consumption-induced, meaning it is generated as a result of workers in the
industry and service industries spending their wages/salaries. ‘Total’ economic value refers to the
total value an industry contributes to the economy when both direct and flow-on effects are
included.
When these flow-on effects are taken into account (see Table 3 and Appendix 1 for detailed data)
and examined by region:
• The total value of output contributed by the industry in 2015-16 was $1,762 million in
Queensland for the industry as a whole, including $432 million in the South East, $112
million in the Southern, $775 million in the Wide Bay Burnett, $60million in the Central and
$70 million in the Northern region
• The total contribution to the value of GRP was $806 million in Queensland for the industry
as a whole, including $200 million in the South East, $60 million in the Southern, $326

19
million in the Wide Bay Burnett, $33 million in the Central and $35 million in the Northern
region
• The total contribution to the household income component of GRP was $490 million in
Queensland for the industry as a whole, including $120 million in the South East, $37 million
in the Southern, $206 million in the Wide Bay Burnett, $21 million in the Central and $21
million in the Northern region.
Table 3 Economic impacts of the Queensland forest industry, by region – all parts of the industry
South East Southern
Wide Bay Burnett Central Northern Queenslanda
Outputb ($m) 432.3 111.6 775.2 60.0 70.2 1,762.4
Direct ($m) 199.7 59.7 413.3 33.5 37.3 743.4
Production-induced ($m) 125.8 23.8 238.3 12.6 17.9 565.0
Consumption-induced ($m) 106.8 28.1 123.7 13.9 15.0 454.0
GRP ($m) 200.2 59.8 326.5 32.9 35.0 806.1
Direct ($m) 81.9 32.6 147.1 19.1 18.2 298.9
Production-induced ($m) 58.2 11.0 107.2 5.7 8.2 257.7
Consumption-induced ($m) 60.0 16.2 72.1 8.1 8.6 249.4
Household Income ($m) 120.2 36.7 205.7 21.1 21.0 490.3
Direct ($m) 54.7 22.9 109.9 14.3 12.0 213.8
Production-induced ($m) 37.5 6.8 68.2 3.6 5.3 161.3
Consumption-induced ($m) 28.1 7.0 27.6 3.3 3.8 115.3
Employment (total)c 1,870 677 3,268 286 366 7,271
Direct (total to point of sale of primary processed products)
1,023 474 1,716 211 237 3,661
Production-induced (total) 427 85 1,006 34 66 1,851
Consumption-induced (total) 420 117 546 41 63 1,759
a - Direct and indirect impacts in Queensland as a whole are greater than the sum of the reported regions as some direct impacts occur outside of the regions and indirect impacts are smaller within some regions due to a higher proportion of imports from outside of these regions by industries within them. b - Total output for combined sectors may be lower than the sum of output for individual sectors as it excludes transfers between sectors to prevent double counting. c – Employment is discussed in more detail in the next section; the data here show employment disaggregated by production-induced and consumption-induced effects for simplicity of presentation.
When examined by sector of the industry up to and including the point of primary processing (see
also Appendix 1):
• The total value of output contributed by the industry in 2015-16 was $1,762 million in
Queensland for the industry as a whole, including $339 million from eucalypt native forests,
$67 million from native cypress forest, $1,052 million from southern pine plantations, and
$267 million from Araucaria plantations.
• The total contribution to the value of GRP was $806 million in Queensland for the industry
as a whole, including $181 million from eucalypt native forests, $36 million from native
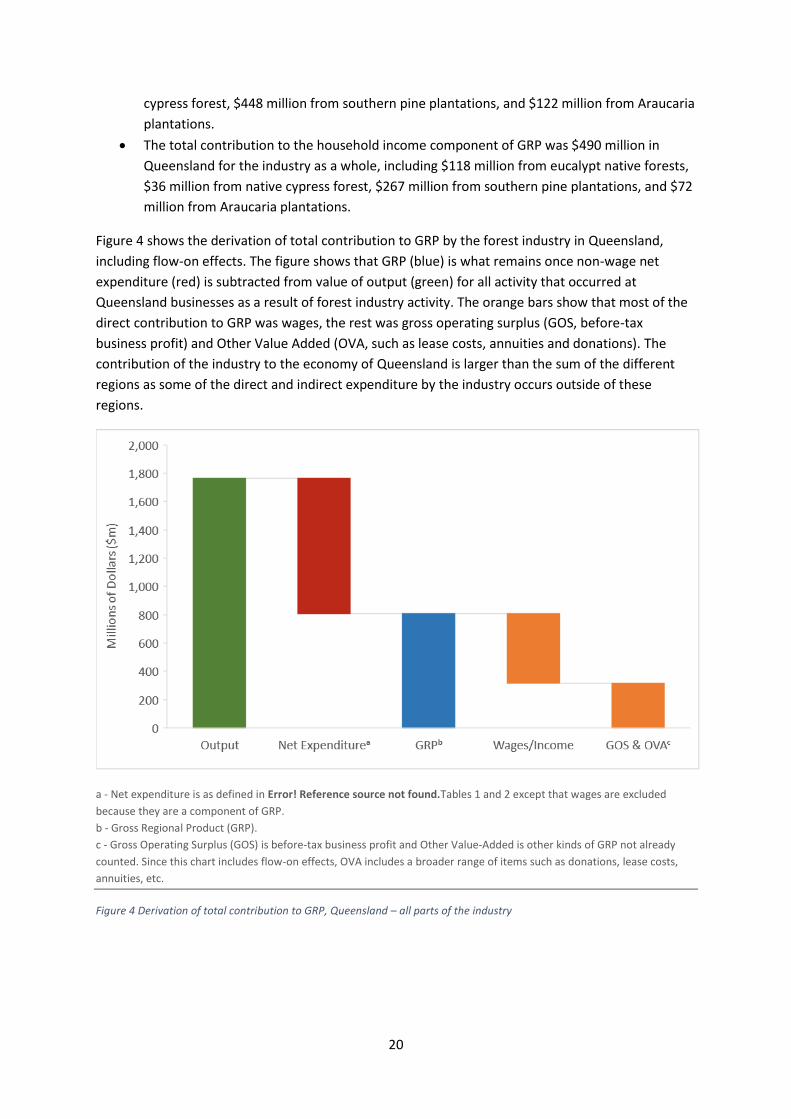
20
cypress forest, $448 million from southern pine plantations, and $122 million from Araucaria
plantations.
• The total contribution to the household income component of GRP was $490 million in
Queensland for the industry as a whole, including $118 million from eucalypt native forests,
$36 million from native cypress forest, $267 million from southern pine plantations, and $72
million from Araucaria plantations.
Figure 4 shows the derivation of total contribution to GRP by the forest industry in Queensland,
including flow-on effects. The figure shows that GRP (blue) is what remains once non-wage net
expenditure (red) is subtracted from value of output (green) for all activity that occurred at
Queensland businesses as a result of forest industry activity. The orange bars show that most of the
direct contribution to GRP was wages, the rest was gross operating surplus (GOS, before-tax
business profit) and Other Value Added (OVA, such as lease costs, annuities and donations). The
contribution of the industry to the economy of Queensland is larger than the sum of the different
regions as some of the direct and indirect expenditure by the industry occurs outside of these
regions.
a - Net expenditure is as defined in Error! Reference source not found.Tables 1 and 2 except that wages are excluded
because they are a component of GRP.
b - Gross Regional Product (GRP).
c - Gross Operating Surplus (GOS) is before-tax business profit and Other Value-Added is other kinds of GRP not already
counted. Since this chart includes flow-on effects, OVA includes a broader range of items such as donations, lease costs,
annuities, etc.
Figure 4 Derivation of total contribution to GRP, Queensland – all parts of the industry

21
Employment This section examines the employment generated in the forest industry in Queensland. This section
provides a brief summary of key findings. This is followed by more detailed examination of the direct
employment generated in the industry, with direct employment first defined, followed by analysis of
the number of jobs generated directly in different regions, different local government areas, and
different sectors of the industry. This is followed by examination of the flow-on jobs generated in
other industries as a result of the activity generated by the forest industry.
The forest industry in Queensland generated a total of 3,661 direct jobs up to the point of primary
processing in 2017. A further estimated 5,137 further direct jobs were generated by secondary
processing activities that use wood and fibre products both from the Queensland forest industry and
imported from interstate or overseas (as of August 2016, based on data from the ABS Census. This
means a total of 8,798 direct jobs were generated in the Queensland forest industry as of 2017. The
estimated flow-on employment generated by activities up to and including primary processing was
an additional 3,610 jobs, which were generated in other industries as a result of demand generated
from the forest industry. Secondary processing activities will also generate flow-on impacts in other
industries, but the extent of these could not be estimated for this report.
Of the 3,661 jobs generated up to the point of primary processing in 2017, 991 were generated by
the native eucalypt sector, 271 by the native cypress sector, 1,666 by the southern pine plantation
sector, and 608 by araucaria plantations. In the secondary processing sector, it was not possible to
identify how many jobs were dependent on different types of native forest and plantation grown in
Queensland or on timber imported from other regions.
The number of jobs varied by region. Of the 8,798 direct jobs generated up to and including
secondary processing, 5,243 were generated in the South East region (most being secondary
processing jobs located in major urban areas such as Brisbane), 1,919 were generated in the Wide
Bay Burnett region (mostly in primary processing), 660 were generated in the Southern region, 604
jobs in the North region, and 372 in the Central region.
Direct employment
This section examines the employment generated directly in the Queensland forest industry,
including detailed examination of where jobs are located and some analysis of change over time.
Defining ‘direct’ employment
In this chapter, the industry’s direct employment is defined as including:
• Primary production: Forest and plantation managers, harvest and haulage contractors,
nurseries growing seedlings for commercial plantations, and silvicultural contractors.
Employment estimates are based on the direct survey of the industry undertaken for this
project, unless otherwise stated.
• Primary processing: All types of manufacturing in which roundwood (logs) are processed into
initial wood and fibre products. All manufacturing on a site is included, even if initial wood
products are further processed into more complex products in a multiple-stage process.
Employment estimates are based on the direct survey of the industry undertaken for this
project, unless otherwise stated.

22
• Secondary processing: Further manufacturing of initial wood products into further products,
for example processing of sawn timber into trusses and frames, or construction of wooden
cabinetry such as kitchen cabinets. Employment estimates are based on data from the ABS
Census, as businesses in this part of the industry were not directly surveyed.
In addition to these three core parts of the industry, when comparing employment over time using
ABS Census data, employment in timber and paper wholesaling is included in the total estimates
(this is noted in the relevant tables).
Some employment generated by the forest industry is not included in the estimates. In particular,
employment in wooden furniture manufacturing is not included in figures presented in this section.
This is because the ABS Census does not produce statistics for wooden furniture manufacturing as a
separate category, instead combining it with upholstered seat manufacturing jobs (which often
involve no use of timber).
Data on employment are presented based on a worker’s place of residence (where they usually live),
rather than based on their office location (where they work). This is done for two reasons. First,
some forest industry workers have multiple work locations, rather than working from a single office:
for example, harvest and haulage contractors will work in multiple locations in a given year. This
means it is often easier to identify these types of workers based on their place of residence rather
than the location of their work. Second, the wages and salaries earned by workers are typically
predominantly spent in the communities they live in, rather than near their place of work. While
many workers live and work in the same community, there are some who do not, and in these cases
using their place of residence enables better estimation of the true economic impact of the industry,
as it enables estimation of spending of wages and salaries by workers in the local government areas
(LGAs) they live in.
Appendix 3 provides basic information from the ABS Census, identifying the number of forest
industry workers recorded in the 2016 Census in each Queensland LGA by place of work versus place
of residence. This can assist in identifying why in some cases the number of workers identified as
employed in the forest industry in a particular LGA in this report is lower or higher than the total
number known to be employed in a particular workplace. For example, while the Census records
1,460 forest industry workers who were employed at a workplace located in Brisbane, many of these
workers lived in different LGAs, with only 1,156 forest industry workers recorded as living in
Brisbane. The opposite was true in Logan: while 725 forest industry workers lived in this LGA, only
430 of them worked in this LGA.
Direct employment generated by the industry in 2017
As shown in Tables 4 and 5, up to the point of sale of primary processed products, the forest
industry generated 3,661 direct jobs located in Queensland in 2017, and a total of 8,798 jobs when
secondary processing jobs were included. ‘Direct’ jobs include jobs that depend on the presence of
the industry, in nurseries, silvicultural contracting, harvest and haulage of logs to processors
(primary production), in primary processing of logs and residues into wood products, and further
(secondary) processing of these products and of products imported from other regions into a wider
range of wood and paper products. Direct jobs do not include jobs generated in mechanical services,
fuel supply, or supply of other goods and services to the industry, which are included in flow-on
employment. The majority of jobs – 84.3% – are generated by the primary and secondary processing
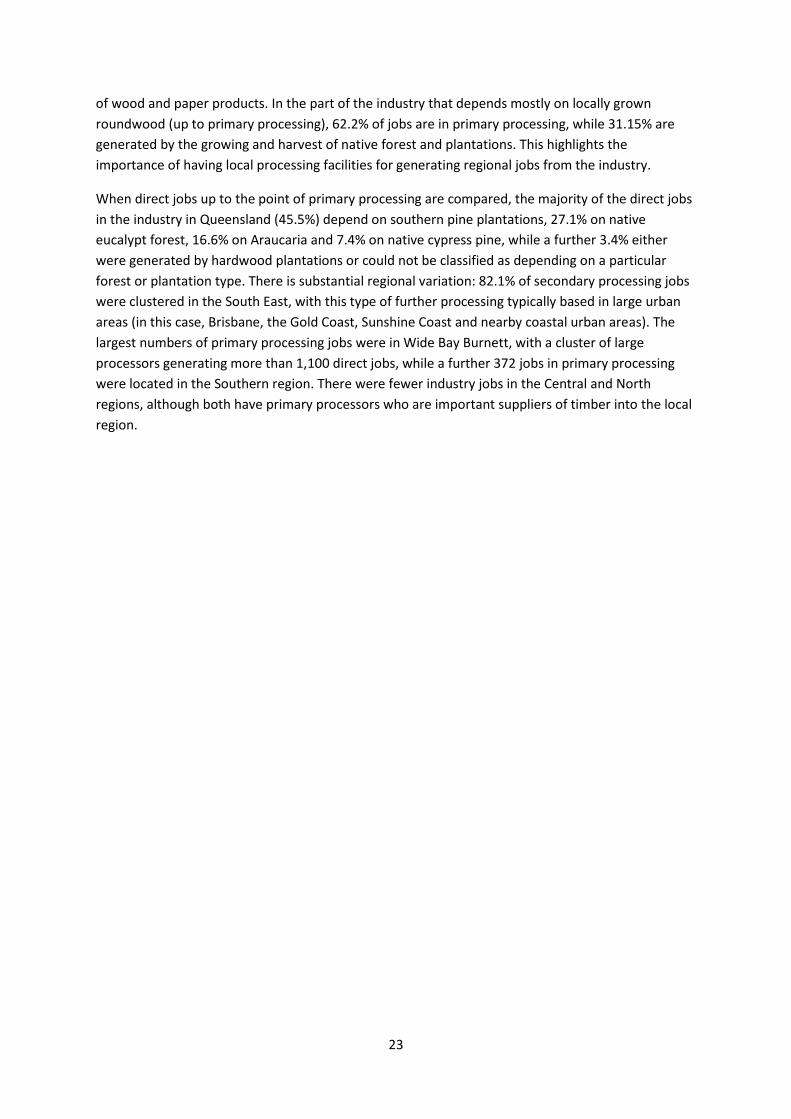
23
of wood and paper products. In the part of the industry that depends mostly on locally grown
roundwood (up to primary processing), 62.2% of jobs are in primary processing, while 31.15% are
generated by the growing and harvest of native forest and plantations. This highlights the
importance of having local processing facilities for generating regional jobs from the industry.
When direct jobs up to the point of primary processing are compared, the majority of the direct jobs
in the industry in Queensland (45.5%) depend on southern pine plantations, 27.1% on native
eucalypt forest, 16.6% on Araucaria and 7.4% on native cypress pine, while a further 3.4% either
were generated by hardwood plantations or could not be classified as depending on a particular
forest or plantation type. There is substantial regional variation: 82.1% of secondary processing jobs
were clustered in the South East, with this type of further processing typically based in large urban
areas (in this case, Brisbane, the Gold Coast, Sunshine Coast and nearby coastal urban areas). The
largest numbers of primary processing jobs were in Wide Bay Burnett, with a cluster of large
processors generating more than 1,100 direct jobs, while a further 372 jobs in primary processing
were located in the Southern region. There were fewer industry jobs in the Central and North
regions, although both have primary processors who are important suppliers of timber into the local
region.

24
Table 4 Direct employment generated by the forest industry in Queensland , 2017, by sector (Data source: 2017 industry survey, unless otherwise noted)
Industry sector Jobs located in Queensland that depend on… Total direct forest industry jobs located in Queensland (includes jobs generated in hardwood plantations, some whose jobs
are spread across all forest and plantation types, and a small number dependent on forests and plantations outside Queensland)
Native forest - eucalypt
Native forest – cypress
pine Plantation –
southern pine Plantation - Araucaria
Growers (forest management companies), nurseries, silvicultural & roading contracting businesses1 77 33 292 100 546
Harvest & haulage contracting businesses (including in-field chipping) 144 52 323 61 594
Primary wood processing2 770 186 995 320 2276
Other (including consultants, equipment sales, training) 0 0 52 127 245
Total – excluding secondary processing 991 271 1666 608 3661
Secondary wood and paper processing (2016 ABS data) Unknown Unknown Unknown Unknown 5137
Total – including secondary processing Unknown Unknown Unknown Unknown 8798 1 Due to the small number of growers in Queensland, employment data are reported for growers and silvicultural businesses together in order to ensure confidentiality of businesses who participated in the forest industry survey. 2The jobs generated in these sectors includes people involved in wholesaling of products produced by these processors.
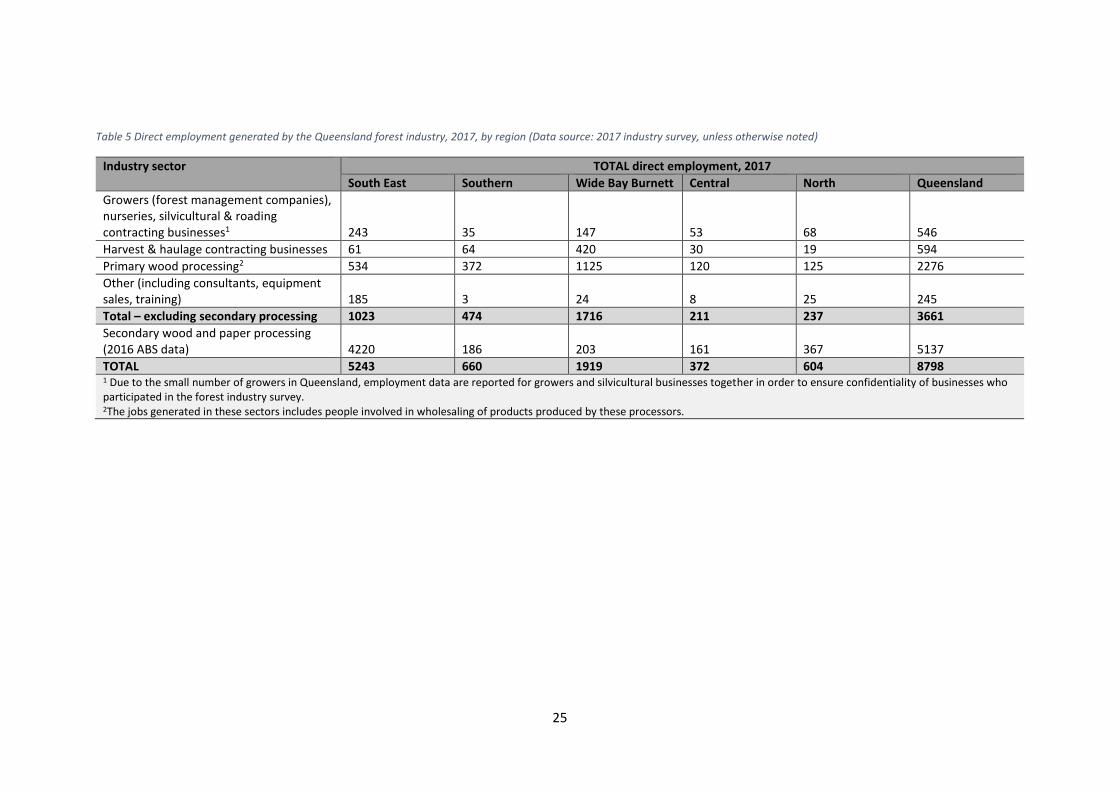
25
Table 5 Direct employment generated by the Queensland forest industry, 2017, by region (Data source: 2017 industry survey, unless otherwise noted)
Industry sector TOTAL direct employment, 2017
South East Southern Wide Bay Burnett Central North Queensland
Growers (forest management companies), nurseries, silvicultural & roading contracting businesses1 243 35 147 53 68 546
Harvest & haulage contracting businesses 61 64 420 30 19 594
Primary wood processing2 534 372 1125 120 125 2276
Other (including consultants, equipment sales, training) 185 3 24 8 25 245
Total – excluding secondary processing 1023 474 1716 211 237 3661
Secondary wood and paper processing (2016 ABS data) 4220 186 203 161 367 5137
TOTAL 5243 660 1919 372 604 8798 1 Due to the small number of growers in Queensland, employment data are reported for growers and silvicultural businesses together in order to ensure confidentiality of businesses who participated in the forest industry survey. 2The jobs generated in these sectors includes people involved in wholesaling of products produced by these processors.

26
Direct employment by local government area
Many of the jobs generated by the Queensland forest industry are located in just a few local
government areas (LGAs). To understand how dependent an LGA is on the industry, it helps to
examine both the total number of jobs generated, and also the overall proportion of jobs that
depend on the industry. This provides an understanding of the extent to which a local area depends
on the industry for employment of its workforce. To do this, we identified the proportion of the
employed workforce in each LGA that was employed directly in the forest industry (Table 6).
The largest number of direct jobs up to and including primary processing are generated in Gympie
Regional Council (745 jobs), Fraser Coast Regional Council (648 jobs), Moreton Bay Regional Council
(366 jobs) and Brisbane City (244 jobs). No other LGAs had more than 200 jobs up to the point of
primary processing, with South Burnett Regional Council (164 jobs), Toowoomba Regional Council
(173 jobs), Sunshine Coast (134 jobs), Maranoa Regional Council (118 jobs) and North Burnett
Regional Council (108 jobs) having more than 100 jobs. When secondary processing jobs are
included, the largest numbers of jobs were generated in Brisbane City (1,249 jobs), Moreton Bay
Regional City (935 jobs), Gold Coast City (851 jobs), Gympie Regional Council (803 jobs), Fraser Coast
Regional Council (732 jobs) and Logan City (689 jobs).
The size of the workforce varies across LGAs. When examined as a proportion of the workforce, the
LGAs with the highest dependence on the forest industry were Gympie Regional Council, where 4.6%
of all jobs directly depended on the industry, North Burnett Regional Council with 2.6% of jobs, and
Fraser Coast Regional Council with 2.3% of jobs. In all other LGAs less than 2% of jobs were directly
dependent on the forest industry, with the next highest levels of job dependence occurring in
Maranoa Regional Council (1.9%), and South Burnett Regional Council (1.5%).

27
Table 6 Direct employment generated by the Queensland industry, 2017, by local government area
Region Local government area name (2017)
Growing, harvest, haulage, primary processing (2017 industry survey)
Secondary processing (2016 ABS Census)
Total forest industry jobs
Size of employed labour force, all industries, 2016
% employed labour force employed in the forest industry
Employment by industry sector (2017 industry survey) Excludes secondary processing jobs.
Native forest - eucalypt
Native forest – cypress pine
Plantation – southern pine
Plantation - Araucaria
Other/ unident-ified
South East
Brisbane City 244 1005 1249 570454 0.2%
Gold Coast City 42 809 851 260550 0.3%
Ipswich City 73 330 403 84281 0.5%
Lockyer Valley Regional 25 40 65 15765 0.4%
Logan City 12 677 689 131953 0.5%
Moreton Bay Regional 366 569 935 189495 0.5%
Noosa Shire 27 41 68 22009 0.3%
Redland City 9 241 250 70165 0.4%
Scenic Rim Regional 27 42 69 16927 0.4%
Somerset Regional 64 29 93 9267 1.0%
Sunshine Coast Regional 134 437 571 129638 0.4%
TOTAL 1023 4220 5243 1500502 0.3% 177 7 530 238 71
Southern Goondiwindi Regional 35 0 35 4859 0.7%
Maranoa Regional 118 0 118 6352 1.9%
Southern Downs Regional 55 10 65 14092 0.5%
Toowoomba Regional 173 163 336 71191 0.5%
Western Downs Regional 85 13 98 14419 0.7%
TOTAL (inc. Murweh, Balonne) 474 186 660 113066 0.6% 96 232 34 106 5
Wide Bay Burnett
Bundaberg Regional 50 45 95 33973 0.3%
Fraser Coast Regional 648 84 732 32269 2.3%
Gympie Regional 745 58 803 17503 4.6%
North Burnett Regional 108 3 111 4336 2.6%
South Burnett Regional 164 13 177 11659 1.5%
TOTAL 1716 203 1919 99732 1.9% 527 9 981 169 31
Central Banana Shire 32 3 35 7184 0.5%
Central Highlands Regional 50 7 57 13463 0.4%
Gladstone Regional 26 20 46 27078 0.2%
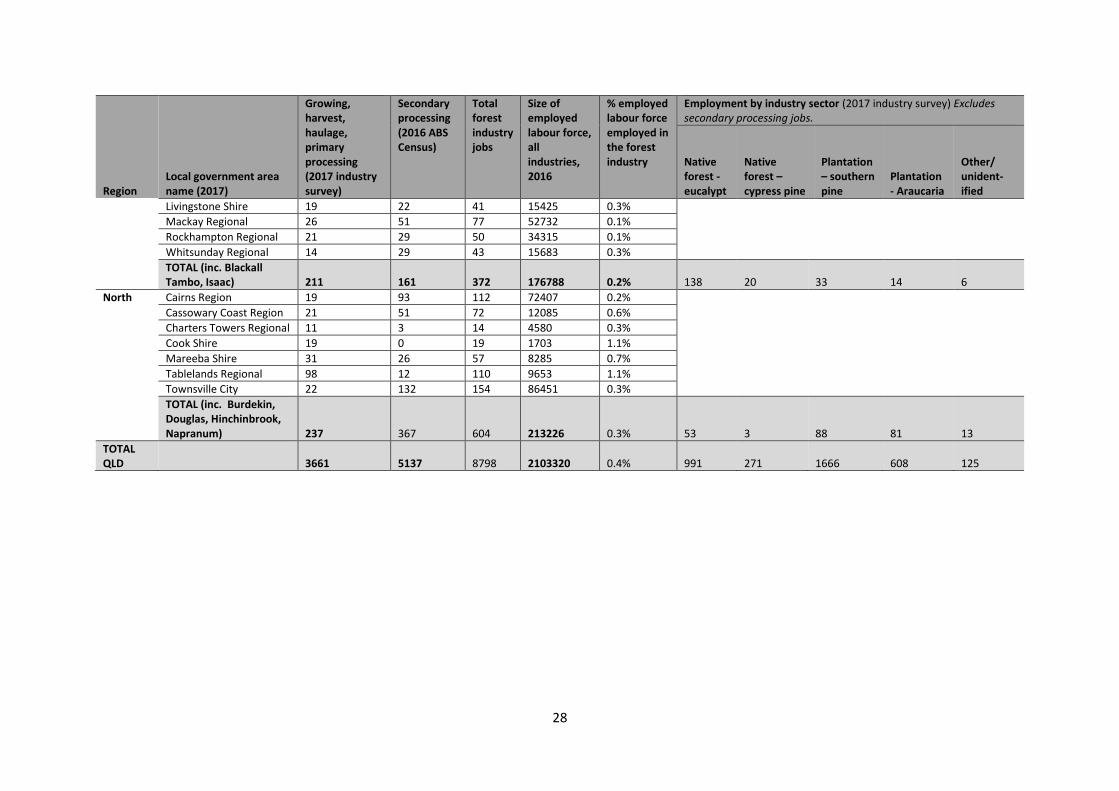
28
Region Local government area name (2017)
Growing, harvest, haulage, primary processing (2017 industry survey)
Secondary processing (2016 ABS Census)
Total forest industry jobs
Size of employed labour force, all industries, 2016
% employed labour force employed in the forest industry
Employment by industry sector (2017 industry survey) Excludes secondary processing jobs.
Native forest - eucalypt
Native forest – cypress pine
Plantation – southern pine
Plantation - Araucaria
Other/ unident-ified
Livingstone Shire 19 22 41 15425 0.3%
Mackay Regional 26 51 77 52732 0.1%
Rockhampton Regional 21 29 50 34315 0.1%
Whitsunday Regional 14 29 43 15683 0.3%
TOTAL (inc. Blackall Tambo, Isaac) 211 161 372 176788 0.2% 138 20 33 14 6
North Cairns Region 19 93 112 72407 0.2%
Cassowary Coast Region 21 51 72 12085 0.6%
Charters Towers Regional 11 3 14 4580 0.3%
Cook Shire 19 0 19 1703 1.1%
Mareeba Shire 31 26 57 8285 0.7%
Tablelands Regional 98 12 110 9653 1.1%
Townsville City 22 132 154 86451 0.3%
TOTAL (inc. Burdekin, Douglas, Hinchinbrook, Napranum) 237 367 604 213226 0.3% 53 3 88 81 13
TOTAL QLD
3661 5137 8798 2103320 0.4% 991 271 1666 608 125

29
Flow-on employment
Earlier in this report (Table 3), as part of analysing flow-on impacts of the industry, the number of
flow-on jobs in the Queensland forest industry was identified. That table identified that the activities
of the people employed in the 3,661 jobs generated up to primary processing created a further
3,610 flow-on jobs in industries outside the forest industry (1,851 were generated as a result of
‘production-induced’ demand, and 1,759 as a result of ‘consumption induced demand). This means
that when flow-on impacts are included, a total of 7,271 direct and indirect jobs were generated in
Queensland by the forest industry up to and including primary processing as a result of (i) the
demand created by the forest industry for supplies and inputs such as fuel and mechanical servicing,
and (ii) spending of salaries and wages by workers.
The figures reported in Table 3 can also be expressed as an employment ‘multiplier’. For the
Queensland forest industry as a whole, the multiplier is 2.0: for every direct job generated in the
Queensland forest industry up to and including primary processing (3,661 jobs total), a ‘flow-on’ or
‘indirect’ job is created in the broader economy as a result of the flow-on activities generated in
other industries by demand from the forest industry (3,610 flow-on jobs).
EconSearch modelling suggests that this multiplier is similar to that of the accommodation (1.9) and
road transport (2.1) sectors, is smaller than the beef cattle (2.5) and non-residential construction
(3.1) sectors, and is larger than the food & beverage services (1.6) and health & community services
(1.7) sectors.
The employment multipliers varied depending on the sector, with a total of 1.7 jobs created for
every direct job in native eucalypt forests, 1.5 for native cypress pine, 2.3 for southern pine and 1.9
for Araurcaria (see Table 7). The multiplier is the ratio of direct jobs to total jobs so it is low if either
direct jobs are high or flow-on jobs are low. The native cypress sector has the lowest employment
multiplier because it employs relatively more direct workers compared to the other sectors, not
because it generates less flow-on jobs. Conversely, the southern pine plantation sector has a high
multiplier because it employs relatively less direct workers. This can be seen by comparing the
number of direct employees per $m of expenditure by each sector. The native cypress sector
employs 11 workers per $1m total expenditure, much higher than the southern pine plantation
sector that employs just 4.
When examined by region, a total of 1.8 jobs are generated in the South East for every direct job in
the region, a total of 1.4 in the Southern region, 1.9 in Wide Bay Burnett, 1.4 in Central and 1.5 in the
North region (see Table 8). Each regional employment multiplier is smaller than the Queensland
multiplier as some indirect expenditure occurs outside of the smaller regions but stays within
Queensland. For example, a proportion of wages earned in many some of the five regions is spent on
consumption goods manufactured in Brisbane or other major urban areas in Queensland, this causes
economic activity within Queensland that is captured in the Queensland multiplier, but not in that
region.
The flow-on effects vary in size in different parts of the industry (see Appendix 1), with the largest
flow-on effects generated by the processing of wood products; while silviculture and harvest and
haulage activities had smaller flow-on effects to the rest of the economy.

30
Table 7 Employment multipliers: indirect employment generated by the Queensland forest industry, by sector
Type of multiplier Description
Native forest - eucalypt
Native forest – cypress pine
Plantation – southern pine Plantation - Araucaria
Queensland (all)
Multip-lier Total jobs
Multip-lier Total jobs
Multip-lier Total jobs
Multip-lier Total jobs
Multip-lier
Total jobs
None Direct jobs only 1.0 991 1.0 271 1.0 1,666 1.0 608 1.0 3,661
Type I Direct jobs + production-induced jobs
1.3 1,261 1.2 322 1.7 2,880 1.5 890 1.5 5,512
Type II Direct jobs + production-induced jobs + consumption-induced jobs
1.7 1,705 1.5 405 2.3 3,814 1.9 1,149 2.0 7,271
Table 8 Employment multipliers: indirect employment generated by the Queensland forest industry, by region
Type of multiplier Description
South East Southern Wide Bay Burnett
Central North Queensland (all)
Multip-lier
Total jobs
Multip-lier
Total jobs
Multip-lier
Total jobs
Multip-lier
Total jobs
Multip-lier
Total jobs
Multip-lier
Total jobs
None Direct jobs only 1.0 1,023 1.0 474 1.0 1,716 1.0 211 1.0 237 1.0 3,661
Type I Direct jobs + production-induced jobs
1.4 1,450 1.2 559 1.6 2,722 1.2 245 1.3 303 1.5 5,512
Type II Direct jobs + production-induced jobs + consumption-induced jobs
1.8 1,870 1.4 677 1.9 3,268 1.4 286 1.5 366 2.0 7,271

31
Comparing employment estimates
There are relatively few sources of information available on direct employment in the forest
industry. Other than specific surveys of businesses operating in the industry, the only regularly
collected data on employment comes from two types of data produced by the Australian Bureau of
Statistics (ABS): the Census of Population and Housing (Census), and the Labour Force Survey (LFS). In
both cases, people who are employed are asked to describe the type of work they do. This
information is then coded to identify each person’s industry of employment, using the Australian
and New Zealand Standard Industrial Classification (ANZSIC) (ABS/SNZ 2013). The ABS also produces
estimates of industry employment in its Australian Industry series; these data are based on
modelling that uses direct surveys of businesses and taxation reporting by businesses to estimate
employment.
The Census is conducted once every five years, and is a complete Census of the population, meaning
it captures all Australians except the small proportion (<5%) who do not participate in this
compulsory survey. Data produced from the Census has the highest reliability of any dataset on
employment, because it is based on the largest possible sample of people. However, it is only
available every five years (data from the 2016 Census on industry of employment were released in
November 2017). The LFS is based on data collected monthly from a sample of 26,000 Australian
households representing around 0.32% of Australia’s population (ABS 2018). In terms of the forest
industry, this means that if the industry employed around 50,000 people nationally, the survey
would include only a relatively small number of people from the industry (around 160). This means
that estimates of employment in the forest industry generated from the LFS have high rates of
sampling error, as a change of 5-10 people in the number sampled in the survey will be extrapolated
to be a large change in total industry employment. Past reviews of the robustness of LFS survey for
estimating employment in the forest, wood and paper industries have identified that the sampling
error is too large to enable accurate estimation of trends in industry employment, or of total
employment levels (Schirmer et al. 2013). Australian Industry estimates are based on more
comprehensive data, but as they still rely to some extent on a sample survey of businesses and
modelling, have some error in estimation, with recent work finding large differences between
Australian Industry and Census estimates for some parts of the Australian forest industry (Schirmer
2018). This means that the most robust source of data other than direct surveys of the industry is
the Census.
The Census, the LFS, and Australian Industry series all classify employment into several ‘industry
classifications’ that form part of the forest industry, specifically in the industry categories of Forestry,
Logging, Services to Forestry, Wood Product Manufacturing and Paper Product Manufacturing.
Wood Product Manufacturing, and Paper Product Manufacturing, are further disaggregated into
multiple types of wood and paper product manufacturing. However, some jobs directly dependent
on the forest industry are classified into other industries. In particular, many log haulage workers are
classified as being part of the transport industry. This means that Census data typically
underestimate the total number of people employed in the industry, particularly in regions where
there is substantial employment in harvest and haulage of logs. Additionally, Census data do not
identify whether workers are based in jobs that depend on plantation or native forest. ABS data do,
however, capture employment in secondary processing, something difficult to do in direct surveys of
the industry.

32
Table 9 compares estimates of employment generated up to the point of primary processing by our
survey (data collected in 2017), and in the 2016 Census (data collected in August 2016). The ABS
uses a process called data randomisation to protect privacy, which means that in any local
government area or industry group, total numbers of workers will be randomly changed by a small
amount to protect privacy. This, combined with the likelihood that employment in many businesses
changed between the time of the Census (August 2016) and when industry survey data were
collected (2017), means that small differences (of, for example, less than 10-15 workers) are unlikely
to represent meaningful differences between the two datasets.

33
Table 9 Comparison of forest industry employment generated up to point of sale of primary processed products: 2016 Census and 2017 Forest Industry Survey
Region
Local government area name
2016 ABS Census 2017 Forest Industry Survey Difference in estimates (noted only if difference of >10 jobs)
Reasons for differences in estimates (other than randomisation of Census data and small changes in employment between Aug 2016 ad 2017)
Forestry, Logging, Services to Forestry
Wood Product Manuf-acturing – primary processing
Total jobs to primary processing (2016)
Forestry, Logging, Services to Forestry
Wood Product Manuf-acturing – primary processing
Total jobs to primary processing (2017)
2016 2016 2016 2017 2017 2017
South East
Brisbane City
83 68 151 193 51 244
More jobs in FIS
Many jobs in forest management not classified as such in the Census. Some jobs in harvest and haulage were recorded as part of the transport industry in the Census.
Gold Coast City
62 33 95 41 1 42
More jobs in Census
Some timber processors in the Gold Coast classified as secondary processors in the FIS were classified as primary processors in the Census. See Appendix 2 for further detail.
Ipswich City 9 69 78 3 70 73
Lockyer Valley Regional 8 13 21
7 18 25
Logan City 23 25 48
8 4 12 More jobs in Census
Census identified some sawmilling and timber dressing jobs (25) not identified in FIS. See Appendix 2 for further detail.
Moreton Bay Regional
97 225 322 90 276 366
More jobs in FIS
Randomisation of Census data and small changes in employment between Aug 2016 and 2017; not all primary processing jobs recorded in Census
Noosa Shire 25 11 36 24 3 27
Redland City 18 8 26
9 0 9 More jobs in Census
Census classified some jobs into primary processing than were classified as secondary processing in FIS.
Scenic Rim Regional 11 24 35
4 23 27
Somerset Regional 20 21 41
19 45 64 More jobs in FIS
Some additional sawmilling jobs identified in FIS that were not identified in Census.
Sunshine Coast 102 59 161
91 43 134 More jobs in Census
Census identified some sawmilling and timber dressing jobs (25) not identified in FIS. See Appendix 2 for further detail.
TOTAL 458 556 1014 489 534 1023
South-ern
Goondiwindi Regional 6 22 28
7 28 35
Maranoa Regional 18 55 73
42 76 118 More jobs in FIS
Some jobs in harvest and haulage were recorded as part of the transport industry in the Census.
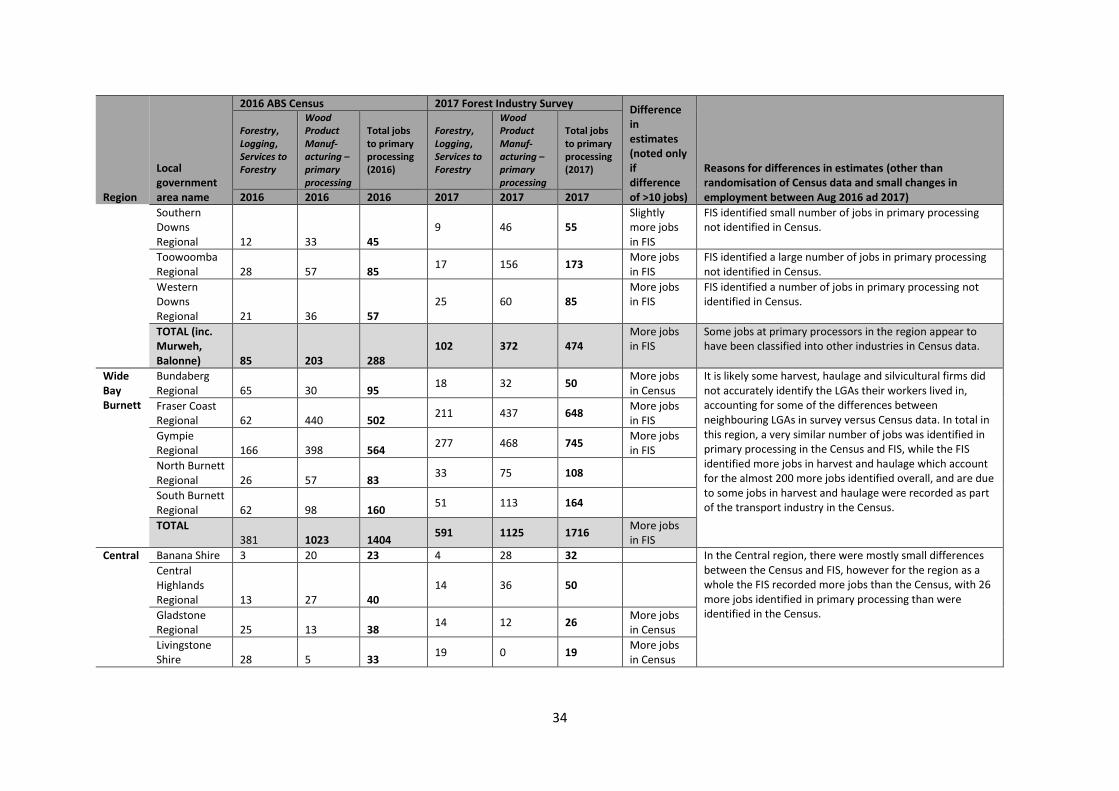
34
Region
Local government area name
2016 ABS Census 2017 Forest Industry Survey Difference in estimates (noted only if difference of >10 jobs)
Reasons for differences in estimates (other than randomisation of Census data and small changes in employment between Aug 2016 ad 2017)
Forestry, Logging, Services to Forestry
Wood Product Manuf-acturing – primary processing
Total jobs to primary processing (2016)
Forestry, Logging, Services to Forestry
Wood Product Manuf-acturing – primary processing
Total jobs to primary processing (2017)
2016 2016 2016 2017 2017 2017
Southern Downs Regional 12 33 45
9 46 55 Slightly more jobs in FIS
FIS identified small number of jobs in primary processing not identified in Census.
Toowoomba Regional 28 57 85
17 156 173 More jobs in FIS
FIS identified a large number of jobs in primary processing not identified in Census.
Western Downs Regional 21 36 57
25 60 85 More jobs in FIS
FIS identified a number of jobs in primary processing not identified in Census.
TOTAL (inc. Murweh, Balonne) 85 203 288
102 372 474 More jobs in FIS
Some jobs at primary processors in the region appear to have been classified into other industries in Census data.
Wide Bay Burnett
Bundaberg Regional 65 30 95
18 32 50 More jobs in Census
It is likely some harvest, haulage and silvicultural firms did not accurately identify the LGAs their workers lived in, accounting for some of the differences between neighbouring LGAs in survey versus Census data. In total in this region, a very similar number of jobs was identified in primary processing in the Census and FIS, while the FIS identified more jobs in harvest and haulage which account for the almost 200 more jobs identified overall, and are due to some jobs in harvest and haulage were recorded as part of the transport industry in the Census.
Fraser Coast Regional 62 440 502
211 437 648 More jobs in FIS
Gympie Regional 166 398 564
277 468 745 More jobs in FIS
North Burnett Regional 26 57 83
33 75 108
South Burnett Regional 62 98 160
51 113 164
TOTAL 381 1023 1404
591 1125 1716 More jobs in FIS
Central Banana Shire 3 20 23 4 28 32 In the Central region, there were mostly small differences between the Census and FIS, however for the region as a whole the FIS recorded more jobs than the Census, with 26 more jobs identified in primary processing than were identified in the Census.
Central Highlands Regional 13 27 40
14 36 50
Gladstone Regional 25 13 38
14 12 26 More jobs in Census
Livingstone Shire 28 5 33
19 0 19 More jobs in Census
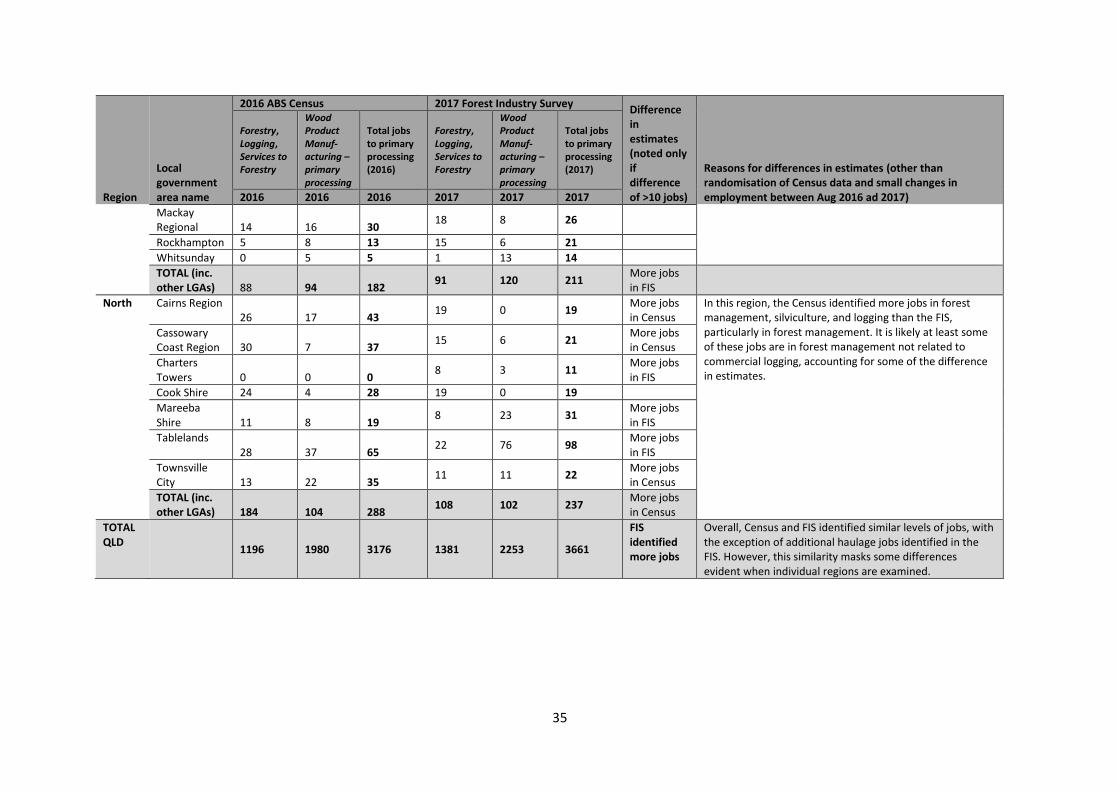
35
Region
Local government area name
2016 ABS Census 2017 Forest Industry Survey Difference in estimates (noted only if difference of >10 jobs)
Reasons for differences in estimates (other than randomisation of Census data and small changes in employment between Aug 2016 ad 2017)
Forestry, Logging, Services to Forestry
Wood Product Manuf-acturing – primary processing
Total jobs to primary processing (2016)
Forestry, Logging, Services to Forestry
Wood Product Manuf-acturing – primary processing
Total jobs to primary processing (2017)
2016 2016 2016 2017 2017 2017
Mackay Regional 14 16 30
18 8 26
Rockhampton 5 8 13 15 6 21
Whitsunday 0 5 5 1 13 14
TOTAL (inc. other LGAs) 88 94 182
91 120 211 More jobs in FIS
North Cairns Region 26 17 43
19 0 19 More jobs in Census
In this region, the Census identified more jobs in forest management, silviculture, and logging than the FIS, particularly in forest management. It is likely at least some of these jobs are in forest management not related to commercial logging, accounting for some of the difference in estimates.
Cassowary Coast Region 30 7 37
15 6 21 More jobs in Census
Charters Towers 0 0 0
8 3 11 More jobs in FIS
Cook Shire 24 4 28 19 0 19
Mareeba Shire 11 8 19
8 23 31 More jobs in FIS
Tablelands 28 37 65
22 76 98 More jobs in FIS
Townsville City 13 22 35
11 11 22 More jobs in Census
TOTAL (inc. other LGAs) 184 104 288
108 102 237 More jobs in Census
TOTAL QLD
1196 1980 3176 1381 2253 3661
FIS identified more jobs
Overall, Census and FIS identified similar levels of jobs, with the exception of additional haulage jobs identified in the FIS. However, this similarity masks some differences evident when individual regions are examined.
36
The 2016 Census recorded fewer forest industry workers in the Wide Bay Burnett and Southern
regions compared to the survey of businesses conducted for this report. Two factors contributed to
this: many log haulage workers were classified as being employed in the transport industry in the
Census, but counted in forest industry employment in the FIS; and the Census under-estimated
employment at some key primary processors. This underestimate is expected: Schirmer (2018)
identified that the Census is likely to under-count employment by up to 5.4% due to missing data
resulting from some people either not completing the Census at all, or not providing enough
information about their employment to enable classification of their employment into a specific
industry. In some LGAs differences in estimates were greater than this percentage, indicating that it
is possible some businesses in these LGAs are not classified as being part of the forest industry when
Census returns are being processed and workers classified into industries. This can happen due to
factors such as a business being mis-classified as operating in a different type of manufacturing.
In the Central and South East regions Census and FIS estimates were relatively similar. In the North,
the Census recorded more jobs than the FIS. At least part of the difference is due to some businesses
being classified by the Census as operating in primary processing (particularly log sawmilling and
timber dressing) when the business does not utilise roundwood. This was identified as the case for
some businesses that, despite having words such as ‘mill’ or ‘sawmill’ in their business name, did
not engage in sawmilling of roundwood. Some had engaged in sawmilling at some point in the past,
but had ceased taking in roundwood and were not either a retail business selling wood products, or
engaged in secondary processing activities such as cutting boards to size. However, this may not
account for all the differences, and it is possible that this study did not identify some small sawmills
in the region who were purchasing roundwood for processing. While study methods included tracing
flow of roundwood from growers to primary processors, and in some cases from initial primary
processors to others when roundwood was on-sold, it is possible some small quantities of
roundwood are purchased from private growers by small private processors who were not identified
in this study, or that estimates of employment by some processors who did not complete the survey
are incorrect.

37
Direct employment over time
There is little information on how employment is changing in the forest industry over time. Few
studies have estimated the employment generated by the Queensland forest industry, and
differences in definitions and methods used means the figures published in past studies are not
always comparable. The only source of data available that enables comparison of employment over
time in the forest industry is the ABS Census of Population and Housing (Census).
As local government boundaries changed substantially for many Queensland LGAs between 2006
and 2011, due to amalgamations and creation of new regional councils, Census data could be
compared between 2006 and 2016 for all regions, but not for all LGAs within each region (Table 10).
This was also the case for identifying change between 2011 and 2016 in some LGAs where further
boundary changes occurred during this time.
Census data show a 40.7% decline in total employment in the forest industry between 2006 and
2016, including a 19.8% decline from 2006 to 2011, and loss of a further 26.1% of jobs between 2011
and 2016. This overall trend masks some differing trends within different industry sectors. Between
2011 and 2016, ABS Census data record growth of 9.5% in employment in the primary production
part of the industry. During the same period, employment in wood and paper product
manufacturing (including both primary and secondary processing) declined by 31.8%. In the different
regions, this overall trend applied, but to differing extents:
• South East: Total employment in the industry fell by 44% between 2006 and 2016, although
employment in primary production (forestry, services to forestry, logging) grew 8.3%
between 2011 and 2016.
• Southern: Total employment fell 42.7% over the ten years, and includes ongoing decline in
both primary production and in primary and secondary processing.
• Wide Bay Burnett: This region had less decline in employment (26.6%) between 2006 and
2016, with much less decline in processing jobs compared to other regions. This is likely to
reflect consolidation of primary processing to larger processors clustered in this region.
• Central: Employment fell by 46.4% in this region during the 10 years, but with some growth
in primary production employment between 2011 and 2016
• North: This region had a decline of 29.7% in total industry employment between 2006 and
2016, less than in many other regions.
Overall, these trends are similar to those occurring across Australia, with factors such as
consolidation of processing to larger processing facilities with higher labour efficiency often driving
changes in employment, together with changes in demand for products and services (Schirmer
2018).

38
Table 10 Forest industry employment recorded in the ABS Census of Population and Housing over time (data source: ABS Census 2006, 2011, 2016)
Region
Local government area name (2017)
Jobs in Forestry, Logging, Services to Forestry Jobs in Wood & Paper Product Manufacturing (includes primary and secondary processing) Total forest industry jobs (includes wholesaling)
2006 2011 2016 Change, 2006-111
Change, 2011-161 2006 2011 2016
Change, 2006-111
Change, 2011-161 2006 2011 2016
Change, 2006-111
Change, 2011-161
South East
Brisbane City 101 77 79 -23.8% 2.6% 2405 1791 1079 -25.5% -39.8% 3549 2726 1850 -23.2% -32.1%
Gold Coast City 43 65 59 51.2% -9.2% 1595 1164 848 -27.0% -27.1% 2173 1543 1178 -29.0% -23.7%
Ipswich City 14 9 12 -35.7% 33.3% 957 515 395 -46.2% -23.3% 1132 716 531 -36.7% -25.8%
Lockyer Valley 0 7 69 53 -23.2% 87 74 -14.9%
Logan City 10 15 25 50.0% 66.7% 1050 1100 700 4.8% -36.4% 1292 1420 1022 9.9% -28.0%
Moreton Bay 68 94 38.2% 1408 806 -42.8% 1781 1161 -34.8%
Noosa Shire 33 31 127 68 192 116
Redland City 6 14 19 35.7% 439 386 256 -12.1% -33.7% 610 541 386 -11.3% -28.7%
Scenic Rim 12 13 8.3% 101 63 -37.6% 135 89 -34.1%
Somerset 25 15 -40.0% 65 57 -12.3% 108 87 -19.4%
Sunshine Coast 136 102 -25.0% 817 514 -37.1% 1163 747 -35.8%
TOTAL 455 421 456 -7.5% 8.3% 9634 7416 4839 -23.0% -34.7% 12923 10220 7241 -20.9% -29.1%
Southern Goondiwindi 12 7 -41.7% 28 25 -10.7% 44 34 -22.7%
Maranoa 9 22 144.4% 76 56 -26.3% 88 77 -12.5%
Southern Downs 19 10 -47.4% 59 46 -22.0% 88 58 -34.1%
Toowoomba 45 32 -28.9% 395 219 -44.6% 491 313 -36.3%
Western Downs 15 17 13.3% 77 53 -31.2% 101 73 -27.7%
TOTAL 138 100 91 -27.5% -9.0% 745 635 399 -14.8% -37.2% 969 812 555 -16.2% -31.7%
Wide Bay Burnett
Bundaberg 63 64 1.6% 139 81 -41.7% 249 179 -28.1%
Fraser Coast 83 72 -13.3% 517 524 1.4% 675 640 -5.2%
Gympie 182 166 -8.8% 553 457 -17.4% 756 653 -13.6%
North Burnett 19 23 21.1% 61 59 -3.3% 84 83 -1.2%
South Burnett 62 64 3.2% 104 117 12.5% 175 185 5.7%
TOTAL 497 409 389 -17.7% -4.9% 1686 1374 1238 -18.5% -9.9% 2370 1939 1740 -18.2% -10.3%
Central
Banana Shire 3 3 3 16 30 25 87.5% -16.7% 17 32 25 88.2% -21.9%
Central Highlands 8 14 75.0% 46 29 -37.0% 55 46 -16.4%
Gladstone 12 20 66.7% 69 32 -53.6% 98 61 -37.8%
Livingstone Shire 29 28 65
Mackay Regional 15 18 20.0% 131 65 -50.4% 201 121 -39.8%
Rockhampton 36 11 -69.4% 127 34 -73.2% 204 88 -56.9%
Whitsunday 0 0 56 39 -30.4% 59 43 -27.1%
TOTAL 113 78 99 -31.0% 26.9% 556 469 252 -15.6% -46.3% 845 660 453 -21.9% -31.4%
North Cairns Region 18 21 16.7% 216 117 -45.8% 328 209 -36.3%

39
Region
Local government area name (2017)
Jobs in Forestry, Logging, Services to Forestry Jobs in Wood & Paper Product Manufacturing (includes primary and secondary processing) Total forest industry jobs (includes wholesaling)
2006 2011 2016 Change, 2006-111
Change, 2011-161 2006 2011 2016
Change, 2006-111
Change, 2011-161 2006 2011 2016
Change, 2006-111
Change, 2011-161
Cassowary Coast 23 28 21.7% 51 58 13.7% 82 82 0.0%
Charters Towers 0 0 13 8 -38.5% 13 12 -7.7%
Cook Shire 0 5 23 360.0% 7 0 7 5 9 28 211.1%
Mareeba Shire 19 16 21 30 45 46
Tablelands 28 30 7.1% 92 54 -41.3% 125 82 -34.4%
Townsville City 9 8 13 -11.1% 62.5% 139 261 156 87.8% -40.2% 215 374 259 74.0% -30.7%
TOTAL 133 108 183 -18.8% 69.4% 816 690 488 -15.4% -29.3% 1175 1011 826 -14.0% -18.3%
TOTAL QLD 1333 1106 1211 -17.0% 9.5% 13456 10578 7209 -21.4% -31.8% 18275 14662 10841 -19.8% -26.1% 1Change has only been calculated where the total number of workers is >10 in both years, as randomisation of small numbers by the ABS means smaller changes may not be meaningful
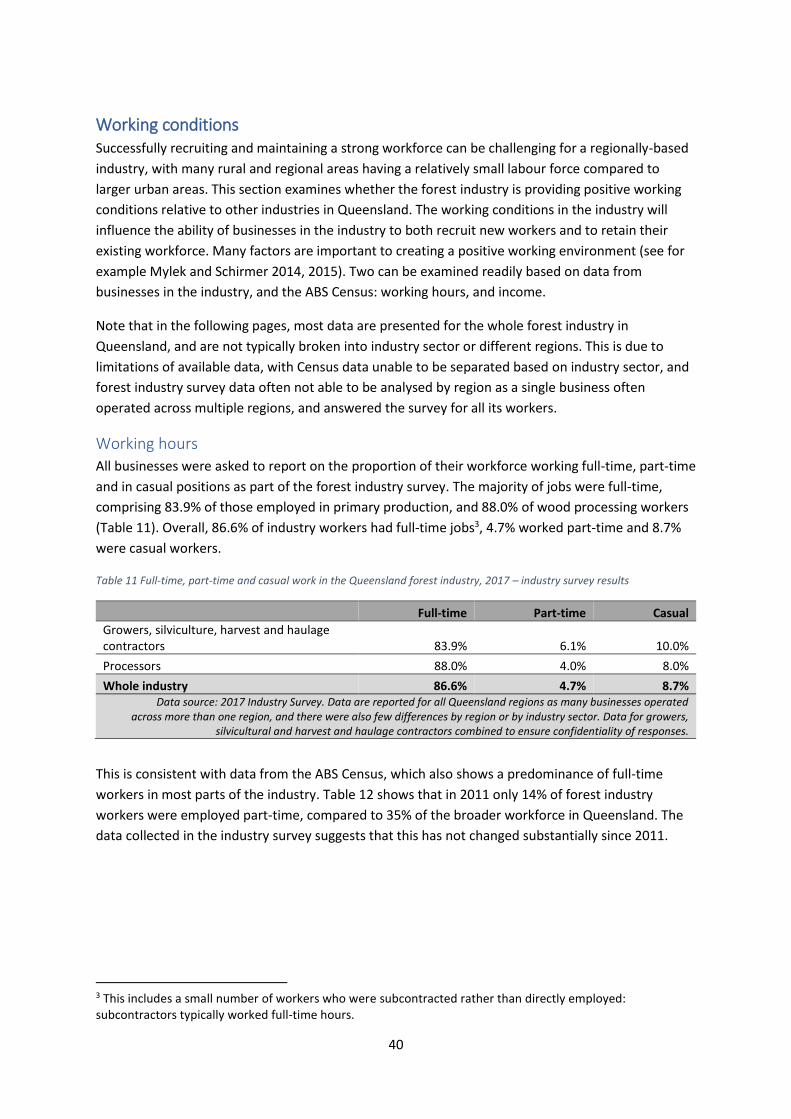
40
Working conditions Successfully recruiting and maintaining a strong workforce can be challenging for a regionally-based
industry, with many rural and regional areas having a relatively small labour force compared to
larger urban areas. This section examines whether the forest industry is providing positive working
conditions relative to other industries in Queensland. The working conditions in the industry will
influence the ability of businesses in the industry to both recruit new workers and to retain their
existing workforce. Many factors are important to creating a positive working environment (see for
example Mylek and Schirmer 2014, 2015). Two can be examined readily based on data from
businesses in the industry, and the ABS Census: working hours, and income.
Note that in the following pages, most data are presented for the whole forest industry in
Queensland, and are not typically broken into industry sector or different regions. This is due to
limitations of available data, with Census data unable to be separated based on industry sector, and
forest industry survey data often not able to be analysed by region as a single business often
operated across multiple regions, and answered the survey for all its workers.
Working hours
All businesses were asked to report on the proportion of their workforce working full-time, part-time
and in casual positions as part of the forest industry survey. The majority of jobs were full-time,
comprising 83.9% of those employed in primary production, and 88.0% of wood processing workers
(Table 11). Overall, 86.6% of industry workers had full-time jobs3, 4.7% worked part-time and 8.7%
were casual workers.
Table 11 Full-time, part-time and casual work in the Queensland forest industry, 2017 – industry survey results
Full-time Part-time Casual
Growers, silviculture, harvest and haulage contractors 83.9% 6.1% 10.0%
Processors 88.0% 4.0% 8.0%
Whole industry 86.6% 4.7% 8.7% Data source: 2017 Industry Survey. Data are reported for all Queensland regions as many businesses operated
across more than one region, and there were also few differences by region or by industry sector. Data for growers, silvicultural and harvest and haulage contractors combined to ensure confidentiality of responses.
This is consistent with data from the ABS Census, which also shows a predominance of full-time
workers in most parts of the industry. Table 12 shows that in 2011 only 14% of forest industry
workers were employed part-time, compared to 35% of the broader workforce in Queensland. The
data collected in the industry survey suggests that this has not changed substantially since 2011.
3 This includes a small number of workers who were subcontracted rather than directly employed: subcontractors typically worked full-time hours.

41
Table 12 Proportion of Queensland workforce employed full-time and part-time, 2006-2016 – ABS Census of Population and Housing
Forestry Logging Forestry Support Services
Wood product manufacturing
Pulp and paper manufacturing
Forest industry
workforce
Employed labour force
(all industries)
Employed labour force (all industries)
exc. Brisbane
% full-time - Queensland
2006 83% 82% 76% 88% 87% 87% 69% 69%
2011 84% 84% 70% 86% 86% 86% 68% 68%
2016 83% 86% 68% 87% 87% 86% 66% 65%
% part-time – Queensland
2006 17% 18% 24% 12% 13% 13% 31% 31%
2011 16% 16% 30% 14% 14% 14% 32% 32%
2016 17% 14% 32% 13% 13% 14% 34% 35%
% full-time - South East
2006 87% 78% 65% 88% 88% 88% 68% 67%
2011 83% 83% 69% 86% 87% 86% 67% 66%
2016 79% 87% 63% 87% 90% 86% 65% 64%
% full-time - Southern
2006 83% 84% 100% 86% 71% 85% 70% 70%
2011 90% 83% 100% 87% 64% 86% 69% 69%
2016 84% 90% 71% 88% 68% 87% 67% 67%
% full-time - Wide Bay Burnett
2006 83% 83% 83% 90% 58% 88% 65% 65%
2011 86% 87% 73% 88% 76% 87% 64% 64%
2016 88% 87% 77% 89% 55% 88% 61% 61%
% full-time - Central
2006 85% 83% 67% 87% 79% 85% 73% 73%
2011 69% 67% 62% 82% 74% 80% 74% 74%
2016 81% 87% 68% 84% 77% 82% 70% 70%
% full-time - North
2006 81% 77% 90% 85% 72% 83% 71% 71%
2011 83% 100% 78% 83% 76% 83% 69% 69%
2016 73% 100% 75% 84% 79% 81% 67% 67% Data source: ABS Census of Population and Housing, 2006, 2011, 2016. TableBuilderPro Place of Usual Residence database. Workers who were away from work or did not report their
working hours were excluded from the analysis.

42
Census data were also analysed to identify whether many workers were working high numbers of
hours per week. Working long hours (often defined as more than 49 hours per week) has been
shown to contribute to negative health and wellbeing outcomes for many workers. Under-
employment – working fewer hours than desired – can also have negative impacts for workers,
however it is not possible to identify from Census data whether a worker was satisfied with the
number of hours they were working.
Across the entire workforce of Queensland, 17% of workers reported working 49 or more hours a
week in 2016 (Table 13). In the forest industry, 21% of workers reported working 49 hours or more
per week, particularly those working in logging.
Table 13 Working hours by industry sector, 2006-2016 – ABS Census of Population and Housing
Industry sector (ABS classification)
% workers who worked < 25 hours in week
prior to Census
% workers who worked > 48 hours in week prior to Census
2006 2011 2016 2006 2011 2016
Forestry 14% 19% 13% 15% 17% 20%
Logging 16% 14% 14% 40% 44% 49%
Forestry Support Services 20% 12% 18% 19% 16% 14%
Wood product manufacturing 9% 10% 9% 21% 18% 20%
Pulp and paper manufacturing 11% 11% 11% 24% 22% 25%
Forest industry workforce – Queensland 10% 11% 10% 21% 19% 21%
Employed labour force (all industries) – Queensland 23% 24% 24% 20% 19% 17%
Employed labour force (all industries) – Queensland exc. Bris
23% 24% 24% 20% 19% 17%
Data source: ABS Census of Population and Housing, 2006, 2011, 2016, TableBuilderPro Place of Usual Residence database. Data are reported for all regions together as results were very similar across regions. Workers who were away from work or did not report their working hours were excluded from the analysis.
Income
ABS Census data shows that forest industry workers in Queensland were more likely to earn ‘middle-
class’ incomes than the average for the region (Table 14). In 2016, only 16% of forest industry
workers earned less than $649 per week, compared to 27% of all workers working in Queensland,
while 31% earned $1,250 or more per week, compared to 35% of the overall employed labour force.

43
Table 14 Income earned by workers, 2006-2016 – ABS Census of Population and Housing
Industry sector (ABS classification)
% all workers earning <$600 or $649 per week
% all workers earning > $1299 or $1250 per week
2006 (<$600/wk)
2011 (<$600/wk)
2016 (<$649/wk)
2006 ($1299/wk)
2011 ($1250/wk)
2016 ($1250/wk)
Forestry 28% 27% 15% 12% 19% 34%
Logging 38% 27% 18% 6% 19% 43%
Forestry Support Services 46% 29% 28% 9% 16% 19%
Wood product manufacturing 39% 21% 17% 8% 17% 27%
Pulp and paper manufacturing 27% 14% 12% 20% 34% 45%
Forest industry workforce – Queensland 36% 20% 16% 11% 21% 31%
Employed labour force (all industries) – Queensland 42% 29% 27% 15% 29% 35%
Employed labour force (all industries) – Queensland exc. Bris 44% 30% 28% 12% 26% 32% Data source: ABS Census of Population and Housing, 2006, 2011, 2016, TableBuilderPro Place of Usual Residence database. Workers who were away from work or did not report their working hours were excluded from the analysis.
Table :
To identify whether the wages/salaries paid in the forest industry are different to the average after
taking hours of work into account, the proportion of full-time workers earned low and high income
was compared (Table 15). This showed that while full-time forestry workers are similarly likely to
earn lower incomes as the rest of the labour force, with 10% of both groups earning less than $649 a
week in 2016, they were much less likely to earn high incomes. Only 26% of full-time forest industry
workers earned $1250 or more per week in 2016, compared to 46% of full-time workers in the
broader workforce.
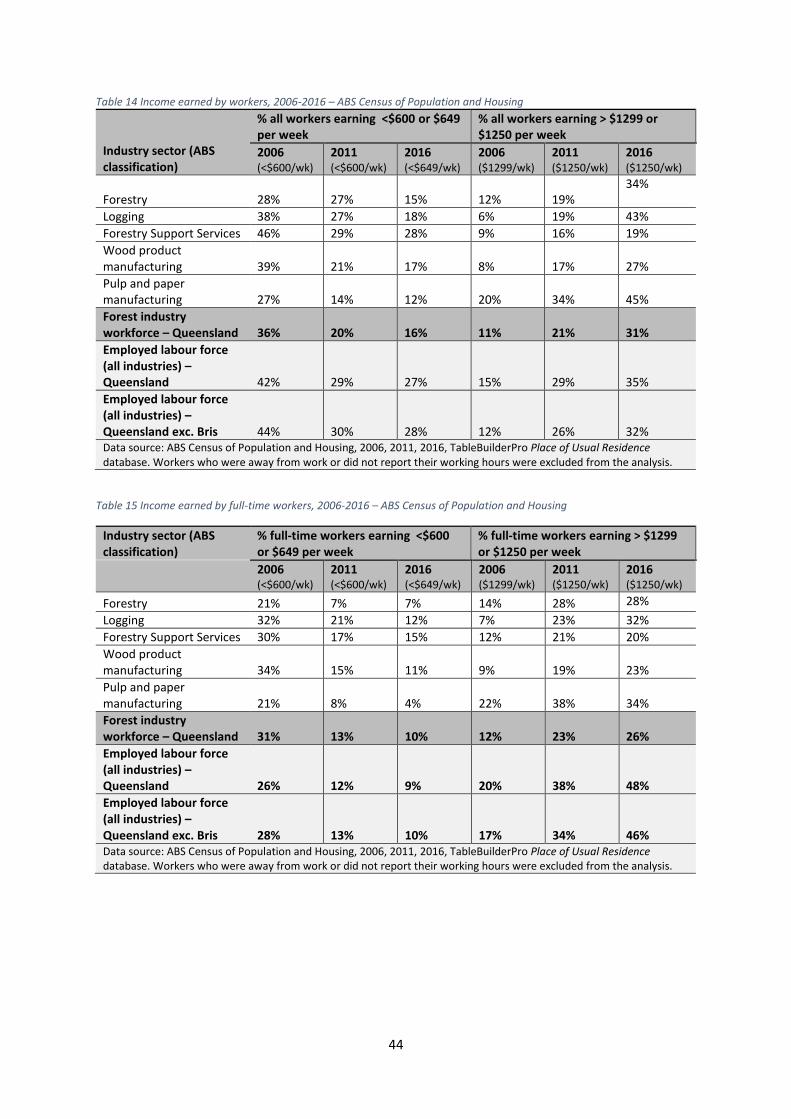
44
Table 14 Income earned by workers, 2006-2016 – ABS Census of Population and Housing
Industry sector (ABS classification)
% all workers earning <$600 or $649 per week
% all workers earning > $1299 or $1250 per week
2006 (<$600/wk)
2011 (<$600/wk)
2016 (<$649/wk)
2006 ($1299/wk)
2011 ($1250/wk)
2016 ($1250/wk)
Forestry 28% 27% 15% 12% 19% 34%
Logging 38% 27% 18% 6% 19% 43%
Forestry Support Services 46% 29% 28% 9% 16% 19%
Wood product manufacturing 39% 21% 17% 8% 17% 27%
Pulp and paper manufacturing 27% 14% 12% 20% 34% 45%
Forest industry workforce – Queensland 36% 20% 16% 11% 21% 31%
Employed labour force (all industries) – Queensland 42% 29% 27% 15% 29% 35%
Employed labour force (all industries) – Queensland exc. Bris 44% 30% 28% 12% 26% 32% Data source: ABS Census of Population and Housing, 2006, 2011, 2016, TableBuilderPro Place of Usual Residence database. Workers who were away from work or did not report their working hours were excluded from the analysis.
Table 15 Income earned by full-time workers, 2006-2016 – ABS Census of Population and Housing
Industry sector (ABS classification)
% full-time workers earning <$600 or $649 per week
% full-time workers earning > $1299 or $1250 per week
2006 (<$600/wk)
2011 (<$600/wk)
2016 (<$649/wk)
2006 ($1299/wk)
2011 ($1250/wk)
2016 ($1250/wk)
Forestry 21% 7% 7% 14% 28% 28%
Logging 32% 21% 12% 7% 23% 32%
Forestry Support Services 30% 17% 15% 12% 21% 20%
Wood product manufacturing 34% 15% 11% 9% 19% 23%
Pulp and paper manufacturing 21% 8% 4% 22% 38% 34%
Forest industry workforce – Queensland 31% 13% 10% 12% 23% 26%
Employed labour force (all industries) – Queensland 26% 12% 9% 20% 38% 48%
Employed labour force (all industries) – Queensland exc. Bris 28% 13% 10% 17% 34% 46% Data source: ABS Census of Population and Housing, 2006, 2011, 2016, TableBuilderPro Place of Usual Residence database. Workers who were away from work or did not report their working hours were excluded from the analysis.
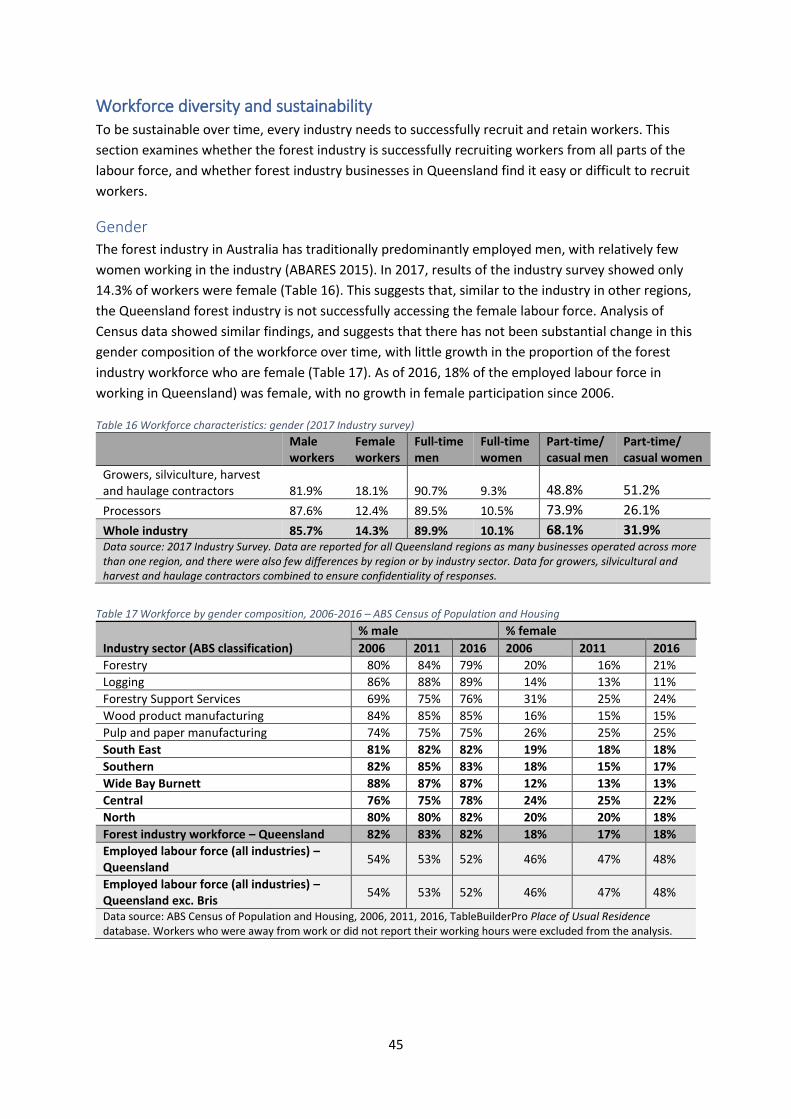
45
Workforce diversity and sustainability To be sustainable over time, every industry needs to successfully recruit and retain workers. This
section examines whether the forest industry is successfully recruiting workers from all parts of the
labour force, and whether forest industry businesses in Queensland find it easy or difficult to recruit
workers.
Gender
The forest industry in Australia has traditionally predominantly employed men, with relatively few
women working in the industry (ABARES 2015). In 2017, results of the industry survey showed only
14.3% of workers were female (Table 16). This suggests that, similar to the industry in other regions,
the Queensland forest industry is not successfully accessing the female labour force. Analysis of
Census data showed similar findings, and suggests that there has not been substantial change in this
gender composition of the workforce over time, with little growth in the proportion of the forest
industry workforce who are female (Table 17). As of 2016, 18% of the employed labour force in
working in Queensland) was female, with no growth in female participation since 2006.
Table 16 Workforce characteristics: gender (2017 Industry survey)
Male workers
Female workers
Full-time men
Full-time women
Part-time/ casual men
Part-time/ casual women
Growers, silviculture, harvest and haulage contractors 81.9% 18.1% 90.7% 9.3% 48.8% 51.2%
Processors 87.6% 12.4% 89.5% 10.5% 73.9% 26.1%
Whole industry 85.7% 14.3% 89.9% 10.1% 68.1% 31.9% Data source: 2017 Industry Survey. Data are reported for all Queensland regions as many businesses operated across more than one region, and there were also few differences by region or by industry sector. Data for growers, silvicultural and harvest and haulage contractors combined to ensure confidentiality of responses.
Table 17 Workforce by gender composition, 2006-2016 – ABS Census of Population and Housing
Industry sector (ABS classification)
% male % female
2006 2011 2016 2006 2011 2016
Forestry 80% 84% 79% 20% 16% 21%
Logging 86% 88% 89% 14% 13% 11%
Forestry Support Services 69% 75% 76% 31% 25% 24%
Wood product manufacturing 84% 85% 85% 16% 15% 15%
Pulp and paper manufacturing 74% 75% 75% 26% 25% 25%
South East 81% 82% 82% 19% 18% 18%
Southern 82% 85% 83% 18% 15% 17%
Wide Bay Burnett 88% 87% 87% 12% 13% 13%
Central 76% 75% 78% 24% 25% 22%
North 80% 80% 82% 20% 20% 18%
Forest industry workforce – Queensland 82% 83% 82% 18% 17% 18%
Employed labour force (all industries) – Queensland
54% 53% 52% 46% 47% 48%
Employed labour force (all industries) – Queensland exc. Bris
54% 53% 52% 46% 47% 48%
Data source: ABS Census of Population and Housing, 2006, 2011, 2016, TableBuilderPro Place of Usual Residence database. Workers who were away from work or did not report their working hours were excluded from the analysis.
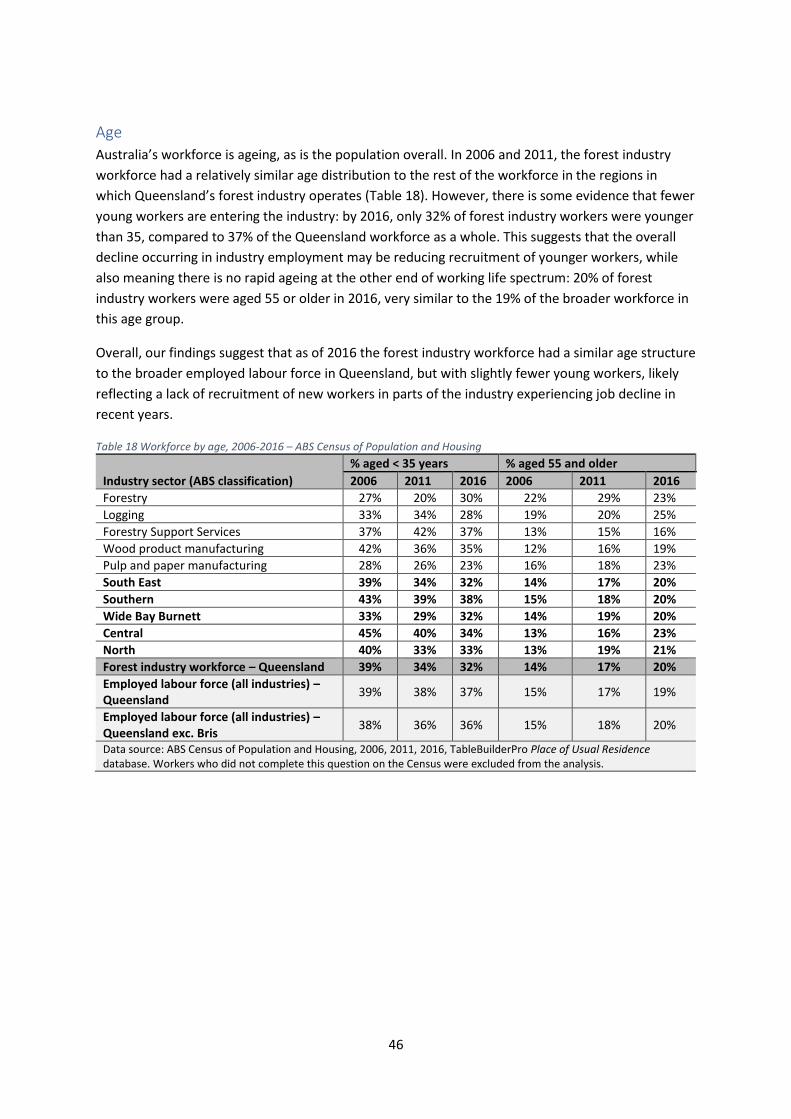
46
Age
Australia’s workforce is ageing, as is the population overall. In 2006 and 2011, the forest industry
workforce had a relatively similar age distribution to the rest of the workforce in the regions in
which Queensland’s forest industry operates (Table 18). However, there is some evidence that fewer
young workers are entering the industry: by 2016, only 32% of forest industry workers were younger
than 35, compared to 37% of the Queensland workforce as a whole. This suggests that the overall
decline occurring in industry employment may be reducing recruitment of younger workers, while
also meaning there is no rapid ageing at the other end of working life spectrum: 20% of forest
industry workers were aged 55 or older in 2016, very similar to the 19% of the broader workforce in
this age group.
Overall, our findings suggest that as of 2016 the forest industry workforce had a similar age structure
to the broader employed labour force in Queensland, but with slightly fewer young workers, likely
reflecting a lack of recruitment of new workers in parts of the industry experiencing job decline in
recent years.
Table 18 Workforce by age, 2006-2016 – ABS Census of Population and Housing
Industry sector (ABS classification)
% aged < 35 years % aged 55 and older
2006 2011 2016 2006 2011 2016
Forestry 27% 20% 30% 22% 29% 23%
Logging 33% 34% 28% 19% 20% 25%
Forestry Support Services 37% 42% 37% 13% 15% 16%
Wood product manufacturing 42% 36% 35% 12% 16% 19%
Pulp and paper manufacturing 28% 26% 23% 16% 18% 23%
South East 39% 34% 32% 14% 17% 20%
Southern 43% 39% 38% 15% 18% 20%
Wide Bay Burnett 33% 29% 32% 14% 19% 20%
Central 45% 40% 34% 13% 16% 23%
North 40% 33% 33% 13% 19% 21%
Forest industry workforce – Queensland 39% 34% 32% 14% 17% 20%
Employed labour force (all industries) – Queensland
39% 38% 37% 15% 17% 19%
Employed labour force (all industries) – Queensland exc. Bris
38% 36% 36% 15% 18% 20%
Data source: ABS Census of Population and Housing, 2006, 2011, 2016, TableBuilderPro Place of Usual Residence database. Workers who did not complete this question on the Census were excluded from the analysis.

47
Aboriginal and Torres Strait Islanders
Employment of Aboriginal and Torres Strait Islander peoples was similar in the forest industry to the
overall workforce in Queensland’s forest industry regions (Table 19).
Table 19 Aboriginal and Torres Strait Islander participation in workforce, 2006-2016 – ABS Census
Industry sector (ABS classification)
% workforce identifying as Aboriginal or Torres Strait Islander
2006 2011 2016
Forestry 1% 2% 3%
Logging 1% 4% 2%
Forestry Support Services 6% 6% 13%
Wood product manufacturing 2% 2% 2%
Pulp and paper manufacturing 1% 1% 2%
South East 1% 1% 2%
Southern 4% 4% 4%
Wide Bay Burnett 2% 3% 3%
Central 4% 2% 4%
North 2% 3% 10%
Forest industry workforce – Queensland 2% 2% 3%
Employed labour force (all industries) – Queensland
2% 2% 2%
Employed labour force (all industries) – Queensland exc. Bris
2% 2% 3%
Data source: ABS Census of Population and Housing, 2006, 2011, 2016, TableBuilderPro Place of Usual Residence database. Workers who did not complete this question on the Census were excluded from the analysis.

48
Recruiting workers and contractors
Forest industry businesses were asked how easy or difficult they found it to recruit workers and
contractors. They were then asked what factors contributed to difficulty recruiting workers. The
types of staff that were most challenging to recruit were heavy machine operators (Figure 5), with
75% of businesses reporting difficulty recruiting these types of workers. This was followed by
managers and high level professional staff (58% finding it difficult to recruit staff), transport and
drivers (45% finding it difficult to recruit staff) and field staff (40% finding it difficult to recruit staff).
Only 30% per cent found it challenging to source finance/book keeping staff, and almost half (46%)
found it easy to source administration staff.
Figure 5 Level of difficulty involved in recruiting different types of workers, as rated by Queensland forest industry businesses
Native forest and plantation managers were asked about accessing skilled contractors. As there are a
small number of native forest and plantation managers in Queensland, results are presented in
qualitative form to ensure privacy of the individual responses from these businesses. Harvest and
haulage contractors were commonly identified as difficult to recruit, by both native forest and
plantation managers, and by sawmills in cases where sawmills were responsible for engaging these
contractors. Silvicultural contractors used for spraying/fertilising and coppicing/pruning were also
reported as being difficult to recruit. Silvicultural contractors used for site preparation and planting,
and roading and earthmoving contractors, were not reported as being difficult to recruit.
When asked what factors made it difficult to recruit staff, a lack of available workers with
appropriate skills was the top issue identified by forest industry businesses across Queensland, with
87% reporting that this was a big issue for them (Figure 6). For 76%, other businesses offering higher
wages was a big issue, and for 75% the investment and time required to build workforce skills was a
big issue.
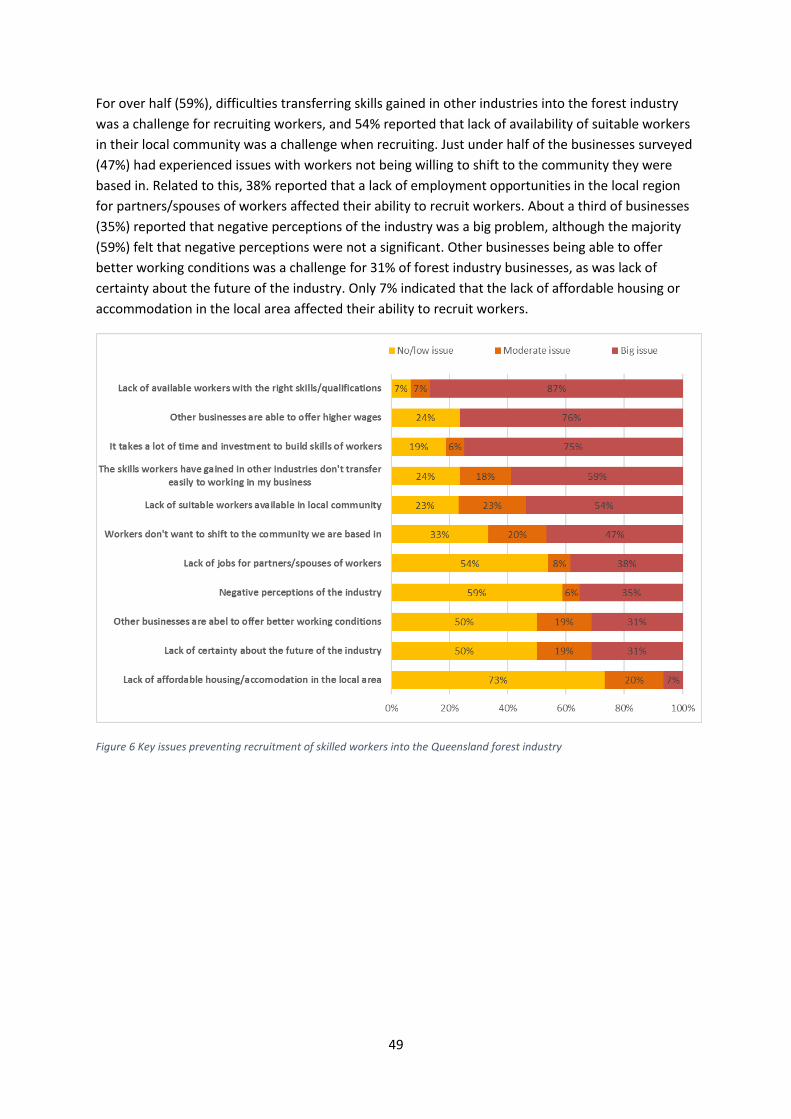
49
For over half (59%), difficulties transferring skills gained in other industries into the forest industry
was a challenge for recruiting workers, and 54% reported that lack of availability of suitable workers
in their local community was a challenge when recruiting. Just under half of the businesses surveyed
(47%) had experienced issues with workers not being willing to shift to the community they were
based in. Related to this, 38% reported that a lack of employment opportunities in the local region
for partners/spouses of workers affected their ability to recruit workers. About a third of businesses
(35%) reported that negative perceptions of the industry was a big problem, although the majority
(59%) felt that negative perceptions were not a significant. Other businesses being able to offer
better working conditions was a challenge for 31% of forest industry businesses, as was lack of
certainty about the future of the industry. Only 7% indicated that the lack of affordable housing or
accommodation in the local area affected their ability to recruit workers.
Figure 6 Key issues preventing recruitment of skilled workers into the Queensland forest industry

50
Industry skills and training needs Forest industry needs workers with a diverse range of skills, which are evolving over time as the
technologies used in the industry evolve. This section examines the skills and training needs of the
forest industry in Queensland.
Forest industry businesses were asked what types of skills were needed by their workforce, whether
they required workers to have formal accreditation in these skills, and how they currently provided
training. forest ecology and silviculture compared to growers and processors.
51
TableTable 20 shows the proportion of businesses reporting that some or all of their workers
required skills in each of twelve competency areas, and the proportion of businesses who required
formal accreditation of their workers in each. Businesses most commonly reported needing workers
with skills in heavy machinery operation, with 82% of businesses reporting a need for this skill,
followed by a need for occupational health and safety training (76%). Other common skills
requirements were operation of hand-held machinery such as chainsaws (71%), compliance training
(67%), fire-fighting (53%) and business and financial management (40%).
Businesses operating in different forestry sectors (native forests and plantations) reported similar
skill requirements in many competency areas. There were some exceptions: More businesses
working in native forests reported a need for heavy machinery operation skills (100%), occupational
health and safety training (100%) and operation of hand-held machinery such as chainsaws (100%)
compared to businesses operating in the plantation sector. A higher proportion of businesses
operating in plantations indicated a need for skills in firefighting (58%), road transport/driver
training for haulage drivers (42%) and IT/ software training specialised to the industry (42%)
compared to businesses working in the native forest sector.
There was more variation in needs for skills and accreditation between businesses types, with some
skills specialised to particular parts of the industry. For example, processors less commonly require
forest operations planning and management, forest ecology and silviculture and road/transport
driving skills, while these were important competency areas for growers (note that data for growers
is not presented separately in Table 20, to ensure privacy of individual survey responses). Harvest
and haulage contractors reported less need for skills in marketing/sales, community
relations/engagement and forest ecology and silviculture compared to growers and processors.

52
Table 20 Skills and accreditation needs reported by businesses in Queensland
All businesses (excludes silvicultural contractors)
Native forest businesses
Plantation businesses Harvest and
haulage contractors Processors
Need skills
Require accred-itation
Need skills
Require accred-itation
Need skills
Require accred-itation
Need skills
Require accred-itation
Need skills
Require accred-itation
Heavy machinery operation 82% 76% 100% 80% 75% 75% 100% 100% 67% 56%
Occupational health and safety training 76% 59% 100% 80% 67% 50% 67% 50% 78% 67%
Chainsaw and other hand-held machinery 71% 59% 100% 80% 58% 50% 67% 67% 67% 44%
Compliance training 67% 53% 67% 67% 67% 50% 67% 50% 57% 57%
Fire fighting 53% 47% 40% 40% 58% 50% 67% 67% 32% 22%
Business and financial management 40% 33% 67% 67% 33% 25% 17% 0% 43% 43%
Road transport/driver training for haulage drivers 40% 33% 33% 33% 42% 33% 67% 67% 29% 14%
Forest operations planning and management 40% 20% 67% 33% 33% 17% 50% 17% 14% 0%
Marketing/sales 33% 20% 33% 33% 33% 17% 0% 0% 57% 43%
IT/ software training specialised to the industry 33% 0% 0% 0% 42% 0% 50% 0% 50% 0%
Forest ecology and silviculture 20% 0% 33% 0% 17% 0% 17% 0% 0% 0%
Community relations/ engagement 13% 13% 0% 0% 17% 17% 0% 0% 14% 14%
53
Businesses who identified a need for particular skills were also asked to identify whether they
delivered skills training in these competency areas via in-house training by other staff, in-house
training by an expert, or training via a registered training organisation (RTO), and were able to select
more than one of these (Table 21). The main findings included:
• RTOs were most commonly used to provide training in business and financial management,
heavy machinery operation and occupational health and safety training; in some cases these
were also supplemented by in-house training. RTOs were also used by the small proportion of
businesses who engaged in community relations/community engagement training (only 13% of
businesses indicated needing this type of skill).
• RTOs were also the most common methods for training in compliance training, fire-fighting, and
hand held machinery, although for these competencies in-house training was also relatively
commonly used in addition to RTOs.
• Compliance training was delivered through an RTO for just over half of all businesses, while
almost half used in-house training by other staff or experts, suggesting opportunities for
additional provision of training in this area through RTOs or other formal mechanisms.
• In-house training was more common than use of a RTO for forest ecology and silviculture, forest
operations and IT.
Table 21 Types of training used by forest industry businesses in Queensland
Registered training organisation
In-house training by expert
In-house training by other staff
Community relations/community engagement 100% 0% 0%
Business and financial management 83% 0% 33%
Heavy machinery operation 79% 29% 21%
Occupational health and safety training. 75% 42% 8%
Compliance training e.g. training in compliance needed for regulatory or certification bodies 70% 30% 30%
Fire fighting 67% 33% 0%
Chainsaw and other hand-held machinery (eg brushcutter, pruning) 55% 36% 45%
Road transport/driver training for haulage drivers 50% 50% 0%
Marketing/sales 50% 0% 50%
Forest operations planning and management 40% 0% 80%
Forest ecology and silviculture including plant identification 0% 33% 100%
IT/ software training specialised to the industry e.g. for plant operation, in-field survey 0% 40% 60%
54
Formal skills attainment
Formal qualifications do not always reflect the skills of a given workforce, particularly in cases where
skills have been learned on the job – for example, through in-house business training such as that
identified in the previous section. Having a formal qualification does, however, provide an idea of
the extent to which workers have skills that are formally recognised and thus able to be better
transferred between workplaces and even industries. Formal educational attainment is also an
important indicator of the extent to which workers have foundational skills in literacy and numeracy
that are widely recognised as critical to enabling workers to gain new skills and competencies
through their working life, and which have been identified as critical to increasing the productivity of
Australia’s labour force into the future (Skills Australia 2010).
As of 2016, forest industry workers in most parts of the industry were less likely to have completed
high school than those working in other industries (Table 22), although high school attainment rates
did increase between 2006 and 2016 at a similar rate to that of the broader workforce. However,
forest industry workers were more likely to have completed a certificate qualification than those in
other parts of the workforce. Completion of a Bachelor degree or other university qualification was
lower than the average for the employed labour force in most parts of the industry.

55
Table 22 Formal educational attainment: rates of attainment of high school and post-school qualifications in the Queensland forest industry, 2006 to 2016
% completed high school (Year 12 or equivalent)
% with no post-school qualification
% with Certificate qualification
% with Bachelor or postgraduate degree
Industry sector (ABS classification) 2006 2011 2016 2006 2011 2016 2006 2011 2016 2006 2011 2016
Forestry 41% 43% 49% 55% 57% 46% 29% 27% 38% 17% 19% 16%
Logging 25% 32% 31% 76% 72% 61% 20% 22% 33% 4% 4% 6%
Forestry Support Services 49% 57% 64% 52% 38% 30% 29% 41% 46% 20% 17% 25%
Wood product manufacturing 36% 41% 46% 56% 48% 46% 41% 48% 50% 3% 4% 5%
Pulp & paper manufacturing 43% 49% 54% 60% 56% 50% 33% 35% 40% 8% 9% 10%
South East 40% 45% 52% 55% 48% 44% 39% 45% 48% 6% 7% 8%
Southern 29% 36% 38% 63% 55% 52% 34% 42% 42% 3% 3% 6%
Wide Bay Burnett 27% 35% 40% 62% 58% 50% 34% 37% 44% 4% 5% 7%
Central 32% 37% 41% 61% 56% 52% 36% 42% 44% 3% 3% 5%
North 41% 42% 48% 53% 47% 46% 43% 49% 48% 4% 4% 5%
Forest industry workforce – Queensland 37% 43% 48% 57% 50% 46% 38% 44% 46% 5% 6% 7%
Employed labour force (all industries) – Queensland
54% 60% 66% 52% 42% 36% 33% 35% 38% 19% 23% 26%
Employed labour force (all industries) – Queensland exc Brisbane
48% 53% 60% 52% 45% 39% 35% 38% 42% 14% 17% 20%
Data source: ABS Census of Population and Housing, 2006, 2011, 2016, TableBuilderPro Place of Usual Residence database. Workers who did not complete this question on the Census were excluded from the analysis.

56
Business and market outlook Businesses were asked about the business and market conditions and challenges they were
experiencing, and the extent to which they could cope with difficult business conditions. These
questions help identify both areas of strength and areas of challenge being experienced by
businesses operating in the forest industry.
Overall business conditions
Businesses were asked ‘how would you describe business conditions for your business at the
moment?’ Around one in five (21%) of businesses in Queensland reported that conditions were
‘easier than usual’, another 21% reported that they were ‘more challenging than usual’, and the
majority (58%) reported that conditions were ‘about the same as usual’.
Half of the businesses operating in the plantation sector (50%) felt that business conditions were
‘about the same as usual’ and 22% that conditions were ‘easier than usual’. The majority of native
forest eucalypt and cypress businesses (83%) reported business conditions were ‘about the same as
usual’, with the remaining 17% reporting that conditions were ‘more challenging than usual’.
Future business expectations
Businesses were asked how likely or unlikely it was that in the next year they would invest in new
business systems or new capital equipment, reduce or increase their workforce, grow their business
revenue, or increase business profitability. As shown in Figure 7:
• 63% of all businesses felt they were likely to grow their profitability, and only 13% felt this was
unlikely in the next 12 months. Of those operating in the plantation, 58% felt they were likely to
grow their profitability and 17% felt this was unlikely. A higher proportion of businesses in the
native forest sector (75%) felt they were likely to grow their profitability in the next 12 months.
• 76% of all businesses felt that their revenue would grow in the next 12 months, and only 12%
felt revenue was unlikely to grow.
• Overall, most businesses felt their workforce would remain stable over the next 12 months,
although fewer native forest businesses (25%) felt they were likely to increase their workforce
compared to plantation businesses (33%). More native forest businesses reported that it was
likely they would reduce the size of their workforce (25%) than plantation businesses (8%).
• Most businesses planned to invest in new capital equipment (76%) in the next year but fewer
were likely to invest in new businesses systems (33%). In general, more plantation sector
businesses were planning to invest in their business, and fewer businesses in the native forest
sector.

57
Figure 7 Expectations for business revenue, profitability, workforce size and investment over the next 12 months
Businesses were also asked whether they felt that, over the next 12 months, demand for their
services or products were likely to grow, remain about the same, or shrink. A little less than half
(45%) felt demand would remain the same, and the remaining businesses (55%) felt that demand
would grow. No businesses indicated that they felt demand would shrink over the next 12 months. A
higher proportion of native forest sector businesses indicated that they expected demand would
remain about the same (75%), while more plantation businesses felt that demand was likely to grow
(61%).
58
Businesses were asked what factors would enable them to invest more in their business. This
question was either completed in the survey, or answered on the phone:
• Businesses operating in native forests reported that having additional supply of timber and
greater workforce stability would enable them to invest more in their business.
• Businesses operating in the plantation sector reported that having improved confidence in
continuing strong markets, being able to reduce production costs, better access to specialised
equipment, increased volume of logs, greater certainty of contracts in the contracting sectors,
and increased availability of skilled staff, would enable more investment in their business.
Business challenges
Businesses were asked ‘what factors would trigger you to downsize or close your business?’ A total
of 14 businesses provided answers to this question. Answers were consistent across businesses, and
most identified that downsizing or closure would be triggered by a decline in demand for their
products of services, by economic downturn, by change in government policies that increases
business costs or reduced supply of timber, or more generally by reduced security of access to native
forests or plantations for wood and fibre production.
Businesses were then asked to rate the extent to which different factors had been a challenge or
problems for their business in the last three years (Figure 8). Of the businesses who completed these
questions, the most common challenges in the last three years were difficulty obtaining labour (65%
of businesses reporting this as a big challenge), increasing cost of labour (58%), government
regulations (47%), rising input costs (47%) and lack of demand for their goods or services (44%).
These issues varied between sectors: native forest dependent businesses were more likely to report
having difficulty obtaining labour (80%) as a challenge than those operating in the plantation sector.
Plantation sector businesses were more likely than native forest-dependent businesses to report
that rising input costs (including labour), government regulation, reduced demand and/or prices,
difficulty accessing markets, poor telecommunications, and difficulty obtaining finance or achieving
certification, were challenges in the last three years.

59
Figure 8 Challenges experienced by Queensland forest industry businesses

60
Community perceptions of the social, economic, service and infrastructure
effects of the forest industry To further evaluate the socio-economic effects of the forest industry in the communities in which it
operates, residents living in communities across Queensland, including the Wide Bay Burnett,
Central, North, South East and Southern regions, were asked about (i) their overall views about
quality of life and liveability of their community, and (ii) the extent to which they felt the different
industries that operated in their region affected different social and economic aspects of their lives.
These questions were asked as part of the 2016 Regional Wellbeing Survey, a large-scale survey of
13,000 people living in rural and regional areas of Australia.
Quality of life and liveability
Quality of life and liveability of local regions was examined by analysing responses to survey
questions which asked residents of these regions how they viewed the overall liveability, economy,
roads, friendliness, safety, landscape and environmental health of their local community. To identify
whether the forest industry may be contributing to differences in these experiences, the following
groups were compared:
• Rural and regional Queensland: a total of around 2,062 people from rural and regional
Queensland participated in the survey, including residents living on the urban fringe of Brisbane
• High forest industry dependence: people living in local government areas (LGAs) in which more
than 2% of employment was directly dependent on the forest industry, or in which there were
large areas of plantations or harvesting of native forests. This was examined in only one region
that had high forest industry dependence:
o Wide Bay Burnett: A total of 158 residents of the LGAs of Fraser Coast Regional,
Gympie Regional and North Burnett Regional
• Low forest industry dependence: people living in LGAs with less than 2% of jobs directly
dependent on the forest industry, or with relatively smaller amounts of plantation of forest
harvesting:
o Wide Bay Burnett: A total of 166 residents of the LGAs of Bundaberg Regional and
South Burnett Regional
o Central: A total of 253 residents of the LGAs of Banana Shire, Blackall Tambo
Regional, Central Highlands Regional, Gladstone Regional, Isaac Regional,
Livingstone Shire, Mackay Regional, Rockhampton Regional, Whitsunday Regional
o North: A total of 318 residents of the LGAs of Burdekin Shire, Cairns Region, Charters
Towers Regional, Cook Shire, Douglas Shire, Hinchinbrook Shire, Mareeba Shire,
Tablelands Regional and Townsville City
o South East: A total of 478 residents of the LGAs of Brisbane City, Gold coast City,
Ipswich City, Lockyer Valley Regional, Logan City, Moreton Bay Regional, Noosa
Shire, Redland City, Scenic Rim Regional, Somerset Regional and Sunshine Coast
Regional
o Southern: A total of 515 residents of the LGAs of Goondiwindi Regional, Maranoa
Regional, Shire of Balonne, Southern Downs Regional, Toowoomba Regional and
Western Downs Regional.

61
The analysis below compares experiences of those living in Queensland as a whole, those living in
communities with high versus low forest industry dependence in Wide Bay Burnett, and the Central,
North, South East and Southern regions as a whole. This gives a useful indication of whether
residents of forest industry dependent communities report substantially different experiences of
liveability compared to those in other communities. However, where there are differences they may
be driven by a range of factors, only one of which is the presence of the forest industry. For example,
the mix of industries operating in different regions varies substantially across Queensland, from
areas with high dependence on irrigated agriculture, to regions that have substantial tourism and
fishing industries or substantial mining activity. Some of the differences between these communities
are therefore likely to be due more to differences in factors such as the changes in other industries
or total size of population (to name just two examples), rather than to the presence of the forest
industry.
Figure 9 shows overall views of residents about the liveability of their community. The error bars
show 95% confidence intervals; where error bars do not overlap, this indicates there is a significant
difference between regions at the ‘5%’ significance level. Overall, the results suggest that those
living in regions with higher dependence on the forest industry are just as or likely to rate their
community as highly liveable as those living in nearby communities with less dependence on the
forest industry. There were similar findings when resident’s perceptions of the overall friendliness
and safety of their community were examined (Figure 10). While those living in Wide Bay Burnett
were less likely than people in other parts of Queensland to recommend their community as a good
place to live, and more likely to report high levels of crime, this was the case both for areas with and
without substantial forest industry dependence in this region, suggesting it is likely to be a result of
factors other than the presence of the forest industry.
When perceptions of local landscape aesthetics and environmental health were asked about (Figure
11), those living in the parts of Wide Bay Burnett with high levels of forest industry jobs were more
likely to report that their region had attractive building and homes, and less likely to report concerns
about environmental degradation, compared to those in other regions. Other than these differences
(which may not be caused by the presence of the forest industry), there were no significant
differences between this region and the Queensland average.
Overall, these results suggest that the perceptions residents have of the liveability of their
communities are mostly positive, but with some small differences between communities that have
higher and lower dependence on the forest industry. However the differences are not consistent,
suggesting they are often driven by factors other than the presence of the forest industry.
62
Figure 9 Perceptions of overall liveability and economy of local region – Regional Wellbeing Survey 2016

63
Figure 10 Perceptions of friendliness, safety and crime
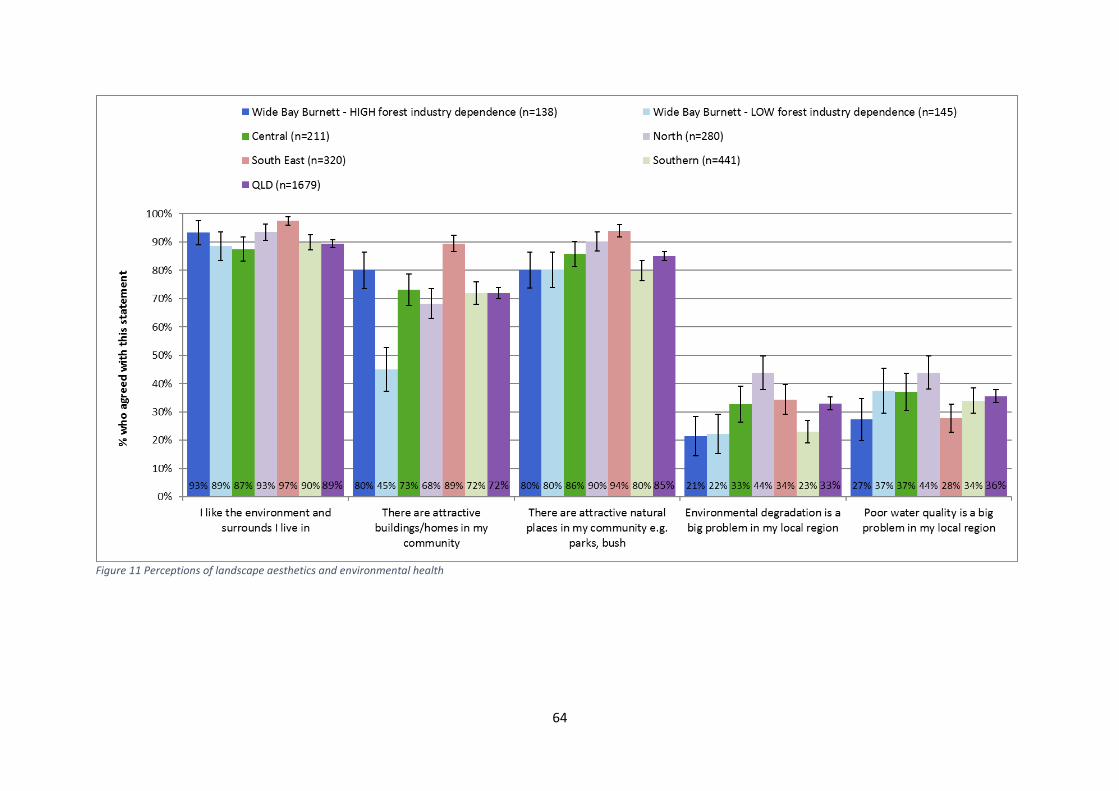
64
Figure 11 Perceptions of landscape aesthetics and environmental health

65
Perceptions of regional industries
After asking their overall perceptions of the liveability of their communities, residents were asked
their views about how different local industries contribute to that liveability.
First, residents were asked to identify whether they felt any of a number of industries were
important to their community. Asking this helps identify whether local residents living in regions
with higher dependence on the forest industry for employment are aware of the presence of the
industry, or feel it is an important contributor.
Residents were asked whether agriculture, tourism, mining, fishing, or forest-related industries were
important industries in their local region. Residents were able to select more than one important
industry in their region. Two forest industry-related industries were asked about: (i) forestry (logging
of native forests or plantations) and (ii) wood or paper product manufacturing. In total, 1,689
residents living in Queensland answered questions about the socio-economic effects of different
industries. This included 296 living in Wide Bay Burnett, 222 living in Central, 294 living in North, 349
living in South East and 384 living in Southern. Of these, a total of 144 lived in local government
areas or towns with higher dependence on the forest industry for employment (all in the Wide Bay
Burnett region).
As shown in Figure 12, those who lived in Wide Bay Burnett LGAs with high forest industry
dependence were much more likely to identify the forest industry as an important industry in their
local community than those who lived in LGAs where a smaller proportion of employment relies on
the industry However, even in these regions with higher dependence on the forest industry, only
54% of residents identified forestry (logging of native forests or plantations) as an important
industry, and 24% identified wood or paper product manufacturing as an important industry. This is
despite the majority of the jobs generated by the industry in the Wide Bay Burnett region being in
the manufacturing of wood products.
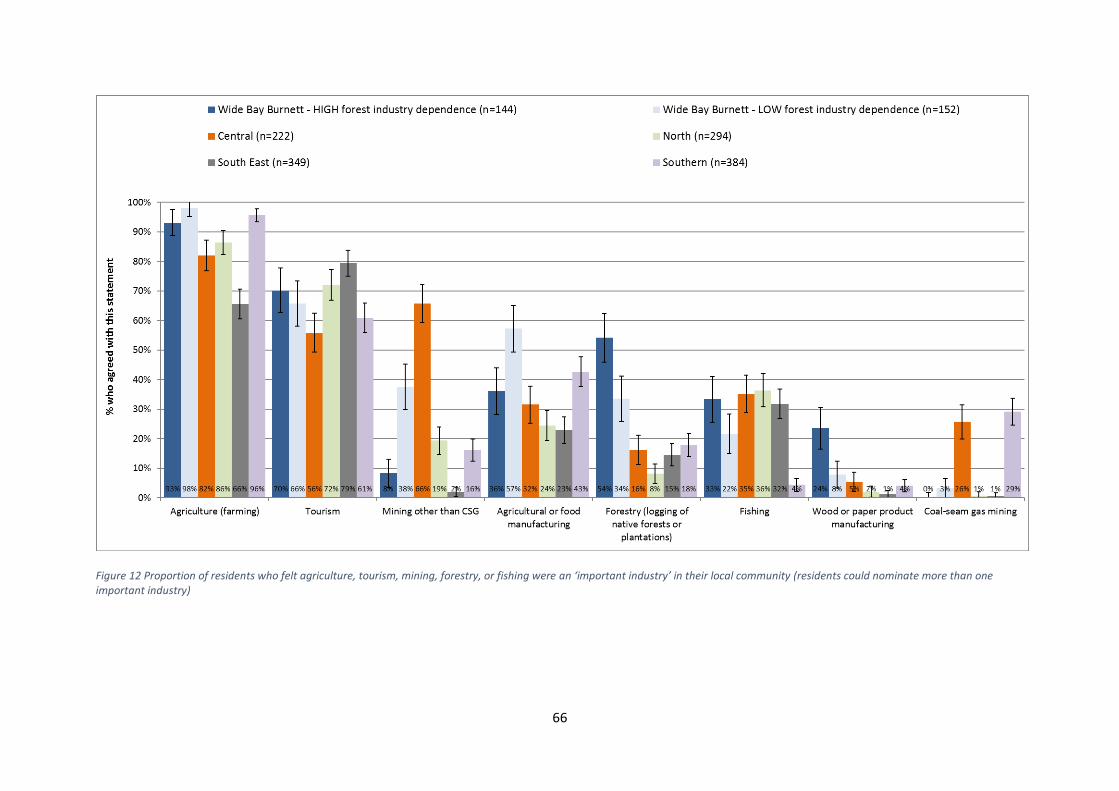
66
Figure 12 Proportion of residents who felt agriculture, tourism, mining, forestry, or fishing were an ‘important industry’ in their local community (residents could nominate more than one important industry)

67
Those who identified that each industry was important were then asked to rate whether they felt
the industry had a negative impact, positive impact, or no impact, on the following in their local
community:
• Local employment
• Cost of living (food, rent)
• Friendliness of the local community
• Health of local residents
• Traffic on local roads
• Quality of local roads
• Attractiveness of the local landscape
• Local water quality
• Health of local environment
• Bushfire risk
• Land prices.
When asked to assess this for the forest industry, survey participants were asked to assess forestry,
wood and paper manufacturing together. This section examines the views of those living in three
regions: the Wide Bay Burnett (with the highest amount of forest industry employment in
Queensland), the Northern and Central regions (reported together due to the low number of people
identifying forestry as an important industry in each of these regions), and the Southern and South
East regions (also reported together due to low numbers of people identifying forestry as an
important industry). The views of these residents about the forestry industry are compared to their
views about the two other industries most commonly considered important by local residents:
agriculture and tourism.
Residents living in the Wide Bay Burnett, and in the Southern and South East regions, generally
perceived the forest industry as having fewer positive effects and more negative effects than the
farming and tourism industries (Figures 13 to 18). This was similar for residents living in LGAs with
higher and lower dependence on the industry (see Appendix 1). While 83% of people living in parts
of the Wide Bay Burnett with high dependence on the forest industry felt it had a positive impact on
local employment (Appendix 1), and 70% in the Wide Bay Burnett more broadly (Figure 13), in the
South East and Southern regions (Figure 15) fewer felt the industry impacted positively on local
employment, likely reflecting the relatively small proportion of jobs dependent on the industry in
most parts of Queensland.
Fewer than 30% felt the industry had positive impacts on other aspects of community liveability
including cost of living, friendliness of the local community, health of local residents, safety and
quality of roads, bushfire risk, landscape attractiveness, water quality, land prices or health of the
local environment.
Fewer than 30% felt that the forest industry had negative impacts on things such as cost of living,
local employment, friendliness of the community, health of local residents, local water quality, or

68
land prices. However, there were some areas where more than 30% of residents in many regions
reported concerns about negative impacts (Figures 16 to 18):
• Traffic on local roads and quality of those roads, with more than 40% and in some cases
more than 50% concerned the industry impacted negatively on these
• Bushfire risk, with 30% in the Wide Bay Burnett concerned the industry had a negative
impact, and lower concern in other regions
• Attractiveness of the local landscape, a concern reported most commonly in the North and
South Eastern region, and less in other regions.
The results suggest that the forest industry is not viewed as either being as important an industry as
agriculture and tourism, or as having positive outcomes for community life other than employment
in those LGAs with high proportions of their workforce employed in the industry. In particular, the
results suggest a lack of connection by many residents with the industry, with fewer feeling the
industry contributes to friendliness of the local community compared to the agriculture and tourism
industries, despite most recognising the positive contributions the industry makes to jobs. Working
to address concerns about traffic, road quality, and landscape aesthetics, as well as to increase
positive experiences of friendliness, can help address the less positive perception of the forest
industry compared to agriculture and tourism in these regions.
Figure 13 Proportion of Wide Bay Burnett residents who felt the forestry, farming and tourism industries had a positive impact on different aspects of their local community

69
Figure 14 Proportion of North and Central region residents who felt the forestry, farming and tourism industries had a positive impact on different aspects of their local community
Figure 15 Proportion of South East and Southern residents who felt the forestry, farming and tourism industries had a positive impact on different aspects of their local community

70
Figure 16 Proportion of Wide Bay Burnett residents who felt the forestry, farming and tourism industries had a negative impact on different aspects of their local community
Figure 17 Proportion of North and Central region residents who felt the forestry, farming and tourism industries had a negative impact on different aspects of their local community

71
Figure 18 Proportion of South East and Southern region residents who felt the forestry, farming and tourism industries had a negative impact on different aspects of their local community

72
Conclusions This report quantifies the employment and economic activity generated by the forest industry, and
identifies the communities in which the industry generates a significant proportion of local jobs. The
analysis shows that the Queensland forest industry has declined in size over time, despite some
growth in employment in primary production jobs between 2011 and 2016. As of 2017, the industry
generated 8,798 direct jobs, of which the majority were secondary processing jobs (not all of which
rely on forest or plantation grown in Queensland). Up to the point of primary processing, 62.1% of
jobs generated in the industry depended on plantations (southern pine and araucaria), while 34.5%
depended on native forests (eucalypt and cypress pine) and a small proportion on other types of
forest or plantation such as hardwood plantation. The majority of jobs generated by the industry are
generated by the processing sector, as is the majority of the flow-on economic impact of the
industry. This highlights the importance of local processing of wood and fibre for generation of jobs
from the industry; far fewer jobs are created if logs are harvested and exported with no or little
processing. Many of the jobs created by the industry are clustered in the Wide Bay Burnett and
South East regions. There is relatively high business confidence in the industry, with businesses
expecting demand for their products to remain the same or increase in the near future; confidence
was higher in the plantation industry compared to the native forest industry. However, many
businesses find it difficult to recruit workers, particularly due to a lack of skilled workers and
competition from other industries.

73
References ABARES 2015. Diversity in Australia’s forest industry workforce. Australian Bureau of Agricultural and
Resource Economics and Sciences, Canberra. URL:
http://www.agriculture.gov.au/abares/forestsaustralia/Documents/DvrstyInAustFrstyWrkfrc201502
20v1.0.0.pdf Accessed 19 March 2017
ABARES 2016. Australian plantation statistics 2016, Australian Bureau of Agricultural and Resource
Economics and Sciences, Canberra, August
ABARES. 2013. Australian forest and wood product statistics September and December quarters
2012. ABARES, Canberra.
ABS. 2017. Australian Industry, 2015-16. Catalogue Number 8155.0. ABS, Canberra.
ABS. 2018. Labour Force, Australia, Dec 2017. Catalogue Number 6202.0. ABS, Canberra.
ABS/SNZ. 2013. Australian and New Zealand Standard Industrial Classification (ANZSIC), Revision 2.0.
Catalogue Number 1292.0. Australian Bureau of Statistics, Canberra.
AFPA. 2016. Plantations – the Missing Piece of the Puzzle. Australian Forest Products Association,
Canberra.
CIE (Centre for International Economics). 2005. Plantations, jobs and investment in regional NSW: A
socio-economic analysis of private forestry in the Bombala region. Centre for International
Economics, Canberra.
Commonwealth of Australia. 2015. Meeting market demand: Australia’s forest products and forest
industry. Forest Industry Advisory Council. Department of Agriculture, Canberra.
HQ Plantations. n.d.[a] Araucaria Fact Sheet. URL:
https://docs.wixstatic.com/ugd/951a68_242c35bd4bad4b97bb0a094a1ab147e3.pdf
HQ Plantations. n.d.[a] Southern Pine Fact Sheet. URL:
https://docs.wixstatic.com/ugd/951a68_e27de50e16ac4ef6858a62ceec7b10e5.pdf
MBAC Consulting. 2005. A socio-economic assessment of the plantation processing section in
Queensland. Report prepared for Timber Queensland, Brisbane.
Mylek, M. and Schirmer, J. 2014. Wellbeing of workers in Australian forest, wood and paper
products businesses. Summary report, June 2014. University of Canberra, Canberra.
Mylek, M. R., & Schirmer, J. 2015. Beyond physical health and safety: supporting the wellbeing of
workers employed in the forest industry. Forestry, 88(4), 391-406.
Schirmer, J., Binks, B., Kancans, R. and Stenekes, N. 2013. Social indicators for Australia’s forest and
wood products industries: discussion paper. Australian Bureau of Agricultural and Resource
Economics and Sciences, Canberra.

74
Schirmer, J., Parsons, M., Charalambou, C. and Gavran, M. 2005. Socio-economic impacts of
plantation forestry in the South West Slopes of NSW, 1991 to 2004. Report produced for FWPRDC
Project PN04.4007. Bureau of Rural Sciences, Canberra.
Schirmer, J. 2018. Employment in Australia’s forest, wood and paper industries. Report prepared for
Forest and Wood Products Australia. Forest and Wood Products Australia, Melbourne.
State of Queensland. 2016. Queensland forest and timber industry: an overview. Department of
Agriculture and Fisheries, Brisbane.
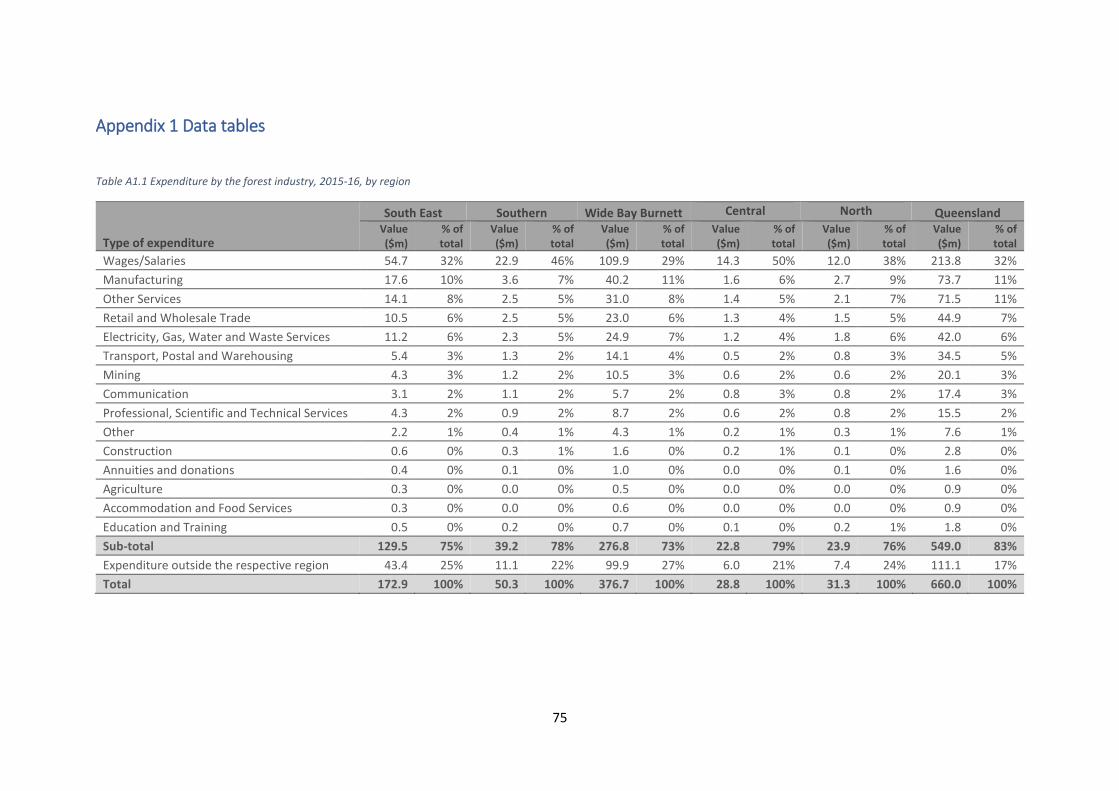
75
Appendix 1 Data tables
Table A1.1 Expenditure by the forest industry, 2015-16, by region
Type of expenditure
South East Southern Wide Bay Burnett Central North Queensland Value ($m)
% of total
Value ($m)
% of total
Value ($m)
% of total
Value ($m)
% of total
Value ($m)
% of total
Value ($m)
% of total
Wages/Salaries 54.7 32% 22.9 46% 109.9 29% 14.3 50% 12.0 38% 213.8 32%
Manufacturing 17.6 10% 3.6 7% 40.2 11% 1.6 6% 2.7 9% 73.7 11%
Other Services 14.1 8% 2.5 5% 31.0 8% 1.4 5% 2.1 7% 71.5 11%
Retail and Wholesale Trade 10.5 6% 2.5 5% 23.0 6% 1.3 4% 1.5 5% 44.9 7%
Electricity, Gas, Water and Waste Services 11.2 6% 2.3 5% 24.9 7% 1.2 4% 1.8 6% 42.0 6%
Transport, Postal and Warehousing 5.4 3% 1.3 2% 14.1 4% 0.5 2% 0.8 3% 34.5 5%
Mining 4.3 3% 1.2 2% 10.5 3% 0.6 2% 0.6 2% 20.1 3%
Communication 3.1 2% 1.1 2% 5.7 2% 0.8 3% 0.8 2% 17.4 3%
Professional, Scientific and Technical Services 4.3 2% 0.9 2% 8.7 2% 0.6 2% 0.8 2% 15.5 2%
Other 2.2 1% 0.4 1% 4.3 1% 0.2 1% 0.3 1% 7.6 1%
Construction 0.6 0% 0.3 1% 1.6 0% 0.2 1% 0.1 0% 2.8 0%
Annuities and donations 0.4 0% 0.1 0% 1.0 0% 0.0 0% 0.1 0% 1.6 0%
Agriculture 0.3 0% 0.0 0% 0.5 0% 0.0 0% 0.0 0% 0.9 0%
Accommodation and Food Services 0.3 0% 0.0 0% 0.6 0% 0.0 0% 0.0 0% 0.9 0%
Education and Training 0.5 0% 0.2 0% 0.7 0% 0.1 0% 0.2 1% 1.8 0%
Sub-total 129.5 75% 39.2 78% 276.8 73% 22.8 79% 23.9 76% 549.0 83%
Expenditure outside the respective region 43.4 25% 11.1 22% 99.9 27% 6.0 21% 7.4 24% 111.1 17%
Total 172.9 100% 50.3 100% 376.7 100% 28.8 100% 31.3 100% 660.0 100%
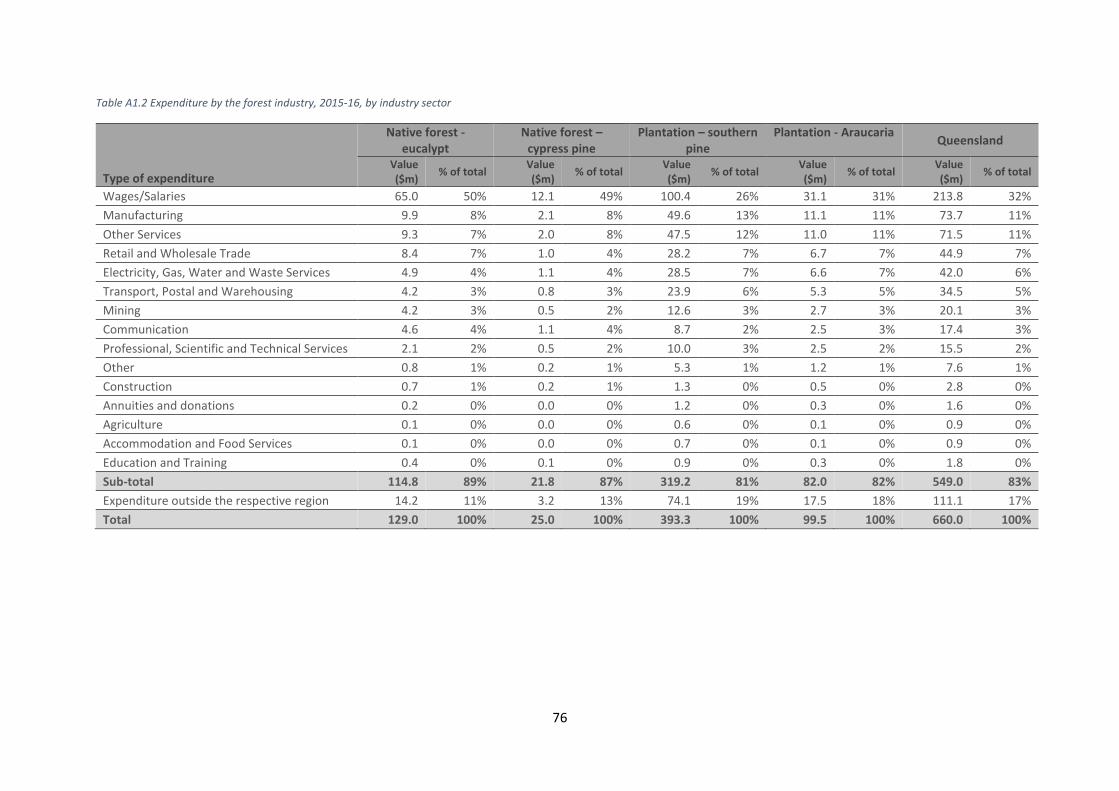
76
Table A1.2 Expenditure by the forest industry, 2015-16, by industry sector
Type of expenditure
Native forest - eucalypt
Native forest – cypress pine
Plantation – southern pine
Plantation - Araucaria Queensland
Value ($m)
% of total Value ($m)
% of total Value ($m)
% of total Value ($m)
% of total Value ($m)
% of total
Wages/Salaries 65.0 50% 12.1 49% 100.4 26% 31.1 31% 213.8 32%
Manufacturing 9.9 8% 2.1 8% 49.6 13% 11.1 11% 73.7 11%
Other Services 9.3 7% 2.0 8% 47.5 12% 11.0 11% 71.5 11%
Retail and Wholesale Trade 8.4 7% 1.0 4% 28.2 7% 6.7 7% 44.9 7%
Electricity, Gas, Water and Waste Services 4.9 4% 1.1 4% 28.5 7% 6.6 7% 42.0 6%
Transport, Postal and Warehousing 4.2 3% 0.8 3% 23.9 6% 5.3 5% 34.5 5%
Mining 4.2 3% 0.5 2% 12.6 3% 2.7 3% 20.1 3%
Communication 4.6 4% 1.1 4% 8.7 2% 2.5 3% 17.4 3%
Professional, Scientific and Technical Services 2.1 2% 0.5 2% 10.0 3% 2.5 2% 15.5 2%
Other 0.8 1% 0.2 1% 5.3 1% 1.2 1% 7.6 1%
Construction 0.7 1% 0.2 1% 1.3 0% 0.5 0% 2.8 0%
Annuities and donations 0.2 0% 0.0 0% 1.2 0% 0.3 0% 1.6 0%
Agriculture 0.1 0% 0.0 0% 0.6 0% 0.1 0% 0.9 0%
Accommodation and Food Services 0.1 0% 0.0 0% 0.7 0% 0.1 0% 0.9 0%
Education and Training 0.4 0% 0.1 0% 0.9 0% 0.3 0% 1.8 0%
Sub-total 114.8 89% 21.8 87% 319.2 81% 82.0 82% 549.0 83%
Expenditure outside the respective region 14.2 11% 3.2 13% 74.1 19% 17.5 18% 111.1 17%
Total 129.0 100% 25.0 100% 393.3 100% 99.5 100% 660.0 100%

77
Table A1.3 Economic impacts of the Queensland forest industry, by sector, on the South East region
Combined activity prior to processingb
(growers , forest management, nurseries, silviculture, roading, consulting, training,
equipment sales, harvest and haulage) Primary processing Whole Industry
(excludes transfers)
Outputa ($m) 156.4 358.4 432.3
Direct ($m) 97.8 184.5 199.7
Production-induced ($m) 23.5 102.3 125.8
Consumption-induced ($m) 35.1 71.7 106.8
GRP ($m) 66.1 134.1 200.2
Direct ($m) 35.2 46.7 81.9
Production-induced ($m) 11.0 47.1 58.2
Consumption-induced ($m) 19.8 40.3 60.0
Household Income ($m) 38.3 81.9 120.2
Direct ($m) 21.4 33.3 54.7
Production-induced ($m) 7.5 30.0 37.5
Consumption-induced ($m) 9.4 18.7 28.1
Employment (total) 610.8 1,259.4 1,870.2
Direct (total) 384.0 639.0 1,023.0
Production-induced (total) 87.5 339.8 427.3
Consumption-induced (total) 139.3 280.6 419.9
a – Total output for combined sectors may be lower than the sum of output for individual sectors as it excludes transfers between sectors to prevent double counting.
b – Activities combined to maintain confidentiality.

78
Table A1.4 Economic impacts of the Queensland forest industry, by sector, on the Southern Region
Combined activity prior to processingb
(growers , forest management, nurseries, silviculture, roading, consulting, training,
equipment sales, harvest and haulage) Primary processing Whole Industry
(excludes transfers)
Outputa ($m) 42.5 99.4 111.6
Direct ($m) 24.3 65.7 59.7
Production-induced ($m) 8.0 15.9 23.8
Consumption-induced ($m) 10.2 17.8 28.1
GRP ($m) 20.5 39.3 59.8
Direct ($m) 10.8 21.7 32.6
Production-induced ($m) 3.7 7.3 11.0
Consumption-induced ($m) 5.9 10.3 16.2
Household Income ($m) 13.3 23.4 36.7
Direct ($m) 8.4 14.5 22.9
Production-induced ($m) 2.4 4.4 6.8
Consumption-induced ($m) 2.5 4.4 7.0
Employment (total) 175.2 501.3 676.6
Direct (total) 102.0 372.0 474.0
Production-induced (total) 30.5 54.7 85.1
Consumption-induced (total) 42.8 74.6 117.4
a – Total output for combined sectors may be lower than the sum of output for individual sectors as it excludes transfers between sectors to prevent double counting.
b – Activities combined to maintain confidentiality.
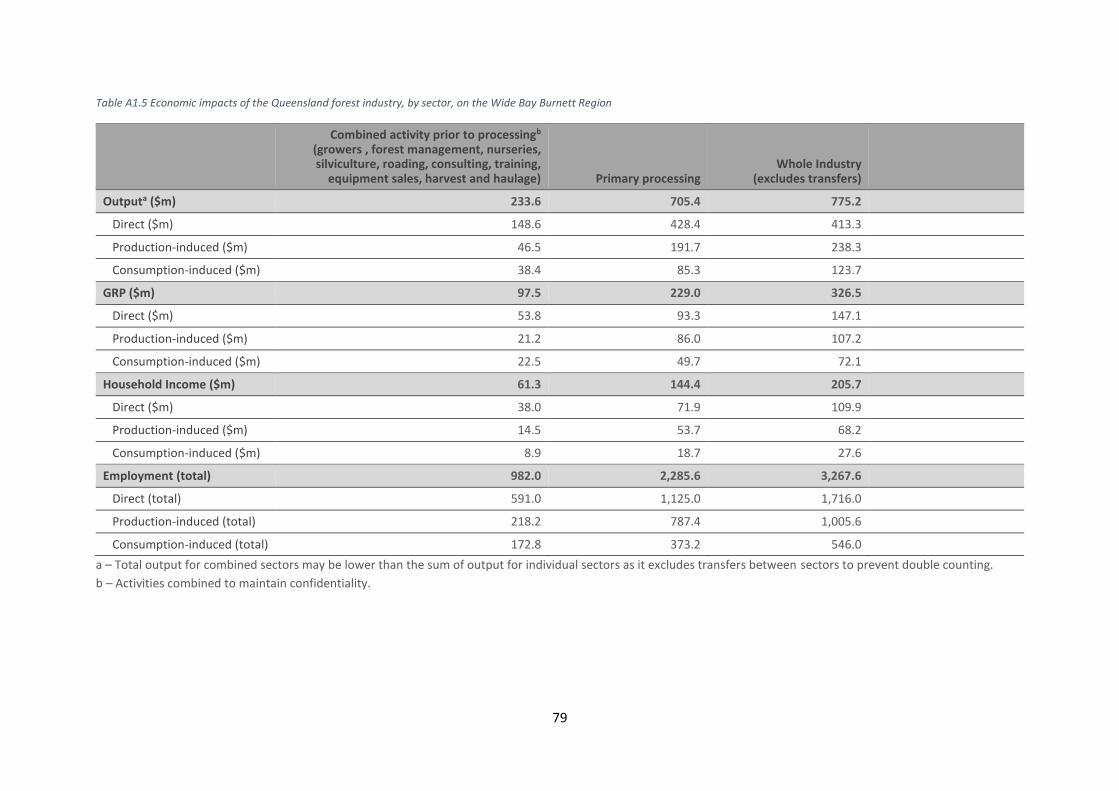
79
Table A1.5 Economic impacts of the Queensland forest industry, by sector, on the Wide Bay Burnett Region
Combined activity prior to processingb
(growers , forest management, nurseries, silviculture, roading, consulting, training,
equipment sales, harvest and haulage) Primary processing Whole Industry
(excludes transfers)
Outputa ($m) 233.6 705.4 775.2
Direct ($m) 148.6 428.4 413.3
Production-induced ($m) 46.5 191.7 238.3
Consumption-induced ($m) 38.4 85.3 123.7
GRP ($m) 97.5 229.0 326.5
Direct ($m) 53.8 93.3 147.1
Production-induced ($m) 21.2 86.0 107.2
Consumption-induced ($m) 22.5 49.7 72.1
Household Income ($m) 61.3 144.4 205.7
Direct ($m) 38.0 71.9 109.9
Production-induced ($m) 14.5 53.7 68.2
Consumption-induced ($m) 8.9 18.7 27.6
Employment (total) 982.0 2,285.6 3,267.6
Direct (total) 591.0 1,125.0 1,716.0
Production-induced (total) 218.2 787.4 1,005.6
Consumption-induced (total) 172.8 373.2 546.0
a – Total output for combined sectors may be lower than the sum of output for individual sectors as it excludes transfers between sectors to prevent double counting.
b – Activities combined to maintain confidentiality.

80
Table A1.6 Economic impacts of the Queensland forest industry, by sector, on the Central Region
Combined activity prior to processingb
(growers , forest management, nurseries, silviculture, roading, consulting, training,
equipment sales, harvest and haulage) Primary processing Whole Industry
(excludes transfers)
Outputa ($m) 38.1 34.4 60.0
Direct ($m) 24.8 21.2 33.5
Production-induced ($m) 6.6 6.0 12.6
Consumption-induced ($m) 6.8 7.2 13.9
GRP ($m) 16.9 16.0 32.9
Direct ($m) 10.0 9.1 19.1
Production-induced ($m) 3.0 2.8 5.7
Consumption-induced ($m) 3.9 4.2 8.1
Household Income ($m) 10.3 10.8 21.1
Direct ($m) 6.8 7.4 14.3
Production-induced ($m) 1.9 1.7 3.6
Consumption-induced ($m) 1.6 1.7 3.3
Employment (total) 130.2 156.1 286.2
Direct (total) 91.0 120.0 211.0
Production-induced (total) 19.3 14.9 34.2
Consumption-induced (total) 19.9 21.2 41.0
a – Total output for combined sectors may be lower than the sum of output for individual sectors as it excludes transfers between sectors to prevent double counting.
b – Activities combined to maintain confidentiality.

81
Table A1.7 Economic impacts of the Queensland forest industry, by sector, on the North Region
Combined activity prior to processingb
(growers , forest management, nurseries, silviculture, roading, consulting, training,
equipment sales, harvest and haulage) Primary processing Whole Industry
(excludes transfers)
Outputa ($m) 32.6 47.2 70.2
Direct ($m) 21.6 25.4 37.3
Production-induced ($m) 5.1 12.8 17.9
Consumption-induced ($m) 6.0 9.0 15.0
GRP ($m) 14.6 20.4 35.0
Direct ($m) 8.8 9.4 18.2
Production-induced ($m) 2.4 5.8 8.2
Consumption-induced ($m) 3.4 5.2 8.6
Household Income ($m) 8.2 12.8 21.0
Direct ($m) 5.1 6.9 12.0
Production-induced ($m) 1.6 3.6 5.3
Consumption-induced ($m) 1.5 2.3 3.8
Employment (total) 157.8 207.8 365.6
Direct (total) 112.0 125.0 237.0
Production-induced (total) 20.6 45.1 65.7
Consumption-induced (total) 25.1 37.7 62.8
a – Total output for combined sectors may be lower than the sum of output for individual sectors as it excludes transfers between sectors to prevent double counting.
b – Activities combined to maintain confidentiality.

82
Table A1.8 Economic impacts of the Queensland native eucalypt forest industry, by sector
Combined activity prior to processingb
(growers , forest management, nurseries, silviculture, roading, consulting, training,
equipment sales, harvest and haulage) Primary processing Whole Industry
(excludes transfers)
Outputa ($m) 112.7 277.9 339.3
Direct ($m) 50.3 145.1 144.1
Production-induced ($m) 27.2 54.6 81.9
Consumption-induced ($m) 35.1 78.2 113.3
GRP ($m) 56.0 124.9 180.8
Direct ($m) 24.3 56.3 80.6
Production-induced ($m) 12.3 25.5 37.8
Consumption-induced ($m) 19.4 43.1 62.5
Household Income ($m) 36.8 81.4 118.2
Direct ($m) 19.7 45.3 65.0
Production-induced ($m) 8.0 15.8 23.8
Consumption-induced ($m) 9.1 20.3 29.4
Employment (total) 452.1 1,253.2 1,705.3
Direct (total) 221.0 770.0 991.0
Production-induced (total) 93.7 176.8 270.5
Consumption-induced (total) 137.3 306.5 443.8
a – Total output for combined sectors may be lower than the sum of output for individual sectors as it excludes transfers between sectors to prevent double counting.
b – Activities combined to maintain confidentiality.

83
Table A1.9 Economic impacts of the Queensland native cypress forest industry, by sector
Combined activity prior to processingb
(growers , forest management, nurseries, silviculture, roading, consulting, training,
equipment sales, harvest and haulage) Primary processing Whole Industry
(excludes transfers)
Outputa ($m) 42.0 40.0 67.2
Direct ($m) 18.8 26.2 30.3
Production-induced ($m) 9.9 5.9 15.8
Consumption-induced ($m) 13.3 7.9 21.2
GRP ($m) 21.1 15.3 36.4
Direct ($m) 9.3 8.2 17.5
Production-induced ($m) 4.5 2.7 7.2
Consumption-induced ($m) 7.3 4.4 11.7
Household Income ($m) 13.9 8.2 22.1
Direct ($m) 7.6 4.6 12.1
Production-induced ($m) 2.9 1.6 4.5
Consumption-induced ($m) 3.4 2.1 5.5
Employment (total) 170.8 234.1 404.9
Direct (total) 85.0 186.0 271.0
Production-induced (total) 33.8 17.1 50.9
Consumption-induced (total) 52.0 31.0 83.0
a – Total output for combined sectors may be lower than the sum of output for individual sectors as it excludes transfers between sectors to prevent double counting.
b – Activities combined to maintain confidentiality.

84
Table A1.10 Economic impacts of the Queensland softwood pine plantation industry, by sector
Combined activity prior to processingb
(growers , forest management, nurseries, silviculture, roading, consulting, training,
equipment sales, harvest and haulage) Primary processing Whole Industry
(excludes transfers)
Outputa ($m) 309.9 918.6 1,052.5
Direct ($m) 174.6 439.4 438.0
Production-induced ($m) 65.4 306.5 371.9
Consumption-induced ($m) 69.9 172.7 242.6
GRP ($m) 128.1 320.0 448.2
Direct ($m) 60.1 85.8 145.9
Production-induced ($m) 29.5 139.7 169.3
Consumption-induced ($m) 38.5 94.6 133.0
Household Income ($m) 74.2 192.7 266.9
Direct ($m) 36.8 63.6 100.4
Production-induced ($m) 19.5 86.2 105.7
Consumption-induced ($m) 17.9 42.9 60.9
Employment (total) 1,164.7 2,649.4 3,814.1
Direct (total) 661.8 1,003.8 1,665.6
Production-induced (total) 230.8 983.8 1,214.6
Consumption-induced (total) 272.1 661.8 934.0
a – Total output for combined sectors may be lower than the sum of output for individual sectors as it excludes transfers between sectors to prevent double counting.
b – Activities combined to maintain confidentiality.

85
Table A1.11 Economic impacts of the Queensland Araucaria plantation industry, by sector
Combined activity prior to processingb
(growers , forest management, nurseries, silviculture, roading, consulting, training,
equipment sales, harvest and haulage) Primary processing Whole Industry
(excludes transfers)
Outputa ($m) 96.4 219.6 267.4
Direct ($m) 53.4 109.8 114.6
Production-induced ($m) 21.2 64.7 85.9
Consumption-induced ($m) 21.8 45.1 66.9
GRP ($m) 39.6 82.9 122.5
Direct ($m) 18.0 28.6 46.6
Production-induced ($m) 9.5 29.6 39.1
Consumption-induced ($m) 12.0 24.8 36.8
Household Income ($m) 23.3 49.2 72.5
Direct ($m) 11.4 19.7 31.1
Production-induced ($m) 6.3 18.1 24.4
Consumption-induced ($m) 5.6 11.4 17.0
Employment (total) 368.0 780.7 1,148.7
Direct (total) 207.9 400.3 608.1
Production-induced (total) 75.2 206.4 281.5
Consumption-induced (total) 85.0 174.1 259.1
a – Total output for combined sectors may be lower than the sum of output for individual sectors as it excludes transfers between sectors to prevent double counting.
b – Activities combined to maintain confidentiality.
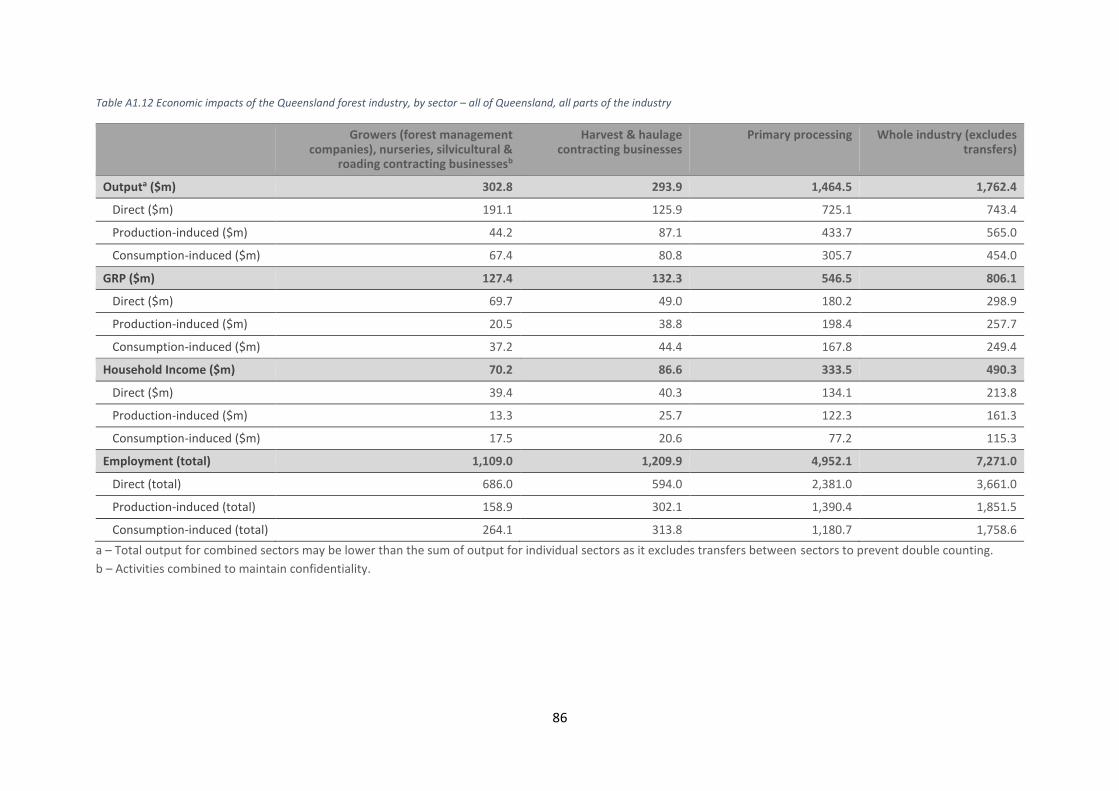
86
Table A1.12 Economic impacts of the Queensland forest industry, by sector – all of Queensland, all parts of the industry
Growers (forest management companies), nurseries, silvicultural &
roading contracting businessesb
Harvest & haulage contracting businesses
Primary processing Whole industry (excludes transfers)
Outputa ($m) 302.8 293.9 1,464.5 1,762.4
Direct ($m) 191.1 125.9 725.1 743.4
Production-induced ($m) 44.2 87.1 433.7 565.0
Consumption-induced ($m) 67.4 80.8 305.7 454.0
GRP ($m) 127.4 132.3 546.5 806.1
Direct ($m) 69.7 49.0 180.2 298.9
Production-induced ($m) 20.5 38.8 198.4 257.7
Consumption-induced ($m) 37.2 44.4 167.8 249.4
Household Income ($m) 70.2 86.6 333.5 490.3
Direct ($m) 39.4 40.3 134.1 213.8
Production-induced ($m) 13.3 25.7 122.3 161.3
Consumption-induced ($m) 17.5 20.6 77.2 115.3
Employment (total) 1,109.0 1,209.9 4,952.1 7,271.0
Direct (total) 686.0 594.0 2,381.0 3,661.0
Production-induced (total) 158.9 302.1 1,390.4 1,851.5
Consumption-induced (total) 264.1 313.8 1,180.7 1,758.6
a – Total output for combined sectors may be lower than the sum of output for individual sectors as it excludes transfers between sectors to prevent double counting.
b – Activities combined to maintain confidentiality.

87
Table A1.13 Proportion of Wide Bay Burnett residents who reported the forest, farming and tourism industries had a NEGATIVE impact on different aspects of community life
All residents
LGAs/towns with HIGH
forest industry dependence
LGAs/towns with LOW
forest industry
dependence
All resident
s
LGAs/towns with HIGH
forest industry
dependence
LGAs/towns with LOW
forest industry
dependence
All resident
s
LGAs/towns with HIGH
forest industry
dependence
LGAs/towns with LOW
forest industry
dependence
Forestry, wood & paper manufacturin
g (n=98)
Forestry, wood & paper
manufacturing (n=56)
Forestry, wood & paper manufacturing
(n=41) Farming
(n=251 Farming (n=114)
Farming (n=137)
Tourism (n=147)
Tourism (n=69)
Tourism (n=77)
Local employment 4% 5% 2% 5% 5% 5% 2% 1% 3%
Cost of living (food, rent) 6% 9% 2% 6% 7% 5% 14% 20% 8%
Friendliness of the local community 5% 9% 0% 3% 4% 2% 4% 7% 1%
Health of local residents 11% 14% 7% 15% 10% 20% 5% 4% 5%
Traffic on local roads 44% 49% 38% 31% 26% 34% 45% 58% 34%
Quality of local roads 55% 56% 52% 37% 34% 38% 39% 44% 34%
Attractiveness of the local landscape 31% 32% 29% 12% 12% 12% 7% 13% 3%
Local water quality 17% 18% 17% 25% 18% 31% 14% 11% 15%
Health of local environment 27% 30% 21% 22% 18% 25% 14% 19% 9%
Bushfire risk 30% 30% 29% 20% 22% 19% 15% 14% 15%
Land prices 15% 13% 19% 14% 16% 13% 12% 17% 7%
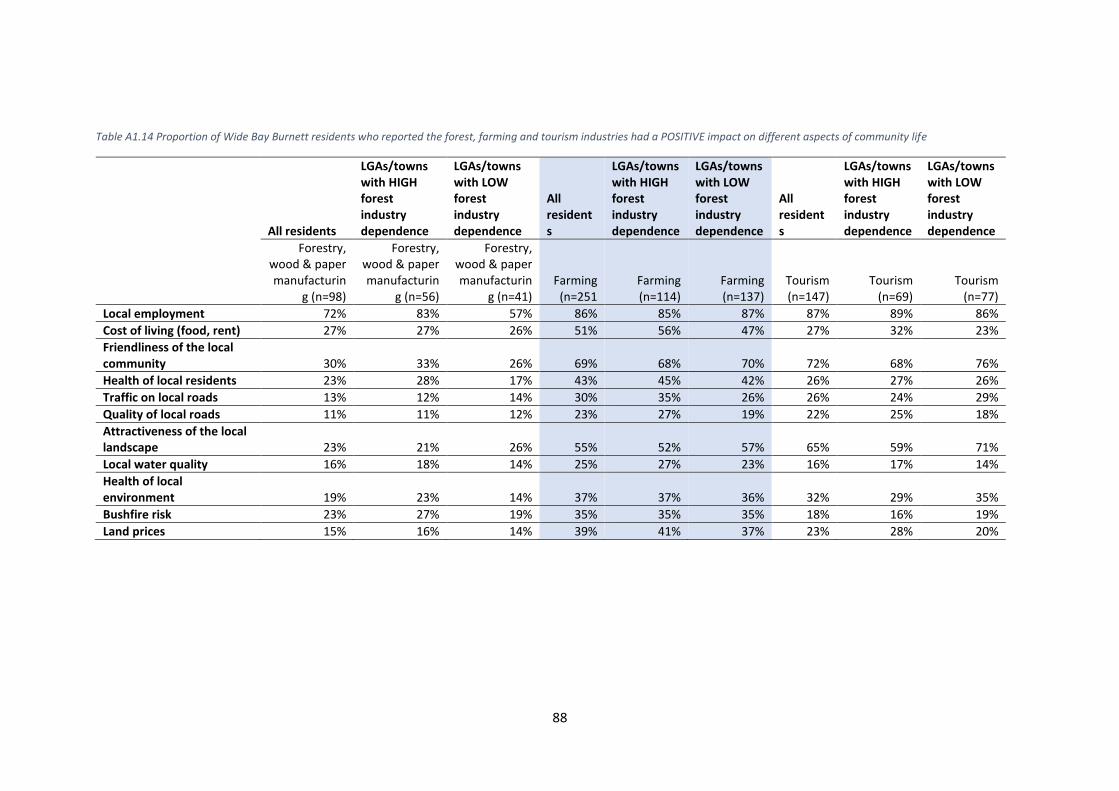
88
Table A1.14 Proportion of Wide Bay Burnett residents who reported the forest, farming and tourism industries had a POSITIVE impact on different aspects of community life
All residents
LGAs/towns with HIGH forest industry dependence
LGAs/towns with LOW forest industry dependence
All residents
LGAs/towns with HIGH forest industry dependence
LGAs/towns with LOW forest industry dependence
All residents
LGAs/towns with HIGH forest industry dependence
LGAs/towns with LOW forest industry dependence
Forestry, wood & paper manufacturin
g (n=98)
Forestry, wood & paper manufacturin
g (n=56)
Forestry, wood & paper manufacturin
g (n=41) Farming
(n=251 Farming (n=114)
Farming (n=137)
Tourism (n=147)
Tourism (n=69)
Tourism (n=77)
Local employment 72% 83% 57% 86% 85% 87% 87% 89% 86%
Cost of living (food, rent) 27% 27% 26% 51% 56% 47% 27% 32% 23%
Friendliness of the local community 30% 33% 26% 69% 68% 70% 72% 68% 76%
Health of local residents 23% 28% 17% 43% 45% 42% 26% 27% 26%
Traffic on local roads 13% 12% 14% 30% 35% 26% 26% 24% 29%
Quality of local roads 11% 11% 12% 23% 27% 19% 22% 25% 18%
Attractiveness of the local landscape 23% 21% 26% 55% 52% 57% 65% 59% 71%
Local water quality 16% 18% 14% 25% 27% 23% 16% 17% 14%
Health of local environment 19% 23% 14% 37% 37% 36% 32% 29% 35%
Bushfire risk 23% 27% 19% 35% 35% 35% 18% 16% 19%
Land prices 15% 16% 14% 39% 41% 37% 23% 28% 20%
89
Appendix 2 Using ABS Census data to identify employment in secondary
processing Data from the ABS Census were used to estimate the number of jobs generated in ‘secondary
processing’, defined as processing in which already processed wood and paper products are further
processed. As described in the main body of this report, primary processing was defined as the jobs
generated at processing plants which take in roundwood products and transform roundwood into
initial wood and paper products. In Queensland, this involved wood processing only, with no paper
processors conducting primary processing. In some cases, sites that take in roundwood further
process initial wood and fibre products into secondary processed products. For simplicity, all the
employment at these sites was counted as ‘primary processing’.
Our definition of primary processing employment is therefore that it is the employment generated
at sites that process wood and fibre products from roundwood. Secondary processing occurs at sites
that take in already processed wood and fibre products and further process these.
When using ABS Census data, a two-step process was used to identify employment in primary
processing versus secondary processing. First, jobs were initially classified into ‘primary’ and
‘secondary’ processing based on the industry categories defined in ANZ-SNZ (2016), as follows:
• Primary processing: The following four-digit ANZSIC categories were considered to be
predominantly composed of primary processing activities:
o Log Sawmilling and Timber Dressing, not further defined
o Log Sawmilling
o Wood Chipping
o Timber Resawing and Dressing
o Reconstituted Wood Product Manufacturing
o Veneer and Plywood Manufacturing
• Secondary processing: The following four-digit ANZSIC categories were considered to be
predominantly composed of secondary processing activities:
o Wood Product Manufacturing, not further defined
o Other Wood Product Manufacturing, not further defined
o Prefabricated Wooden Building Manufacturing
o Wood Structural Fitting and Component Manufacturing
o Other Wood Product Manufacturing not elsewhere classified
o Pulp, Paper and Converted Paper Product Manufacturing, not further defined
o Pulp, Paper and Paperboard Manufacturing.
o Converted Paper Product Manufacturing, not further defined
o Corrugated Paperboard and Paperboard Container Manufacturing
o Paper Bag Manufacturing
o Paper Stationery Manufacturing
o Sanitary Paper Product Manufacturing
o Other Converted Paper Product Manufacturing.
In Queensland, all paper product manufacturing was considered to be secondary processing, as no
paper manufacturers manufacture pulp from roundwood or woodchips harvested in Queensland.

90
However, there are cases in which either (i) Census data are mis-classified, with workers at a given
facility classified into an incorrect industry category, or in which (ii) while correctly classified
according to the industry definitions used by the ABS, a wood or paper processing facility classified
as primary processing does not utilise roundwood as an input and is in fact a secondary processor.
Therefore, the second step in analysis was to compare known data from our industry survey to ABS
data, and identify areas in which data did not match. Where there was a mismatch, the businesses
involved were then identified and contacted to confirm whether or not they were a primary
processor or secondary processor. If it was identified that a business had been mis-classified into
primary versus secondary processing, Census data were adjusted accordingly.
Based on this process, the following adjustments were made when classifying ‘primary’ versus
‘secondary’ processing employment in different local government areas using ABS Census data. Note
that none of these adjustments involved any change in the total amount of employment generated
in the region from wood and paper product manufacturing; it simply changed the number of jobs
classified as being dependent on primary versus secondary processing.
• Cairns: A small number of workers (5) were mis-classified as working in reconstituted wood
product manufacturing; these were re-classified as secondary processing workers.
• Townsville: A small number of workers (5) were mis-classified as working in veneer or
reconstituted wood product manufacturing; these were re-classified as secondary
processing workers.
• Brisbane: A number of workers (70) were mis-classified as working in veneer or
reconstituted wood product manufacturing, or were classified into ‘wood and paper product
manufacturing not further defined’; these were re-classified as secondary processing
workers.
• Gold Coast: A number of workers (41) were mis-classified as working in veneer or
reconstituted wood product manufacturing, or as being engaged in timber resawing and
dressing; these were re-classified as secondary processing workers.
• Logan: A number of workers (49) were mis-classified as working in veneer or reconstituted
wood product manufacturing, or were classified into ‘wood and paper product
manufacturing not further defined’; these were re-classified as secondary processing
workers.
• Moreton Bay: A small number of workers (7) were classified as working in ‘wood and paper
product manufacturing not further defined’; these were re-classified as secondary
processing workers.
• Noosa: A small number of workers (11) were mis-classified as working in reconstituted wood
product manufacturing, or as being engaged in unspecified log sawmilling activities; these
were re-classified as secondary processing workers.
• Scenic Rim: A small number of workers (7) were mis-classified as working in veneer or
reconstituted wood product manufacturing; these were re-classified as secondary
processing workers.
• Sunshine Coast: A number of workers (44) were mis-classified as working in veneer
manufacturing, reconstituted wood product manufacturing, or as being engaged in log
sawmilling or timber dressing; these were re-classified as secondary processing workers.
91
• Fraser Coast: A small number of workers (13) were classified as working in ‘wood and paper
product manufacturing not further defined’; these were re-classified as secondary
processing workers.
• Gympie: A small number of workers (13) were classified as working in ‘wood and paper
product manufacturing not further defined’; these were re-classified as secondary
processing workers.
These changes enabled a more robust assessment of primary and secondary processing
employment, and the extent to which employment depends on availability of roundwood versus
availability of primary processed products as inputs.
ABS Census data used in this report have been randomised. This means that numbers have been
randomly adjusted by small amounts when produced by the ABS TableBuilderPro product. Because
of this randomisation, the ABS Census data we present will vary by small amounts (usually less than
10 workers in any given region) from other analyses.
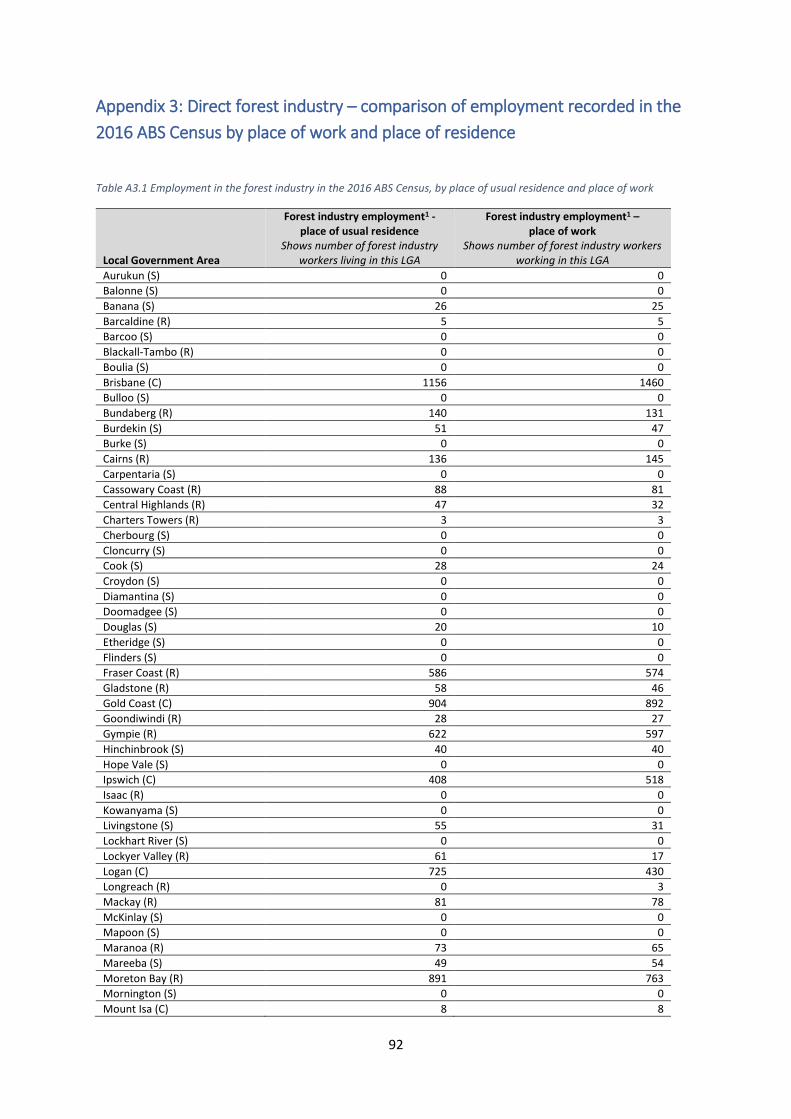
92
Appendix 3: Direct forest industry – comparison of employment recorded in the
2016 ABS Census by place of work and place of residence
Table A3.1 Employment in the forest industry in the 2016 ABS Census, by place of usual residence and place of work
Local Government Area
Forest industry employment1 - place of usual residence
Shows number of forest industry workers living in this LGA
Forest industry employment1 – place of work
Shows number of forest industry workers working in this LGA
Aurukun (S) 0 0
Balonne (S) 0 0
Banana (S) 26 25
Barcaldine (R) 5 5
Barcoo (S) 0 0
Blackall-Tambo (R) 0 0
Boulia (S) 0 0
Brisbane (C) 1156 1460
Bulloo (S) 0 0
Bundaberg (R) 140 131
Burdekin (S) 51 47
Burke (S) 0 0
Cairns (R) 136 145
Carpentaria (S) 0 0
Cassowary Coast (R) 88 81
Central Highlands (R) 47 32
Charters Towers (R) 3 3
Cherbourg (S) 0 0
Cloncurry (S) 0 0
Cook (S) 28 24
Croydon (S) 0 0
Diamantina (S) 0 0
Doomadgee (S) 0 0
Douglas (S) 20 10
Etheridge (S) 0 0
Flinders (S) 0 0
Fraser Coast (R) 586 574
Gladstone (R) 58 46
Gold Coast (C) 904 892
Goondiwindi (R) 28 27
Gympie (R) 622 597
Hinchinbrook (S) 40 40
Hope Vale (S) 0 0
Ipswich (C) 408 518
Isaac (R) 0 0
Kowanyama (S) 0 0
Livingstone (S) 55 31
Lockhart River (S) 0 0
Lockyer Valley (R) 61 17
Logan (C) 725 430
Longreach (R) 0 3
Mackay (R) 81 78
McKinlay (S) 0 0
Mapoon (S) 0 0
Maranoa (R) 73 65
Mareeba (S) 49 54
Moreton Bay (R) 891 763
Mornington (S) 0 0
Mount Isa (C) 8 8

93
Local Government Area
Forest industry employment1 - place of usual residence
Shows number of forest industry workers living in this LGA
Forest industry employment1 – place of work
Shows number of forest industry workers working in this LGA
Murweh (S) 3 0
Napranum (S) 0 5
Noosa (S) 77 69
North Burnett (R) 86 82
Northern Peninsula Area (R) 0 0
Palm Island (S) 0 0
Paroo (S) 0 0
Pormpuraaw (S) 0 0
Quilpie (S) 0 0
Redland (C) 267 167
Richmond (S) 0 3
Rockhampton (R) 42 56
Scenic Rim (R) 77 42
Somerset (R) 70 55
South Burnett (R) 173 158
Southern Downs (R) 55 53
Sunshine Coast (R) 598 570
Tablelands (R) 77 67
Toowoomba (R) 248 255
Torres (S) 0 0
Torres Strait Island (R) 0 0
Townsville (C) 167 166
Weipa (T) 0 0
Western Downs (R) 70 65
Whitsunday (R) 34 33
Winton (S) 0 0
Woorabinda (S) 0 0
Wujal Wujal (S) 0 0
Yarrabah (S) 4 4
No usual address (Qld) 0 355
Migratory - Offshore - Shipping (Qld)
0 0
Total 8452 8443 1Forest industry employment is defined as the sum of employment in the Australia New Zealand Standard Industry
Classification categories of (i) Forestry and logging (2 digit), (ii) Forestry support services (2 digit), (iii) Wood product manufacturing (2 digit), (iv) Pulp, paper and converted paper product manufacturing (2 digit)