socioeconomic impact assessment of rural...
TRANSCRIPT

March 28, 2002 First Draft
SOCIOECONOMIC IMPACT ASSESSMENT OF RURAL ROADS:
METHODOLOGY AND QUESTIONNAIRES
This work was commissioned by the Roads and Rural Transport TG and the Transport Economics and Poverty TG. This document was drafted by Christiaan Grootaert, under the guidance of Christina Malmberg Calvo. Assistance was received from Santhadevi Meenakshy. We are grateful for helpful comments and contributions from Anil Bhandari, Colin Gannon, Kenneth Gwilliam, Jose Luis Irigoyen, Jerry Lebo, Hernan Levy, Zhi Liu, Aurelio Menendez, Jyotsna Puri, Dieter Schelling, Dominique van de Walle, and Piers Vickers.

ii
Table of Contents
1. OBJECTIVES AND TERMS OF REFERENCE .................................................. 1
SCOPE OF THE IMPACT ASSESSMENT TOOL ...................................................................... 3 MODULAR APPROACH...................................................................................................... 5 COSTS .............................................................................................................................. 6 OUTLINE .......................................................................................................................... 9
2. CONCEPTUAL FRAMEWORK: UNDERSTANDING THE IMPACT OF RURAL TRANSPORT INVESTMENTS....................................................................... 9
3. PRINCIPLES AND METHODS FOR ASSESSING IMPACTS ....................... 20
EXPERIMENTAL AND QUASI-EXPERIMENTAL DESIGNS .................................................. 20 SELECTION BIAS ............................................................................................................ 25 BEST-PRACTICE APPROACH ........................................................................................... 27 LINKS WITH THE PROJECT CYCLE .................................................................................. 31 DATA COLLECTION ISSUES ............................................................................................ 35
4. CONTENT OF DATA COLLECTION AND QUESTIONNAIRES ................. 37
5. ANALYTIC ISSUES .............................................................................................. 56
THE DOUBLE-DIFFERENCES METHOD............................................................................ 56 PROPENSITY SCORE MATCHING..................................................................................... 61 INSTRUMENTAL VARIABLES ........................................................................................... 64
REFERENCES................................................................................................................ 66
ANNEX: QUESTIONNAIRE MODULES .................................................................. 69
iii
List of Tables, Figures, and Boxes TABLE 1: SUMMARY OF ESTIMATED COSTS FROM SEVERAL WORLD BANK IMPACT EVALUATIONS.......................................................................................................................7 BOX 1: RURAL TRANSPORT INTERVENTIONS AND POVERTY REDUCTION..........................11 BOX 2: OVERVIEW OF INDICATORS FOR SOCIOECONOMIC IMPACT ASSESSMENT OF RURAL ROADS ....................................................................................................................18 BOX 3: SUMMARY OF QUANTITATIVE METHODS FOR EVALUATING PROJECT IMPACT ......22 BOX 4: MAIN STEPS IN DESIGNING AND IMPLEMENTING IMPACT EVALUATIONS...............31 BOX 5: SELECTED SOCIOECONOMIC IMPACT STUDIES OF RURAL ROADS ..........................36 BOX 6: ISSUES IN QUESTIONNAIRE DESIGN ........................................................................54 BOX 7: SUMMARY OF STEPS IN TAKING DOUBLE DIFFERENCES ........................................58 BOX 8: STEPS IN PROPENSITY SCORE MATCHING..............................................................62

1
1. OBJECTIVES AND TERMS OF REFERENCE
The transport sector has a long tradition of justifying its projects on the basis of
efficiency considerations, evaluating alternative investments on the basis of cost-benefit
data. For road transport investments, the main economic benefits consist of savings in
vehicle operating costs (such as fuel costs, vehicle maintenance), time savings, and a
reduced risk of accidents. These benefits accrue to road users, in particular operators of
vehicles, and apply to motorized as well as non-motorized transport. Operators of
commercial vehicles may or may not pass on these cost reductions to passengers and
shippers. Vehicle operators, as well as consumers, may or may not be local residents, so
that the benefits could be spread out over a large geographic area. Recently, in part
fueled by the Bank’s sharpened focus on poverty reduction and the World Development
Report 2000/2001: Attacking Poverty, interest has emerged in the distributional impact
of transport projects and especially the impact on poor groups.
In addition to economic evaluation, attempts have been made to measure the
social and economic impacts of rural roads using various approaches. Most efforts have
been ad hoc and few have been sufficiently well-designed to be able to isolate the social
and economic impacts attributable to roads.1 A recent study found that only a small
percentage of Bank infrastructure projects include formal impact evaluation studies. In
1 The most common criticisms of past impact evaluations of roads are that they lacked appropriate control zones, that results did not take into account unobserved factors influencing both project placement and outcomes, and that the evaluations did not follow the projects long enough to capture full impacts (van de Walle, 1999, 2001).

2
FY98, only 1.5% of infrastructure projects (0.8% of lending) had included in project
design all requisite elements for sound impact evaluation, although 33% of the
infrastructure portfolio (42% of lending) had the potential for incorporating sound
evaluation (Subbarao et al, 1999).2 Between FY98 and FY00, the evaluation
performance of the infrastructure sector declined: the fraction of projects with either
sound evaluation or potential for it fell from 34% to 24% (in lending terms the decline
was from 43% to 27%) (Ezemenari et al, 2000).3
Project impact consists of direct or first round effects, and indirect or second
round effects. Direct effects are registered in the impact zone by reduced travel time to
work, schools, hospitals, markets, etc. and savings in fuel and other direct transport costs.
Road improvements may also reduce seasonal or other weather-related road closures.
Although there is a tendency to perceive these direct effects as local, they may in fact be
regional, national, or even international. For example, the benefits of a rural road may
accrue to local farmers, urban residents, domestic producers, or foreign tourists. The
composition and distribution of the direct effects depends on the composition of users
and the structure of the transport market.
The indirect effects consist of increases in income and other dimensions of well-
being (health, education, social interaction and political participation) brought about by
2 This contrasts with 5.4% of all FY98 Bank projects (6.2% of lending) which included in project design all necessary elements for sound evaluation. An additional 32% of projects (33% of lending) had potential for incorporating sound evaluation. 3 During the same period, the fraction of all Bank projects with sound evaluation or potential for it increased slightly from 37.1% to 38.8% (from 39.2% to 43.0% of lending).

3
the infrastructure. The roads may increase job opportunities and open up new sources of
revenue, leading to a more diversified income structure, which can reduce household
vulnerability to economic shocks.
The objective of socioeconomic impact analysis is to assess the magnitude and
distribution of both direct and indirect effects. Past efforts at assessing the impact of
infrastructure projects have typically been limited due to the lack of available baseline
and control data. This has made it difficult to disentangle the effects from the
infrastructure project from those of other interventions and the overall development of the
economy. The aim of the current paper is therefore to help task managers and clients
develop rigorous data collection and analytic methods which can form the basis for
systematic impact assessment of road projects. The principles and tools proposed here
must be seen as flexible templates, a guide to options to be developed for specific country
contexts. Yet, adherence to a given methodology in individual efforts will make it easier
to develop general lessons applicable across countries.
Scope of the Impact Assessment Tool
Since road transport investments consist of a wide variety of types of
infrastructure, ranging from large cross-national highways to local roads and paths, one
and the same methodology cannot be developed for assessing all types of projects. The
main reasons are that the ratio of direct to indirect benefits differs widely, as does the
geographical size of the impact region. For example, large roads serve a wide and

4
usually disparate group of users. They generate much of their benefits through indirect
economy-wide repercussions and hence economy-wide modeling is needed to fully
capture these benefits. With local roads, the fraction of direct benefits is expected to be
larger and spillovers outside the project zone may be less important.
In light of this, the decision has been made to develop an impact assessment tool
initially for local rural transport projects only. Such projects build or improve local roads
(with low motorized traffic volumes, typically no more than 25 to 50 vehicles per day),
paths and tracks, and non-motorized transport. Current experience has not made clear
whether such projects affect poverty reduction mostly through direct or indirect effects,
and the proposed tool aims to set in motion a research strategy to begin disentangling
these effects within the confines of a given zone of influence.
The zone of influence of a rural road can be defined in different ways, depending
upon the local situation of how project roads are connected to the existing network. It is
not part of this activity to develop a standard methodology for defining a zone of
influence appropriate for every situation. The view is that this cannot in fact be done
because the appropriate definition needs to consider a combination of many factors
relating to the characteristics of the road itself and the characteristics of the population
around it (e.g. population density, spatial dispersion of the population, type of economic
activity, etc.).4 Rather, we wish to ensure that the impact assessment tool is compatible
with different definitions of zone of influence. It needs to be appreciated, however, that
4 In this context it is surprising to note the dearth of discussion on methodologies for determining the zone of influence in the literature on rural roads.
5
the adaptation of the impact assessment tool to specific situations and the definition of a
zone of influence are interdependent because both are a function of the characteristics of
the road and the surrounding area.
Modular Approach
The proposed impact assessment tool consists of two modules. The first module
captures the direct impact on transportation variables (transportation costs and times,
accessibility, etc.) and social variables (access to markets, health and education facilities,
etc.). The data from this module make it possible to assess the distribution of direct
effects over different socioeconomic groups.5
The second module captures the indirect welfare enhancing effects with a focus
on improvements in households income. Indirect effects derive from the ability of
households in the project influence zone to operate household enterprises more
profitably, from better access to jobs due to better mobility, etc. Indirect effects may also
include improved health and education status, and increased social interaction and
political participation.
The first module can be applied without the second one, but the second module is
only meaningful in conjunction with the first. This is the case for two reasons. First, it is
generally not meaningful to study indirect effects without any knowledge about direct
5 The data from the first module do not make possible the assessment of the distribution of direct effects over income or expenditure groups, because the module does not collect income or expenditure data.
6
effects. Second, the questionnaire design is such that all basic socioeconomic
information about communities and households are captured in the first module (see
annex). Hence, the system is modular in the sense that it can be applied to capture and
monitor direct effects only, or both direct and indirect effects.
The proposed impact assessment tool relies primarily on survey-based data
collection and quantitative analysis of these data. An important feature is to provide
results that are representative of the project influence zone. This does not mean, of
course, that there is no place for participatory or qualitative assessment methods. Such
methods are well-developed and can be combined with a survey-based system as needed
(see e.g. World Bank, 1996a; Carvalho and White, 1997; Salmen, 1995a, 1995b).
Costs
The cost of applying the impact assessment tool depends largely on labor and
transport costs in a given country and the scope of needed data collection. A study of
eight non-road project impact evaluations found that the overall costs ranged from
$238,000 to $878,000 (Table 1). The most expensive component of these evaluations
were the data collection, which ranged from $85,000 to $607,000 (Baker, 2000).

7
Table 1: Summary of Estimated Costs from Several World Bank
Impact Evaluations
Breakdown of Evaluation Costs (%) Project Estimated cost of
evaluation ($)a
Cost as % of total
project costb
Cost as % of IBRD loan or IDA
creditb
Travelc World Bank staff
Consultants Data collection
Data collection
costs ($)
Nicaragua School-Based Management
495,000 1.26 1.5 8.1 18.1 39.0 34.8 172,000
El Salvador School-Based Management
443,000 0.60 1.3 7.7 7.4 25.8 59.2 262,000
Colombia Voucher Program
266,000 0.20 0.3 9.4 9.8 21.8 59.0 157,000
Honduras Social Fund
263,000 0.23 0.9 3.0 11.5 53.2 32.3 85,000
Nicaragua Social Fund
449,000 0.30 0.8 4.9 33.0 7.8 55.7 250,000
Bolivia Social Fund
878,000 0.50 1.4 3.4 14.6 12.9 69.1 607,000
Trinidad and Tobago Youth Training
238,000 0.80 1.2 7.6 11.5 17.9 63.1 150,000
Average 433,000 0.56 1.0 6.3 15.1 25.5 53.3 231,000 a. This cost does not include the cost of local counterpart teams not financed from the loan or credit. The figures
refer to the time period under which the projects in the evaluation sample were selected, not total financing ever provided by the Bank and others to those institutions.
b. These costs as a percentage of the loan or credit or of the project are presented as a reference only. In many cases the actual financing for the evaluation was obtained from sources outside of the project financing.
c. The travel cost estimates include mission travel for World Bank staff and international consultants to the client countries, as well as travel from client country counterparts, particularly to participate in strategy sessions and analytical workshops with international consultants and World Bank staff.
Source: Baker (2000). An example of an inexpensive program evaluation was that of the vocational
skills training program in Trinidad and Tobago, which took advantage of a national
income and employment survey to oversample program graduates and create a
comparison group from a subset of the national sample. Data collection was limited to a
sample of 2,500 people and consisted of only one short questionnaire administered to
8
program graduates. Furthermore, Trinidad and Tobago is a small country where all
communities have good access by road, which kept transport costs for the survey teams
low. Total data collection costs were $150,000. In contrast, the impact assessment of the
Bolivia Social Fund was very expensive because there were no national surveys
available. The entire data collection had to be undertaken for the purposes of the
evaluation. The sample consisted of 7,000 households, which were interviewed in 1993
for the baseline and in 1998 for the follow-up survey. Eight questionnaires were used:
two household questionnaires, a community questionnaire, four health center
questionnaires, and a school questionna ire. These were supplemented with special
modules, such as water quality tests, scholastic achievement tests, and questionnaires for
key informants. As a result, total data collection costs exceeded $600,000. It seems
likely that the data collection needed for a typical rural roads project would fall
somewhere in-between those two extremes.
The proposed impact tool has been designed so that the cost for a baseline survey
of both modules would fall in the $100,000 to $150,000 range in a country with average
labor and transport costs. This assumes a survey coverage of 100-150 villages and
2,000-3,000 households. A full impact assessment, i.e., with both baseline and post-
project data collection would thus cost $200,000 to $300,000. This is in line with
expenditures for past impact assessments. Data collection for the currently ongoing
impact study of rural roads in Viet Nam was budgeted at $202,500 for two rounds of data
collection (van de Walle, 1999). This study collected data in 200 communes, and
surveyed 15 households per commune (van de Walle and Cratty, 2002).

9
Outline
The remainder of this paper is structured as follows: in the next section we
present a conceptual framework for understanding the impact of rural transport projects.
Section three discusses basic methodological principles for impact assessment as they are
relevant in the case of rural roads. Section four presents the key variables needed to
assess direct and indirect impacts. Section five discusses selected analytic issues. The
questionnaires that make up the impact assessment tool are presented in annexes.
2. CONCEPTUAL FRAMEWORK: UNDERSTANDING THE IMPACT OF RURAL
TRANSPORT INVESTMENTS6
Infrastructure investments contribute to economic growth and to raising the
quality of life. They contribute to economic growth by reducing the cost of production,
by making possible the diversification of the economy, and by making other factors of
production more productive. There is significant empirical evidence at the
macroeconomic level of a positive correlation between infrastructure networks, including
roads, and GDP per capita or growth rates. Quality of life is improved by creating
amenities in the physical environment and by providing outputs, such as transportation
and communication, which are valued in their own right.
6 This section draws upon Kessides, 1993; Gannon and Liu, 1997; Gannon et al, 2001.

10
At the household level, rural roads can lead to increases in agricultural production
and open up alternative non-farm employment, resulting in both higher overall earnings
and more diversified sources of income.7 Roads reduce the transaction costs of looking
for employment and thus contribute to making labor markets more efficient. Roads may
also contribute directly to household wealth by having a positive impact on real estate
values.
Transportation has the potential to bestow important consumption benefits by
virtue of the increased personal mobility and communication it makes possible. It can
also be a means to acquiring other goods and services, by improving access to education
and health facilities and to markets. The absence of roads in rural areas frequently
necessitates the practice of “headloading” of firewood, water and crops. The
establishment of roads can reduce this burden and free up time to engage in more
productive income-earning activities. To the extent that women are often responsible for
these transport duties, rural roads can be expected to free up their time for employment
opportunities and improved child care.
The short and long term distributive impacts of transport projects, particularly on
low income groups, are not well understood. In poor rural areas, lack of adequate and
reliable transport can penalize households pursuing cash crop farming and reduce non-
farm employment opportunities and access to social services. It is thus argued that rural
7 Although we will mainly use the terms “rural roads”, the proposed impact tool can be used to evaluate the impact of rural transport infrastructure in general. This concept includes the lowest levels of the designated network for which government is responsible (tertiary, district, and feeder roads) and the undesignated network of village access roads, tracks, paths and foot bridges over which local residents travel (Gannon et al, 2001).

11
roads contribute to poverty reduction by removing major constraints faced by the poor in
accessing jobs, markets, and services (Box 1).
Box 1: Rural Transport Interventions and Poverty Reduction
The situation of poor people in rural areas prior to the construction or improvement of roads is frequently characterized by the following factors:
• Poor communities are isolated for significant portions of the year as they lack reliable all-season road access.
• The majority of journeys are short, numerous and time consuming. They typically occur for production or subsistence needs, such as collecting water and fuel, crop production, harvesting and processing.
• Longer journeys are infrequent even though they may well be essential to livelihood strategies. Such journeys include visits to hospitals and clinics, marketing of produce, or searching for jobs.
• Poor people do not own motorized vehicles and can rarely secure access to them. Walking and non-motorized transport (headloading and bicycles) predominates.
• The transport burden for many domestic tasks tends to fall disproportionately on women, and social rules and customs often limit their access to available means of transport .
These factors act as constraints to improving monetary and non-monetary dimensions of well-being and thus to poverty reduction. Rural transport interventions are meant to alleviate each of these constraints. Source: Gannon et al, 2001. Transport is an intermediate service. Road improvement has the potential to
enhance household welfare not through increased consumption of transport services per
se, but through improving the quality and security of access to work, markets and

12
services and through release of scarce household resources for consumption and
production. Tracing the welfare impact of transport intervention is thus rather complex.
The disentanglement of the impact of road construction or improvement, in fact of
any transport infrastructure and services, is made more difficult because transport access
is a complimentary service to the availability of other basic services, such as health care
and education. Thus, while the construction of a road can make it possible that the poor
travel easier to a health facility, national health policy will be responsible for ensuring
that the facility is adequately staffed and provided with medicines. The process through
which the benefits of transport investments lead to improvements in the standard of living
of households involves many links.

13

14
Investment in the transport sector can improve access to economic opportunities
by reducing transport costs. If markets are reasonably competitive, this can result in
lower prices for freight and passenger services. This in turn can lead to lower prices for
product and consumer goods, a spatial extension of the market for production and
consumption goods, higher personal mobility, and a general higher level of
socioeconomic activities.
Local farmers can benefit from roads because the cost of shipping agricultural
products to markets is reduced and the distance to break-even locations is extended. This
might lead to expanding the area of land under cultivation and increasing the production
of cash crops. Transport improvements can further reduce production costs by lowering
the delivered price of inputs, including equipment and information (for example, through
better agricultural extension service). The ultimate effect to the farmer is increased net
farm gate prices and increased farm income, although the extent to which this happens
depends on the competitiveness of the transport service market. All-year and all-weather
passability of the road not only increases income from farming activities, but also makes
it more stable and thus enables the poor to improve their management of risk. Several of
these effects have been noted in impact studies of rural roads in Brazil, Morocco, Peru
and Tanzania (see Section 4).

15
Roads also make possible income diversification beyond farming activities, by
stimulating the non-farm economy and creating demand for non-farm services. Often
this will be manifested through an increase in the number and type of non-farm
household enterprises. Better transport may also improve the scope of job opportunities
available to rural residents, by allowing them to look for jobs beyond their immediate
settlement areas and take advantage, for example, of seasonal work in further away rural
areas or cities.
Social effects can include increased enrollment of children in schools, due to
better access and improved school quality. It has been argued that better qualified
teachers are willing to work in areas served by roads. Access to other social services
often improves as well, particularly health services. Social capital effects are possible to
the extent that the road makes it easier to maintain networks of contacts, which can be a
source of help in time of need.
Two possible gender effects need to be highlighted. Where rural roads improve
access to schools, often the enrollment rate for girls, which was typically lower than that
for boys before the project, increases more than for boys. This was observed in the
evaluation of a rural roads project in Morocco (see Section 4). Also, the construction of
roads generates employment. Surveys in Botswana, Kenya, Lesotho, Madagascar, and
Tanzania have indicated that women are eager to participate in road work opportunities.

16
Finally, it should be pointed out that rural transport interventions do not solely
have positive effects. Inappropriately designed projects can harm residents, especially
the poor. The negative impacts that have been observed in a number of countries include
involuntary resettlement, increased traffic accidents, environmental effects such as
deforestation and erosion, and the spread of HIV/AIDS. The impact assessment of rural
roads should capture not only the benefits but these potential negative consequences as
well.8
In summary, using the framework of the World Development Report 2000/2001,
rural roads can contribute to creating opportunity, facilitating empowerment, and
enhancing security.
• Opportunity: better access to markets creates economic opportunities for poor
people to sell their labor and products. Better transport infrastructure and
services facilitate access to schools and health clinics.
• Empowerment: the presence of roads can empower the poor by facilitating
their access to information and their political and social participation, by
making it easier to hold public consultations in poor communities and making
it possible for constituents to get to meeting places and town centers. Better
8 The scope of the impact tool proposed here excludes environmental impacts. The reason for the exclusion is that the type of data collection needed to assess environmental impact is very different from that needed to assess socioeconomic impact. It typically requires specialized collection of air and water samples, or aerial surveys of forests, which are subject to different sampling rules than data collection at the household and community level. Furthermore, measuring air and water pollution is not tied as strictly to the concepts of treatment and control zones as measuring socioeconomic impacts.

17
access to government officials may serve the same objective. If roads are
designed and implemented with local community involvement, the process
may strengthen community capacity overall.
• Security: a reliable road system can enhance security by making it possible to
respond better to economic and natural shocks. At the micro level access to
transport facilitates job search and can contribute to easier diversification of
income, thus reducing vulnerability of households to external shocks. Roads
can also improve access to health care facilities, thus making it easier to
respond to medical emergencies.
Although not all effects will occur everywhere, the foregoing discussion makes it
clear that a socioeconomic impact assessment of rural roads needs to cover an
exceptionally large array of issues, and that a commensurately large set of variables needs
to be collected (see Section 4). To help organize this information, the relevant indicators
can be put in three categories:
• Transport project outputs, such as vehicle operating costs, duration and fares
of transport, frequency of trips, accessibility of roads.
• Transport project outcomes, such as access to jobs, markets, health and
education facilities.

18
• Welfare or living standards outcomes, such as incomes, literacy, health status.
The first two categories measure the direct effects of the road, the third category
measures the indirect effect (Box 2).

19
Box 2: Overview of Indicators for Socioeconomic Impact Assessment of
Rural Roads 1. Direct Effects 1A. Transport Project Output Indicators
• Traffic density (vehicles per day, frequency of bus service) • Road passability (number of days of road closure) • Fares and costs (passenger and freight transport fares) • Transport patterns (number of trips, duration, mode of transport to selected
destinations, by age and gender) • Vehicle ownership (motorized and non-motorized vehicles owned) • Accidents (injuries and fatalities, by age and gender)
1B. Transport Project Outcome Indicators
• Access to education (school enrollment and drop-out, by gender) • Quality of education (absenteeism of teachers, availability of school supplies) • Access to health facilities (number of visits, by age and gender) • Quality of health facilities (qualifications of staff, availability of medical supplies) • Access to markets (frequency of visits by age and gender, products sold and bought) • Prices (prices of key commodities, agricultural inputs, land) • Time use of household members (time spent on fuelwood collection and other
transport tasks, by age and gender) • Other (access to credit, migration patterns)
2. Indirect Effects: Welfare Outcome Indicators
• Impact on agricultural activities (crop mix, use of inputs, visits of extension agents) • Impact on non-agricultural activities (activity mix, off-farm employment) • Income structure (type of income sources) • Composition of expenditure (share of food, transportation) • Health status (incidence of illness, number of work days lost due to illness, by age
and gender) • Education status (literacy, average years of education, by age and gender) • Social interaction (number of visits to other villages and cities, participation at social
events, by age and gender) • Political participation (number of visits by government officials, participation in
community or political events, by age and gender)

20
3. PRINCIPLES AND METHODS FOR ASSESSING IMPACTS9
The objective of impact evaluation is to determine what the results are of a
specific intervention on a predetermined set of indicators.10 This necessitates answering
a counter- factual question, namely, what would have happened in the absence of the
intervention? In fact, this is the hallmark of impact assessment which distinguishes it
from monitoring. Monitoring is concerned with tracking the progress of implementation
of a project to ensure that agreed targets are met. Impact assessment seeks to determine
causality. It is concerned with the net impact of an intervention, attributable only and
exclusively to that intervention.
Experimental and Quasi-Experimental Designs
Answering the counter- factual question requires identifying comparison or control
groups (groups who do not receive an intervention) and comparing them with the
treatment group (the group who receives the intervention). Control groups must have the
same relevant characteristics as those receiving the intervention. In the ideal world, the
intervention would be the only difference between the control and the treatment group.11
9 This section draws from Ezemenari et al (1999), Baker (2000), Prennushi et al (2001), and Ravallion (2001). 10 Project impact evaluation is distinct from cost-benefit or cost-effectiveness analysis. The objective of the latter is to compare alternative interventions on the basis of costs and benefits or on the basis of differential costs to produce a given result. This type of analysis provides useful information on program efficiency and should thus be seen as complementary to the analysis of impact evaluation. Cost-benefit and cost-effectiveness analysis are discussed at length in Handbook on Economic Analysis of Investment Operations (World Bank, 1996b). See also the discussion in van de Walle (2001). 11 Sometimes the term “control group” is limited to a comparison group which is selected randomly from the same population as the program participants (Baker, 2000).
21
Determining the counter-factual can be achieved through experimental or quasi-
experimental designs. In experimental designs, the intervention is allocated randomly
among all eligible beneficiaries. The randomness of the assignment assures that
treatment and control groups are statistically equivalent and comparable to one another,
and different only in the receipt of the intervention. This method assures that the
comparison is free from selection bias which typically affects impact evaluations.
Selection bias refers to the fact that individuals receiving the intervention may
have specific characteristics which affect the outcome of the intervention. If this is the
case, a simple comparison of treatment and control groups will not reveal the net effect of
the intervention. Although randomization effectively resolves this problem, in practice,
this method is rarely used because it can create ethical or political problems to exclude
otherwise eligible beneficiaries from the intervention. In the case of rural roads
construction or improvement, random allocation will only rarely be feasible. It would
require that a fairly large number of potential project areas be identified so that there are
sufficient observation points in both the treatment and control group. A random process
could then be utilized to select the zones where the construction or improvement would
take place. Such a method might be practically possible if a road project is intended to be
implemented in two phases. The selection of first phase areas could be done randomly,
thus creating a natural experiment to assess the impact of the road. All control areas then
receive the intervention in the second phase. This might avoid the ethical or political
problems created by excluding beneficiaries.

22
Experimental designs need to be set up prior to the intervention. This is an
important difference with quasi-experimental designs which attempt to generate control
groups after the intervention by means of statistical and econometric methods, such as
propensity score matching, computing double differences, or using instrumental variables
(Box 3).12
12 Other approaches include reflexive comparisons, generic comparisons, and shadow comparisons. In reflexive comparisons, the participants themselves provide the control information by comparing themselves before and after receiving the intervention. With generic comparisons, the impact of the intervention on beneficiaries is compared with established norms about typical changes occurring in the target population. Shadow comparisons consist of the judgment of experts, program administrators and/or selected participants on what is ordinarily to be expected for the target population as compared to actual outcomes.

23
Box 3: Summary of Quantitative Methods for Evaluating Project Impact
The main methods for evaluating the impact of rural roads are discussed below. All methods require the prior selection of the unit of analysis: this can be the community (in which case there can be multiple communities on a single road) or a larger area, such as county or district in which the road is located. We use the term “area” to refer to either situation. Experimental or Randomized Control Designs
• Randomization, in which the selection into the treatment and control areas is random. Then there should be no difference on average between the two areas besides the fact that the treatment area got the road project.
Nonexperimental or Quasi-Experimental Designs
• Matching methods or constructed controls, in which one tries to pick an ideal comparison that matches the treatment area from a larger survey of communities or areas. The most widely used type of matching is propensity score matching, in which the comparison area is matched to the treatment area on the basis of a set of observed characteristics or by using the “propensity score” (predicted probability that an area will get a road given its observed characteristics); the closer the propensity score, the better the match. A good comparison area has the same economic environment and was administered the same survey by similarly trained interviewers as the treatment area.
• Double difference or difference-in-differences methods, in which one compares a
treatment and comparison area (first difference) before and after the road project (second difference). Comparators should be dropped if they have propensity scores outside the range observed for the treatment areas. (A special case is a “reflexive comparison” that only compares the treatment area before and after the intervention; because there is no control area, this method can be deceptive as a basis for assessing impact).
• Instrumental variables or statistical control methods, in which one uses one or more
variables that determine the participation in the road project but not the benefits given that the area is part of the project. This identifies the exogenous variation in outcomes attributable to the road project, recognizing that the selection of areas to get a road is not random but purposive. The “instrumental variables” are first used to predict project participation; then one sees how the outcome indicator varies with the predicted values.
Adapted from Baker (2000), Ravallion (2001). In selecting control areas, two situations can be distinguished: construction of
rural roads and improvement of rural roads. The latter situation is the easier one to deal

24
with because for each improved road, a matching non- improved road can in principle be
identified as a control. It is important to compare both the physical conditions of the road
and the socioeconomic conditions of the area around it. The physical conditions of the
road include its surface (gravel, dirt), the width of the road, and its degree of passability.
However, it is not sufficient to select the control road simply based on matching physical
characteristics, but one also needs to ensure that the surrounding zone of influence is
similar in relevant socioeconomic aspects. These could include population density, level
and mix of agricultural activity, nature of non-farm employment, education levels, etc.
Propensity score matching methods can be used to ensure that the control areas are truly
similar to the treatment areas (see Section 5).
The second situation — whereby the project constructs roads where previously
there were none — is potentially more difficult since the control area has to be selected
solely on the basis of geographic and/or socioeconomic criteria. In practice this will
often mean selecting administrative entities used in the country’s master sampling frame.
The feasibility of identifying control roads at the start of a project is a contentious
issue among task managers of rural roads projects. Some feel that the ethical and
political obstacles are insurmountable. Others emphasize the practical difficulties.
Control roads will often be in communities that are located in close proximity and are
socioeconomically similar to the treatment areas. This makes it practically very difficult
to exclude the communities from the project. Some impact studies which had identified
control roads before the project were forced to change them afterwards, because a control

25
road had been improved by another donor or by the community itself, outside the sphere
of the project.13 Other experiences are more positive and report no difficulties with
identifying control roads, especially in the context of a two-stage project (see section 4
for selected case studies).
Selection Bias
As mentioned, one of the major problems affecting impact evaluation is the
presence of selection bias — the occurrence of non-observable characteristics that
determine both program participation and the results of this participation. At the level of
individuals, these characteristics could be personal ability, political connections,
willingness to work, etc. At the level of the community, it could be the integrity of
community leaders, social cohesion, etc. It is worth reflecting on the special situation
presented by roads when it comes to considering the possibility of selection bias. Most
non- infrastructure programs are targeted on individual or household beneficiaries. This is
the case, for example, for workfare, food-for-education or scholarships, micro-credit, and
agricultural extension programs, where eligibility is determined by personal attributes.
However, in the case of roads, the selection is based on characteristics of communities,
districts, or other geographically defined areas where the road is to be built. This limits
the potential of statistical methods, like instrumental variables, to deal with selection bias.
13 This situation presents an interesting dilemma. If the objective is to assess the impact of a given road project, then changes occurring independently in pre-selected control areas do not constitute a problem, even if these include road improvement. If on the other hand the main concern is to assess the impact of road improvement per se, i.e. regardless of which project or donor funded it, then subsequent road improvement in a selected control area would disqualify the area as a valid control.

26
Compare e.g. the case of a food-for-education program with a road improvement
program. Smarter children or children from smarter parents may be more likely to
participate in the food-for-education program, and since such children would otherwise
be more likely to have favorable schools results, not controlling for the selection bias
might lead to overestimation of the benefits from the program. The customary method to
control for such factors is the use of instrumental variables, which are defined as
variables that determine program participation but that do not determine individual
outcomes given participation. It is often very difficult to identify such variables, but a
frequently used practical choice is to use variables that determine the allocation of
program funds to specific areas. This method is unlikely to be available in the case of
rural roads because any selection bias would exist precisely at the level of the community
or district or other entity that is used to allocate funds to build roads. Thus, if “smarter”
communities are both more successful in securing project funds and more frequent road
users, there is no practical statistical way to control for the implied bias. This is a distinct
difference with the food-for-education program, where participation is a two-stage
process. First, the community or the school to receive the program is selected based on a
set of criteria, and second, the individual children which will receive the food also have
to meet certain criteria. This second stage is not present in the case of rural roads since
every resident is free to use or not to use the road.

27
Best-Practice Approach
What are the implications of the foregoing discussion for the choice of best-
practice method for assessing the impact of rural roads? The use of randomized designs
will only be feasible when (at least) two conditions are met: the program must be large-
scale (so that a sufficient number of treatment and control zones can be selected
randomly), and it must be implemented in two stages (to avoid the political and ethical
difficulties of program exclusion). In the majority of rural roads projects, these
conditions will not be met.
This means that often the best available methodological choice will be among the
quasi-experimental methods. If baseline data are available or can be collected as part of
the project, the clearly preferred method is that of double differences. This consists of
comparing impact variables before and after the building of the road in the treatment
areas, and comparing these changes with observed changes in control areas where no
road was built or improved. An effort at implementing this method was undertaken in
evaluation studies of rural roads in Morocco and Peru, but both studies selected the
control roads judgmentally at the time of the evaluation study (i.e. after the project was
completed), casting doubt on the ability of the studies to clearly attribute observed
changes to the road (see Section 4).14 The ongoing Viet Nam rural roads assessment
study has collected pre-project baseline and post-project data in both project and control
14 In the case of the Morocco study, the task manager has clarified that control roads had been selected at the time of launching the road improvement program. However, one of the four control roads was improved outside the Bank project, and this road was replaced by another nearby road that was not improved. The selection of this replacement road was deemed “judgmental”.

28
communes, which will allow the application of the full double-differences method (van
de Walle and Cratty, 2002).
A second best approach is to use reflexive or generic controls, whereby direct
questions to the respondents are used to ask them how much they think their situation has
improved due to the road, or whereby the observed evolution is compared to what
happened regionwide or even countrywide. The assessment of a rural roads projects in
Bahia, Brazil is an example of the latter approach (see Section 4). While the results of
reflexive or generic methods may be indicative of the impact of the road, they fail to
identify rigorously the contribution of the intervention.
If no baseline data at all can be obtained, one must rely on propensity score
matching methods or instrumental variables estimation. The choice between the two will
be primarily a function of available data and whether or not selection bias is perceived to
be an issue. In the case of rural roads, the unit of observation will typically be the
community or the geographic entity (district, county) which is used to define the road’s
zone of influence.15 The regression models will thus have to be estimated over
communities or districts/counties and this requires that a sufficient number of
observations at that level are available (both in and outside the project) and that
15 This is a noteworthy contrast with the application of these methods for the assessment of many other types of projects, where the unit of analysis is usually the household or individual — see the discussion of selection bias.

29
community or district/county level data exist or can be aggregated from household level
data.16
It is worth pointing out that the propensity score matching method is also useful in
conjunction with the double-difference method as an independent test on the validity of
the control sample. This is especially advisable in case of a large and geographically
dispersed project. Valid control entities must have propensity scores in the same range as
the treatment areas, and it is worth checking this explicitly (see Section 5 and Ravallion,
2001 for a fuller discussion).
Lastly, although a review of qualitative methods is not within the scope of this
note, it is recommended to complement the quantitative methods discussed above with an
array of qualitative methods, which are often useful to identify causal processes. Indeed,
the focus of qualitative methods is frequently on understanding constraints, processes and
the impact of interventions as perceived by individuals. Qualitative methods typically do
not rely on questionnaires, but rather on open discussions with respondents, focus groups
of selected households, and interviews with key respondents, such as village leaders,
school teachers, health officia ls, and the like. Qualitative methods often have the
potential to be more participatory and allow various stakeholders to provide input at
different stages of the impact assessment. A further discussion of participatory methods
can be found in World Bank (1996a) and Salmen (1995a 1995b). For a discussion on
16 The potential usefulness of road evaluations relying solely on ex-post methods (i.e. without baseline data) is deemed very limited. This is because roads typically have many indirect effects and externalities which may affect non-project areas and “contaminate” data collected in them. These effects cannot be identified without baseline data on both control and treatment areas (van de Walle and Cratty, 2002).

30
how to integrate quantitative and qualitative methods, see Bamberger (2000) and
Carvalho and White (1997).
In summary, a best practice evaluation of rural roads would include the following
elements:
(i) Estimation of the counter- factual by either random selection of
intervention areas to create a control group, or the use of quasi-
experimental methods to create a comparison group. The treatment and
comparison groups should be sufficiently large to establish valid statistical
inference.17
(ii) Collection of pre- intervention and post- intervention data in both control
and treatment groups, to compute double differences.
(iii) Qualitative techniques are incorporated to supplement and triangulate the
quantitative find ings.
17 The sample size will need to be larger if the difference between the control and the treatment groups is small (for the impact variable being considered), and vice versa. I am grateful to Hernan Levy for pointing this out.

31
Links with the Project Cycle18
A successful impact evaluation should be fully integrated in the regular project
cycle and not be run as an activity separate from the project. Each step in the project
cycle includes evaluation-related tasks. Setting up baseline controls and a timeframe for
follow-up surveys should be part of project identification and preparation. By the time
the project is ready for appraisal, the impact indicators should have been selected and
discussed with the relevant counterparts. Local partners, such as the institutions involved
in the data collection, should be identified at this stage. The baseline survey should be
completed prior to the start of project implementation. During project implementation
and supervision, the preparation for the follow-up survey needs to be made. The latter
needs to be undertaken following completion of the project. The actual impact evaluation
is then part of the post-completion activities. Box 4 gives an overview of the process.
We will now discuss in more detail each of the steps necessary for implementing a
successful impact evaluation.
18 This section draws on chapter 2 in Baker (2000).

32
Box 4: Main Steps in Designing and Implementing Impact Evaluations During Project Identification and Preparation
1. Determining whether or not to carry out an evaluation 2. Clarifying objectives of the evaluation 3. Exploring data availability 4. Designing the evaluation 5. Forming the evaluation team 6. Baseline data collection:
(a) Sample design and selection (b) Data collection instrument development (c) Staffing and training fieldwork personnel (d) Pilot testing (e) Data collection (f) Data management and access
During Project Implementation
7. Analyzing the baseline data 8. Writing up the findings and discussing them with policymakers and other stakeholders 9. If needed, making mid-term revis ions to project design 10. Preparing the follow-up survey
After Project Implementation
11. Follow-up survey data collection 12. Project impact data analysis 13. Writing up the results and discussing them with policymakers and other stakeholders 14. Incorporating the findings in design of future projects
Adapted from Baker (2000). The first step of the process is obviously to decide whether or not to carry out an
impact evaluation. In making this decision, both technical and political considerations
need to be assessed. At the technical level, given the previous discussion, the most
important decision is whether it will in fact be possible to undertake a baseline and a
follow-up survey in both the treatment area and the control area. If these conditions are

33
not met, a full impact assessment will not be possible, although it might still be possible
to collect relevant socioeconomic data in the influence zone of the road. Since the results
of an impact evaluation could be politically sensitive, obtaining support (and willingness
to finance the impact evaluation) from policymakers is critical.
If a decision is made to go forward, the first activity is to identify the objectives of
the evaluation, which in practice means to identify the impact indicators of interest.
Baker (2000) recommends the use of a logical (log) framework as a commonly used tool
for identifying project goals. The log frame is a matrix that matches information on
project objectives with various performance and output benchmarks. However, other
techniques are possible to identify the objectives of the evaluation. This exercise is
particularly important for rural roads because the range of impact indicators can be very
wide, going from transport-specific indicators to general social impact indicators (health,
education) and general welfare indicators of earnings and consumption (see Section 2).
Although we have emphasized the importance of data collection for the impact
evaluation, especially the undertaking of a baseline and follow-up survey, this does not
mean that these activities need occur independently from other data collection efforts in
the country. Specifically, it may be useful to find out whether the country has any plans
to undertake a household income and expenditure survey, a living standards measurement
survey, a labor force survey, or similar activity during the lifetime of the project. It may
be possible to piggyback either the baseline or the follow-up survey to this activity, thus
possibly economizing on sample design and field costs. It may be possible to convince

34
the authorities to over-sample the population in the project zone so as to increase the
number of observations available for the impact study. In addition, it may be possible to
introduce a few questions in the survey relating specifically to the impact of the roads.
In designing the evaluation methodology, specific attention must be given to the
implementation capacity of the country in question. It may be possible to ask a statistical
agency to undertake the data collection, but more often than not the data collection will
have to be delegated to a research institute, a university, or a private firm with experience
in opinion surveys. The needed capacity should not be underestimated. As the annexes
to this document show, the questionnaires to undertake a socioeconomic impact
assessment are complex and require significant experience on the part of the enumerators.
In the case of roads, they will cover very different types of data collection, ranging from a
traffic density survey to a socioeconomic survey of households. Commensurately, the
evaluation team will have to include different disciplines both at the analytic side and at
the data collection side. At the analytic side, an economist, a transport/road specialist,
and other social scientists are needed. It is essential that the full analytic team takes part
in the design and finalization of the survey questionnaires. At the data collection side,
the following skills are essential: sampling expert, survey/questionnaire designer, field
work manager, enumerators, data entry specialist/processors. A useful discussion on the
composition of the evaluation team can be found in Baker (2000).

35
Data Collection Issues
Two data collection issues may create a special complexity in the case of rural
roads: sampling design and time periods. With respect to sampling, as was discussed
earlier, the control zone should ideally be identical to the treatment zone except for the
intervention. In principle, the control zones can be sampled from a national sampling
framework, although geographical proximity will often be helpful to ensure compatibility
between the control and the treatment zones. This issue is made more complex in the
case of rural roads because of the definition of the zone of influence. If the zone of
influence is defined as a band, say five or ten kilometers wide around the road, this will
make the sampling task more difficult and more expensive because such a zone will not
conform to any of the sampling units that will be found in a typical national sampling
framework. In fact, it will be necessary to map this zone and to do an exhaustive listing
operation (i.e., to make a list of all households in the zone). A sample can then be drawn
from this list.
A more practical approach is to define the zone of influence as coinciding with
districts, counties, or other administrative entities through which the road runs. Such
entities typically are part of the national sampling framework, as are potential cand idates
for control zones. Thus, in practice there will have to be a compromise between a
theoretically ideal zone of influence and what is practically possible given resource
constraints and the available sampling framework. For example, in the ongoing
assessment of the Viet Nam rural roads project, communes were selected as entities to

36
assess project impact. The treatment group consists of communes randomly selected
from a list of all communes with proposed projects in each province. Comparison
communes were selected from a list of all remaining communes without proposed
projects, but in the same district as treatment communes. The appropriateness of this
selection procedure will be tested during the actual analysis by propensity score matching
methods to ensure that selected non-road communes are indeed comparable to selected
communes with roads (van de Walle and Cratty, 2002).
The second issue pertains to timing. The baseline survey should be completed
prior to the start of road building or improvement. The range of benefits which a rural
road brings about are likely to take place over a fairly long period time. Some
improvements, such as increased traffic density or improved access to schools, may occur
quite rapidly but effects on cropping patterns and rural incomes may take years to
materialize. The decision, therefore, has to be made on how many follow-up surveys
need to be undertaken and with what time intervals. If resources are available for only
one follow-up survey, common practice is to schedule it two to four years after the
baseline. If multiple rounds are possible, shorter intervals, such as two years might be
advisable. Since many of the activities to be observed are seasonal in nature, it will be
important to undertake the baseline and the follow-up surveys at the same time of the
year (and avoiding peak periods of economic activity, such as seeding or harvest time).
This is important even for issues that rely upon one-year recall (e.g. harvest information)
to ensure that recall errors are held constant as much as possible over successive survey
rounds.

37
4. CONTENT OF DATA COLLECTION AND QUESTIONNAIRES
In order to get an idea of the scope of variables needed for a socioeconomic
impact study of rural roads, we review in this section a number of studies done in
different countries and by different agencies (World Bank, USAID, ODA) (Box 5).
Box 5: Selected Socioeconomic Impact Studies of Rural Roads
Rural Roads, Morocco
Impact Evaluation Report — Socioeconomic Influence of Rural Roads (Fourth Highway Project, Loan 2254-MOR). Operations Evaluation Department, World Bank, Washington, D.C., June 1996 (Report No. 15808-MOR)
Feeder Roads, Bahia, Brazil
Impact Evaluation Report — Feeder Roads in Bahia (Secondary and Feeder Roads Project, Loan 1207-BR; Second Feeder Roads Project, Loan 1730-BR). Operations Evaluation Department, World Bank, Washington, D.C., June 1997 (Report No. 16738-BR).
Rural Roads, Peru
Project Appraisal Document — Second Rural Roads Project in Peru. Finance, Private Sector and Infrastructure Department, Country Management Unit LCC6C, Latin America and Caribbean Region, May 2001, World Bank, Washington, D.C. (Report No. 22110-PE).
Njombe-Makete Road, Tanzania
K. Lucas, V. Rutachokozibwa and E. Tagora, “The Njombe-Makete Road: An Impact Assessment of an ATAP Funded Road Improvement Project”, mimeo, September 1995, Dar es Salaam, Tanzania.
Songea-Makambako Road, Tanzania
T. Airey, D. Bryceson, J. Howe “Interim Evaluation of the Songea-Makambako Road”. Evaluation Department, Overseas Development Administration, July 1989, London.
Other relevant sources: Kessides (1993) Gannon and Shalizi (1995) Baker (2000) Gannon and Liu (2000) Gannon et al (2001)

38
The Fourth Highway Project in Morocco aimed to improve the country’s national
highway system, but also included a major investment in secondary and tertiary rural
roads. This was meant to help reduce income disparities between regions. The impact
study found that the rural roads had a significant impact on transport infrastructure and
services, agriculture, social services, and the environment.
The road improvements consisted primarily of installing an asphalt surface to
replace original gravel or unengineered tracks. The most direct impact was the
elimination of frequent road closures during rainy periods. The asphalt surface meant
that the cost of operating vehicles dropped, leading to lower prices for freight and
passenger services. Traffic volumes increased as did the proportion of traffic consisting
of trucks. Supply of passenger services also increased, especially share-ride taxis started
offering a more frequent service, whereas in the past the only service was a rural bus
often running only once a day. Ownership of motorized vehicles increased in the area,
and access time to markets and social services fell drastically, sometimes by 50%.
However, the benefits from paving rural roads extended well beyond traffic-
related factors and included major benefits for the agricultural economy at large,
including higher outputs, transformation of the agricultural output mix, and increased use
of modern inputs, especially fertilizers. Agricultural extension service also improved as
it was easier for the agents to reach the farmers. The year-round passability of the roads
meant that farmers were able to produce higher value crops, such as fruits and vegetables

39
which could be brought to the markets easier. There was also a marked growth in off-
farm employment opportunities.
On the social side, the improved roads made access to education and health
facilities easier, leading to a significantly higher enrollment in primary education. The
biggest impact was on girls’ enrollment in primary schools which trebled over the period.
Quality of education also improved as it became easier to recruit teachers, and
absenteeism rates of both teachers and students dropped. The population around the
roads nearly doubled its use of health care facilities. The quality of health services
improved as the supply of medicines increased and health staff could easier reach the
facilities. On the negative side, the increased traffic on the roads led to increased road
accidents.
Lastly, due to the improvement of travel facilities, rural/urban interaction
increased, both in the direction of urban dwellers visiting their rural relatives and farm
households visiting cities.
Some of the impacts from the road were especially important for women. In
addition to the increase in enrollment of girls in primary schools, the roads also increased
the availability and affordability of butane, which reduced the time women needed to
devote to the collection of fuelwood for cooking and heating.

40
From a methodological point of view, the Morocco impact study attempted to
calculate double differences by comparing current conditions with those before the road
improvements and by comparing conditions surrounding the project roads relative to
control roads which did not benefit from improvements over the study period. However,
as the evaluation report recognizes, for one of the four roads, the control road was
selected judgmentally at the end of the project, and thus one cannot definitely attribute
any observed changes in the communities in question to road improvements.
Furthermore, no formal matching was done between the control zones and the treatment
zones to ensure that they were in fact comparable. Another problem with this study was
that baseline data originally intended to be collected under the project were in fact not
collected, so that baseline information had to be reconstructed from various statistical
records and surveys (with varying reliability).
Between 1976 and 1982, the World Bank supported three rural feeder roads
projects in the state of Bahia in Brazil. An impact assessment was conducted of the
second and third feeder roads projects. Two major difficulties in undertaking the effort
were the lack of baseline data prior to the improvement of the roads and the fact that
neither of the road projects identified control roads. Consequently, much of the pre-
project information had to be collected retroactively, and the study focused its analysis on
comparisons before and after the project, rather than comparing situations with and
without roads. Thus, as the report recognizes, “The extent to which these changes can be
attributed to the roads is unclear, but, as a minimum, it can be said that the changes
coincided with the improvements of the roads” (p. 9).

41
Bearing these limitations in mind, the study found that traffic on the improved
roads increased substantially during the study period. For example, traffic on most roads
in the late 1970s was about 20 to 40 vehicles per day, but in 1996 this traffic volume
surpassed 100 vehicles per day in 12 of the 20 roads in the study. The roads helped
expand production of several crops, especially coffee and cocoa. Farmers were able to
market their projects more easily, and bring in modern inputs and machinery at a time
when traditional production techniques were being upgraded. However, apart from
changes in these crops, the study found that there were relatively few changes in the level
of other economic activities and the roads also induced little migration.
The study found that school enrollment increased, as did availability of hospital
beds. The main social change observed, however, was the change in land tenure patterns,
especially an increase in the proportion of smallholders.
The first phase of the Rural Roads Project in Peru was carried out between 1995
and 2000 in the 12 departments that ranked highest in rural poverty. The project aimed to
improve accessibility to rural areas so as to create income-generating activities and better
access to basic social services. In order to prepare for the second phase of the project, an
impact evaluation was undertaken of the first phase. The evaluation study collected post-
project data in March 2000 over a representative sample of roads and tracks improved by
the project and over a set of similar roads and tracks which did not receive an
intervention. Although no formal matching analysis was undertaken to assess whether

42
the control zones were similar to the treatment zones, the study attempted to use the
double-difference method to assess the impact from the roads. The main difficulty was
the lack of baseline data, which necessitated the use of retroactively collected data to
obtain information on the pre-project situation.
The study showed significant reduction in travel times, up to 50%, and a
reduction in transport tariffs for both passengers and freight. Reliability of transport
services was markedly improved. There was also a substantial decrease in the percentage
of the time the roads were not passable. The fraction of trips that were undertaken by
foot decreased from about 52% to 46%, with the largest decrease observed for trips with
social purposes (which tended to be longer in distance). One negative impact of the road
was an increase in the number of accidents.
The study did not show a significant impact on access to education, whether in
terms of greater attendance, smaller drop-out rates, or higher recruitment of teachers.
The results, however, did show an appreciable improvement in the quality of education
due to increased security in the movement of pupils and teachers. The impacts were
more positive in the case of access to health services, where travel times to health centers
and practitioners showed a substantial decrease. Communities in the areas of influence of
the roads also enjoyed an increased number of government-sponsored programs than in
the control zones, indicating that improved access facilitated the delivery of programs.

43
In contrast to what was observed in Morocco and Bahia, the roads program did
not lead to noticeable changes in economic production activities. Variables such as value
of land, productivity, number of heads of livestock, and prices of agricultural products,
did not show any significant trends that could be attributed to the advantages of better
access. For some crops, but not all, improvements in commercialization were observed.
The roads did, however, contribute to the diversification of productive activities. An
important effect, not observed in the other countries, was an increase in access to credit
due to better accessibility to banks.
Although the roads did not significantly change the amount of migration, it was
observed that employment considerations had a greater weight in the decision to migrate
in project areas than in control areas. In terms of overall level of living, household
expenditures were found to be higher in project areas than in control areas although there
were no significant differences in the incidence of poverty.
The three rural road impact studies discussed so far were each undertaken by the
World Bank for Bank-financed projects. It is of interest to review a few non-Bank
sponsored rural road projects and the associated impact studies. We will compare two
studies, both from Tanzania, assessing the impact of road projects funded, respectively,
by the U.S. Agency for International Development (USAID) and the Overseas
Development Administration (ODA) of the United Kingdom.

44
The first study pertains to a regional road between Njombe and Makete in the
Iringa region of Tanzania. The road project was funded through the Agricultural
Transport Assistance Program of USAID and implemented by the Tanzania Ministry of
Works. The project undertook improvements of feeder roads, bridge construction, and
rural road routine and spot maintenance. The impact assessment package developed by
USAID was used to evaluate the road. The evaluation report indicates that baseline data
and post-project data were collected but gives no indication on the use of control roads to
determine project impact.
The impact study found a 70% increase in daily vehicle traffic. Vehicle operating
costs declined by almost 50% and fares by 40%. The study observed increased
participation of vendors at local markets and an increased variety of available consumer
goods and agricultural products. The geographic size of markets for agricultural products
increased significantly. As was also observed in several of the World Bank analyses, the
USAID study found significant increases in the sale of all types of agricultural products
as well as increased availability of agricultural inputs. On the social side, the study noted
increased attendance at hospitals and family planning and preventive health care
facilities. An interesting finding was that of increased participation of women in local
government affairs due to the increased feasibility of one-day roundtrip travel to meeting
sites.19
19 In light of the importance of the empowerment agenda for the implementation of the WDR 2000/2001 poverty reduction strategy, the impact of road construction and improvement on political participation and voice should receive increased attention in impact studies. The questionnaires in the annexes have a module devoted to this.

45
The final case study reflects the methodology used by the Overseas Development
Administration (ODA) to evaluate the Songea-Makambako Road in Tanzania. The
evaluation study was made difficult by the fact that the 1979 baseline study collected
only information at the level of district and villages and not at the household level. Thus,
the 1987 survey undertaken by the evaluation team served both as follow-up survey at the
village and district level, but baseline survey at the level of household. Since this survey
occurred two years after completion of the road, the assessment cannot measure impacts
at the household level.
The study finds a significant growth in the volume of traffic. An origin-
destination survey revealed that less than one-fifth of the traffic used the complete length
of the road. The volume of passenger services doubled and in some areas trebled.
Vehicle operating costs were reduced by 40% to 50%.
Since there were no baseline household data, the socioeconomic impact of the
road was measured by comparing trends in villages on the road with those off the road.
However, since no explicit effort was undertaken to ensure that off-road villages were
comparable with those on the road, and thus constituted valid controls, it is not possible
to attribute differences in trends between the two types of villages to the benefits from the
road. Nevertheless, the study observes that the volume of marketed crops increased more
than twice as fast in on-road villages as compared to off-road villages. There were,
however, few changes in the crop mix and no increases in cash crop production.

46
Agricultural incomes rose faster in on-road villages than in off-road villages. Likewise,
on-road communities displayed a higher use of farm inputs than those of the road.
On the social side, the study did not observe any increases in school enrollment,
but did find that an important effect of the road was to make it much easier to recruit
teachers. Teaching posts in schools along the road proved to be much more popular than
those off the road. On the health side, referrals from local health centers to district
hospitals became more frequent. However, the road also caused a significant increase in
serious traffic accidents.
These five case studies illustrate that, regardless of the agency which undertakes
the impact assessment, there are significant difficulties and challenges in undertaking a
full- fledged rural roads impact assessment. Only two of the five studies, Morocco and
Peru, explicitly used control sites that could form the basis of a double differences
method. Due to various limitations in the selection of controls, however, neither study
was able to formally evaluate the validity of the control sites. The other three case
studies were limited to before and after comparisons or to comparisons of villages with
and without roads. Furthermore, each of the three Bank impact studies had to collect the
baseline information retroactively, at the time of the impact assessment. Since the
respondents thus had to recall information of 3-4 years earlier, it is likely that the baseline
information is subject to significant measurement error. The table below summarizes the
methodological features of the five studies reviewed above.

47
Road Impact Evaluation Characteristics
Project
Rur
al R
oads
M
oroc
co
Fee
der
Roa
ds
Bah
ia, B
razi
l
Rur
al R
oads
P
eru
Njo
mbe
-M
aket
e R
oad
Tan
zani
a
Song
ea-
Mak
amba
ko
Roa
d,
Tan
zani
a
Baseline data Retrospective Retrospective Retrospective Yes Partial Control roads Yes, but post-
project for one road
No Yes, but post-project
No No
Double-differences Yes No Yes (partial)
No No
Propensity score matching No No No No No Instrumental variables No No No No No The rather self-evident conclusion from this table is that a firm commitment to
improved data collection in conjunction with rural roads projects is a major pre-condition
for better future impact studies. The key weakness of existing stud ies lies in the failure to
identify control areas before the project starts and to undertake baseline data collection in
both control and treatment areas.
The ongoing evaluation of the Viet Nam Rural Transport Project has addressed
this weakness and is the first rural roads assessment study to have collected baseline and
follow-up data in both control and treatment communities. This transport project was
launched in 1997 and aims to rehabilitate 5,000 kilometers of roads in 18 provinces. To
assess the impact of the project, baseline and post-project data were collected in six of the
18 provinces. The data cover 100 randomly selected project communes and 100
randomly selected control communes (selected however from within the same districts as
48
the treatment communes). Propensity score matching techniques will be used to verify
that the selected communes are valid controls. Within each commune, 15 randomly
selected households were surveyed. Baseline data collection started in June 1997, and
two follow-up survey rounds were done in the summers of 1999 and 2001. (A third
round is scheduled for the summer of 2003). Surveyed households and communes are
the same in each round, and the resulting panel data set will make it possible to measure
project impact by computing double differences on a wide range of impact variables.
The panel nature of the data will also allow the elimination of selection bias from the
analysis (van de Walle and Cratty, 2002).
The comparison of the studies discussed above indicates that there is a fairly large
overlap in the set of variables deemed useful for assessing project impact on traffic and
socioeconomic conditions. However, each study also used some unique variables, which
may well be relevant for other areas as well. We have brought together common and
unique variables in three tables — traffic variables, income and expenditure variables,
and social variables — to provide an overview of issues that can be addressed in impact
studies of rural roads. As the tables indicate, the range of topics is very wide, and
selectivity and prioritization will be essential if one is to stay within the cost parameters
set out earlier. The tables contain prototype variables lists, which must be seen as a
starting menu from which the design of a given roads impact study can be undertaken.
The questionnaires proposed in the annex make it possible to collect information on all
variables in the tables.

49
Socioeconomic Impact of Rural Roads: Traffic Variables
Project
Variables
Rur
al R
oads
M
oroc
co
Fee
der
Roa
ds
Bah
ia, B
razi
l
Rur
al R
oads
P
eru
Njo
mbe
-M
aket
e R
oad
Tan
zani
a
Song
ea-
Mak
amba
ko
Roa
d,
Tan
zani
a
Oth
er S
ourc
es
TRAFFIC DENSITY
Vehicles per day (by type of vehicle) X X X X X X Frequency of bus service X X X X Frequency of taxi service X X X X
PASSABILITY
Number of months of road closure X X X
FARES AND COSTS
Vehicle operation costs X X X X X X Passenger fares X X X X Rate for a truck-load of merchandize over a given distance
X X X X X
Transport cost of farming inputs (seeds, fertilizers)
X X X
Transport cost of agricultural products X X X
TRANSPORT PATTERNS
Number of trips taken outside village, by purpose
X X X
Time required to reach selected destinations (nearest city, market, school, health center, work)
X X X X X
Main mode of transport to selected destinations X X X Number of passengers in public transport X Number of passengers on goods transport X
VEHICLE OWNERSHIP
Ownership of motor vehicles (by type) and bicycles
X X X X
Type of use of owned vehicles X
ACCIDENTS
Number of traffic accidents (injuries and fatalities)
X X X X X X

50
Socioeconomic Impact of Rural Roads: Income and Expenditure Variables
Project
Variables
Rur
al R
oads
M
oroc
co
Fee
der
Roa
ds
Bah
ia, B
razi
l
Rur
al R
oads
P
eru
Njo
mbe
-M
aket
e R
oad
Tan
zani
a
Song
ea-
Mak
amba
ko
Roa
d,
Tan
zani
a
Oth
er
IMPACT ON AGRICULTURAL ACTIVITIES
Land devoted to different crops X X X X X X Produced quantities of crops X X X X X Output of key crops per unit of cultivated land X X X X X X Amount of harvest sold in markets X X X X X Use of fertilizers X X X X X Use of herbicides X X X Use of pesticides X X X Use of improved seeds X X X X Use of farm equipment (tractors, machines) X X X X Farm-gate prices of key crops X X X X Local market prices of key crops X X X X Unit price of farm inputs X X Number of people (household members, others) working on farm
X X X X
Agricultural day wage X Number of yearly visits of agricultural extension agent
X X
Livestock ownership X X X X X
IMPACT ON NON-AGRICULTURAL ACTIVITIES
Number of stores in village X X X Ownership of non-agricultural household enterprise (by type)
X X X X
Number of days worked outside farm X X X Employment pattern (on-farm, off-farm) X X X X
INCOME PATTERN
Composition of Income X X X X X
EXPENDITURE PATTERN
Pattern of household expenditure X X X X
MARKETS
Distance to market X X X X X Number of sellers/shops in nearest market X X X Number of products available at market X X Number of visits to market as consumer and products bought
X
Number of visits to market as producer and products sold
X

51
PRICES
Price of key traded commodities X X X Price of land X X X X Price of housing X X
OTHER
Land tenure X Access to credit X X Number of migrants X X X Number of return migrants X X X Number of persons/days of employment generated by road construction/maintenance
X

52
Socioeconomic Impact of Rural Roads: Social Variables
Project
Variables
Rur
al R
oads
M
oroc
co
Fee
der
Roa
ds,
Bah
ia B
razi
l
Rur
al R
oads
P
eru
Njo
mbe
-M
aket
e R
oad
Tan
zani
a
Song
ea-
Mak
amba
ko
Roa
d,
Tan
zani
a
Oth
er
EDUCATION
Number of primary schools in village X X Primary school enrollment rate (by gender) X X X X X X Secondary school enrollment rate (by gender) X Primary school drop-out rate (by gender) X X Distance to nearest primary/secondary school X X X Quality of schools • qualification of teachers • rate of absenteeism of teachers • availability of school supplies
X X
X
X X X
HEALTH
Distance to nearest health center/hospital X X X Number of visits to health facilities (by age/gender)
X X X X X
Number of visits to health center unable to make due to road conditions
X
Days of work lost due to illness X Morbidity rates X Immunization rate of children X Pregnant women receiving prenatal care X Quality of health facilities • qualifications of medical staff • number of days present • availability of drugs and medical supplies • available hospital beds
X
X
X
X X X
TIME USE
Time spent on firewood collection X X X Time spend on other transport tasks X
SOCIAL INTERACTION
Number of visits to nearest city/village X X X Number of vis its received from friends or relatives in other villages or cities
X X
Households receiving remittances X Attendance at social events (funeral, wedding, festival) not in village
X

53
POLITICAL PARTICIPATION
Attendance at public meetings not in village X Number of visits to village by government officials
X X
Use of court/police X Membership in community or political organizations
X
Number of government programs accessed X Involvement of community in road maintenance
X

54
As these tables indicate, the list of potential variables for a full-scale road impact
evaluation is long, and the design and administration of the questionnaires are a
potentially complex task. Fortunately, the effort does not need to start from scratch.
There is by now a very wide experience with the undertaking of socioeconomic
household surveys, both inside and outside the Bank. Inside the Bank, the best known
instrument is probably the Living Standards Measurement Surveys (LSMS), started in
1980 and revised in the late 1990s. These surveys constitute the most widely used data
collection instrument underlying poverty and socioeconomic analysis in the Bank. All
income, expenditure, and social variables in the lists above can be derived from a typical
LSMS, although this is not the case for the transport variables. Thus, one attractive
option for the design of a rural roads impact study is to take the LSMS questionnaires and
add a transport module.20 The main drawback is that the LSMS questionnaires are
lengthy and their administration costly, so that this option may exceed the $200,000 to
$300,000 target budget for an impact study. However, the LSMS prototype
questionnaires can easily be reduced to suit the user’s needs and priorities.21 Such shorter
forms have been used in other endeavors in the Bank, for example, a reduced expenditure
module was used in the Local Level Institutions Studies in combination with institutional
20 In such a case, it would be preferred but not essential that the fieldwork for the LSMS and the transport module be undertaken simultaneously. If there is an existing LSMS which one wants to use as baseline for a road impact study, it is possible to administer a transport module afterwards provided that the module is administered in the same communities as the LSMS and that households are selected using the same sampling method as the LSMS. This will make it possible to undertake the impact evaluation using the community as unit of analysis. Of course, it will not be possible to study links at the household level between transport variables and socioeconomic variables. The permissible time-delay between the LSMS and the administration of the transport module is a function of the rate of social and economic change in the country. In countries in transition, or undergoing social or economic turmoil, the time period should probably not exceed 1 or 2 years. 21 Guidelines and a CD-ROM are available for that purpose in Grosh and Glewwe, 2000.

55
and access-to-service modules (World Bank, 1998). Box 6 discusses some issues in
questionnaire design.
Box 6: Issues in Questionnaire Design
1. Why are the questionnaires suggested in the annex designed to collect all variables in the tables as opposed to the minimum set needed for impact evaluation of rural roads? In a prototype questionnaire it is not possible to determine what the minimum set of variables is for a meaningful impact evaluation. This depends on the social and economic setting in the country and on the time period between baseline and follow-up survey. E.g. if roads are built in communities where primary school enrollment is already at 100%, this variable would not be part of the “minimum education module”, but it would be in other areas where enrollment is low. If the elapsed time between baseline and follow-up survey is two years, it make little sense to include literacy as part of the minimum module, because literacy changes only slowly. However, if the elapsed time is 5 years, and it is known that the government has an active literacy program, the variable may well need to be included. Similar considerations exist for the design of all modules. 2. Is it essential to collect household income and expenditure data in order to undertake a road impact evaluation? If the objectives of the evaluation include to estimate the impact on poverty, it is essential to have income or expenditure data. Most poverty analysis is based on expenditure data, because they can typically be collected with lower measurement error than income data. However, the collection of income or expenditure data is time-consuming and costly. In a typical LSMS, income and expenditure questions constitute more than half of the entire questionnaire and are the main reason why the LSMS requires at least two visits to the household. This is the reason why some impact studies (e.g. the earlier mentioned study of rural roads in Viet Nam) do not collect income or expenditure data, but rely on other welfare indicators such as asset holdings. However, the correlation between income/expenditure and assets need not be very high. Short-cut questionnaires are available, and have been used, for income and expenditure, but they are subject to higher recall errors. One intermediate solution would be to collect household expenditure data (either with a full LSMS module or a short-cut module), but to limit the collection of income information to sources of income (not levels) and directions of change. This would make it possible to assess whether roads had an impact on income diversification and which types of income increased and declined.

56
5. ANALYTIC ISSUES
After the analysis of the baseline and follow-up survey data has been completed,
the actual impact study can be started. Baker (2000) lists a long range of issues that are
relevant in bringing this task to a good end: understanding biases, adding control
variables, understanding the importance of exogeneity, exploring better ways to form a
comparison group (propensity score matching), learning about biases due to
unobservables, calculating double differences, using instrumental variables, comparing
different methodologies, combining quantitative and qualitative results. Obviously, this
document is not the place to explore each of those issues in detail (chapter 3 in Baker
(2000) and Ravallion (2001) contain detailed discussions). Here we limit ourselves to
raising three critical analytic issues as they apply to the evaluation of rural roads: the
double-differences method, propensity score matching, and the use of instrumental
variables.
The Double-Differences Method
From the point of view of communities,22 there are two situations: those that have
a road and those that do not. From the point of view of individuals, however, there is a
third differentiation to be made within the communities with a road, namely, people who
have used the road and those who have not. This leads to the following matrix:
22 As discussed earlier, the unit of analysis can either be the community or a larger area such as county or district. Since it is likely that most impact analyses of roads will use the community as unit of analysis, we will present the discussion accordingly. However, the term “community” can always be replaced with “area” without loss of validity.

57
Communities With Road Communities Without Road
Individual Road Users A
—
Individual Road Non-Users B
C
The relevant comparison to study the impact of the road is between C and the sum
of A and B. The comparison between A and B (i.e., users and non-users within
communities which have received the road) is not part of a road impact assessment,
although this comparison may be of interest for other purposes, e.g. to determine how
inclusive road use is, and whether road use is related to personal characteristics such as
education or gender. However, the important point is that group B, the non-users within
communities with a road, are not a control group suitable to assess the impact of the road.
The relevant comparison is between average values for the outcome variables in the
communities without a road and the same variables in the communities which have
received the road, averaged over both users and non-users. This comparison generates
the first of the two differences needed for applying the double-differences method. The
second difference is between the pre-project and post-project situations.
The most basic version of the double-differencing method to estimate the impact
of the road project works as follows: first, one calculates the mean values for all relevant
outcome indicators Y for the communities in the treatment group and in the control

58
group, both in the baseline year and the follow-up year. These values are captured in the
following matrix:
With Roads Without Roads
Baseline 1,roadY 1,roadnoY
Follow-up 2,roadY 2,roadnoY
The difference in values in the first column of the matrix indicates the mean
change in the treatment group. The equivalent difference in the second column gives the
mean change in the control group. The difference between those two differences is an
estimate of the program’s impact.
Program impact ( ) ( )1,2,1,2, roadnoroadnoroadroad YYYY −−−=
mean change in mean change in treatment group control group
This process (summarized in Box 7) provides a simple mean estimate of program
impact over all the communities in question. It is quite possible that the impact will
differ depending upon initial conditions, which may not be the same in all communities,
e.g. because communities may have different endowments of human, social, or physical
capital. To take these differences into account a regression approach may be indicated.

59
Box 7: Summary of Steps in Taking Double Differences
The double differences method entails comparing a treatment group with a comparison group both before and after the intervention. The main steps are as follows: Step 1: Undertake a baseline survey before the road is constructed or improved, covering
the full zone of influence (i.e., including both future road users and non-users). Step 2: After the project is completed, undertake one or more follow-up surveys. These
should be highly comparable to the baseline survey (in terms of the questionnaire, the interviewing, etc.). Ideally, the follow-up surveys should be of the same sampled observations as the baseline survey. If this is not possible, then the follow-up survey should be in the same geographic areas.
Step 3: Calculate the mean difference between the “after” and “before” values of the
outcome indicators for each of the treatment and comparison groups. Step 4: Calculate the difference between these two mean differences. This is the estimate
of the impact of the program. Adapted from Ravallion (2001). Consider t = 1,2 where 1 refers to the pre-road period and 2 refers to the post-road
period. Then, the average income Y (or any other outcome variable) of community c in
period 2 can be written as
222 cccc ucXbRaY +++= (1)
where R is a dummy variable indicating the presence of a road, X is a series of variables
capturing household and community characteristics, and u is an error term.

60
In the base period, this equation is
111 ccc ucXaY ++= (2)
Note that cR is always zero in the pre-project period. The error term u can consist of
time-variant elements ce and time-invariant elements cf . Thus,
cctct feu += (for t = 1, 2)
Taking the difference between equations (1) and (2) yields
( ) 121212 ccccccc eeXXcbRYY −+−+=− (3)
This equation regresses the change in income on the presence of a road and the
change in other explanatory variables. Estimation of equation (3) by Ordinary Least
Squares will yield an unbiased estimate b of the impact of the roads project on income.
If there was any selection bias due to unobserved variables, this will have been removed
due to the differencing process, at least if such biases are time- invariant (Ravallion,
2001).

61
In most cases, it will be desirable to take initial conditions into account, which can
be achieved by adding 2cX and 1cX separately in equation (3) so that
12112212 ccccccc eeXcXcbRYY −+++=− (4)
This method requires the availability of a panel dataset. In a typical impact study,
households or individuals who participated in the baseline survey must be the same ones
who participate in the follow-up survey, otherwise the differencing method would not
eliminate the unobservable factors that could create bias. In practice, it is often difficult
to construct such a panel, because households move or are no longer willing to participate
in the second round of the survey (attrition bias). In the case of roads, this problem is
likely to be insignificant since the evaluation occurs at the level of communities, and
equations (3) and (4) are estimated with communities as observations. It is unlikely that a
community at large would refuse to participate in the follow-up survey. If individual
households are not the same from one year to the next, this will not affect the validity of
the method, so long as the selection of households within each community takes place
randomly in each survey year.
Propensity Score Matching
As suggested in Section 3, it is desirable to undertake a separate check as to
whether the control communities are truly similar to the communities which have
received the roads, to ensure that the estimation of equations (3) or (4) are valid. This

62
can be done by applying the propensity score matching method. This consists of running
a probit or logit equation which estimates the probability that a community is selected to
participate in the rural roads project. The choice of explanatory variables for this
equation is a function of the selection criteria. If, for example, communities needed to
have a minimum population size, fall into the poorest quintile of communities, or have
achieved a certain level of agricultural development, then such variables would be
candidate explanatory variables.
ccc vgZdR ++= (5)
where cZ are variables capturing the selection process in the roads project.
This equation is estimated over the full sample of communities, and from the results the
propensity score is calculated for each community. If the range of propensity scores for
the group of communities with a road is similar to that for the sample of communities
which have not received the road, then the latter can be considered a valid control group.
The propensity score method is further explained in Box 8.

63
Box 8: Steps in Propensity Score Matching
The aim of matching is to find the closest comparison group from a sample of nonparticipants (non-road communities) to the sample of program participants (communities with road). “Closest” is measured in terms of observable characteristics. If there are only one or two such characteristics then matching should be easy. But typically there are many potential characteristics. The main steps in matching based on propensity scores are as follows: Step 1: You need a representative sample of eligible nonparticipants as well as one for the participants. The larger the sample of eligible nonparticipant communities the better, to facilitate good matching. Step 2: Pool the two samples and estimate a probit or logit model of participation in the roads project as a function of all the variables in the data that are likely to determine participation. Step 3: Create the predicted values of the probability of participation from the estimated regression; these are the propensity scores. There is a propensity score for every sampled participant and nonparticipant community. Step 4: Some communities in the nonparticipant sample may have to be excluded at the outset because they have a propensity score that is outside the range (typically too low) found for the treatment sample. The range of propensity scores estimated for the treatment group should correspond closely to that for the retained subsample of nonparticipants. If the road program covers a very large area, for example it may be national in scope, it is quite likely that propensity scores may not match. In that case improved matching can be achieved by splitting the sample according to geographic location. Step 5: For each community in the treatment sample, find the observation in the nonparticipant sample that has the closest propensity score, as measured by the absolute difference in scores. This is called the “nearest neighbor.” You will get more precise estimates if you use, say, the nearest five neighbors. Step 6: Calculate the mean value of the outcome indicator (or each of the indicators if there is more than one) for the five nearest neighbors. The difference between that mean and the actual value for the treatment observation is the estimate of the gain due to the program for that observation. Step 7: Calculate the mean of these gains for each observation (community) to obtain the average overall gain. This can be stratified by some variable of interest, such as village size, in the nonparticipant sample. Adapted from Ravallion (2001).

64
Instrumental Variables
Finally, one last complication needs to be discussed. In order for equation (1),
and by implication equations (3) or (4), to properly capture the impact of the roads
project, all the regressors must be truly exogenous. It is, however, quite possible that the
selection of a community for inclusion in the roads project may well be determined by
one of the dependent variables of these equations. For example, if the roads program is
targeted towards poor areas, participation is no longer exogenous in a regression where
income is the dependent variable. This problem can be resolved by revisiting
equation (5).
If the variables X in equation (1) include all variables Z in equation (5) and
there is no correlation between the error terms v and u , then equation (1) will remain
unbiased. This process is known as “selection on observables”. If this is not the case,
however, then an instrumental variable approach is called for. In the example at hand,
this can be achieved in two ways. The first way is to replace the variable R in
equation (1) by its value predicted by equation (5). The second and statistically more
efficient way is to add the residuals from equation (5) as a regressor to equation (1).23
For this method to work, it is necessary that there is at least one exogenous variable in the
set Z which is not included in X , i.e., there has to be one exogenously identified
instrument (Jalan and Ravallion, 1999; Ravallion, 2001).
23 Please note that the first method will not yield correct standard errors due to the replacement of the roads variables with its predicted value. It is advisable, therefore, to use a statistical package which estimates both equations as part of the same estimation routine.

65
In cases where there is no baseline data set available, the instrumental variable
method is the only one available to provide an unbiased estimate of project impact. The
instrument then just serves as an observable source of exogenous variation in project
participation (Ravallion, 2001). The double differences method resolves this problem by
having a valid control group.

66
REFERENCES T. Airey, D. Bryceson, and J. Howe. 1989. “Interim Evaluation of the Songea-
Makambako Road”. Evaluation Department, Overseas Development Administration, London, U.K.
J. Baker. 2000. Evaluating the Impact of Development Projects on Poverty — A
Handbook for Practitioners. Directions in Development Series, Washington, D.C.: World Bank.
M. Bamberger. 2000. “Integrating Quantitative and Qualitative Methods in
Development Research.” Mimeo, Poverty Reduction and Economic Management Network, World Bank, Washington, D.C.
S. Carvalho and H. White. 1997. “Combining the Quantitative and Qualitative
Approaches to Poverty Measurement and Analysis: The Practice and the Potential.” World Bank Technical Paper No. 366, World Bank, Washington, D.C.
K. Ezemenari, J. Owens and G. Rubio Soto. 2000. “Progress on Impact Evaluation
Plans in Bank Projects: Comparison of Fiscal Years 1998-2000” mimeo, Poverty Group, Poverty Reduction and Economic Management Network, World Bank, Washington, D.C.
K. Ezemenari, A. Rudqvist and K. Subbarao. 1999. “Impact Evaluation: A Note on
Concepts and Methods.” Paper presented at World Bank Conference on Evaluation and Poverty Reduction, June 14-15, 1999, Washington, D.C.
C. Gannon, K. Gwilliam, Z. Liu and C. Malmberg Calvo. 2001. “Transport:
Infrastructure and Services.” Chapter 4.2 in Poverty Reduction Strategy Sourcebook, Vol. 2 (Macro and Sectoral Issues). Washington, D.C.: World Bank.
C. Gannon and Z. Liu. 1997. “Poverty and Transport.” Transport, Water, and Urban
Development Paper No. 30, World Bank, Washington, D.C. C. Gannon and Z. Shalizi. 1995. “The Use of Sectoral and Project Performance
Indicators in Bank-financed Transport Operations.” Transportation, Water, and Urban Development Department, Discussion Paper No. 21, World Bank, Washington, D.C.
L. T. Ghee. 2000. “Report on Community Participation in Rural Road Maintenance in
Lao PDR”, mimeo, Environment and Social Development Sector Unit, East Asia and Pacific Region, World Bank, Washington, D.C.

67
M. Grosh and P. Glewwe (eds.). 2000. Designing Household Survey Questionnaires for Developing Countries — Lessons from 15 Years of the Living Standards Measurement Study. Washington, D.C.: World Bank.
C. Grootaert and T. van Bastelaer (eds.). 2002. Understanding and Measuring Social
Capital: A Multidisciplinary Tool for Practitioners. Washington, D.C.: World Bank.
C. Hille and N. van der Jagt. 1995. “Pilot Integrated Rural Transport Project, Malawi —
Findings from the Household-Level Rural Transport Survey and Recommendations for Household-Level Survey Methodology”, mimeo, Center for International Cooperation and Appropriate Technology, Delft University of Technology.
J. Jalan and M. Ravallion. 1999. “Income Gains to the Poor from Workfare: Estimates
for Argentina’s Trabajar Program.” Policy Research Working Paper, No. 2149, World Bank, Washington, D.C.
C. Kessides. 1993. “The Contributions of Infrastructure to Economic Development — A
Review of Experience and Policy Implications.” World Bank Discussion Paper No. 213, World Bank, Washington, D.C.
Louis Berger International, Inc. 1979. “Study of Transport Investment and Impact on
Distribution of Income in Remote Area: Phase I”, Report prepared for U.S. Agency for International Development, Washington, D.C.
K. Lucas, V. Rutachokozibwa and E. Tagora. 1995. “The Njombe-Makete Road: An
Impact Assessment of an ATAP Funded Road Improvement Project”, mimeo, Dar es Salaam, Tanzania.
G. Prennushi, G. Rubio and K. Subbarao. 2001. “Monitoring and Eva luation”,
chapter 1.3 in Poverty Reduction Strategy Sourcebook, Vol. 1 (Core Techniques and Cross-cutting Issues). Washington, D.C.: World Bank.
M. Ravallion. 2001. “The Mystery of the Vanishing Benefits: An Introduction to
Impact Evaluation.” World Bank Economic Review, 15(1): 115-140. L. Salmen. 1995a. “Beneficiary Assessment: An Approach Described.” Environment
Department Papers (Social Assessment Series), No. 23, World Bank, Washington, D.C.
L. Salmen. 1995b. “Participatory Poverty Assessment: Incorporating Poor People’s
Perspectives into Poverty Assessment Work.” Environment Department Papers (Social Assessment Series), No. 24, World Bank, Washington, D.C.

68
K. Subbarao, K. Ezemenari, J. Randa and G. Rubio. 1999. “Impact Evaluation in FY98 Bank Projects: A Review.” Mimeo, Poverty Group, Poverty Reduction and Economic Management Network, World Bank, Washington, D.C.
J. Tracey-White. 1999. “Establishment of a Framework for Socio-economic Studies”,
mimeo, International Labor Organization, Phnom Penh, Cambodia (UPSTREAM-CAMB/97/M02/SID).
D. van de Walle. 1999. “Assessing the Poverty Impact of Rural Road Projects.”
Mimeo, Development Research Group, World Bank, Washington, D.C. D. van de Walle. 2001. “Choosing Rural Road Investments to Help Reduce Poverty.”
World Development 30(4). D. van de Walle and D. Cratty. 2002. “Impact Evaluation of a Rural Road Rehabilitation
Project”. Mimeo, Development Research Group, World Bank, Washington, D.C. World Bank. 1996a. The World Bank Participation Sourcebook. Washington, D.C. World Bank. 1996b. Handbook on Economic Analysis of Investment Operations.
Washington, D.C. World Bank. 1996c. “Impact Evaluation Report — Socioeconomic Influence of Rural
Roads (Fourth Highway Project, Loan 2254-MOR).” Report No. 15808-MOR, Operations Evaluation Department, Washington, D.C.
World Bank. 1997. “Impact Evaluation Report — Feeder Roads in Bahia (Secondary
and Feeder Roads Project, Loan 1207-BR; Second Feeder Roads Project, Loan 1730-BR).” Report No. 16738-BR, Operations Evaluation Department, Washington, D.C.
World Bank. 1998. “The Local Level Institutions Study: Program Description and
Prototype Questionnaires.” Local Level Institutions Working Paper No. 2, Social Development Department, World Bank, Washington, D.C.
World Bank. 2001. “Project Appraisal Document — Second Rural Roads Project in
Peru.” Report No. 22110-PE, Finance, Private Sector and Infrastructure Department, Country Management Unit LCC6C, Latin America and Caribbean Region, Washington, D.C.

69
ANNEX: QUESTIONNAIRE MODULES Overview
Module 1: Direct Effects Module 2: Indirect Effects
TRANSPORT • Traffic density and composition
• Origin-destination survey
• Vehicle operating costs • Transporter survey
HOUSEHOLD • Household roster • Housing and amenities • Education • Health • Use of transport
services • Participation in
community affairs
HOUSEHOLD • Employment • Migration • Assets • Agricultural
enterprises • Non-agricultural
enterprises • Other income • Expenditures
COMMUNITY • General characteristics • Education • Health • Transport Infrastructure • Government programs • Community activities
COMMUNITY • Economic activities • Markets • Migration • Prices
Sources To the extent possible, the questionnaire modules proposed here were taken from existing surveys, in order to recommend field-tested instruments. The two main sources are the prototype LSMS instrument described in Grosh and Glewwe (2000) and the questionnaires used in the impact evaluation of the Viet Nam Transport Project (van de Walle, 1999; van de Walle and Cratty, 2002). Other road impact studies were drawn upon as indicated in the specific modules.

70
MODULE 1: DIRECT EFFECTS 1A. Transport 1A.1 Traffic Density and Composition A traffic density survey consists of visual or automated traffic counts. Counts should be conducted over “typical” days (e.g. a market and non-market day, week-day and weekend) or over a randomly selected number of days. Different types of vehicles should be distinguished. Where appropriate, pedestrian traffic can also be counted. Sources are World Bank (1996c) and Tracey-White (1999). Date ______________________________________ Time period________________________________ Location __________________________________ Direction of traffic __________________________
Observation Number
Time of Passage Vehicle Type (code)
1 2 3 4 5 • • •
Vehicle type codes
1. Bicycle 2. Ox/horse cart 3. Motor cycle 4. Motor-trailer 5. Car 6. Pick-up truck, jeep, tractor
7. Light truck (up to 2 tons) 8. Medium truck (2-6 tons) 9. Heavy truck (over 6 tons) 10. Bus 11. Other

71
1A.2 Origin-Destination Survey In contrast to a simple traffic count, an origin-destination survey requires that passing vehicles be stopped to ask questions about origin, destination, and purpose of the trip. All vehicles can be stopped or, where traffic volumes are high, a random sample can be selected (e.g. every tenth vehicle), possibly stratified by type of vehicle. To simplify the task of the enumerators, codes can be pre-determined for points of origin and destination and for the commodities being transported. Sources are Tracey-White (1999), Airey et al (1989), and Lucas et al (1995).

72
Date ____________________________________________ Time period______________________________________ Location ________________________________________ Direction of traffic ________________________________
1 Observation
Number
2 Time of Passage
3 Vehicle type
(code)
4 Origin of vehicle (code)
5 Destination of
vehicle (code)
6 Vehicle load
(tons)
7 Main
commodity on vehicle (code)
8 Is your
destination the market in
________? 1 Yes 2 No
9 If yes, how often do you
go to the market? (times
per month)
10 Type of market
user (code)
1 2 3 4 5 • • •
Vehicle type codes Origin/Destination Codes Commodity Codes Type of market user
1. Bicycle 2. Ox/horse cart 3. Motor cycle 4. Motor-trailer 5. Car 6. Pick-up truck, jeep, tractor
7. Light truck (up to 2 tons) 8. Medium truck (2-6 tons) 9. Heavy truck (over 6 tons) 10. Bus 11. Other
1. Village/town 1 along road 2. Village/town 2 along road 3. Other areas in district 4. Outside district
A locally relevant list of products needs to be developed, one code should allow for passengers only.
1. Farmer 2. Transporter 3. Buyer

73
1A.3 Vehicle Operating Cost The calculation of vehicle operating costs is a standard element of the economic analysis of transport projects, and several models (e.g. HDM-III) are available to that effect (see e.g. chapter 7 in World Bank, 1996c). The source for the data is a survey of freight and passenger transporters and private vehicle owners. The latter can be sampled as part of the household survey. Transporters can be interviewed as part of the origin-destination survey. Module 1A.4 below collects the necessary information to calculate vehicle operating costs. 1A.4 Transporter Survey The purpose of this module is to calculate vehicle operating costs and to get further detailed information about the nature of the transport business. Source is Tracey-White (1999).

74
TRANSPORTER SURVEY QUESTIONNAIRE
Transporter’s name, gender and address
Day of the week/date Name of the interview QUESTIONS: 1. What type of vehicles do you use?
2. How many of these vehicles do you own
3. How many drivers do you have?
Full time Part time
4. When did you buy the vehicles?
Year
5. How much did you pay for the vehicles?
6. How old are the vehicles now?
Years
7. How much do you spend in total on repairs per month? (excluding costs of tires, but including spare parts)
8. How many days a week do you use the vehicle(s)?
Days in dry season Days in wet season
9. How many days a year do you lose because of rain or
bad road conditions?
Days
10. What is the approximate distance traveled by your
vehicles in a year?
Kilometers
11. What sort of trips do your vehicles make? (to/from which villages/communes/district centers and, if
possible, approx. %)
1 % 2 % 3 % 4 % 5 %

75
12. What are the vehicles used for — transporting goods
and/or people? (specify approx. shares)
100% people 100% goods
0% people 0% goods
13. What types of agricultural products do you carry? (rank in order of importance)
1 2 3 4 5
14. What other types of products do you carry?
1 2 3 4
15. What is the total load your vehicle can carry?
Kg.
16. Do you operate any other type of business?
17. Do you also use the vehicle(s) for marketing your own
produce?
18. How much fuel do you use per month? (or fodder for animal transport)
Liters
19. How much oil do you use per month? (or veterinary medicine for animal transport)
Liters
20. How often do you replace your tires? (or wheels/harnesses for animal transport)
Months
21. What is the average length of trip? (if not the average then a range of distances)
Kilometers
22. What are the average fares you charge per one-way trip
for passengers? Last year This year
23. What do you charge per one-way trip for goods carried? (try to extract information to calculate cost per tons or
kg/km)
Last year This year
24. If roads were improved would this affect the fares you
charge? (try to get transporter to specify this as a % decrease)
%
25. If roads were improved would this affect the number of
trips you make? (try to get transporter to specify this as a % increase)
% in dry season % in wet season

76
1B. Household Survey 1B.1 Household Roster The household roster records the composition of the household and collects basic socioeconomic information about its members (age, gender, marital status, occupation). Both the LSMS prototype questionnaire (chapter 6) and the Viet Nam Transport Project evaluation questionnaire (section 1) contain good examples. 1B.2 Housing and Amenities This module records information on the type of housing, main construction materials, and available amenities (water, electricity, sanitation). A standard example is chapter 12 of the LSMS prototype questionnaire. 1B.3 Education This module obtains data on school enrollment and attendance of children, and participation of adults in training or literacy classes. Of special importance is the detailed recording of distance, time, and mode of transport to the educational facilities. The standard LSMS module on education (chapter 7) will probably be too detailed for inclusion in most transport project assessments but can easily be shortened. Education data were also collected in section 2 of the Viet Nam Transport Project assessment questionnaire. 1B.4 Health This module identifies the incidence of illness among household members and the extent of consultation with medical practitioners. As was the case for education, of special importance are the detailed questions about distance, time, and mode of transport to the facilities. The prototype health module (chapter 8) of the LSMS questionnaire is too detailed for use in a transport impact study, and section 3 of the questionnaire of the Viet Nam Transport Project study provides a good alternative. 1B.5 Use of Transport Services This module inquires about the number of journeys undertaken by household members, and the distance, duration, mode of transport, and purpose of the trips (excluding trips for health and education purposes which were already covered in sections 1B.3 and 1B.4). Section 10 of the questionnaire of the Viet Nam Transport Project study is a good example for this module. Since the use of transport services can differ greatly between

77
men and women, some studies use gender-specific questionnaires. For example, the questionnaire recommended in Hille and van der Jagt (1995) has a section to be answered by the “senior female” in the household, focusing on activities such as collection of water and firewood. 1B.6 Participation in Community Affairs Road construction and improvement may not only facilitate access to education and health facilities (captured in modules 1B.3 and 1B.4) but also enhance social interaction and political participation. The purpose of this module is to capture households’ involvement in these aspects of community life. Four topics are covered:
Ø Social visits to and from nearby communities Ø Remittances inflows and outflows Ø Attendance at social and political events outside the community Ø Membership in community organizations
This module draws upon the LSMS prototype survey (chapter 11) for the questions on remittances and upon the Social Capital Assessment Tool for the other topics (Grootaert and van Bastelaer, 2002). 1. How many times in the last three months did people who live outside this
community visit you in your home? ______ times 2. How many times in the last three months did you visit people who live outside
this community? ______ times [if zero, go to question 7] 3. For the most recent such visit, how did you travel there? 1 Walking 2 Private vehicle 3 Public taxi/bus 4 Other

78
4. How far away lives the person you visited? ______ kilometers 5. How long did the journey (going and returning) take? ______ hours ______ minutes 6. What was the purpose of this visit? ______________________________________________________ 7. In the past year, did your household give any money or goods to persons who are
not now members of your household? For example, to children, other relatives, or friends living elsewhere?
1 Yes 2 No go to question 10 8. How many times did you make such gifts in the last year? ______ times 9. What was the total amount of money and the value of the goods you gave? ______________________________________________________ 10. In the past year, did any one in your household receive money or goods as gift
from persons who are not now members of your household? For example, from children, other relatives, or friends living elsewhere?
1 Yes 2 No go to question 13 11. How many times did you receive such gifts in the last year? ______ times

79
12. What was the total amount of money and the value of the goods you received? ______________________________________________________ 13. How many times in the last year did you attend a festival or ceremony (wedding,
funeral, religious festival, etc.) outside this community? ______ times [if zero, go to question 17) 14. For the most recent such trip, how did you travel there? 1 Walking 2 Private vehicle 3 Public taxi/bus 4 Other 15. What was the distance to your destination? ______ kilometers 16. How long did this journey (going and returning) take? ______ hours ______ minutes 17. In the past year, how often have people in this community gotten together to
petition government officials or political leaders? ______ times

80
18. In the past year, have you done any of the following? Yes No a. Attend a political rally or other event outside this
community
b. Travel outside the community to meet with a politician
c. Send a letter to a politician outside this community d. Meet with a politician who visited the community
from outside
e. Contacted district police or court officials about a problem
19. Is anyone in your household an active member of any of the following type of
organizations? Yes No a. Farmer/fisherman group b. Cooperative c. Trader/professional association d. Credit/finance group e. Water or waste management group f. Forestry management group g. Religious group h. Cultural association i. Political association j. Youth group k. Women’s group l. PTA/school committee m. Health group n. Sports group o. Other group or association 20. How many of the groups of which you are an active member have members from
outside the community? ____________ 21. How many of the groups of which you are an active member regularly meet with
groups or associations from outside the community? ____________

81
1C. Community Survey 1C.1 General Characteristics This module provides a general overview of the demographic characteristics of the community (population size, ethnic/linguistic/religious composition), and the major social and economic infrastructure (except for health, education, and transport infrastructure which are covered in separate modules below). Chapter 13 of the LSMS prototype questionnaire and section 1 of the community questionnaire of the Viet Nam Transport Project study are both good sources. 1C.2 Education This module provides an inventory of the educational facilities in the community (number and type of schools, classes, and teachers) and indicators of quality (availability of school supplies, teacher credentials and attendance). This information complements the enrollment and attendance data collected in the household education module 1B.3. If there is a desire to triangulate the latter information, community- level enrollment data can also be obtained in this module from key informants (head of school, local representatives of Ministry of Education). Chapter 13 (section10) of the LSMS questionnaire and section 5 of the community questionnaire of the Viet Nam Transport Project evaluation study are alternative examples. 1C.3 Health This module provides an inventory of the health care facilities in the community (number and type of facilities and health care personnel) and indicators of quality (availability of medicines, attendance of doctors and nurses). A number of health care questions are better asked from key informants than from households (because of the relative rarity of the events involved), such as immunization rates, births at health care facilities, injuries and deaths from traffic accidents. Chapter 13 (section 9) of the LSMS questionnaire and section 6 of the community questionnaire of the Viet Nam Transport Project impact study are good examples.

82
1C.4 Transport Infrastructure The purpose of this module is to provide information on the state of the community’s transport infrastructure. This would cover any paths and roads that pass through the community (condition and passability), distance from major regional and national roads, distance to railways and waterways (where applicable), extent of available transport services (passengers and freight), and the recent history of road construction and improvements in the community. The LSMS questionnaire (chapter 13, sections 3 and 7) contains basic questions on some of these facilities. A more detailed line of questioning is available in section 2 of the community questionnaire of the Viet Nam Transport Project impact study. 1C.5 Government Programs The purpose of this module is to record the number and type of government programs that operate in the community, and the extent of use by residents. The expectation would be that the number of such programs, and their use, may increase as a result of road construction or improvement. Obviously, the list of potential programs to be included is country-specific. Given this list, the design of the module is straightforward, consisting of a number of “screen” questions (“Is program X active in this community?”) and, in the case of positive reply, questions probing about the number of beneficiary households and/or the sums of money received. An example, relevant for Viet Nam, is section 7 of the community questionnaire of the Transport Project impact study. 1C.6 Community Activities This module aims to provide an overview of social and political events and activities in the community (note that economic events and activities, including markets, are covered in the indirect effects modules). The increased mobility and communication from roads may well have measurable social capital effects on communities, and this module aims to capture this. This module is the community complement to household survey module 1B.6 which captured household participation in community affairs. There are three main topics:
Ø Cross-community social and political events Ø Density of community or political organizations Ø Involvement of the community in road maintenance
The module draws in part on the Social Capital Assessment Tool for the first two topics. A detailed module on road maintenance is presented by Ghee (2000).

83
1. In the past year, has this community organized a social or religious festival jointly
with other communities? 1 Yes (specify nature of event: ____________________________) 2 No 2. In the past year, has this community organized a political event jointly with other
communities? 1 Yes (specify nature of event: ____________________________) 2 No 3. When this community organizes a social or religious festival, how many people
approximately attend from other communities? ____________ 4. When this community organizes a political event, how many people
approximately attend from other communities? ____________ 5. Do the current road conditions make it difficult for people from other
communities to participate in these events? 1 Very difficult 2 Somewhat difficult 3 Not difficult at all 6. How many times in the past year did the leaders of this community meet with
leaders of neighboring communities? ______ times 7. How many times in the past year did the leaders of this community travel outside
the community as part of their responsibilities? ______ times

84
8. How many times in the past year were the leaders of this community visited by
district government officials? ______ times 9. How many associations of the following type exist in this community?
a. Farmer/fisherman group b. Cooperative c. Trader/professional association d. Credit/finance group e. Water or waste management group f. Forestry management group g. Religious group h. Cultural association i. Political association j. Youth group k. Women’s group l. PTA/school committee m. Health group n. Sports group o. Other group or association
10. How many of these groups are active in road maintenance? ____________ 11. Are there any groups that were created specifically for the purpose of road
maintenance? 1 Yes name of group(s) year created _________________________________ ____________ _________________________________ ____________ _________________________________ ____________ 2 No

85
12. Who has the main responsibility for road maintenance in this community? 1 Central ministry 2 District/provincial authorities 3 Private company who uses the road 4 This community 5 Other (specify _____________________________________) 13. How is the community road presently maintained? 1 Central government 2 District/provincial government 3 Private company 4 Community government 5 Community labor group 6 Individual labor 7 Combination (specify ____________________________________) 14. What proportion of this community’s population is actively involved in road
maintenance? ____________% 15. How do people contribute to road maintenance? Estimate value or percentage
contribution. Value % 1. By providing cash
2. By contribution in-kind (wood, animals, land, guest house, food, gravel, sand)
3. Other (specify ________________________)
16. In view of the current road situation, is it difficult for the leaders of this
community to bring people together to maintain the roads? 1 Very difficult 2 Somewhat difficult 3 Not difficult at all
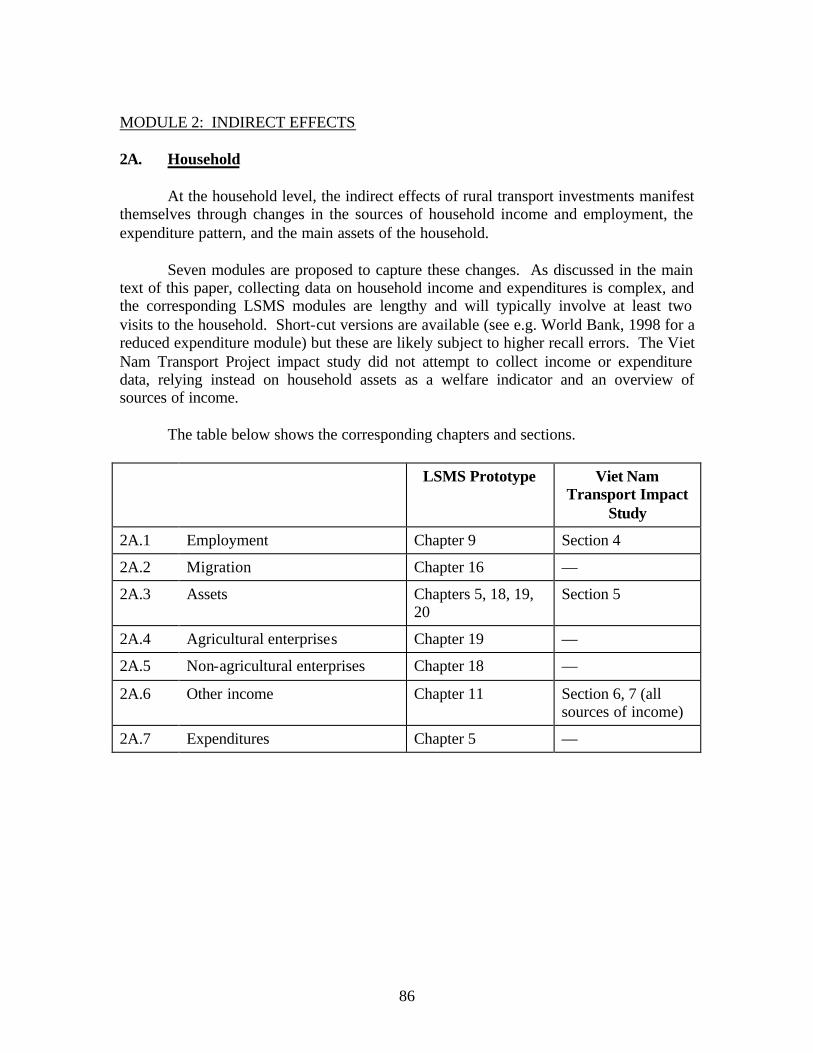
86
MODULE 2: INDIRECT EFFECTS 2A. Household At the household level, the indirect effects of rural transport investments manifest themselves through changes in the sources of household income and employment, the expenditure pattern, and the main assets of the household. Seven modules are proposed to capture these changes. As discussed in the main text of this paper, collecting data on household income and expenditures is complex, and the corresponding LSMS modules are lengthy and will typically involve at least two visits to the household. Short-cut versions are available (see e.g. World Bank, 1998 for a reduced expenditure module) but these are likely subject to higher recall errors. The Viet Nam Transport Project impact study did not attempt to collect income or expenditure data, relying instead on household assets as a welfare indicator and an overview of sources of income. The table below shows the corresponding chapters and sections.
LSMS Prototype Viet Nam Transport Impact
Study
2A.1 Employment Chapter 9 Section 4
2A.2 Migration Chapter 16 —
2A.3 Assets Chapters 5, 18, 19, 20
Section 5
2A.4 Agricultural enterprises Chapter 19 —
2A.5 Non-agricultural enterprises Chapter 18 —
2A.6 Other income Chapter 11 Section 6, 7 (all sources of income)
2A.7 Expenditures Chapter 5 —

87
2B. Community 2B.1 Economic Activities This module adds the economic dimension to the general community characteristics obtained under module 1C.1 of the direct effects. It covers the main economic activities and resources of the community, and thus complements the household- level economic data gathered in modules 2A1 to 2A7. Chapter 13 of the LSMS prototype questionnaire and section 3 of the community questionnaire of the Viet Nam Transport impact study are good examples. 2B.2 Markets The effect of road projects on accessibility of markets is a critical factor in bringing about changes in the pattern and level of income. It is thus important to obtain information on the frequency and type of markets. This is to be combined with the data on trips to and from markets obtained in the origin-destination survey and the transporter survey (modules 1A.2 and 1A.4). Chapter 13 (section 3) of the LSMS prototype questionnaire and section 2(17) of the Viet Nam Transport study community questionnaire contain suitable modules. 2B.3 Migration The objective of this module is to record prevailing in and outmigration patterns, which may be affected by road construction or improvement. This supplements the household migration information obtained in module 2A.2. The LSMS questionnaire does not contain a migration module at the community level, but a suitable module is in sections 3(31) and 3(32) of the community questionnaire of the Viet Nam Transport project impact study.

88
2B.4 Prices The changes in transport costs brought about by road projects are likely to affect prices of tradable goods. A price module thus rounds out the community modules to capture indirect effects of road projects. The list of products for which prices need to be obtained will obviously be location-specific, but good examples of price questionnaires are in chapter 13 of the LSMS prototype questionnaire and section 10 of the community questionnaire of the Viet Nam Transport Project impact study.

89
Gracie M. Ochieng L:\enbaks\WORDFILE\CHRIS\Cross Support \Socioecon Impact Assessment of Rural Roads (12-14-2001).doc December 14, 2001 2:26 PM