sodium phosphate listing background - … phosphate listing background document for the inorganic...
TRANSCRIPT


SODIUM PHOSPHATE LISTING BACKGROUNDDOCUMENT
FORTHE INORGANIC CHEMICAL
LISTING DETERMINATION
This Document Contains No Confidential Business Information
August, 2000
U.S. ENVIRONMENTAL PROTECTION AGENCYARIEL RIOS BUILDING1200 PENNSYLVANIA AVENUE, N.W.WASHINGTON, D.C. 20460

Inorganic Listing Determination Contains No Confidential Business Information Sodium PhosphateListing Background Document August, 2000ii
TABLE OF CONTENTS
1. SECTOR OVERVIEW . . . . . . . . . . . . . . . . . . . . . . . . . . . . . . . . . . . . . . . . . . . . . . . . . . . . 11.1 SECTOR DEFINITION, FACILITY NAMES AND LOCATIONS . . . . . . . . . . . 11.2 PRODUCTS, PRODUCT USAGE AND MARKETS . . . . . . . . . . . . . . . . . . . . . . 11.3 PRODUCTION CAPACITY . . . . . . . . . . . . . . . . . . . . . . . . . . . . . . . . . . . . . . . . . 4
2. DESCRIPTION OF MANUFACTURING PROCESS . . . . . . . . . . . . . . . . . . . . . . . . . . . 4
3. WASTE GENERATION AND MANAGEMENT . . . . . . . . . . . . . . . . . . . . . . . . . . . . . . . 83.1 SUMMARY OF WASTE GENERATION PROCESSES . . . . . . . . . . . . . . . . . . . 8
3.1.1 Filter Press Cakes . . . . . . . . . . . . . . . . . . . . . . . . . . . . . . . . . . . . . . . . . . . . 93.2.2 Mix Area Filters . . . . . . . . . . . . . . . . . . . . . . . . . . . . . . . . . . . . . . . . . . . . . 123.2.3 Dust Collector Bags . . . . . . . . . . . . . . . . . . . . . . . . . . . . . . . . . . . . . . . . . 123.2.4 Scrubber Waters and Effluents . . . . . . . . . . . . . . . . . . . . . . . . . . . . . . . . . . 153.2.5 Product Dust . . . . . . . . . . . . . . . . . . . . . . . . . . . . . . . . . . . . . . . . . . . . . . . 163.2.6 Off-specification Product . . . . . . . . . . . . . . . . . . . . . . . . . . . . . . . . . . . . . . 17
3.2 WASTES OUTSIDE THE SCOPE OF THE CONSENT DECREE . . . . . . . . . . . 183.2.1 In process recycled materials . . . . . . . . . . . . . . . . . . . . . . . . . . . . . . . . . . . 183.2.2 Refractory Brick . . . . . . . . . . . . . . . . . . . . . . . . . . . . . . . . . . . . . . . . . . . . 19
Appendix A: Summary of Waste Generation and ManagementAppendix B: Record Sampling Analytical Data Reports
Attachment 1: Glossary of Data Qualifier CodesAttachment 2: List of AcronymsAttachment 3: Data Validation Worksheet

Inorganic Listing Determination Contains No Confidential Business Information Sodium PhosphateListing Background Document August, 2000iii
LIST OF TABLES
Table 1.1 Sodium Phosphate Producers . . . . . . . . . . . . . . . . . . . . . . . . . . . . . . . . . . . . . . . . . . . . . 1Table 3.1 Wastes Generated from the Production of Sodium Phosphate . . . . . . . . . . . . . . . . . . . . . 8Table 3.2 Waste Management Summary for Filter Press Cakes . . . . . . . . . . . . . . . . . . . . . . . . . . . . 9Table 3.3 Record Samples, Filter Press Cakes . . . . . . . . . . . . . . . . . . . . . . . . . . . . . . . . . . . . . . . 10Table 3.4 Waste Characterization for Filter Press Cakes . . . . . . . . . . . . . . . . . . . . . . . . . . . . . . . . 10Table 3.5 Waste Management Summary for Mix Area Filter . . . . . . . . . . . . . . . . . . . . . . . . . . . . . 12Table 3.6 Waste Management Summary for Dust Collector Bags . . . . . . . . . . . . . . . . . . . . . . . . . 13Table 3.7 Record Samples, Dust Collector Bags . . . . . . . . . . . . . . . . . . . . . . . . . . . . . . . . . . . . . . 13Table 3.8 Waste Characterization for Dust Collector Bags . . . . . . . . . . . . . . . . . . . . . . . . . . . . . . . 14Table 3.9 Waste Management Summary for Scrubber Waters and Effluents . . . . . . . . . . . . . . . . . 16Table 3.10 Waste Management Summary for Product Dust . . . . . . . . . . . . . . . . . . . . . . . . . . . . . . 17Table 3.11 Waste Management Summary for Off-specification Product . . . . . . . . . . . . . . . . . . . . . 18
LIST OF FIGURES
Figure 1.1 Geographical Distribution of Sodium Phosphate Producers . . . . . . . . . . . . . . . . . . . . . . . 3Figure 2.1 Process Flow Diagram for the Production of Sodium Phosphate . . . . . . . . . . . . . . . . . . . 7

1 Environmental Protection Agency, RCRA 3007, Survey of Inorganic Chemicals Industry
2www.chemistry.co.nz/deterg_inorganic.htm
Inorganic Listing Determination Contains No Confidential Business Information Sodium PhosphateListing Background Document August, 20001
1. SECTOR OVERVIEW
1.1 SECTOR DEFINITION, FACILITY NAMES AND LOCATIONS
Currently two manufacturing companies at four locations in the United States produce sodiumphosphate from wet process phosphoric acid. Table 1.1 presents the name and location of theseproducers.1 Figure 1.1 shows the geographical location of facilities presented in Table 1.1. Thenumbers on the map correspond to the facility number in Table 1.1.
Table 1.1 Sodium Phosphate Producers
Facility Name Facility Location
1. Rhodia Inc. - Waterway Chicago, IL
2. Rhodia Inc. - Chicago Heights Chicago Heights, IL
3. Solutia Inc. - Augusta Augusta, GA
4. Solutia Inc. - Carondelet St. Louis, MO
1.2 PRODUCTS, PRODUCT USAGE AND MARKETS
Sodium phosphate is the general chemical name for a wide variety of salts produced from the reactionof phosphoric acid with sodium hydroxide or sodium carbonate. These salts can be divided into twoclasses: orthophosphates and complex phosphates.2
Chemical analysis predicts three salts resulting from the successive neutralization of the acidic protons ofthe phosphate group with sodium hydroxide or sodium carbonate. These salts are: monosodiumdihydrogen phosphate (H2NaPO4), disodium monohydrogen phosphate or sodium orthophosphate(HNa2PO4), and trisodium phosphate (Na3PO4). Each of these salts is produced commercially in theanhydrous state, although disodium monohydrogen phosphate and trisodium phosphate are alsoproduced commercially as hydrates.
Monosodium dihydrogen phosphate is used as a water soluble solid acid, as a pH buffer for acidiccleaners, as a boiler water precipitant for polyvalent metal ions and as a livestock feed supplement. Disodium monohydrogen phosphate is used in consumer products, as a buffer in food ingredients, incheese and milk processing, in instant pudding mixes, in animal feed and in chemical processing. Trisodium phosphate is used in automatic dishwashing detergents, as an alkaline source for metalcleaner, as a standard pH buffer, and as an alkaline pH bleaching agent.

3Http://www.solutia.com/Investor/WorldwideLocations/STlCarondelet.html
4Ibid
5 Http://www.scorecard.org/chemical-profiles/
6Kirk, R.E. and Othmer, D.F. (1982). Encyclopedia of Chemical Technology. (Vol.17, p.456) New York: John Wiley & Sons.
7Http://www.solutia.com/Products/SHexametaphosphate.html
Inorganic Listing Determination Contains No Confidential Business Information Sodium PhosphateListing Background Document August, 20002
Sodium tripolyphosphate (Na5O10P3) is used as a buffering agent, a flavor enhancer in meats, seafoodand poultry, a dispersing agent and a protein modifier. It can be found in detergents, cheeses, creams,canned vegetables, meats, seafood, poultry, metal cleaners and water treatment products.3
Sodium hexametaphosphate (Na6O18P6) is used as a flame retardant with textiles, as an emulsifier forcheese, in synthetic dairy products and in tanning of hides.4
Industries that produce corrosion inhibitors, the electroplating industry, chemical laboratories, facilitiesthat produce metal degreasing products, facilities that produce pH adjusting agents, and the pulp andpaper manufacturing industry use sodium phosphates in their products.5
Sodium tripolyphosphate is produced by the thermal dehydration of phosphate salts containing thecorrect sodium to phosphorus ratio.6 Both hydrous and anhydrous forms exist. Sodium hexametaphosphate is a glassy, amorphous sodium polyphosphate with a Na2O/P2O5 molarratio of approximately 1:1.7

Inorganic Listing Determination Contains No Confidential Business Information Sodium PhosphateListing Background Document August, 20003
Figure 1.1 Geographical Distribution of Sodium Phosphate Producers 1
ì í
ï
î
1 See Table 1.1 for facility name and location.

Inorganic Listing Determination Contains No Confidential Business Information Sodium PhosphateListing Background Document August, 20004
1.3 PRODUCTION CAPACITY
No production or capacity quantities that were not CBI could be located for the sodium phosphatesector.
2. DESCRIPTION OF MANUFACTURING PROCESS
This section provides the general process description for the production of sodium phosphate from wetprocess phosphoric acid. The processes for monosodium dihydrogen phosphate, disodiummonohydrogen phosphate and trisodium phosphate are similar except for the ratio of phosphoric acid tosoda ash at the reactor stage and the type, size and construction of the crystallizing and dryingequipment. Figure 2.1 is a general process flow diagram for the production of sodium phosphate fromwet process phosphoric acid and may not account for specific process variations.
Initial Reaction
Sodium phosphate salts are produced by an acid base reaction between phosphoric acid and sodiumhydroxide or soda ash (sodium carbonate) in a reactor. Two of the facilities, Solutia-Augusta andSolutia-Carondelet add potassium hydroxide and sodium chlorate to the initial reaction mixture. Thepotassium hydroxide is added to stabilize the crystallization process that occurs later in the productionprocess and the sodium chlorate is added as a bleach.
Overall reactions:
a) 2H3PO4 + 3Na2CO3 6 2Na3PO4 + 3H2CO3
b) H3PO4 +3NaOH 6 Na3PO4 + 3H2O
Phosphoric acid used in the production of sodium phosphate is manufactured offsite by outsidesuppliers using the wet phosphoric acid process. If the plant is manufacturing food grade phosphatesthen the phosphoric acid is food grade quality, with arsenic levels below 1.0 ppm. At two of thefacilities, Rhodia-Chicago Heights and Rhodia-Waterway, the sodium carbonate used in the process ismanufactured offsite through the crystallization/purification process of mined Trona. The sodiumhydroxide is purchased commercially.
The product that results from the initial reaction depends upon the sodium/phosphate ratio present in thereaction mixture. Three of the facilities, Solutia-Augusta, Solutia-Carondelet and Rhodia-ChicagoHeights, report the product as trisodium phosphate (Na3PO4) or disodium monohydrogen phosphate(HNa2PO4) feed liquor. At Rhodia-Waterway, the initial reaction produces a mixture of monosodiumdihydrogen phosphate (H2NaPO4) and disodium monohydrogen phosphate.
Processing of initial reaction solution to produce the desired product
At Rhodia-Waterway, the reactor vents through a scrubber. The scrubbing waters are discharged to a

Inorganic Listing Determination Contains No Confidential Business Information Sodium PhosphateListing Background Document August, 20005
publicly-owned treatment works (POTW). These wastewaters are a portion of the scrubber watersand effluents wastestream. The reactor generates residues which are sent to the furnace or to a sewerline which discharges to a POTW. These residues are mixed with scrubber waters and are a portion ofthe scrubber waters and effluents wastestream. At Rhodia-Chicago Heights, the reaction solution isfiltered to remove any precipitated solids. This generates a portion of the filter press cakeswastestream. The filtrate contains a mixture of monosodium/disodium liquor which is used as the feedliquor for all three processes that occur at the facility.
Final product
The next steps in the sodium phosphate production process are determined by the desired finalproducts.
• Monosodium dihydrogen phosphate process (H2NaPO4)
At Rhodia-Chicago Heights, phosphoric acid is added to the feed liquor to adjust thesodium/phosphate ratio, producing a monosodium dihydrogen phosphate solution. The monosodiumphosphate solution passes through a polishing filter to remove any precipitated solids as well as rust anddirt. This filtering step generates a portion of the filter press cakes wastestream.
The liquid monosodium dihydrogen phosphate product is shipped to customers via tanker truck orrailcar.
• Disodium monohydrogen and trisodium phosphate processes (HNa2PO4 and Na3PO4)
At Rhodia-Chicago Heights, if the requested products are disodium monohydrogen or trisodiumphosphate, the feed liquor is mixed with varying amounts of sodium hydroxide to produce the correctratio of sodium/phosphate. After the ratio correction step, the disodium monohydrogen and trisodiumphosphate streams are filtered. This generates a portion of the filter press cakes wastestream.
• Sodium hexametaphosphate process (Na6O18P6)
At Rhodia-Waterway, the product from the initial reaction mixture is fed to a furnace which melts themix and converts it to sodium hexametaphosphate. The furnace is cleaned out on a periodic basis,generating a portion of the refractory material wastestream.
• Sodium tripolyphosphate process (Na5O10P3)
At Rhodia-Waterway, the product from the initial reaction mixture is fed to a converter, that changes itto sodium tripolyphosphate. The converter is cleaned out on a periodic basis, generating a portion ofthe refractory material wastestream.
At Solutia-Augusta and Solutia-Carondelet, the reaction mixture is allowed to overflow into tankswhere acid is added until the correct pH is reached. A pH of approximately 8.5 produces disodium

Inorganic Listing Determination Contains No Confidential Business Information Sodium PhosphateListing Background Document August, 20006
monohydrogen phosphate, and a pH of approximately 10 produces trisodium phosphate. The resultingproducts are filtered, generating the mix area filters wastestream. The product is fed into a calciner. The non-regulated gases from the calciner are vented to the atmosphere. The calciner is cleaned out ona periodic basis, generating a portion of the refractory material wastestream. Sodium tripolyphosphateis produced.
Packaging and Sizing
• Disodium monohydrogen and trisodium phosphate
At Rhodia-Chicago Heights, the disodium monohydrogen and trisodium phosphate liquor is sent tocrystallizers after filtration. The vapors and gases from the crystallizers are scrubbed, and the scrubberwaters are returned to the reactors. These scrubber waters are a portion of the scrubber wastewaterwastestream. Dust from the dryers is collected in a dust collection system, mixed with water andreturned to the mixing reactor. Similarly, dust from the packaging of the finished product is returned tothe mixing reactor. The dust collector bags are a portion of the dust collector bags wastestream.
• Sodium hexametaphosphate
At Rhodia-Waterway, the mix leaving the furnace is air cooled and sent to a reformer for sizing andblending. The air from the cooler goes to a scrubber, and the scrubber water is a portion of thescrubber wastewaters and effluents wastestream. The product is sized to granular, crushed orpowdered form in the reformer. The dust from the reformer goes to a scrubber, and the scrubberwaters are a portion of the scrubber wastewaters and effluents wastestream.
• Sodium tripolyphosphate
At Rhodia-Waterway, the sodium tripolyphosphate product leaves the converter and is cooled, sized,stored and packaged for shipment. Three dust collectors are associated with the sizing, storage andpackaging operations. The dust from the sizing operation and the dust from the truck loading operationare returned to the process. The dust from the blending and bagging operations is collected anddisposed of as a portion of the off-spec product wastestream. The dust collector bags are a portion ofthe dust collector bags wastestream.
At Solutia-Augusta and Solutia-Carondelet, the product leaves the calciner, is cooled and is conveyedto the appropriate system for milling to a granular or powder form. The fines from this process arerecycled back into the process. The granular and powder mills have a dust collector system whichgenerates a portion of the dust collector bags wastestream. The ground product moves to thepackaging area. A dust collection system returns collected product to the process. Dust collectionbags are generated at this point in the process and are a portion of the dust collector bags wastestream.
Occasionally, off-spec product is produced. This wastestream is produced when the product hasexceeded its shelf life or the sizing of the particles does not meet customer specifications. Off-spec

Inorganic Listing Determination Contains No Confidential Business Information Sodium PhosphateListing Background Document August, 20007
product is a portion of the off-spec product wastestream.

Inorganic Listing Determination Contains No Confidential Business Information Sodium PhosphateListing Background Document August, 20008
Scrubber
Reactor Furnace
Scrubber
SizingStorage
Packaging
Soda Ash
H3PO4
Non-regulatedGas Vented toAtmosphere
ScrubberWater toPOTW
ScrubberWater toPOTW
RefractoryCleanout
Filter
Filter PressCake
DustCollectors
Dust CollectorBags
Off-SpecProduct
Product
Product Dust
Mix AreaFilters
Non-regulatedGas Vented toAtmosphere
Figure 2.1 Process Flow Diagram for the Production of Sodium Phosphate

Inorganic Listing Determination Contains No Confidential Business Information Sodium PhosphateListing Background Document August, 20009
3. WASTE GENERATION AND MANAGEMENT
Section 3.1 presents a detailed discussion of the production steps that generate the wastestream, thefinal management steps for the wastestream, a characterization of the physical and chemical propertiesof the wastestream and the results of the initial risk screening analyses. Section 3.2 discusses wastesreported by the facilities, in the RCRA §3007 questionnaire, that are outside the scope of the ConsentDecree. Appendix A presents a complete summary of the wastestreams generated at each of thefacilities in the sodium phosphate sector, the volume of the wastestreams generated in metric tons peryear (MT/yr), and the associated final management step.
3.1 SUMMARY OF WASTE GENERATION PROCESSES
The wastes generated from the production of sodium phosphate salts consists of filter press cakes, mixarea filters, dust collector bags, scrubber waters and effluents, product dust, and off-spec product. These wastestreams are nonhazardous.
The scrubber waters and effluents wastestreams generated at the facilities are managed in a tank, pHadjusted, filtered and discharged to a POTW. For those scenarios where wastes are managed in atank, the impervious nature of the construction materials (concrete, fiberglass, or steel) of the tanks isunlikely to result in releases to groundwater in all but the most catastrophic scenarios. We also are notconcerned with potential air releases from these tanks as neither volatile contaminants nor airborneparticulates are likely to be present in these aqueous wastes. Therefore, we did not evaluate thesewastes further. For those scenarios where wastes are discharged via the facility’s common sewage lineto permitted publicly-owned treatment works (POTW), these wastes are excluded from the ResourceConservation and Recovery Act ( RCRA) (40 CFR 261.4(a)(1)(ii)).
Table 3.1 presents a summary of wastestreams generated by facility as reported in their RCRA §3007 questionnaire and in the follow-up responses to the questionnaire .
Table 3.1 Wastes Generated from the Production of Sodium Phosphate
Facilities FilterPress
Cakes
Mix AreaFilters
DustCollector
Bags
ScrubberWaters
andEffluents
ProductDust
Off-specProduct
Rhodia -Chicago Heights
x x x x x
Rhodia -Waterway
x x x x
Solutia -Augusta
x x x
Solutia -Carondelet
x x

Inorganic Listing Determination Contains No Confidential Business Information Sodium PhosphateListing Background Document August, 200010
3.1.1 Filter Press Cakes Waste Generation
Only one facility, Rhodia-Chicago Heights, reported generating filter press cakes. This wastestream isgenerated at three points in the production process producing four filter cakes as impurities are filteredout of the phosphate liquor.
• The solution from the initial reaction of phosphoric acid, soda ash and caustic is filtered,generating a filter cake and a monosodium/disodium phosphate liquor (H2NaPO4/HNa2PO4).
• The monosodium phosphate from the initial reaction passes through a polishing filter generatinga second filter press cake, consisting of precipitated solids, rust and dirt, that is removed atthis point in the process.
• The sodium to phosphate ratio in the initial monosodium phosphate liquor is adjusted withcaustic to make disodium (Na2HPO4) and trisodium phosphate (Na3PO4). After the disodiumand trisodium phosphates are formed, the solution is filtered twice more generating twoadditional filter cakes. One of the filter cakes is redissolved into a solution and returned to thereaction process and the second is collected for disposal.
The facilities generated process filter press cake at the rate of 10 to 74 MT/yr in 1998.
Waste Management
Filter press cakes are managed by recycling back to the process and by disposal offsite in an industrialSubtitle D landfill. Table 3.2 presents the residuals that contribute to this wastestream and the totalvolume that is disposed of in each management unit. The residuals listed in Table 3.2 are the individualwaste components that contribute to the wastestream.
Table 3.2 Waste Management Summary for Filter Press Cakes
Final Management # of Wastestreamswith Reported Volumes
Total Volume(MT/yr)
Recycled back to process 1 12
Offsite industrial Subtitle D landfill 3 108
Waste Characterization
Two sources of residual characterization data were developed during the industry study:
Inorganic Listing Determination Contains No Confidential Business Information Sodium PhosphateListing Background Document August, 200011
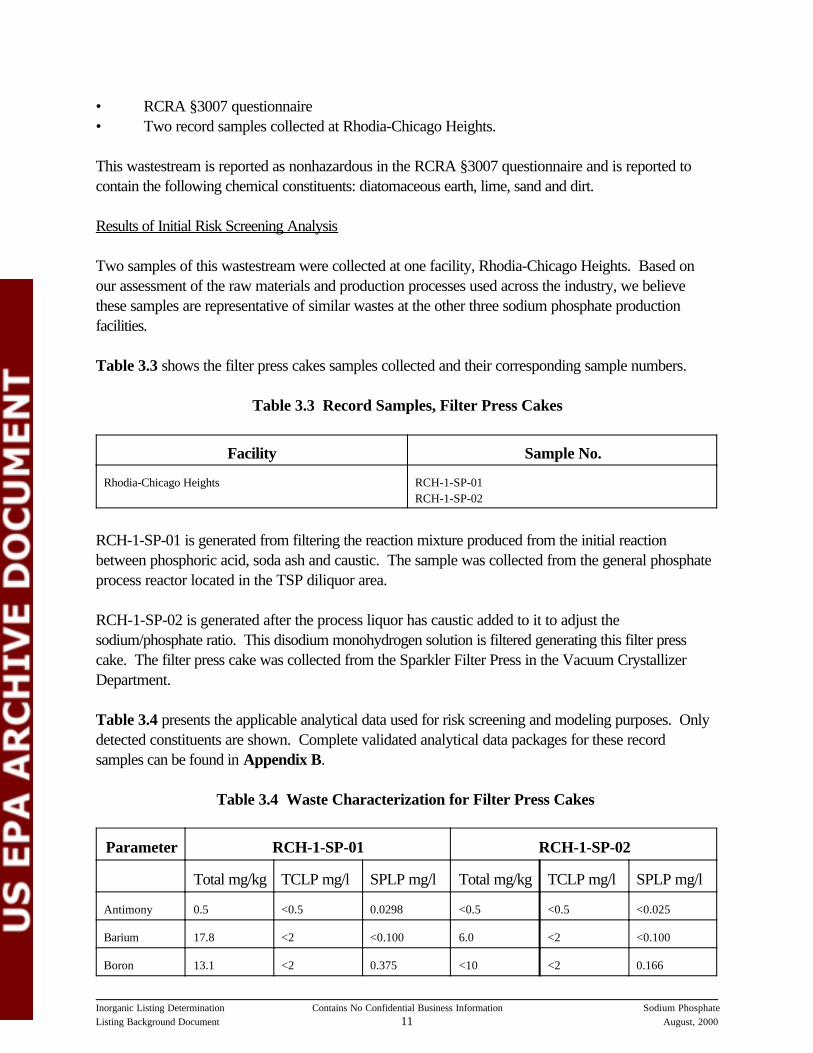
• RCRA §3007 questionnaire• Two record samples collected at Rhodia-Chicago Heights.
This wastestream is reported as nonhazardous in the RCRA §3007 questionnaire and is reported tocontain the following chemical constituents: diatomaceous earth, lime, sand and dirt.
Results of Initial Risk Screening Analysis
Two samples of this wastestream were collected at one facility, Rhodia-Chicago Heights. Based onour assessment of the raw materials and production processes used across the industry, we believethese samples are representative of similar wastes at the other three sodium phosphate productionfacilities.
Table 3.3 shows the filter press cakes samples collected and their corresponding sample numbers.
Table 3.3 Record Samples, Filter Press Cakes
Facility Sample No.
Rhodia-Chicago Heights RCH-1-SP-01RCH-1-SP-02
RCH-1-SP-01 is generated from filtering the reaction mixture produced from the initial reactionbetween phosphoric acid, soda ash and caustic. The sample was collected from the general phosphateprocess reactor located in the TSP diliquor area.
RCH-1-SP-02 is generated after the process liquor has caustic added to it to adjust thesodium/phosphate ratio. This disodium monohydrogen solution is filtered generating this filter presscake. The filter press cake was collected from the Sparkler Filter Press in the Vacuum CrystallizerDepartment.
Table 3.4 presents the applicable analytical data used for risk screening and modeling purposes. Onlydetected constituents are shown. Complete validated analytical data packages for these recordsamples can be found in Appendix B.
Table 3.4 Waste Characterization for Filter Press Cakes
Parameter RCH-1-SP-01 RCH-1-SP-02
Total mg/kg TCLP mg/l SPLP mg/l Total mg/kg TCLP mg/l SPLP mg/l
Antimony 0.5 <0.5 0.0298 <0.5 <0.5 <0.025
Barium 17.8 <2 <0.100 6.0 <2 <0.100
Boron 13.1 <2 0.375 <10 <2 0.166

Parameter RCH-1-SP-01 RCH-1-SP-02
Total mg/kg TCLP mg/l SPLP mg/l Total mg/kg TCLP mg/l SPLP mg/l
1The sample was analyzed in duplicate; the duplicate result for TCLP lead was 0.007 mg/L (<0.5 mg/L)
Inorganic Listing Determination Contains No Confidential Business Information Sodium PhosphateListing Background Document August, 200012
Cadmium 6.5 <0.05 <0.005 6.1 <0.05 <0.005
Calcium 25100 18.9 3.32 20800 55.5 1.340
Chromium 111 0.2 0.171 90.8 0.075 0.0222
Cobalt 1.2 <0.05 <0.005 0.8 <0.05 <0.005
Copper 3.6 <0.25 0.0060 1.9 <0.25 0.0035
Iron 3320 <1 <0.050 2160 <1 0.0629
Lead 2.4 0.81 <0.005 0.7 <0.5 <0.005
Mercury 6.2 <0.002 <0.0002 4.6 <0.002 <0.0002
Nickel 61.1 0.4 0.0072 42.5 1.0 0.0162
Potassium <100 <10 1.7 <100 <10 1.1
Selenium <0.5 <0.5 0.0084 <0.5 <0.5 <0.005
Sodium 146000 N/A 5310 59200 N/A 812
Thallium <2 <2 0.0055 <2 <2 0.0079
Titanium 61.5 <0.05 <0.005 49.3 <0.05 <0.005
Zinc 10.3 <3 <0.100 5.2 <3 <0.100
Fluoride 325 N/A N/A 58.8 N/A N/A
The initial screen identified antimony and thallium at concentrations above their health-based limits(HBL). The HBL for arsenic is lower than the arsenic detection limit. However, both samples havenon-detect levels for arsenic so no modeling was necessary for arsenic.
Based on the sampling results summarized above, we decided that modeling was necessary for twoconstituents of concern: antimony and thallium. We assessed the off-site, industrial Subtitle D landfillscenario using the hydrogeologic properties associated with the geographic areas where the landfillsreported in the survey are located. Synthetic Precipitation Leaching Procedure (SPLP) results weregiven primary consideration as there is no reported management in municipal landfills (where the TCLPresults would be relevant). The SPLP values from both samples were considered. For antimony, weused one-half of the detection limit for sample RCH-1-SP-02 as the input to the modeling. Regardlessof the type of measurement, if the result of the chemical analysis for a particular compound was belowthe limit of detection but the compound was detected in the waste, then we used ½ the value reportedby the laboratory as the limit of detection for that compound. For a more complete description of thisanalysis, see “Risk Assessment for the Listing Determinations for Inorganic Chemical

Inorganic Listing Determination Contains No Confidential Business Information Sodium PhosphateListing Background Document August, 200013
Manufacturing Wastes” (August 2000) in the docket for this proposed rulemaking.
3.2.2 Mix Area Filters
Waste Generation
Solutia-Augusta reported generating mix area filters. The reaction mixture formed from the initialreaction of phosphoric acid with soda ash, sodium chlorate, sodium or potassium hydroxide and off-spec product is filtered. These filters are changed out periodically, generating the mix area filterswastestream.
Waste Management
This wastestream is managed in an offsite industrial Subtitle D landfill. Table 3.5 presents the finalmanagement step used by the facility for this wastestream.
Table 3.5 Waste Management Summary for Mix Area Filters
Final Management # of Wastestreamswith Reported Volumes
Total Volume (MT/yr)
Offsite industrial Subtitle D landfill 1 0.009
Results of Initial Risk Screening Analysis
Mix area filters were not sampled and did not warrant risk assessment for the following reasons:
C The location of these filters in the process indicates that any contaminants found would besimilar to those of the filter press cakes found at Rhodia-Chicago Heights;
C The volume of this waste is extremely small;C The raw materials used in this process are food-grade products. This fact ensures extremely
low levels of contaminants, such as arsenic.
3.2.3 Dust Collector Bags
Waste Generation
All four facilities generate dust collector bags. At Rhodia-Chicago Heights the dust collector bagsystem consists of a large cylindrical steel cage-like core surrounded by a polyester/acrylic bag withTeflon coating. At other facilities the filter bags are made of polypropylene.
• At Rhodia-Chicago Heights, the wet crystals from the two processes (disodium phosphate andtrisodium phosphate) pass through dryers. Dust from the dryers is collected in a dust collectionsystem.

Inorganic Listing Determination Contains No Confidential Business Information Sodium PhosphateListing Background Document August, 200014
• At Rhodia-Waterway and at the two Solutia facilities, the dust collector bags are located in thesizing, storage and packaging area.
At all four facilities the dust collector bags are changed intermittently as part of normal maintenanceprocedures.
Waste Management
Dust collector bags are disposed offsite in an industrial Subtitle D landfill. Table 3.6 presents the finalmanagement step used by the facilities for this wastestream. The residuals listed in Table 3.6 are theindividual waste components that contribute to the wastestream. At some facilities, more than oneresidual contributes to the same wastestream.
The dust collector bags are generated at various rates from less than .05 MT/yr to 1.12 MT/yr
Table 3.6 Waste Management Summary for Dust Collector Bags
Final Management # of Wastestreamswith Reported Volumes
Total Volume (MT/yr)
Offsite industrial Subtitle D landfill 7 2.1
Waste Characterization
Two sources of residual characterization information were developed during the industry study:
• RCRA §3007 questionnaire• One record sample collected at Rhodia-Chicago Heights.
Results of Initial Risk Screening Analysis
All four facilities characterized this waste as nonhazardous. One sample of this wastestream wascollected. Based on our assessment of the raw materials and production processes used across theindustry, we believe this sample is representative of similar wastes at the other three sodium phosphateproduction facilities. Table 3.7 shows the dust collector bags sample collected and its sample number.
Table 3.7 Record Samples, Dust Collector Bags
Facility Sample No.
Rhodia Inc. - Chicago Heights RCH-1-SP-03

Inorganic Listing Determination Contains No Confidential Business Information Sodium PhosphateListing Background Document August, 200015
RCH-1-SP-03 is generated after the wet crystals from the two processes, disodium monohydrogenphosphate production and trisodium phosphate production pass through dryers. Dust from the dryersis collected in a dust collection system, dissolved and returned to the mixing reactor. The dust collectorbags used in the dust collection system consists of a large cylindrical, steel cage-like core surroundedby a polyester/acrylic bag with Teflon coating. The coating was cut from the core and it was thiscoating that was sampled. We collected one sample of this residual which we believe is representativeof similar wastes at the other three sodium phosphate production facilities.
Table 3.8 presents the applicable analytical data used for risk screening and modeling purposes. Onlydetected constituents are shown. Complete validated analytical data packages for the record samplingtrip can be found in Appendix B.
Table 3.8 Waste Characterization for Dust Collector Bags
Parameter RCH-1-SP-03
Total (mg/kg) TCLP (mg/L) SPLP (mg/L)
Antimony 48.8 <0.5 0.309
Arsenic <0.5 <0.5 0.0064
Barium 12.5 <2 <0.100
Boron 23.0 <2 0.765
Calcium 344 14.1 1.180
Chromium 10.9 0.087 0.0297
Cobalt 2.8 <0.05 <0.005
Copper 6.0 <0.25 0.0496
Iron 740 1.4 0.101
Lead 4.5 <0.5 <0.005
Nickel 4.8 <0.2 0.0077
Potassium <100 <10 2.5
Selenium <0.5 <0.5 0.0091
Sodium 142000 N/A 1640
Titanium 4.3 <0.05 <0.005
Vanadium 0.6 <0.05 0.0084
Zinc 116 <3 <0.100
Fluoride 315 N/A N/A
Antimony and arsenic are the constituents of concern. Because the volume of this waste is relatively

Inorganic Listing Determination Contains No Confidential Business Information Sodium PhosphateListing Background Document August, 200016
small, we first used the de minimis waste quantity screening analysis to screen the potential risk togroundwater associated with landfilling this waste. We found that the SPLP data for arsenic screensout because the waste volume is insufficient to release arsenic at levels of concern.
The detected SPLP levels for antimony did not screen out using the de minimis volume analysis. Weconducted full groundwater modeling for the industrial landfill scenario for this constituent. Weassessed the off-site landfill scenario using the hydrogeologic properties associated with the geographicareas where the landfills reported in the survey are located. For a more complete description of thisanalysis, see “Risk Assessment for the Listing Determinations for Inorganic ChemicalManufacturing Wastes” (August 2000) in the docket for this proposed rulemaking.
3.2.4 Scrubber Waters and Effluents
Waste Generation
Two facilities identified scrubber waters and effluents as a wastestream.
• At Rhodia-Waterway, this wastestream is generated at several points in the sodium phosphateprocess.
S The process starts with a reaction between phosphoric acid and soda ash. The reactorvents through a scrubber generating scrubber waters.
S The initial product mix is fed to a dryer and then into a furnace which melts andconverts the mix to sodium hexametaphosphate. The mix is air cooled and sent to areformer for sizing and blending. The air from the dryer and cooler goes to a scrubbergenerating scrubber waters.
S Depending on customer specifications, the product may be sized to granular, crushed orpowder form in a reformer. The dust from the reformer goes to a scrubber generatingscrubber waters.
• At Rhodia-Chicago Heights, the crystallizers used to crystallize disodium and trisodiumphosphate are vented through scrubbers generating scrubber waters that are recycled back tothe process.
Waste Management
At Rhodia-Waterway, scrubber waters and effluents are stored onsite in a 500 gallon coveredequalization tank that discharges to a POTW. At Rhodia-Chicago Heights, the scrubber waters andeffluents are returned to the reactors. Table 3.9 presents the last management step used by thefacilities for this wastestream. The residuals listed in Table 3.9 are the individual waste components thatcontribute to the wastestream. At some facilities more than one residual contributes to the samewastestream.

Inorganic Listing Determination Contains No Confidential Business Information Sodium PhosphateListing Background Document August, 200017
Table 3.9 Waste Management Summary for Scrubber Waters and Effluents
Final Management # of Wastestreamswith Reported
Volumes
# of Wastestreamswithout Reported
Volumes
Total Volume(MT/yr)
Discharged to POTW 3 32
Recycled back to process 1 NR
NR = not reported in RCRA §3007 questionnaire
Waste Characterization
One source of residual characterization was developed during the industry study, which was the RCRA§3007 questionnaire. This wastestream was reported as nonhazardous. The scrubber waters andeffluents wastestream has a pH of 6 and contains small amounts of the chemical constituents sodiumphosphate and carbonate.
Results of Initial Risk Screening Analysis
Scrubber waters and effluents were not sampled and did not warrant a quantitative risk assessment. We did not evaluate scenarios where these secondary materials are piped back into the productionprocess because there is no potential for exposure. For those scenarios where wastes are managed ina tank, the impervious nature of the construction materials (concrete, fiberglass, or steel) of tanks isunlikely to result in releases to groundwater in all but the most catastrophic scenarios. We also are notconcerned with potential air releases from these tanks as neither volatile contaminants nor airborneparticulates are likely to be present in these aqueous wastes. For those scenarios where scrubberwater and effluents are discharged via the facility’s common sewage line to POTWs, these wastes areexcluded from RCRA (40 CFR 261.4(a)(1)(ii)). Furthermore, these discharges are regulated by theClean Water Act pretreatment standards. They do not warrant listing. We propose not to list thiswaste.
3.2.5 Product Dust
Waste Generation
Two facilities identified product dust as a wastestream. Rhodia-Waterway uses three dust collectors inthe area where the sodium tripolyphosphate product stream is sized, stored, and packaged. Thesodium tripolyphosphate crystals are returned to the sizing, storing and packaging equipment and are

Inorganic Listing Determination Contains No Confidential Business Information Sodium PhosphateListing Background Document August, 200018
part of the final product. In some cases a small fraction of the product has a food-grade organicmaterial added per customer specifications. When this product must be disposed of, it is not recycledback to the process but is disposed of offsite in an industrial Subtitle D landfill.
Rhodia-Chicago Heights takes the dust from the dryers used to dry wet crystals of disodium andtrisodium phosphate, mixes it with water and returns the dust to the mixing reactor. No quantities werereported for this wastestream, and no RINs were assigned.
Waste Management
This wastestream is managed in one of two ways: recycling back into the process or disposal in anoffsite industrial Subtitle D landfill. Table 3.10 presents the final management step used by the facilitiesfor this wastestream. The residuals listed in Table 3.10 are the individual waste components thatcontribute to the wastestream. At one facility more than one residual contributes to the samewastestream.
Table 3.10 Waste Management Summary for Product Dust
Final Management # of Wastestreams withoutReported Volumes
Total Volume (MT/yr)
Recycled back to process 2 NR
Offsite industrial Subtitle D landfill 1 NR
NR = not reported in RCRA §3007 questionnaire
Waste Characterization
One source of residual characterization was developed during the industry study, which was the RCRA§3007 questionnaire. This wastestream was characterized as nonhazardous. No additional informationwas reported.
Results of Initial Risk Screening Analysis
Product dust was not sampled and did not warrant risk assessment. All collected dust that can berecycled is recycled back into the production process. Due to production constraints, some portion ofthis collected product dust cannot be recycled back to the process and is instead sent to an industrialSubtitle D landfill. However, this landfilled product is still food-grade product. Because this “waste” is,in fact, food-grade product, we believe it unlikely that it contains any constituent exceeding health-based limits based on ingestion. Therefore, we propose not to list this waste.
3.2.6 Off-specification Product
Waste Generation
Inorganic Listing Determination Contains No Confidential Business Information Sodium PhosphateListing Background Document August, 200019
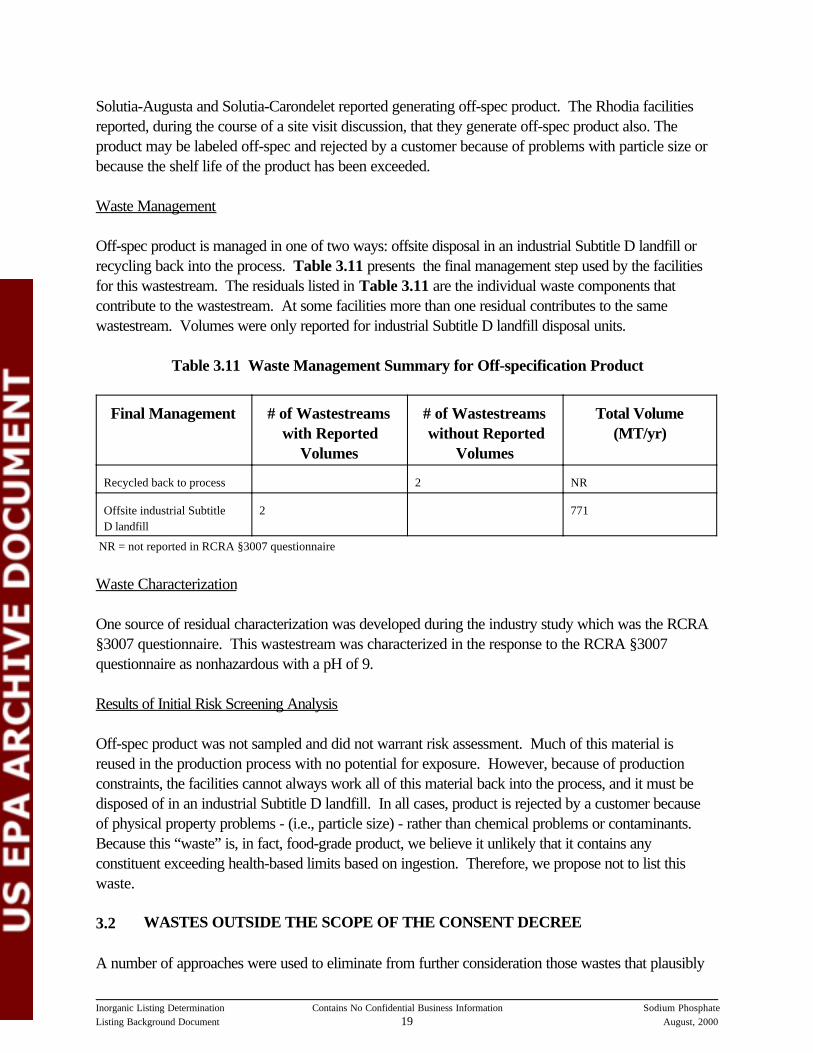
Solutia-Augusta and Solutia-Carondelet reported generating off-spec product. The Rhodia facilitiesreported, during the course of a site visit discussion, that they generate off-spec product also. Theproduct may be labeled off-spec and rejected by a customer because of problems with particle size orbecause the shelf life of the product has been exceeded.
Waste Management
Off-spec product is managed in one of two ways: offsite disposal in an industrial Subtitle D landfill orrecycling back into the process. Table 3.11 presents the final management step used by the facilitiesfor this wastestream. The residuals listed in Table 3.11 are the individual waste components thatcontribute to the wastestream. At some facilities more than one residual contributes to the samewastestream. Volumes were only reported for industrial Subtitle D landfill disposal units.
Table 3.11 Waste Management Summary for Off-specification Product
Final Management # of Wastestreamswith Reported
Volumes
# of Wastestreamswithout Reported
Volumes
Total Volume(MT/yr)
Recycled back to process 2 NR
Offsite industrial SubtitleD landfill
2 771
NR = not reported in RCRA §3007 questionnaire
Waste Characterization
One source of residual characterization was developed during the industry study which was the RCRA§3007 questionnaire. This wastestream was characterized in the response to the RCRA §3007questionnaire as nonhazardous with a pH of 9.
Results of Initial Risk Screening Analysis
Off-spec product was not sampled and did not warrant risk assessment. Much of this material isreused in the production process with no potential for exposure. However, because of productionconstraints, the facilities cannot always work all of this material back into the process, and it must bedisposed of in an industrial Subtitle D landfill. In all cases, product is rejected by a customer becauseof physical property problems - (i.e., particle size) - rather than chemical problems or contaminants. Because this “waste” is, in fact, food-grade product, we believe it unlikely that it contains anyconstituent exceeding health-based limits based on ingestion. Therefore, we propose not to list thiswaste.
3.2 WASTES OUTSIDE THE SCOPE OF THE CONSENT DECREE
A number of approaches were used to eliminate from further consideration those wastes that plausibly
Inorganic Listing Determination Contains No Confidential Business Information Sodium PhosphateListing Background Document August, 200020
could not pose a risk, and to identify wastes and chemical constituents that did require furtherassessment. The sodium phosphate sector has two categories of wastes that did not merit furtherassessment. These were in process recycled materials and refractory brick. These wastes aredescribed in Sections 3.2.1 and 3.2.2.
3.2.1 In process recycled materials
Some facilities reported managing the same wastestream either by recycling back into the process or bydisposal offsite in industrial Subtitle D landfills. For those scenarios where wastes are sent to industrialSubtitle D landfills, we performed a risk assessment to help us determine whether these risks warrantedlisting. For those scenarios where secondary materials (filter press cakes, product dust, off-specproduct, and scrubber water) are piped back to the production process, we could identify no potentialroute for significant exposure prior to reuse. In addition, we evaluated all wastes generated afterreinsertion of these materials into the process and we do not believe that these secondary materialspresent significant threats. Also, off-specification product, when reinserted without reclamation into theprocess from where it originated, is not a solid waste.
3.2.2 Refractory Brick
EPA does not consider plant component materials to fall within the scope of the consent decree. Twofacilities in the sodium phosphate sector reported generating refractory brick. EPA considers thismaterial to be a structural component of the plant where production takes place rather than a wastefrom the “production” of an inorganic chemical. Refractory brick is outside the scope of the ConsentDecree and will not be evaluated further.

APPENDIX A
Summary of Waste Generation and Management

Inorganic Listing Determination Contains No Confidential Business Information Sodium PhosphateListing Background Document August, 20001
Wastestreams Facility Waste Volume(MT/yr)
Final WasteManagement Step
Filter Press Cakes Rhodia-Chicago Heights 108 Offsite industrial SubtitleD landfill
12 Recycled back to process
Rhodia-Waterway NR NR
Solutia-Augusta NR NR
Solutia-Carondelet Plant NR NR
NR = not reported in RCRA §3007 questionnaire
Wastestreams Facility Waste Volume(MT/yr)
Final WasteManagement Step
Mix area filters Rhodia-Chicago Heights NR NR
Rhodia-Waterway NR NR
Solutia-Augusta 0.009 Offsite industrial SubtitleD landfill
Solutia-Carondelet NR NR
NR = not reported in RCRA §3007 questionnaire
Wastestreams Facility Waste Volume(MT/yr)
Final WasteManagement Step
Dust collector bags Rhodia-Chicago Heights 1.12 Offsite industrial Subtitle Dlandfill
Rhodia-Waterway 0.28 Offsite industrial Subtitle Dlandfill
Solutia-Augusta 0.7 Offsite industrial Subtitle Dlandfill
Solutia-Carondelet 0.05 Offsite industrial Subtitle Dlandfill

Inorganic Listing Determination Contains No Confidential Business Information Sodium PhosphateListing Background Document August, 20002
Wastestreams Facility Waste Volume(MT/yr)
Final WasteManagement Step
Scrubber waters andeffluents
Rhodia-Chicago Heights NR Recycled back to process
Rhodia-Waterway 32 Discharge to POTW
Solutia-Augusta NR NR
Solutia-Carondelet NR NR
NR = not reported in RCRA §3007 questionnaire
Wastestreams Facility Waste Volume(MT/yr)
Final WasteManagement Step
Product dust Rhodia-Chicago Heights NR Recycled back to process
Rhodia-Waterway NR Recycled back to process
Offsite industrial SubtitleD landfill
Solutia-Augusta NR NR
Solutia-Carondelet NR NR
NR = not reported in RCRA §3007 questionnaire
Wastestreams Facility Waste Volume(MT/yr)
Final WasteManagement Step
Off-specification product Rhodia-Chicago Heights NR Recycled back to process
Rhodia-Waterway NR Recycled back to process
Offsite industrial SubtitleD landfill
Solutia-Augusta 646 Offsite industrial SubtitleD landfill
Solutia-Carondelet 125 Offsite industrial SubtitleD landfill
NR = not reported in RCRA §3007 questionnaire

APPENDIX B
Record Sampling Analytical Data Report

Final Data Validation ReportRhodia Inc., Chicago Heights Facility 1
FINAL DATA VALIDATION REPORTRHODIA INC., CHICAGO HEIGHTS FACILITY
RECORD SAMPLING
Overview
Four samples were collected at Rhodia Inc., Chicago Heights facility during a site visit on September 14,1999: two press cake samples, one filter sample, and an equipment blank. The sample set did not includea field duplicate pair, as there was an insufficient sample volume of the sample designated as the fieldduplicate. The samples were analyzed for the analyses specified in the Rhodia Inc., Chicago HeightsFacility Site Sampling and Analysis Plan for Record Sampling Under the Inorganic Listing Determination,dated September 2, 1999. The methods used for these analyses are presented in Table 1. The laboratorydid not deviate from the methods as written except for the following: (i) for hexavalent chromiumanalysis of solid samples, the laboratory extracted the samples 1:1 with deionized water as the samplesspattered when the heated digestion (SW-846 method 3060) was attempted (the digestion was attemptedtwice with the same results); and (ii) for TCLP and SPLP hexavalent chromium, the laboratory useddeionized water as the extraction fluid. Because TCLP extraction of hexavalent chromium usingdeionized water is identical to SPLP extraction of hexavalent chromium using deionized water, thelaboratory only reported results for SPLP hexavalent chromium analyses.
Because of insufficient sample volume, analysis for specific gravity could not be completed forRCH-1-SP-02. In addition, oxidation/reduction analysis of this sample was hindered by a matrix effect,and an insufficient sample prevented re-analysis of the sample. The laboratory reported that sampleRCH-1-SP-01 was off-gassing which prevented the accurate determination of specific gravity andmoisture content. The laboratory provided alternate results based on their best technical judgement (seeTable 2).
The data were reviewed according to the procedures outlined in the Quality Assurance Project Plan forCharacterization Sampling for Inorganic Chemicals Listing Determination. The text of this reportaddresses only those problems affecting usability.
The analytical results for the Rhodia samples, with the applied data qualifiers, are presented in Table 2. The results for the method blanks and leachate blanks prepared at the laboratory are also presented.
Data Validation Summary
The samples identified in the SAP were collected in the volumes specified in the SAP, with the exceptionsdescribed above.
Holding Times: All extractions and analyses were completed within the required holding times with theexception of hexavalent chromium in RCH-1-SP-05. The result was qualified as estimated with a lowbias (UL for non-detect results) in this sample.
The dates of analysis for each sample are detailed in the attached worksheet.
Instrument Calibration: All QC requirements for instrument calibration were met for all analyses. Calibration curves for CVAA, AA, and colorimetric analyses had correlation coefficients >0.995. Allinitial calibration verification samples were within the QC limits of 90-110%, and all continuing calibration

Final Data Validation ReportRhodia Inc., Chicago Heights Facility 2
verification samples were within the QC limits of 90-110% for ICP and 80-120% for CVAA, AA, andcolorimetric analyses.Blank Analysis Results: No target analyses were detected in the method and leachate blanks. Calciumand lead were detectable in the equipment blank, RCH-1-SP-05 (see Table 2). No qualification of datawas necessary as the levels of these analyses in the samples greatly exceeded the levels in the blanks.
Interference Check Sample (ICP Analyses): The recovery of spiked analyses in the InterferenceCheck Sample (ICS) was within the QC limits of 80-120% for all analyses.
Matrix Spike/Matrix Spike Duplicate Results: The results of matrix spike/matrix spike duplicateanalyses are presented in Tables 3 (total inorganics), 4 (TCLP), and 5 (SPLP). The recovery of analysesin the matrix spike and matrix spike duplicate samples was within the QC limits of 75-125%, and theduplication was within the QC limits of 0-25% relative percent difference, with the exception of totalcalcium, iron, mercury, sodium, and titanium; TCLP boron; and SPLP sodium. The data qualifiers thatwere applied to data as a result of these QC exceedances are detailed in the footnotes to the respectivetables. For total calcium, iron, mercury, and sodium, and SPLP sodium, no action was necessary as thesample concentration greatly exceeded the spike concentration.
For some analyses, the laboratory did not conduct matrix spike analyses but did conduct duplicateanalyses; these results are presented in Table 3.
Post-Digestion Spike Results: Although the laboratory conducted post-digestion spike analyses for allICP analyses, post-digestion spike results were only reported for analyses for which matrix spikerecovery failed. For this sample set, post-digestion spike recovery was reported for total titanium; therecovery was below the QC limits of 75-125% (73.5%). No additional qualification of data wasnecessary as all affected sample results previously had been qualified due to poor matrix spike recovery.
Laboratory Control Sample Results: The recovery of analyses in the laboratory control samples ispresented in Tables 6 (aqueous sample), 7 (solid sample), 8 (TCLP sample), and 9 (SPLP sample). Therecovery was within the QC limits of 80-120% for all analyses except total boron, TCLP zinc (extractionfluid #2), SPLP barium, and SPLP boron. The actions that were taken as a result of these QCexceedances are detailed in the respective tables.
ICP Serial Dilution Results (ICP Analyses): The laboratory conducted serial dilution analyses for ICPanalyses only in cases for which matrix spike recovery failed and no post-digestion spike analysis wasconducted (because sample concentration greatly exceeded spike concentration). No serial dilutionresults were reported for this sample set.
Target Detection Limits: The target detection limits identified in the QAPP were met for all analysesexcept as detailed in the table below:
Target Compound Target Detection Limit(mg/L)
Achieved Method DetectionLimit (mg/L) 1
WastewatersArsenic 0.002 0.00237 (0.005)
Thallium 0.0005 0.00216 (0.005)
1 Quantitation limit used for reporting in parentheses.

Final Data Validation ReportRhodia Inc., Chicago Heights Facility 3
Field Duplicate Results: No field duplicate samples were collected on this sampling trip due to limitedsample volume.
Attachments:
1. Glossary of Data Qualifier Codes2. List of Acronyms3. Data Validation Worksheet

Final Data Validation ReportRhodia Inc., Chicago Heights Facility 4
Table 1. Digestion and Analysis Methods Used for Rhodia Samples. 1
Target Analyte Digestion Method 2 Analysis MethodAntimony 3010/3050 6010 (ICP)Arsenic 3010/3050 6010 (ICP)Barium 3010/3050 6010 (ICP)Beryllium 3010/3050 6010 (ICP)Boron 3010/3050 6010 (ICP)Cadmium 3010/3050 6010 (ICP)Calcium 3010/3050 6010 (ICP)Chromium 3010/3050 6010 (ICP)Chromium 6+ — 3 7196 (colorimetric)Cobalt 3010/3050 6010 (ICP)Copper 3010/3050 6010 (ICP)Iron 3010/3050 6010 (ICP)Lead 3010/3050 6010 (ICP)Mercury 7470/7471 7470/7471 4 (CVAA)Nickel 3010/3050 6010 (ICP)Potassium 3010/3050 7610 (Flame AA)Selenium 3010/3050 6010 (ICP)Silver 3010/3050 6010 (ICP)Sodium 3010/3050 7770 (Flame AA)Thallium 3010/3050 6010 (ICP)Titanium 3010/3050 6010 (ICP)Vanadium 3010/3050 6010 (ICP)Zinc 3010/3050 6010 (ICP)
Fluoride EPA 300.0 EPA 300.0 (ion chromatographic)
TCLP 1311 5 N/ASPLP 1312 5 N/A
pH N/A EPA 150.1/ SW-846 9045 3
Oxidation/reduction (mV) N/A ASTM D1498-93Specific gravity N/A ASTM D854-83Total non-filterable residues N/A EPA 160.2Moisture content N/A CLP 3/90
1 All methods are SW-846 methods unless otherwise indicated.

Table 1 (continued).
Final Data Validation ReportRhodia Inc., Chicago Heights Facility 5
2 The first method listed is the digestion method for aqueous matrices (leachates); the second methodlisted is for solid matrices.
3 The laboratory found that the samples spattered when the requested alkaline digestion 3060 wasattempted. (The digestion was attempted twice with the same results. Instead, the samples wereextracted 1:1 with deionized water.
4 The first method is for aqueous matrices (leachates); the second method is for solid matrices.5 Following the leaching procedure, the leachates were digested according to the digestion method
listed for each analyte.

Final Data Validation ReportRhodia Inc., Chicago Heights Facility (continued; footnotes follow)6
Table 2. Rhodia, Inc. Chicago Heights Facility - Sample Results 1
LaboratorySample Number
AP83770 AP83771
EPA SampleNumber
RCH-1-SP-01 RCH-1-SP-02
Date Sampled 09/14/1999 09/14/1999
SampleDescription
Initial filter press cake Filter press cake
Result Type Total TCLP SPLP Total TCLP SPLP
Units mg/kg mg/L mg/L mg/kg mg/L mg/L
Target Analyte Result DQ 2 Result DQ Result DQ Result DQ Result DQ Result DQ
Inorganics
Antimony 0.5 <0.5 U 0.0298 <0.5 U <0.5 U <0.025 U
Arsenic <0.5 U <0.5 U <0.005 U <0.5 U <0.5 U <0.005 U
Barium 17.8 <2 U <0.100 U 6.0 <2 U <0.100 U
Beryllium <0.2 U <0.02 U <0.002 U <0.2 U <0.02 U <0.002 U
Boron 13.1 <2 U 0.375 J <10 U <2 U 0.166 J
Cadmium 6.5 <0.05 U <0.005 U 6.1 <0.05 U <0.005 U
Calcium 25100 18.9 3.32 20800 55.5 1.340
Chromium 111 0.2 0.171 90.8 0.075 0.0222
Chromium 6+ <0.4 3 U N/A 4 <0.02 U <0.4 3 U N/A 4 <0.02 U
Cobalt 1.2 <0.05 U <0.005 U 0.8 <0.05 U <0.005 U
Copper 3.6 <0.25 U 0.0060 1.9 <0.25 U 0.0035
Iron 3320 <1 U <0.050 U 2160 <1 U 0.0629
Lead 2.4 0.8 5 <0.005 U 0.7 <0.5 U <0.005 U
Mercury 6.2 <0.002 U <0.0002
U 4.6 <0.002 U <0.0002
U
Nickel 61.1 0.4 0.0072 42.5 1.0 0.0162
Potassium <100 U <10 U 1.7 <100 U <10 U 1.1
Selenium <0.5 U <0.5 U 0.0084 <0.5 U <0.5 U <0.005 U
Silver <0.1 U <0.1 U <0.001 U <0.1 U <0.1 U <0.001 U
Sodium 146000
N/A 5310 59200 N/A 812
Thallium <2 U <2 U 0.0055 <2 U <2 U 0.0079
Titanium 61.5 L <0.05 U <0.005 U 49.3 L <0.05 U <0.005 U
Vanadium <0.5 U <0.05 U <0.005 U <0.5 U <0.05 U <0.005 U
Zinc 10.3 <3 U <0.100 U 5.2 <3 U <0.100 U
Fluoride 325 N/A N/A 58.8 N/A N/A
Physical Properties
pH, pH units 8.8 N/A N/A 9.4 N/A N/A
Oxidation/reduction, O/R
1370000
N/A N/A N/A 6 N/A N/A
Specific gravity(unitless)
N/A 7 N/A N/A N/A 8 N/A N/A
Moisture content,%
42.9 9 N/A N/A 71.7 N/A N/A
Final pH ofleachate
N/A 6.98 9.01 N/A 5.93 9.90
Laboratory SampleNumber
AP83772
EPA Sample Number RCH-1-SP-03

Table 2 (continued).
Final Data Validation ReportRhodia Inc., Chicago Heights Facility (continued; footnotes follow)7
Date Sampled 09/14/1999
Sample Description Dust collector filter bags
Result Type Total TCLP SPLP
Units mg/kg mg/L mg/L
Target Analyte Result DQ Result DQ Result DQ
Inorganics
Antimony 48.8 <0.5 U 0.309
Arsenic <0.5 U <0.5 U 0.0064
Barium 12.5 <2 U <0.100 U
Beryllium <0.2 U <0.02 U <0.002 U
Boron 23.0 <2 U 0.765 J
Cadmium <0.5 U <0.05 U <0.005 U
Calcium 344 14.1 1.180
Chromium 10.9 0.087 0.0297
Chromium 6+ <0.4 3 U N/A 4 <0.02 U
Cobalt 2.8 <0.05 U <0.005 U
Copper 6.0 <0.25 U 0.0496
Iron 740 1.4 0.101
Lead 4.5 <0.5 U <0.005 U
Mercury <0.1 U <0.002 U <0.0002 U
Nickel 4.8 <0.2 U 0.0077
Potassium <100 U <10 U 2.5
Selenium <0.5 U <0.5 U 0.0091
Silver <0.1 U <0.1 U <0.001 U
Sodium 142000 N/A 1640
Thallium <2 U <2 U <0.005 U
Titanium 4.3 L <0.05 U <0.005 U
Vanadium 0.6 <0.05 U 0.0084
Zinc 116 <3 U <0.100 U
Fluoride 315 N/A N/A
Physical Properties
pH, pH units 10.1 N/A N/A
Oxidation/reduction, O/R 1.14 x10¹⁰
N/A N/A
Specific gravity (unitless) 2.0 N/A N/A
Moisture content, % 22.6 N/A N/A
Final pH of leachate N/A 6.27 10.6
Laboratory Sample Number AP83773
EPA Sample Number RCH-1-SP-05
Date Sampled 09/14/1999
Sample Description Equipment blank Method blank - water Method blank - solid Leachate blank
Result Type Total Total Total TCLP
Units mg/L mg/L mg/kg mg/L
Target Analyte Result DQ Result DQ Result DQ Result DQ
Inorganics
Antimony <0.005 U <0.005 U <0.5 U <0.5 U
Arsenic <0.005 U <0.005 U <0.5 U <0.5 U
Barium <0.005 U <0.005 U <0.5 U <2 U

Table 2 (continued).Laboratory Sample Number AP83773
EPA Sample Number RCH-1-SP-05
Date Sampled 09/14/1999
Sample Description Equipment blank Method blank - water Method blank - solid Leachate blank
Result Type Total Total Total TCLP
Units mg/L mg/L mg/kg mg/L
Target Analyte Result DQ Result DQ Result DQ Result DQ
Final Data Validation ReportRhodia Inc., Chicago Heights Facility (continued; footnotes follow)8
Beryllium <0.002 U <0.002 U <0.2 U <0.02 U
Boron <0.050 U <0.050 U <10 U <2 U
Cadmium <0.005 U <0.005 U <0.5 U <0.05 U
Calcium 0.211 <0.100 U <100 U <2 U
Chromium <0.005 U <0.005 U <0.5 U <0.05 U
Chromium 6+ <0.02 UL <0.020 U N/A N/A
Cobalt <0.005 U <0.005 U <0.5 U <0.05 U
Copper <0.005 U <0.005 U <0.5 U <0.25 U
Iron <0.050 U <0.050 U <5 U <1 U
Lead 0.0032 <0.003 U <0.5 U <0.5 U
Mercury <0.0002 U <0.0002 U <0.1 U <0.002 U
Nickel <0.005 U <0.005 U <0.5 U <0.2 U
Potassium <1 U <1 U <100 U <10 U
Selenium <0.005 U <0.005 U <0.5 U <0.5 U
Silver <0.001 U <0.001 U <0.1 U <0.2 U
Sodium <1 U <1 U <100 U N/A
Thallium <0.005 U <0.005 U <2 U <2 U
Titanium <0.005 U <0.005 U <0.5 U <0.1 U
Vanadium <0.005 U <0.005 U <0.5 U <0.05 U
Zinc <0.050 U <0.050 U <5 U <3 U
Fluoride <0.1 U <0.1 U <10 U N/A
Physical Properties
pH, pH units 3.4 N/A N/A N/A
Oxidation/reduction, O/R 279 N/A N/A N/A
Specific gravity (unitless) 1.0 201.9 N/A N/A
Total non-filterable residues,mg/L
<10 U <10 N/A N/A
1 < = Less than the reporting limit specified. N/A = Not analyzed.2 DQ = Data Qualifier. 3 The laboratory reported that the sample spattered when the alkaline digestion for hexavalent chromium was attempted. (The
digestion was attempted twice with the same results.) ; Instead the samples were extracted 1:1 with deionized water and theextract was analyzed. The result is reported as mg/L.
4 TCLP/SPLP extraction was conducted using deionized water at a 20:1 ratio (deionized water:sample); therefore, thelaboratory reported the result as SPLP leachate.
5 The sample was analyzed in duplicate; the duplicate result for TCLP lead was 0.007 mg/L (<0.5 mg/L).6 A matrix effect hindered the initial analysis of this sample, and the laboratory had insufficient sample volume to reanalyze
the sample.7 The report moisture content (see footnote 9) led to the determination of a negative specific gravity for this sample. If a
moisture content of zero was assumed, the laboratory calculated the specific gravity to be 2.9.8 The laboratory had insufficient sample volume to conduct specific gravity analysis.9 The laboratory believes that this result is erroneous, due to the outgassing of the sample. The laboratory stated that their
was no apparent moisture in the sample.

Final Data Validation ReportRhodia Inc., Chicago Heights Facility (continued; footnotes follow)9
Table 3. Matrix Spike/Matrix Spike Duplicate Results - Total Inorganics
Sample ID: RCH-1-SP-01
Analyte MS Recovery, % MSD Recovery, % % RPD Action 1
Antimony 93.1 92.0 1.2 None
Arsenic 92.8 90.4 2.6 None
Barium 93.2 91.8 1.1 None
Beryllium 90.1 89.4 0.8 None
Boron 90.5 91.2 0.6 None
Cadmium 85.5 85.3 0.2 None
Calcium 62.3 76.0 2.6 None 2
Chromium 84.0 77.3 2.2 None
Chromium 6+ 101 116 13.9 None
Cobalt 89.2 87.8 1.5 None
Copper 100.7 98.7 1.9 None
Iron 3.0 -7.2 0.6 None 2
Lead 90.6 89.5 1.1 None
Mercury 139 187 4.2 None 2
Nickel 85.5 82.0 1.7 None
Potassium 98.6 98.4 0.2 None
Selenium 83.7 82.8 1.1 None
Silver 91.7 90.0 1.9 None
Sodium 186 -76.0 8.8 None 2
Thallium 93.0 91.0 2.2 None
Titanium 70.5 69.2 0.6 L - positive results;UL - non-detect results
Vanadium 94.4 93.2 1.2 None
Zinc 95.5 93.4 1.8 None
Fluoride 87.3 87.5 0.1 None
Sample ID: RCH-1-SP-05
Analyte MS Recovery, % MSD Recovery, % % RPD Action 1
Fluoride 92.0 96.3 4.5 None
1 QC limits are 75-125% recovery and 0-25% RPD (relative percent difference).2 No action taken as sample concentration greatly exceeded spike concentration.
Inorganics, Laboratory DuplicateSample ID: RCH-1-SP-01
Analyte Sample Result Duplicate Result % RPD Action 1
Moisture content, % 42.9 38.4 11.1% None
pH, pH units 8.76 8.72 0.5% None
Inorganics, Laboratory DuplicateSample ID: RCH-1-SP-05
Analyte Sample Result Duplicate Result % RPD Action 1
Oxidation/reduction, mV 13.7 14.1 2.9% None

Final Data Validation ReportRhodia Inc., Chicago Heights Facility (continued; footnotes follow)10
1 QC limits are 0-25% RPD (relative percent difference).

Final Data Validation ReportRhodia Inc., Chicago Heights Facility (continued; footnotes follow)11
Table 4. Matrix Spike/Matrix Spike Duplicate Results - TCLP Inorganics
Analyte
Sample ID: RCH-1-SP-01
Action 1MS Recovery, % MSD Recovery, % RPD, %
Antimony 98.4 97.6 0.9 None
Arsenic 100.7 100.6 0.0 None
Barium 101.7 100.7 1.0 None
Beryllium 95.1 94.2 1.0 None
Boron 88.5 308.4 96.3 None 2
Cadmium 98.0 97.9 0.1 None
Calcium 100.6 99.9 0.7 None
Chromium 97.1 98.0 0.8 None
Cobalt 93.7 93.2 0.5 None
Copper 108.5 110.0 1.3 None
Iron 96.7 97.6 1.0 None
Lead 81.5 81.5 0.0 None
Mercury 100 100 0.3 None
Nickel 94.2 94.2 0.0 None
Potassium 112 116 3.5 None
Selenium 95.6 96.0 0.4 None
Silver 103.0 102.5 0.5 None
Thallium 98.5 98.6 0.1 None
Titanium 97.4 96.9 0.5 None
Vanadium 101.1 100.4 0.7 None
Zinc 112.6 110.1 2.3 None
1 QC limits are 75-125% recovery and 0-25% RPD.2 No action necessary as TCLP boron was not detected in RCH-1-SP-01, RCH-1-SP-02, or RCH-1-SP-03.

Final Data Validation ReportRhodia Inc., Chicago Heights Facility (continued; footnotes follow)12
Table 5. Matrix Spike/Matrix Spike Duplicate Results - SPLP Inorganics
Analyte
Sample ID: RCH-1-SP-01
Action 1MS Recovery, % MSD Recovery, % RPD, %
Antimony 87.6 83.6 4.0 None
Arsenic 98.9 97.1 1.8 None
Barium 89.2 87.6 1.8 None
Beryllium 84.0 82.4 1.9 None
Boron 98.8 97.1 0.7 None
Cadmium 86.2 83.9 2.7 None
Calcium 86.6 84.5 2.1 None
Chromium 87.8 85.4 1.6 None
Chromium 6+ 100 95.3 4.8 None
Cobalt 87.3 85.4 2.3 None
Copper 105.5 103.4 1.9 None
Iron 89.4 86.3 3.5 None
Lead 88.1 85.6 2.9 None
Mercury 106 105 1.0 None
Nickel 83.2 81.6 1.9 None
Potassium 100 99.1 0.7 None
Selenium 87.9 87.2 0.7 None
Silver 102.6 100.4 2.2 None
Sodium -648 516 5.5 None 2
Thallium 80.9 80.6 0.4 None
Titanium 87.2 85.9 1.6 None
Vanadium 88.4 86.8 1.8 None
Zinc 109.1 106.2 2.6 None
1 QC limits are 75-125% recovery and 0-25% RPD (relative percent difference).2 No action was taken as the sample concentration greatly exceeded the spike concentration.

Final Data Validation ReportRhodia Inc., Chicago Heights Facility (continued; footnotes follow)13
Table 6. Laboratory Control Sample (LCS) Results - Inorganics Water Matrix
Analyte LCS Recovery, % 1 QC Limits 2 Compliant?
LCSW-1 LCSW-2
Antimony 99.3 100.8 80-120 Yes
Arsenic 99.6 101.9 80-120 Yes
Barium 104.4 105.2 80-120 Yes
Beryllium 101.7 100.5 80-120 Yes
Boron 100.5 131.6 80-120 No 3
Cadmium 102.6 103.5 80-120 Yes
Calcium 106.0 105.4 80-120 Yes
Chromium 105.0 105.9 80-120 Yes
Chromium 6+ 98.0 101 (9/21/99) 80-120 Yes
Cobalt 101.7 102.9 80-120 Yes
Copper 102.9 104.1 80-120 Yes
Iron 104.6 109.7 80-120 Yes
Lead 102.6 103.8 80-120 Yes
Mercury 100 (9/29/99) — 80-120 Yes
Nickel 103.5 103.6 80-120 Yes
Potassium 105 (9/26/99) 104 (9/26/99) 80-120 Yes
Selenium 94.4 96.7 80-120 Yes
Silver 99.9 101.9 80-120 Yes
Sodium 104 (9/26/99) 98.0 (9/26/99) 80-120 Yes
Thallium 98.9 100.0 80-120 Yes
Titanium 98.7 99.8 80-120 Yes
Vanadium 105.3 106.5 80-120 Yes
Zinc 108.6 111.0 80-120 Yes
Fluoride 95.5 97.5 (10/11/99) 80-120 Yes
1 Samples were analyzed 9/25/99 unless otherwise indicated in parentheses.2 QC limits reported by laboratory.3 No qualification of data necessary as boron was not detected in the aqueous sample (RCH-1-SP-05).

Final Data Validation ReportRhodia Inc., Chicago Heights Facility (continued; footnotes follow)14
Table 7. Laboratory Control Sample (LCS) Results - Inorganics Solid Matrix
Analyte LCS Recovery, % 1 QC Limits 2 Compliant?
1 2
Antimony 91.8 93.9 80-120 Yes
Arsenic 90.7 91.9 80-120 Yes
Barium 96.7 98.5 80-120 Yes
Beryllium 98.4 100.6 80-120 Yes
Boron 98.1 95.3 80-120 Yes
Cadmium 96.5 98.0 80-120 Yes
Calcium 99.6 101.7 80-120 Yes
Chromium 100.6 102.6 80-120 Yes
Cobalt 95.3 97.2 80-120 Yes
Copper 102.5 104.3 80-120 Yes
Iron 100.2 103.4 80-120 Yes
Lead 95.8 97.4 80-120 Yes
Mercury 103 (9/28/99)101 (10/7/99)
104 (9/28/99) 80-120 Yes
Nickel 96.3 97.1 80-120 Yes
Potassium 96.3 (9/27/99) 98.7 (9/27/99) 80-120 Yes
Selenium 81.9 83.1 80-120 Yes
Silver 91.1 92.3 80-120 Yes
Sodium 94.4 (9/27/99) 99.1 (9/27/99) 80-120 Yes
Thallium 89.0 90.8 80-120 Yes
Titanium 100.9 105.0 80-120 Yes
Vanadium 99.9 102.3 80-120 Yes
Zinc 98.0 100.9 80-120 Yes
Fluoride 100 102 (10/7/99) 80-120 Yes
1 Samples were analyzed 9/26/99 unless otherwise indicated in parentheses.2 QC limits reported by laboratory.

Final Data Validation ReportRhodia Inc., Chicago Heights Facility (continued; footnotes follow)15
Table 8. Laboratory Control Sample (LCS) Results - TCLP Inorganics
Analyte LCS Recovery, %(Extraction Fluid #2) 1
QC Limits 2 Compliant?
Antimony 99.8 80-120 Yes
Arsenic 102.2 80-120 Yes
Barium 109.1 80-120 Yes
Beryllium 96.3 80-120 Yes
Boron 105.6 80-120 Yes
Cadmium 100.1 80-120 Yes
Calcium 102.9 80-120 Yes
Chromium 99.4 80-120 Yes
Cobalt 94.2 80-120 Yes
Copper 103.3 80-120 Yes
Iron 102.0 80-120 Yes
Lead 99.0 80-120 Yes
Mercury 101 (10/7/99) 80-120 Yes
Nickel 96.6 80-120 Yes
Potassium 104 80-120 Yes
Selenium 100.6 80-120 Yes
Silver 104.1 80-120 Yes
Thallium 94.5 80-120 Yes
Titanium 101.3 80-120 Yes
Vanadium 102.8 80-120 Yes
Zinc 183.1, 132.0 80-120 No 3
1 Sample was analyzed 10/6/99 unless otherwise indicated in parentheses.2 QC limits reported by laboratory.3 No action necessary as TCLP zinc was not detected in the affected samples (RCH-1-SP-01, RCH-1-SP-02, and
RCH-1-SP-03).

Final Data Validation ReportRhodia Inc., Chicago Heights Facility (continued; footnotes follow)16
Table 9. Laboratory Control Sample (LCS) Results - SPLP Inorganics
Analyte LCS Recovery, % 1 QC Limits 2 Compliant?
Antimony 101.0 80-120 Yes
Arsenic 94.2 80-120 Yes
Barium 100.2, 137.0 80-120 No 3
Beryllium 96.1 80-120 Yes
Boron 123.6, 77.8 80-120 No 4
Cadmium 96.4 80-120 Yes
Calcium 99.1 80-120 Yes
Chromium 99.2 80-120 Yes
Chromium 6+ 94.7, 98.0 (10/1/99) 80-120 Yes
Cobalt 95.4 80-120 Yes
Copper 100.4 80-120 Yes
Iron 99.9 80-120 Yes
Lead 96.3 80-120 Yes
Mercury 98.5, 99.9 (10/7/99) 80-120 Yes
Nickel 96.8 80-120 Yes
Potassium 105 80-120 Yes
Selenium 88.1 80-120 Yes
Silver 98.9 80-120 Yes
Sodium 102, 106 (10/4/99) 80-120 Yes
Thallium 93.7 80-120 Yes
Titanium 101.7 80-120 Yes
Vanadium 99.2 80-120 Yes
Zinc 114.7 80-120 Yes
1 Samples were analyzed 10/6/99 unless otherwise indicated in parentheses.2 QC limits reported by laboratory.3 No qualification of data was necessary as SPLP barium was not detected in RCH-1-SP-01, RCH-1-SP-02, or RCH-1-SP-03.4 Positive results for SPLP boron in RCH-1-SP-01, RCH-1-SP-02, and RCH-1-SP-03 were qualified as estimated (J).

(continued; footnotes follow)
ATTACHMENT 1
Glossary of Data Qualifier Codes
(continued; footnotes follow)
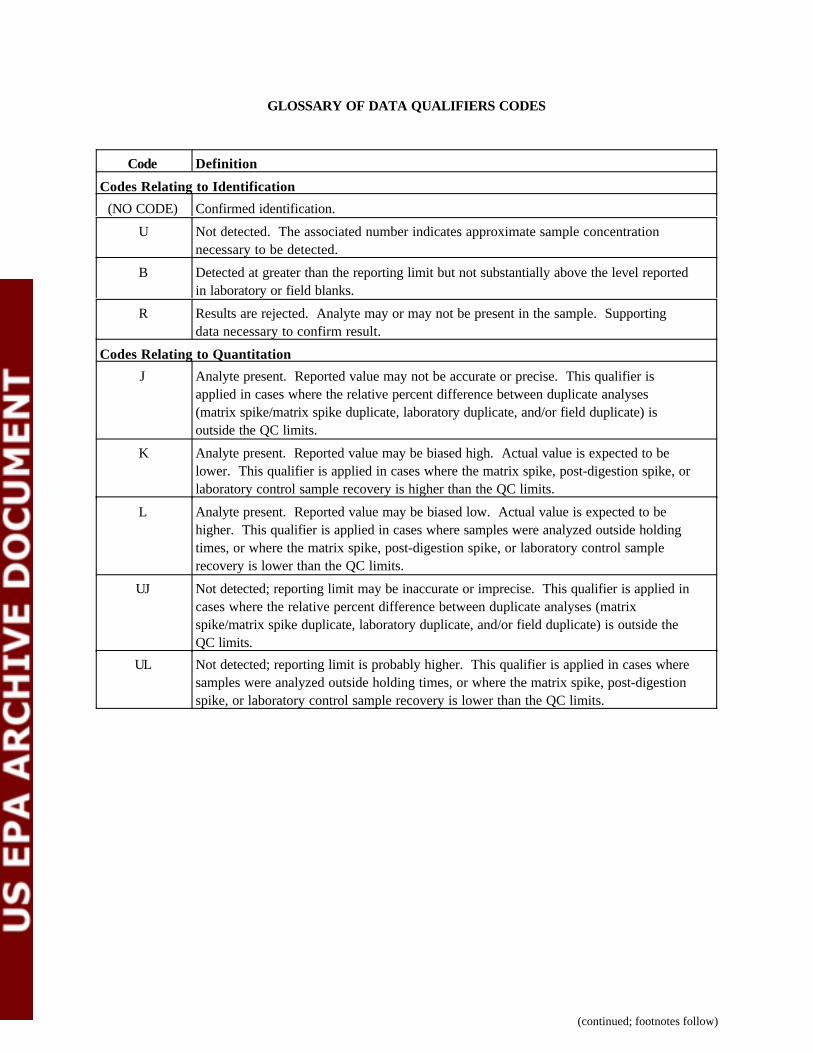
GLOSSARY OF DATA QUALIFIERS CODES
Code Definition
Codes Relating to Identification
(NO CODE) Confirmed identification.
U Not detected. The associated number indicates approximate sample concentrationnecessary to be detected.
B Detected at greater than the reporting limit but not substantially above the level reportedin laboratory or field blanks.
R Results are rejected. Analyte may or may not be present in the sample. Supportingdata necessary to confirm result.
Codes Relating to Quantitation
J Analyte present. Reported value may not be accurate or precise. This qualifier isapplied in cases where the relative percent difference between duplicate analyses(matrix spike/matrix spike duplicate, laboratory duplicate, and/or field duplicate) isoutside the QC limits.
K Analyte present. Reported value may be biased high. Actual value is expected to belower. This qualifier is applied in cases where the matrix spike, post-digestion spike, orlaboratory control sample recovery is higher than the QC limits.
L Analyte present. Reported value may be biased low. Actual value is expected to behigher. This qualifier is applied in cases where samples were analyzed outside holdingtimes, or where the matrix spike, post-digestion spike, or laboratory control samplerecovery is lower than the QC limits.
UJ Not detected; reporting limit may be inaccurate or imprecise. This qualifier is applied incases where the relative percent difference between duplicate analyses (matrixspike/matrix spike duplicate, laboratory duplicate, and/or field duplicate) is outside theQC limits.
UL Not detected; reporting limit is probably higher. This qualifier is applied in cases wheresamples were analyzed outside holding times, or where the matrix spike, post-digestionspike, or laboratory control sample recovery is lower than the QC limits.

(continued; footnotes follow)
ATTACHMENT 2
List of Acronyms

(continued; footnotes follow)
AA Atomic Absorption SpectroscopyAL Action LevelASTM American Society for Testing and MaterialsCBI Confidential Business InformationCCB Continuing Calibration BlankCCV Continuing Calibration VerificationCOC Chain of CustodyCVAA Cold Vapor Atomic Absorption Spectroscopy%D Percent DifferenceDOT Department of TransportationDQ Data QualifierDQA Data Quality AssessmentDQO Data Quality ObjectivesEPA Environmental Protection AgencyGC/MS Gas Chromatography/Mass SpectrometryGFAA Gas Furnace Atomic Absorption SpectroscopyHRGC High Resolution Gas ChromatographyHRMS High Resolution Mass SpectrometryICB Initial Calibration BlankICP Inductively Coupled Argon Plasma SpectroscopyICS Interference Check SampleICV Initial Calibration VerificationIDL Instrument Detection LimitIS Internal StandardLCS Laboratory Control SampleMDL Method Detection LimitMS Matrix SpikeMSD Matrix Spike DuplicatePAH Polynuclear Aromatic HydrocarbonPDS Post-Digestion SpikeQA Quality AssuranceQA/QC Quality Assurance/Quality ControlQAPP Quality Assurance Project PlanQC Quality Control%R Percent RecoveryRCRA Resource Conservation and Recovery ActRPD Relative Percent DifferenceRT Retention TimeSAP Sampling and Analysis PlanSR Sample resultSA Spike addedSOP Standard Operating ProcedureSPLP Synthetic Precipitation Leaching ProcedureSVOC Semi-Volatile Organic CompoundTCLP Toxicity Characteristic Leaching ProcedureVOC Volatile Organic Compound

(continued; footnotes follow)
ATTACHMENT 3
Data Validation Worksheet
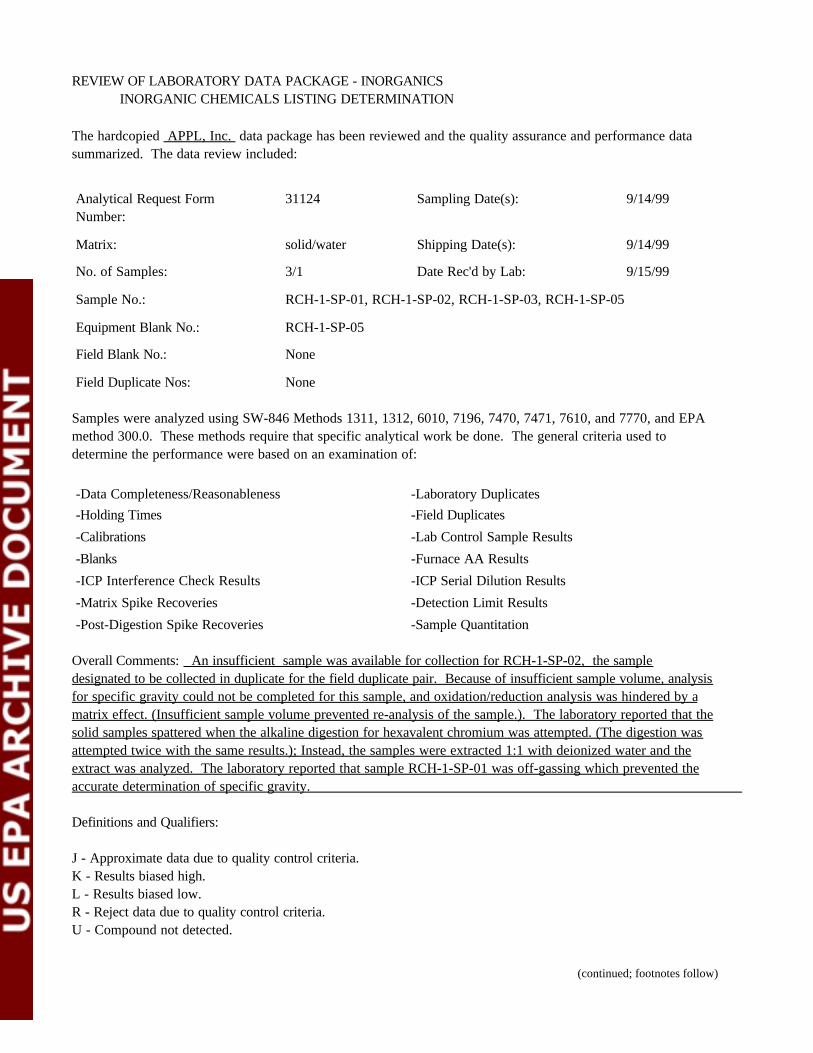
REVIEW OF LABORATORY DATA PACKAGE - INORGANICSINORGANIC CHEMICALS LISTING DETERMINATION
(continued; footnotes follow)
The hardcopied APPL, Inc. data package has been reviewed and the quality assurance and performance datasummarized. The data review included:
Analytical Request FormNumber:
31124 Sampling Date(s): 9/14/99
Matrix: solid/water Shipping Date(s): 9/14/99
No. of Samples: 3/1 Date Rec'd by Lab: 9/15/99
Sample No.: RCH-1-SP-01, RCH-1-SP-02, RCH-1-SP-03, RCH-1-SP-05
Equipment Blank No.: RCH-1-SP-05
Field Blank No.: None
Field Duplicate Nos: None
Samples were analyzed using SW-846 Methods 1311, 1312, 6010, 7196, 7470, 7471, 7610, and 7770, and EPAmethod 300.0. These methods require that specific analytical work be done. The general criteria used todetermine the performance were based on an examination of:
-Data Completeness/Reasonableness -Laboratory Duplicates-Holding Times -Field Duplicates
-Calibrations -Lab Control Sample Results
-Blanks -Furnace AA Results
-ICP Interference Check Results -ICP Serial Dilution Results
-Matrix Spike Recoveries -Detection Limit Results
-Post-Digestion Spike Recoveries -Sample Quantitation
Overall Comments: An insufficient sample was available for collection for RCH-1-SP-02, the sampledesignated to be collected in duplicate for the field duplicate pair. Because of insufficient sample volume, analysisfor specific gravity could not be completed for this sample, and oxidation/reduction analysis was hindered by amatrix effect. (Insufficient sample volume prevented re-analysis of the sample.). The laboratory reported that thesolid samples spattered when the alkaline digestion for hexavalent chromium was attempted. (The digestion wasattempted twice with the same results.); Instead, the samples were extracted 1:1 with deionized water and theextract was analyzed. The laboratory reported that sample RCH-1-SP-01 was off-gassing which prevented theaccurate determination of specific gravity.
Definitions and Qualifiers:
J - Approximate data due to quality control criteria.K - Results biased high.L - Results biased low.R - Reject data due to quality control criteria.U - Compound not detected.

REVIEW OF LABORATORY DATA PACKAGE - INORGANICSINORGANIC CHEMICALS LISTING DETERMINATION
(continued; footnotes follow)
Reviewer: Kelly Luck Date: November 12, 1999

REVIEW OF LABORATORY DATA PACKAGE - INORGANICSINORGANIC CHEMICALS LISTING DETERMINATION
(continued; footnotes follow)
IV. DATA COMPLETENESS/REASONABLENESS
A. Completeness: Except as reported below, all required information was included in the data packages,including supporting raw data.
MISSING/INCORRECT INFORMATION DATE LABCONTACTED
DATA RECEIVED
Results for total metals in solid samples werecorrected for moisture content.
11/1/99 11/1/99 (fax)
MS/MSD results for RCH-1-SP-01, ICP metalswere not reported
11/8/99 Results were reported in anotherdata package (Degussa)
Case narrative did not contain information aboutproblems with sample analysis due to alkalinity (hex.chrome) or insufficient sample volume
11/8/99 11/11/99 (fax)
Was the sample collection plan outlined in the SAP followed (all samples that were to be collected were collected,all field QC samples to be collected were collected, etc.)? No, please - see trip report. Insufficient sample volume was available at the facility for RCH-1-SP-02,preventing collection of the other sample of the field duplicate pair, and restricting the analyses that could becompleted on the sample. The laboratory was able to perform all requested analyses on this sample with theexception of specific gravity and oxidation/reduction.
B. Reasonableness:
Were results for TCLP and SPLP consistent with total results (in consideration of the minimum 20-fold dilutionfactor)?Yes, with the exception of TCLP lead in RCH-1-SP-01 (0.8 mg/L versus 2.4 mg/kg total lead). This sample wasanalyzed in duplicate and the duplicate result for TCLP lead was 0.0071 mg/L.

REVIEW OF LABORATORY DATA PACKAGE - INORGANICSINORGANIC CHEMICALS LISTING DETERMINATION
(continued; footnotes follow)
V. HOLDING TIMES Complete table for all samples.
Sample ID Date Sampled Analyte Preparation Date Analysis DateRCH-1-SP-01 9/14/99 oxidation/reduction 10/13/99 10/13/99
specific gravity 10/5/99 10/5/99moisture 9/17/99 9/17/99
pH 9/17/99 9/17/99fluoride 10/7/99 10/15/99
Cr6+ 9/21/99 9/21/99SPLP Cr6+ 10/1/99 10/1/99
metals except mercury 9/24/99 9/25/99 (9/27/99 forNa and K)
mercury 10/1/99 10/7/99
TCLP extraction — 10/1/99TCLP metals exceptmercury
10/4/99 10/6/99 (10/8/99 forK)
TCLP mercury 10/6/99 10/7/99SPLP extraction — 9/29/99
SPLP metals exceptmercury
10/1/99 10/6/99 (10/4/99 forNa and K)
SPLP mercury 10/5/99 10/7/99RCH-1-SP-02 9/14/99 moisture 9/17/99 9/17/99
pH 9/17/99 9/17/99fluoride 10/7/99 10/15/99
Cr6+ 9/21/99 9/21/99SPLP Cr6+ 10/1/99 10/1/99
metals except mercury 9/24/99 9/25/99 (9/27/99 forNa and K)
mercury 9/27/99 9/28/99
TCLP extraction — 10/1/99TCLP metals exceptmercury
10/4/99 10/6/99 (10/8/99 forK)
TCLP mercury 10/6/99 10/7/99SPLP extraction — 9/29/99
SPLP metals exceptmercury
10/1/99 10/6/99 (10/4/99 forNa and K)
SPLP mercury 10/5/99 10/7/99

REVIEW OF LABORATORY DATA PACKAGE - INORGANICSINORGANIC CHEMICALS LISTING DETERMINATION
Sample ID Date Sampled Analyte Preparation Date Analysis Date
(continued; footnotes follow)
RCH-1-SP-03 9/14/99 oxidation/reduction 10/13/99 10/13/99
specific gravity 10/5/99 10/5/99moisture 9/17/99 9/17/99
pH 9/17/99 9/17/99
fluoride 10/7/99 10/14/99Cr6+ 9/21/99 9/21/99
SPLP Cr6+ 10/1/99 10/1/99metals except mercury 9/24/99 9/25/99 (9/27/99 for
Na and K)
mercury 9/27/99 9/28/99TCLP extraction — 10/1/99
TCLP metals exceptmercury
10/4/99 10/6/99 (10/8/99 forK)
TCLP mercury 10/6/99 10/7/99
SPLP extraction — 9/29/99SPLP metals exceptmercury
10/1/99 10/6/99 (10/4/99 forNa and K)
SPLP mercury 10/5/99 10/7/99RCH-1-SP-05 9/14/99 oxidation/reduction 10/13/99 10/13/99
specific gravity 10/11/99 10/11/99pH 9/17/99 9/17/99
total non-filterable residues 9/20/99 9/20/99fluoride 10/7/99 10/7/99
Cr6+ 9/21/99 9/21/99metals except mercury 9/24/99 9/25/99 (9/26/99 for
Na and K)
mercury 9/28/99 9/29/99Metals - 180 days from sample collectionMercury - 28 days from sample collectionTCLP & SPLP - 180 days from sample collection to extraction and 180 days from extraction to analysis for total
metals- 28 days from sample collection to extraction for mercury
Chromium6+ - one month from sample collection to extraction and 4 days from extraction to analysis for solidsamples- 24 hours from sample collection to analysis for aqueous samples
Fluoride - 28 days from sample collectionTSS - 7 days from sample collection
ACTIONS: Holding time for Cr6+ was exceeded in sample RCH-1-SP-05; sample results were qualified asestimated with a low bias (L(+);UL(ND)).
NOTE: Extraction fluid #2 was used for TCLP metal extraction of RCH-1-SP-01, RCH-1-SP-02, andRCH-1-SP-03. Extraction fluid #1 was used for SPLP metal extractions.

REVIEW OF LABORATORY DATA PACKAGE - INORGANICSINORGANIC CHEMICALS LISTING DETERMINATION
(continued; footnotes follow)
Action: 1. If holding times are exceeded all positive results are estimated with a low bias (L) and non-detects areestimated with a low bias (UL).
2. If holding times are grossly exceeded (>2x), all results are qualified unusable (R).

REVIEW OF LABORATORY DATA PACKAGE - INORGANICSINORGANIC CHEMICALS LISTING DETERMINATION
(continued; footnotes follow)
VI. INSTRUMENT CALIBRATION
1. Recovery Criteria
List the analyses which did not meet the percent recovery (%R) criteria for Initial or Continuing Calibration.
ANALYSIS
ICV/CCV# ANALYTE %R ACTION SAMPLES AFFECTED
ACTIONS: None; all criteria met.
If any analyte does not meet the %R criteria follow the actions stated below:
Positive Results Non-detected Results %R
Methods 6010, 7196, and300.0
Methods 7470, 7471, 7610, and 7770
L UL <90 <80
K >110 >120

REVIEW OF LABORATORY DATA PACKAGE - INORGANICSINORGANIC CHEMICALS LISTING DETERMINATION
(continued; footnotes follow)
III. INSTRUMENT CALIBRATION (Section 2)
2. Analytical Sequence
A. Did the laboratory use the proper number of standards for calibration as described in method? Yes
B. Were calibrations performed at the beginning of each analysis? Yes
C. Were calibration standards analyzed at the beginning of sample analysis and at a minimum frequency often percent or every two hours during analysis, whichever is more frequent? Yes
D. Were the correlation coefficients for the calibration curves for Hg, nitrate, nitrite, ammonia, sodium,potassium, TOC, hexavalent chromium, and CN $ 0.995?
Yes
ACTION: None; all criteria met.
1. If the minimum number of standards were not used for initial calibration or if the instrument was notcalibrated daily and each time the instrument was set up, reject the associated data (R).
2. If the correlation coefficient is <0.995, qualify results >IDL as estimated (J), and results <IDL asestimated (UJ).

REVIEW OF LABORATORY DATA PACKAGE - INORGANICSINORGANIC CHEMICALS LISTING DETERMINATION
(continued; footnotes follow)
VII. BLANK ANALYSIS RESULTS (Section 1)
List the blank contamination in Section 1 below.
1. Laboratory Blanks ANALYSIS: Total
DATE ICB/CCB# PREP BL ANALYTE CONC/UNITS
ANALYSIS: TCLP
DATE ICB/CCB# PREP BL ANALYTE CONC/UNITS
ANALYSIS: SPLP
DATE ICB/CCB# PREP BL ANALYTE CONC/UNITS

REVIEW OF LABORATORY DATA PACKAGE - INORGANICSINORGANIC CHEMICALS LISTING DETERMINATION
(continued; footnotes follow)
IV. BLANK ANALYSIS RESULTS (Section 2)
List the blank contamination in Section 2 below.
2. Equipment/Trip Blanks
SAMPLE NUMBER ANALYTE CONCENTRATION/ UNITS
RCH-1-SP-05 total calcium 0.211 mg/L
total lead 0.0032 mg/L
3. Frequency Requirements
A. Was a preparation blank analyzed for each matrix, for every 20 samples and for each digestion batch? Yes
B. Was a calibration blank run every 10 samples or every 2 hours whichever is more frequent (inorganicsanalyses only)?
Yes
C. Were the ICB/CCB results <3xIDL (Method 6010 only)? Yes
If not, were samples reanalyzed?
If no, the data may be affected. Use professional judgement to determine the severity of the effect and qualifythe data accordingly. Discuss any actions below and list the samples affected.

REVIEW OF LABORATORY DATA PACKAGE - INORGANICSINORGANIC CHEMICALS LISTING DETERMINATION
(continued; footnotes follow)
IV. BLANK ANALYSIS RESULTS (Section 4)
4. Blank Actions
The Action Level for any analyte is equal to five times the highest concentration of that element's contaminationin any blank. The action level for samples that have been concentrated or diluted should be multiplied by theconcentration/dilution factor. No positive sample results should be reported unless the concentration of theanalyte in the sample exceeds the Action Level (AL). Specific actions are as follows:
1. When the concentration is greater than the IDL, but less than the Action Level, report the sampleconcentration detected with a B.
2. When the sample concentration is greater than the Action Level, report the sample concentration unqualified.
ANALYTEMAX. CONC.
(mg/L) AL (mg/L) ANALYTEMAX.
CONC./UNITS AL/UNITS
Total calcium 0.211 1.055
Total lead 0.0032 0.016
ACTION: None; all results for the affected analyses were much greater than the action levels.

REVIEW OF LABORATORY DATA PACKAGE - INORGANICSINORGANIC CHEMICALS LISTING DETERMINATION
(continued; footnotes follow)
V. ICP INTERFERENCE CHECK SAMPLE (Section 1 & 2)
1. Recovery Criteria
List any elements in the ICS AB solution which did not meet the criteria for %R.
DATE ELEMENT %R ACTION SAMPLES AFFECTED
ACTIONS: None; all criteria met.
For samples with concentrations of Al, Ca, Mg, and Fe or other potential interferents which are 50% or more thantheir respective levels in the ICS, the following actions apply if an element does not meet the %R criteria:
%R Positive results Non-detected results
<50% R R
50-79% L UL
>120% K
2. Frequency Requirements
Were Interference QC samples run at the beginning of each sample analysis run? Yes
If no, the data may be affected. Use professional judgement to determine the severity of the effect and qualifythe data accordingly. Discuss any actions below and list the samples affected.

REVIEW OF LABORATORY DATA PACKAGE - INORGANICSINORGANIC CHEMICALS LISTING DETERMINATION
(continued; footnotes follow)
VI. MATRIX SPIKE/MATRIX SPIKE DUPLICATE (Section 1 & 2)
Sample No.: RCH-1-SP-01 Analysis: Total
1. Recovery Criteria
List the percent recoveries for analyses which did not meet the required criteria.
where SSR = Spiked sample resultSR = Sample resultSA = Spike added
ANALYTE SAMPLE SSR SR SA %R ACTION
Calcium MS 25649.5996 22534.6426 5000 62.3 None; see 1 below
Iron MS 3322.7864 3316.7280 200 3.0 None; see 1 below
MSD 3302.2925 -7.2
Mercury MS 7.0688 6.1792 0.64 139 None; see 1 below
MSD 7.3728 187
Sodium MS 155000 145700 5000 186 None; see 1 below
MSD 141900 -76.0
Titanium MS 96.7559 61.5286 50 70.5 L(+);UL(ND)
MSD 96.1523 69.2
Matrix Spike Actions apply to all samples of the same matrix.
ACTIONS: See table above. In addition, the laboratory ran duplicate analyses for moisture content and pH; allresults were within criteria. Sample RCH-1-SP-05 was used for duplicate analyses for oxidation/reduction; theresult was within criteria.
1. If the sample concentration exceeds the spike concentration by a factor of 4 of more, no action is taken.
2. If any analyte does not meet the %R criteria, follow the actions stated below:
Positive Results Non-detectedResults
%R
Metals/CN Ammonia/Nitrate/Nitrite
L/R 1 R <50% <50%
L UL 50-74% 50-79%
K >125% >120
K/R 1 >135% >1351 Professional judgement will be used to determine the appropriate data qualifier.
2. Frequency Criteria
A. Was a matrix spike prepared at the required frequency? Yes

REVIEW OF LABORATORY DATA PACKAGE - INORGANICSINORGANIC CHEMICALS LISTING DETERMINATION
(continued; footnotes follow)
A separate worksheet should be used for each matrix spike pair.

REVIEW OF LABORATORY DATA PACKAGE - INORGANICSINORGANIC CHEMICALS LISTING DETERMINATION
(continued; footnotes follow)
VI. MATRIX SPIKE/MATRIX SPIKE DUPLICATE (Section 1 & 2)
Sample No.: RCH-1-SP-01 Analysis: TCLP
1. Recovery Criteria
List the percent recoveries for analyses which did not meet the required criteria.
where SSR = Spiked sample resultSR = Sample resultSA = Spike added
ANALYTE SAMPLE SSR SR SA %R ACTION
Boron MSD 16.9117 1.4967 1 308.4 K(+)
Matrix Spike Actions apply to all samples of the same matrix.
ACTIONS: See table above.
1. If the sample concentration exceeds the spike concentration by a factor of 4 of more, no action is taken.
2. If any analyte does not meet the %R criteria, follow the actions stated below:
Positive Results Non-detectedResults
%R
Metals/CN Ammonia/Nitrate/Nitrite
L/R 1 R <50% <50%
L UL 50-74% 50-79%
K >125% >120
K/R 1 >135% >1351 Professional judgement will be used to determine the appropriate data qualifier.
2. Frequency Criteria
A. Was a matrix spike prepared at the required frequency? Yes
A separate worksheet should be used for each matrix spike pair.
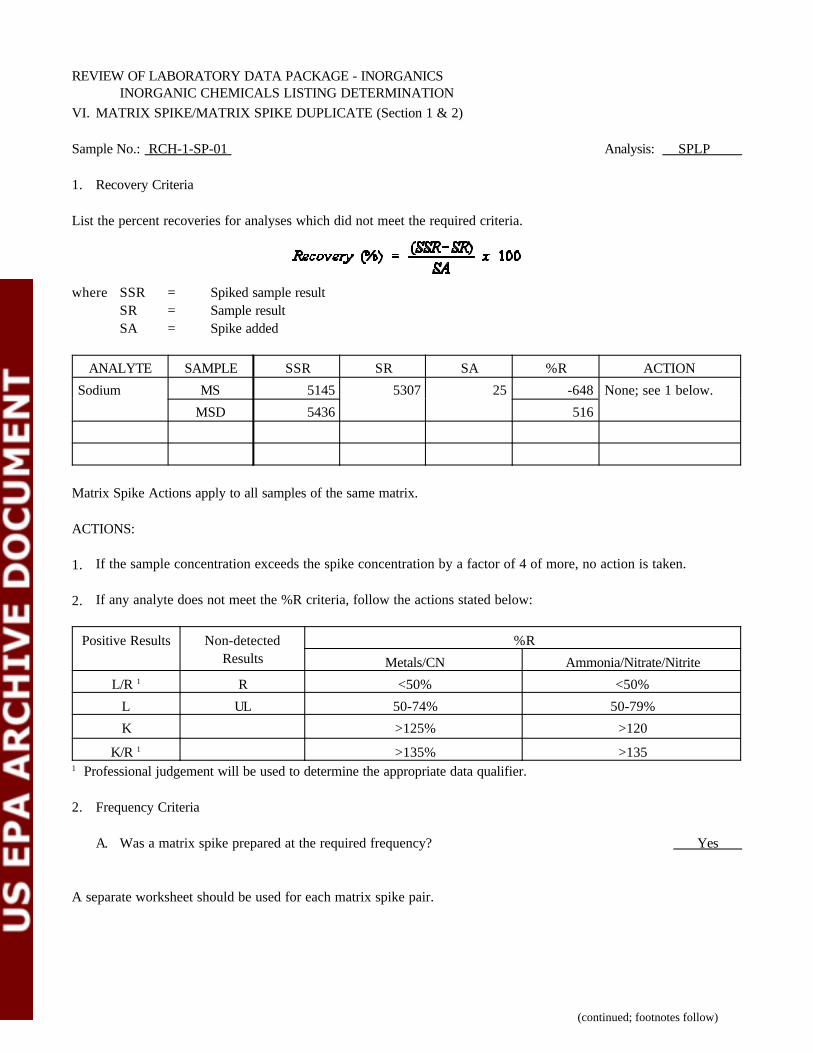
REVIEW OF LABORATORY DATA PACKAGE - INORGANICSINORGANIC CHEMICALS LISTING DETERMINATION
(continued; footnotes follow)
VI. MATRIX SPIKE/MATRIX SPIKE DUPLICATE (Section 1 & 2)
Sample No.: RCH-1-SP-01 Analysis: SPLP
1. Recovery Criteria
List the percent recoveries for analyses which did not meet the required criteria.
where SSR = Spiked sample resultSR = Sample resultSA = Spike added
ANALYTE SAMPLE SSR SR SA %R ACTION
Sodium MS 5145 5307 25 -648 None; see 1 below.
MSD 5436 516
Matrix Spike Actions apply to all samples of the same matrix.
ACTIONS:
1. If the sample concentration exceeds the spike concentration by a factor of 4 of more, no action is taken.
2. If any analyte does not meet the %R criteria, follow the actions stated below:
Positive Results Non-detectedResults
%R
Metals/CN Ammonia/Nitrate/Nitrite
L/R 1 R <50% <50%
L UL 50-74% 50-79%
K >125% >120
K/R 1 >135% >1351 Professional judgement will be used to determine the appropriate data qualifier.
2. Frequency Criteria
A. Was a matrix spike prepared at the required frequency? Yes
A separate worksheet should be used for each matrix spike pair.

REVIEW OF LABORATORY DATA PACKAGE - INORGANICSINORGANIC CHEMICALS LISTING DETERMINATION
(continued; footnotes follow)
VI. MATRIX SPIKE/MATRIX SPIKE DUPLICATE (Section 3)
3. Duplicate Criteria
Sample No.: RCH-1-SP-01 Analysis: Total
List the relative percent difference (RPD) for analyses which did not meet the required criteria.
where RPD = Relative percent differenceMS = Matrix spike valueMSD = Matrix spike duplicate value
ANALYTE MS MSD RPD ACTION
Matrix Spike Actions apply to all samples of the same matrix.
ACTIONS: None; all criteria met. In addition, the laboratory ran duplicate analyses for moisture content and pH;all results were within criteria. Sample RCH-1-SP-05 was used for duplicate analyses for oxidation/reduction; theresult was within criteria.
1. For positive results which have an RPD >25%, use professional judgement to determine whether to estimate(J) or reject (R) the results.
A separate worksheet should be used for each matrix spike pair.

REVIEW OF LABORATORY DATA PACKAGE - INORGANICSINORGANIC CHEMICALS LISTING DETERMINATION
(continued; footnotes follow)
VI. MATRIX SPIKE/MATRIX SPIKE DUPLICATE (Section 3)
3. Duplicate Criteria
Sample No.: RCH-1-SP-01 Analysis: TCLP
List the relative percent difference (RPD) for analyses which did not meet the required criteria.
where RPD = Relative percent differenceMS = Matrix spike valueMSD = Matrix spike duplicate value
ANALYTE MS MSD RPD ACTION
Boron 5.9228 16.9177 96.3 J(+)
Matrix Spike Actions apply to all samples of the same matrix.
ACTIONS: See table above.
1. For positive results which have an RPD >25%, use professional judgement to determine whether to estimate(J) or reject (R) the results.
A separate worksheet should be used for each matrix spike pair.

REVIEW OF LABORATORY DATA PACKAGE - INORGANICSINORGANIC CHEMICALS LISTING DETERMINATION
(continued; footnotes follow)
VI. MATRIX SPIKE/MATRIX SPIKE DUPLICATE (Section 3)
3. Duplicate Criteria
Sample No.: RCH-1-SP-01 Analysis: SPLP
List the relative percent difference (RPD) for analyses which did not meet the required criteria.
where RPD = Relative percent differenceMS = Matrix spike valueMSD = Matrix spike duplicate value
ANALYTE MS MSD RPD ACTION
Matrix Spike Actions apply to all samples of the same matrix.
ACTIONS: None; all criteria met.
1. For positive results which have an RPD >25%, use professional judgement to determine whether to estimate(J) or reject (R) the results.
A separate worksheet should be used for each matrix spike pair.

REVIEW OF LABORATORY DATA PACKAGE - INORGANICSINORGANIC CHEMICALS LISTING DETERMINATION
(continued; footnotes follow)
VII. POST-DIGESTION SPIKE RESULTS (Section 1 & 2)
Sample ID RCH-1-SP-01 Analysis: Total
1. List the percent recoveries for analyses which did not meet the required criteria in the post-digestion spikesample.
S - amount of spike addedSSR - spiked sample resultSR - sample result
SAMPLE ANALYTE SSR SR S %R ACTION
Ti 79.8970 61.5286 25 73.5 L(+);UL(ND)
Post-Digestion Spike Actions apply to all samples of the same matrix.
ACTIONS: See table above. Although the laboratory conducted post-digestion spike analyses for all ICPanalyses, post-digestion spike results were only reported for analyses for which matrix spike recovery failed.
1. If the sample concentration exceeds the spike concentration by a factor of 4 of more, no action is taken.
2. If any analyte does not meet the %R criteria, follow the actions stated below:
Positive resultsNon-detected
results
%R
Methods 6010 and 7196 Methods 7060, 7470, 7471, 7740, and 7841
L R <30% <30%
L UL 30-74% 30-84%
K >125% >115%
2. Frequency Criteria
Was a post-digestion spike prepared at the required frequency? Yes

REVIEW OF LABORATORY DATA PACKAGE - INORGANICSINORGANIC CHEMICALS LISTING DETERMINATION
(continued; footnotes follow)
VII. POST-DIGESTION SPIKE RESULTS (Section 1 & 2)
Sample ID RCH-1-SP-01 Analysis: TCLP
1. List the percent recoveries for analyses which did not meet the required criteria in the post-digestion spikesample.
S - amount of spike addedSSR - spiked sample resultSR - sample result
SAMPLE ANALYTE SSR SR S %R ACTION
Post-Digestion Spike Actions apply to all samples of the same matrix.
ACTIONS: Although the laboratory conducted post-digestion spike analyses for all ICP analyses, post-digestionspike results only were reported for analyses for which matrix spike and matrix spike duplicate recovery failed. No post-digestion spike results were reported for this sample.
1. If the sample concentration exceeds the spike concentration by a factor of 4 of more, no action is taken.
2. If any analyte does not meet the %R criteria, follow the actions stated below:
Positive resultsNon-detected
results
%R
Methods 6010 and 7196 Methods 7060, 7470, 7471, 7740, and 7841
L R <30% <30%
L UL 30-74% 30-84%
K >125% >115%
2. Frequency Criteria
Was a post-digestion spike prepared at the required frequency? Yes

REVIEW OF LABORATORY DATA PACKAGE - INORGANICSINORGANIC CHEMICALS LISTING DETERMINATION
(continued; footnotes follow)
VII. POST-DIGESTION SPIKE RESULTS (Section 1 & 2)
Sample ID RCH-1-SP-01 Analysis: SPLP
1. List the percent recoveries for analyses which did not meet the required criteria in the post-digestion spikesample.
S - amount of spike addedSSR - spiked sample resultSR - sample result
SAMPLE ANALYTE SSR SR S %R ACTION
Post-Digestion Spike Actions apply to all samples of the same matrix.
ACTIONS: Although the laboratory conducted post-digestion spike analyses for all ICP analyses, post-digestionspike results were only reported for analyses for which matrix spike and matrix spike duplicate recovery failed. No post-digestion spike results were reported for this sample.
1. If the sample concentration exceeds the spike concentration by a factor of 4 of more, no action is taken.
2. If any analyte does not meet the %R criteria, follow the actions stated below:
Positive resultsNon-detected
results
%R
Methods 6010 and 7196 Methods 7060, 7470, 7471, 7740, and 7841
L R <30% <30%
L UL 30-74% 30-84%
K >125% >115%
2. Frequency Criteria
Was a post-digestion spike prepared at the required frequency? Yes

REVIEW OF LABORATORY DATA PACKAGE - INORGANICSINORGANIC CHEMICALS LISTING DETERMINATION
(continued; footnotes follow)
VIII. FIELD DUPLICATES
Sample Nos.: , Matrix:
List the concentrations of the compounds for which RPD is $50%.
FRACTION ANALYTE SAMPLECONC.
DUP SAMPLE CONC. RPD ACTION
NOTE: Professional judgement may be utilized to apply duplicate actions.
A separate worksheet should be filled out for each field duplicate pair.
ACTIONS: None; no field duplicate samples were collected.
1. Estimate (J) positive results for elements which have an RPD >50% when sample results are >5x thereporting limit.
2. If sample results are less than 5x the reporting limit, estimate (J) positive results for elements whose absolutedifference is >4x the reporting limit. If both samples are non-detected, the RPD is not calculated (NC).

REVIEW OF LABORATORY DATA PACKAGE - INORGANICSINORGANIC CHEMICALS LISTING DETERMINATION
(continued; footnotes follow)
IX. LABORATORY CONTROL SAMPLE
1. Aqueous LCS
List any LCS recoveries not within the 80-120% criteria and the samples affected.
DATE ANALYTE %R ACTION SAMPLES AFFECTED9/25/99 Total boron 131.6 K(+) RCH-1-SP-0510/6/99 TCLP zinc
(extraction fluid #2)132.0, 183.1 K(+) RCH-1-SP-01, RCH-1-SP-02,
RCH-1-SP-03
10/6/99 SPLP barium 137.0 K(+) RCH-1-SP-01, RCH-1-SP-02,RCH-1-SP-0310/6/99 SPLP boron 77.8, 123.6 J(+);UJ(ND)
2. Solid LCS
List any analyses that were not within the control windows set for the solid LCS sample. The 80-120% criteria isnot used evaluate solid LCS results.
ELEMENT DATE LCS %R CONTROLWINDOWS
ACTION SAMPLES AFFECTED
ACTIONS: See table above.
Aqueous LCS:
%R Positive results Non-detected results
<50% R R
50-79% L UL
>120% K
Solid LCS:
Positive results Non-detected results
<Control Windows L UL
>Control Windows K
3. Frequency Criteria
A. Was an LCS analyzed for every matrix, every digestion batch, and every 20 samples? Yes

REVIEW OF LABORATORY DATA PACKAGE - INORGANICSINORGANIC CHEMICALS LISTING DETERMINATION
(continued; footnotes follow)
X. ICP SERIAL DILUTION ANALYSIS
Serial dilutions were performed for each matrix and results of the diluted sample analysis agreed withinten percent of the original undiluted analysis for analyte concentrations greater than 50x the LODbefore dilution.
Serial dilutions were not performed for the following:
Serial dilutions were performed, but analytical results did not agree within 10% for analyteconcentrations greater than 50x the LOD before dilution.
Report all results below that do not meet the required laboratory criteria for ICP serial dilution analysis.
Analysis: Total
ELEMENT LOD 50xLOD SAMPLERESULT
SERIALDILUTION
%D ACTION
Actions apply to all samples of the same matrix.
ACTIONS: The laboratory conducted serial dilution analyses for ICP analyses only in cases for which matrixspike recovery failed, the sample result was greater than 4 times the spike added, and the sample result wasgreater than 50 times the reporting limit. Serial dilution was not required for any analyses in this sample.
1. Estimate (J) positive results if %D >10%.

REVIEW OF LABORATORY DATA PACKAGE - INORGANICSINORGANIC CHEMICALS LISTING DETERMINATION
(continued; footnotes follow)
X. ICP SERIAL DILUTION ANALYSIS
Serial dilutions were performed for each matrix and results of the diluted sample analysis agreed withinten percent of the original undiluted analysis for analyte concentrations greater than 50x the LODbefore dilution.
Serial dilutions were not performed for the following:
Serial dilutions were performed, but analytical results did not agree within 10% for analyteconcentrations greater than 50x the LOD before dilution.
Report all results below that do not meet the required laboratory criteria for ICP serial dilution analysis.
Analysis: TCLP
ELEMENT LOD 50xLOD SAMPLERESULT
SERIALDILUTION
%D ACTION
Actions apply to all samples of the same matrix.
ACTIONS: The laboratory conducted serial dilution analyses for ICP analyses only in cases for which matrixspike recovery failed, the sample result was greater than 4 times the spike added, and the sample result wasgreater than 50 times the reporting limit. Serial dilution was not required for any analyses in this sample.
1. Estimate (J) positive results if %D >10%.

REVIEW OF LABORATORY DATA PACKAGE - INORGANICSINORGANIC CHEMICALS LISTING DETERMINATION
(continued; footnotes follow)
X. ICP SERIAL DILUTION ANALYSIS
Serial dilutions were performed for each matrix and results of the diluted sample analysis agreed withinten percent of the original undiluted analysis for analyte concentrations greater than 50x the LODbefore dilution.
Serial dilutions were not performed for the following:
Serial dilutions were performed, but analytical results did not agree within 10% for analyteconcentrations greater than 50x the LOD before dilution.
Report all results below that do not meet the required laboratory criteria for ICP serial dilution analysis.
Analysis: SPLP
ELEMENT LOD 50xLOD SAMPLERESULT
SERIALDILUTION
%D ACTION
Actions apply to all samples of the same matrix.
ACTIONS: The laboratory conducted serial dilution analyses for ICP analyses only in cases for which matrixspike recovery failed, the sample result was greater than 4 times the spike added, and the sample result wasgreater than 50 times the reporting limit. Serial dilution was not required for any analyses in this sample.
1. Estimate (J) positive results if %D >10%.

REVIEW OF LABORATORY DATA PACKAGE - INORGANICSINORGANIC CHEMICALS LISTING DETERMINATION
(continued; footnotes follow)
XI. DETECTION LIMIT RESULTS
1. Instrument Detection Limits (IDLs)
IDL results were present and found to be less than the required detection limits.
IDLs were not included in the data package.
X IDLs were present, but the criteria was not met for the following elements: arsenic in wastewaters andleachates (0.00237 mg/L versus 0.002 mg/L target) and thallium in wastewaters and leachates (0.00216mg/L versus 0.0005 mg/L target).
Detection limit requirements were not specified for familiarization samples.
2. Reporting Requirements
Yes Were sample results on Form 1s reported down to the PQL for all analyses?
Yes Were sample weights, volumes, and dilutions taken into account when reporting detection limits?
If not, the reported results may be inaccurate. Make the necessary changes on the data summary tables andrequest that the laboratory resubmit the corrected data.

REVIEW OF LABORATORY DATA PACKAGE - INORGANICSINORGANIC CHEMICALS LISTING DETERMINATION
(continued; footnotes follow)
results in ug / L x 100 mL1.00 g
x 1 L
1000 mL x
1000 g1 kg
x 1 mg
1000 ug= results in mg / kg
1457 mg / L x 100 mL1.00 g
x 1 L
1000 mL x
1000 g1 kg
x 1000 (dilution factor) = 145700 mg / kg
38.62 ug / L x 96 mL0.6 g
x 1 L
1000 mL x
1000 g1 kg
x 1 mg
1000 ug = 6.179 mg / kg
3.25 mg / L x 100 mL10.03 g
x 1 L
1000 mL x
1000 g1 kg
x 10 (dilution factor) = 325 mg / kg
0.0129 mg / L x 50 mL50.01 g
x 1 L
1000 mL x
1000 g1 kg
= 0.0129 mg / kg (< 0.4 mg / kg)
Conc.in ug / L x volume diluted to (mL)
weight digested (g) x
1 L1000 mL
x 1000 g
1 kg x
1 mg1000 ug
= mg / kg
XII. SAMPLE QUANTITATION
X Samples results fall within the linear range for ICP and within the calibrated range for all otherparameters.
Samples results were beyond the linear range/calibration range of the instrument for the followingsamples/elements:
In the space below, please show a minimum of one sample calculation per method type:
ICP: Cr in RCH-1-SP-01 (total): results were reported directly in mg/kg using a correction factor, 0.1 calculatedas follows:
Flame AA: Na in RCH-1-SP-01 (total):
CVAA: Hg in RCH-1-SP-01 (total):
Colorimetric : Fluoride in RCH-1-SP-01:
Cr6+ in RCH-1-SP-01:
For soil samples, the following equation may be necessary to convert raw data values (usually reported in :g/L)to actual sample concentrations (mg/kg):