softbank e-book center tehran, phone: 66403879,66493070...
TRANSCRIPT

1 Introduction
The clamour for energy-saving techniques in almost all branches of industry has acted asa spur in the development of thermal separation equipment. The design and process engi-neering improvements that have ensued entail that feedstocks are subjected to less severetreatment and can thus be optimally exploited. They also entail production under ecologi-cally favourable conditions (cf. Fig. 1.1).
A typical example is provided by low-pressure-drop packing in the vacuum rectification ofmixtures that are unstable to heat and that necessitate a large number of theoretical stagesfor their thermal separation. The attendant decrease in the total pressure drop and operationunder vacuum ensure that the temperature at the bottom of the column is comparativelylow. Hence, decomposition products that are detrimental to the environment can be largelyavoided, i.e. atmospheric pollution is reduced and less residues have to be disposed of.Another advantage is that the reduction in the average column pressure brought about byvacuum operation increases the average relative volatility of the components in the mixtureand thus reduces energy consumption.
Low-pressure-drop, high-performance packing is an essential requirement in the economicdesign of an integrated separation plant, because it permits heat pumps to be installed and anumber of columns to be linked together.
Fig. 1.1. Relationships established by separation techniques between energy consumption, proces-sing and environmental protection
Packed Towers in Processing and Environmental Technology. Reinhard BilletCopyright © 1995 VCH Verlagsgesellschaft mbH, WeinheimISBN: 3-527-28616-0
SOFTbank E-Book Center Tehran, Phone: 66403879,66493070 For Educational Use.

2 1 Introduction
From this point of view, it is not surprising that packing designed to conserve energy hasbeen the subject of many new developments on the part of equipment manufacturers. How-ever, before any one particular type of packing can be selected for a given separation task,adequate knowledge must be available on the performance characteristics, e. g. the separa-tion efficiency, the pressure drop, the liquid holdup, the capacity, and the costs.
A physical model is required to describe the hydraulics and the mass transfer efficiency ina given separation column and thus to allow the main dimensions to be calculated and theprocess engineering performance to be predicted. The parameters that affect the design, thecapacity, and the specific properties of the product and inlet streams must be known in orderto devise the model, and the only means of acquiring these data is by experiment.
Consequently, the aim of this book is to supplement the theoretical considerations by theresults of relevant studies that were performed in the author's laboratories and pilot plantsand were scaled up to meet practical requirements. It is known that packed columns,whether random or stacked, allow lower pressure drops per theoretical stage than platecolumns and are thus better suited to meet demands on optimum energy consumption inthermal separation plants.
The main applications for packed columns are the separation of vapour-liquid orgas-liquid systems, e.g. in rectification, absorption, and desorption. In many cases, theyhave also proved to be superior to conventional plate columns for liquid-liquid extractionprocesses. Greatest significance from the aspect of saving energy is attached to their use inrectification, a subject to which particular attention has been devoted in the course of thisbook.
In future, these separation processes will not be confined to petroleum refineries and thechemical and allied industries. They will also be adopted on a wider scale in ecological engi-neering for purifying off-gas streams and for water treatment, and the demand for the neces-sary equipment, including packing, will grow accordingly.
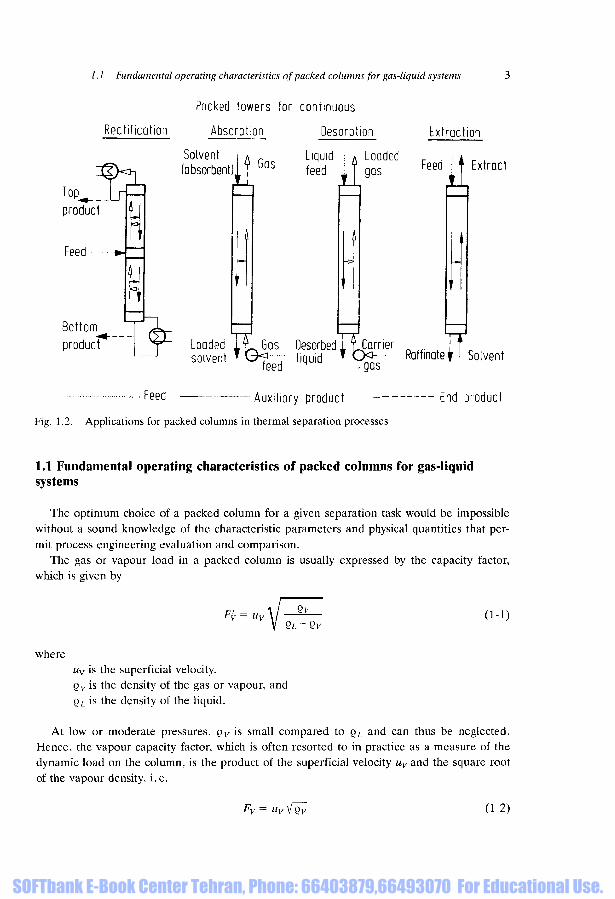
Rectification, absorption, desorption, and liquid-liquid extraction processes consist essen-tially of passing two countercurrent phases through a packed column (cf. Fig. 1.2).
In rectification, the vapour produced in the distillation section of the column flows coun-tercurrent to the liquid formed in a condenser. Contact between the two phases is thusestablished, with the result that the low-boiling component flows upwards and the high boileraccumulates at the bottom of the column.
Physical absorption processes consist of mass transfer from the gas into the liquid phase,i. e. into a solvent that selectively absorbs the desired component from the gas stream. Indesorption - often referred to as stripping - mass transfer proceeds in the opposite direction,i.e. from the liquid into the gas phase.
In the extraction of a component from a mixture of liquids by means of a selective sol-vent, mass transfer takes place between two liquid phases.
It is taken for granted here that the reader is already acquainted with these separationprocesses and their thermodynamic fundamentals together with the literature on the subjectand the standard terminology. The scope of this book has therefore been restricted to a com-prehensive treatment of packed-bed technology and its application to separation processes.
SOFTbank E-Book Center Tehran, Phone: 66403879,66493070 For Educational Use.
/. 1 Fundamental operating characteristics of packed columns for gas-liquid systems
Packed towers for continuous
Rectification Absorption Desorption Extraction
Solvent I A Liquid = A Loaded(absorbent)J { b a s feed : | gas
Feed *
Bottom
product Loadedsolvent
Feed j f Extract
yDesorbedTTcarrier | f
t t / 5 ™ Raff mate ^ I Solventliquid-gas
- Feed — Auxiliary product End product
Fig. 1.2. Applications for packed columns in thermal separation processes
1.1 Fundamental operating characteristics of packed columns for gas-liquidsystems
The optimum choice of a packed column for a given separation task would be impossiblewithout a sound knowledge of the characteristic parameters and physical quantities that per-mit process engineering evaluation and comparison.
The gas or vapour load in a packed column is usually expressed by the capacity factor,which is given by
Fy = Uy (1-1)
whereuv is the superficial velocity,o v is the density of the gas or vapour, andQL is the density of the liquid.
At low or moderate pressures, QV is small compared to QL and can thus be neglected.Hence, the vapour capacity factor, which is often resorted to in practice as a measure of thedynamic load on the column, is the product of the superficial velocity uv and the square rootof the vapour density, i.e.
Fy = Uy \J~Qy~ (1-2)
SOFTbank E-Book Center Tehran, Phone: 66403879,66493070 For Educational Use.
1 Introduction
The maximum permissible value for the capacity factor also depends on a dimensionlessflow parameter that allows for the ratio of the liquid to the vapour flow rate LIV and isgiven by
(1-3)
In practice, the capacity of packed columns is frequently described by the following func-tion, which has to be determined by experiment:
Fy
yfoL(1-4)
A crucial factor in evaluating packed columns, especially those intended for vacuum recti-fication, is the resistance offered by the bed of packing to the flow of vapour.
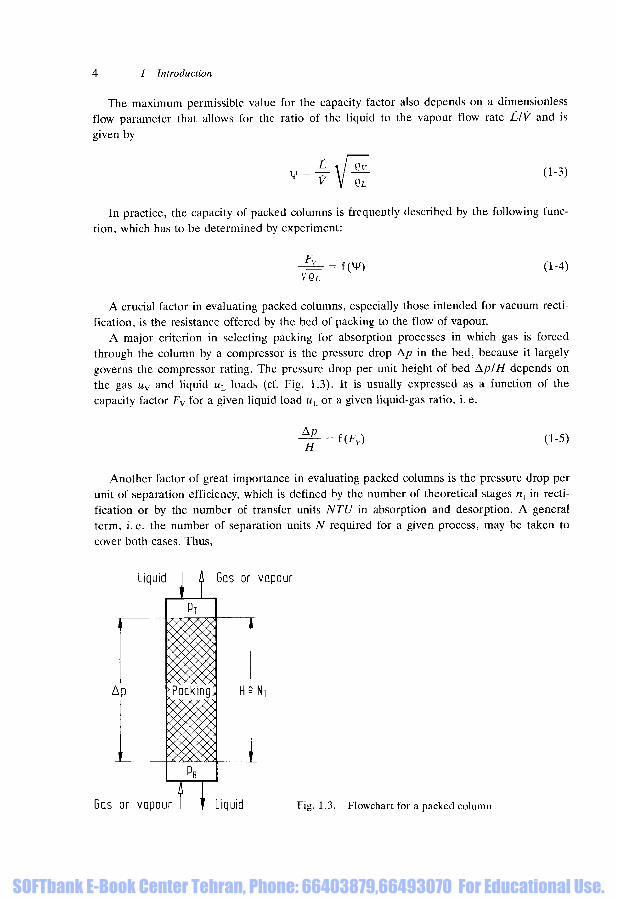
A major criterion in selecting packing for absorption processes in which gas is forcedthrough the column by a compressor is the pressure drop Ap in the bed, because it largelygoverns the compressor rating. The pressure drop per unit height of bed Ap/H depends onthe gas uv and liquid uL loads (cf. Fig. 1.3). It is usually expressed as a function of thecapacity factor F v for a given liquid load uL or a given liquid-gas ratio, i.e.
(1-5)
Another factor of great importance in evaluating packed columns is the pressure drop perunit of separation efficiency, which is defined by the number of theoretical stages nt in recti-fication or by the number of transfer units NTU in absorption and desorption. A generalterm, i.e. the number of separation units N required for a given process, may be taken tocover both cases. Thus,
Liquid Gas or vapour
Ap
PT
H=NT
Gas or vapour I ? Liquid Fig. 1.3. Flowchart for a packed column
SOFTbank E-Book Center Tehran, Phone: 66403879,66493070 For Educational Use.
1.1 Fundamental operating characteristics of packed columns for gas-liquid systems 5
N = nt or N = NTU (1-6)
The total pressure drop in the gas or vapour is given by
&P=PB-PT (1-7)
where pB is the pressure at the lower column inlet andpT is the pressure at the upper column outlet.
In analogy to Eqn (1-5), the total pressure drop per separation unit can be expressed as afunction of the capacity factor for a given ratio LIV of the liquid to the vapour flow rate,i.e.
~ - = HFy) (1-8)
The following relationship thus applies:
^ (1-9)
If the vapour pressure at the top of the column is kept constant during rectification, thatat the bottom of the column - and thus the boiling point - become less as the pressure dropper unit efficiency for the specific bed of packing decreases. Low boiling points are an abso-lute necessity in the vacuum rectification of thermally instable mixtures. They also entaillarger differences between the temperature of the heating medium and that of the mixture,i.e. more effective heat transfer. Moreover, if a large number of theoretical stages isrequired in a given vacuum rectification, a low pressure drop allows entire installations to bedesigned from the aspect of optimum energy consumption.
The number of theoretical stages nt required to separate a binary feed with a molar flowrate F can be determined diagrammatically by the McCabe-Thiele method, which is basedon the concept of an equilibrium stage, i.e. a stage in which the ascending vapour is inphase equilibrium with the descending liquid. An example of the corresponding diagram isshown in Fig. 1.4, in which x¥ is the mole fraction in the feed of the more volatile compo-nent that has to be concentrated to a mole fraction xD in the overhead product (distillate)with a molar flow rate D; and xB is the mole fraction of this volatile fraction that remains inthe bottom product (molar flow rate B). The equilibrium curve is the locus of the points x,y. The two operating lines derived from material balance equations - BI for the strippingzone and DI for the enrichment zone - intersect at the point / on the g-line, which is thelocus of all points of intersection of the two operating lines for any given feed stream.
The number of theoretical stages nt is represented by the steps that link the equilibriumcurve with the two operating lines between the points xB and xD. It is the sum of the numberof stages in the enrichment zone ntez and the number in the stripping zone ntsz, i. e.
nt = nt,ez + nt,sz (1-10)
SOFTbank E-Book Center Tehran, Phone: 66403879,66493070 For Educational Use.

1 Introduction
Number of theoreticalstages nt
Reflux condenser^
Equilibrium curveOperating *i V
0 xB xF xD
Liquid mole fraction x
Fig. 1.4. Determination of the the number of theoretical stages in a continuous rectificationcolumn, taking a binary mixture as an example
If xF, xD and xB are given, nt depends on the phase equilibrium in the mixture, i. e. onthe shape of the equilibrium curve for the binary system, and on the position of the twooperating lines BI and DI.
The position of the intersect / can be obtained from the material balance at the inletcross-section of the column, i.e.
The factor / in this equation is a measure for the thermal state of the feed and is given by
h'F-hF/ = ! - "Ahv
(1-12)
where hF is the molar enthalpy of the feed at the inlet temperature, h'F is the molar enthalpyat the operating temperature in the inlet cross-section of the column, and Ahv is the molarcondensation enthalpy of the vapour stream in the inlet cross-section.
If the individual components of the mixture have roughly the same molar evaporationenthalpy, the molar flow rates of both the vapour and liquid will remain practically constantalong the respective flow paths both above and below the inlet, i.e. in both the enrichmentand stripping zones. In this case, the relationship between the vapour y and the liquid xmole fractions of the more volatile component in the enrichment zone is given by the follow-ing linear equation:
y = r + 1• x +
r + 1(1-13)
SOFTbank E-Book Center Tehran, Phone: 66403879,66493070 For Educational Use.
1.1 Fundamental operating characteristics of packed columns for gas-liquid systems 7
where r is the ratio of the reflux flow rate L to the overhead product flow rate D, i.e.
r = | - d-14)
The corresponding equation for the stripping zone is
where b is the ratio of the flow rate of liquid L in the stripping zone to that of the bottomproduct B, i. e.
b = -j (1-16)
If the values for xF and / are given and those for xD and xB are specified, the operatinglines for the enrichment and stripping zones in Fig. 1.4 can be easily plotted. Inserting x = 0in Eqn (1-13) yields the value for y0 at the intercept with the axis of ordinates, i.e.
d-17)
where xD is the mole fraction of the more volatile component in the overhead product.The reflux ratio r at the head of the column is a factor that greatly affects the economics
of rectification.If the molar evaporation enthalpies for the low-boiling A/z, and the high-boiling Ahh com-
ponents differ significantly, a linear relationship no longer exists between the mole fractionsv and x of the more volatile component in the vapour and in the liquid respectively. In thiscase, allowance for the difference between Aht and Ahh is made by the expression
K- —^— (1-18)Ahh - Ahi
The equation for the enrichment zone is thus no longer linear, i.e.
r + 1y =
r + 1 ^ r + 1 #
The intercept >;0 with the axis of ordinates in this case is given by
— (1-20)
SOFTbank E-Book Center Tehran, Phone: 66403879,66493070 For Educational Use.

8 1 Introduction
Whether its position is higher or lower than the corresponding intercept formed by thelinear relationship {cf. Eqn (1-17)} depends on which of the two components - the high-boiler or the low-boiler - has the greater molar evaporation enthalpy.
Likewise, the relationship for the stripping zone in the column is also nonlinear if themolar evaporation enthalpies of the components differ. In this case, the following equationapplies:
/ yA
*—r (1"21)
where the parameter mI is given by
xF-xBr,+f
m, = ^ ^ (1-22)
the reflux ratio r7 at the inlet cross-section, by
=
and yt and xt are the coordinates of the intersect / (cf. Fig. 1.4).An alternative concept to the number of theoretical stages nt for the evaluation of separa-
tion efficiency is the number of transfer units NTU. If the molar flow rates for the liquid Land the vapour V are kept constant and there is no mixing in the axial direction, the NTUfor steady-state operation can be expressed as follows in the terms of the concentration dif-ference y* - y in the vapour (cf. Fig. 1.5):
—£- (1.24)
where y* is the phase equilibrium concentration of the more volatile component in thevapour in contact with the liquid of concentration x* at the phase boundary in anygiven horizontal cross-section of the column; and
x and y are the fractions that correspond to the concentrations of the more volatilecomponent in the bulk of the vapour and in the liquid respectively.
It may often be assumed that the resistance to mass transfer in rectification is predomi-nantly in the vapour phase, i. e. x —» x*. In this case, the surface mass transfer coefficient inthe liquid phase is |3L —» °o and that in the vapour phase fV is identical to the overall masstransfer coefficient on the vapour side kov. Accordingly, NTUV = NTUOV. The height of atransfer unit is then defined by
SOFTbank E-Book Center Tehran, Phone: 66403879,66493070 For Educational Use.

1.1 Fundamental operating characteristics of packed columns for gas-liquid systems
H HHTUOV =
NTUn dy(1-25)
ye-y
If it is assumed that kov is constant over the height of the column in mass transfer con-trolled by the vapour phase, a mass balance yields
HTUOV =
ds kov aph
(1-26)
where aph is the phase contact area per unit column volume,ds is the column diameter,V is the molar flow rate of the vapour, andHTUOV is usually determined by experiment.
Hence the following relationship exists between the number of theoretical stages per unitheight nt/H and the height of a transfer unit HTUOV:
H HTUn
V
\n[myxy-(1-27)
Liquid mole fraction x
^o x 0
J
(pv)x*=x=kov
"ity*dy x+dx
0&Z7/Z2
y
a = -
Fig. 1.5. Determination of the number of transfer units by the two-film theory
SOFTbank E-Book Center Tehran, Phone: 66403879,66493070 For Educational Use.

10 1 Introduction
In other words, the number of transfer units in systems with a low relative volatility isgiven by
(NTUov)a = smal, = n, (1-28)
Likewise, the height of a transfer unit can be equated to the height equivalent of a theo-retical stage, i.e.
{HTUOy) a , small = HETS = — (1-29)
The stripping factor X for a given section of the column is defined as the product of themean slope myx of the equilibrium curve and the molar vapour/liquid ratio VIL, i. e.
\ = myxj- (1-30)
Once the height of a transfer unit HTUOV and the number of transfer units NTUOV areknown, the height of the column required for the relevant separation process can beobtained from their product. Hence,
c y
H = HTUQV ' NTUOV = HTUOV ^— (1-31)
The figure thus derived is identical to that obtained from the number of theoretical stagesnt and the separation efficiency ntIH for the packing concerned {cf. Eqn (1-27)}, i. e.
H =
An analogous analysis applies for mass transfer in the liquid phase.This procedure for the determination of column height is referred to in the literature as
the HTU-NTU concept. It is applied in Chapters 3, 5 and 14.The efficiency, expressed as the number of separation units per unit height NIH, can be
assessed graphically from its relationship to the column load or capacity factor, which can bewritten as
NIH = i{Fv) (1-33)
A knowledge of this function is essential in determining the load relationships for thepressure drop per unit height AplH {Eqn (1-5)} and the pressure drop per separation unitAp/TV {Eqn (1-8)}.
These relationships allow the column volume vv per unit of vapour flow rate and unit ofseparation efficiency to be determined in terms of the capacity factor /v{Eqn (1-34)} or thepressure drop per unit of separation efficiency ApIN {Eqn (1-35)}, i. e.
SOFTbank E-Book Center Tehran, Phone: 66403879,66493070 For Educational Use.
1.2 Theoretical column efficiency 11
vv=i(Fv) (1-34)
vv=f(Ap/N) (1-35)
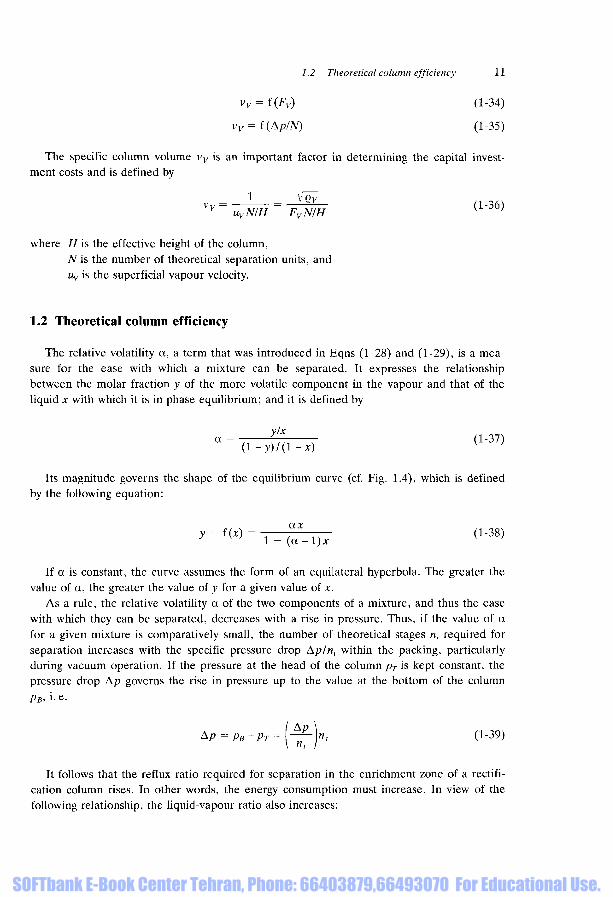
The specific column volume vv is an important factor in determining the capital invest-ment costs and is defined by
where H is the effective height of the column,N is the number of theoretical separation units, anduv is the superficial vapour velocity.
1.2 Theoretical column efficiency
The relative volatility a, a term that was introduced in Eqns (1-28) and (1-29), is a mea-sure for the ease with which a mixture can be separated. It expresses the relationshipbetween the molar fraction y of the more volatile component in the vapour and that of theliquid x with which it is in phase equilibrium; and it is defined by
Its magnitude governs the shape of the equilibrium curve (cf. Fig. 1.4), which is definedby the following equation:
y = f w = i + (a / i ) x ^ - 3 8 )
If a is constant, the curve assumes the form of an equilateral hyperbola. The greater thevalue of a, the greater the value of y for a given value of x.
As a rule, the relative volatility a of the two components of a mixture, and thus the easewith which they can be separated, decreases with a rise in pressure. Thus, if the value of afor a given mixture is comparatively small, the number of theoretical stages nt required forseparation increases with the specific pressure drop Ap/nt within the packing, particularlyduring vacuum operation. If the pressure at the head of the column pT is kept constant, thepressure drop Ap governs the rise in pressure up to the value at the bottom of the columnpB, i.e.
[^y (1-39)
It follows that the reflux ratio required for separation in the enrichment zone of a rectifi-cation column rises. In other words, the energy consumption must increase. In view of thefollowing relationship, the liquid-vapour ratio also increases:
SOFTbank E-Book Center Tehran, Phone: 66403879,66493070 For Educational Use.
12 1 Introduction
L_V r + 1
(1-40)
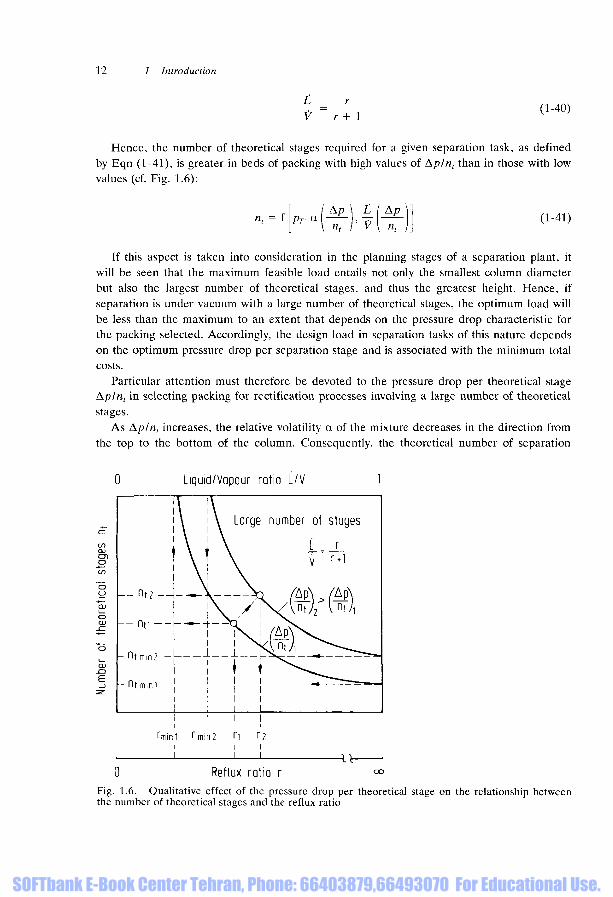
Hence, the number of theoretical stages required for a given separation task, as definedby Eqn (1-41), is greater in beds of packing with high values of Ap/n, than in those with lowvalues (cf. Fig. 1.6):
Ap ApV\ n,
(1-41)
If this aspect is taken into consideration in the planning stages of a separation plant, itwill be seen that the maximum feasible load entails not only the smallest column diameterbut also the largest number of theoretical stages, and thus the greatest height. Hence, ifseparation is under vacuum with a large number of theoretical stages, the optimum load willbe less than the maximum to an extent that depends on the pressure drop characteristic forthe packing selected. Accordingly, the design load in separation tasks of this nature dependson the optimum pressure drop per separation stage and is associated with the minimum totalcosts.
Particular attention must therefore be devoted to the pressure drop per theoretical stageAp/nt in selecting packing for rectification processes involving a large number of theoreticalstages.
As Ap/nt increases, the relative volatility a of the mixture decreases in the direction fromthe top to the bottom of the column. Consequently, the theoretical number of separation
0 Liquid/Vapour ratio L/V
Reflux ratio rFig. 1.6. Qualitative effect of the pressure drop per theoretical stage on the relationship betweenthe number of theoretical stages and the reflux ratio
SOFTbank E-Book Center Tehran, Phone: 66403879,66493070 For Educational Use.

1.2 Theoretical column efficiency 13
stages nt ought to be higher than that in an isobaric column (ntiso), i.e. a column in whichthere is theoretically no pressure drop, and the ratio ntisolnt {Eqn (1-42)} can be regarded asthe theoretical column efficiency r\c {Eqn (1-43)}:
(nt) Ap/nt = 0 = nttiso
(nt) Ap/m > 0 nt
f [pT, a r Ap/nt> nt(L/V,
(1-42)
(1-43)
In other words, the theoretical column efficiency depends on the operating pressure pT
and relative volatility aT at the top of the column, the pressure drop per separation stageAp/nt, and the number of theoretical stages nt.
The value of r\c thus varies from the one separation task to another. It is comparativelydifficult to calculate x\c accurately from phase equilibrium relationships, and a graphical-mathematical method based on the qualitative method shown in Fig. 1.7 would therefore bemore expedient for the evaluation of Eqn (1-41). This plot is analogous to that proposed byGilliland for isobaric (theoretically Ap/nt = 0) columns. The ordinates in the diagram arereferred to as stage-number parameters and are defined by Eqn (1-44) for isobaric and byEqn (1-45) for nonisobaric columns, i. e.
_ ft t, iso ^t,min,iso _- , 1 -
nt,iso ~ L
llt llt,min,isoS - „ . 1 - SWnt > 0
(1-44)
(1-45)
Fig. 1.7. Determination of the theoreticalcolumn efficiency
o(v-D
v rr
e=-mm,iso •
Energy parameter
vg rmin,iso+
The abscissae are referred to as energy parameters and are defined by Eqn (1-46) for iso-baric and Eqn (1-47) for nonisobaric columns, i. e.
SOFTbank E-Book Center Tehran, Phone: 66403879,66493070 For Educational Use.
14 1 Introduction
riso-rmin.iso (v-l)rminjso = e ^ = o ( 1 . 4 6 )
j 7
^ + 1 vg rw/n /50 + 1
According to Eqn (1-46), the reflux ratio riso in the isobaric column exceeds the mini-mum rminJso by a factor v, i. e.
Similarly, according to Eqn (1-47), the reflux ratio r in the real column exceeds the mini-mum in the isobaric column rminiso by a factor vg, i.e.
f = Vg rmin,iso (!-49)
If the factor v by which the actual reflux ratio exceeds the minimum rmin in the realcolumn is the same as that for the isobaric column, as determined by Eqn (1-47), the follow-ing equation would apply:
r = v rmin (1-50)
In this case, the factor vg for the real column is given by Eqn (1-51), which is obtained bycombining Eqns (1-49) and (1-50); and the reflux ratio r for the real column, by Eqn(1-52), which is obtained by combining Eqns (1-48) and (1-50), i. e.
(1-51)
r =ris0^shL- (1-52)'min, iso
This method allows the number of theoretical stages nt and the reflux ratio r for a realcolumn to be determined from the corresponding values ntminiso and rminiso for an isobariccolumn.
The theoretical column efficiency, as defined by Eqn (1-42), can then be obtained quiteeasily in the light of the qualitative diagram in Fig. 1.7. The following relationships applyand can be evaluated by alternative means:
t, min. iso iso s-i co\
r ] c = — —^—J (1-53)
1 - 5 d-54)v\c = nt,isont,min,iso ' ^
= _Lz±_ numinAso + siso
*- ^iso nt,min,iso ' 3
SOFTbank E-Book Center Tehran, Phone: 66403879,66493070 For Educational Use.
1.2 Theoretical column efficiency 15
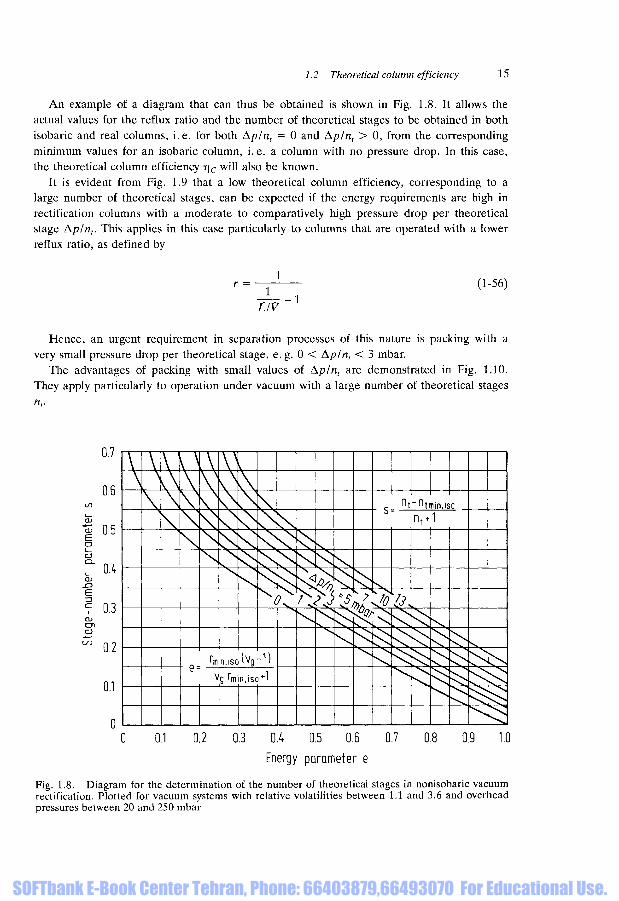
An example of a diagram that can thus be obtained is shown in Fig. 1.8. It allows theactual values for the reflux ratio and the number of theoretical stages to be obtained in bothisobaric and real columns, i.e. for both Ap/nt = 0 and Aplnt > 0, from the correspondingminimum values for an isobaric column, i.e. a column with no pressure drop. In this case,the theoretical column efficiency r\c will also be known.
It is evident from Fig. 1.9 that a low theoretical column efficiency, corresponding to alarge number of theoretical stages, can be expected if the energy requirements are high inrectification columns with a moderate to comparatively high pressure drop per theoreticalstage Ap/nt. This applies in this case particularly to columns that are operated with a lowerreflux ratio, as defined by
1(1-56)
Hence, an urgent requirement in separation processes of this nature is packing with avery small pressure drop per theoretical stage, e.g. 0 < Ap/nt < 3 mbar.
The advantages of packing with small values of Ap/nt are demonstrated in Fig. 1.10.They apply particularly to operation under vacuum with a large number of theoretical stagesnt.
0.7
0.6
0.5
0.4
0.3
0.2
0.1
V\
\\
\
\A\\ s
s\
AV
N
V\
rs
\
nnin.iso 'Vg ~ ' )
Vg m i n. i s o "*"'
s
s nt-ntmin.iso
2X
\
1
\
^ \
0.1 0.2 0.3 0.4 0.5 0.6 0.7
Energy parameter e
0.8 0.9 1.1
Fig. 1.8. Diagram for the determination of the number of theoretical stages in nonisobaric vacuumrectification. Plotted for vacuum systems with relative volatilities between 1.1 and 3.6 and overheadpressures between 20 and 250 mbar
SOFTbank E-Book Center Tehran, Phone: 66403879,66493070 For Educational Use.

16
cien
effi
colu
mn
eon
1.0
0.8
0.6
0.4
0.2
Introductior
Ap/n t= 6.5 fnbar
I
f
/
\ —-—
" C
. —', l
•
Ap/nt = 13mbar
x B = 2 0 0 ppm»» —i — •
"1PT
k-720 f
=15C= 0 1= 0.9
T "7r~~
)pm
mb(53 ]47
f =1
• •
Jl
90 100 110 120 130 140 150Reflux ratio r
Fig. 1.9. Theoretical column efficiency as a function of the reflux ratio in the rectification of amixture of thionyl chloride and ethylene chloride
too
0.96
0.92
0.88
0.84
0.80
- 0.76
0.72
0.68
10 20 40 60 100 200 400 600 1000
Pressure at head of column pT [mbar]
Fig. 1.10. Theoretical column efficiency as a function of the overhead pressure
g
/
/
/
\
/
/
A'J
/
I//7/
A/
/ I
J
/
/
7
\ j
7/
/
/ /
1 /
*
V
, •
xD=0.9995, a T = \M
^tmin.Jso = ^L
= = = : ? -
SOFTbank E-Book Center Tehran, Phone: 66403879,66493070 For Educational Use.

1.3 Energy consumption and number of theoretical stages
1.3 Energy consumption and number of theoretical stages
17
One of the most important tasks in planning rectification plants is the exact determinationof the relationship expressed by Eqn (1-41), i. e. between the number of theoretical stages nt
and the reflux ratio r that corresponds to a constant pressure pT at the top of the column andthat is required to separate a mixture with low-boiling mole fractions of xF, xD and xB in thefeed, distillate and bottoms. This relationship forms the basis for all optimization calcula-tions by fixing the mutual dependence of capital expenditure and the costs of utilities.
This is demonstrated qualitatively in Fig. 1.11. The number of theoretical stages underotherwise identical conditions is theoretically higher in the separation of systems with a lowrelative volatility a than of systems with a high one. This relationship can be expressed in ther-modynamic terms and, as has been demonstrated in Section 1.2, is of particular importancein planning rectification processes with a large number of theoretical stages designed toseparate mixtures whose relative volatilities are comparatively small and, furthermore,become even less at higher pressures. The economics in cases of this nature dictate the useof packing with a low pressure drop per theoretical stage Ap/nt. This requirement is illus-trated qualitatively in Fig. 1.6, which shows the number of theoretical stages nt as a functionof the reflux ratio r for columns with low and high values of Ap/nt. A diagram of this natureis characteristic for the vacuum rectification of a mixture whose relative volatility a is com-paratively small at a column overhead pressure pT and becomes progressively smaller as aresult of the rise in pressure that occurs as the mixture descends through the column.
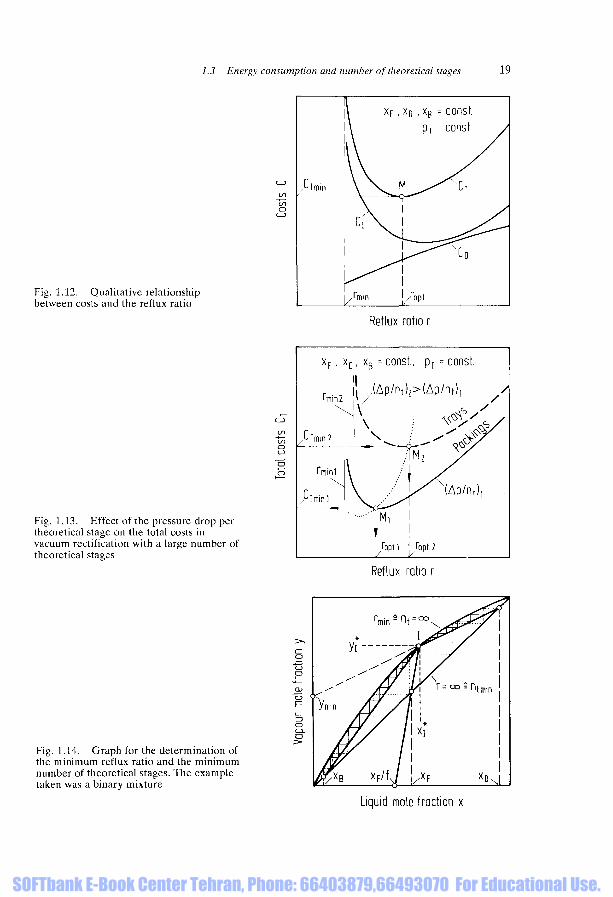
Economic limits are imposed on the pressure drop per theoretical stage Ap/nt in separa-tion tasks of this nature, because the minimum total costs CT>min, i.e. the sum of the capitalinvestment C7 and the operating costs Co, shifts towards high reflux ratios r and towardslarge numbers of theoretical stages. The relationship is shown qualitatively in Fig. 1.12. Theconsequence of the shift is a pronounced rise in the minimum total costs CT>min, as is evidentfrom the qualitative diagram presented in Fig. 1.13. The only economic solution for vacuumrectification in this case is to install low-pressure-drop, highly efficient packing, because itallows considerable savings in costs.
Fig. 1.11. Qualitative relationshipbetween the number of theoretical stagesand the reflux ratio with the relativevolatility as parameter
COCDCO•CO1D3I
man!
o
IZD
)
\ xF , xD , xB = const
\ \
rmini ^ ^ " ^ ^
Reflux ratio r
SOFTbank E-Book Center Tehran, Phone: 66403879,66493070 For Educational Use.
18 1 Introduction
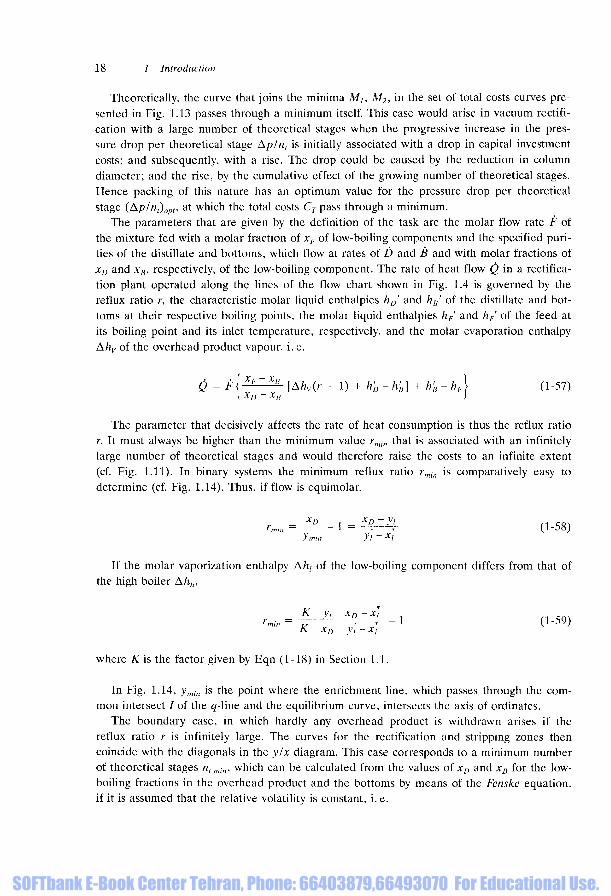
Theoretically, the curve that joins the minima M7, M2, in the set of total costs curves pre-sented in Fig. 1.13 passes through a minimum itself. This case would arise in vacuum rectifi-cation with a large number of theoretical stages when the progressive increase in the pres-sure drop per theoretical stage Ap/nt is initially associated with a drop in capital investmentcosts; and subsequently, with a rise. The drop could be caused by the reduction in columndiameter; and the rise, by the cumulative effect of the growing number of theoretical stages.Hence packing of this nature has an optimum value for the pressure drop per theoreticalstage (Ap/nt)opt, at which the total costs CT pass through a minimum.
The parameters that are given by the definition of the task are the molar flow rate F ofthe mixture fed with a molar fraction of xF of low-boiling components and the specified puri-ties of the distillate and bottoms, which flow at rates of D and B and with molar fractions ofxD and xB, respectively, of the low-boiling component. The rate of heat flow Q in a rectifica-tion plant operated along the lines of the flow chart shown in Fig. 1.4 is governed by thereflux ratio r, the characteristic molar liquid enthalpies hD' and hB of the distillate and bot-toms at their respective boiling points, the molar liquid enthalpies hF and hF of the feed atits boiling point and its inlet temperature, respectively, and the molar evaporation enthalpyAhvof the overhead product vapour, i.e.
_ hxD - xB
The parameter that decisively affects the rate of heat consumption is thus the reflux ratior. It must always be higher than the minimum value rmin that is associated with an infinitelylarge number of theoretical stages and would therefore raise the costs to an infinite extent(cf. Fig. 1.11). In binary systems the minimum reflux ratio rmin is comparatively easy todetermine (cf. Fig. 1.14). Thus, if flow is equimolar,
- x° 1 - x° ~yi n snmin~ ymin yl-x] ( 1 " 5 8 )
If the molar vaporization enthalpy A/i, of the low-boiling component differs from that ofthe high boiler Ahh,
r = K~yi XD~X' - 1 (1-59)r""" K-xD yi-x, ( 1 5 9 )
where K is the factor given by Eqn (1-18) in Section 1.1.
In Fig. 1.14, ymin is the point where the enrichment line, which passes through the com-mon intersect / of the g-line and the equilibrium curve, intersects the axis of ordinates.
The boundary case, in which hardly any overhead product is withdrawn arises if thereflux ratio r is infinitely large. The curves for the rectification and stripping zones thencoincide with the diagonals in the ylx diagram. This case corresponds to a minimum numberof theoretical stages ntmin, which can be calculated from the values of xD and xB for the low-boiling fractions in the overhead product and the bottoms by means of the Fenske equation,if it is assumed that the relative volatility is constant, i.e.
SOFTbank E-Book Center Tehran, Phone: 66403879,66493070 For Educational Use.
1.3 Energy consumption and number of theoretical stages 19
Fig. 1.12. Qualitative relationshipbetween costs and the reflux ratio
Fig. 1.13. Effect of the pressure drop pertheoretical stage on the total costs invacuum rectification with a large number oftheoretical stages
00 <L ' \ IV.
Reflux ratio r
c
c
x F . '
Tmin 2
Tmini
Tmin 1
<D
'I
"11
1
\
\
X
m
\
3 = const
jAp/nt)
/
M,
/opii
•• P T = const.
p(Ap/nt), ^ /
>
/opt 2
/x(Ap/nt),
Reflux ratio r
Fig. 1.14. Graph for the determination ofthe minimum reflux ratio and the minimumnumber of theoretical stages. The exampletaken was a binary mixture
Liquid mole fraction x
SOFTbank E-Book Center Tehran, Phone: 66403879,66493070 For Educational Use.
20 1 Introduction
ntmin = T1- In (-^- ±^A- 1 (1-60)In a \ 1 - xD xB I
In many cases, a rough estimation can be obtained from the following relationship, whichis obtained by ignoring the enthalpy differences h'D - h'B and h'B - hF in Eqn (1-57):
4 ~ ^ ^ (r + 1) A/V (1-61)t xD - xB
It follows that, if the reflux ratio r is very high, it is almost directly proportional to theenergy consumption Q in rectification processes.
1.4 Height of bed determined from the HTU-NTU model
The HTU-NTU model for the determination of the requisite height of a bed of packinghas previously been described by Eqn (1-31).
The height of an overall transfer unit HTUO, i. e. for both the vapour HTUOV and liquidHTUOL phases, is related to the respective heights for the individual phases HTUV andHTUL by the stripping factor X, which is defined by Eqn (1-30). Thus Eqn (1-62) applies forthe vapour phase; and Eqn (1-63), for the liquid phase:
HTUOV = HTUV + X HTUL (1-62)
HTUOL = HTUL + — HTUV (1-63)A,
Therefore, the height H required to realize NTUOV transfer units in the vapour phase isgiven by Eqn (1-64); and NTUOL in the liquid phase, by Eqn (1-65):
H = HTUOV ' NTUOV (1-64)
H = HTUOL • NTUOL (1-65)
The procedure for the determination of the numerical values of NTUOV and NTUOL isillustrated qualitatively in Fig. 1.5.
A knowledge of the slope myx of the equilibrium curve for the system is required for thedetermination of the stripping factor A, from Eqn (1-30). If the relative volatility is almostconstant in the range of concentrations concerned, the slope can be obtained as a functionof the mole fraction x of the liquid phase by differentiating Eqn (1-38), i. e.
(myx) a . cons, = - ^ = [l+xla_1)f d-66)
Thus the calculation of the effective height of bed consists essentially of determining thevalues for HTUV and HTUL as described in Chapter 5.
SOFTbank E-Book Center Tehran, Phone: 66403879,66493070 For Educational Use.

1.4 Height of bed determined from the HTU-NTU model 21
The equilibrium curve for absorption and desorption processes is often linear in therange of low transfer component loads Yin the gas and X in the liquid. In other words, theslope mYx of the Y = f(X) relationship can be regarded as constant, and the equilibriumcurve can be defined by
Y=mYXX (1-67)
The stripping factor in this case is then given by
where L/Vis the ratio of the liquid to the gas flow rate.
SOFTbank E-Book Center Tehran, Phone: 66403879,66493070 For Educational Use.

SOFTbank E-Book Center Tehran, Phone: 66403879,66493070 For Educational Use.