software design and architecture lecture 21. review analysis phase (object oriented design)...
TRANSCRIPT

SOFTWARE DESIGN AND ARCHITECTURE
LECTURE 21

Review
• ANALYSIS PHASE (OBJECT ORIENTED DESIGN)• Functional Modeling– Use case• Diagram• Description
Outline
• ANALYSIS PHASE (OBJECT ORIENTED DESIGN)• Functional Modeling– Activity Diagrams

System Modeling
• System modeling is the process of developing abstract models of a system, with each model presenting a different view or perspective of that system.
• System modeling has generally come to mean representing the system using some kind of graphical notation, which is now almost always based on notations in the Unified Modeling Language (UML).

System Modeling
• Models are used – during the requirements engineering process to
help derive the requirements for a system, – during the design process to describe the system
to engineers implementing the system and – after implementation to document the system’s
structure and operation.

Analysis Models
• At an early stage in the specification of a system, we need to decide on the system boundaries. – This involves working with system stakeholders to decide
what functionality should be included in the system and what is provided by the system’s environment.
• We need to decide that automated support for some business processes should be implemented but – others should be manual processes or supported by
different systems.

Modeling System Interactions
• All systems involve interaction of some kind. – user interaction, which involves user inputs and
outputs, interaction between the system being developed
• Modeling user interaction is important as it helps to identify user requirements.

Modeling System interactions
• For modeling system interactions we can use– Use case modeling, – which is mostly used to model interactions
between a system and external actors (users or other systems).

ACTIVITY DIAGRAM

Activity Diagram
• Activity diagrams are for modeling business processes, workflows, data flows, and complex algorithms.
• Based on data flow models – a graphical representation (with a Directed Graph) of how data move around an information system.
• An activity diagram shows sequential and parallel activities in a process.

Activity Diagram
• Activity diagrams are the object-oriented equivalent of flow charts and data-flow diagrams from structured development
• Activity diagrams describe the workflow behavior of a system
• Activity diagram illustrates the dynamic nature of a system by modeling the flow of control from activity to activity

When to Use Activity Diagrams ?
• To explore the logic of
– a complex operation– a complex business rule– a single use case– several use cases– a business process– software processes
• Useful for showing workflow and parallel processing

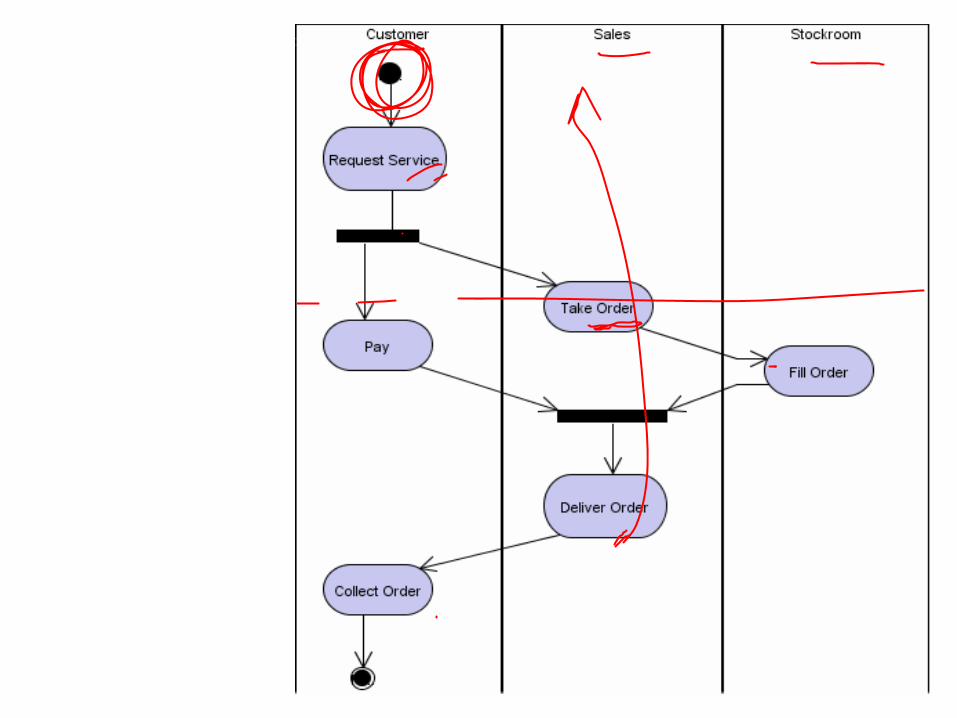
Example

Scenario
• Customer places an order• The sales assistant receives the order and
processes it.• After successful order processing the order is
filled.• The customer makes payment and the order is
delivered/shipped to him by sales rep.

Example 1:

16
Actions
• The fundamental unit of executable functionality in an activity
• The execution of an action represents some transformations or processes in the modeled system (creating objects, setting attribute values, linking objects together, invoking user-defined behaviours, etc.)
Description of the action behaviour

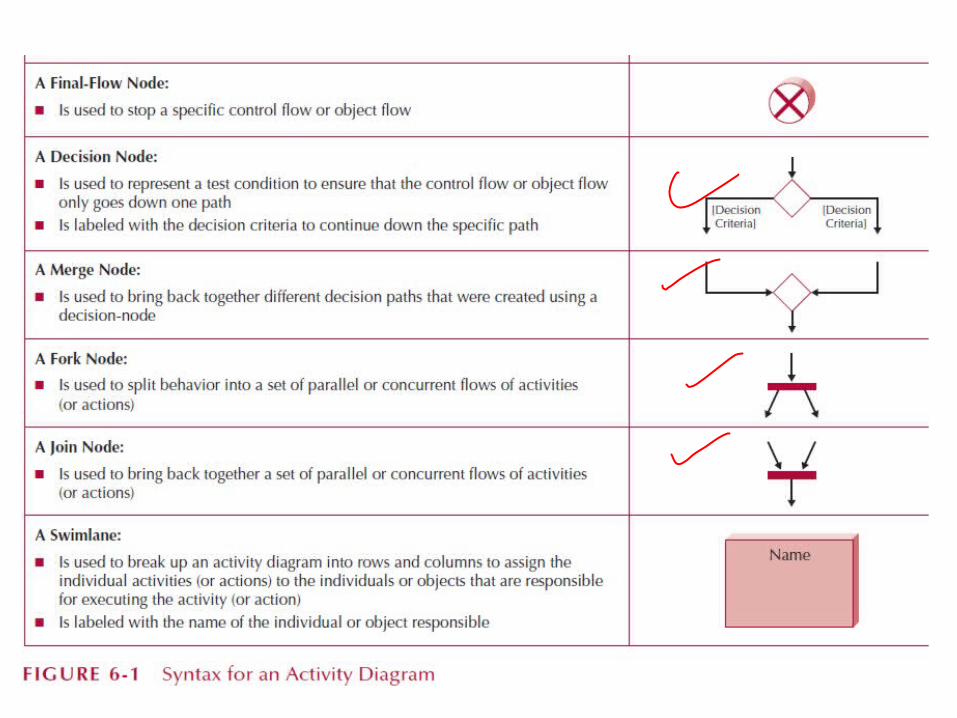
Control nodes – initial nodes
17
• In an activity the flow starts in initial nodes, that return the control immediately along their outgoing edges

Control nodes – decision nodes
18
• Route the flow to one of the outgoing edges

Control nodes – merge nodes
19
• Bring together multiple alternate flows• All controls and data arriving at a merge node
are immediately passed to the outgoing edge

Control nodes – fork nodes
20
• Fork nodes split flows into multiple concurrent flows

Control nodes – join nodes
21
• Join nodes synchronize multiple flows

Control nodes – final nodes
22
• Final node:– the activity is terminated when the first token arrives


Appointment management
Usecase:• Get patient information• If new patient, then create a record and
proceed to payment arrangements• Else proceed to payment arrangements • Create a new appointment OR change an
existing appointment OR remove an old appointment.

Appointment management
• Get patient information• If new patient, then create
a record and proceed to payment arrangements
• Else proceed to payment arrangements
• Create a new appointment OR change an existing appointment OR remove an old appointment.

Patient Information System

Swim lanes, which represent responsibilities of one or more objects for actions within an overall activity; that is, they divide the activity states into groups and assign these groups to objects that must perform the activities.
Swim Lane
28

Activity Diagrams: Swim lanes
29
OpenIncident
AllocateResources
CoordinateResources
DocumentIncident
ArchiveIncident
Dispatcher
FieldOfficer
Actions may be grouped into swim lanes to denote the object or subsystem that implements the actions.
Example-2


Receive Order
Check OrderItem
DispatchOrder
Authorize Payment
Cancel Order
Add Remainderto Stock
[succeeded]
[failed]Assign to Order
Receive Supply
Choose Outstanding Order Items
Assign to Order
* for each chosenorder item
[in stock]
*for each order item
[need to reorder]
Reorderitem
[all outstanding order items filled]
[stock assigned to all order itemsand payment authorized]
OrderProcessing
accounts StockManager
vertical linesare used to separate“swimlanes”to show which activities are handledby which part of thesystem
32


Summary
• Analysis Level Design– Activity Diagrams