software metrics sucess, failures and new directions
TRANSCRIPT

1
Software Metrics:Successes, Failures and New Directions
Norman E Fenton
Centre for Software Reliability Agena LtdCity University 11 Main Street
Northampton Square CaldecoteLondon EC1V OHB Cambridge CB3 7NU
United Kingdom United KingdomTel: 44 171 477 8425 Tel 44 1223 263753 / 44 181 530 5981Fax: 44 171 477 8585 Fax: 01223 263899
[email protected] [email protected]/people/norman.fenton/ www.agena.co.uk
Abstract
The history of software metrics is almost as old as the history of software engineering. Yet, the extensiveresearch and literature on the subject has had little impact on industrial practice. This is worrying given thatthe major rationale for using metrics is to improve the software engineering decision making process from amanagerial and technical perspective. Industrial metrics activity is invariably based around metrics that havebeen around for nearly 30 years (notably Lines of Code or similar size counts, and defects counts). While suchmetrics can be considered as massively successful given their popularity, their limitations are well known, andmis-applications are still common. The major problem is in using such metrics in isolation. We argue that it ispossible to provide genuinely improved management decision support systems based on such simplisticmetrics, but only by adopting a less isolationist approach. Specifically, we feel it is important to explicitlymodel: a) cause and effect relationships and b) uncertainty and combination of evidence. Our approach usesBayesian Belief nets which are increasingly seen as the best means of handling decision-making underuncertainty. The approach is already having an impact in Europe.
1. Introduction‘Software metrics’ is the rather misleading collective term used to describe the wide range of activitiesconcerned with measurement in software engineering. These activities range from producing numbers thatcharacterise properties of software code (these are the classic software ‘metrics’) through to models that helppredict software resource requirements and software quality. The subject also includes the quantitative aspectsof quality control and assurance - and this covers activities like recording and monitoring defects duringdevelopment and testing. Although there are assumed to be many generic benefits of software metrics (see forexample the books [DeMarco 1982, Gilb 1987, Fenton and Pfleeger 1996, Jones 1991]), it is fair to say thatthe most significant is to provide information to support managerial decision making during softwaredevelopment and testing. With this focus we provide here a dispassionate assessment of the impact ofsoftware metrics (both industrially and academically) and the direction we feel the subject might now usefullytake.
We begin our assessment of the status of software metrics with a necessary look at its history in Section 2. Itis only in this context that we can really judge its successes and failures. These are described in Section 3. Ifwe judge the entire software metrics subject area by the extent to which the level of metrics activity hasincreased in industry then it has been a great success. However, the increased industrial activity is not relatedto the increased academic and research activity. The ‘metrics’ being practised are essentially the same basicmetrics that were around in the late 1960’s. In other words these are metrics based around LOC (or verysimilar) size counts, defect counts, and crude effort figures (in person months). Industrialists have acceptedthe simple metrics and rejected the esoteric because they are easy to understand and relatively simple tocollect. Our objective is to use primarily these simple metrics to build management decision support tools thatcombine different aspects of software development and testing and enable managers to make many kinds ofpredictions, assessments and trade-offs during the software life-cycle. Most of all our objective is to handle

2
the key factors largely missing from the usual metrics models: uncertainty and combining different (oftensubjective) evidence. In Section 4 we explain why traditional (largely regression-based) models areinadequate for this purpose. In Section 5 we explain how the exciting technology of Bayesian nets (which ishidden to users) helps us meet our objective.
2. History of software metrics as a subject areaTo assess the current status of software metrics, and its successes and failures, we need to consider first itshistory. Although the first dedicated book on software metrics was not published until 1976 [Gilb 1976], thehistory of active software metrics dates back to the late-1960’s. Then the Lines of Code measure (LOC orKLOC for thousands of lines of code) was used routinely as the basis for measuring both programmerproductivity (LOC per programmer month) and program quality (defects per KLOC). In other words LOCwas being used as a surrogate measure of different notions of program size. The early resource predictionmodels (such as those of [Putnam 1978] and [Boehm 1981]) also used LOC or related metrics like deliveredsource instructions as the key size variable. In 1971 Akiyama [Akiyama 1971] published what we believe wasthe first attempt to use metrics for software quality prediction when he proposed a crude regression-basedmodel for module defect density (number of defects per KLOC) in terms of the module size measured inKLOC. In other words he was using KLOC as a surrogate measure for program complexity.
The obvious drawbacks of using such a crude measure as LOC as a surrogate measure for such differentnotions of program size such as effort, functionality, and complexity, were recognised in the mid-1970’s. Theneed for more discriminating measures became especially urgent with the increasing diversity ofprogramming languages. After all, a LOC in an assembly language is not comparable in effort, functionality,or complexity to a LOC in a high-level language. Thus, the decade starting from the mid-1970’s saw anexplosion of interest in measures of software complexity (pioneered by the likes of [Halstead 1977] and[McCabe 1976]) and measures of size (such as function points pioneered by [Albrecht 1979] and later by[Symons 1991]) which were intended to be independent of programming language.
Work on extending, validating and refining complexity metrics (including applying them to new paradigmssuch as object oriented languages [Chidamber and Kemerer 1994]) has been a dominant feature of academicmetrics research up to the present day [Fenton 1991, Zuse 1991].
In addition to work on specific metrics and models, much recent work has focused on meta-level activities,the most notable of which are:
• Work on the mechanics of implementing metrics programs. Two pieces of work stand out in this respect:
1. The work of [Grady and Caswell 1987] ( later extended in [Grady 1992]) which was the first andmost extensive experience report of a company-wide software metrics program. This work contains keyguidelines (and lessons learned) which influenced (and inspired) many subsequent metrics programs.
2. The work of Basili, Rombach and colleagues on GQM(Goal-Question Metric) [Basili and Rmbach1988]. By borrowing some simple ideas from the Total Quality Management field, Basili and hiscolleagues proposed a simple scheme for ensuring that metrics activities were always goal-driven. Ametrics program established without clear and specific goals and objectives is almost certainly doomedto fail [Hall and Fenton 1997]). Basili’s high profile in the community and outstandingcommunications and technology transfer skills ensured that this important message was subsequentlywidely accepted and applied. That does not mean it is without its criticisms ([Bache and Neil 1995]and [Hetzel 1993] argue that the inherent top-down approach ignores what is feasible to measure at thebottom). However, most metrics programs at least pay lip service to GQM with the result that suchprograms should in principle be collecting only those metrics which are relevant to the specific goals.
• the use of metrics in empirical software engineering: specifically we refer to empirical work concernedwith evaluating the effectiveness of specific software engineering methods, tools and technologies. This isa great challenge for the academic/research software metrics community. There is now widespreadawareness that we can no longer rely purely on the anecdotal claims of self-appointed experts about whichnew methods really work and how. Increasingly we are seeing measurement studies that quantify theeffectiveness of methods and tools. Basili and his colleagues have again pioneered this work (see, for

3
example [Basili and Reiter 1981, Basili et al 1986]. Success here is judged by acceptance of empiricalresults, and the ability to repeat experiments to independently validate results.
• work on theoretical underpinnings of software metrics This work (exemplified by [Briand et al 1996,Fenton 1991, Zuse 1991] is concerned with improving the level of rigour in the discipline as a whole. Forexample, there has been considerable work in establishing a measurement theory basis for softwaremetrics activities. The most important success from this work has been the acceptance of the need toconsider scale types when defining measures with restrictions on the metrics analyses techniques that arerelevant for the given scale type.
3. Successes and failuresFirst the good news about software metrics and its related activities:
• It has been a phenomenal success if we judge it by the number of books, journal articles, academicresearch projects, and dedicated conferences. The number of published metrics papers grows at anexponential rate (CSR maintains a database of such papers which currently numbers over 1600). There arenow at least 40 books on software metrics, which is as many as there on the general topic of softwareengineering. Most computing/software engineering courses world-wide now include some compulsorymaterial on software metrics. In other words the subject area has now been accepted as part of themainstream of software engineering.
• There has been a significant increase in the level of software metrics activity actually taking place inindustry. Most major IT companies, and even many minor ones, have in place software metrics‘programs’, even if they are not widely recognised as such. This was not happening 10 years ago.
Now for the bad news:
• There is no match in content between the increased level of metrics activity in academia and industry.Like many other core subjects within the software engineering mainstream (such as formal developmentmethods, object-oriented design, and even structured analysis), the industrial take-up of most academicsoftware metrics work has been woeful. Much of the increased metrics activity in industry is based almostentirely on metrics that were around in the early 1970s.
• Much academic metrics research is inherently irrelevant to industrial needs. Irrelevance here is at twolevels.
1. irrelevance in scope: much academic work has focused on metrics which can only ever beapplied/computed for small programs, whereas all the reasonable objectives for applying metrics arerelevant primarily for large systems. Irrelevance in scope also applies to the many academic modelswhich rely on parameters which could never be measured in practice.
2. irrelevance in content: whereas the pressing industrial need is for metrics that are relevant forprocess improvement, much academic work has concentrated on detailed code metrics. In manycases these aim to measure properties that are of little practical interest. This kind of irrelevanceprompted Glass to comment:
“What theory is doing with respect to measurement of software work and what practice is doing are ontwo different planes, planes that are shifting in different directions” [Glass 1994]
• Much industrial metrics activity is poorly motivated. For all the warm feelings associated with theobjectives for software metrics (improved assessment and prediction, quality control and assurance etc.) itis not at all obvious that metrics are inevitably a ‘good thing’. The decision by a company to put in placesome kind of a metrics program is inevitably a ‘grudge purchase’; it is something done when things arebad or to satisfy some external assessment body. For example, in the US the single biggest trigger forindustrial metrics activity has been the CMM [Humphreys 1989]; evidence of use of metrics is intrinsicfor achieving higher levels of CMM. Just as there is little empirical evidence about the effectiveness ofspecific software development methods [Fenton et al 1994] so there is equally little known about theeffectiveness of software metrics. Convincing success stories describing the long-term payback of metricsare almost non-existent. What we do know is that metrics will always be an overhead on your currentsoftware projects (we found typically it would be 4-8% [Hall and Fenton 1997]) . When deadlines are tight

4
and slipping it is inevitable that the metrics activity will be one of the first things to suffer (or be stoppedcompletely). Metrics are, above all, effective primarily as a management tool. Yet good metrics data ispossible only with the commitment of technical staff involved in development and testing. There are noeasy ways to motivate such staff in this respect.
• Much industrial metrics activity is poorly executed: We have come across numerous examples ofindustrial practice which ignores well known guidelines of best practice data-collection and analysis andapplies metrics in ways that were known to be invalid twenty years ago. For example, it is still commonfor companies to collect defect data which does not distinguish between defects discovered in operationand defects discovered during development [Fenton and Neil 1998].
The raison d’être of software metrics is to improve the way we monitor, control or predict various attributes ofsoftware and the commercial software production process. Therefore, a necessary criterion to judge thesuccess of software metrics is the extent to which they are being routinely used across a wide cross section ofthe software production industry. Using this criterion, and based solely on our own consulting experience andthe published literature, the only metrics to qualify as candidates for successes are:
• The enduring LOC metric: despite the many convincing arguments about why this metric is a very poor‘size’ measure [Fenton and Pfleeger 1996] it is still routinely used in its original applications: as anormalising measure for software quality (defects per KLOC); as a means of assessing productivity (LOCper programmer month) and as a means of providing crude cost/effort estimates. Like it or not LOC hasbeen a ‘success’ because it is easy to compute and can be ‘visualised’ in the sense that we understand whata 100 LOC program looks like.
• Metrics relating to defect counts: (see [Gilb and Graham 1994] and [Fenton and Pfleeger 1996] forextensive examples). Almost all industrial metrics programs incorporate some attempt to collect data onsoftware defects discovered during development and testing. In many cases, such programs are notrecognised explicitly as ‘metrics programs’ since they may be regarded simply as applying goodengineering practice and configuration management.
• McCabe’s cyclomatic number [McCabe 1976]. For all the many criticisms that it has attracted thisremains exceptionally popular. It is easily computed by static analysis (unlike most of the morediscriminating complexity metrics) and it is widely used for quality control purposes. For example, [Grady1992] reports that, at Hewlett Packard, any modules with a cyclomatic complexity higher than 16 must bere-designed.
To a less extent we should also include:
• Function Points [Albrecht 1979, Symons 1991]: Function point analysis is very hard to do properly[Jeffery and Stathis 1996] and is unnecessarily complex if used for resource estimation [Kitchenham1995]. Yet, despite these drawbacks function points appear to have been widely accepted as a standardsizing measure, especially within the financial IT sector [Onvlee 1995].
This is not an impressive list, and in Section 4 we will explain why the credibility of metrics as a whole hasbeen lowered because of the crude way in which these kinds of metrics have been used. However, as we willshow in Section 5, it is the models and applications which have been fundamentally flawed rather than themetrics.
4. What you can and cannot do with the basic metricsIn this section we will look at recent empirical work which explains the limitations of the basic measures andexplains in particular problems with the so-called complexity metrics. We restrict our attention to the use ofmetrics for quality control, assessment and prediction. Specifically, in what follows we will examine what youcan and cannot do with defect metrics and size and complexity metrics. We assume that readers alreadyacknowledge the need to distinguish between:
• defects which are discovered at different life-cycle phases. Most notably defects discovered in operation(we call these failures) must always be distinguished from defects discovered during development (whichwe refer to as faults since they may lead to failures in operation).
• different categories of defects (including defects with different levels of criticality)

5
Ultimately one of the major objectives of software metrics research has been to produce metrics which aregood ‘early’ predictors of reliability (the frequency of operational defects). It is known that stochasticreliability growth models can produce accurate predictions of the reliability of a software system providingthat a reasonable amount of failure data can be collected for that system in representative operational use[Brocklehurst and Littlewood 1992]. Unfortunately, this is of little help in those many circumstances when weneed to make predictions before the software is operational. In [Fenton and Neil 1998] we reviewed the manystudies advocating statistical models and metrics to address this problem. Our opinion of this work is not high- we found that many methodological and theoretical mistakes have been made. Studies suffered from avariety of flaws ranging from model mis-specification to use of inappropriate data. We concluded that theexisting models are incapable of predicting defects accurately using size and complexity metrics alone.Furthermore, these models offer no coherent explanation of how defect introduction and detection variablesaffect defect counts.
In [Fenton and Ohlsson 1998] we used case study data from two releases of a major commercial system to testa number of popular hypotheses about the basic metrics. The system was divided into many hundreds ofmodules. The basic metrics data were collected at the module level (the metrics were: defects found at fourdifferent testing phases, including in operation, LOC, and a number of complexity metrics includingcyclomatic complexity). We were especially interested in hypotheses which lie at the root of the popularity forthe basic metrics. Many of these are based around the idea that a small number of the modules inevitably havea disproportionate number of the defects; the assumption is then that metrics can help us to identify early inthe development cycle such fault and failure prone modules.
Number Hypothesis Case study evidence?1a a small number of modules contain most of the faults discovered
during pre-release testingYes - evidence of 20-60rule
1b if a small number of modules contain most of the faults discoveredduring pre-release testing then this is simply because thosemodules constitute most of the code size
No
2a a small number of modules contain most of the operational faults Yes - evidence of 20-80rule
2b if a small number of modules contain most of the operationalfaults then this is simply because those modules constitute most ofthe code size
No - strong evidence of aconverse hypothesis
3 Modules with higher incidence of faults in early pre-release likelyto have higher incidence of faults in system testing
Weak support
4 Modules with higher incidence of faults in all pre-release testinglikely to have higher incidence of faults in post-release operation
No - strongly rejected
5a Smaller modules are less likely to be failure prone than largerones
No
5b Size metrics (such as LOC) are good predictors of number of pre-release faults in a module
Weak support
5c Size metrics (such as LOC) are good predictors of number of post-release faults in a module
No
5d Size metrics (such as LOC) are good predictors of a module’s(pre-release) fault-density
No
5e Size metrics (such as LOC) are good predictors of a module’s(post-release) fault-density
No
6 Complexity metrics are better predictors than simple size metricsof fault and failure-prone modules
Very weak support
7 Fault densities at corresponding phases of testing and operationremain roughly constant between subsequent major releases of asoftware system
Yes
8 Software systems produced in similar environments have broadlysimilar fault densities at similar testing and operational phases
Yes
Table 1: Support for the hypotheses provided in this case study
The hypotheses and results are summarised in Table 1. We make no claims about the generalisation of theseresults. However, given the rigour and extensiveness of the data-collection and also the strength of some ofthe observations, we feel that there are lessons to be learned by the wider community.

6
The evidence we found in support of the two Pareto principles 1a) and 2a) is the least surprising, but therewas previously little published empirical data to support it. However, the popularly believed explanations forthese two phenomena were not supported in this case:
• It is not the case that size explains in any significant way the number of faults. Many people seem tobelieve (hypotheses 1b and 2b) that the reason why a small proportion of modules account for most faultsis simply because those fault-prone modules are disproportionately large and therefore account for most ofthe system size. We have shown this assumption to be false for this system.
• Nor is it the case that ‘complexity’ (or at least complexity as measured by ‘complexity metrics’) explainsthe fault-prone behaviour (hypothesis 6). In fact complexity is not significantly better at predicting faultand failure prone modules than simple size measures.
• It is also not the case that the set of modules which are especially fault-prone pre-release are going to beroughly the same set of modules that are especially fault-prone post-release (hypothesis 4).
The result for hypothesis 4 is especially devastating for much software metrics work. The rationale behindhypothesis 4 is the belief in the inevitability of ‘rogue modules’ - a relatively small proportion of modules ina system that account for most of the faults and which are likely to be fault-prone both pre- and post release. Itis often assumed that such modules are somehow intrinsically complex, or generally poorly built. This alsoprovides the rationale for complexity metrics. For example, Munson and Khosghoftaar asserted:
‘There is a clear intuitive basis for believing that complex programs have more faults in them than simpleprograms’, [Munson and Khosghoftaar, 1992]
Not only was there no evidence to support hypothesis 4, but there was evidence to support a conversehypothesis. In both releases almost all of the faults discovered in pre-release testing appear in modules whichsubsequently revealed almost no operation faults (see Figure 1)
0
2
4
6
8
10
12
14
0 20 40 60 80 100
Pre-release faults
Post-releasefaults
0
5
10
15
20
25
30
35
0 20 40 60 80 100 120 140
Pre-release faults
Post-releasefaults
Release n Release n+1
Figure 1: Scatter plot of pre-release faults against post-release faults for successive versions of a major system(each dot represents a module selected randomly)
These remarkable results are also closely related to the empirical phenomenon observed by Adams [Adams1984]�that most operational system failures are caused by a small proportion of the latent faults. The resultshave major ramifications for the commonly used fault density metric as a de-facto measure of user perceivedsoftware quality. If fault density is measured in terms of pre-release faults (as is common), then at the modulelevel this measure tells us worse than nothing about the quality of the module; a high value is more likely tobe an indicator of extensive testing than of poor quality. Modules with high fault density pre-release are likelyto have low fault-density post-release, and vice versa. The results of hypothesis 4 also bring into question theentire rationale for the way software complexity metrics are used and validated. The ultimate aim ofcomplexity metrics is to predict modules which are fault-prone post-release. Yet, most previous ‘validation’studies of complexity metrics have deemed a metric ‘valid’ if it correlates with the (pre-release) fault density.

7
Our results suggest that ‘valid’ metrics may therefore be inherently poor at predicting what they are supposedto predict.
What we did confirm was that complexity metrics are closely correlated to size metrics like LOC. While LOC(and hence also the complexity metrics) are reasonable predictors of absolute number of faults, they are verypoor predictors of fault density.
5. New DirectionsThe results in Section 4 provide mixed evidence about the usefulness of the commonly used metrics. Resultsfor hypotheses 1, 2,3, 7 and 8 explain why there is still so much interest in the potential of defects data to helpquality prediction. But the other results confirm that the simplistic approaches are inevitably inadequate. It isfair to conclude that
• complexity and/or size measures alone cannot provide accurate predictions of software defects
• on its own, information about software defects (discovered pre-release) provides no information aboutlikely defects post-release.
• traditional statistical (regression-based) methods are inappropriate for defects prediction
In addition to the problem of using metrics data in isolation, the major weakness of the simplistic approachesto defect prediction has been a misunderstanding of the notion of cause and effect. A correlation between twometric values (such as a module’s size and the number of defects found in it) does not provide evidence of acausal relationship. Consider, for example, our own result for hypothesis 4. The data we observed can beexplained by the fact that the modules in which few faults are discovered during testing may simply not havebeen tested properly. Those modules which reveal large numbers of faults during testing may genuinely bevery well tested in the sense that all the faults really are 'tested out of them'. The key missing explanatory datain this case is, of course, testing effort, which was unfortunately not available to us in this case study. Asanother example, hypothesis 5 is the popular software engineering assumption that small modules are likelyto be (proportionally) less failure prone. In other words small modules have a lower defect density. In fact,empirical studies summarised in [Hatton 1997] suggest the opposite effect: that large modules have a lowerfault density than small ones. We found no evidence to support either hypothesis. Again this is because theassociation between size and fault density is not a causal one. It is for this kind of reason that we recommendmore complete models that enable us to augment the empirical observations with other explanatory factors,most notably, testing effort and operational usage . If you do not test or use a module you will not observefaults or failures associated with it.
Thus, the challenge for us is to produce models of the software development and testing process which takeaccount of the crucial concepts missing from traditional statistical approaches. Specifically we need modelsthat can handle:
• diverse process and product evidence
• genuine cause and effect relationships
• uncertainty
• incomplete information
At the same time the models must not introduce any additional metrics overheads, either in terms of theamount of data-collection or the sophistication of the metrics.
After extensive investigations during the DATUM project 1993-1996 into the range of suitable formalisms[Fenton et al 1998] we concluded that Bayesian belief nets (BBNs) were by far the best solution for ourproblem. The only remotely relevant approach we found in the software engineering literature was the processsimulation method of [Abdel-Hamid 1991], but this did not attempt to model the crucial notion ofuncertainty.
BBNs have attracted much recent attention as a solution for problems of decision support under uncertainty.Although the underlying theory (Bayesian probability) has been around for a long time, building andexecuting realistic models has only been made possible because of recent algorithms (see [Jensen 1996]) and

8
software tools that implement them [Hugin A/S]. To date BBNs have proven useful in practical applicationssuch as medical diagnosis and diagnosis of mechanical failures. Their most celebrated recent use has been byMicrosoft where BBNs underlie the help wizards in Microsoft Office. A number of recent projects in Europe,most of which we have been involved in, have pioneered the use of BBNs in the area of software assessment(especially for critical systems) [Fenton et al 1998], but other related applications include their use in time-critical decision making for the propulsion systems on the Space Shuttle [Horvitz and Barry 1995].
A BBN is a graphical network (such as that shown in Figure 2) together with an associated set of probabilitytables. The nodes represent uncertain variables and the arcs represent the causal/relevance relationshipsbetween the variables. The probability tables for each node provide the probabilities of each state of thevariable for that node. For nodes without parents these are just the marginal probabilities while for nodeswith parents these are conditional probabilities for each combination of parent state values. The BBN inFigure 2 is a simplified version of the one that was built in collaboration with the partner in the case studydescribed in Section 4.
Defect Density at testing
Residual Defect Count
New defects inserted
defects not corrected
defects undetected
Testing quality
Defects detected
defects introduced
Problem complexity
Design effortProblem size
Design size (KLOC)
Operational usage
Post release failure density
Final design size
Rework accuracy
Residual Defect Density
Figure 2: A BBN that models the software defects insertion and detection process
It is simplified in the sense that it only models one pre-release testing/rework phase whereas in the fullversion there are three. Like all BBNs the probability tables were provided by a mixture of:empirical/benchmarking data and subjective judgements. We have also developed (in collaboration withHugin A/S) tools for generating quickly very large probability tables. It is beyond the scope of this paper todescribe either BBNs or the particular example in detail (see [Fenton and Neil 1998] for a fuller account).However, we can give a feel for its power and relevance.
First note that the model in Figure 2 contains a mixture of variables we might have evidence about andvariables we are interested in predicting. At different times during development and testing differentinformation will be available, although some variables such as ‘number of defects inserted’ will never beknown with certainty. With BBNs, it is possible to propagate consistently the impact of evidence on the
9
probabilities of uncertain outcomes. For example, suppose we have evidence about the number of defectsdiscovered in testing. When we enter this evidence all the probabilities in the entire net are updated.
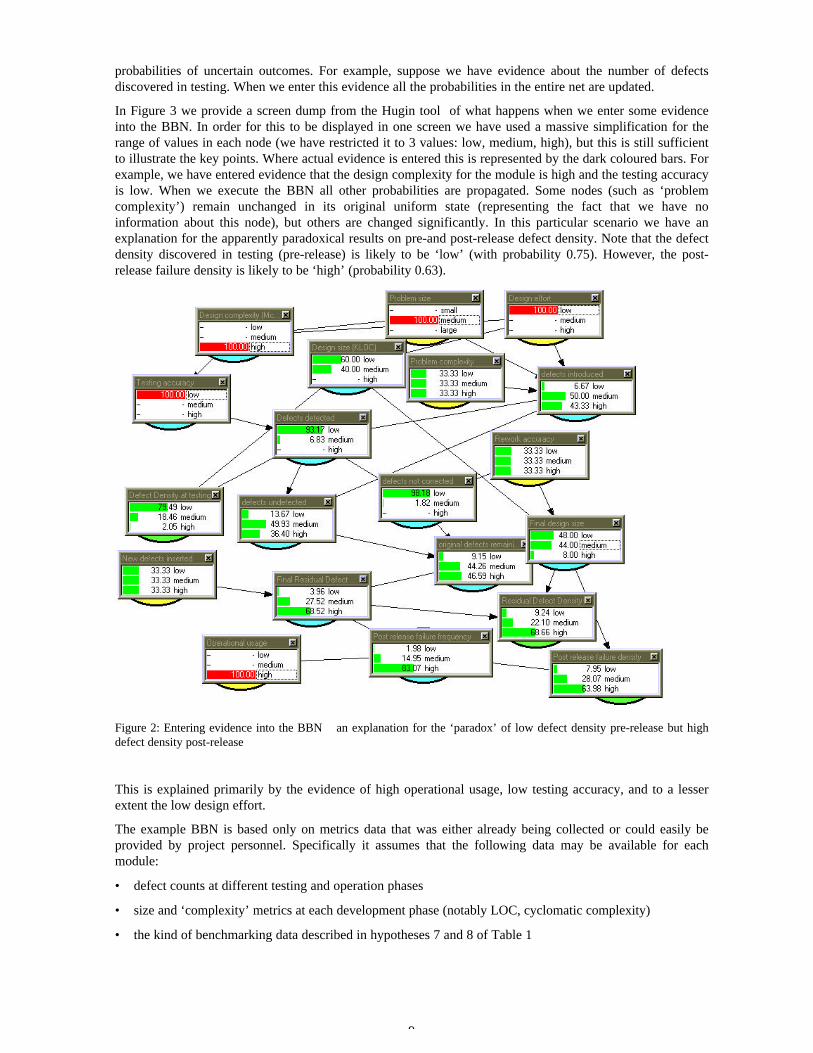
In Figure 3 we provide a screen dump from the Hugin tool of what happens when we enter some evidenceinto the BBN. In order for this to be displayed in one screen we have used a massive simplification for therange of values in each node (we have restricted it to 3 values: low, medium, high), but this is still sufficientto illustrate the key points. Where actual evidence is entered this is represented by the dark coloured bars. Forexample, we have entered evidence that the design complexity for the module is high and the testing accuracyis low. When we execute the BBN all other probabilities are propagated. Some nodes (such as ‘problemcomplexity’) remain unchanged in its original uniform state (representing the fact that we have noinformation about this node), but others are changed significantly. In this particular scenario we have anexplanation for the apparently paradoxical results on pre-and post-release defect density. Note that the defectdensity discovered in testing (pre-release) is likely to be ‘low’ (with probability 0.75). However, the post-release failure density is likely to be ‘high’ (probability 0.63).
Figure 2: Entering evidence into the BBN � an explanation for the ‘paradox’ of low defect density pre-release but highdefect density post-release
This is explained primarily by the evidence of high operational usage, low testing accuracy, and to a lesserextent the low design effort.
The example BBN is based only on metrics data that was either already being collected or could easily beprovided by project personnel. Specifically it assumes that the following data may be available for eachmodule:
• defect counts at different testing and operation phases
• size and ‘complexity’ metrics at each development phase (notably LOC, cyclomatic complexity)
• the kind of benchmarking data described in hypotheses 7 and 8 of Table 1
10
• approximate development and testing effort
At any point in time there will always be some missing data. The beauty of a BBN is that it will compute theprobability of every state of every variable irrespective of the amount of evidence. Lack of substantial hardevidence will be reflected in greater uncertainty in the values.
In addition to the result that high defect density pre-release may imply low defect density post-release, wehave used this BBN to explain other empirical results that were discussed in Section 4, such as the scenariowhereby larger modules have lower defect densities .
The benefits of using BBNs include:
• explicit modelling of ‘ignorance’ and uncertainty in estimates, as well as cause-effect relationships
• makes explicit those assumptions that were previously hidden - hence adds visibility and auditability tothe decision making process
• intuitive graphical format makes it easier to understand chains of complex and seemingly contradictoryreasoning
• ability to forecast with missing data.
• use of ‘what-if?’ analysis and forecasting of effects of process changes;
• use of subjectively or objectively derived probability distributions;
• rigorous, mathematical semantics for the model
• no need to do any of the complex Bayesian calculations, since tools like Hugin do this
Clearly the ability to use BBNs to predict defects will depend largely on the stability and maturity of thedevelopment processes. Organisations that do not collect the basic metrics data, do not follow defined life-cycles or do not perform any forms of systematic testing will not be able to apply such models effectively. Thisdoes not mean to say that less mature organisations cannot build reliable software, rather it implies that theycannot do so predictably and controllably.
6. ConclusionsThe increased industrial software metrics activity seen in the last 10 years may be regarded as a successfulsymptom of an expanding subject area. Yet, this industrial practice is not related in content to the increasedacademic and research activity. The ‘metrics’ being practised are essentially the same basic metrics that werearound in the late 1960’s. In other words these are metrics based around LOC (or very similar) size counts,defect counts, and crude effort figures (in person months). The mass of academic metrics research has failedalmost totally in terms of industrial penetration. This is a particularly devastating indictment given theinherently ‘applied’ nature of the subject. Having been heavily involved ourselves in academic softwaremetrics research the obvious temptation would be to criticise the short-sightedness of industrial softwaredevelopers. Instead, we recognise that industrialists have accepted the simple metrics and rejected theesoteric for good reasons. They are easy to understand and relatively simple to collect. Since the esotericalternatives are not obviously more ‘valid’ there is little motivation to use them. We are therefore usingindustrial reality to fashion our research. One of our objectives is to develop metrics-based managementdecision support tools that build on the relatively simple metrics that we know are already being collected.These tools combine different aspects of software development and testing and enable managers to makemany kinds of predictions, assessments and trade-offs during the software life-cycle, without any major newmetrics overheads. Most of all our objective is to handle the key factors largely missing from the usual metricsmodels: uncertainty and combining different (often subjective) evidence. Traditional (largely regression-based) models are inadequate for this purpose. We have shown how the exciting technology of Bayesian nets(whose complexities are hidden to users) helps us meet our objective. The approach does, however, forcemanagers to make explicit those assumptions which were previously hidden in their decision-making process.We regard this as a benefit rather than a drawback. The BBN approach is actually being used on real projectsand is receiving highly favourable reviews. We believe it is an important way forward for metrics research.

11
7. AcknowledgementsThe work was supported, in part, by the EPSRC-funded project IMPRESS, and the ESPRIT-funded projectsDEVA and SERENE. We are also indebted to Niclas Ohlsson for his work on the case study described in thispaper.
8. ReferencesAbdel-Hamid TK, ''The slippery path to productivity improvement'', IEEE Software, 13(4), 43-52, 1996.Adams E , ''Optimizing preventive service of software products'', IBM Research Journal, 28(1), 2-14, 1984.Akiyama F, ''An example of software system debugging'', Inf Processing 71, 353-379, 1971.Albrecht A.J, Measuring Application Development, Proceedings of IBM Applications Development joint
SHARE/GUIDE symposium. Monterey CA, pp 83-92, 1979.Bache R and Neil M, ''Introducing metrics into industry: a perspective on GQM'', in 'Software Quality Assurance and
metrics: A Worldwide prespective' (Eds: Fenton NE, Whitty RW, Iizuka Y, International Thomson Press, 59-68, 1995.Basili VR and Rombach HD, The TAME project: Towards improvement-oriented software environments, IEEE
Transactions on Software Engineering 14(6), pp 758-773, 1988.Basili VR and Reiter RW, A controlled experiment quantitatively comparing software development approaches, IEEE
Trans Soft Eng SE-7(3), 1981.Basili VR, Selby RW and Hutchens DH, Experimentation in software engineering, IEEE Trans Soft Eng SE-12(7), 733-
743, 1986.Boehm BW, Software Engineering Economics, Prentice-Hall, New York, 1981.Briand LC, Morasca S, Basili VR, Property-based software engineering measurement, IEEE Transactions on Software
Engineering, 22(1), 68-85, 1996.Brocklehurst, S and Littlewood B, New ways to get accurate software reliability modelling, IEEE Software, 34-42, July,
1992.Chidamber SR and Kemerer CF, A metrics suite for object oriented design, IEEE Trans Software Eng, 20 (6), 476-498,
1994.DeMarco T, 'Controlling Software Projects’, Yourden Press, New York, 1982Fenton NE, Software Metrics: A Rigorous Approach, Chapman and Hall, 1991.Fenton NE, Littlewood B, Neil M, Strigini L, Sutcliffe A, Wright D, Assessing Dependability of Safety Critical Systems
using Diverse Evidence, IEE Proceedings Software Engineering, 145(1), 35-39, 1998.Fenton NE and Neil M, A Critique of Software Defect Prediction Models, IEEE Transactions on Software Engineering, to
appear, 1998.Fenton NE and Ohlsson N, Quantitative Analysis of Faults and Failures in a Complex Software System, IEEE
Transactions on Software Engineering, to appear, 1998.Fenton NE and Pfleeger SL, Software Metrics: A Rigorous and Practical Approach (2nd Edition), International Thomson
Computer Press, 1996.Fenton NE, Pfleeger SL, Glass R, ''Science and Substance: A Challenge to Software Engineers'', IEEE Software, 11(4),
86-95, July, 1994.Gilb T and Graham D, Software Inspections, Addison Wesley, 1994.Gilb T, Principles of Software Engineering Management, Addison Wesley, 1988.Gilb T, Software Metrics, Chartwell-Bratt, 1976.Glass RL, ''A tabulation of topics where software practice leads software theory'', J Systems Software, 25, 219-222, 1994.Grady R and Caswell D, Software Metrics: Establishing a Company-wide Program, Prentice Hall, Englewood Cliffs,
New Jersey, 1987.Grady, R.B, Practical Software Metrics for Project Management and Process Improvement, Prentice-Hall, 1992.Hall T and Fenton NE, ''Implementing effective software metrics programmes'', IEEE Software, 14(2), 55-66, 1997.Halstead M, Elements of Software Science, North Holland, , 1977.Hatton L, Reexamining the fault density - component size connection, IEEE Software, 14(2), 89-97, 1997.Hetzel, William C, Making Software Measurement Work: Building an Effective Software Measurement Program, QED
Publishing Group, Wellesley MA, 1993.Horvitz E and Barry M, ''Display of information for time-critical decision making'', Proc of 11th Conf in AI, Montreal,
August, 1995.Hugin A/S: www.hugin.dkHumphrey WS, Managing the Software Process, Addison-Wesley, Reading, Massachusetts, 1989.

12
Jeffery R and Stathis J, Function point sizing: structure, validity and applicability, Empirical Software Engineering, 1(1),11-30, 1996.
Jensen FV, An Introduction to Bayesian Networks, UCL Press, 1996.Jones C, ''Applied Software Measurement'', McGraw Hill, 1991.Kitchenham BA, Using function points for software cost estimation, in 'Software Quality Assurance and Measurement'
(Eds Fenton NE, Whitty RW, Iizuka Y), International Thomson Computer Press, 266-280, 1995.McCabe T, A Software Complexity Measure, IEEE Trans. Software Engineering SE-2(4), 308-320, 1976.Munson JC, and Khoshgoftaar TM, The detection of fault-prone programs, IEEE Transactions on Software
Engineering,18(5), 423-433, 1992.Onvlee J, ''Use of function points for estimation and contracts'', in 'Software Quality Assurance and Metrics' (Fenton N,
Whitty RW, Iizuka Y eds), 88-93, 1995.Putnam LH, A general empirical solution to the macro software sizing and estimating problem, IEEE Trans Soft Eng SE-
4(4), 1978, 345-361, 1978.Symons, CR, Software Sizing & Estimating: Mark II Function point Analysis, John Wiley, 1991.Zuse H, Software Complexity: Measures and Methods, De Gruyter. Berlin, 1991

Norman FentonNorman Fenton is Professor of Computing Science at the Centre for Software Reliability,City University, London and also Managing Director of Agena Ltd, a company specializingin risk management for critical computer systems. He is a Chartered Engineer whopreviously held academic posts at University College Dublin, Oxford University and SouthBank University where he was Director of the Centre for Systems and SoftwareEngineering. He has been project manager and principal researcher in many majorcollaborative projects. His recent and current projects cover the areas of: software metrics;safety critical systems assessment; Bayesian nets for systems' assessment; softwarereliability tools. Professor Fenton has written several books on software metrics and relatedsubjects.