software project management - san jose state · pdf file– see qspm outline ... example...
TRANSCRIPT
L7-S1 Scheduling 8/25/10© M.E. Fayad 2000 -- 2009 Scheduling
Dr. M.E. Fayad, Professor Computer Engineering Department College of Engineering, San José State University One Washington Square, San José, CA 95192-0180 E-mail: [email protected]
Software Project Management

L7-S2 Scheduling 8/25/10© M.E. Fayad 2000 -- 2009 Scheduling
2
Scheduling
Lesson Title
Session #7

L7-S3 Scheduling 8/25/10© M.E. Fayad 2000 -- 2009 Scheduling
3
Roadmap
Review Previous Session
Scheduling
Activity Network Fundamentals
PERT & CRM Techniques
Gantt Charts
Mythical Man-Month
L7-S4 Scheduling 8/25/10© M.E. Fayad 2000 -- 2009 Scheduling
4
Lesson Learning Objectives
Review previous session
Learn more about scheduling, scheduling terminology, and Scheduling techniques
Understand network diagrams
Know how-to PERT, CRM, Milestone Chart, Bar
Chart, Gantt Chart
Learn and understand Mythical Man-Month Issues
L7-S5 Scheduling 8/25/10© M.E. Fayad 2000 -- 2009 Scheduling
5
Review Previous Session
Lesson Title

L7-S6 Scheduling 8/25/10© M.E. Fayad 2000 -- 2009 Scheduling
6
WBS
Types: Process, product, hybrid Formats: Outline or graphical org chart High-level WBS does not show
dependencies or durations What hurts most is what’s missing Becomes input to many things, esp.
schedule

L7-S7 Scheduling 8/25/10© M.E. Fayad 2000 -- 2009 Scheduling
7
Estimation (1)
“The single most important task of a project: setting realistic expectations. Unrealistic expectations based on inaccurate estimates are the single largest cause of software failure.” Futrell, Shafer, Shafer, “Quality Software Project Management”

L7-S8 Scheduling 8/25/10© M.E. Fayad 2000 -- 2009 Scheduling
8
Estimation (2)
History is your best ally – Especially when using LOC, function points,
etc. Use multiple methods if possible
– This reduces your risk – If using “experts”, use two
Get buy-in Remember: it’s an iterative process! Know your “presentation” techniques

L7-S9 Scheduling 8/25/10© M.E. Fayad 2000 -- 2009 Scheduling
9
Estimation (3)
Bottom-up • More work to create but more accurate • Often with Expert Judgment at the task level
Top-down • Used in the earliest phases • Usually with/as Analogy or Expert Judgment
Analogy • Comparison with previous project: formal or informal
Expert Judgment • Via staff members who will do the work • Most common technique along w/analogy • Best if multiple ‘experts’ consulted
L7-S10 Scheduling 8/25/10© M.E. Fayad 2000 -- 2009 Scheduling
10
Estimation (4)
Parametric Methods – Know the trade-offs of: LOC & Function Points
Function Points – Benefit: relatively independent of the technology used
to develop the system – We will re-visit this briefly later in semester (when
discussing “software metrics”) – Variants: WEBMO (no need to know this for exam)
Re-Use Estimation – See QSPM outline
U Calgary

L7-S11 Scheduling 8/25/10© M.E. Fayad 2000 -- 2009 Scheduling
11
Your Early Phase Processes
Initial Planning: • Why
– SOW, Charter • What/How (partial/1st pass)
– WBS – Other planning documents
» Software Development Plan, Risk Mgmt., Cfg. Mgmt.
Estimating • Size (quantity/complexity) and Effort (duration) • Iterates
Scheduling • Begins along with 1st estimates • Iterates
L7-S12 Scheduling 8/25/10© M.E. Fayad 2000 -- 2009 Scheduling
12
Scheduling
Lesson Title
L7-S13 Scheduling 8/25/10© M.E. Fayad 2000 -- 2009 Scheduling
13
Scheduling
Once tasks (from the WBS) and size/effort (from estimation) are known: then schedule
Primary objectives • Best time • Least cost • Least risk
Secondary objectives • Evaluation of schedule alternatives • Effective use of resources • Communications

L7-S14 Scheduling 8/25/10© M.E. Fayad 2000 -- 2009 Scheduling
14
Terminology (1)
Precedence: • A task that must occur before another is said to
have precedence of the other
Concurrence: • Concurrent tasks are those that can occur at the
same time (in parallel)
Leads & Lag Time • Delays between activities • Time required before or after a given task
L7-S15 Scheduling 8/25/10© M.E. Fayad 2000 -- 2009 Scheduling
15
Terminology (2)
Milestones – Have a duration of zero – Identify critical points in your schedule – Shown as inverted triangle or a diamond – Often used at “review” or “delivery” times
• Or at end or beginning of phases • Ex: Software Requirements Review (SRR) • Ex: User Sign-off
– Can be tied to contract terms

L7-S16 Scheduling 8/25/10© M.E. Fayad 2000 -- 2009 Scheduling
16
Terminology (3)
Milestone Examples
L7-S17 Scheduling 8/25/10© M.E. Fayad 2000 -- 2009 Scheduling
17
Terminology (4)
Slack & Float – Float & Slack: synonymous terms – Free Slack
– Slack an activity has before it delays next task
– Total Slack – Slack an activity has before delaying whole project
– Slack Time TS = TL – TE • TE = earliest time an event can take place • TL = latest date it can occur w/o extending
project’s completion date

L7-S18 Scheduling 8/25/10© M.E. Fayad 2000 -- 2009 Scheduling
18
Scheduling Techniques
– Mathematical Analysis • Network Diagrams
– PERT – CPM – GERT
– Bar Charts • Milestone Chart • Gantt Chart

L7-S19 Scheduling 8/25/10© M.E. Fayad 2000 -- 2009 Scheduling
19
Network Diagrams
Developed in the 1950’s A graphical representation of the tasks
necessary to complete a project Visualizes the flow of tasks &
relationships

L7-S20 Scheduling 8/25/10© M.E. Fayad 2000 -- 2009 Scheduling
20
Mathematical Analysis
PERT – Program Evaluation and Review Technique
CPM – Critical Path Method
Sometimes treated synonymously All are models using network diagrams

L7-S21 Scheduling 8/25/10© M.E. Fayad 2000 -- 2009 Scheduling
21
MS Project Example

L7-S22 Scheduling 8/25/10© M.E. Fayad 2000 -- 2009 Scheduling
22
Network Diagrams
Two classic formats – AOA: Activity on Arrow – AON: Activity on Node
Each task labeled with • Identifier (usually a letter/code) • Duration (in std. unit like days)
There are other variations of labeling There is 1 start & 1 end event Time goes from left to right

L7-S23 Scheduling 8/25/10© M.E. Fayad 2000 -- 2009 Scheduling
23
Node Formats
L7-S24 Scheduling 8/25/10© M.E. Fayad 2000 -- 2009 Scheduling
24
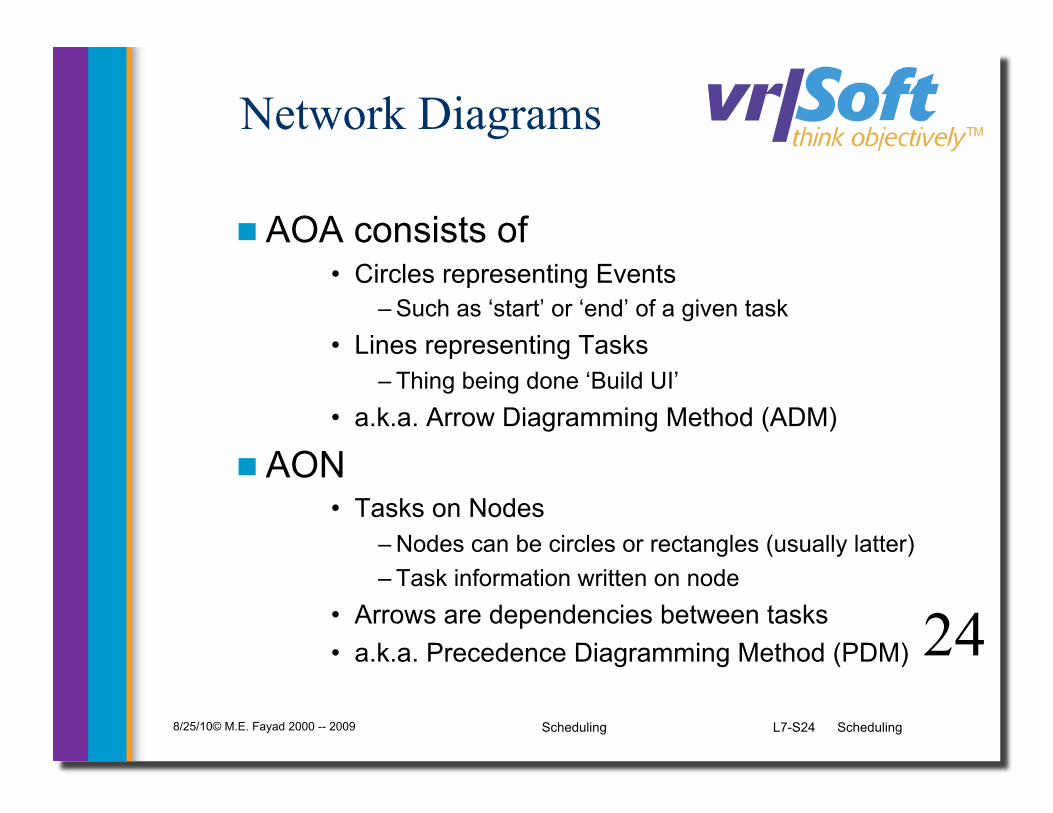
Network Diagrams
AOA consists of • Circles representing Events
– Such as ‘start’ or ‘end’ of a given task • Lines representing Tasks
– Thing being done ‘Build UI’ • a.k.a. Arrow Diagramming Method (ADM)
AON • Tasks on Nodes
– Nodes can be circles or rectangles (usually latter) – Task information written on node
• Arrows are dependencies between tasks • a.k.a. Precedence Diagramming Method (PDM)

L7-S25 Scheduling 8/25/10© M.E. Fayad 2000 -- 2009 Scheduling
25
Critical Path
“The specific set of sequential tasks upon which the project completion date depends” – or “the longest full path”
All projects have a Critical Path Accelerating non-critical tasks do not
directly shorten the schedule

L7-S26 Scheduling 8/25/10© M.E. Fayad 2000 -- 2009 Scheduling
26
Critical Path Example

L7-S27 Scheduling 8/25/10© M.E. Fayad 2000 -- 2009 Scheduling
27
CPM
Critical Path Method – The process for determining and optimizing
the critical path Non-CP tasks can start earlier or later
w/o impacting completion date Note: Critical Path may change to
another as you shorten the current Should be done in conjunction with the
you & the functional manager

L7-S28 Scheduling 8/25/10© M.E. Fayad 2000 -- 2009 Scheduling
28
4 Task Dependency Types
Mandatory Dependencies • “Hard logic” dependencies • Nature of the work dictates an ordering • Ex: Coding has to precede testing • Ex: UI design precedes UI implementation
Discretionary Dependencies • “Soft logic” dependencies • Determined by the project management team • Process-driven • Ex: Discretionary order of creating certain
modules
L7-S29 Scheduling 8/25/10© M.E. Fayad 2000 -- 2009 Scheduling
29
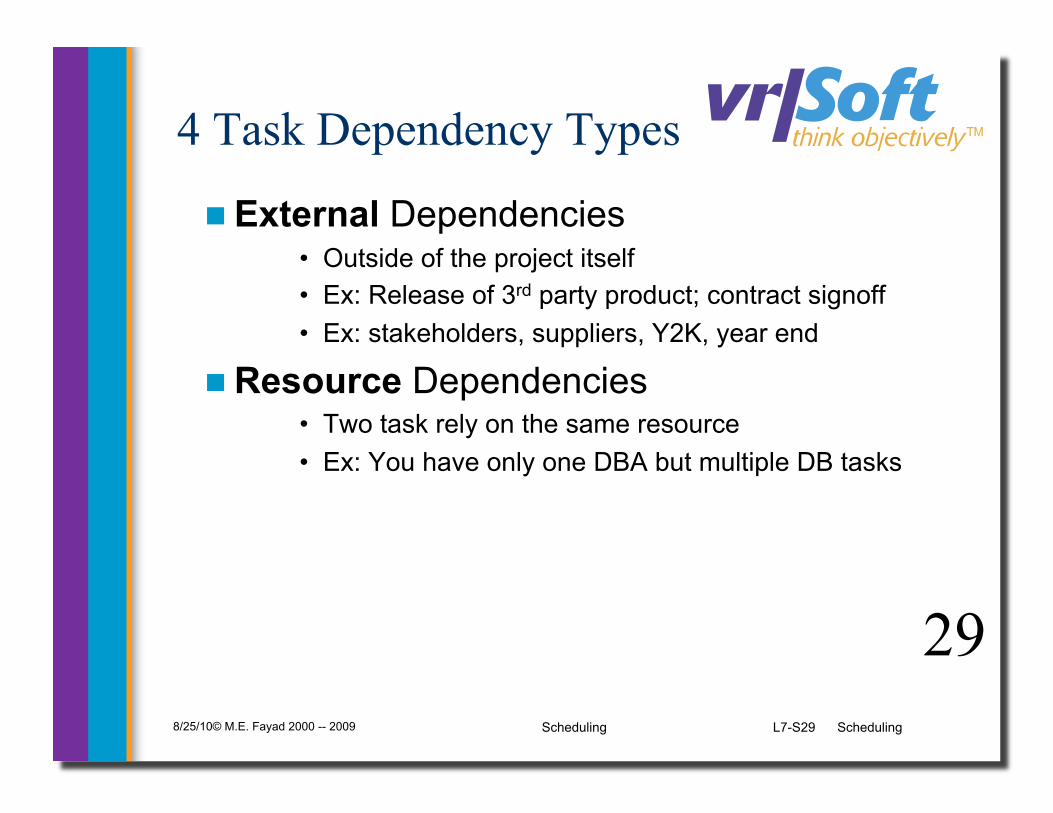
4 Task Dependency Types
External Dependencies • Outside of the project itself • Ex: Release of 3rd party product; contract signoff • Ex: stakeholders, suppliers, Y2K, year end
Resource Dependencies • Two task rely on the same resource • Ex: You have only one DBA but multiple DB tasks
L7-S30 Scheduling 8/25/10© M.E. Fayad 2000 -- 2009 Scheduling
30
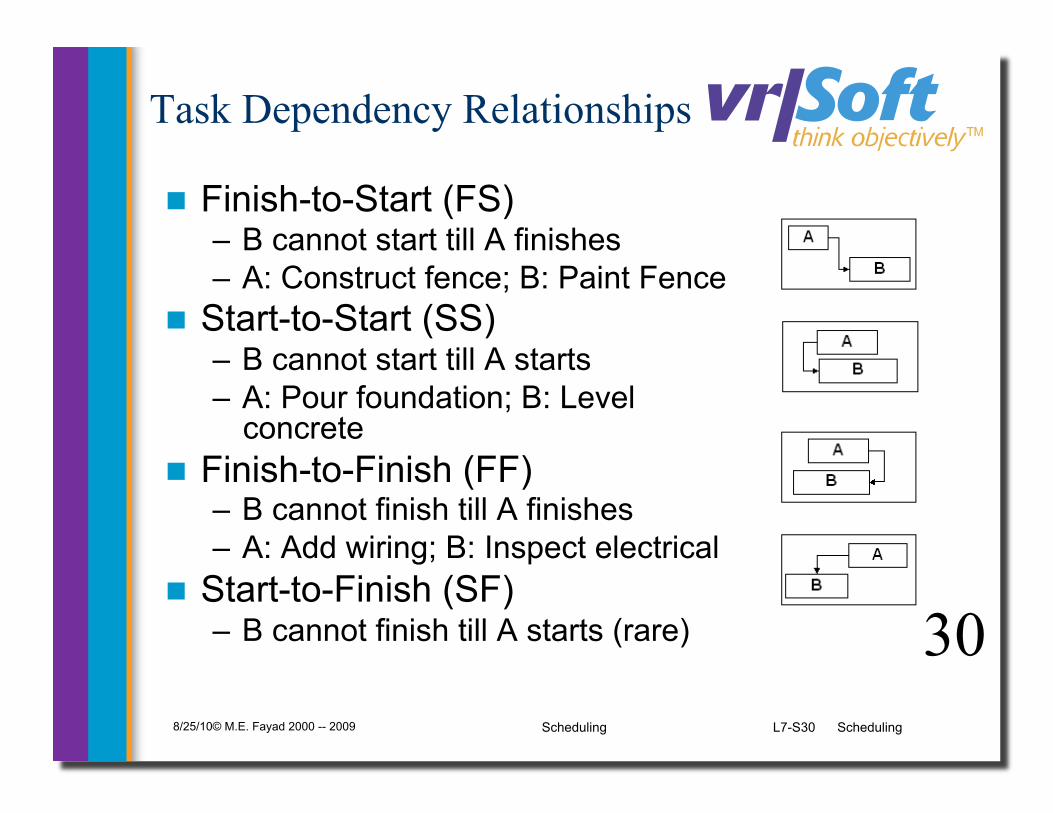
Task Dependency Relationships
Finish-to-Start (FS) – B cannot start till A finishes – A: Construct fence; B: Paint Fence
Start-to-Start (SS) – B cannot start till A starts – A: Pour foundation; B: Level
concrete Finish-to-Finish (FF)
– B cannot finish till A finishes – A: Add wiring; B: Inspect electrical
Start-to-Finish (SF) – B cannot finish till A starts (rare)

L7-S31 Scheduling 8/25/10© M.E. Fayad 2000 -- 2009 Scheduling
31
Example Step 1

L7-S32 Scheduling 8/25/10© M.E. Fayad 2000 -- 2009 Scheduling
32
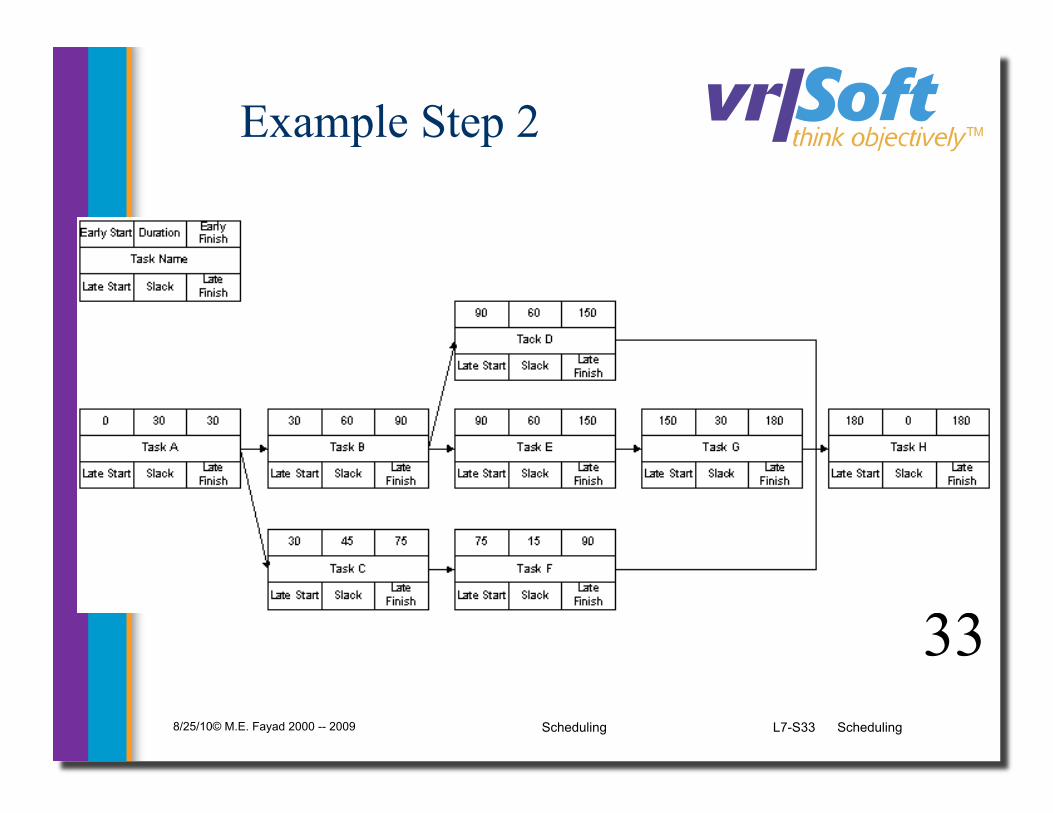
Forward Pass
To determine early start (ES) and early finish (EF) times for each task
Work from left to right Adding times in each path Rule: when several tasks converge, the
ES for the next task is the largest of preceding EF times
L7-S33 Scheduling 8/25/10© M.E. Fayad 2000 -- 2009 Scheduling
33
Example Step 2
L7-S34 Scheduling 8/25/10© M.E. Fayad 2000 -- 2009 Scheduling
34
Backward Pass
To determine the last finish (LF) and last start (LS) times
Start at the end node Compute the bottom pair of numbers Subtract duration from connecting node’s
earliest start time
L7-S35 Scheduling 8/25/10© M.E. Fayad 2000 -- 2009 Scheduling
35
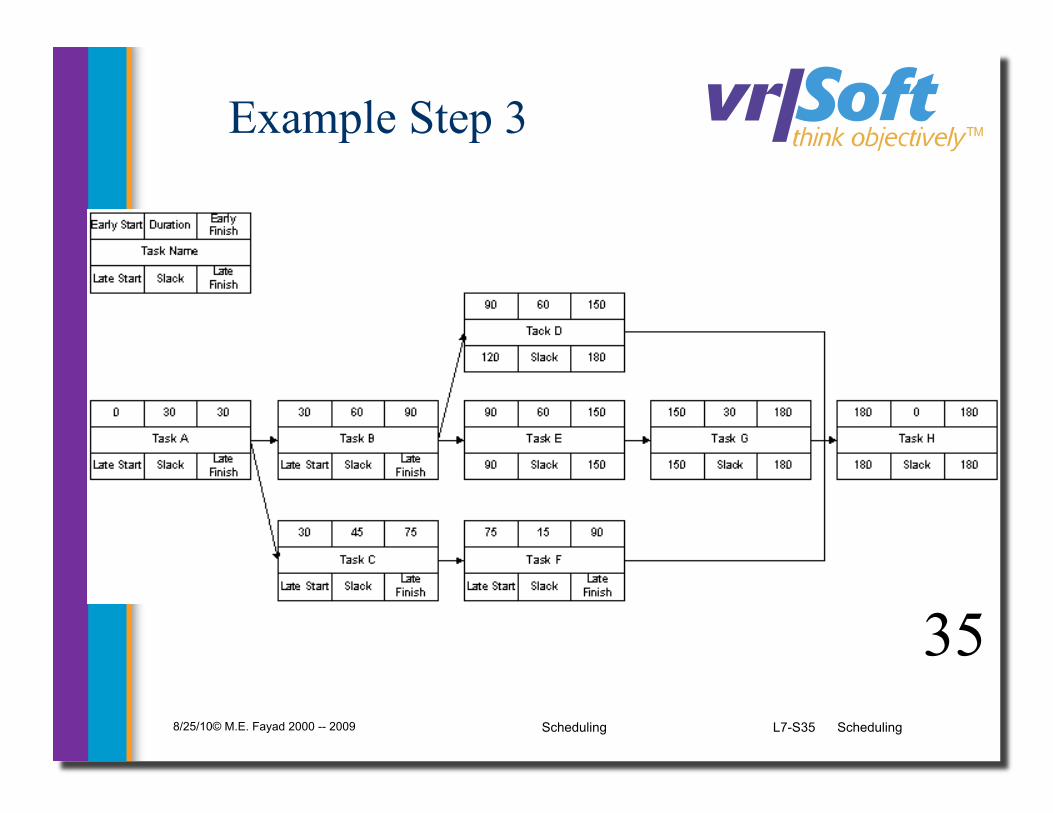
Example Step 3
L7-S36 Scheduling 8/25/10© M.E. Fayad 2000 -- 2009 Scheduling
36
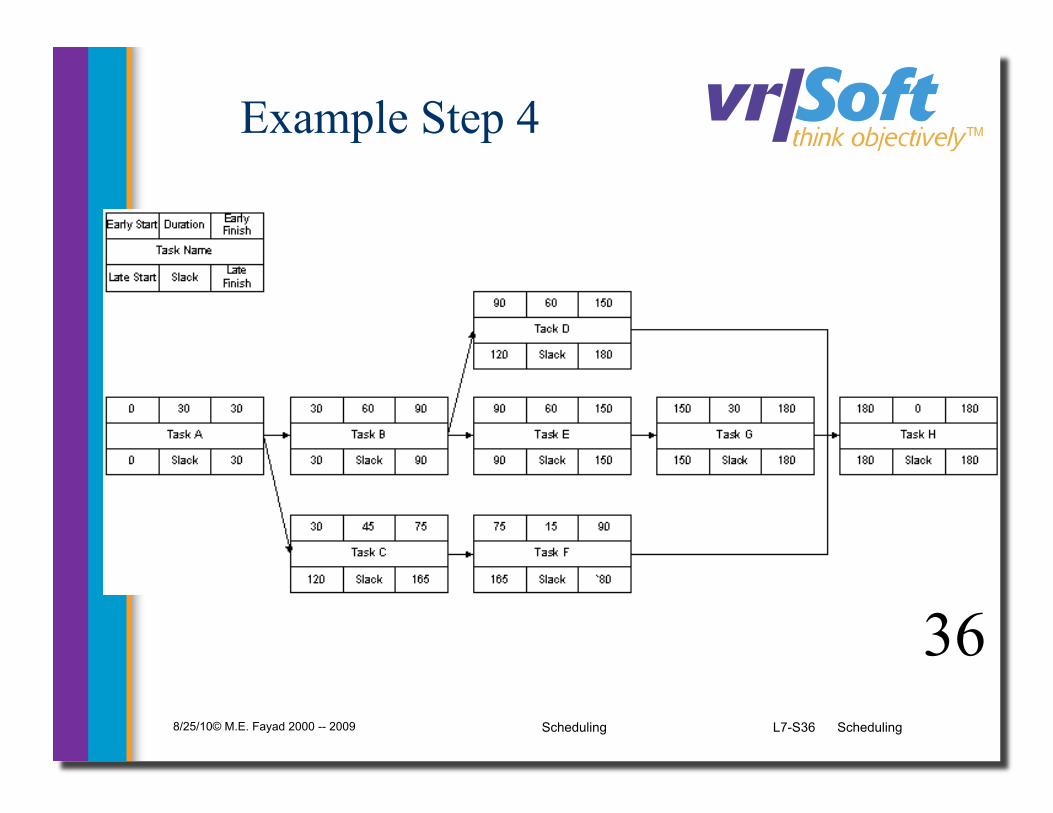
Example Step 4
L7-S37 Scheduling 8/25/10© M.E. Fayad 2000 -- 2009 Scheduling
37
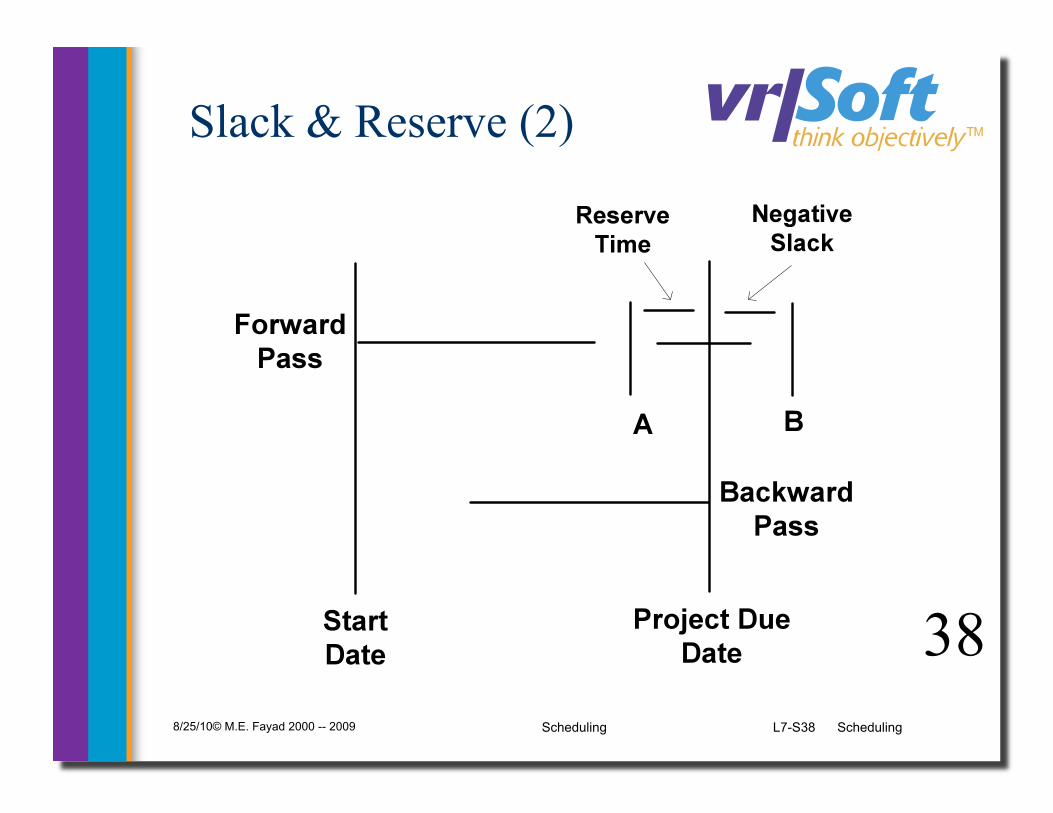
Slack & Reserve (1)
How can slack be negative? What does that mean? How can you address that situation?
L7-S38 Scheduling 8/25/10© M.E. Fayad 2000 -- 2009 Scheduling
38
Slack & Reserve (2)

L7-S39 Scheduling 8/25/10© M.E. Fayad 2000 -- 2009 Scheduling
39
Network Diagrams
Advantages – Show precedence well – Reveal interdependencies not shown in other
techniques – Ability to calculate critical path – Ability to perform “what if” exercises
Disadvantages – Default model assumes resources are unlimited
• You need to incorporate this yourself (Resource Dependencies) when determining the “real” Critical Path
– Difficult to follow on large projects

L7-S40 Scheduling 8/25/10© M.E. Fayad 2000 -- 2009 Scheduling
40
PERT (1)
Program Evaluation and Review Technique Based on idea that estimates are uncertain
– Therefore uses duration ranges – And the probability of falling to a given range
Uses an “expected value” (or weighted average) to determine durations
Use the following methods to calculate the expected durations, then use as input to your network diagram
L7-S41 Scheduling 8/25/10© M.E. Fayad 2000 -- 2009 Scheduling
41
PERT (2)
Start with 3 estimates – Optimistic
• Would likely occur 1 time in 20
– Most likely • Modal value of the distribution
– Pessimistic • Would be exceeded only one time in 20

L7-S42 Scheduling 8/25/10© M.E. Fayad 2000 -- 2009 Scheduling
42
PERT Formula (1)
Combined to estimate a task duration

L7-S43 Scheduling 8/25/10© M.E. Fayad 2000 -- 2009 Scheduling
43
PERT Formula (2)
Confidence Interval can be determined Based on a standard deviation of the
expected time • Using a bell curve (normal distribution)
For the whole critical path use

L7-S44 Scheduling 8/25/10© M.E. Fayad 2000 -- 2009 Scheduling
44
PERT Example
Confidence interval for P2 is 4 times wider than P1 for a given probability
Ex: 68% probability of 9.7 to 11.7 days (P1) vs. 9.5-13.5 days (P2)
Description Planner 1 Planner 2
m 10d 10d
a 9d 9d
b 12d 20d
PERT time 10.16d 11.5d
Std. Dev. 0.5d 1.8d

L7-S45 Scheduling 8/25/10© M.E. Fayad 2000 -- 2009 Scheduling
45
PERT
Advantages – Accounts for uncertainty
Disadvantages – Time and labor intensive – Assumption of unlimited resources is big issue – Lack of functional ownership of estimates – Mostly only used on large, complex project
Get PERT software to calculate it for you
L7-S46 Scheduling 8/25/10© M.E. Fayad 2000 -- 2009 Scheduling
46
CPM vs. PERT
Both use Network Diagrams CPM: deterministic PERT: probabilistic CPM: one estimate, PERT, three
estimates PERT is infrequently used
L7-S47 Scheduling 8/25/10© M.E. Fayad 2000 -- 2009 Scheduling
47
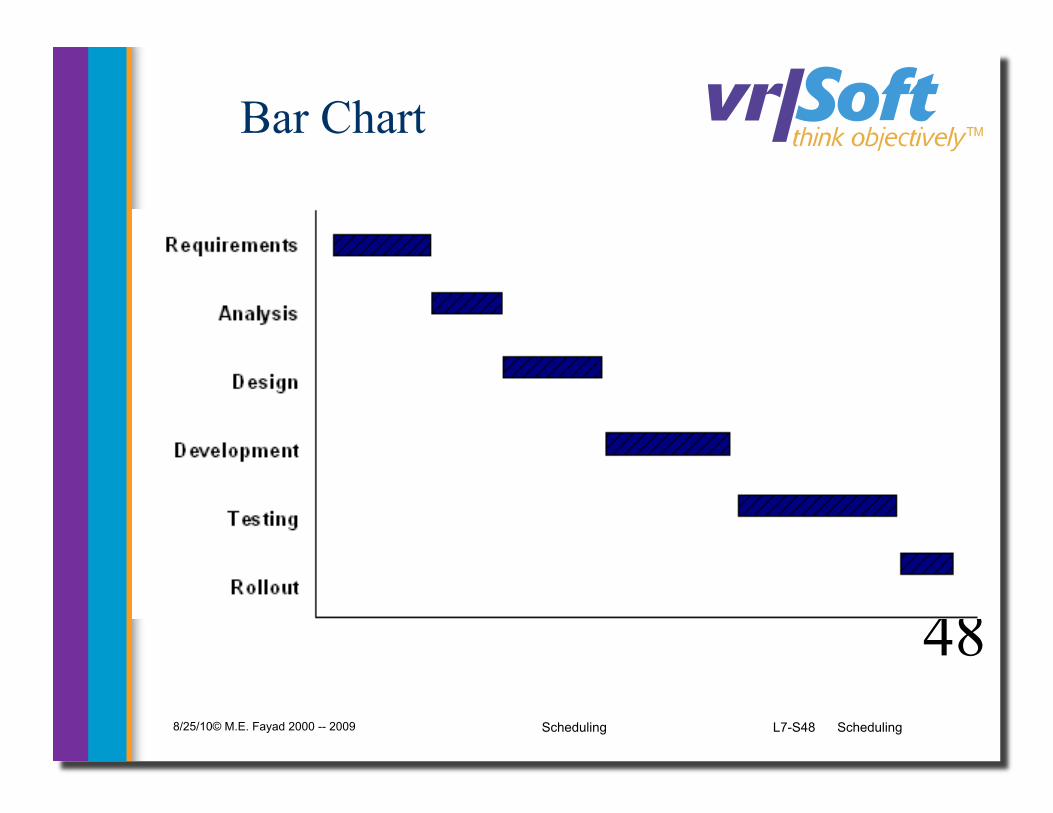
Milestone Chart
Sometimes called a “bar charts” Simple Gantt chart
– Either showing just highest summary bars – Or milestones only
L7-S48 Scheduling 8/25/10© M.E. Fayad 2000 -- 2009 Scheduling
48
Bar Chart

L7-S49 Scheduling 8/25/10© M.E. Fayad 2000 -- 2009 Scheduling
49
Gantt Chart (1)

L7-S50 Scheduling 8/25/10© M.E. Fayad 2000 -- 2009 Scheduling
50
Gantt Chart (2)
Disadvantages – Does not show interdependencies well – Does not uncertainty of a given activity (as does
PERT)
Advantages – Easily understood – Easily created and maintained
Note: Software now shows dependencies among tasks in Gantt charts
– In the “old” days Gantt charts did not show these dependencies, bar charts typically do not
L7-S51 Scheduling 8/25/10© M.E. Fayad 2000 -- 2009 Scheduling
51
Reducing Project Duration
How can you shorten the schedule? Via
– Reducing scope (or quality) – Adding resources – Concurrency (perform tasks in parallel) – Substitution of activities

L7-S52 Scheduling 8/25/10© M.E. Fayad 2000 -- 2009 Scheduling
52
Compression Techniques
Shorten the overall duration of the project Crashing
• Looks at cost and schedule tradeoffs • Gain greatest compression with least cost • Add resources to critical path tasks • Limit or reduce requirements (scope) • Changing the sequence of tasks
Fast Tracking • Overlapping of phases, activities or tasks that would
otherwise be sequential • Involves some risk • May cause rework
L7-S53 Scheduling 8/25/10© M.E. Fayad 2000 -- 2009 Scheduling
53
Mythical Man-Month (1)
Book: “The Mythical Man-Month” – Author: Fred Brooks
“The classic book on the human elements of software engineering”
First two chapters are full of terrific insight (and quotes)

L7-S54 Scheduling 8/25/10© M.E. Fayad 2000 -- 2009 Scheduling
54
“Cost varies as product of men and months, progress does not.”
“Hence the man-month as a unit for measuring the size of job is a dangerous and deceptive myth”
Mythical Man-Month (2)

L7-S55 Scheduling 8/25/10© M.E. Fayad 2000 -- 2009 Scheduling
55
Why is software project disaster so common? – 1. Estimation techniques are poor & assume
things will go well (an ‘unvoiced’ assumption) – 2. Estimation techniques fallaciously confuse effort
with progress, hiding the assumption that men and months are interchangeable
– 3. Because of estimation uncertainty, manager lack courteous stubbornness
– 4. Schedule progress is poorly monitored – 5. When schedule slippage is recognized, the
natural response is to add manpower. Which, is like dousing a fire with gasoline.
Mythical Man-Month (3)

L7-S56 Scheduling 8/25/10© M.E. Fayad 2000 -- 2009 Scheduling
56
Optimism – “All programmers are optimists” – 1st false assumption: “all will go well” or “each task takes
only as long as it ‘ought’ to take” – The Fix: Consider the larger probabilities
Cost (overhead) of communication (and training) • His formula: n(n-1)/2
– How long does a 12 month project take? – 1 person: 1 month – 2 persons = 7 months (2 man-months extra) – 3 persons = 5 months (e man-months extra)
– Fix: don’t assume adding people will solve the problem
Mythical Man-Month (4)

L7-S57 Scheduling 8/25/10© M.E. Fayad 2000 -- 2009 Scheduling
57
Sequential nature of the process – “The bearing of a child takes nine months, no
matter how many women are assigned” What is the most mis-scheduled part of
process? • Testing (the most linear process)
Why is this particularly bad? • Occurs late in process and w/o warning • Higher costs: primary and secondary
Fix: Allocate more test time • Understand task dependencies
Mythical Man-Month (5)

L7-S58 Scheduling 8/25/10© M.E. Fayad 2000 -- 2009 Scheduling
58
Reliance on hunches and guesses – What is ‘gutless estimating’?
The myth of additional manpower – Brooks Law – “Adding manpower to a late project makes it
later”
Mythical Man-Month (6)

L7-S59 Scheduling 8/25/10© M.E. Fayad 2000 -- 2009 Scheduling
59
Q: “How does a project get to be a year late”? – A: “One day at a time”
Studies – Each task: twice as long as estimated – Only 50% of work week was programming
Fixes – No “fuzzy” milestones (get the “true” status) – Reduce the role of conflict – Identify the “true status”
Mythical Man-Month (7)

L7-S60 Scheduling 8/25/10© M.E. Fayad 2000 -- 2009 Scheduling
60
Discussion Questions
Questions?