software size and cost estimation
TRANSCRIPT

8/6/2019 Software Size and Cost Estimation
http://slidepdf.com/reader/full/software-size-and-cost-estimation 1/39
Software Project Management
BIM 8th SEM
Software Size and Cost EstimationUnit 3

8/6/2019 Software Size and Cost Estimation
http://slidepdf.com/reader/full/software-size-and-cost-estimation 2/39
Software Estimation
A project manager produces:
– An estimate of the effort.
– An estimate of the activity durations.
– An estimate of
effort affects costs
– An estimate of
activity durations affects the delivery time

8/6/2019 Software Size and Cost Estimation
http://slidepdf.com/reader/full/software-size-and-cost-estimation 3/39
Difficulties of Estimation
Some estimation difficulties include:• Nature of software.
– Complexity and invisibility of software.
• Subjective nature of estimating.
– Over-estimating and under-estimating.
• Political implications.
– Different objectives of people in an organization.
• Changing technology.
– Technology is rapidly changing, making the experience of previous
project estimates not useable in new ones.
• Lack of homogeneity of project experience.
– Differences between projects.

8/6/2019 Software Size and Cost Estimation
http://slidepdf.com/reader/full/software-size-and-cost-estimation 4/39
Where are estimates done?
Estimates are carried out at different stages of a software
project for a variety of reasons.
• Feasibility study.
•
Strategic planning.• System specification.
• Evaluation of suppliers proposals.
• Project planning.
As the project proceeds, the accuracy of your estimates
improves. Why?

8/6/2019 Software Size and Cost Estimation
http://slidepdf.com/reader/full/software-size-and-cost-estimation 5/39
Over and Under Estimation
• Over-estimating a project can cause it to take longer than itwould otherwise.
Parkinson’s Law: “work expands to fill the time available”.
Brooks Law: ”putting more people on a late job makes it later”
• Underestimating a project:
– can cause it to not be delivered on time and cost but still
could be delivered faster than a more generous estimate.
– On the other side it has bad effect on the Quality why?.
8/6/2019 Software Size and Cost Estimation
http://slidepdf.com/reader/full/software-size-and-cost-estimation 6/39
Basis for Software Estimating
• The need for historical data.
– Most estimation methods need information about past
projects.
–
Care has to be considered when applying pastperformance to new projects because:
• Different programming languages.
• Different experience of staff.
•Different terminology.

8/6/2019 Software Size and Cost Estimation
http://slidepdf.com/reader/full/software-size-and-cost-estimation 7/39
Basis for Software Estimating (cont’d)
• Measuring work.
The time and cost to implement software depends on:
– The developer’s capability and experience.
– The technology used.
In order to express work size independently of the effort, we can use
measures such as:
–
SLOC OR KLOC: Source lines of code or thousands of lines of code.
– Function points.

8/6/2019 Software Size and Cost Estimation
http://slidepdf.com/reader/full/software-size-and-cost-estimation 8/39
Software Effort Estimation Techniques
Some include:
– Expert judgment.
– Analogy estimation.
– Bottom-up estimation.
– Top-down estimation.

8/6/2019 Software Size and Cost Estimation
http://slidepdf.com/reader/full/software-size-and-cost-estimation 9/39
Bottom-up Estimation
•
In this approach the estimator breaks the system into
component tasks.
• The breaking down process is iterative.
• Usually stops when we get tasks that can be done by an
individual in a week or two.
• The bottom-up part comes in adding up the calculated effort
for each activity to get an overall estimate.
• The bottom-up approach works at the level of activities.

8/6/2019 Software Size and Cost Estimation
http://slidepdf.com/reader/full/software-size-and-cost-estimation 10/39
Bottom-up Estimation (cont’d)
A procedural code-oriented approach
one of the software development activities is “writing code”.
Using the bottom-up approach at the level of software
components:• Envisage the number and type of the software modules in the system.
• Estimate the SLOC of each identified module.
•Estimate the work content taking into consideration the complexity and
technical difficulties.
• Calculate the work days effort.

8/6/2019 Software Size and Cost Estimation
http://slidepdf.com/reader/full/software-size-and-cost-estimation 11/39
Top-down Estimation
• It is associated with parametric or algorithmic models.
• A formula for a parametric model:
Effort = (System Size) × (Productivity Rate)
Example:
System Size = 3 KLOC.
Productivity Rate = 40 days per KLOC.
Effort = 3 * 40 =120 Days.System Size is a size driver.
Productivity Rate is a productivity driver.

8/6/2019 Software Size and Cost Estimation
http://slidepdf.com/reader/full/software-size-and-cost-estimation 12/39
Top-down Estimation (cont’d)
Other parametric models:
Function points is concerned more with task sizes.
COCOMO is concerned more with productivity rate.

8/6/2019 Software Size and Cost Estimation
http://slidepdf.com/reader/full/software-size-and-cost-estimation 13/39
Estimation by Analogy
• Also called case-based reasoning.
• For a new project the estimator identifies the previous completed projects
that have similar characteristics to it.
• The new project is referred to as the target project or target case.
• The completed projects are referred to as the source projects or source
cases.
• The effort recorded for the matching source case is used as the base
estimate for the target project.
• The estimator calculates an estimate for the new project by adjusting the
(base estimate) based on the differences that exist between the two
projects.

8/6/2019 Software Size and Cost Estimation
http://slidepdf.com/reader/full/software-size-and-cost-estimation 14/39
Estimation by Analogy (cont’d)
• There are software tools that automate this process by
selecting the nearest project cases to the new project.
•
Some software tools perform that by measuring the Euclideandistance between cases (projects).
• The Euclidean distance is calculate as follows:
distance= square-root of ((target_parameter 1- source_parameter 1 )2 +…
(target_parameter n- source_parameter n )2 )

8/6/2019 Software Size and Cost Estimation
http://slidepdf.com/reader/full/software-size-and-cost-estimation 15/39
Estimation by Analogy (cont’d)
Example
• Assume that cases are matched on the basis of two parameters, thenumber of inputs and the number of outputs.
• The new project requires 7 inputs and 15 outputs.
• You are looking into two past case:
• Project A: has 8 inputs and 17 outputs.
• Project B: has 5 inputs and 10 outputs.
Which is a more closer match for the new project A or project B?
• Distance between new project and project A:
• Square-root of ((7-8) 2 + (15-17) 2)= 2.24Distance between new project and project B:
• Square-root of ((7-5) 2 + (15-10) 2)= 5.39
Project A is a better match because it has less distance than project Bto the new project.

8/6/2019 Software Size and Cost Estimation
http://slidepdf.com/reader/full/software-size-and-cost-estimation 16/39
Albrecht Function Point Analysis
• FP is A top-down method.
• Developed by Allan Albrecht during his work IBM.
Why FP?
• To be able to calculate the functional size of programs
independently of the programming language used.

8/6/2019 Software Size and Cost Estimation
http://slidepdf.com/reader/full/software-size-and-cost-estimation 17/39
Albrecht Function Point Analysis (cont’d)• Idea of FP: A software system consists of five major components or
external user types or functions).Data functions:
– Logical internal file types• Are standing files used by the system.-> group of data items that is
accessed together, it is of one or more records – Purchase Order File(Purchase_order, Purchase_order_item)
– External interface file types• Allows output and input that may pass to and from other computer applications eg
accounting data
Transaction functions:
– External input types• Input transaction which updates internal files
– External output types• Data is output to the user
– External inquiry types• Transactions initiated by the user which provides information but do
not update internal files.

8/6/2019 Software Size and Cost Estimation
http://slidepdf.com/reader/full/software-size-and-cost-estimation 18/39
Albrecht Function Point Analysis (cont’d)
The FP approach:
1. Identify each external user type in your application.
2. Determine the complexity of each user type (high, average orlow).
3. FP score for of each external user type = Multiply the weightof each complexity by the count of each external user typethat has that complexity.
4. FP count = summation of all the FP scores.
FP count indicates the size of the information processing.
8/6/2019 Software Size and Cost Estimation
http://slidepdf.com/reader/full/software-size-and-cost-estimation 19/39
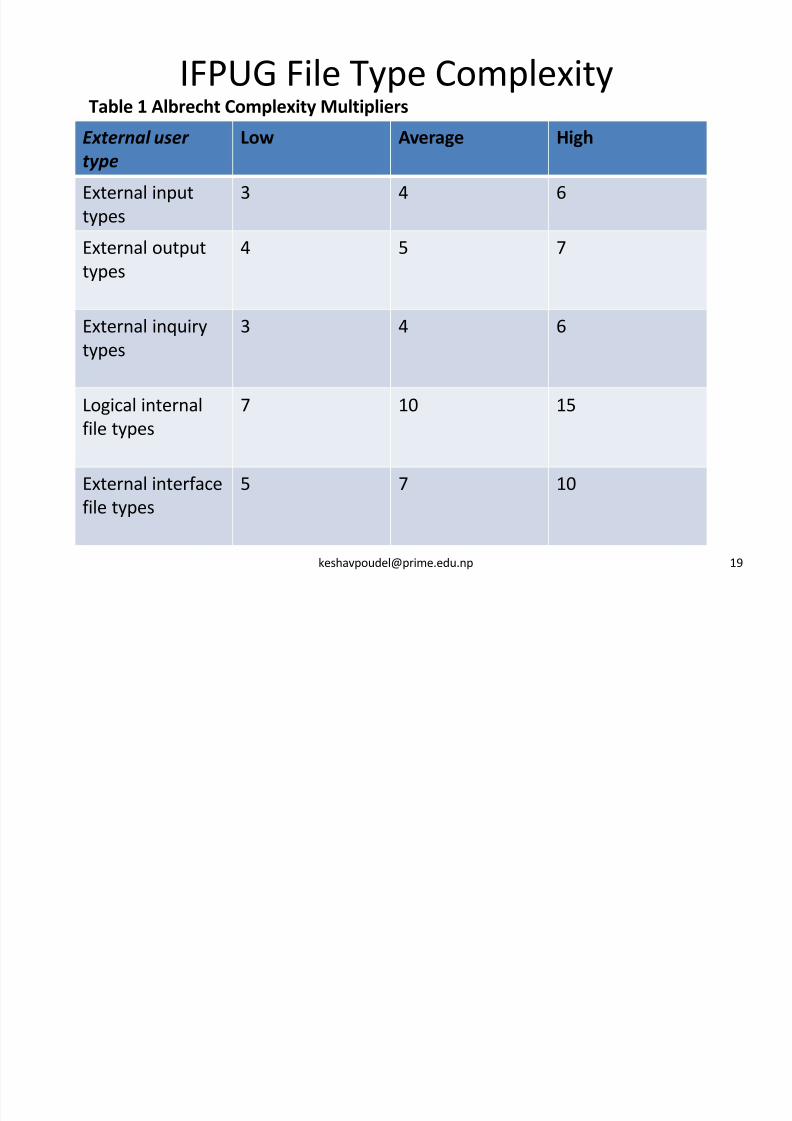
IFPUG File Type Complexity
External user type
Low Average High
External input
types
3 4 6
External output
types
4 5 7
External inquiry
types
3 4 6
Logical internal
file types
7 10 15
External interface
file types
5 7 10
Table 1 Albrecht Complexity Multipliers

8/6/2019 Software Size and Cost Estimation
http://slidepdf.com/reader/full/software-size-and-cost-estimation 20/39
IFPUG File Type Complexity (cont’d)
Number of
record types
Number of data types
<20 20-50 >50
1 Low low Average
2 to 5 Low Average High
>5 Average High High
Table 2 File Type Complexity

8/6/2019 Software Size and Cost Estimation
http://slidepdf.com/reader/full/software-size-and-cost-estimation 21/39
Example
•A logical internal file contains data about purchase orders. Thepurchase orders are organized into two separate record types:
• The main PURCHASE-ORDER details:
1. Purchase order number
2. Supplier reference.
3. Purchase order date.• The details for each PURCHASE-ORDER-ITEM:
1. Product code.
2. Price.
3. Quantity ordered.
What is the complexity of the file and its FP count ? Use tables 1&2.
We have 2 RET and 6 DET, based on that the file has low complexity.
• FP count = 7. [RET is record element type.DET is data element type]

8/6/2019 Software Size and Cost Estimation
http://slidepdf.com/reader/full/software-size-and-cost-estimation 22/39
Albrecht Function Point Analysis (cont’d)
Exercise
• The Payroll system has a payroll data file.
• The Timetabling system has two files: course file, staff file.
• A subsystem for analyzing the staffing costs for each course is needed, and
a programmer has been asked to create the following program:
•A program that will extract yearly salaries from the payroll file, and thehours taught on each course by each member of staff and the details of
courses from the two files maintained by the timetabling system. The
program will produce a report showing for each course the hours taught
by each member of staff and the cost of these hours.
Assuming the report is of high complexity and all other elements are of average complexity calculate the Albrecht Function Points for this subsystem.
Use Table1.

8/6/2019 Software Size and Cost Estimation
http://slidepdf.com/reader/full/software-size-and-cost-estimation 23/39
Exercise
SOLUTION:
3 External interface file types
(payroll file, course file, staff file) with average complexity =7,thus FP score 3*7= 21
1 External output types (report) with high complexity. FP score
1*7= 7
FP count= 21+7=28 FP.

8/6/2019 Software Size and Cost Estimation
http://slidepdf.com/reader/full/software-size-and-cost-estimation 24/39
Albrecht Function Point Analysis (cont’d)
Exercise
• Given that 53 lines of Java are needed on average to
implement a FP.
• How many lines of Java code should be needed to implement
the previous subsystem?
• Assuming a productivity rate of 50 lines of code a day, what
would be the estimate of effort?

8/6/2019 Software Size and Cost Estimation
http://slidepdf.com/reader/full/software-size-and-cost-estimation 25/39
COCOMO II
•
It is a parametric productivity model.• It id developed by Barry Boehm in the late 1970s.(based on 63
projects)
• COCOMO is short for COnstructive COst MOdel.
• The basic model was built around the following equation:Effort= c(size)k
– The effort is measured in person-months(pm), consisting of units of
152 working hours.
–
The size is measured in (Kdsi) thousands of delivered source code of instructions.
– c and k are constants.

8/6/2019 Software Size and Cost Estimation
http://slidepdf.com/reader/full/software-size-and-cost-estimation 26/39
COCOMO II (cont’d)
• The first step is to estimate the system size in terms of kdsi .
• C and k depend on classifying the system in Boehm’s terms as:
• Organic mode.
– Small team,
– Small system,
–
Interface requirements flexible, – In- house software development.
• Embedded mode.
– Product has to operate within very tight constraints,
– the project team is large,
–
development environment consists of many complex interfaces, – Changes are very costly.
• Semi-detached mode.
– Combination from the two above modes.

8/6/2019 Software Size and Cost Estimation
http://slidepdf.com/reader/full/software-size-and-cost-estimation 27/39
COCOMO II (cont’d)
27
C and k values

8/6/2019 Software Size and Cost Estimation
http://slidepdf.com/reader/full/software-size-and-cost-estimation 28/39
COCOMO II (cont’d)
• COCOMO II is designed to accommodate the fact that
estimates will be needed at different stages of the system life
cycle.
• COCOMO II has models for three different stages:
– Application composition.
– Early design.
– Post Architecture.

8/6/2019 Software Size and Cost Estimation
http://slidepdf.com/reader/full/software-size-and-cost-estimation 29/39
Application composition Stage
• The external features that the user will experience are
designed.
•
Prototyping will typically be deployed to do this.
• Uses object points to estimate the size of the product
• Objects include physical features such as screens, reports
rather than logical features.

8/6/2019 Software Size and Cost Estimation
http://slidepdf.com/reader/full/software-size-and-cost-estimation 30/39
Early Design Stage
• At this stage the fundamental software structures are
designed.
•
Estimate the size by FPs.
• FPs may be converted to a LOC equivalent.
• Estimate scale factor and effort multiplier.
8/6/2019 Software Size and Cost Estimation
http://slidepdf.com/reader/full/software-size-and-cost-estimation 31/39
Early Design(cont’d)
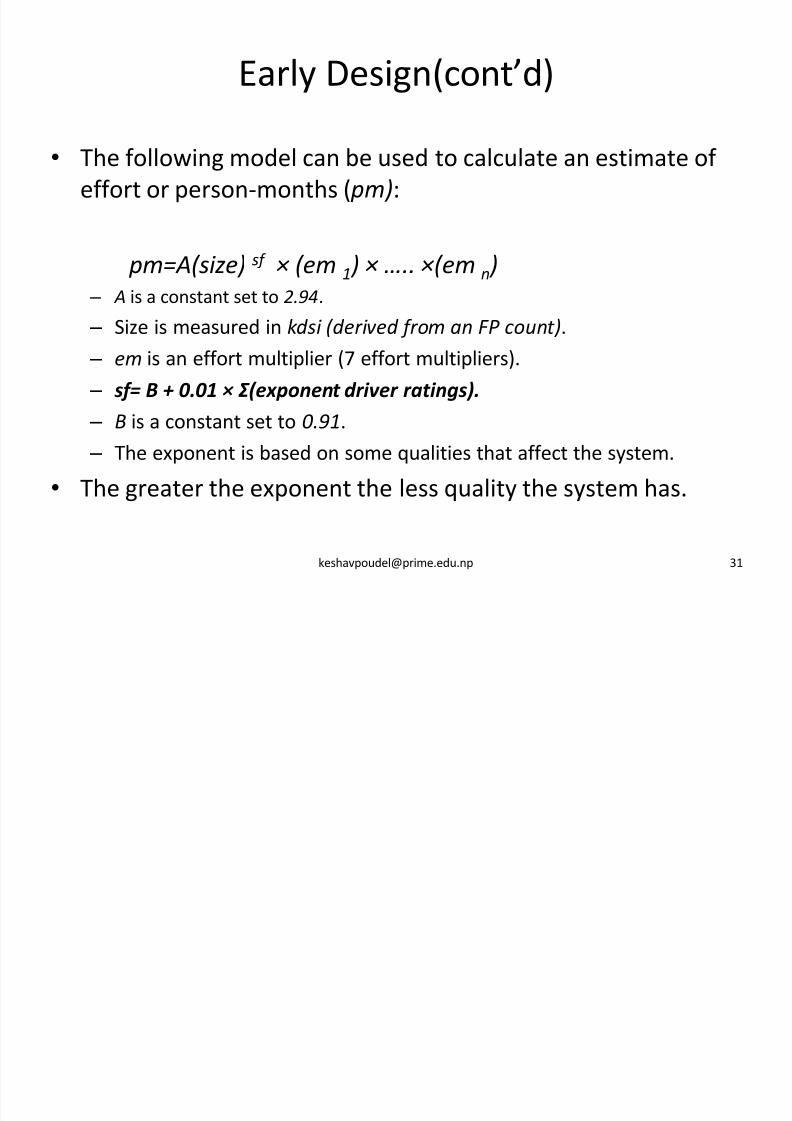
• The following model can be used to calculate an estimate of
effort or person-months ( pm):
pm=A(size) sf × (em1
) × ….. ×(emn
)
– A is a constant set to 2.94.
– Size is measured in kdsi (derived from an FP count).
– em is an effort multiplier (7 effort multipliers).
– sf= B + 0.01 × Σ (exponent driver ratings).
– B is a constant set to 0.91.
– The exponent is based on some qualities that affect the system.
• The greater the exponent the less quality the system has.
8/6/2019 Software Size and Cost Estimation
http://slidepdf.com/reader/full/software-size-and-cost-estimation 32/39
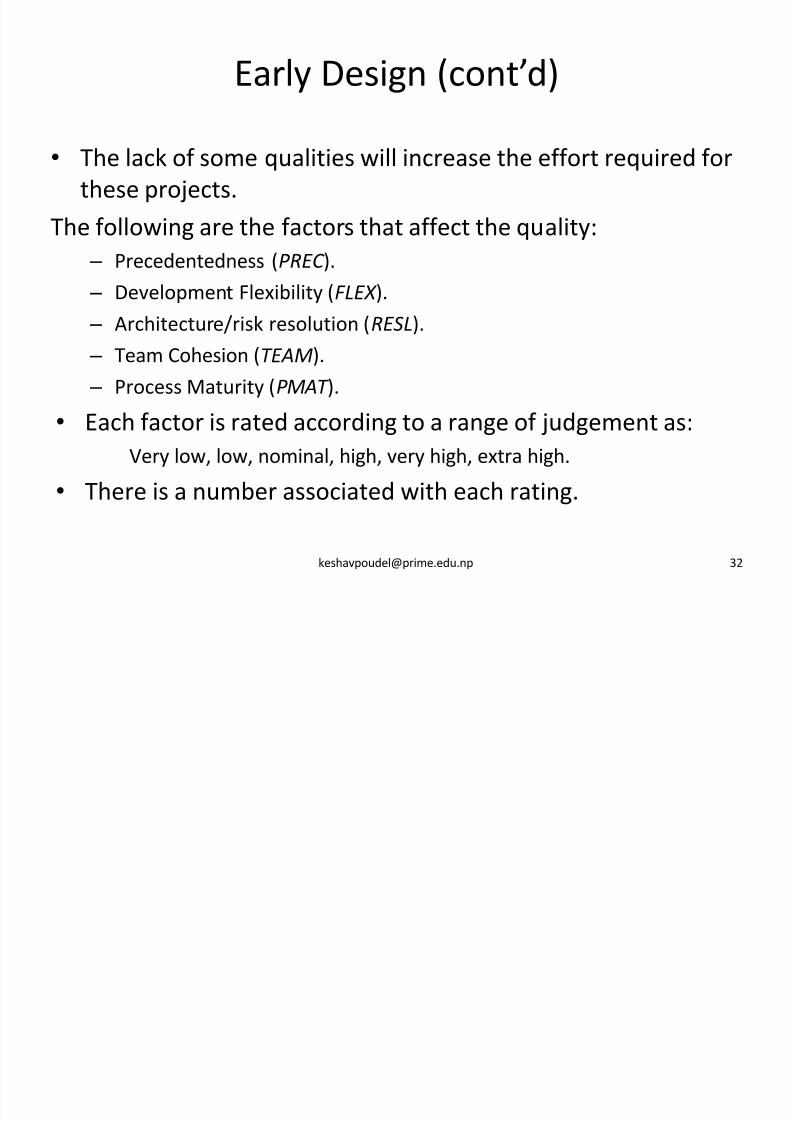
Early Design (cont’d)
• The lack of some qualities will increase the effort required for
these projects.
The following are the factors that affect the quality:
– Precedentedness (PREC ).
– Development Flexibility (FLEX ).
– Architecture/risk resolution (RESL).
– Team Cohesion (TEAM).
– Process Maturity (PMAT ).
• Each factor is rated according to a range of judgement as:Very low, low, nominal, high, very high, extra high.
• There is a number associated with each rating.

8/6/2019 Software Size and Cost Estimation
http://slidepdf.com/reader/full/software-size-and-cost-estimation 33/39
Driver table
8/6/2019 Software Size and Cost Estimation
http://slidepdf.com/reader/full/software-size-and-cost-estimation 34/39
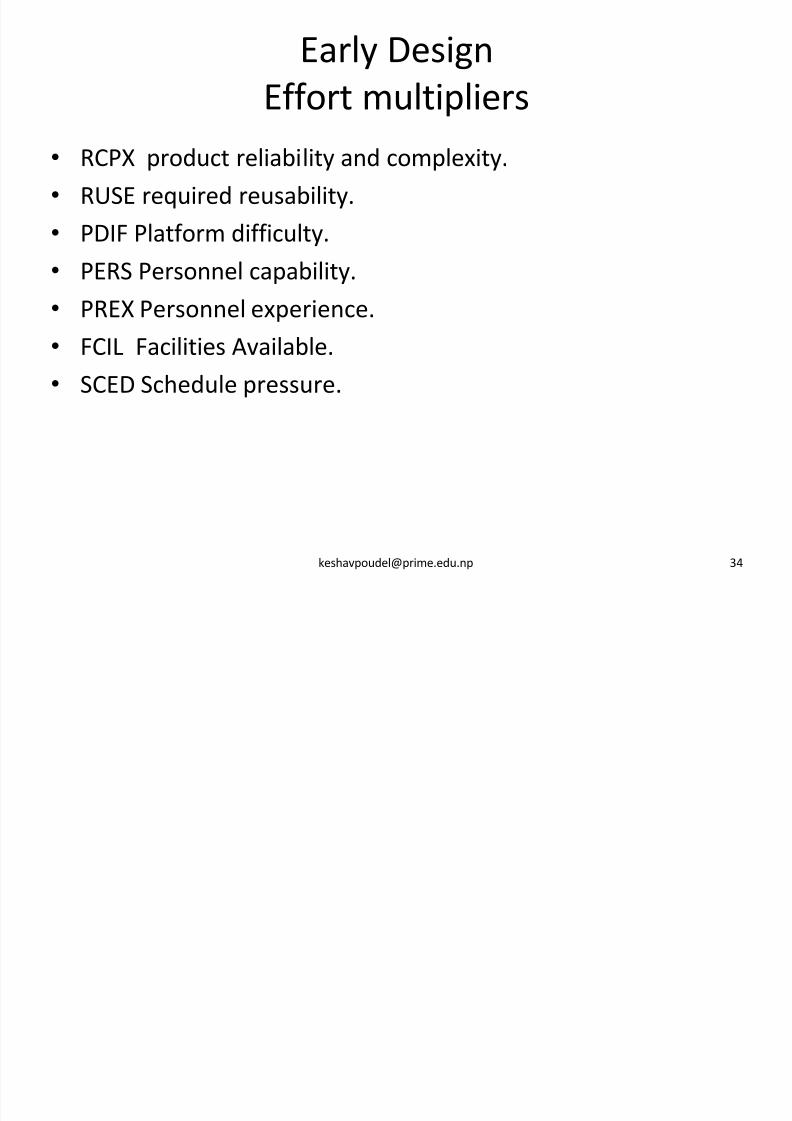
Early Design
Effort multipliers
• RCPX product reliability and complexity.
• RUSE required reusability.
• PDIF Platform difficulty.
•
PERS Personnel capability.• PREX Personnel experience.
• FCIL Facilities Available.
• SCED Schedule pressure.

8/6/2019 Software Size and Cost Estimation
http://slidepdf.com/reader/full/software-size-and-cost-estimation 35/39
Exercise

8/6/2019 Software Size and Cost Estimation
http://slidepdf.com/reader/full/software-size-and-cost-estimation 36/39
Solution
•
sf= B + 0.01 × Σ(exponent driver ratings)
sf= 0.91 + 0.01 * (3.72 + 2.03 + 7.07 + 1.10 +6.24)=1.112
Scale factor=1.112
• 2000 lines of code = how many kdsi
2000/1000 =2 kdsi
Pm=A(size) sf
= 2.94 * (2) 1.112 =6.35
Effort = 6.35 person-months.

8/6/2019 Software Size and Cost Estimation
http://slidepdf.com/reader/full/software-size-and-cost-estimation 37/39
Post Architecture Stage
• Estimation after the software architecture has been defined
and going into its final construction.
•
The same basic model equation
• Size estimation by KLOC or FPs
• Same scale factor estimation
• 17 factors in EM .

8/6/2019 Software Size and Cost Estimation
http://slidepdf.com/reader/full/software-size-and-cost-estimation 38/39
Post Architecture (cont’d)
•17 factors in 4 different categories – Product attributes
• e.g.: Database size
– Platform attributes
• e.g.: main storage constraint
– Personnel attributes
• e.g.: Analyst capability.
– Project attributes
• e.g.: Multisite developers.
8/6/2019 Software Size and Cost Estimation
http://slidepdf.com/reader/full/software-size-and-cost-estimation 39/39
• Refer to the following manual for more details on the Post
Architecture stage.
http://sunset.usc.edu/csse/research/COCOMOII/COCOMO_main
.html.
39k h d l@ i d