soi bullet in - internal revenue service · soi bullet in a quarterly ... the proprietor’s...
TRANSCRIPT
w w w . i r s . g o v / t a x s t a t sStatistics of Income Bulletin | Fall 2016
SOI BulletIn A QuArterly StAtiSticS of income report | Volume 36, number 2
The Statistics of Income (SOI) Bulletin is issued quarterly by the Statistics of Income Division of the Internal Revenue Service. The report provides the earliest published annual fi-nancial statistics obtained from the various types of tax and information returns filed, as well as information from periodic or special analytical studies of particular interest to students of the U.S. tax system, tax policymakers, and tax administra-tors. Selected historical and other data tables, previously pub-lished in the spring issue of the Bulletin are now only available on SOI’s pages of the IRS Website (https://www.irs.gov/uac/soi-tax-stats-historical-data-tables).
Information on the availability of supplemental data on the topics included in this issue or other SOI subjects, may be ob-tained by sending an email to SOI’s Statistical Information Services at [email protected], or by writing to the Director, Statistics of Income Division RAAS:S, Internal Revenue Service, 1111 Constitution Avenue, NW, K-Room 4112, Washington, D.C. 20224.
The SOI Bulletin is prepared under the direction of Wayne Kei, Chief, Communications and Data Dissemination Section. Paul Bastuscheck (layout and graphics), Clay Moulton (layout and graphics), Lisa Smith (layout and graphics editor), and Camille Swick (layout and graphics) are the editorial staff who prepare the manuscript. Carla Borden, Jim Hobbs, Emily Gross, and Beth Kilss also made major contributions in the production of this issue. Views expressed in the articles are those of the au-thors and do not necessarily represent the views of the Treasury Department or the Internal Revenue Service.
NOTE: When using information from this report, cite the publi-cation as follows—
Internal Revenue ServiceStatistics of Income BulletinFall 2016Washington, D.C.
Inside This Issue:
Sole Proprietorship Returns, Tax Year 2014 2by Adrian DunganFor Tax Year 2014, taxpayers reported nonfarm sole proprietor-ship activity on approximately 24.6 million individual income tax returns, a 2.3-percent increase from 2013. Profits rose to $317.1 billion for 2014, a 4.9-percent increase from the previ-ous year. In constant dollars, total nonfarm sole proprietorship profits increased 3.2 percent for 2014. Total profits as a percent-age of business receipts were 22.7 percent for 2014, the second highest level in this data series which began in 1988.
Partnership Returns, Tax Year 2014 61by Ron DeCarlo and Nina ShumofskyThe number of partnerships and partners in the United States continued to increase for Tax Year 2014. Partnerships filed more than 3.6 million returns for the year, representing more than 27 million partners. Real estate and rental and leasing accounted for about half (50.3 percent) of all partnerships and over a quarter (28.5 percent) of all partners. Total net income (loss), or profit, increased 8.9 percent to $837.4 billion for 2014. Ordinary busi-ness income accounted for the majority of this increase.
Transactions Between Large Foreign-Owned Domestic Corporations and Related Foreign Persons, Tax Year 2010 173by Isaac J. GoodwinThe total value of nonloan transactions between large for-eign-owned domestic corporations and related foreign parties amounted to $1.208 trillion for Tax Year 2010, a 1.8-percent increase from the 2008 study’s $1.187 trillion. This represents the second-highest total since the inception of the study, trailing only 2006’s $1.861 trillion. Sales (59.4 percent) and purchases of stock-in-trade (75.2 percent) represent the bulk of the total value of nonloan transactions, which is consistent with prior years.

w w w . i r s . g o v / t a x s t a t sStatistics of Income Bulletin | Fall 2016
Sole Proprietorship Returns, Tax Year 2014by Adrian Dungan
1 For 2014, the 24,633,003 nonfarm sole proprietorship returns accounted for an estimated 27,556,784 nonfarm businesses. For purposes of the statistics, if a proprietor owned more than one business, the statistics for each business were combined with those of the proprietor’s dominant business and included in the industrial group for that business activity. When this occurred, the sum of net incomes (for businesses reporting a positive net income) reduced by the sum of net deficits (for businesses reporting a deficit) yielded the profits for a specific industrial group. The North American Industry Classification System (NAICS) was used to classify data by industries for 2014. These classifications were applied on a “per business” (rather than on a “per establish-ment”) basis for Statistics of Income by combining various industry groups, although businesses were further combined as described above. While the wording of the industry titles used for the sole proprietorship statistics diverge somewhat from those appearing in NAICS, the definitions are consistent. The North American Industry Classification System for industrial coding was introduced in Tax Year 1998. Prior to 1998 industries were classified using the Standard Industrial Classification (SIC). Due to coding changes, comparisons between data by industry from 1998–2014 with 1997 and prior years may show inconsistencies. A reason for this was that several types of sole proprietorships under the NAICS system were classified in completely different industrial groups, which makes prior-year comparisons under the SIC system inappropriate. For example, in 1997, finance, insurance, and real estate were classified as one industry under the SIC system, while, under the NAICS system, the group has been split into two industrial sectors: “finance and insurance” and “real estate and rental and leasing.” The industrial sectors based on the NAICS codes are reported in Tables 1 and 2.
F or Tax Year 2014, there were approximately 24.6 mil-lion individual income tax returns that reported nonfarm sole proprietorship activity, a 2.3-percent increase from
2013. Total nonfarm sole proprietorship profits rose to $317.1 billion for 2014, a 4.9-percent increase from 2013. In con-stant dollars, they increased by 3.2 percent for 2014. Total profits as a percentage of business receipts were 22.7 percent for 2014, the second highest level in this data series, which began in 1988. The largest percentage increase in profits was reported by the transportation and warehousing sector, which increased 17.7 percent or $2.2 billion. The professional, scientific, and technical services sector accounted for 24.7 percent of total profits, which was the largest of any sector. Total profits in the sector rose to $78.2 billion, a 6.5-percent increase for 2014.
For sole proprietorships as a whole, receipts increased 3.9 percent, while deductions increased 3.7 percent. The construc-tion sector reported the largest percentages of total business receipts (15.3 percent) and total business deductions (16.5 per-cent). The transportation and warehousing sector reported the largest rise in business receipts, with a 10.7-percent increase. Among all industrial sectors, the retail trade sector was the only sector which experienced a downturn in receipts, losing $4.0 bil-lion or 2.1 percent. This sector also reported the only decrease in deductions, with a decline of $4.1 billion or 2.2 percent.
Returns and ReceiptsBetween 2013 and 2014, the number of individual income tax returns reporting nonfarm sole proprietorship activity increased 2.3 percent to 24.6 million (Figure A).1 The transportation
Figure ANonfarm Sole Proprietorship Returns, Receipts, and Deductions, by Selected Industrial Sector, Tax Years 2013 and 2014[Number of returns is in thousands—money amounts are in billions of dollars]
Number of returns Total business receipts Total business deductions [1]Selected industrial sector
(1) (2) (3) (4) (5) (6) (7) (8) (9)
All nonfarm industries 24,074.7 24,631.8 2.3 1,341.6 1,393.9 3.9 1,040.4 1,078.5 3.7 Construction 2,700.3 2,732.0 1.2 200.5 213.2 6.4 166.7 177.9 6.7 Specialty trade contractors 2,149.9 2,152.5 0.1 140.5 148.0 5.3 114.0 120.8 6.0 Wholesale trade (merchant wholesalers) 345.9 347.4 0.4 54.8 57.1 4.2 50.2 52.2 4.0 Retail trade 2,379.9 2,399.0 0.8 191.9 187.9 -2.1 181.4 177.4 -2.2 Transportation and warehousing 1,180.4 1,295.6 9.8 95.6 105.9 10.7 83.0 91.1 9.7 Finance and insurance 618.3 626.1 1.3 78.6 81.0 3.1 59.3 60.7 2.4 Real estate and rental and leasing 1,163.4 1,144.6 -1.6 67.7 68.1 0.6 43.9 43.8 -0.2 Real estate 1,104.2 1,091.6 -1.1 63.5 63.9 0.7 39.8 39.5 -0.6 Professional, scientific, and technical services 3,274.6 3,329.4 1.7 174.2 180.9 3.9 100.9 102.8 2.0 Administrative and support and waste management and remediation services 2,601.8 2,639.8 1.5 71.5 74.7 4.5 49.4 52.4 6.1 Health care and social assistance 2,115.8 2,145.7 1.4 119.3 120.1 0.6 71.0 70.6 -0.6 Arts, entertainment, and recreation 1,512.0 1,545.6 2.2 37.9 40.0 5.6 28.8 30.3 5.2 Performing arts, spectator sports, and related industries 1,222.4 1,261.3 3.2 29.1 29.2 0.6 20.2 19.9 -1.7 Other services 3,175.2 3,269.8 3.0 98.0 103.5 5.6 72.6 76.1 4.8 Personal and laundry services 2,132.7 2,205.7 3.4 52.7 56.8 7.8 34.6 37.5 8.4 All other sectors 3,007.2 3,156.9 5.0 151.5 161.4 6.5 133.3 143.3 7.5 [1] Total business deductions are calculated before subtraction of nonallowable "passive" activity losses and inclusion of any "passive loss" carryover from prior years.NOTES: Detail may not add to totals because of rounding. Percentages were calculated before rounding.SOURCE: IRS, Statistics of Income Division, Sole Proprietorship Returns, October 2016.
2013 2014 2013 2014 2013 2014Percentagechange
Percentagechange
Percentagechange
3
Sole Proprietorship Returns, 2014
Fall 2016Statistics of Income Bulletin
and warehousing sector had the largest percentage increase in number of returns among all sectors, increasing 9.8 percent for 2014. The largest sector in terms of number of returns was the professional, scientific, and technical services sector. The number of returns in this sector rose to 3.3 million, an increase of 1.7 percent from 2013. The second largest sector based on returns was the other services sector, which is mainly comprised of personal and laundry services. This sector had a 3.0-percent increase in number of returns to 3.3 million.
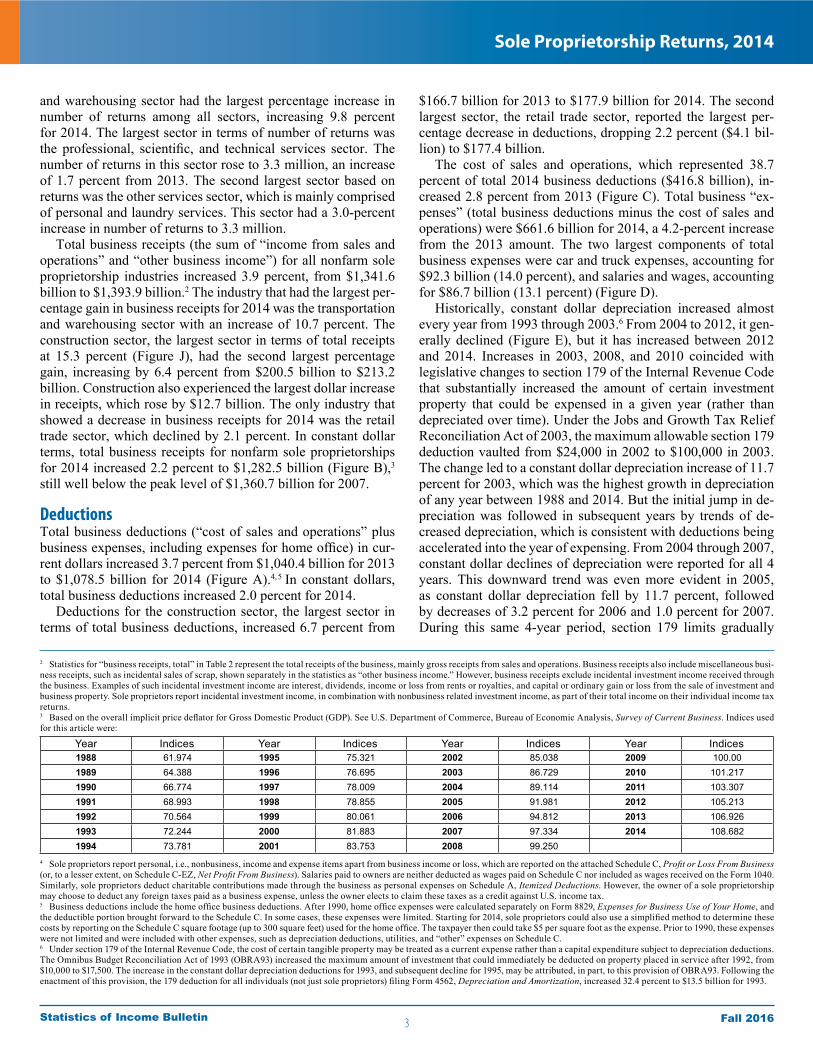
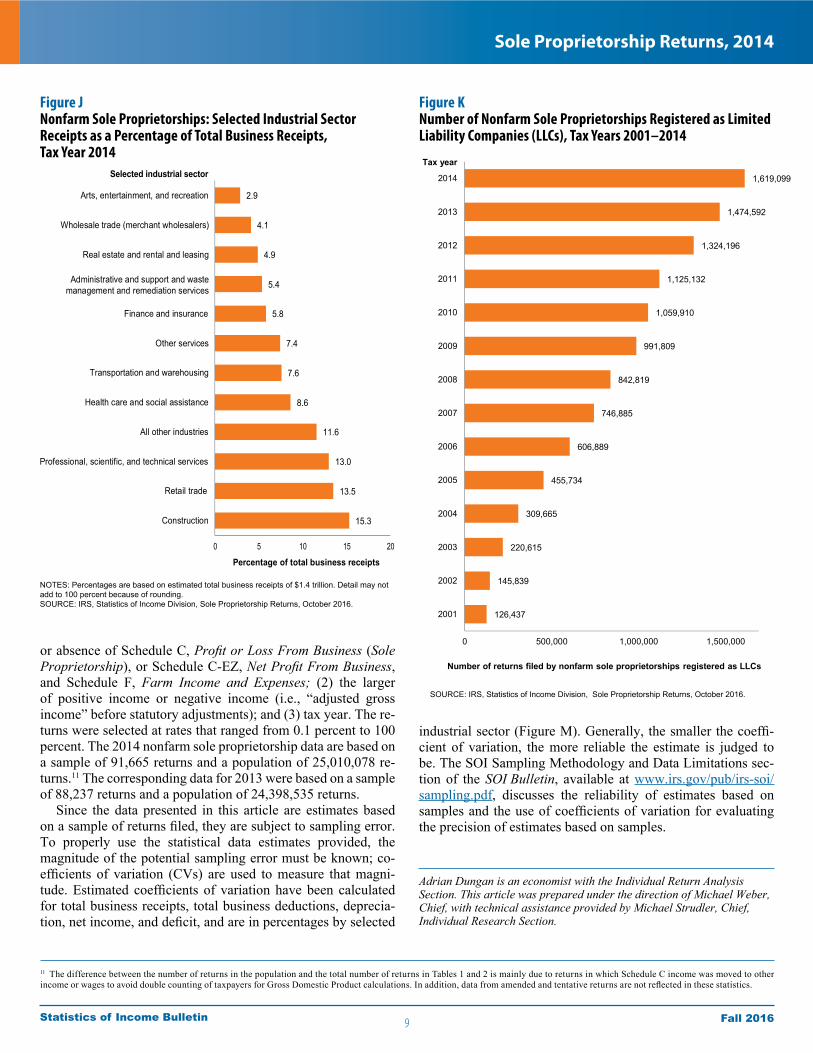
Total business receipts (the sum of “income from sales and operations” and “other business income”) for all nonfarm sole proprietorship industries increased 3.9 percent, from $1,341.6 billion to $1,393.9 billion.2 The industry that had the largest per-centage gain in business receipts for 2014 was the transportation and warehousing sector with an increase of 10.7 percent. The construction sector, the largest sector in terms of total receipts at 15.3 percent (Figure J), had the second largest percentage gain, increasing by 6.4 percent from $200.5 billion to $213.2 billion. Construction also experienced the largest dollar increase in receipts, which rose by $12.7 billion. The only industry that showed a decrease in business receipts for 2014 was the retail trade sector, which declined by 2.1 percent. In constant dollar terms, total business receipts for nonfarm sole proprietorships for 2014 increased 2.2 percent to $1,282.5 billion (Figure B),3 still well below the peak level of $1,360.7 billion for 2007.
DeductionsTotal business deductions (“cost of sales and operations” plus business expenses, including expenses for home office) in cur-rent dollars increased 3.7 percent from $1,040.4 billion for 2013 to $1,078.5 billion for 2014 (Figure A).4, 5 In constant dollars, total business deductions increased 2.0 percent for 2014.
Deductions for the construction sector, the largest sector in terms of total business deductions, increased 6.7 percent from
$166.7 billion for 2013 to $177.9 billion for 2014. The second largest sector, the retail trade sector, reported the largest per-centage decrease in deductions, dropping 2.2 percent ($4.1 bil-lion) to $177.4 billion.
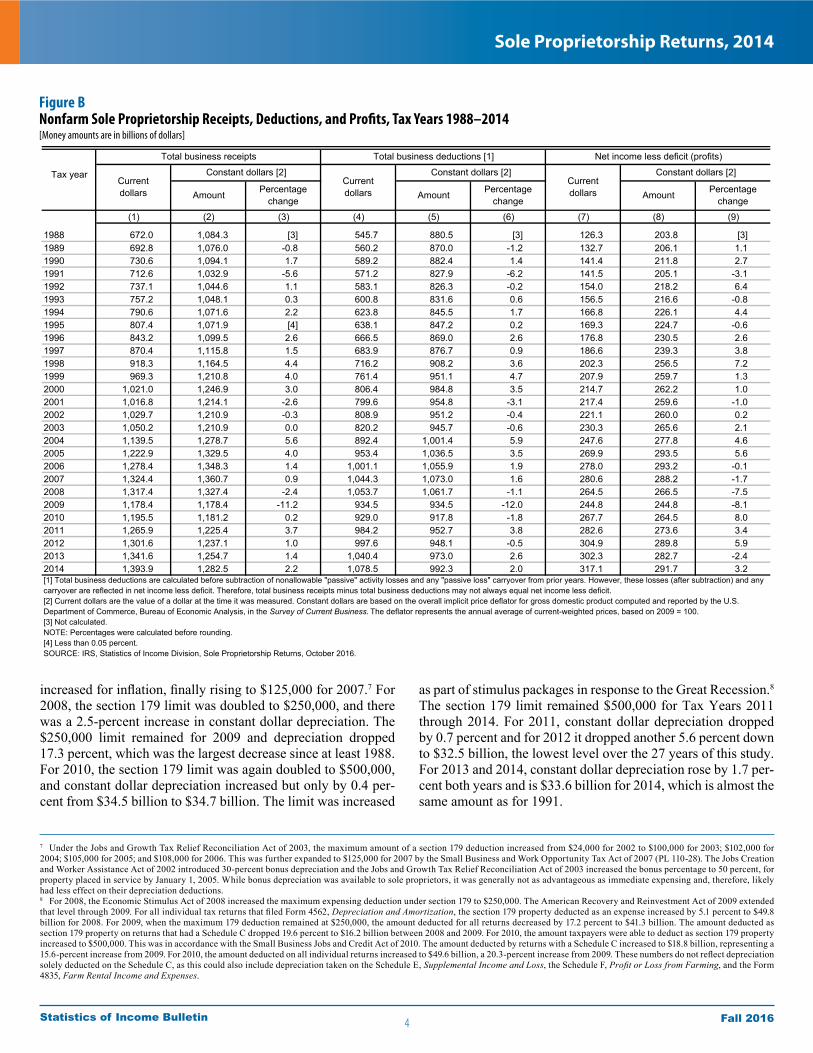
The cost of sales and operations, which represented 38.7 percent of total 2014 business deductions ($416.8 billion), in-creased 2.8 percent from 2013 (Figure C). Total business “ex-penses” (total business deductions minus the cost of sales and operations) were $661.6 billion for 2014, a 4.2-percent increase from the 2013 amount. The two largest components of total business expenses were car and truck expenses, accounting for $92.3 billion (14.0 percent), and salaries and wages, accounting for $86.7 billion (13.1 percent) (Figure D).
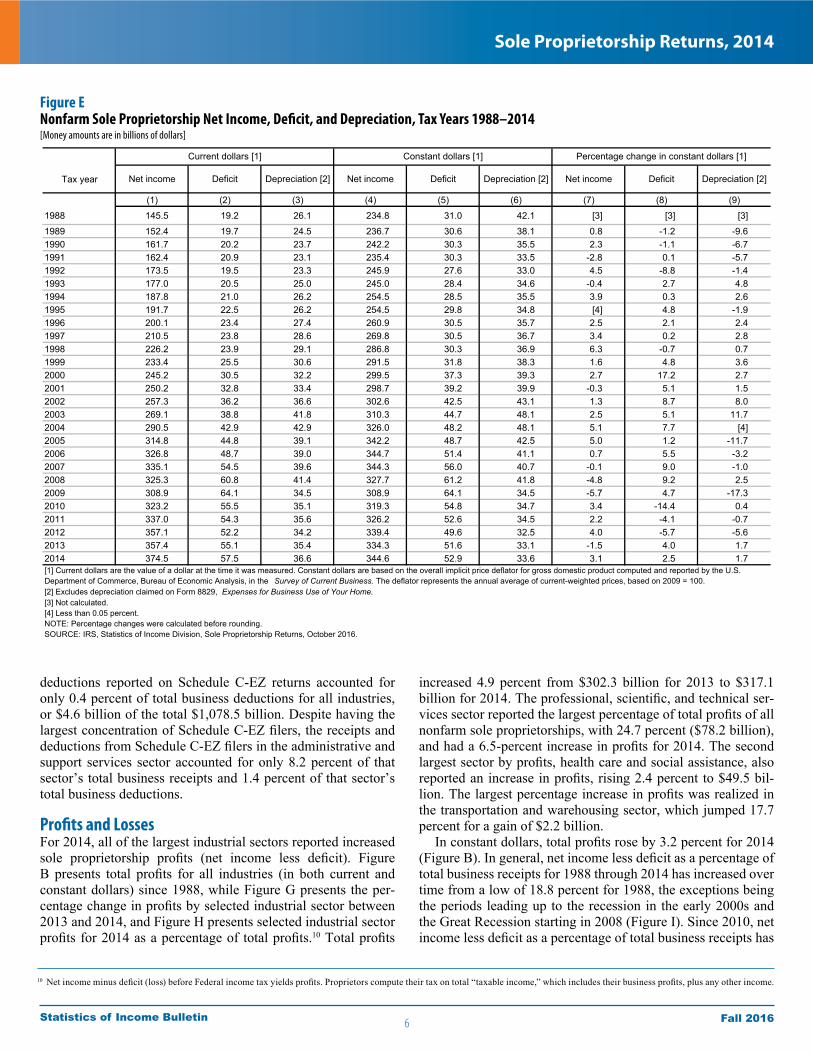
Historically, constant dollar depreciation increased almost every year from 1993 through 2003.6 From 2004 to 2012, it gen-erally declined (Figure E), but it has increased between 2012 and 2014. Increases in 2003, 2008, and 2010 coincided with legislative changes to section 179 of the Internal Revenue Code that substantially increased the amount of certain investment property that could be expensed in a given year (rather than depreciated over time). Under the Jobs and Growth Tax Relief Reconciliation Act of 2003, the maximum allowable section 179 deduction vaulted from $24,000 in 2002 to $100,000 in 2003. The change led to a constant dollar depreciation increase of 11.7 percent for 2003, which was the highest growth in depreciation of any year between 1988 and 2014. But the initial jump in de-preciation was followed in subsequent years by trends of de-creased depreciation, which is consistent with deductions being accelerated into the year of expensing. From 2004 through 2007, constant dollar declines of depreciation were reported for all 4 years. This downward trend was even more evident in 2005, as constant dollar depreciation fell by 11.7 percent, followed by decreases of 3.2 percent for 2006 and 1.0 percent for 2007. During this same 4-year period, section 179 limits gradually
2 Statistics for “business receipts, total” in Table 2 represent the total receipts of the business, mainly gross receipts from sales and operations. Business receipts also include miscellaneous busi-ness receipts, such as incidental sales of scrap, shown separately in the statistics as “other business income.” However, business receipts exclude incidental investment income received through the business. Examples of such incidental investment income are interest, dividends, income or loss from rents or royalties, and capital or ordinary gain or loss from the sale of investment and business property. Sole proprietors report incidental investment income, in combination with nonbusiness related investment income, as part of their total income on their individual income tax returns.3 Based on the overall implicit price deflator for Gross Domestic Product (GDP). See U.S. Department of Commerce, Bureau of Economic Analysis, Survey of Current Business. Indices used for this article were:
Year Indices Year Indices Year Indices Year Indices1988 61.974 1995 75.321 2002 85.038 2009 100.001989 64.388 1996 76.695 2003 86.729 2010 101.2171990 66.774 1997 78.009 2004 89.114 2011 103.3071991 68.993 1998 78.855 2005 91.981 2012 105.2131992 70.564 1999 80.061 2006 94.812 2013 106.9261993 72.244 2000 81.883 2007 97.334 2014 108.6821994 73.781 2001 83.753 2008 99.250
4 Sole proprietors report personal, i.e., nonbusiness, income and expense items apart from business income or loss, which are reported on the attached Schedule C, Profit or Loss From Business (or, to a lesser extent, on Schedule C-EZ, Net Profit From Business). Salaries paid to owners are neither deducted as wages paid on Schedule C nor included as wages received on the Form 1040. Similarly, sole proprietors deduct charitable contributions made through the business as personal expenses on Schedule A, Itemized Deductions. However, the owner of a sole proprietorship may choose to deduct any foreign taxes paid as a business expense, unless the owner elects to claim these taxes as a credit against U.S. income tax.5 Business deductions include the home office business deductions. After 1990, home office expenses were calculated separately on Form 8829, Expenses for Business Use of Your Home, and the deductible portion brought forward to the Schedule C. In some cases, these expenses were limited. Starting for 2014, sole proprietors could also use a simplified method to determine these costs by reporting on the Schedule C square footage (up to 300 square feet) used for the home office. The taxpayer then could take $5 per square foot as the expense. Prior to 1990, these expenses were not limited and were included with other expenses, such as depreciation deductions, utilities, and “other” expenses on Schedule C.6 Under section 179 of the Internal Revenue Code, the cost of certain tangible property may be treated as a current expense rather than a capital expenditure subject to depreciation deductions. The Omnibus Budget Reconciliation Act of 1993 (OBRA93) increased the maximum amount of investment that could immediately be deducted on property placed in service after 1992, from $10,000 to $17,500. The increase in the constant dollar depreciation deductions for 1993, and subsequent decline for 1995, may be attributed, in part, to this provision of OBRA93. Following the enactment of this provision, the 179 deduction for all individuals (not just sole proprietors) filing Form 4562, Depreciation and Amortization, increased 32.4 percent to $13.5 billion for 1993.
4
Sole Proprietorship Returns, 2014
Fall 2016Statistics of Income Bulletin
Figure BNonfarm Sole Proprietorship Receipts, Deductions, and Profits, Tax Years 1988–2014[Money amounts are in billions of dollars]
Total business receipts Total business deductions [1] Net income less deficit (profits)
Tax year
(1) (2) (3) (4) (5) (6) (7) (8) (9)
1988 672.0 1,084.3 [3] 545.7 880.5 [3] 126.3 203.8 [3] 1989 692.8 1,076.0 -0.8 560.2 870.0 -1.2 132.7 206.1 1.1 1990 730.6 1,094.1 1.7 589.2 882.4 1.4 141.4 211.8 2.7 1991 712.6 1,032.9 -5.6 571.2 827.9 -6.2 141.5 205.1 -3.1 1992 737.1 1,044.6 1.1 583.1 826.3 -0.2 154.0 218.2 6.4 1993 757.2 1,048.1 0.3 600.8 831.6 0.6 156.5 216.6 -0.8 1994 790.6 1,071.6 2.2 623.8 845.5 1.7 166.8 226.1 4.4 1995 807.4 1,071.9 [4] 638.1 847.2 0.2 169.3 224.7 -0.6 1996 843.2 1,099.5 2.6 666.5 869.0 2.6 176.8 230.5 2.6 1997 870.4 1,115.8 1.5 683.9 876.7 0.9 186.6 239.3 3.8 1998 918.3 1,164.5 4.4 716.2 908.2 3.6 202.3 256.5 7.2 1999 969.3 1,210.8 4.0 761.4 951.1 4.7 207.9 259.7 1.3 2000 1,021.0 1,246.9 3.0 806.4 984.8 3.5 214.7 262.2 1.0 2001 1,016.8 1,214.1 -2.6 799.6 954.8 -3.1 217.4 259.6 -1.0 2002 1,029.7 1,210.9 -0.3 808.9 951.2 -0.4 221.1 260.0 0.2 2003 1,050.2 1,210.9 0.0 820.2 945.7 -0.6 230.3 265.6 2.1 2004 1,139.5 1,278.7 5.6 892.4 1,001.4 5.9 247.6 277.8 4.6 2005 1,222.9 1,329.5 4.0 953.4 1,036.5 3.5 269.9 293.5 5.6 2006 1,278.4 1,348.3 1.4 1,001.1 1,055.9 1.9 278.0 293.2 -0.1 2007 1,324.4 1,360.7 0.9 1,044.3 1,073.0 1.6 280.6 288.2 -1.7 2008 1,317.4 1,327.4 -2.4 1,053.7 1,061.7 -1.1 264.5 266.5 -7.5 2009 1,178.4 1,178.4 -11.2 934.5 934.5 -12.0 244.8 244.8 -8.1 2010 1,195.5 1,181.2 0.2 929.0 917.8 -1.8 267.7 264.5 8.0 2011 1,265.9 1,225.4 3.7 984.2 952.7 3.8 282.6 273.6 3.4 2012 1,301.6 1,237.1 1.0 997.6 948.1 -0.5 304.9 289.8 5.9 2013 1,341.6 1,254.7 1.4 1,040.4 973.0 2.6 302.3 282.7 -2.4 2014 1,393.9 1,282.5 2.2 1,078.5 992.3 2.0 317.1 291.7 3.2 [1] Total business deductions are calculated before subtraction of nonallowable "passive" activity losses and any "passive loss" carryover from prior years. However, these losses (after subtraction) and any carryover are reflected in net income less deficit. Therefore, total business receipts minus total business deductions may not always equal net income less deficit.[2] Current dollars are the value of a dollar at the time it was measured. Constant dollars are based on the overall implicit price deflator for gross domestic product computed and reported by the U.S. Department of Commerce, Bureau of Economic Analysis, in the Survey of Current Business. The deflator represents the annual average of current-weighted prices, based on 2009 = 100.[3] Not calculated.NOTE: Percentages were calculated before rounding.[4] Less than 0.05 percent.SOURCE: IRS, Statistics of Income Division, Sole Proprietorship Returns, October 2016.
Currentdollars
Currentdollars
CurrentdollarsAmountAmount Amount
Constant dollars [2] Constant dollars [2] Constant dollars [2]
Percentagechange
Percentagechange
Percentagechange
increased for inflation, finally rising to $125,000 for 2007.7 For 2008, the section 179 limit was doubled to $250,000, and there was a 2.5-percent increase in constant dollar depreciation. The $250,000 limit remained for 2009 and depreciation dropped 17.3 percent, which was the largest decrease since at least 1988. For 2010, the section 179 limit was again doubled to $500,000, and constant dollar depreciation increased but only by 0.4 per-cent from $34.5 billion to $34.7 billion. The limit was increased
as part of stimulus packages in response to the Great Recession.8 The section 179 limit remained $500,000 for Tax Years 2011 through 2014. For 2011, constant dollar depreciation dropped by 0.7 percent and for 2012 it dropped another 5.6 percent down to $32.5 billion, the lowest level over the 27 years of this study. For 2013 and 2014, constant dollar depreciation rose by 1.7 per-cent both years and is $33.6 billion for 2014, which is almost the same amount as for 1991.
7 Under the Jobs and Growth Tax Relief Reconciliation Act of 2003, the maximum amount of a section 179 deduction increased from $24,000 for 2002 to $100,000 for 2003; $102,000 for 2004; $105,000 for 2005; and $108,000 for 2006. This was further expanded to $125,000 for 2007 by the Small Business and Work Opportunity Tax Act of 2007 (PL 110-28). The Jobs Creation and Worker Assistance Act of 2002 introduced 30-percent bonus depreciation and the Jobs and Growth Tax Relief Reconciliation Act of 2003 increased the bonus percentage to 50 percent, for property placed in service by January 1, 2005. While bonus depreciation was available to sole proprietors, it was generally not as advantageous as immediate expensing and, therefore, likely had less effect on their depreciation deductions.8 For 2008, the Economic Stimulus Act of 2008 increased the maximum expensing deduction under section 179 to $250,000. The American Recovery and Reinvestment Act of 2009 extended that level through 2009. For all individual tax returns that filed Form 4562, Depreciation and Amortization, the section 179 property deducted as an expense increased by 5.1 percent to $49.8 billion for 2008. For 2009, when the maximum 179 deduction remained at $250,000, the amount deducted for all returns decreased by 17.2 percent to $41.3 billion. The amount deducted as section 179 property on returns that had a Schedule C dropped 19.6 percent to $16.2 billion between 2008 and 2009. For 2010, the amount taxpayers were able to deduct as section 179 property increased to $500,000. This was in accordance with the Small Business Jobs and Credit Act of 2010. The amount deducted by returns with a Schedule C increased to $18.8 billion, representing a 15.6-percent increase from 2009. For 2010, the amount deducted on all individual returns increased to $49.6 billion, a 20.3-percent increase from 2009. These numbers do not reflect depreciation solely deducted on the Schedule C, as this could also include depreciation taken on the Schedule E, Supplemental Income and Loss, the Schedule F, Profit or Loss from Farming, and the Form 4835, Farm Rental Income and Expenses.
5
Sole Proprietorship Returns, 2014
Fall 2016Statistics of Income Bulletin
Figure CComponents of Nonfarm Sole Proprietorship Business Deductions, Tax Years 2013 and 2014[Money amounts are in millions of dollars]
Beginning with Tax Year 1992, certain smaller businesses could elect not to itemize depreciation and other business de-ductions by filing the Schedule C-EZ, Net Profit from Business, a simplified version of Schedule C, Profit or Loss from Business. (Schedules C and C-EZ are the sources of nonfarm sole pro-prietorship statistics.) For Tax Year 2014, taxpayers could use Schedule C-EZ if they: had business expenses of $5,000 or less; used the cash accounting method; had no inventories; did not
(1) (2) (3)
Business deductions, total [1] 1,040,388.8 1,078,490.0 3.7 Cost of sales and operations, total 405,646.2 416,840.5 2.8 Inventory, beginning of year 40,341.6 41,257.8 2.3 Cost of labor 32,792.1 33,097.1 0.9 Purchases 259,752.1 256,014.3 -1.4 Materials and supplies 51,766.9 56,559.5 9.3 Other costs 62,627.6 73,156.6 16.8 Inventory, end of year 41,634.1 43,244.8 3.9 Business expenses, total 634,742.5 661,649.5 4.2 Advertising expenses 14,912.6 14,999.7 0.6 Car and truck expenses 89,043.0 92,320.0 3.7 Commissions 14,171.4 14,236.3 0.5 Contract labor 47,646.4 53,539.8 12.4 Depletion 1,047.5 898.4 -14.2 Depreciation [2] 35,378.6 36,568.9 3.4 Employee benefit programs 3,105.4 3,007.7 -3.1 Home office business deductions [2] 9,593.5 9,469.9 -1.3 Depreciation, Form 8829 1,266.3 1,234.8 -2.5 Insurance 17,994.6 18,707.9 4.0 Legal and professional services 11,574.5 12,058.7 4.2 Meals and entertainment deducted 9,511.8 9,539.2 0.3 Mortgage interest 3,426.7 3,190.3 -6.9 Other interest paid on business indebtedness 5,579.3 5,627.4 0.9 Office expenses 12,349.6 12,776.5 3.5 Pension and profit-sharing plans 1,121.9 1,108.5 -1.2 Rent paid on machinery and equipment 9,253.9 10,090.8 9.0 Rent paid on other business property 36,083.4 36,746.5 1.8 Repairs 17,767.5 18,494.6 4.1 Salaries and wages 83,238.9 86,743.0 4.2 Supplies 35,105.2 36,662.7 4.4 Taxes paid 18,850.2 19,358.4 2.7 Travel 14,201.7 15,344.2 8.0 Utilities 31,150.4 31,640.5 1.6 Other business expenses [3] 110,118.4 113,958.2 3.5Schedule C-EZ business expenses 4,579.0 4,578.1 [4]
Percentageincrease20142013Business deductions
[1] Total business deductions are before subtraction of nonallowable "passive" activity losses and any "passive loss" carryover from the prior years. [2] Depreciation claimed on Form 8829, Expenses for Business Use of Your Home, is included in "home office business deductions" and excluded from "depreciation" shown above.[3] Other business expenses includes some expenses from electronically filed Schedule C-EZ returns.[4] Less than 0.05 percent.NOTES: Detail may not add to totals because of rounding. Percentage increases were calculated before rounding.SOURCE: IRS, Statistics of Income Division, Sole Proprietorship Returns, October 2016.
Figure DComponents of Nonfarm Sole Proprietorship Business Expenses as a Percentage of Total Business Expenses, Tax Year 2014
[1] Depreciation claimed on Form 8829, Expenses for Business Use of Your Home, is included in “home office business deductions” and excluded from “depreciation” shown above. See footnote [2] below.[2] Includes depletion; employee benefit programs; legal and professional services; pension and prof-it-sharing plans; meals and entertainment; home office; and other business expenses. “Other busi-ness deductions” also includes all Schedule C-EZ, Net Profit from Business, deductions ($4.6 billion).NOTES: “Total business expenses” equals all business deductions minus cost of sales and opera-tions. Percentages are based on an estimated total business expense of $661.6 billion. Detail may not add to 100 percent because of rounding.SOURCE: IRS, Statistics of Income Division, Sole Proprietorship Returns, October 2016.
23.4
14.0
13.1
8.1
7.1
5.5
5.5
4.8
2.9
2.8
2.8
2.3
2.3
2.2
1.9
1.3
Other business deductions [2]
Car and truck expenses
Salaries and wages
Contract labor
Rent paid on machinery, equipment, and other business property
Supplies
Depreciation [1]
Utilities
Taxes paid
Insurance
Repairs
Travel
Advertising expenses
Commissions
Office expenses
Total interest
0 10 305 2015 25
Business expenses
Percentage of total business expenses
report a loss from the business; had only one business as a sole proprietor; had no employees; were not required to file Form 4562, Depreciation and Amortization, for the business; claimed no deduction for home business expenses; and had no prior-year disallowed passive activity losses from the business. Since tax-payers using Schedule C-EZ did not itemize business deduc-tions, the detailed deductions in Table 2 are slightly understated and do not add to the totals.
For Tax Year 2014, approximately 5.0 million taxpayers filed the Schedule C-EZ, marking a 3.7-percent increase from the number filed for 2013. In the administrative and support sector (the largest sector of filers of this schedule), taxpayers filed 0.8 million Schedule C-EZ returns, or 30.2 percent of the total sole proprietorship returns for that sector (Figure F).9 For 2014, business receipts from Schedule C-EZ filers totaled $39.8 bil-lion, or 2.9 percent of total business receipts reported. Business
9 Based on the NAICS system, the full name of the administrative and support services sector is administrative and support and waste management and remediation services sector. The waste management and remediation services portion makes up a small percentage of the overall numbers reported under this classification, which are detailed in Table 1.
6
Sole Proprietorship Returns, 2014
Fall 2016Statistics of Income Bulletin
Figure ENonfarm Sole Proprietorship Net Income, Deficit, and Depreciation, Tax Years 1988–2014 [Money amounts are in billions of dollars]
Tax year Net income Deficit Depreciation [2] Net income Deficit Depreciation [2] Net income Deficit Depreciation [2]
(1) (2) (3) (4) (5) (6) (7) (8) (9)
1988 145.5 19.2 26.1 234.8 31.0 42.1 [3] [3] [3]
1989 152.4 19.7 24.5 236.7 30.6 38.1 0.8 -1.2 -9.6 1990 161.7 20.2 23.7 242.2 30.3 35.5 2.3 -1.1 -6.7 1991 162.4 20.9 23.1 235.4 30.3 33.5 -2.8 0.1 -5.7 1992 173.5 19.5 23.3 245.9 27.6 33.0 4.5 -8.8 -1.4 1993 177.0 20.5 25.0 245.0 28.4 34.6 -0.4 2.7 4.8 1994 187.8 21.0 26.2 254.5 28.5 35.5 3.9 0.3 2.6 1995 191.7 22.5 26.2 254.5 29.8 34.8 [4] 4.8 -1.9 1996 200.1 23.4 27.4 260.9 30.5 35.7 2.5 2.1 2.4 1997 210.5 23.8 28.6 269.8 30.5 36.7 3.4 0.2 2.8 1998 226.2 23.9 29.1 286.8 30.3 36.9 6.3 -0.7 0.7 1999 233.4 25.5 30.6 291.5 31.8 38.3 1.6 4.8 3.6 2000 245.2 30.5 32.2 299.5 37.3 39.3 2.7 17.2 2.7 2001 250.2 32.8 33.4 298.7 39.2 39.9 -0.3 5.1 1.5 2002 257.3 36.2 36.6 302.6 42.5 43.1 1.3 8.7 8.0 2003 269.1 38.8 41.8 310.3 44.7 48.1 2.5 5.1 11.7 2004 290.5 42.9 42.9 326.0 48.2 48.1 5.1 7.7 [4] 2005 314.8 44.8 39.1 342.2 48.7 42.5 5.0 1.2 -11.7 2006 326.8 48.7 39.0 344.7 51.4 41.1 0.7 5.5 -3.2 2007 335.1 54.5 39.6 344.3 56.0 40.7 -0.1 9.0 -1.0 2008 325.3 60.8 41.4 327.7 61.2 41.8 -4.8 9.2 2.5 2009 308.9 64.1 34.5 308.9 64.1 34.5 -5.7 4.7 -17.3 2010 323.2 55.5 35.1 319.3 54.8 34.7 3.4 -14.4 0.4 2011 337.0 54.3 35.6 326.2 52.6 34.5 2.2 -4.1 -0.7 2012 357.1 52.2 34.2 339.4 49.6 32.5 4.0 -5.7 -5.6 2013 357.4 55.1 35.4 334.3 51.6 33.1 -1.5 4.0 1.7 2014 374.5 57.5 36.6 344.6 52.9 33.6 3.1 2.5 1.7 [1] Current dollars are the value of a dollar at the time it was measured. Constant dollars are based on the overall implicit price deflator for gross domestic product computed and reported by the U.S. Department of Commerce, Bureau of Economic Analysis, in the Survey of Current Business. The deflator represents the annual average of current-weighted prices, based on 2009 = 100.[2] Excludes depreciation claimed on Form 8829, Expenses for Business Use of Your Home.[3] Not calculated.[4] Less than 0.05 percent.NOTE: Percentage changes were calculated before rounding.SOURCE: IRS, Statistics of Income Division, Sole Proprietorship Returns, October 2016.
Current dollars [1] Constant dollars [1] Percentage change in constant dollars [1]
deductions reported on Schedule C-EZ returns accounted for only 0.4 percent of total business deductions for all industries, or $4.6 billion of the total $1,078.5 billion. Despite having the largest concentration of Schedule C-EZ filers, the receipts and deductions from Schedule C-EZ filers in the administrative and support services sector accounted for only 8.2 percent of that sector’s total business receipts and 1.4 percent of that sector’s total business deductions.
Profits and LossesFor 2014, all of the largest industrial sectors reported increased sole proprietorship profits (net income less deficit). Figure B presents total profits for all industries (in both current and constant dollars) since 1988, while Figure G presents the per-centage change in profits by selected industrial sector between 2013 and 2014, and Figure H presents selected industrial sector profits for 2014 as a percentage of total profits.10 Total profits
increased 4.9 percent from $302.3 billion for 2013 to $317.1 billion for 2014. The professional, scientific, and technical ser-vices sector reported the largest percentage of total profits of all nonfarm sole proprietorships, with 24.7 percent ($78.2 billion), and had a 6.5-percent increase in profits for 2014. The second largest sector by profits, health care and social assistance, also reported an increase in profits, rising 2.4 percent to $49.5 bil-lion. The largest percentage increase in profits was realized in the transportation and warehousing sector, which jumped 17.7 percent for a gain of $2.2 billion.
In constant dollars, total profits rose by 3.2 percent for 2014 (Figure B). In general, net income less deficit as a percentage of total business receipts for 1988 through 2014 has increased over time from a low of 18.8 percent for 1988, the exceptions being the periods leading up to the recession in the early 2000s and the Great Recession starting in 2008 (Figure I). Since 2010, net income less deficit as a percentage of total business receipts has
10 Net income minus deficit (loss) before Federal income tax yields profits. Proprietors compute their tax on total “taxable income,” which includes their business profits, plus any other income.

7
Sole Proprietorship Returns, 2014
Fall 2016Statistics of Income Bulletin
With Percentage On Percentage On PercentageSelected industrial sector Total Schedule of Total Schedule of Total Schedule of
C-EZ total C-EZ total C-EZ total(1) (2) (3) (4) (5) (6) (7) (8) (9)
All nonfarm industries 24,631.8 4,995.2 20.3 1,393,884.2 39,791.0 2.9 1,078,490.0 4,578.1 0.4 Construction 2,732.0 469.3 17.2 213,247.0 3,969.9 1.9 177,899.7 431.0 0.2 Wholesale trade (merchant wholesalers) 347.4 38.7 11.1 57,071.7 244.5 0.4 52,212.4 29.0 0.1 Retail trade 2,399.0 320.6 13.4 187,940.6 1,913.0 1.0 177,366.2 278.4 0.2 Transportation and warehousing 1,295.6 156.9 12.1 105,858.1 1,173.9 1.1 91,052.3 175.3 0.2 Finance and insurance 626.1 65.5 10.5 81,021.2 664.6 0.8 60,696.6 65.5 0.1 Real estate and rental and leasing 1,144.6 91.5 8.0 68,090.7 1,205.0 1.8 43,771.8 126.9 0.3 Professional, scientific, and technical services 3,329.4 563.2 16.9 180,908.5 6,908.5 3.8 102,842.7 605.3 0.6 Administrative and support and waste management and remediation services 2,639.8 798.4 30.2 74,734.4 6,152.6 8.2 52,391.6 738.4 1.4Health care and social assistance 2,145.7 583.9 27.2 120,066.0 5,366.8 4.5 70,587.4 498.7 0.7 Arts, entertainment, and recreation 1,545.6 328.5 21.3 40,016.7 1,540.8 3.9 30,302.2 303.5 1.0 Other services 3,269.8 750.2 22.9 103,484.9 6,155.6 5.9 76,089.4 785.4 1.0 All other sectors 3,156.9 828.5 26.2 161,444.3 4,495.7 2.8 143,277.7 540.8 0.4
Number of returns Total business receipts Total business deductions [1]
[1] Total business deductions are calculated before subtraction of nonallowable "passive" activity losses and any "passive loss" carryover from prior years.NOTES: Certain smaller sole proprietorships could elect not to itemize business expenses by filing Schedule C-EZ, Net Profit from Business. See the text of this article for a full list of the requirements to be eligible to file Schedule C-EZ. Detail may not add to totals because of rounding. Percentages were calculated before rounding.SOURCE: IRS, Statistics of Income Division, Sole Proprietorship Returns, October 2016.
Figure FAll Nonfarm Sole Proprietorship Returns and Those with Schedule C-EZ, by Selected Industrial Sector, Tax Year 2014[Number of returns is in thousands—money amounts are in millions of dollars]
Figure GNonfarm Sole Proprietorship Profits, by Selected Industrial Sector, Tax Years 2013 and 2014[Money amounts are in billions of dollars]
Net income less deficit (profits)Selected industrial sector
(1) (2) (3)
All nonfarm industries 302.3 317.1 4.9 Construction 33.9 35.6 5.0 Specialty trade contractors 26.6 27.3 2.6 Wholesale trade (merchant wholesalers) 4.6 4.9 5.6 Retail trade 10.6 10.7 1.4 Transportation and warehousing 12.7 14.9 17.7 Finance and insurance 19.4 20.4 5.2 Real estate and rental and leasing 23.9 24.5 2.5 Real estate 23.8 24.4 2.9 Professional, scientific, and technical services 73.5 78.2 6.5 Administrative and support and waste management and remediation services 22.2 22.4 1.0 Health care and social assistance 48.4 49.5 2.4 Arts, entertainment, and recreation 9.3 10.0 7.8 Performing arts, spectator sports, and related industries 8.9 9.4 6.0 Other services 25.5 27.5 7.6 Personal and laundry services 18.1 19.3 6.6 All other sectors 18.5 18.5 [1]
2013 2014
NOTES: Detail may not add to totals because of rounding. Percentage changes were calculated before rounding.[1] Less than 0.05 percent.SOURCE: IRS, Statistics of Income Division, Sole Proprietorship Returns, October 2016.
Percentagechange
Figure HNonfarm Sole Proprietorships: Selected Industrial Sector Profits as a Percentage of Total Profits, Tax Year 2014
NOTES: Percentages are based on estimated total profits of $317.1 billion.Detail may not add to 100 percent because of rounding.Profits is a designation for “net income less deficit,” shown elsewhere in this article. SOURCE: IRS, Statistics of Income Division, Sole Proprietorship Returns, October 2016.
24.7
15.6
11.2
8.7
7.7
7.1
6.4
5.8
4.7
3.4
3.2
1.5
Professional, scientific, and technical services
Health care and social assistance
Construction
Other services
Real estate and rental and leasing
Administrative and support and wastemanagement and remediation services
Finance and insurance
All other sectors
Transportation and warehousing
Retail trade
Arts, entertainment, and recreation
Wholesale trade (merchant wholesalers)
Percentage of total profits
Selected industrial sector
0 10 305 2015 25

8
Sole Proprietorship Returns, 2014
Fall 2016Statistics of Income Bulletin
Figure INonfarm Sole Proprietorship Net Income Less Deficit (Profits) as a Percentage of Total Business Receipts, Tax Years 1988–2014
18.8
19.2
19.4
19.9
20.9
20.7
21.1
21.0 21.0
21.4
22.0
21.5
21.0
21.421.5
21.9
21.7
22.1
21.7
21.2
20.1
20.8
22.4
22.3
23.4
22.5
22.7
18
19
20
21
22
23
24
25
1988 1989 1990 1991 1992 1993 1994 1995 1996 1997 1998 1999 2000 2001 2002 2003 2004 2005 2006 2007 2008 2009 2010 2011 2012 2013 2014
Percentage
Tax yearSOURCE: IRS, Statistics of Income Division, Sole Proprietorship Returns, October 2016.
been between 22.4 and 23.4 percent, and for 2014 stands at 22.7 percent. Looking at net income and deficit separately, for 2014, net income (in constant dollars) increased by 3.1 percent, and deficit (in constant dollars) increased by 2.5 percent (Figure E).
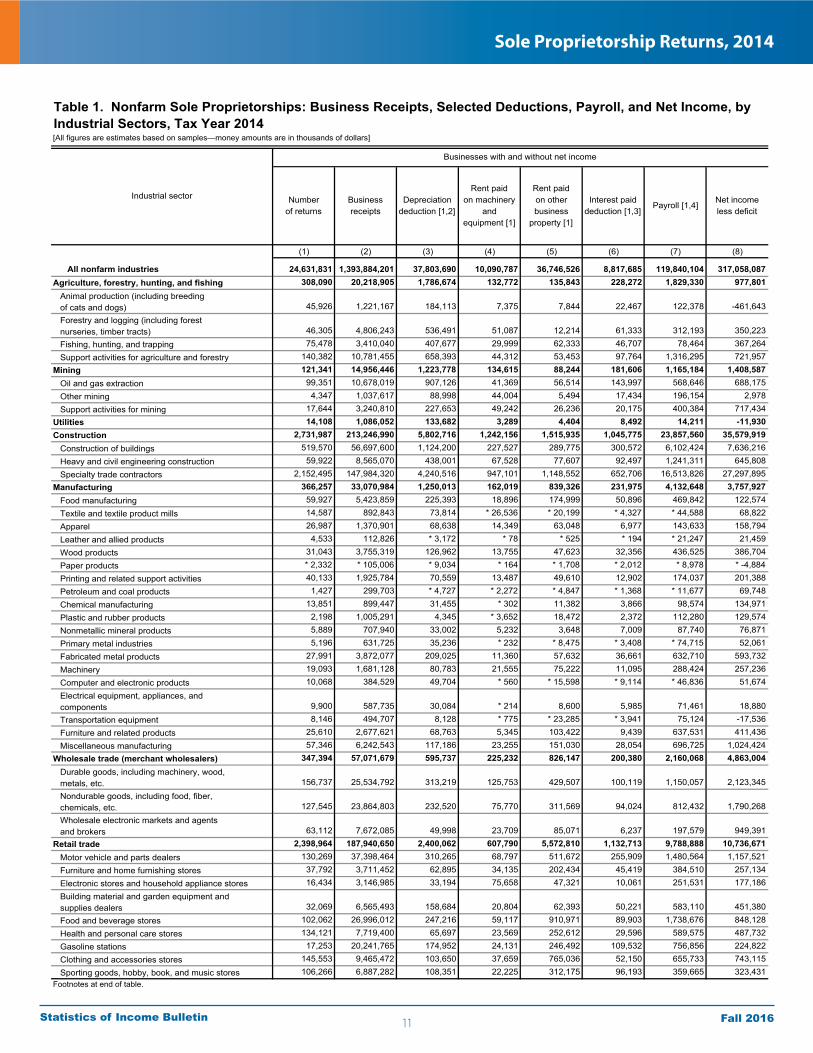
Limited Liability CompaniesTax Year 2001 was the first year for which data became avail-able on the number of limited liability companies (LLCs) among nonfarm sole proprietorship returns. LLC entities have limited liability (like corporations), but they may be taxed as sole pro-prietorships (for which income and expenses flow through to the owner to be taxed), if they are owned by a single individ-ual. For 2001, there were 126,437 sole proprietorship returns that indicated status as an LLC or just 0.7 percent of total sole proprietorship returns (Figure K). In contrast, for Tax Year 2014, there were 1,619,099 such sole proprietorships, which ac-counted for 6.6 percent of the total nonfarm sole proprietorship returns, nearly a 13-fold increase since 2001. The LLC business receipts share of the total nonfarm sole proprietorship business receipts has also risen during this period from approximately 2.3 percent in 2001 to 24.5 percent for 2014 (Figure L). Similarly, the portion of total net income (less deficit) of all nonfarm sole proprietorships attributable to LLCs increased from 1.0 percent for 2001 to 13.7 percent for 2014.
SummaryProfits for the 24.6 million returns with sole proprietorship ac-tivity for Tax Year 2014 increased by 4.9 percent from 2013, to
a level of $317.1 billion. In constant dollars, total nonfarm sole proprietorship profits for 2014 increased 3.2 percent after de-creasing 2.4 percent between 2012 and 2013. The professional, scientific, and technical services sector had the largest profits of any sector, at $78.2 billion, representing 24.7 percent of total sole proprietorship profits, followed by the health care and social assistance sector, at $49.5 billion or 15.6 percent of total profits. The largest percentage increases in profits were by trans-portation and warehousing (17.7 percent) and arts, entertain-ment, and recreation (7.8 percent). The professional, scientific, and technical services sector experienced the largest increase in dollar value for profits, gaining $4.8 billion. For all sole propri-etorships, business receipts increased 3.9 percent, and the larg-est industrial sector, based on business receipts, was the con-struction sector, accounting for 15.3 percent. Transportation and warehousing had the largest increase in receipts at 10.7 percent. The retail trade sector was the only sector that experienced a downturn in receipts from 2013 to 2014, decreasing $4.0 billion. For all sole proprietorships, deductions increased 3.7 percent, with the transportation and warehousing sector having the larg-est percentage increase in deductions at 9.7 percent.
Data Sources and LimitationsThe 2014 sole proprietorship estimates are based on a stratified probability sample of unaudited individual income tax returns, Form 1040 (including electronically filed returns), processed by the Internal Revenue Service during Calendar Year 2015. Returns in the sample were stratified based on: (1) the presence
9
Sole Proprietorship Returns, 2014
Fall 2016Statistics of Income Bulletin
or absence of Schedule C, Profit or Loss From Business (Sole Proprietorship), or Schedule C-EZ, Net Profit From Business, and Schedule F, Farm Income and Expenses; (2) the larger of positive income or negative income (i.e., “adjusted gross income” before statutory adjustments); and (3) tax year. The re-turns were selected at rates that ranged from 0.1 percent to 100 percent. The 2014 nonfarm sole proprietorship data are based on a sample of 91,665 returns and a population of 25,010,078 re-turns.11 The corresponding data for 2013 were based on a sample of 88,237 returns and a population of 24,398,535 returns.
Since the data presented in this article are estimates based on a sample of returns filed, they are subject to sampling error. To properly use the statistical data estimates provided, the magnitude of the potential sampling error must be known; co-efficients of variation (CVs) are used to measure that magni-tude. Estimated coefficients of variation have been calculated for total business receipts, total business deductions, deprecia-tion, net income, and deficit, and are in percentages by selected
Figure JNonfarm Sole Proprietorships: Selected Industrial Sector Receipts as a Percentage of Total Business Receipts,Tax Year 2014
NOTES: Percentages are based on estimated total business receipts of $1.4 trillion. Detail may not add to 100 percent because of rounding.SOURCE: IRS, Statistics of Income Division, Sole Proprietorship Returns, October 2016.
15.3
13.5
13.0
11.6
8.6
7.6
7.4
5.8
5.4
4.9
4.1
2.9
0 5 10 15 20
Construction
Retail trade
Professional, scientific, and technical services
All other industries
Health care and social assistance
Transportation and warehousing
Other services
Finance and insurance
Administrative and support and wastemanagement and remediation services
Real estate and rental and leasing
Wholesale trade (merchant wholesalers)
Arts, entertainment, and recreation
Percentage of total business receipts
Selected industrial sector
industrial sector (Figure M). Generally, the smaller the coeffi-cient of variation, the more reliable the estimate is judged to be. The SOI Sampling Methodology and Data Limitations sec-tion of the SOI Bulletin, available at www.irs.gov/pub/irs-soi/ sampling.pdf, discusses the reliability of estimates based on samples and the use of coefficients of variation for evaluating the precision of estimates based on samples.
Figure KNumber of Nonfarm Sole Proprietorships Registered as Limited Liability Companies (LLCs), Tax Years 2001–2014
SOURCE: IRS, Statistics of Income Division, Sole Proprietorship Returns, October 2016.
11 The difference between the number of returns in the population and the total number of returns in Tables 1 and 2 is mainly due to returns in which Schedule C income was moved to other income or wages to avoid double counting of taxpayers for Gross Domestic Product calculations. In addition, data from amended and tentative returns are not reflected in these statistics.
Adrian Dungan is an economist with the Individual Return Analysis Section. This article was prepared under the direction of Michael Weber, Chief, with technical assistance provided by Michael Strudler, Chief, Individual Research Section.
126,437
145,839
220,615
309,665
455,734
606,889
746,885
842,819
991,809
1,059,910
1,125,132
1,324,196
1,474,592
1,619,099
0 500,000 1,000,000 1,500,000
2001
2002
2003
2004
2005
2006
2007
2008
2009
2010
2011
2012
2013
2014
Number of returns filed by nonfarm sole proprietorships registered as LLCs
Tax year

10
Sole Proprietorship Returns, 2014
Fall 2016Statistics of Income Bulletin
Figure LNumber of Returns, Business Receipts, and Profits for All Nonfarm Sole Proprietorships and Those Registered as Limited Liability Companies (LLCs), Tax Years 2001–2014[Money amounts are in millions of dollars]
Figure MNonfarm Sole Proprietorships: Coefficients of Variation for Selected Items, by Selected Industrial Sector, Tax Year 2014[Coefficients of variation are in percentages]
(1) (2) (3) (4) (5) (6) (7) (8) (9)
2001 18,338,190 126,437 0.7 1,016,834.7 23,357.8 2.30 217,385.1 2,259.1 1.04 2002 18,925,517 145,839 0.8 1,029,691.8 39,239.7 3.81 221,113.3 3,378.8 1.53 2003 19,710,079 220,615 1.1 1,050,202.4 55,626.8 5.30 230,308.1 3,847.6 1.67 2004 20,590,691 309,665 1.5 1,139,523.8 82,850.7 7.27 247,567.2 6,743.7 2.72 2005 21,467,566 455,734 2.1 1,222,880.2 119,603.0 9.78 269,920.0 10,902.8 4.04 2006 22,074,953 606,889 2.7 1,278,359.8 151,746.2 11.87 278,032.6 14,270.5 5.13 2007 23,122,698 746,885 3.2 1,324,403.1 185,837.7 14.03 280,557.0 16,235.2 5.79 2008 22,614,483 842,819 3.7 1,317,443.0 205,646.0 15.61 264,508.4 18,215.2 6.89 2009 22,659,976 991,809 4.4 1,178,437.1 205,194.2 17.41 244,821.8 18,522.8 7.57 2010 23,003,656 1,059,910 4.6 1,195,538.6 220,116.9 18.41 267,699.7 23,915.5 8.93 2011 23,426,940 1,125,132 4.8 1,265,939.2 244,024.9 19.28 282,649.9 27,093.8 9.59 2012 23,553,850 1,324,196 5.6 1,301,569.7 291,350.5 22.38 304,895.9 35,841.0 11.76 2013 24,074,684 1,474,592 6.1 1,341,571.1 316,224.9 23.57 302,269.6 37,151.5 12.29 2014 24,631,831 1,619,099 6.6 1,393,884.2 342,093.6 24.54 317,058.1 43,427.4 13.70
SOURCE: IRS, Statistics of Income Division, Sole Proprietorship Returns, October 2016.
Taxyear
LLCs as a percentage of all
nonfarm sole proprietorships
All nonfarmsole
proprietorships
Nonfarm soleproprietorships
registeredas LLCs
LLCs as a percentage of all
nonfarm sole proprietorships
Net income less deficit
All nonfarmsole
proprietorships
Nonfarm soleproprietorships
registeredas LLCs
LLCs as a percentage of all
nonfarm sole proprietorships
All nonfarmsole
proprietorships
Number of returns Total business receipts
Nonfarm soleproprietorships
registeredas LLCs
(1) (2) (3) (4) (5) All nonfarm industries 0.55 0.62 1.50 0.72 1.41 Construction (236100-238990) 2.11 2.22 4.53 2.46 5.74 Specialty trade contractors (238110-238990) 2.52 2.67 5.38 2.80 6.99 Wholesale trade (423100-425120) 4.16 4.23 8.05 6.75 8.83 Retail trade (441110-454390) 2.18 2.18 4.65 3.32 4.09Transportation and warehousing (481000-493100) 2.59 2.61 4.69 3.46 6.98 Finance and insurance (522100-524290) 2.33 2.31 7.46 3.70 4.27 Real estate and rental and leasing (531100-532400) 2.77 3.06 5.84 3.40 5.15 Real estate (531100-531390) 2.89 3.26 7.84 3.45 5.65Professional, scientific, and technical services (541100-541990) 1.70 2.03 4.74 1.94 4.42 Administrative and support and waste management and remediation services (561110-562000) 2.87 3.38 6.71 2.85 6.17 Health care and social assistance (561110-562000) 1.88 2.05 4.18 2.24 6.52 Arts, entertainment, and recreation (711100-713900) 3.30 3.50 6.87 3.93 4.92 Performing arts, spectator sports, and related industries (711100-711510) 3.75 4.07 9.80 4.23 5.84 Other services (811110-812990) 2.60 2.96 6.24 2.52 5.56 Personal and laundry services (812111-812990) 3.07 3.58 8.36 3.00 7.07 All other industries 2.04 2.08 3.38 2.77 3.25
Coefficients of variation
Industrial sector
[1] Excludes depreciation claimed on Form 8829, Expenses for Business Use of Your Home.SOURCE: IRS, Statistics of Income Division, Sole Proprietorship Returns, October 2016.
Total businessreceipts
Total businessdeductions Depreciation [1] Net income Deficit
11
Sole Proprietorship Returns, 2014
Fall 2016Statistics of Income Bulletin
(1) (2) (3) (4) (5) (6) (7) (8)
All nonfarm industries 24,631,831 1,393,884,201 37,803,690 10,090,787 36,746,526 8,817,685 119,840,104 317,058,087Agriculture, forestry, hunting, and fishing 308,090 20,218,905 1,786,674 132,772 135,843 228,272 1,829,330 977,801 Animal production (including breeding of cats and dogs) 45,926 1,221,167 184,113 7,375 7,844 22,467 122,378 -461,643
Forestry and logging (including forest nurseries, timber tracts) 46,305 4,806,243 536,491 51,087 12,214 61,333 312,193 350,223
Fishing, hunting, and trapping 75,478 3,410,040 407,677 29,999 62,333 46,707 78,464 367,264
Support activities for agriculture and forestry 140,382 10,781,455 658,393 44,312 53,453 97,764 1,316,295 721,957Mining 121,341 14,956,446 1,223,778 134,615 88,244 181,606 1,165,184 1,408,587 Oil and gas extraction 99,351 10,678,019 907,126 41,369 56,514 143,997 568,646 688,175
Other mining 4,347 1,037,617 88,998 44,004 5,494 17,434 196,154 2,978
Support activities for mining 17,644 3,240,810 227,653 49,242 26,236 20,175 400,384 717,434Utilities 14,108 1,086,052 133,682 3,289 4,404 8,492 14,211 -11,930Construction 2,731,987 213,246,990 5,802,716 1,242,156 1,515,935 1,045,775 23,857,560 35,579,919 Construction of buildings 519,570 56,697,600 1,124,200 227,527 289,775 300,572 6,102,424 7,636,216
Heavy and civil engineering construction 59,922 8,565,070 438,001 67,528 77,607 92,497 1,241,311 645,808
Specialty trade contractors 2,152,495 147,984,320 4,240,516 947,101 1,148,552 652,706 16,513,826 27,297,895Manufacturing 366,257 33,070,984 1,250,013 162,019 839,326 231,975 4,132,648 3,757,927 Food manufacturing 59,927 5,423,859 225,393 18,896 174,999 50,896 469,842 122,574
Textile and textile product mills 14,587 892,843 73,814 * 26,536 * 20,199 * 4,327 * 44,588 68,822
Apparel 26,987 1,370,901 68,638 14,349 63,048 6,977 143,633 158,794
Leather and allied products 4,533 112,826 * 3,172 * 78 * 525 * 194 * 21,247 21,459
Wood products 31,043 3,755,319 126,962 13,755 47,623 32,356 436,525 386,704
Paper products * 2,332 * 105,006 * 9,034 * 164 * 1,708 * 2,012 * 8,978 * -4,884
Printing and related support activities 40,133 1,925,784 70,559 13,487 49,610 12,902 174,037 201,388
Petroleum and coal products 1,427 299,703 * 4,727 * 2,272 * 4,847 * 1,368 * 11,677 69,748
Chemical manufacturing 13,851 899,447 31,455 * 302 11,382 3,866 98,574 134,971
Plastic and rubber products 2,198 1,005,291 4,345 * 3,652 18,472 2,372 112,280 129,574
Nonmetallic mineral products 5,889 707,940 33,002 5,232 3,648 7,009 87,740 76,871
Primary metal industries 5,196 631,725 35,236 * 232 * 8,475 * 3,408 * 74,715 52,061
Fabricated metal products 27,991 3,872,077 209,025 11,360 57,632 36,661 632,710 593,732
Machinery 19,093 1,681,128 80,783 21,555 75,222 11,095 288,424 257,236
Computer and electronic products 10,068 384,529 49,704 * 560 * 15,598 * 9,114 * 46,836 51,674
Electrical equipment, appliances, and components 9,900 587,735 30,084 * 214 8,600 5,985 71,461 18,880
Transportation equipment 8,146 494,707 8,128 * 775 * 23,285 * 3,941 75,124 -17,536
Furniture and related products 25,610 2,677,621 68,763 5,345 103,422 9,439 637,531 411,436
Miscellaneous manufacturing 57,346 6,242,543 117,186 23,255 151,030 28,054 696,725 1,024,424Wholesale trade (merchant wholesalers) 347,394 57,071,679 595,737 225,232 826,147 200,380 2,160,068 4,863,004 Durable goods, including machinery, wood, metals, etc. 156,737 25,534,792 313,219 125,753 429,507 100,119 1,150,057 2,123,345
Nondurable goods, including food, fiber, chemicals, etc. 127,545 23,864,803 232,520 75,770 311,569 94,024 812,432 1,790,268
Wholesale electronic markets and agents and brokers 63,112 7,672,085 49,998 23,709 85,071 6,237 197,579 949,391Retail trade 2,398,964 187,940,650 2,400,062 607,790 5,572,810 1,132,713 9,788,888 10,736,671 Motor vehicle and parts dealers 130,269 37,398,464 310,265 68,797 511,672 255,909 1,480,564 1,157,521
Furniture and home furnishing stores 37,792 3,711,452 62,895 34,135 202,434 45,419 384,510 257,134
Electronic stores and household appliance stores 16,434 3,146,985 33,194 75,658 47,321 10,061 251,531 177,186
Building material and garden equipment and supplies dealers 32,069 6,565,493 158,684 20,804 62,393 50,221 583,110 451,380
Food and beverage stores 102,062 26,996,012 247,216 59,117 910,971 89,903 1,738,676 848,128
Health and personal care stores 134,121 7,719,400 65,697 23,569 252,612 29,596 589,575 487,732
Gasoline stations 17,253 20,241,765 174,952 24,131 246,492 109,532 756,856 224,822
Clothing and accessories stores 145,553 9,465,472 103,650 37,659 765,036 52,150 655,733 743,115
Sporting goods, hobby, book, and music stores 106,266 6,887,282 108,351 22,225 312,175 96,193 359,665 323,431Footnotes at end of table.
Businesses with and without net income
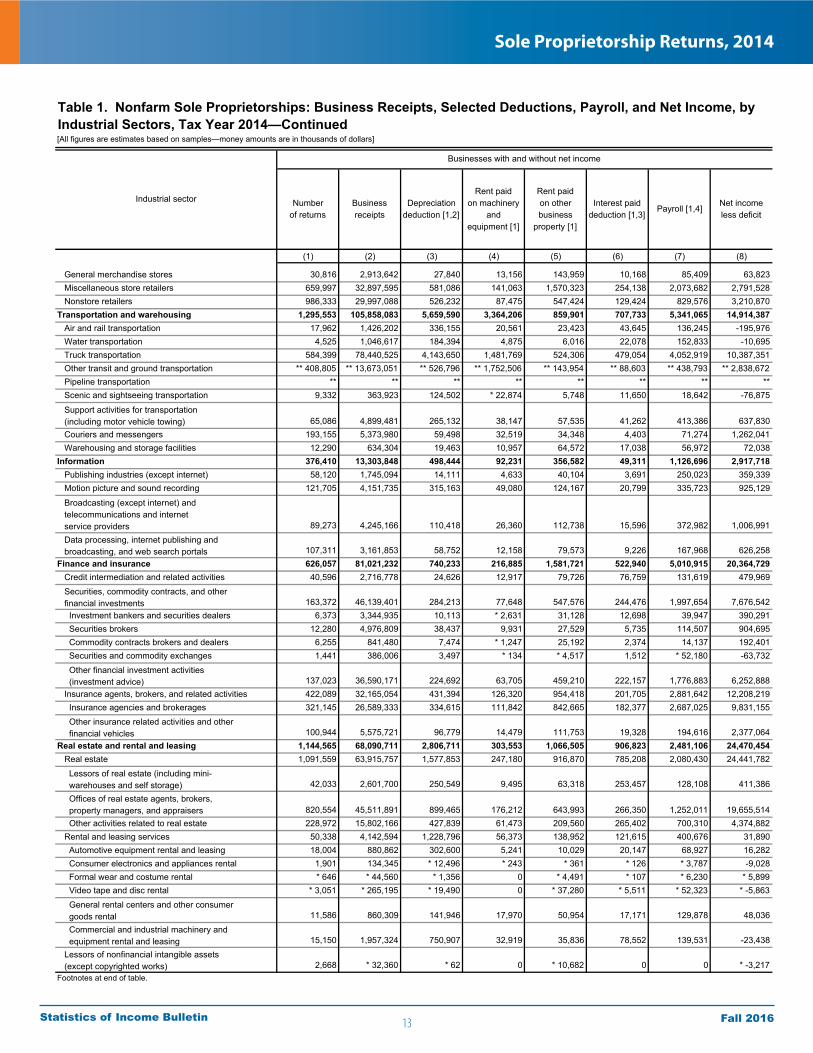
Table 1. Nonfarm Sole Proprietorships: Business Receipts, Selected Deductions, Payroll, and Net Income, by Industrial Sectors, Tax Year 2014
Industrial sector Numberof returns
Businessreceipts
Depreciationdeduction [1,2]
Rent paidon machinery
andequipment [1]
Rent paidon otherbusiness
property [1]
[All figures are estimates based on samples—money amounts are in thousands of dollars]
Interest paiddeduction [1,3]
Payroll [1,4]Net incomeless deficit

12
Sole Proprietorship Returns, 2014
Fall 2016Statistics of Income Bulletin
(9) (10) (11) (12) (13) (14) (15) (16)
All nonfarm industries 18,293,930 1,195,179,213 24,872,869 7,779,037 28,010,235 5,570,671 96,170,053 374,540,376Agriculture, forestry, hunting, and fishing 195,119 16,629,192 947,277 62,645 94,688 136,118 1,461,055 2,808,065 Animal production (including breeding of cats and dogs) 14,017 825,448 63,990 * 99 * 1,673 * 4,188 95,383 193,853
Forestry and logging (including forest nurseries, timber tracts) 31,452 3,779,077 343,221 11,784 10,979 40,980 196,807 509,309
Fishing, hunting, and trapping 47,171 2,856,918 207,703 17,579 41,971 31,889 54,804 686,807
Support activities for agriculture and forestry 102,479 9,167,748 332,364 33,183 40,065 59,061 1,114,061 1,418,097Mining 85,976 10,957,405 643,212 80,189 37,568 88,930 760,612 2,984,975 Oil and gas extraction 73,272 7,566,285 433,219 18,197 14,846 70,245 384,385 2,084,389
Other mining 897 616,170 40,660 24,836 * 1,844 2,896 112,611 71,771
Support activities for mining 11,808 2,774,950 169,333 37,156 20,877 15,788 263,616 828,815Utilities 11,282 525,701 18,602 * 3,282 * 1,722 4,333 * 8,964 176,604Construction 2,247,450 190,185,731 4,739,965 995,978 1,234,571 745,332 20,841,856 40,472,496 Construction of buildings 424,912 49,411,258 943,115 186,006 229,397 201,109 5,195,054 8,780,753
Heavy and civil engineering construction 43,881 6,704,801 330,216 34,823 62,861 56,570 936,913 1,064,855
Specialty trade contractors 1,778,657 134,069,672 3,466,634 775,149 942,313 487,653 14,709,889 30,626,888Manufacturing 222,004 27,567,554 824,107 105,674 600,121 134,102 3,094,225 5,443,614 Food manufacturing 36,537 4,357,837 151,974 6,189 122,800 21,818 246,453 507,275
Textile and textile product mills 7,730 628,408 23,525 * 13,744 * 18,237 * 1,539 * 43,127 139,173
Apparel 16,034 1,074,778 45,015 * 11,349 52,743 5,972 113,292 305,459
Leather and allied products * 2,074 * 76,454 * 75 * 33 * 321 * 94 * 6,318 * 40,868
Wood products 15,688 3,284,815 85,748 13,314 34,895 17,211 316,012 526,093
Paper products * 1,021 * 3,849 * 106 0 0 * 13 * 197 * 895
Printing and related support activities 21,889 1,380,357 32,109 * 13,474 36,790 2,512 106,621 350,679
Petroleum and coal products 1,322 274,700 * 4,620 * 2,271 * 3,547 * 450 * 9,664 72,926
Chemical manufacturing 7,910 755,616 24,496 * 218 4,098 1,830 71,928 201,695
Plastic and rubber products 2,141 862,757 * 2,358 * 3,090 * 11,583 * 1,743 * 84,709 134,674
Nonmetallic mineral products 2,876 585,734 27,717 * 3,505 * 3,384 * 4,829 60,434 95,239
Primary metal industries 3,356 560,444 * 17,473 * 232 * 8,224 * 647 * 64,617 81,626
Fabricated metal products 18,991 3,582,404 142,932 10,141 36,830 30,969 576,785 675,248
Machinery 16,027 1,430,071 62,447 10,782 60,347 7,162 227,909 339,806
Computer and electronic products 6,207 339,625 * 42,453 * 447 * 9,050 * 2,600 * 40,908 84,782
Electrical equipment, appliances, and components 6,363 527,314 * 27,632 * 207 * 7,704 * 4,980 * 65,745 84,495
Transportation equipment 4,846 336,164 * 4,552 * 759 * 17,630 * 3,697 * 41,205 29,718
Furniture and related products 16,648 2,094,886 * 37,341 * 5,232 * 55,447 * 4,090 * 454,084 498,019
Miscellaneous manufacturing 34,345 5,411,342 91,535 * 10,685 116,491 21,949 564,217 1,274,942Wholesale trade (merchant wholesalers) 227,506 49,556,101 343,949 186,113 625,256 151,277 1,670,415 6,335,928 Durable goods, including machinery, wood, metals, etc. 92,859 21,393,945 134,598 107,081 330,848 63,241 824,608 2,843,957
Nondurable goods, including food, fiber, chemicals, etc. 87,345 21,390,720 168,026 55,589 241,605 82,858 673,733 2,199,633
Wholesale electronic markets and agents and brokers 47,302 6,771,436 41,325 23,443 52,803 5,178 172,074 1,292,338Retail trade 1,309,387 149,849,784 1,332,095 399,773 3,615,191 678,222 7,144,442 18,868,472 Motor vehicle and parts dealers 81,910 30,811,166 221,319 56,202 324,469 177,813 1,190,112 1,873,279
Furniture and home furnishing stores 18,265 2,401,080 25,826 * 1,034 80,332 31,169 257,817 490,916
Electronic stores and household appliance stores 11,435 2,666,461 32,173 51,878 41,082 7,973 181,718 240,287
Building material and garden equipment and supplies dealers 21,003 5,292,112 98,469 19,724 48,051 36,684 470,340 608,626
Food and beverage stores 65,458 21,212,844 138,972 34,710 672,943 60,691 1,205,590 1,434,498
Health and personal care stores 62,237 6,433,873 38,382 15,054 148,070 8,747 445,273 955,083
Gasoline stations 9,648 15,134,491 101,349 17,529 144,074 61,062 544,277 393,295
Clothing and accessories stores 82,966 7,575,784 48,680 27,204 546,192 23,625 441,261 1,298,802
Sporting goods, hobby, book, and music stores 56,746 5,333,689 59,290 10,650 216,675 65,979 266,187 687,080Footnotes at end of table.
Payroll [1,4]
Businesses with net income
Table 1. Nonfarm Sole Proprietorships: Business Receipts, Selected Deductions, Payroll, and Net Income, by Industrial Sectors, Tax Year 2014—Continued[All figures are estimates based on samples—money amounts are in thousands of dollars]
Net incomeBusinessreceipts
Depreciationdeduction [1,2]
Rent paidon machinery
andequipment [1]
Rent paidon otherbusiness
property [1]
Interest paiddeduction [1,3]
Industrial sectorNumber
of returns
13
Sole Proprietorship Returns, 2014
Fall 2016Statistics of Income Bulletin
(1) (2) (3) (4) (5) (6) (7) (8)
General merchandise stores 30,816 2,913,642 27,840 13,156 143,959 10,168 85,409 63,823 Miscellaneous store retailers 659,997 32,897,595 581,086 141,063 1,570,323 254,138 2,073,682 2,791,528 Nonstore retailers 986,333 29,997,088 526,232 87,475 547,424 129,424 829,576 3,210,870Transportation and warehousing 1,295,553 105,858,083 5,659,590 3,364,206 859,901 707,733 5,341,065 14,914,387 Air and rail transportation 17,962 1,426,202 336,155 20,561 23,423 43,645 136,245 -195,976 Water transportation 4,525 1,046,617 184,394 4,875 6,016 22,078 152,833 -10,695 Truck transportation 584,399 78,440,525 4,143,650 1,481,769 524,306 479,054 4,052,919 10,387,351 Other transit and ground transportation ** 408,805 ** 13,673,051 ** 526,796 ** 1,752,506 ** 143,954 ** 88,603 ** 438,793 ** 2,838,672 Pipeline transportation ** ** ** ** ** ** ** ** Scenic and sightseeing transportation 9,332 363,923 124,502 * 22,874 5,748 11,650 18,642 -76,875
Support activities for transportation (including motor vehicle towing) 65,086 4,899,481 265,132 38,147 57,535 41,262 413,386 637,830 Couriers and messengers 193,155 5,373,980 59,498 32,519 34,348 4,403 71,274 1,262,041 Warehousing and storage facilities 12,290 634,304 19,463 10,957 64,572 17,038 56,972 72,038Information 376,410 13,303,848 498,444 92,231 356,582 49,311 1,126,696 2,917,718 Publishing industries (except internet) 58,120 1,745,094 14,111 4,633 40,104 3,691 250,023 359,339 Motion picture and sound recording 121,705 4,151,735 315,163 49,080 124,167 20,799 335,723 925,129
Broadcasting (except internet) and telecommunications and internet service providers 89,273 4,245,166 110,418 26,360 112,738 15,596 372,982 1,006,991
Data processing, internet publishing and broadcasting, and web search portals 107,311 3,161,853 58,752 12,158 79,573 9,226 167,968 626,258Finance and insurance 626,057 81,021,232 740,233 216,885 1,581,721 522,940 5,010,915 20,364,729 Credit intermediation and related activities 40,596 2,716,778 24,626 12,917 79,726 76,759 131,619 479,969
Securities, commodity contracts, and other financial investments 163,372 46,139,401 284,213 77,648 547,576 244,476 1,997,654 7,676,542 Investment bankers and securities dealers 6,373 3,344,935 10,113 * 2,631 31,128 12,698 39,947 390,291 Securities brokers 12,280 4,976,809 38,437 9,931 27,529 5,735 114,507 904,695 Commodity contracts brokers and dealers 6,255 841,480 7,474 * 1,247 25,192 2,374 14,137 192,401 Securities and commodity exchanges 1,441 386,006 3,497 * 134 * 4,517 1,512 * 52,180 -63,732
Other financial investment activities (investment advice) 137,023 36,590,171 224,692 63,705 459,210 222,157 1,776,883 6,252,888 Insurance agents, brokers, and related activities 422,089 32,165,054 431,394 126,320 954,418 201,705 2,881,642 12,208,219 Insurance agencies and brokerages 321,145 26,589,333 334,615 111,842 842,665 182,377 2,687,025 9,831,155
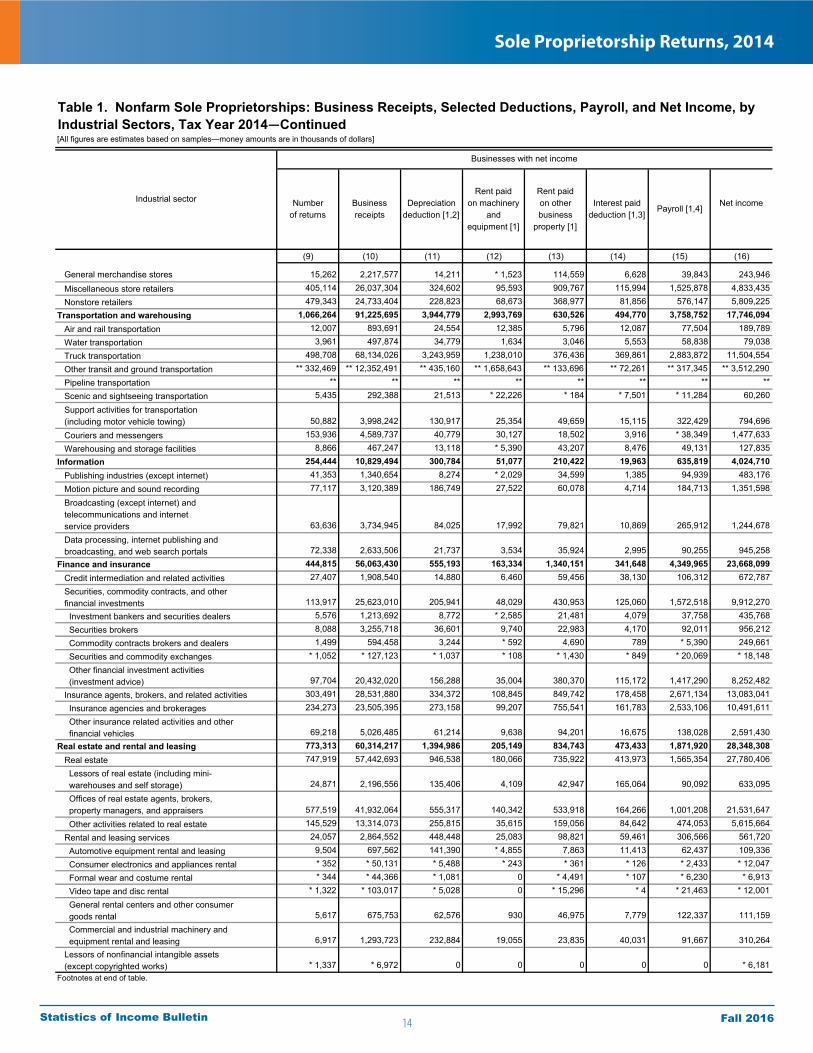
Other insurance related activities and other financial vehicles 100,944 5,575,721 96,779 14,479 111,753 19,328 194,616 2,377,064Real estate and rental and leasing 1,144,565 68,090,711 2,806,711 303,553 1,066,505 906,823 2,481,106 24,470,454 Real estate 1,091,559 63,915,757 1,577,853 247,180 916,870 785,208 2,080,430 24,441,782
Lessors of real estate (including mini- warehouses and self storage) 42,033 2,601,700 250,549 9,495 63,318 253,457 128,108 411,386
Offices of real estate agents, brokers, property managers, and appraisers 820,554 45,511,891 899,465 176,212 643,993 266,350 1,252,011 19,655,514 Other activities related to real estate 228,972 15,802,166 427,839 61,473 209,560 265,402 700,310 4,374,882 Rental and leasing services 50,338 4,142,594 1,228,796 56,373 138,952 121,615 400,676 31,890 Automotive equipment rental and leasing 18,004 880,862 302,600 5,241 10,029 20,147 68,927 16,282 Consumer electronics and appliances rental 1,901 134,345 * 12,496 * 243 * 361 * 126 * 3,787 -9,028 Formal wear and costume rental * 646 * 44,560 * 1,356 0 * 4,491 * 107 * 6,230 * 5,899 Video tape and disc rental * 3,051 * 265,195 * 19,490 0 * 37,280 * 5,511 * 52,323 * -5,863
General rental centers and other consumer goods rental 11,586 860,309 141,946 17,970 50,954 17,171 129,878 48,036
Commercial and industrial machinery and equipment rental and leasing 15,150 1,957,324 750,907 32,919 35,836 78,552 139,531 -23,438
Lessors of nonfinancial intangible assets (except copyrighted works) 2,668 * 32,360 * 62 0 * 10,682 0 0 * -3,217Footnotes at end of table.
Interest paiddeduction [1,3]
Payroll [1,4]Net incomeless deficit
Depreciationdeduction [1,2]
Rent paidon machinery
andequipment [1]
Rent paidon otherbusiness
property [1]
[All figures are estimates based on samples—money amounts are in thousands of dollars]
Industrial sector
Businesses with and without net income
Numberof returns
Businessreceipts
Table 1. Nonfarm Sole Proprietorships: Business Receipts, Selected Deductions, Payroll, and Net Income, by Industrial Sectors, Tax Year 2014—Continued
14
Sole Proprietorship Returns, 2014
Fall 2016Statistics of Income Bulletin
(9) (10) (11) (12) (13) (14) (15) (16)
General merchandise stores 15,262 2,217,577 14,211 * 1,523 114,559 6,628 39,843 243,946
Miscellaneous store retailers 405,114 26,037,304 324,602 95,593 909,767 115,994 1,525,878 4,833,435
Nonstore retailers 479,343 24,733,404 228,823 68,673 368,977 81,856 576,147 5,809,225Transportation and warehousing 1,066,264 91,225,695 3,944,779 2,993,769 630,526 494,770 3,758,752 17,746,094 Air and rail transportation 12,007 893,691 24,554 12,385 5,796 12,087 77,504 189,789
Water transportation 3,961 497,874 34,779 1,634 3,046 5,553 58,838 79,038
Truck transportation 498,708 68,134,026 3,243,959 1,238,010 376,436 369,861 2,883,872 11,504,554
Other transit and ground transportation ** 332,469 ** 12,352,491 ** 435,160 ** 1,658,643 ** 133,696 ** 72,261 ** 317,345 ** 3,512,290
Pipeline transportation ** ** ** ** ** ** ** **
Scenic and sightseeing transportation 5,435 292,388 21,513 * 22,226 * 184 * 7,501 * 11,284 60,260
Support activities for transportation (including motor vehicle towing) 50,882 3,998,242 130,917 25,354 49,659 15,115 322,429 794,696
Couriers and messengers 153,936 4,589,737 40,779 30,127 18,502 3,916 * 38,349 1,477,633
Warehousing and storage facilities 8,866 467,247 13,118 * 5,390 43,207 8,476 49,131 127,835Information 254,444 10,829,494 300,784 51,077 210,422 19,963 635,819 4,024,710 Publishing industries (except internet) 41,353 1,340,654 8,274 * 2,029 34,599 1,385 94,939 483,176
Motion picture and sound recording 77,117 3,120,389 186,749 27,522 60,078 4,714 184,713 1,351,598
Broadcasting (except internet) and telecommunications and internet service providers 63,636 3,734,945 84,025 17,992 79,821 10,869 265,912 1,244,678
Data processing, internet publishing and broadcasting, and web search portals 72,338 2,633,506 21,737 3,534 35,924 2,995 90,255 945,258Finance and insurance 444,815 56,063,430 555,193 163,334 1,340,151 341,648 4,349,965 23,668,099 Credit intermediation and related activities 27,407 1,908,540 14,880 6,460 59,456 38,130 106,312 672,787
Securities, commodity contracts, and other financial investments 113,917 25,623,010 205,941 48,029 430,953 125,060 1,572,518 9,912,270
Investment bankers and securities dealers 5,576 1,213,692 8,772 * 2,585 21,481 4,079 37,758 435,768
Securities brokers 8,088 3,255,718 36,601 9,740 22,983 4,170 92,011 956,212
Commodity contracts brokers and dealers 1,499 594,458 3,244 * 592 4,690 789 * 5,390 249,661
Securities and commodity exchanges * 1,052 * 127,123 * 1,037 * 108 * 1,430 * 849 * 20,069 * 18,148
Other financial investment activities (investment advice) 97,704 20,432,020 156,288 35,004 380,370 115,172 1,417,290 8,252,482
Insurance agents, brokers, and related activities 303,491 28,531,880 334,372 108,845 849,742 178,458 2,671,134 13,083,041
Insurance agencies and brokerages 234,273 23,505,395 273,158 99,207 755,541 161,783 2,533,106 10,491,611
Other insurance related activities and other financial vehicles 69,218 5,026,485 61,214 9,638 94,201 16,675 138,028 2,591,430Real estate and rental and leasing 773,313 60,314,217 1,394,986 205,149 834,743 473,433 1,871,920 28,348,308 Real estate 747,919 57,442,693 946,538 180,066 735,922 413,973 1,565,354 27,780,406
Lessors of real estate (including mini- warehouses and self storage) 24,871 2,196,556 135,406 4,109 42,947 165,064 90,092 633,095
Offices of real estate agents, brokers, property managers, and appraisers 577,519 41,932,064 555,317 140,342 533,918 164,266 1,001,208 21,531,647
Other activities related to real estate 145,529 13,314,073 255,815 35,615 159,056 84,642 474,053 5,615,664
Rental and leasing services 24,057 2,864,552 448,448 25,083 98,821 59,461 306,566 561,720
Automotive equipment rental and leasing 9,504 697,562 141,390 * 4,855 7,863 11,413 62,437 109,336
Consumer electronics and appliances rental * 352 * 50,131 * 5,488 * 243 * 361 * 126 * 2,433 * 12,047
Formal wear and costume rental * 344 * 44,366 * 1,081 0 * 4,491 * 107 * 6,230 * 6,913
Video tape and disc rental * 1,322 * 103,017 * 5,028 0 * 15,296 * 4 * 21,463 * 12,001
General rental centers and other consumer goods rental 5,617 675,753 62,576 930 46,975 7,779 122,337 111,159
Commercial and industrial machinery and equipment rental and leasing 6,917 1,293,723 232,884 19,055 23,835 40,031 91,667 310,264
Lessors of nonfinancial intangible assets (except copyrighted works) * 1,337 * 6,972 0 0 0 0 0 * 6,181Footnotes at end of table.
Industrial sector Depreciationdeduction [1,2]
Rent paidon machinery
andequipment [1]
Net incomeNumberof returns
Businessreceipts
Rent paidon otherbusiness
property [1]
Interest paiddeduction [1,3]
Payroll [1,4]
[All figures are estimates based on samples—money amounts are in thousands of dollars]
Businesses with net income
Table 1. Nonfarm Sole Proprietorships: Business Receipts, Selected Deductions, Payroll, and Net Income, by Industrial Sectors, Tax Year 2014—Continued
15
Sole Proprietorship Returns, 2014
Fall 2016Statistics of Income Bulletin
(1) (2) (3) (4) (5) (6) (7) (8)
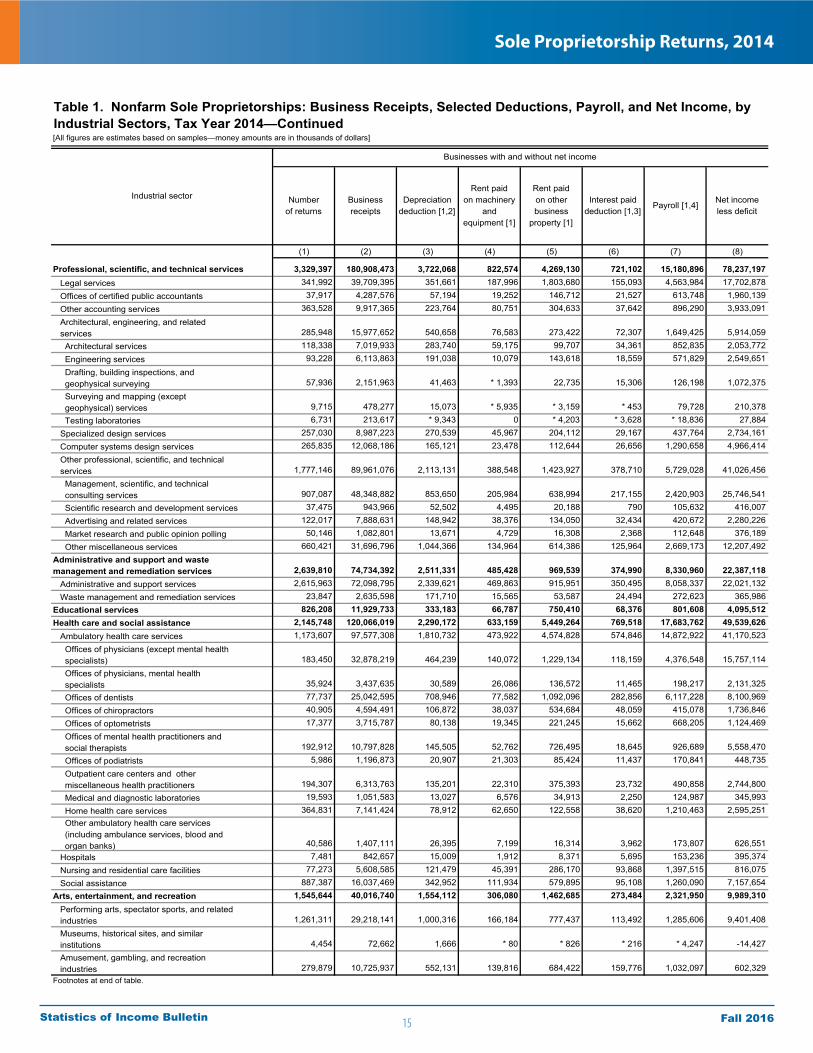
Professional, scientific, and technical services 3,329,397 180,908,473 3,722,068 822,574 4,269,130 721,102 15,180,896 78,237,197 Legal services 341,992 39,709,395 351,661 187,996 1,803,680 155,093 4,563,984 17,702,878
Offices of certified public accountants 37,917 4,287,576 57,194 19,252 146,712 21,527 613,748 1,960,139
Other accounting services 363,528 9,917,365 223,764 80,751 304,633 37,642 896,290 3,933,091
Architectural, engineering, and related services 285,948 15,977,652 540,658 76,583 273,422 72,307 1,649,425 5,914,059
Architectural services 118,338 7,019,933 283,740 59,175 99,707 34,361 852,835 2,053,772
Engineering services 93,228 6,113,863 191,038 10,079 143,618 18,559 571,829 2,549,651
Drafting, building inspections, and geophysical surveying 57,936 2,151,963 41,463 * 1,393 22,735 15,306 126,198 1,072,375
Surveying and mapping (except geophysical) services 9,715 478,277 15,073 * 5,935 * 3,159 * 453 79,728 210,378
Testing laboratories 6,731 213,617 * 9,343 0 * 4,203 * 3,628 * 18,836 27,884
Specialized design services 257,030 8,987,223 270,539 45,967 204,112 29,167 437,764 2,734,161
Computer systems design services 265,835 12,068,186 165,121 23,478 112,644 26,656 1,290,658 4,966,414
Other professional, scientific, and technical services 1,777,146 89,961,076 2,113,131 388,548 1,423,927 378,710 5,729,028 41,026,456
Management, scientific, and technical consulting services 907,087 48,348,882 853,650 205,984 638,994 217,155 2,420,903 25,746,541
Scientific research and development services 37,475 943,966 52,502 4,495 20,188 790 105,632 416,007
Advertising and related services 122,017 7,888,631 148,942 38,376 134,050 32,434 420,672 2,280,226
Market research and public opinion polling 50,146 1,082,801 13,671 4,729 16,308 2,368 112,648 376,189
Other miscellaneous services 660,421 31,696,796 1,044,366 134,964 614,386 125,964 2,669,173 12,207,492Administrative and support and wastemanagement and remediation services 2,639,810 74,734,392 2,511,331 485,428 969,539 374,990 8,330,960 22,387,118 Administrative and support services 2,615,963 72,098,795 2,339,621 469,863 915,951 350,495 8,058,337 22,021,132
Waste management and remediation services 23,847 2,635,598 171,710 15,565 53,587 24,494 272,623 365,986Educational services 826,208 11,929,733 333,183 66,787 750,410 68,376 801,608 4,095,512Health care and social assistance 2,145,748 120,066,019 2,290,172 633,159 5,449,264 769,518 17,683,762 49,539,626 Ambulatory health care services 1,173,607 97,577,308 1,810,732 473,922 4,574,828 574,846 14,872,922 41,170,523
Offices of physicians (except mental health specialists) 183,450 32,878,219 464,239 140,072 1,229,134 118,159 4,376,548 15,757,114
Offices of physicians, mental health specialists 35,924 3,437,635 30,589 26,086 136,572 11,465 198,217 2,131,325
Offices of dentists 77,737 25,042,595 708,946 77,582 1,092,096 282,856 6,117,228 8,100,969
Offices of chiropractors 40,905 4,594,491 106,872 38,037 534,684 48,059 415,078 1,736,846
Offices of optometrists 17,377 3,715,787 80,138 19,345 221,245 15,662 668,205 1,124,469
Offices of mental health practitioners and social therapists 192,912 10,797,828 145,505 52,762 726,495 18,645 926,689 5,558,470
Offices of podiatrists 5,986 1,196,873 20,907 21,303 85,424 11,437 170,841 448,735
Outpatient care centers and other miscellaneous health practitioners 194,307 6,313,763 135,201 22,310 375,393 23,732 490,858 2,744,800
Medical and diagnostic laboratories 19,593 1,051,583 13,027 6,576 34,913 2,250 124,987 345,993
Home health care services 364,831 7,141,424 78,912 62,650 122,558 38,620 1,210,463 2,595,251 Other ambulatory health care services (including ambulance services, blood and organ banks) 40,586 1,407,111 26,395 7,199 16,314 3,962 173,807 626,551
Hospitals 7,481 842,657 15,009 1,912 8,371 5,695 153,236 395,374
Nursing and residential care facilities 77,273 5,608,585 121,479 45,391 286,170 93,868 1,397,515 816,075
Social assistance 887,387 16,037,469 342,952 111,934 579,895 95,108 1,260,090 7,157,654Arts, entertainment, and recreation 1,545,644 40,016,740 1,554,112 306,080 1,462,685 273,484 2,321,950 9,989,310 Performing arts, spectator sports, and related industries 1,261,311 29,218,141 1,000,316 166,184 777,437 113,492 1,285,606 9,401,408
Museums, historical sites, and similar institutions 4,454 72,662 1,666 * 80 * 826 * 216 * 4,247 -14,427
Amusement, gambling, and recreation industries 279,879 10,725,937 552,131 139,816 684,422 159,776 1,032,097 602,329Footnotes at end of table.
Rent paidon machinery
andequipment [1]
Rent paidon otherbusiness
property [1]
Interest paiddeduction [1,3]
Payroll [1,4]Net incomeless deficit
Table 1. Nonfarm Sole Proprietorships: Business Receipts, Selected Deductions, Payroll, and Net Income, by Industrial Sectors, Tax Year 2014—Continued[All figures are estimates based on samples—money amounts are in thousands of dollars]
Industrial sector
Businesses with and without net income
Numberof returns
Businessreceipts
Depreciationdeduction [1,2]
16
Sole Proprietorship Returns, 2014
Fall 2016Statistics of Income Bulletin
(9) (10) (11) (12) (13) (14) (15) (16)
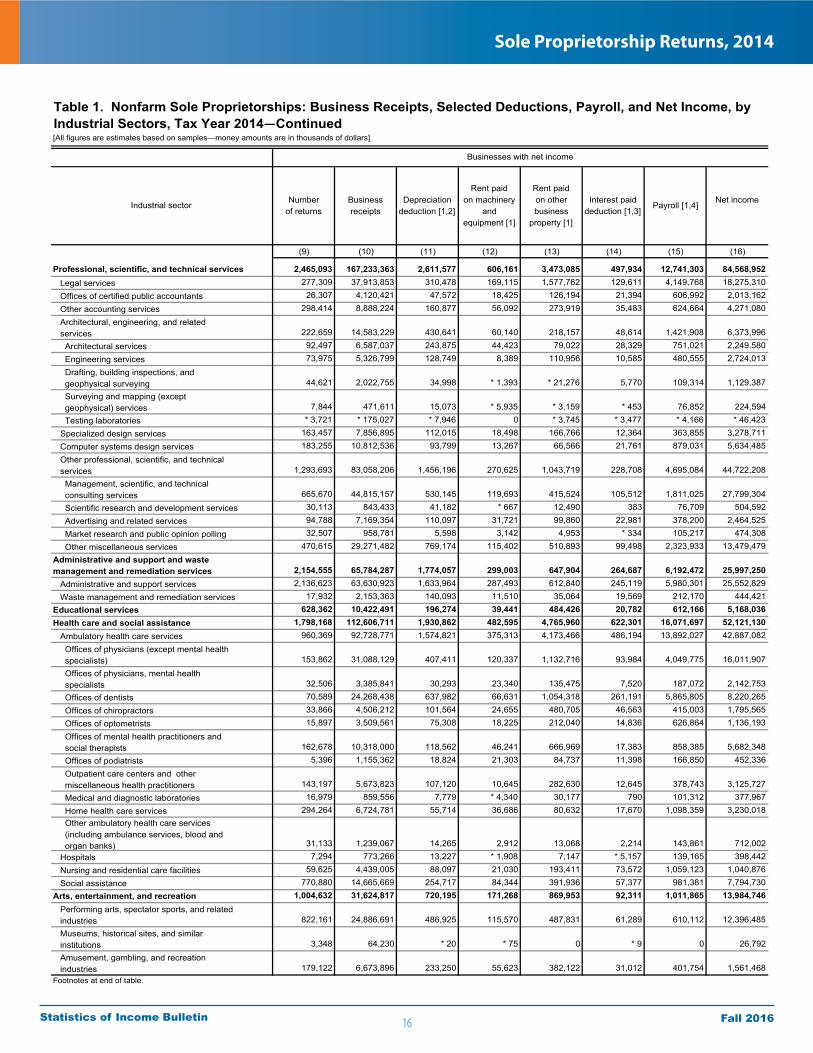
Professional, scientific, and technical services 2,465,093 167,233,363 2,611,577 606,161 3,473,085 497,934 12,741,303 84,568,952 Legal services 277,309 37,913,853 310,478 169,115 1,577,762 129,611 4,149,768 18,275,310
Offices of certified public accountants 26,307 4,120,421 47,572 18,425 126,194 21,394 606,992 2,013,162
Other accounting services 298,414 8,888,224 160,877 56,092 273,919 35,483 624,664 4,271,080
Architectural, engineering, and related services 222,659 14,583,229 430,641 60,140 218,157 48,614 1,421,908 6,373,996
Architectural services 92,497 6,587,037 243,875 44,423 79,022 28,329 751,021 2,249,580
Engineering services 73,975 5,326,799 128,749 8,389 110,956 10,585 480,555 2,724,013
Drafting, building inspections, and geophysical surveying 44,621 2,022,755 34,998 * 1,393 * 21,276 5,770 109,314 1,129,387
Surveying and mapping (except geophysical) services 7,844 471,611 15,073 * 5,935 * 3,159 * 453 76,852 224,594
Testing laboratories * 3,721 * 175,027 * 7,946 0 * 3,745 * 3,477 * 4,166 * 46,423
Specialized design services 163,457 7,856,895 112,015 18,498 166,766 12,364 363,855 3,278,711
Computer systems design services 183,255 10,812,536 93,799 13,267 66,566 21,761 879,031 5,634,485
Other professional, scientific, and technical services 1,293,693 83,058,206 1,456,196 270,625 1,043,719 228,708 4,695,084 44,722,208
Management, scientific, and technical consulting services 665,670 44,815,157 530,145 119,693 415,524 105,512 1,811,025 27,799,304
Scientific research and development services 30,113 843,433 41,182 * 667 12,490 383 76,709 504,592
Advertising and related services 94,788 7,169,354 110,097 31,721 99,860 22,981 378,200 2,464,525
Market research and public opinion polling 32,507 958,781 5,598 3,142 4,953 * 334 105,217 474,308
Other miscellaneous services 470,615 29,271,482 769,174 115,402 510,893 99,498 2,323,933 13,479,479Administrative and support and wastemanagement and remediation services 2,154,555 65,784,287 1,774,057 299,003 647,904 264,687 6,192,472 25,997,250 Administrative and support services 2,136,623 63,630,923 1,633,964 287,493 612,840 245,119 5,980,301 25,552,829
Waste management and remediation services 17,932 2,153,363 140,093 11,510 35,064 19,569 212,170 444,421Educational services 628,362 10,422,491 196,274 39,441 484,426 20,782 612,166 5,168,036Health care and social assistance 1,798,168 112,606,711 1,930,862 482,595 4,765,960 622,301 16,071,697 52,121,130 Ambulatory health care services 960,369 92,728,771 1,574,821 375,313 4,173,466 486,194 13,892,027 42,887,082
Offices of physicians (except mental health specialists) 153,862 31,088,129 407,411 120,337 1,132,716 93,984 4,049,775 16,011,907
Offices of physicians, mental health specialists 32,506 3,385,841 30,293 23,340 135,475 7,520 187,072 2,142,753
Offices of dentists 70,589 24,268,438 637,982 66,631 1,054,318 261,191 5,865,805 8,220,265
Offices of chiropractors 33,866 4,506,212 101,564 24,655 480,705 46,563 415,003 1,795,565
Offices of optometrists 15,897 3,509,561 75,308 18,225 212,040 14,836 626,864 1,136,193
Offices of mental health practitioners and social therapists 162,678 10,318,000 118,562 46,241 666,969 17,383 858,385 5,682,348
Offices of podiatrists 5,396 1,155,362 18,824 21,303 84,737 11,398 166,850 452,336
Outpatient care centers and other miscellaneous health practitioners 143,197 5,673,823 107,120 10,645 282,630 12,645 378,743 3,125,727
Medical and diagnostic laboratories 16,979 859,556 7,779 * 4,340 30,177 790 101,312 377,967
Home health care services 294,264 6,724,781 55,714 36,686 80,632 17,670 1,098,359 3,230,018 Other ambulatory health care services (including ambulance services, blood and organ banks) 31,133 1,239,067 14,265 2,912 13,068 2,214 143,861 712,002
Hospitals 7,294 773,266 13,227 * 1,908 7,147 * 5,157 139,165 398,442
Nursing and residential care facilities 59,625 4,439,005 88,097 21,030 193,411 73,572 1,059,123 1,040,876
Social assistance 770,880 14,665,669 254,717 84,344 391,936 57,377 981,381 7,794,730Arts, entertainment, and recreation 1,004,632 31,624,817 720,195 171,268 869,953 92,311 1,011,865 13,984,746 Performing arts, spectator sports, and related industries 822,161 24,886,691 486,925 115,570 487,831 61,289 610,112 12,396,485
Museums, historical sites, and similar institutions 3,348 64,230 * 20 * 75 0 * 9 0 26,792
Amusement, gambling, and recreation industries 179,122 6,673,896 233,250 55,623 382,122 31,012 401,754 1,561,468Footnotes at end of table.
Payroll [1,4]Net incomeNumber
of returnsBusinessreceipts
Depreciationdeduction [1,2]
Rent paidon machinery
andequipment [1]
Rent paidon otherbusiness
property [1]
Interest paiddeduction [1,3]
Industrial sector
Table 1. Nonfarm Sole Proprietorships: Business Receipts, Selected Deductions, Payroll, and Net Income, by Industrial Sectors, Tax Year 2014—Continued[All figures are estimates based on samples—money amounts are in thousands of dollars]
Businesses with net income
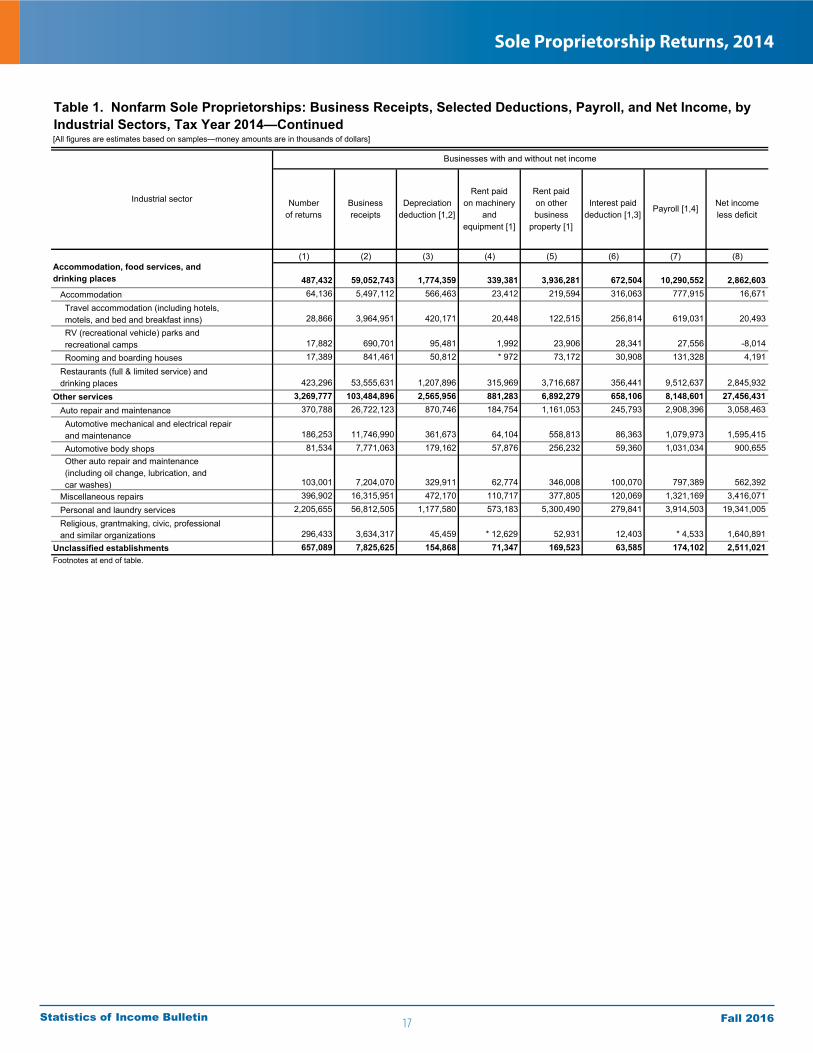
17
Sole Proprietorship Returns, 2014
Fall 2016Statistics of Income Bulletin
(1) (2) (3) (4) (5) (6) (7) (8)Accommodation, food services, and drinking places 487,432 59,052,743 1,774,359 339,381 3,936,281 672,504 10,290,552 2,862,603 Accommodation 64,136 5,497,112 566,463 23,412 219,594 316,063 777,915 16,671
Travel accommodation (including hotels, motels, and bed and breakfast inns) 28,866 3,964,951 420,171 20,448 122,515 256,814 619,031 20,493
RV (recreational vehicle) parks and recreational camps 17,882 690,701 95,481 1,992 23,906 28,341 27,556 -8,014
Rooming and boarding houses 17,389 841,461 50,812 * 972 73,172 30,908 131,328 4,191
Restaurants (full & limited service) and drinking places 423,296 53,555,631 1,207,896 315,969 3,716,687 356,441 9,512,637 2,845,932Other services 3,269,777 103,484,896 2,565,956 881,283 6,892,279 658,106 8,148,601 27,456,431 Auto repair and maintenance 370,788 26,722,123 870,746 184,754 1,161,053 245,793 2,908,396 3,058,463
Automotive mechanical and electrical repair and maintenance 186,253 11,746,990 361,673 64,104 558,813 86,363 1,079,973 1,595,415
Automotive body shops 81,534 7,771,063 179,162 57,876 256,232 59,360 1,031,034 900,655 Other auto repair and maintenance (including oil change, lubrication, and car washes) 103,001 7,204,070 329,911 62,774 346,008 100,070 797,389 562,392
Miscellaneous repairs 396,902 16,315,951 472,170 110,717 377,805 120,069 1,321,169 3,416,071
Personal and laundry services 2,205,655 56,812,505 1,177,580 573,183 5,300,490 279,841 3,914,503 19,341,005
Religious, grantmaking, civic, professional and similar organizations 296,433 3,634,317 45,459 * 12,629 52,931 12,403 * 4,533 1,640,891Unclassified establishments 657,089 7,825,625 154,868 71,347 169,523 63,585 174,102 2,511,021Footnotes at end of table.
Net incomeless deficit
Industrial sector
Businesses with and without net income
Numberof returns
Businessreceipts
Depreciationdeduction [1,2]
Rent paidon machinery
andequipment [1]
Rent paidon otherbusiness
property [1]
Interest paiddeduction [1,3]
Payroll [1,4]
Table 1. Nonfarm Sole Proprietorships: Business Receipts, Selected Deductions, Payroll, and Net Income, by Industrial Sectors, Tax Year 2014—Continued[All figures are estimates based on samples—money amounts are in thousands of dollars]

18
Sole Proprietorship Returns, 2014
Fall 2016Statistics of Income Bulletin
(9) (10) (11) (12) (13) (14) (15) (16)Accommodation, food services, and drinking places 315,490 44,794,246 872,692 221,140 2,746,444 352,449 7,112,279 5,684,944 Accommodation 37,458 3,606,622 237,307 9,319 96,502 147,665 435,705 630,015
Travel accommodation (including hotels, motels, and bed and breakfast inns) 14,800 2,581,811 174,606 8,557 80,388 110,236 331,327 434,108
RV (recreational vehicle) parks and recreational camps 13,322 501,186 35,626 * 636 * 15,943 * 13,546 * 16,901 84,006
Rooming and boarding houses 9,337 523,626 27,074 * 126 * 171 23,883 * 87,477 111,901
Restaurants (full & limited service) and drinking places 278,032 41,187,624 635,385 211,821 2,649,942 204,784 6,676,574 5,054,928Other services 2,589,823 92,676,729 1,632,178 667,527 5,705,077 431,770 6,729,742 32,568,083 Auto repair and maintenance 270,765 22,743,175 606,481 131,506 870,217 165,527 2,299,899 4,140,334
Automotive mechanical and electrical repair and maintenance 141,499 10,495,043 291,355 50,428 441,066 70,710 948,937 2,015,865
Automotive body shops 62,375 6,697,653 151,215 40,920 194,103 46,687 849,960 1,072,395 Other auto repair and maintenance (including oil change, lubrication, and car washes) 66,891 5,550,478 163,911 40,158 235,048 48,129 501,002 1,052,074
Miscellaneous repairs 290,146 14,614,085 294,940 72,767 293,616 80,986 1,124,878 4,204,449
Personal and laundry services 1,814,230 52,145,150 715,404 459,930 4,500,418 180,968 3,301,084 22,225,516
Religious, grantmaking, civic, professional and similar organizations 214,684 3,174,319 15,352 * 3,324 40,827 * 4,289 * 3,881 1,997,784Unclassified establishments 500,245 6,332,267 90,085 44,921 92,424 20,308 100,505 3,569,872
Rent paidon otherbusiness
property [1]
Interest paiddeduction [1,3]
Payroll [1,4]Net income
*Estimate should be used with caution because of the small number of sample returns on which it is based.**Data combined to prevent disclosure of taxpayer information.[1] Excludes amounts reported on Schedule C-EZ filed by certain small businesses not required to itemize their business deductions. Therefore, totals shown may be slightly understated.[2] Includes depreciation claimed on Form 8829, Expenses for Business Use of Your Home.[3] Interest paid is the sum of mortgage interest and other interest paid on business indebtedness.[4] Payroll is the sum of salaries and wages plus the cost of labor reported as part of cost of sales and operations.NOTE: Detail may not add to totals because of rounding.SOURCE: IRS, Statistics of Income Division, Sole Proprietorship Returns 2014, October 2016.
Industrial sectorNumber
of returnsBusinessreceipts
Depreciationdeduction [1,2]
Rent paidon machinery
andequipment [1]
Businesses with net income
Table 1. Nonfarm Sole Proprietorships: Business Receipts, Selected Deductions, Payroll, and Net Income, by Industrial Sectors, Tax Year 2014—Continued[All figures are estimates based on samples—money amounts are in thousands of dollars]
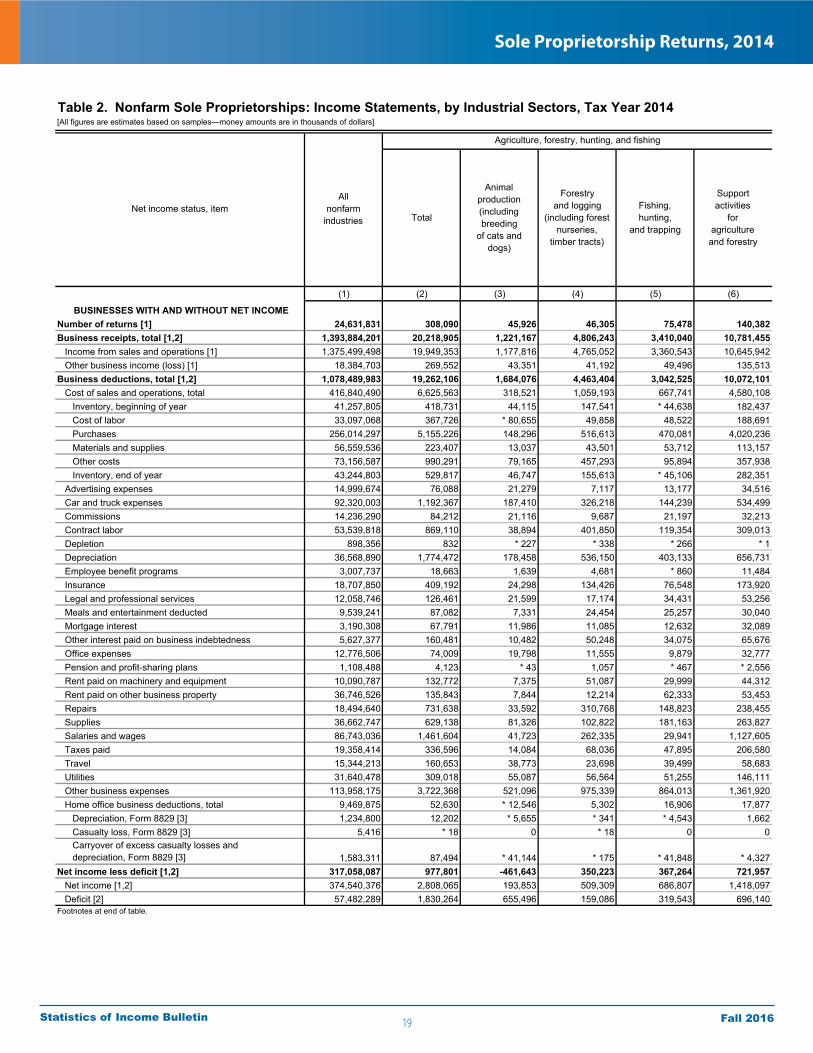
19
Sole Proprietorship Returns, 2014
Fall 2016Statistics of Income Bulletin
[All figures are estimates based on samples—money amounts are in thousands of dollars]
(1) (2) (3) (4) (5) (6)
BUSINESSES WITH AND WITHOUT NET INCOMENumber of returns [1] 24,631,831 308,090 45,926 46,305 75,478 140,382Business receipts, total [1,2] 1,393,884,201 20,218,905 1,221,167 4,806,243 3,410,040 10,781,455 Income from sales and operations [1] 1,375,499,498 19,949,353 1,177,816 4,765,052 3,360,543 10,645,942 Other business income (loss) [1] 18,384,703 269,552 43,351 41,192 49,496 135,513Business deductions, total [1,2] 1,078,489,983 19,262,106 1,684,076 4,463,404 3,042,525 10,072,101 Cost of sales and operations, total 416,840,490 6,625,563 318,521 1,059,193 667,741 4,580,108 Inventory, beginning of year 41,257,805 418,731 44,115 147,541 * 44,638 182,437 Cost of labor 33,097,068 367,726 * 80,655 49,858 48,522 188,691 Purchases 256,014,297 5,155,226 148,296 516,613 470,081 4,020,236 Materials and supplies 56,559,536 223,407 13,037 43,501 53,712 113,157 Other costs 73,156,587 990,291 79,165 457,293 95,894 357,938 Inventory, end of year 43,244,803 529,817 46,747 155,613 * 45,106 282,351 Advertising expenses 14,999,674 76,088 21,279 7,117 13,177 34,516 Car and truck expenses 92,320,003 1,192,367 187,410 326,218 144,239 534,499 Commissions 14,236,290 84,212 21,116 9,687 21,197 32,213 Contract labor 53,539,818 869,110 38,894 401,850 119,354 309,013 Depletion 898,356 832 * 227 * 338 * 266 * 1 Depreciation 36,568,890 1,774,472 178,458 536,150 403,133 656,731 Employee benefit programs 3,007,737 18,663 1,639 4,681 * 860 11,484 Insurance 18,707,850 409,192 24,298 134,426 76,548 173,920 Legal and professional services 12,058,746 126,461 21,599 17,174 34,431 53,256 Meals and entertainment deducted 9,539,241 87,082 7,331 24,454 25,257 30,040 Mortgage interest 3,190,308 67,791 11,986 11,085 12,632 32,089 Other interest paid on business indebtedness 5,627,377 160,481 10,482 50,248 34,075 65,676 Office expenses 12,776,506 74,009 19,798 11,555 9,879 32,777 Pension and profit-sharing plans 1,108,488 4,123 * 43 1,057 * 467 * 2,556 Rent paid on machinery and equipment 10,090,787 132,772 7,375 51,087 29,999 44,312 Rent paid on other business property 36,746,526 135,843 7,844 12,214 62,333 53,453 Repairs 18,494,640 731,638 33,592 310,768 148,823 238,455 Supplies 36,662,747 629,138 81,326 102,822 181,163 263,827 Salaries and wages 86,743,036 1,461,604 41,723 262,335 29,941 1,127,605 Taxes paid 19,358,414 336,596 14,084 68,036 47,895 206,580 Travel 15,344,213 160,653 38,773 23,698 39,499 58,683 Utilities 31,640,478 309,018 55,087 56,564 51,255 146,111 Other business expenses 113,958,175 3,722,368 521,096 975,339 864,013 1,361,920 Home office business deductions, total 9,469,875 52,630 * 12,546 5,302 16,906 17,877 Depreciation, Form 8829 [3] 1,234,800 12,202 * 5,655 * 341 * 4,543 1,662 Casualty loss, Form 8829 [3] 5,416 * 18 0 * 18 0 0 Carryover of excess casualty losses and depreciation, Form 8829 [3] 1,583,311 87,494 * 41,144 * 175 * 41,848 * 4,327Net income less deficit [1,2] 317,058,087 977,801 -461,643 350,223 367,264 721,957 Net income [1,2] 374,540,376 2,808,065 193,853 509,309 686,807 1,418,097 Deficit [2] 57,482,289 1,830,264 655,496 159,086 319,543 696,140Footnotes at end of table.
Table 2. Nonfarm Sole Proprietorships: Income Statements, by Industrial Sectors, Tax Year 2014
Agriculture, forestry, hunting, and fishing
Net income status, itemAll
nonfarmindustries Total
Animalproduction(includingbreeding
of cats and dogs)
Forestryand logging
(including forestnurseries,
timber tracts)
Fishing,hunting,
and trapping
Supportactivities
foragricultureand forestry
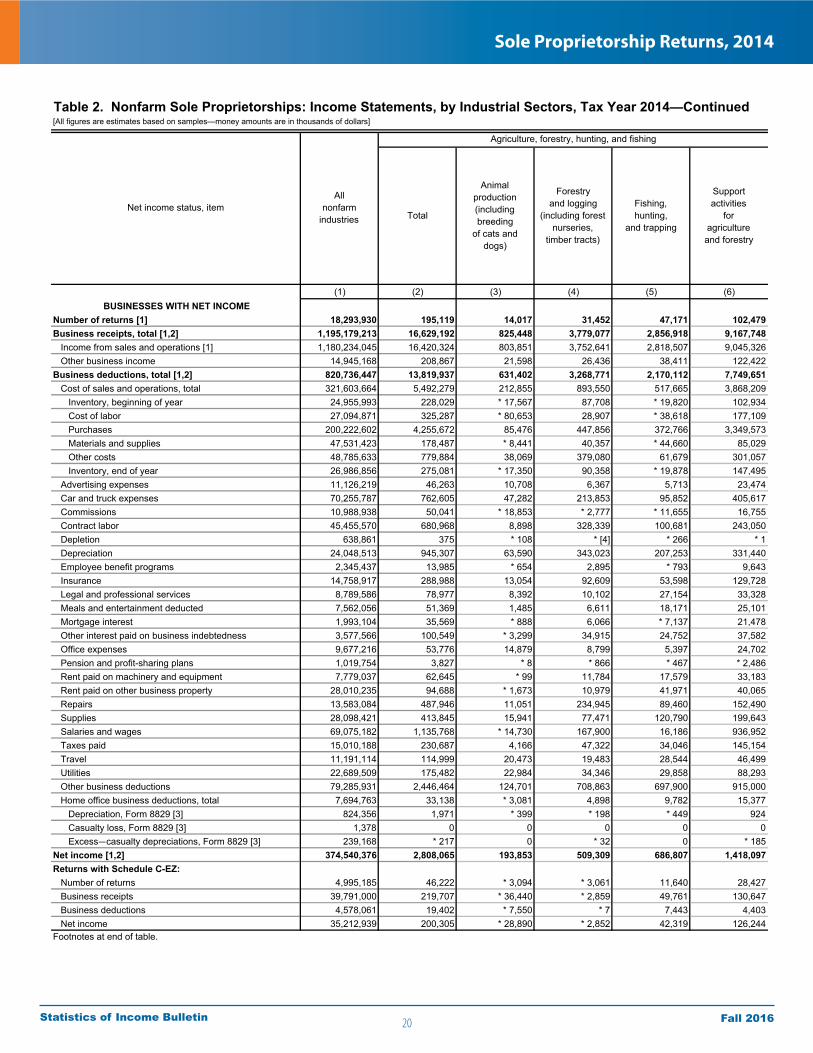
20
Sole Proprietorship Returns, 2014
Fall 2016Statistics of Income Bulletin
[All figures are estimates based on samples—money amounts are in thousands of dollars]
(1) (2) (3) (4) (5) (6)BUSINESSES WITH NET INCOME
Number of returns [1] 18,293,930 195,119 14,017 31,452 47,171 102,479Business receipts, total [1,2] 1,195,179,213 16,629,192 825,448 3,779,077 2,856,918 9,167,748 Income from sales and operations [1] 1,180,234,045 16,420,324 803,851 3,752,641 2,818,507 9,045,326 Other business income 14,945,168 208,867 21,598 26,436 38,411 122,422Business deductions, total [1,2] 820,736,447 13,819,937 631,402 3,268,771 2,170,112 7,749,651 Cost of sales and operations, total 321,603,664 5,492,279 212,855 893,550 517,665 3,868,209 Inventory, beginning of year 24,955,993 228,029 * 17,567 87,708 * 19,820 102,934 Cost of labor 27,094,871 325,287 * 80,653 28,907 * 38,618 177,109 Purchases 200,222,602 4,255,672 85,476 447,856 372,766 3,349,573 Materials and supplies 47,531,423 178,487 * 8,441 40,357 * 44,660 85,029 Other costs 48,785,633 779,884 38,069 379,080 61,679 301,057 Inventory, end of year 26,986,856 275,081 * 17,350 90,358 * 19,878 147,495 Advertising expenses 11,126,219 46,263 10,708 6,367 5,713 23,474 Car and truck expenses 70,255,787 762,605 47,282 213,853 95,852 405,617 Commissions 10,988,938 50,041 * 18,853 * 2,777 * 11,655 16,755 Contract labor 45,455,570 680,968 8,898 328,339 100,681 243,050 Depletion 638,861 375 * 108 * [4] * 266 * 1 Depreciation 24,048,513 945,307 63,590 343,023 207,253 331,440 Employee benefit programs 2,345,437 13,985 * 654 2,895 * 793 9,643 Insurance 14,758,917 288,988 13,054 92,609 53,598 129,728 Legal and professional services 8,789,586 78,977 8,392 10,102 27,154 33,328 Meals and entertainment deducted 7,562,056 51,369 1,485 6,611 18,171 25,101 Mortgage interest 1,993,104 35,569 * 888 6,066 * 7,137 21,478 Other interest paid on business indebtedness 3,577,566 100,549 * 3,299 34,915 24,752 37,582 Office expenses 9,677,216 53,776 14,879 8,799 5,397 24,702 Pension and profit-sharing plans 1,019,754 3,827 * 8 * 866 * 467 * 2,486 Rent paid on machinery and equipment 7,779,037 62,645 * 99 11,784 17,579 33,183 Rent paid on other business property 28,010,235 94,688 * 1,673 10,979 41,971 40,065 Repairs 13,583,084 487,946 11,051 234,945 89,460 152,490 Supplies 28,098,421 413,845 15,941 77,471 120,790 199,643 Salaries and wages 69,075,182 1,135,768 * 14,730 167,900 16,186 936,952 Taxes paid 15,010,188 230,687 4,166 47,322 34,046 145,154 Travel 11,191,114 114,999 20,473 19,483 28,544 46,499 Utilities 22,689,509 175,482 22,984 34,346 29,858 88,293 Other business deductions 79,285,931 2,446,464 124,701 708,863 697,900 915,000 Home office business deductions, total 7,694,763 33,138 * 3,081 4,898 9,782 15,377 Depreciation, Form 8829 [3] 824,356 1,971 * 399 * 198 * 449 924 Casualty loss, Form 8829 [3] 1,378 0 0 0 0 0 Excess—casualty depreciations, Form 8829 [3] 239,168 * 217 0 * 32 0 * 185Net income [1,2] 374,540,376 2,808,065 193,853 509,309 686,807 1,418,097Returns with Schedule C-EZ: Number of returns 4,995,185 46,222 * 3,094 * 3,061 11,640 28,427 Business receipts 39,791,000 219,707 * 36,440 * 2,859 49,761 130,647 Business deductions 4,578,061 19,402 * 7,550 * 7 7,443 4,403 Net income 35,212,939 200,305 * 28,890 * 2,852 42,319 126,244Footnotes at end of table.
Table 2. Nonfarm Sole Proprietorships: Income Statements, by Industrial Sectors, Tax Year 2014—Continued
Supportactivities
foragricultureand forestry
Net income status, itemAll
nonfarmindustries
Agriculture, forestry, hunting, and fishing
Total
Animalproduction(includingbreeding
of cats and dogs)
Forestryand logging
(including forestnurseries,
timber tracts)
Fishing,hunting,
and trapping

21
Sole Proprietorship Returns, 2014
Fall 2016Statistics of Income Bulletin
[All figures are estimates based on samples—money amounts are in thousands of dollars]
Utilities
(7) (8) (9) (10) (11) (12) (13)
BUSINESSES WITH AND WITHOUT NET INCOMENumber of returns [1] 121,341 99,351 4,347 17,644 14,108 2,731,987 519,570Business receipts, total [1,2] 14,956,446 10,678,019 1,037,617 3,240,810 1,086,052 213,246,990 56,697,600 Income from sales and operations [1] 14,575,859 10,336,069 1,036,970 3,202,820 1,064,960 211,274,726 56,258,675 Other business income (loss) [1] 380,587 341,950 647 37,991 21,092 1,972,264 438,924Business deductions, total [1,2] 13,540,839 9,977,661 1,041,432 2,521,746 982,633 177,899,708 49,186,152 Cost of sales and operations, total 3,529,218 2,155,733 417,780 955,706 495,872 84,295,732 28,921,444 Inventory, beginning of year 181,410 90,064 31,921 59,425 * 2,312 4,574,133 2,552,254 Cost of labor 366,482 192,501 68,180 105,801 * 891 14,371,393 4,079,456 Purchases 688,516 264,567 131,260 292,689 * 158,805 25,146,403 7,328,137 Materials and supplies 243,848 108,933 46,678 88,237 * 7,904 29,943,325 9,738,815 Other costs 2,222,523 1,596,531 157,788 468,204 * 335,195 14,838,426 7,858,044 Inventory, end of year 173,561 96,864 18,047 58,651 * 9,235 4,577,949 2,635,263 Advertising expenses 20,209 8,561 3,934 7,714 7,734 1,080,862 200,094 Car and truck expenses 428,746 277,067 26,868 124,811 41,790 15,720,087 3,151,698 Commissions 31,188 25,777 * 640 4,770 3,901 593,456 123,348 Contract labor 311,480 165,487 10,105 135,889 32,685 19,210,024 4,990,066 Depletion 784,637 765,467 11,288 7,883 * 1,007 22,840 3,443 Depreciation 1,220,035 903,621 88,996 227,417 133,558 5,688,361 1,093,935 Employee benefit programs 28,788 15,447 6,969 6,372 * 1,103 335,459 52,340 Insurance 166,592 97,641 18,186 50,766 6,792 3,859,290 795,392 Legal and professional services 161,495 128,828 9,440 23,227 17,910 1,049,039 261,584 Meals and entertainment deducted 39,550 21,540 1,248 16,762 4,420 838,835 151,368 Mortgage interest 17,760 12,360 * 3,973 1,427 * 2,024 310,768 88,880 Other interest paid on business indebtedness 163,846 131,637 13,461 18,748 6,468 735,006 211,691 Office expenses 65,679 50,855 3,579 11,245 5,125 1,077,430 216,999 Pension and profit-sharing plans 4,646 2,618 * 1,861 * 167 0 43,882 5,080 Rent paid on machinery and equipment 134,615 41,369 44,004 49,242 3,289 1,242,156 227,527 Rent paid on other business property 88,244 56,514 5,494 26,236 4,404 1,515,935 289,775 Repairs 252,520 157,836 34,413 60,271 19,022 2,200,254 394,513 Supplies 136,183 73,787 16,259 46,137 30,046 9,632,349 1,982,852 Salaries and wages 798,702 376,145 127,974 294,583 13,320 9,486,167 2,022,968 Taxes paid 353,227 293,481 18,279 41,467 11,544 2,052,905 454,416 Travel 96,880 52,495 1,659 42,725 6,669 1,167,768 219,118 Utilities 138,410 95,911 11,261 31,239 14,198 3,298,201 683,858 Other business expenses 4,528,951 4,042,800 159,877 326,274 111,690 11,021,334 2,358,084 Home office business deductions, total 30,082 17,800 * 3,884 8,397 * 3,318 990,544 214,242 Depreciation, Form 8829 [3] 3,743 3,505 * 2 * 236 * 124 114,356 30,264 Casualty loss, Form 8829 [3] * 1 * 1 0 0 0 * 175 * 175 Carryover of excess casualty losses and depreciation, Form 8829 [3] 651 605 * 0 * 45 0 124,018 42,153Net income less deficit [1,2] 1,408,587 688,175 2,978 717,434 -11,930 35,579,919 7,636,216 Net income [1,2] 2,984,975 2,084,389 71,771 828,815 176,604 40,472,496 8,780,753 Deficit [2] 1,576,388 1,396,214 68,793 111,381 188,534 4,892,577 1,144,537Footnotes at end of table.
Construction
Table 2. Nonfarm Sole Proprietorships: Income Statements, by Industrial Sectors, Tax Year 2014—Continued
Mining
Net income status, itemTotal
Oiland
gas extraction
Othermining Total Total
Constructionof
buildings
Supportactivities for
mining

22
Sole Proprietorship Returns, 2014
Fall 2016Statistics of Income Bulletin
[All figures are estimates based on samples—money amounts are in thousands of dollars]
Utilities
(7) (8) (9) (10) (11) (12) (13)BUSINESSES WITH NET INCOME
Number of returns [1] 85,976 73,272 897 11,808 11,282 2,247,450 424,912Business receipts, total [1,2] 10,957,405 7,566,285 616,170 2,774,950 525,701 190,185,731 49,411,258 Income from sales and operations [1] 10,672,858 7,316,894 615,663 2,740,301 524,509 188,467,226 49,129,210 Other business income 284,546 249,390 * 507 34,649 * 1,191 1,718,505 282,048Business deductions, total [1,2] 7,975,635 5,485,059 544,399 1,946,177 350,102 149,714,772 40,631,590 Cost of sales and operations, total 2,273,183 1,345,753 179,307 748,123 * 165,626 71,786,915 24,014,365 Inventory, beginning of year 102,616 42,207 * 20,746 39,663 * 65 2,185,411 1,289,854 Cost of labor 250,840 188,156 * 21,720 40,964 * 888 12,797,989 3,573,204 Purchases 513,168 221,114 * 72,562 219,491 * 144,995 21,450,038 6,124,382 Materials and supplies 149,335 45,305 * 22,737 81,293 * 7,842 26,501,161 8,594,648 Other costs 1,342,901 888,338 49,223 405,340 * 18,787 11,256,449 5,832,429 Inventory, end of year 85,676 39,365 * 7,681 38,630 * 6,950 2,404,132 1,400,152 Advertising expenses 12,294 5,301 734 6,259 * 2,187 898,021 164,727 Car and truck expenses 260,493 132,193 * 13,397 114,903 34,713 13,105,857 2,671,532 Commissions 25,530 20,648 * 593 4,288 * 932 448,358 82,678 Contract labor 248,131 142,994 6,627 98,511 * 17,819 16,917,731 4,358,090 Depletion 559,070 544,581 7,186 7,303 * 986 14,111 * 235 Depreciation 639,796 429,995 40,659 169,142 18,478 4,652,556 921,034 Employee benefit programs 18,692 8,504 * 5,812 4,377 * 664 281,542 42,447 Insurance 111,147 60,777 9,597 40,772 2,475 3,271,447 675,062 Legal and professional services 79,961 58,896 4,289 16,775 3,404 796,750 190,676 Meals and entertainment deducted 26,497 10,872 116 15,509 4,213 700,146 118,588 Mortgage interest 11,140 9,139 * 623 1,377 * 887 217,786 57,888 Other interest paid on business indebtedness 77,790 61,106 2,274 14,411 * 3,447 527,546 143,221 Office expenses 48,025 36,345 1,667 10,014 4,328 867,853 174,592 Pension and profit-sharing plans 3,458 1,627 * 1,753 * 78 0 35,180 3,680 Rent paid on machinery and equipment 80,189 18,197 24,836 37,156 * 3,282 995,978 186,006 Rent paid on other business property 37,568 14,846 * 1,844 20,877 * 1,722 1,234,571 229,397 Repairs 147,786 81,776 22,619 43,391 10,738 1,645,557 244,973 Supplies 96,619 41,007 13,262 42,350 23,977 8,279,042 1,647,857 Salaries and wages 509,772 196,230 90,891 222,651 * 8,076 8,043,867 1,621,850 Taxes paid 244,365 199,534 10,114 34,718 3,258 1,710,865 366,961 Travel 67,023 27,854 592 38,577 6,360 932,921 157,000 Utilities 102,849 70,992 3,557 28,300 10,858 2,653,326 540,602 Other business deductions 2,260,936 1,943,048 102,044 215,844 13,620 8,406,599 1,779,608 Home office business deductions, total 24,506 16,299 * 7 8,200 * 3,310 865,032 168,087 Depreciation, Form 8829 [3] 3,416 3,224 * 2 * 191 * 124 87,409 22,081 Casualty loss, Form 8829 [3] * 1 * 1 0 0 0 * 175 * 175 Excess—casualty depreciations, Form 8829 [3] * 24 * 24 0 0 0 55,211 22,444Net income [1,2] 2,984,975 2,084,389 71,771 828,815 176,604 40,472,496 8,780,753Returns with Schedule C-EZ: Number of returns 13,097 11,767 ** ** 1,330 * 4,785 469,311 64,827 Business receipts 94,378 68,764 ** ** 25,614 * 41,116 3,969,926 634,168 Business deductions 9,162 6,891 ** ** 2,271 * 4,743 431,025 71,436 Net income 85,216 61,874 ** ** 23,343 * 36,373 3,538,900 562,732Footnotes at end of table.
Construction
Table 2. Nonfarm Sole Proprietorships: Income Statements, by Industrial Sectors, Tax Year 2014—Continued
TotalConstruction
ofbuildings
TotalOiland
gas extraction
Othermining
Supportactivities for
miningTotal
Net income status, item
Mining
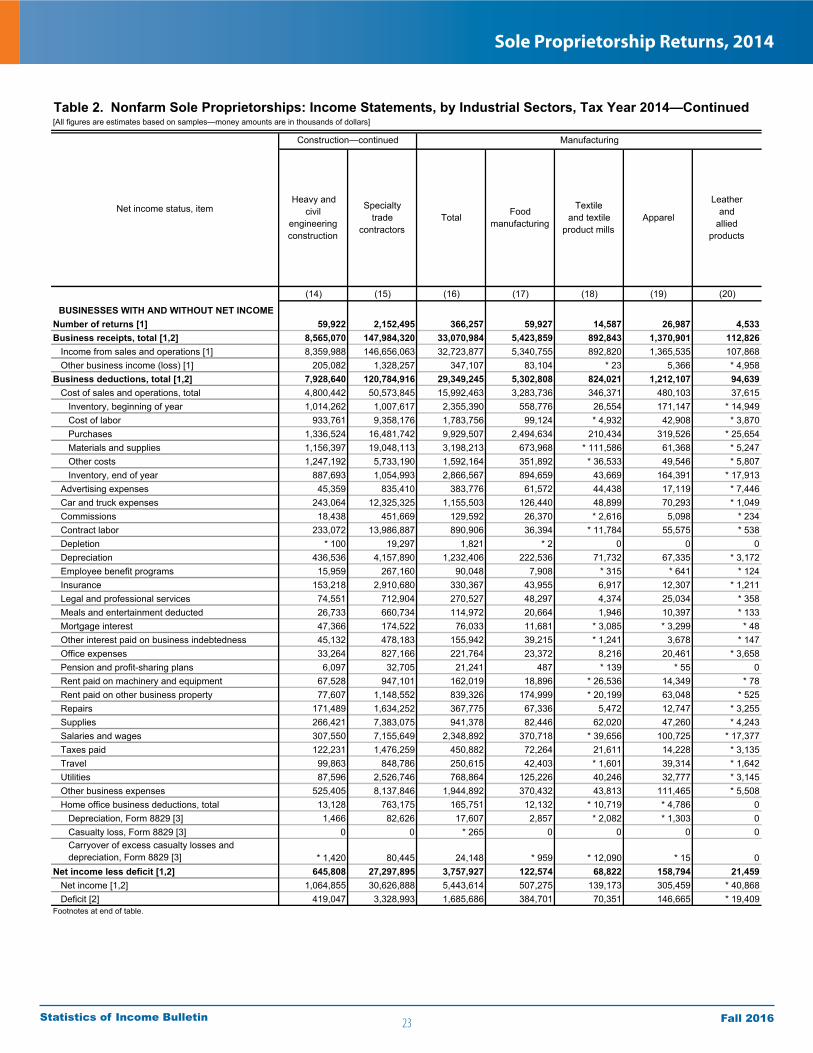
23
Sole Proprietorship Returns, 2014
Fall 2016Statistics of Income Bulletin
[All figures are estimates based on samples—money amounts are in thousands of dollars]
(14) (15) (16) (17) (18) (19) (20)
BUSINESSES WITH AND WITHOUT NET INCOMENumber of returns [1] 59,922 2,152,495 366,257 59,927 14,587 26,987 4,533Business receipts, total [1,2] 8,565,070 147,984,320 33,070,984 5,423,859 892,843 1,370,901 112,826 Income from sales and operations [1] 8,359,988 146,656,063 32,723,877 5,340,755 892,820 1,365,535 107,868 Other business income (loss) [1] 205,082 1,328,257 347,107 83,104 * 23 5,366 * 4,958Business deductions, total [1,2] 7,928,640 120,784,916 29,349,245 5,302,808 824,021 1,212,107 94,639 Cost of sales and operations, total 4,800,442 50,573,845 15,992,463 3,283,736 346,371 480,103 37,615 Inventory, beginning of year 1,014,262 1,007,617 2,355,390 558,776 26,554 171,147 * 14,949 Cost of labor 933,761 9,358,176 1,783,756 99,124 * 4,932 42,908 * 3,870 Purchases 1,336,524 16,481,742 9,929,507 2,494,634 210,434 319,526 * 25,654 Materials and supplies 1,156,397 19,048,113 3,198,213 673,968 * 111,586 61,368 * 5,247 Other costs 1,247,192 5,733,190 1,592,164 351,892 * 36,533 49,546 * 5,807 Inventory, end of year 887,693 1,054,993 2,866,567 894,659 43,669 164,391 * 17,913 Advertising expenses 45,359 835,410 383,776 61,572 44,438 17,119 * 7,446 Car and truck expenses 243,064 12,325,325 1,155,503 126,440 48,899 70,293 * 1,049 Commissions 18,438 451,669 129,592 26,370 * 2,616 5,098 * 234 Contract labor 233,072 13,986,887 890,906 36,394 * 11,784 55,575 * 538 Depletion * 100 19,297 1,821 * 2 0 0 0 Depreciation 436,536 4,157,890 1,232,406 222,536 71,732 67,335 * 3,172 Employee benefit programs 15,959 267,160 90,048 7,908 * 315 * 641 * 124 Insurance 153,218 2,910,680 330,367 43,955 6,917 12,307 * 1,211 Legal and professional services 74,551 712,904 270,527 48,297 4,374 25,034 * 358 Meals and entertainment deducted 26,733 660,734 114,972 20,664 1,946 10,397 * 133 Mortgage interest 47,366 174,522 76,033 11,681 * 3,085 * 3,299 * 48 Other interest paid on business indebtedness 45,132 478,183 155,942 39,215 * 1,241 3,678 * 147 Office expenses 33,264 827,166 221,764 23,372 8,216 20,461 * 3,658 Pension and profit-sharing plans 6,097 32,705 21,241 487 * 139 * 55 0 Rent paid on machinery and equipment 67,528 947,101 162,019 18,896 * 26,536 14,349 * 78 Rent paid on other business property 77,607 1,148,552 839,326 174,999 * 20,199 63,048 * 525 Repairs 171,489 1,634,252 367,775 67,336 5,472 12,747 * 3,255 Supplies 266,421 7,383,075 941,378 82,446 62,020 47,260 * 4,243 Salaries and wages 307,550 7,155,649 2,348,892 370,718 * 39,656 100,725 * 17,377 Taxes paid 122,231 1,476,259 450,882 72,264 21,611 14,228 * 3,135 Travel 99,863 848,786 250,615 42,403 * 1,601 39,314 * 1,642 Utilities 87,596 2,526,746 768,864 125,226 40,246 32,777 * 3,145 Other business expenses 525,405 8,137,846 1,944,892 370,432 43,813 111,465 * 5,508 Home office business deductions, total 13,128 763,175 165,751 12,132 * 10,719 * 4,786 0 Depreciation, Form 8829 [3] 1,466 82,626 17,607 2,857 * 2,082 * 1,303 0 Casualty loss, Form 8829 [3] 0 0 * 265 0 0 0 0 Carryover of excess casualty losses and depreciation, Form 8829 [3] * 1,420 80,445 24,148 * 959 * 12,090 * 15 0Net income less deficit [1,2] 645,808 27,297,895 3,757,927 122,574 68,822 158,794 21,459 Net income [1,2] 1,064,855 30,626,888 5,443,614 507,275 139,173 305,459 * 40,868 Deficit [2] 419,047 3,328,993 1,685,686 384,701 70,351 146,665 * 19,409Footnotes at end of table.
Construction—continued Manufacturing
Table 2. Nonfarm Sole Proprietorships: Income Statements, by Industrial Sectors, Tax Year 2014—Continued
Leatherand
alliedproducts
Net income status, itemHeavy and
civilengineeringconstruction
Specialtytrade
contractorsTotal Food
manufacturing
Textileand textile
product millsApparel

24
Sole Proprietorship Returns, 2014
Fall 2016Statistics of Income Bulletin
[All figures are estimates based on samples—money amounts are in thousands of dollars]
(14) (15) (16) (17) (18) (19) (20)BUSINESSES WITH NET INCOME
Number of returns [1] 43,881 1,778,657 222,004 36,537 7,730 16,034 * 2,074Business receipts, total [1,2] 6,704,801 134,069,672 27,567,554 4,357,837 628,408 1,074,778 * 76,454 Income from sales and operations [1] 6,513,013 132,825,004 27,338,380 4,309,167 628,449 1,070,043 * 76,175 Other business income 191,788 1,244,668 229,174 48,670 * -42 4,735 * 279Business deductions, total [1,2] 5,639,983 103,443,200 22,120,613 3,849,504 489,235 769,319 * 35,586 Cost of sales and operations, total 3,335,971 44,436,579 12,775,793 2,604,294 225,852 268,638 * 21,605 Inventory, beginning of year 265,065 630,492 1,511,034 344,400 * 24,954 84,490 * 14,413 Cost of labor 747,057 8,477,728 1,430,439 53,119 * 3,752 * 37,752 * 1,182 Purchases 1,057,828 14,267,827 7,946,578 2,038,432 * 196,008 141,765 * 22,591 Materials and supplies 930,497 16,976,016 2,367,504 261,125 * 2,516 58,986 0 Other costs 640,234 4,783,786 1,195,335 255,280 * 34,157 40,053 * 81 Inventory, end of year 304,711 699,269 1,675,097 348,061 * 35,535 94,407 * 16,662 Advertising expenses 32,391 700,902 227,599 34,145 * 13,093 6,088 * 594 Car and truck expenses 173,168 10,261,158 723,700 87,291 18,255 43,942 * 306 Commissions 13,867 351,813 90,281 21,411 * 2,376 * 2,701 * 228 Contract labor 187,689 12,371,952 767,186 25,225 * 11,150 42,028 0 Depletion 0 * 13,876 * 1,053 0 0 0 0 Depreciation 329,542 3,401,980 812,438 150,055 22,759 43,718 * 75 Employee benefit programs 7,673 231,422 63,275 4,074 * 305 * 625 * 119 Insurance 126,225 2,470,161 247,731 30,854 * 4,189 10,131 * 557 Legal and professional services 41,980 564,094 160,365 26,533 * 3,986 8,284 * 172 Meals and entertainment deducted 19,905 561,653 82,955 13,402 * 1,237 9,132 * 11 Mortgage interest 34,331 125,567 42,107 5,481 * 580 * 3,299 0 Other interest paid on business indebtedness 22,239 362,086 91,995 16,336 * 959 * 2,672 * 94 Office expenses 24,346 668,915 144,975 13,501 3,568 17,155 * 809 Pension and profit-sharing plans * 2,093 29,406 20,096 * 233 * 139 * 55 0 Rent paid on machinery and equipment 34,823 775,149 105,674 6,189 * 13,744 * 11,349 * 33 Rent paid on other business property 62,861 942,313 600,121 122,800 * 18,237 52,743 * 321 Repairs 141,441 1,259,143 252,027 39,830 * 5,133 9,740 * 34 Supplies 254,369 6,376,817 646,137 37,893 23,668 24,511 * 136 Salaries and wages 189,856 6,232,161 1,663,786 193,334 * 39,375 75,540 * 5,135 Taxes paid 91,485 1,252,419 326,754 41,561 13,278 10,268 * 306 Travel 78,460 697,461 152,655 30,259 * 1,218 15,377 * 893 Utilities 72,602 2,040,122 514,968 65,821 25,387 21,651 * 255 Other business deductions 344,327 6,282,664 1,435,654 257,781 32,697 84,916 * 3,903 Home office business deductions, total 7,965 688,981 129,912 7,988 * 7,977 * 4,742 0 Depreciation, Form 8829 [3] * 674 64,653 11,669 * 1,919 * 766 * 1,297 0 Casualty loss, Form 8829 [3] 0 0 0 0 0 0 0 Excess—casualty depreciations, Form 8829 [3] * 589 32,178 0 0 0 0 0Net income [1,2] 1,064,855 30,626,888 5,443,614 507,275 139,173 305,459 * 40,868Returns with Schedule C-EZ: Number of returns 11,303 393,181 34,093 8,193 * 136 * 6 * 1,014 Business receipts 65,433 3,270,324 264,903 71,541 * 83 * 268 * 17,310 Business deductions * 10,493 349,096 41,490 13,328 * 74 * 14 0 Net income 54,940 2,921,228 223,412 58,213 * 8 * 254 * 17,310Footnotes at end of table.
Construction—continued Manufacturing
Table 2. Nonfarm Sole Proprietorships: Income Statements, by Industrial Sectors, Tax Year 2014—Continued
Textileand textile
product millsApparel
Leatherand
alliedproducts
Heavy andcivil
engineeringconstruction
Specialtytrade
contractorsTotal Food
manufacturingNet income status, item
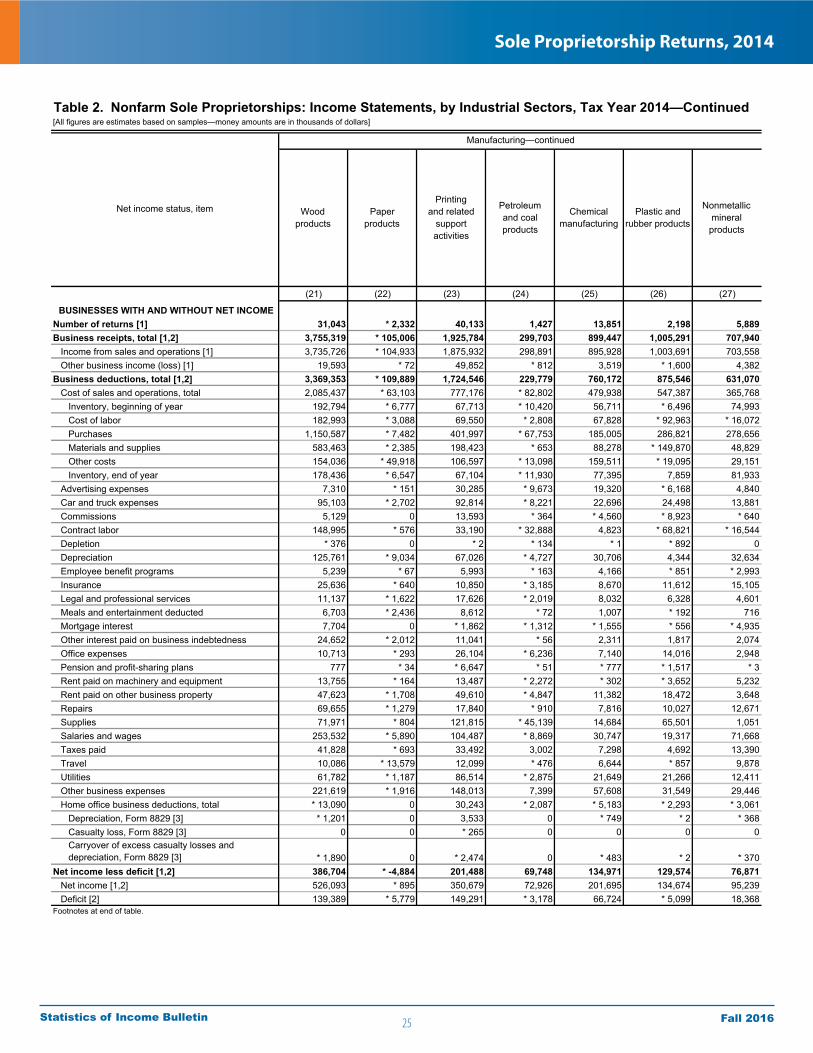
25
Sole Proprietorship Returns, 2014
Fall 2016Statistics of Income Bulletin
[All figures are estimates based on samples—money amounts are in thousands of dollars]
(21) (22) (23) (24) (25) (26) (27)
BUSINESSES WITH AND WITHOUT NET INCOMENumber of returns [1] 31,043 * 2,332 40,133 1,427 13,851 2,198 5,889Business receipts, total [1,2] 3,755,319 * 105,006 1,925,784 299,703 899,447 1,005,291 707,940 Income from sales and operations [1] 3,735,726 * 104,933 1,875,932 298,891 895,928 1,003,691 703,558 Other business income (loss) [1] 19,593 * 72 49,852 * 812 3,519 * 1,600 4,382Business deductions, total [1,2] 3,369,353 * 109,889 1,724,546 229,779 760,172 875,546 631,070 Cost of sales and operations, total 2,085,437 * 63,103 777,176 * 82,802 479,938 547,387 365,768 Inventory, beginning of year 192,794 * 6,777 67,713 * 10,420 56,711 * 6,496 74,993 Cost of labor 182,993 * 3,088 69,550 * 2,808 67,828 * 92,963 * 16,072 Purchases 1,150,587 * 7,482 401,997 * 67,753 185,005 286,821 278,656 Materials and supplies 583,463 * 2,385 198,423 * 653 88,278 * 149,870 48,829 Other costs 154,036 * 49,918 106,597 * 13,098 159,511 * 19,095 29,151 Inventory, end of year 178,436 * 6,547 67,104 * 11,930 77,395 7,859 81,933 Advertising expenses 7,310 * 151 30,285 * 9,673 19,320 * 6,168 4,840 Car and truck expenses 95,103 * 2,702 92,814 * 8,221 22,696 24,498 13,881 Commissions 5,129 0 13,593 * 364 * 4,560 * 8,923 * 640 Contract labor 148,995 * 576 33,190 * 32,888 4,823 * 68,821 * 16,544 Depletion * 376 0 * 2 * 134 * 1 * 892 0 Depreciation 125,761 * 9,034 67,026 * 4,727 30,706 4,344 32,634 Employee benefit programs 5,239 * 67 5,993 * 163 4,166 * 851 * 2,993 Insurance 25,636 * 640 10,850 * 3,185 8,670 11,612 15,105 Legal and professional services 11,137 * 1,622 17,626 * 2,019 8,032 6,328 4,601 Meals and entertainment deducted 6,703 * 2,436 8,612 * 72 1,007 * 192 716 Mortgage interest 7,704 0 * 1,862 * 1,312 * 1,555 * 556 * 4,935 Other interest paid on business indebtedness 24,652 * 2,012 11,041 * 56 2,311 1,817 2,074 Office expenses 10,713 * 293 26,104 * 6,236 7,140 14,016 2,948 Pension and profit-sharing plans 777 * 34 * 6,647 * 51 * 777 * 1,517 * 3 Rent paid on machinery and equipment 13,755 * 164 13,487 * 2,272 * 302 * 3,652 5,232 Rent paid on other business property 47,623 * 1,708 49,610 * 4,847 11,382 18,472 3,648 Repairs 69,655 * 1,279 17,840 * 910 7,816 10,027 12,671 Supplies 71,971 * 804 121,815 * 45,139 14,684 65,501 1,051 Salaries and wages 253,532 * 5,890 104,487 * 8,869 30,747 19,317 71,668 Taxes paid 41,828 * 693 33,492 3,002 7,298 4,692 13,390 Travel 10,086 * 13,579 12,099 * 476 6,644 * 857 9,878 Utilities 61,782 * 1,187 86,514 * 2,875 21,649 21,266 12,411 Other business expenses 221,619 * 1,916 148,013 7,399 57,608 31,549 29,446 Home office business deductions, total * 13,090 0 30,243 * 2,087 * 5,183 * 2,293 * 3,061 Depreciation, Form 8829 [3] * 1,201 0 3,533 0 * 749 * 2 * 368 Casualty loss, Form 8829 [3] 0 0 * 265 0 0 0 0 Carryover of excess casualty losses and depreciation, Form 8829 [3] * 1,890 0 * 2,474 0 * 483 * 2 * 370Net income less deficit [1,2] 386,704 * -4,884 201,488 69,748 134,971 129,574 76,871 Net income [1,2] 526,093 * 895 350,679 72,926 201,695 134,674 95,239 Deficit [2] 139,389 * 5,779 149,291 * 3,178 66,724 * 5,099 18,368Footnotes at end of table.
Manufacturing—continued
Table 2. Nonfarm Sole Proprietorships: Income Statements, by Industrial Sectors, Tax Year 2014—Continued
Woodproducts
Net income status, item Paperproducts
Printingand related
supportactivities
Petroleumand coalproducts
Chemicalmanufacturing
Plastic andrubber products
Nonmetallicmineralproducts

26
Sole Proprietorship Returns, 2014
Fall 2016Statistics of Income Bulletin
[All figures are estimates based on samples—money amounts are in thousands of dollars]
(21) (22) (23) (24) (25) (26) (27)BUSINESSES WITH NET INCOME
Number of returns [1] 15,688 * 1,021 21,889 1,322 7,910 2,141 2,876Business receipts, total [1,2] 3,284,815 * 3,849 1,380,357 274,700 755,616 862,757 585,734 Income from sales and operations [1] 3,266,065 * 3,842 1,332,720 273,988 753,275 861,204 582,782 Other business income 18,750 * 6 47,637 * 712 2,341 * 1,553 * 2,952Business deductions, total [1,2] 2,759,193 * 2,953 1,029,678 201,774 549,616 727,913 490,495 Cost of sales and operations, total 1,825,674 * 2,729 503,553 * 63,167 386,070 442,236 306,538 Inventory, beginning of year 128,202 * 70 38,844 * 6,885 25,471 * 5,636 * 47,007 Cost of labor 164,723 * 167 * 43,671 * 1,747 * 54,999 * 70,996 * 10,813 Purchases 965,095 * 2,138 248,817 * 51,101 134,701 * 208,978 247,500 Materials and supplies 565,455 0 131,985 * 653 * 79,913 * 149,870 * 31,223 Other costs 135,634 * 394 80,750 * 11,072 125,872 * 13,022 * 19,803 Inventory, end of year 133,435 * 40 40,513 * 8,290 * 34,887 * 6,267 * 49,808 Advertising expenses 3,986 0 17,497 * 9,542 4,876 * 6,162 2,384 Car and truck expenses 59,276 0 36,521 * 8,185 15,475 * 23,606 11,243 Commissions * 3,387 0 10,795 0 * 4,057 * 6,736 * 475 Contract labor 148,594 0 * 26,514 * 32,712 * 1,122 * 68,810 * 16,266 Depletion 0 0 0 * 134 * 1 * 892 0 Depreciation 84,975 * 106 29,520 * 4,620 24,230 * 2,358 27,376 Employee benefit programs 3,666 * 12 * 3,145 * 163 * 2,206 * 325 * 1,224 Insurance 16,070 * 4 5,770 * 2,904 5,111 8,895 10,042 Legal and professional services 6,612 * 3 5,518 * 1,978 3,172 5,920 3,332 Meals and entertainment deducted 5,793 * 1 5,890 * 65 504 * 169 * 359 Mortgage interest 4,681 0 * 1,078 * 394 * 989 * 556 * 3,917 Other interest paid on business indebtedness 12,530 * 13 1,433 * 56 * 842 * 1,187 * 912 Office expenses 5,879 0 5,886 * 6,178 2,277 * 13,447 1,997 Pension and profit-sharing plans * 587 0 * 6,544 * 51 * 703 * 1,517 0 Rent paid on machinery and equipment 13,314 0 * 13,474 * 2,271 * 218 * 3,090 * 3,505 Rent paid on other business property 34,895 0 36,790 * 3,547 4,098 * 11,583 * 3,384 Repairs 51,443 * 3 10,948 * 907 6,638 7,500 10,054 Supplies 40,517 0 60,392 * 45,138 10,221 * 63,339 * 190 Salaries and wages 151,289 * 29 62,950 * 7,917 16,928 * 13,713 49,621 Taxes paid 26,431 0 23,106 * 2,815 4,450 3,863 9,288 Travel 7,014 * 12 7,969 * 392 4,192 * 739 746 Utilities 43,960 * 2 45,870 * 2,791 12,908 15,698 8,109 Other business deductions 196,383 * 39 80,213 * 3,757 34,459 23,284 15,991 Home office business deductions, total * 8,500 0 24,175 * 2,087 * 2,713 * 2,289 * 2,607 Depreciation, Form 8829 [3] * 773 0 * 2,589 0 * 266 0 * 341 Casualty loss, Form 8829 [3] 0 0 0 0 0 0 0 Excess—casualty depreciations, Form 8829 [3] 0 0 0 0 0 0 0Net income [1,2] 526,093 * 895 350,679 72,926 201,695 134,674 95,239Returns with Schedule C-EZ: Number of returns * 2,034 * 1,020 * 1,998 * 8 * 2,208 0 * 1,036 Business receipts * 20,169 * 485 * 7,075 * 2 * 23,607 0 * 12,526 Business deductions * 3,739 0 * 4,124 0 * 1,157 0 * 933 Net income * 16,429 * 485 * 2,951 * 2 * 22,450 0 * 11,593Footnotes at end of table.
Manufacturing—continued
Table 2. Nonfarm Sole Proprietorships: Income Statements, by Industrial Sectors, Tax Year 2014—Continued
Woodproducts
Paperproducts
Printingand related
supportactivities
Net income status, item Petroleumand coalproducts
Chemicalmanufacturing
Plastic andrubber products
Nonmetallicmineralproducts
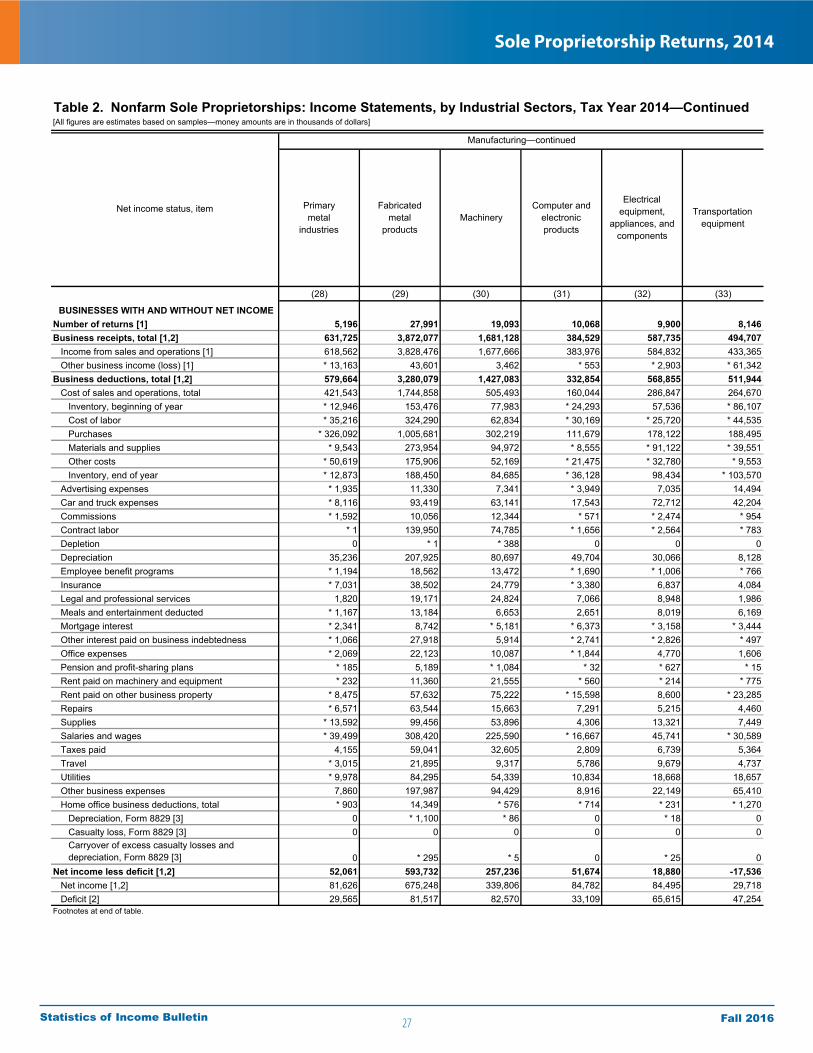
27
Sole Proprietorship Returns, 2014
Fall 2016Statistics of Income Bulletin
[All figures are estimates based on samples—money amounts are in thousands of dollars]
(28) (29) (30) (31) (32) (33)
BUSINESSES WITH AND WITHOUT NET INCOMENumber of returns [1] 5,196 27,991 19,093 10,068 9,900 8,146Business receipts, total [1,2] 631,725 3,872,077 1,681,128 384,529 587,735 494,707 Income from sales and operations [1] 618,562 3,828,476 1,677,666 383,976 584,832 433,365 Other business income (loss) [1] * 13,163 43,601 3,462 * 553 * 2,903 * 61,342Business deductions, total [1,2] 579,664 3,280,079 1,427,083 332,854 568,855 511,944 Cost of sales and operations, total 421,543 1,744,858 505,493 160,044 286,847 264,670 Inventory, beginning of year * 12,946 153,476 77,983 * 24,293 57,536 * 86,107 Cost of labor * 35,216 324,290 62,834 * 30,169 * 25,720 * 44,535 Purchases * 326,092 1,005,681 302,219 111,679 178,122 188,495 Materials and supplies * 9,543 273,954 94,972 * 8,555 * 91,122 * 39,551 Other costs * 50,619 175,906 52,169 * 21,475 * 32,780 * 9,553 Inventory, end of year * 12,873 188,450 84,685 * 36,128 98,434 * 103,570 Advertising expenses * 1,935 11,330 7,341 * 3,949 7,035 14,494 Car and truck expenses * 8,116 93,419 63,141 17,543 72,712 42,204 Commissions * 1,592 10,056 12,344 * 571 * 2,474 * 954 Contract labor * 1 139,950 74,785 * 1,656 * 2,564 * 783 Depletion 0 * 1 * 388 0 0 0 Depreciation 35,236 207,925 80,697 49,704 30,066 8,128 Employee benefit programs * 1,194 18,562 13,472 * 1,690 * 1,006 * 766 Insurance * 7,031 38,502 24,779 * 3,380 6,837 4,084 Legal and professional services 1,820 19,171 24,824 7,066 8,948 1,986 Meals and entertainment deducted * 1,167 13,184 6,653 2,651 8,019 6,169 Mortgage interest * 2,341 8,742 * 5,181 * 6,373 * 3,158 * 3,444 Other interest paid on business indebtedness * 1,066 27,918 5,914 * 2,741 * 2,826 * 497 Office expenses * 2,069 22,123 10,087 * 1,844 4,770 1,606 Pension and profit-sharing plans * 185 5,189 * 1,084 * 32 * 627 * 15 Rent paid on machinery and equipment * 232 11,360 21,555 * 560 * 214 * 775 Rent paid on other business property * 8,475 57,632 75,222 * 15,598 8,600 * 23,285 Repairs * 6,571 63,544 15,663 7,291 5,215 4,460 Supplies * 13,592 99,456 53,896 4,306 13,321 7,449 Salaries and wages * 39,499 308,420 225,590 * 16,667 45,741 * 30,589 Taxes paid 4,155 59,041 32,605 2,809 6,739 5,364 Travel * 3,015 21,895 9,317 5,786 9,679 4,737 Utilities * 9,978 84,295 54,339 10,834 18,668 18,657 Other business expenses 7,860 197,987 94,429 8,916 22,149 65,410 Home office business deductions, total * 903 14,349 * 576 * 714 * 231 * 1,270 Depreciation, Form 8829 [3] 0 * 1,100 * 86 0 * 18 0 Casualty loss, Form 8829 [3] 0 0 0 0 0 0 Carryover of excess casualty losses and depreciation, Form 8829 [3] 0 * 295 * 5 0 * 25 0Net income less deficit [1,2] 52,061 593,732 257,236 51,674 18,880 -17,536 Net income [1,2] 81,626 675,248 339,806 84,782 84,495 29,718 Deficit [2] 29,565 81,517 82,570 33,109 65,615 47,254Footnotes at end of table.
Manufacturing—continued
Table 2. Nonfarm Sole Proprietorships: Income Statements, by Industrial Sectors, Tax Year 2014—Continued
Net income status, item Primarymetal
industries
Fabricatedmetal
productsMachinery
Computer andelectronicproducts
Electricalequipment,
appliances, andcomponents
Transportationequipment

28
Sole Proprietorship Returns, 2014
Fall 2016Statistics of Income Bulletin
[All figures are estimates based on samples—money amounts are in thousands of dollars]
(28) (29) (30) (31) (32) (33)BUSINESSES WITH NET INCOME
Number of returns [1] 3,356 18,991 16,027 6,207 6,363 4,846Business receipts, total [1,2] 560,444 3,582,404 1,430,071 339,625 527,314 336,164 Income from sales and operations [1] 549,232 3,539,782 1,428,139 339,084 524,420 329,660 Other business income * 11,212 42,622 * 1,932 * 541 * 2,894 * 6,504Business deductions, total [1,2] * 478,818 2,908,890 1,090,265 254,843 442,819 306,445 Cost of sales and operations, total * 364,822 1,629,762 394,320 * 136,951 239,596 * 161,103 Inventory, beginning of year * 3,405 125,456 48,038 * 10,997 * 43,085 * 9,732 Cost of labor * 26,718 306,706 33,109 * 29,153 * 25,154 * 40,518 Purchases * 313,797 924,788 233,113 * 79,792 * 134,918 * 81,223 Materials and supplies * 3,375 261,727 89,358 * 2,776 * 90,951 * 39,084 Other costs * 20,932 169,526 38,758 * 20,653 * 20,156 * 4,482 Inventory, end of year * 3,405 158,440 48,056 * 6,420 74,667 * 13,937 Advertising expenses * 800 9,831 3,448 * 3,307 5,076 * 9,233 Car and truck expenses * 3,110 59,649 40,981 13,677 35,999 * 24,780 Commissions * 23 9,367 * 10,566 * 385 * 1,186 * 166 Contract labor 0 128,862 58,819 * 1,030 * 136 * 175 Depletion 0 * 1 0 0 0 0 Depreciation * 17,473 141,980 62,361 * 42,453 * 27,632 * 4,552 Employee benefit programs * 713 16,401 6,711 * 1,240 * 493 * 65 Insurance * 6,493 35,282 17,238 * 3,005 6,387 * 3,051 Legal and professional services * 1,357 15,714 20,335 * 3,850 7,317 * 881 Meals and entertainment deducted * 522 11,887 3,815 1,484 6,340 * 2,486 Mortgage interest * 184 7,599 * 4,549 0 * 2,157 * 3,437 Other interest paid on business indebtedness * 463 23,370 2,613 * 2,600 * 2,822 * 259 Office expenses * 1,148 19,124 5,612 1,214 4,307 * 335 Pension and profit-sharing plans * 151 5,102 * 895 * 19 * 583 0 Rent paid on machinery and equipment * 232 10,141 10,782 * 447 * 207 * 759 Rent paid on other business property * 8,224 36,830 60,347 * 9,050 * 7,704 * 17,630 Repairs * 5,599 59,063 9,695 * 536 * 5,072 * 818 Supplies * 13,035 92,635 28,716 * 792 11,094 * 3,164 Salaries and wages * 37,899 270,079 194,800 * 11,755 * 40,591 * 687 Taxes paid * 3,806 49,046 27,098 * 2,076 6,313 * 4,762 Travel * 1,154 17,717 3,493 * 4,936 7,649 * 2,237 Utilities * 6,147 68,860 39,863 * 7,465 14,306 * 15,317 Other business deductions * 4,471 177,243 74,939 * 6,369 9,218 49,128 Home office business deductions, total * 903 * 12,176 * 563 * 76 * 227 * 1,270 Depreciation, Form 8829 [3] 0 * 952 * 85 0 0 0 Casualty loss, Form 8829 [3] 0 0 0 0 0 0 Excess—casualty depreciations, Form 8829 [3] 0 0 0 0 0 0Net income [1,2] 81,626 675,248 339,806 84,782 84,495 29,718Returns with Schedule C-EZ: Number of returns * 40 * 1,553 * 4,058 * 2,078 * 2,037 * 136 Business receipts * 3,398 * 9,514 * 19,829 * 13,450 * 19,755 * 319 Business deductions * 87 * 1,168 * 7,707 * 127 * 408 * 148 Net income * 3,311 * 8,346 * 12,122 * 13,322 * 19,347 * 171Footnotes at end of table.
Manufacturing—continued
Table 2. Nonfarm Sole Proprietorships: Income Statements, by Industrial Sectors, Tax Year 2014—Continued
Primarymetal
industries
Fabricatedmetal
productsMachinery
Computer andelectronicproducts
Electricalequipment,
appliances, andcomponents
Transportationequipment
Net income status, item
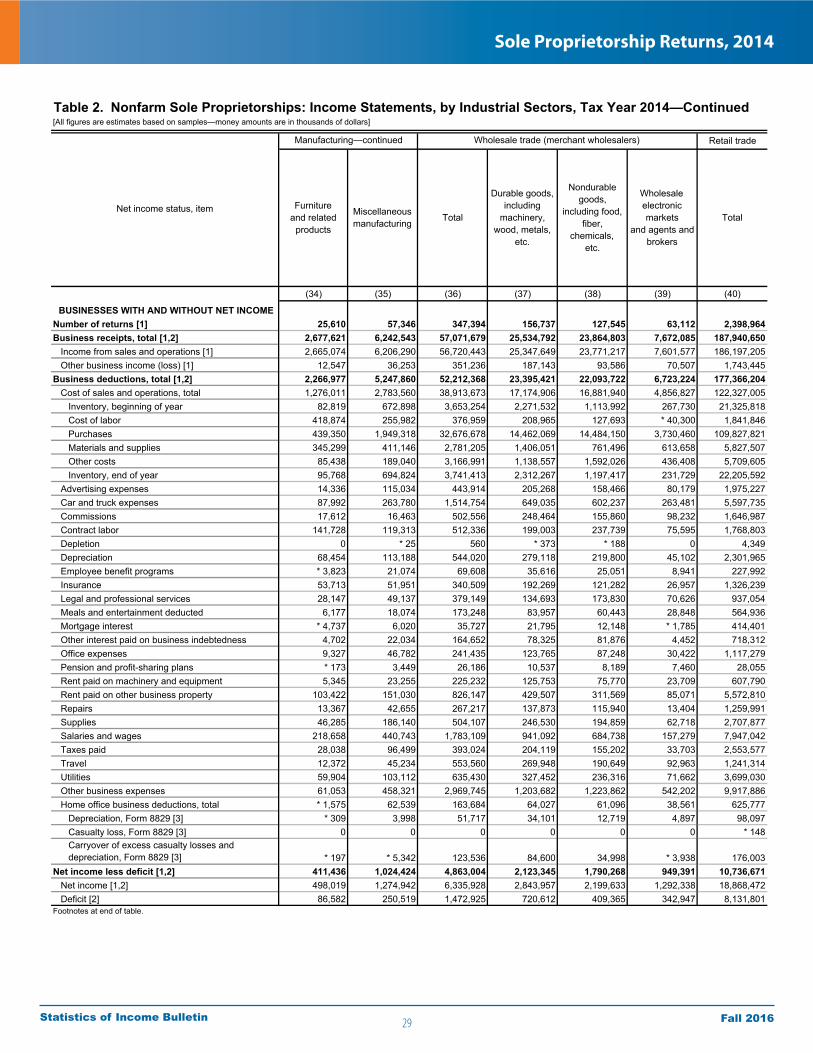
29
Sole Proprietorship Returns, 2014
Fall 2016Statistics of Income Bulletin
[All figures are estimates based on samples—money amounts are in thousands of dollars]
Retail trade
(34) (35) (36) (37) (38) (39) (40)
BUSINESSES WITH AND WITHOUT NET INCOMENumber of returns [1] 25,610 57,346 347,394 156,737 127,545 63,112 2,398,964Business receipts, total [1,2] 2,677,621 6,242,543 57,071,679 25,534,792 23,864,803 7,672,085 187,940,650 Income from sales and operations [1] 2,665,074 6,206,290 56,720,443 25,347,649 23,771,217 7,601,577 186,197,205 Other business income (loss) [1] 12,547 36,253 351,236 187,143 93,586 70,507 1,743,445Business deductions, total [1,2] 2,266,977 5,247,860 52,212,368 23,395,421 22,093,722 6,723,224 177,366,204 Cost of sales and operations, total 1,276,011 2,783,560 38,913,673 17,174,906 16,881,940 4,856,827 122,327,005 Inventory, beginning of year 82,819 672,898 3,653,254 2,271,532 1,113,992 267,730 21,325,818 Cost of labor 418,874 255,982 376,959 208,965 127,693 * 40,300 1,841,846 Purchases 439,350 1,949,318 32,676,678 14,462,069 14,484,150 3,730,460 109,827,821 Materials and supplies 345,299 411,146 2,781,205 1,406,051 761,496 613,658 5,827,507 Other costs 85,438 189,040 3,166,991 1,138,557 1,592,026 436,408 5,709,605 Inventory, end of year 95,768 694,824 3,741,413 2,312,267 1,197,417 231,729 22,205,592 Advertising expenses 14,336 115,034 443,914 205,268 158,466 80,179 1,975,227 Car and truck expenses 87,992 263,780 1,514,754 649,035 602,237 263,481 5,597,735 Commissions 17,612 16,463 502,556 248,464 155,860 98,232 1,646,987 Contract labor 141,728 119,313 512,336 199,003 237,739 75,595 1,768,803 Depletion 0 * 25 560 * 373 * 188 0 4,349 Depreciation 68,454 113,188 544,020 279,118 219,800 45,102 2,301,965 Employee benefit programs * 3,823 21,074 69,608 35,616 25,051 8,941 227,992 Insurance 53,713 51,951 340,509 192,269 121,282 26,957 1,326,239 Legal and professional services 28,147 49,137 379,149 134,693 173,830 70,626 937,054 Meals and entertainment deducted 6,177 18,074 173,248 83,957 60,443 28,848 564,936 Mortgage interest * 4,737 6,020 35,727 21,795 12,148 * 1,785 414,401 Other interest paid on business indebtedness 4,702 22,034 164,652 78,325 81,876 4,452 718,312 Office expenses 9,327 46,782 241,435 123,765 87,248 30,422 1,117,279 Pension and profit-sharing plans * 173 3,449 26,186 10,537 8,189 7,460 28,055 Rent paid on machinery and equipment 5,345 23,255 225,232 125,753 75,770 23,709 607,790 Rent paid on other business property 103,422 151,030 826,147 429,507 311,569 85,071 5,572,810 Repairs 13,367 42,655 267,217 137,873 115,940 13,404 1,259,991 Supplies 46,285 186,140 504,107 246,530 194,859 62,718 2,707,877 Salaries and wages 218,658 440,743 1,783,109 941,092 684,738 157,279 7,947,042 Taxes paid 28,038 96,499 393,024 204,119 155,202 33,703 2,553,577 Travel 12,372 45,234 553,560 269,948 190,649 92,963 1,241,314 Utilities 59,904 103,112 635,430 327,452 236,316 71,662 3,699,030 Other business expenses 61,053 458,321 2,969,745 1,203,682 1,223,862 542,202 9,917,886 Home office business deductions, total * 1,575 62,539 163,684 64,027 61,096 38,561 625,777 Depreciation, Form 8829 [3] * 309 3,998 51,717 34,101 12,719 4,897 98,097 Casualty loss, Form 8829 [3] 0 0 0 0 0 0 * 148 Carryover of excess casualty losses and depreciation, Form 8829 [3] * 197 * 5,342 123,536 84,600 34,998 * 3,938 176,003Net income less deficit [1,2] 411,436 1,024,424 4,863,004 2,123,345 1,790,268 949,391 10,736,671 Net income [1,2] 498,019 1,274,942 6,335,928 2,843,957 2,199,633 1,292,338 18,868,472 Deficit [2] 86,582 250,519 1,472,925 720,612 409,365 342,947 8,131,801Footnotes at end of table.
Manufacturing—continued
Table 2. Nonfarm Sole Proprietorships: Income Statements, by Industrial Sectors, Tax Year 2014—Continued
Wholesale trade (merchant wholesalers)
Furnitureand related
products
Miscellaneousmanufacturing Total
Durable goods,including
machinery,wood, metals,
etc.
Net income status, item
Nondurablegoods,
including food,fiber,
chemicals,etc.
Wholesaleelectronicmarkets
and agents andbrokers
Total

30
Sole Proprietorship Returns, 2014
Fall 2016Statistics of Income Bulletin
[All figures are estimates based on samples—money amounts are in thousands of dollars]
Retail trade
(34) (35) (36) (37) (38) (39) (40)BUSINESSES WITH NET INCOME
Number of returns [1] 16,648 34,345 227,506 92,859 87,345 47,302 1,309,387Business receipts, total [1,2] 2,094,886 5,411,342 49,556,101 21,393,945 21,390,720 6,771,436 149,849,784 Income from sales and operations [1] 2,082,488 5,387,865 49,300,708 21,281,767 21,317,753 6,701,188 148,428,094 Other business income * 12,398 23,478 255,393 112,178 72,967 70,248 1,421,690Business deductions, total [1,2] 1,596,867 4,136,400 43,221,920 18,549,998 19,192,599 5,479,322 130,986,125 Cost of sales and operations, total 923,269 2,275,613 33,215,810 14,055,118 15,078,601 4,082,091 95,346,835 Inventory, beginning of year 61,310 488,639 2,577,279 1,452,604 918,263 206,412 13,420,372 Cost of labor * 299,642 226,516 290,573 155,350 114,267 * 20,957 1,325,113 Purchases 343,856 1,577,967 28,208,003 11,887,606 13,123,665 3,196,733 86,112,004 Materials and supplies 219,071 379,435 2,128,769 1,206,321 482,025 440,422 4,498,525 Other costs * 58,207 146,504 2,778,745 958,908 1,417,080 402,757 4,546,089 Inventory, end of year 58,816 543,449 2,767,560 1,605,671 976,699 185,190 14,555,268 Advertising expenses 6,752 90,786 297,838 164,094 79,446 54,298 1,239,177 Car and truck expenses 60,284 181,121 1,174,957 438,441 498,485 238,031 3,184,278 Commissions * 3,192 13,231 429,267 220,054 126,057 83,156 1,194,442 Contract labor 124,495 81,246 424,583 164,465 185,557 74,561 1,299,113 Depletion 0 * 24 * 395 * 245 * 150 0 3,448 Depreciation 37,229 88,967 327,993 130,812 159,760 37,420 1,290,682 Employee benefit programs * 3,728 18,061 57,079 28,434 19,871 8,774 173,606 Insurance 43,001 38,745 269,594 148,934 96,432 24,229 917,045 Legal and professional services 10,645 34,758 248,766 93,111 128,885 26,771 562,482 Meals and entertainment deducted 4,935 14,922 140,484 66,996 49,044 24,445 347,982 Mortgage interest * 318 2,887 30,034 18,633 9,734 * 1,666 267,797 Other interest paid on business indebtedness * 3,772 19,062 121,243 44,608 73,124 3,512 410,425 Office expenses 6,808 35,729 179,142 80,979 74,280 23,884 693,346 Pension and profit-sharing plans * 173 3,344 25,811 10,353 7,998 7,460 25,414 Rent paid on machinery and equipment * 5,232 10,685 186,113 107,081 55,589 23,443 399,773 Rent paid on other business property 55,447 116,491 625,256 330,848 241,605 52,803 3,615,191 Repairs 8,882 20,133 202,004 94,579 95,981 11,444 830,976 Supplies 27,360 163,337 397,754 183,147 158,893 55,714 1,520,276 Salaries and wages 154,441 337,701 1,379,841 669,259 559,466 151,117 5,819,329 Taxes paid 18,769 79,518 299,069 154,118 112,768 32,183 1,821,015 Travel 11,389 35,272 400,206 191,369 128,884 79,953 716,994 Utilities 40,011 80,548 454,183 228,377 179,801 46,005 2,207,029 Other business deductions 45,414 335,448 2,194,660 885,415 1,013,394 295,851 6,417,975 Home office business deductions, total * 1,296 50,323 111,780 32,215 42,100 37,465 408,330 Depreciation, Form 8829 [3] * 112 * 2,569 15,957 3,786 8,266 3,905 41,413 Casualty loss, Form 8829 [3] 0 0 0 0 0 0 0 Excess—casualty depreciations, Form 8829 [3] 0 0 * 863 * 114 * 323 * 426 20,773Net income [1,2] 498,019 1,274,942 6,335,928 2,843,957 2,199,633 1,292,338 18,868,472Returns with Schedule C-EZ: Number of returns * 2,015 4,521 38,655 16,786 15,990 5,879 320,617 Business receipts * 5,078 40,494 244,500 95,172 118,444 30,885 1,912,986 Business deductions * 25 * 8,449 28,964 8,316 17,603 3,045 278,362 Net income * 5,053 32,045 215,536 86,856 100,840 27,839 1,634,624Footnotes at end of table.
Manufacturing—continued
Table 2. Nonfarm Sole Proprietorships: Income Statements, by Industrial Sectors, Tax Year 2014—Continued
TotalFurniture
and relatedproducts
Miscellaneousmanufacturing Total
Durable goods,including
machinery,wood, metals,
etc.
Nondurablegoods,
including food,fiber,
chemicals,etc.
Wholesaleelectronicmarkets
and agents andbrokers
Net income status, item
Wholesale trade (merchant wholesalers)
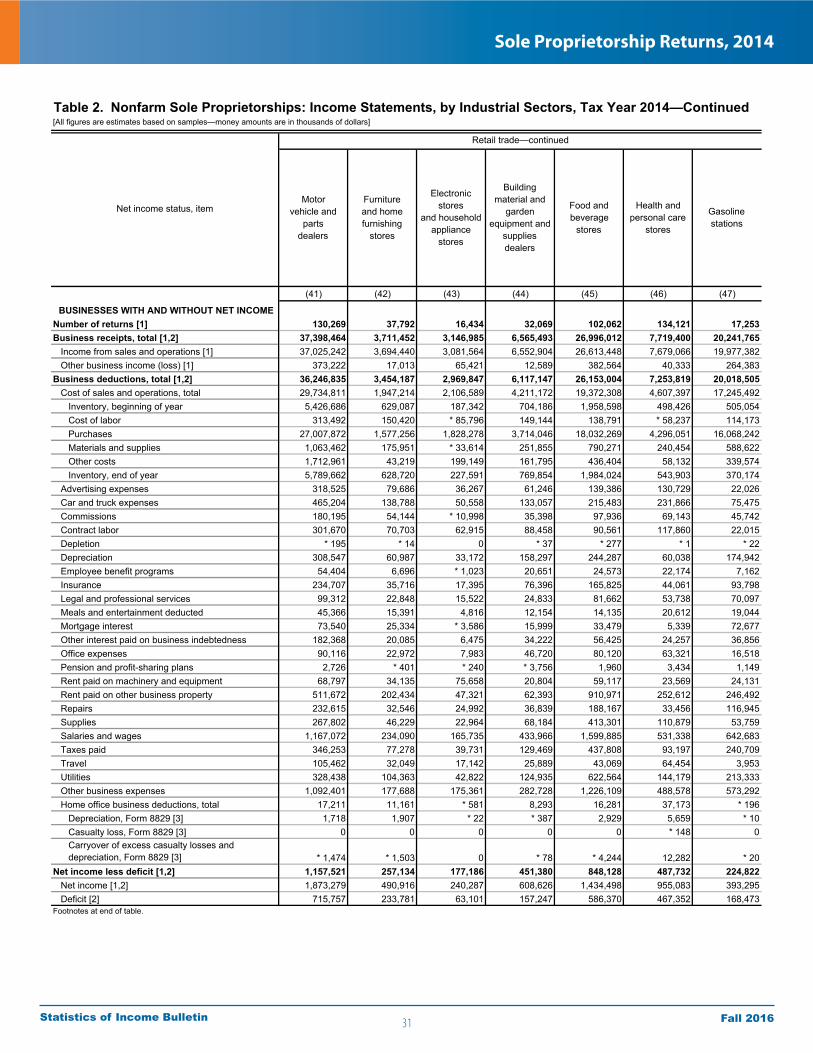
31
Sole Proprietorship Returns, 2014
Fall 2016Statistics of Income Bulletin
[All figures are estimates based on samples—money amounts are in thousands of dollars]
(41) (42) (43) (44) (45) (46) (47)
BUSINESSES WITH AND WITHOUT NET INCOMENumber of returns [1] 130,269 37,792 16,434 32,069 102,062 134,121 17,253Business receipts, total [1,2] 37,398,464 3,711,452 3,146,985 6,565,493 26,996,012 7,719,400 20,241,765 Income from sales and operations [1] 37,025,242 3,694,440 3,081,564 6,552,904 26,613,448 7,679,066 19,977,382 Other business income (loss) [1] 373,222 17,013 65,421 12,589 382,564 40,333 264,383Business deductions, total [1,2] 36,246,835 3,454,187 2,969,847 6,117,147 26,153,004 7,253,819 20,018,505 Cost of sales and operations, total 29,734,811 1,947,214 2,106,589 4,211,172 19,372,308 4,607,397 17,245,492 Inventory, beginning of year 5,426,686 629,087 187,342 704,186 1,958,598 498,426 505,054 Cost of labor 313,492 150,420 * 85,796 149,144 138,791 * 58,237 114,173 Purchases 27,007,872 1,577,256 1,828,278 3,714,046 18,032,269 4,296,051 16,068,242 Materials and supplies 1,063,462 175,951 * 33,614 251,855 790,271 240,454 588,622 Other costs 1,712,961 43,219 199,149 161,795 436,404 58,132 339,574 Inventory, end of year 5,789,662 628,720 227,591 769,854 1,984,024 543,903 370,174 Advertising expenses 318,525 79,686 36,267 61,246 139,386 130,729 22,026 Car and truck expenses 465,204 138,788 50,558 133,057 215,483 231,866 75,475 Commissions 180,195 54,144 * 10,998 35,398 97,936 69,143 45,742 Contract labor 301,670 70,703 62,915 88,458 90,561 117,860 22,015 Depletion * 195 * 14 0 * 37 * 277 * 1 * 22 Depreciation 308,547 60,987 33,172 158,297 244,287 60,038 174,942 Employee benefit programs 54,404 6,696 * 1,023 20,651 24,573 22,174 7,162 Insurance 234,707 35,716 17,395 76,396 165,825 44,061 93,798 Legal and professional services 99,312 22,848 15,522 24,833 81,662 53,738 70,097 Meals and entertainment deducted 45,366 15,391 4,816 12,154 14,135 20,612 19,044 Mortgage interest 73,540 25,334 * 3,586 15,999 33,479 5,339 72,677 Other interest paid on business indebtedness 182,368 20,085 6,475 34,222 56,425 24,257 36,856 Office expenses 90,116 22,972 7,983 46,720 80,120 63,321 16,518 Pension and profit-sharing plans 2,726 * 401 * 240 * 3,756 1,960 3,434 1,149 Rent paid on machinery and equipment 68,797 34,135 75,658 20,804 59,117 23,569 24,131 Rent paid on other business property 511,672 202,434 47,321 62,393 910,971 252,612 246,492 Repairs 232,615 32,546 24,992 36,839 188,167 33,456 116,945 Supplies 267,802 46,229 22,964 68,184 413,301 110,879 53,759 Salaries and wages 1,167,072 234,090 165,735 433,966 1,599,885 531,338 642,683 Taxes paid 346,253 77,278 39,731 129,469 437,808 93,197 240,709 Travel 105,462 32,049 17,142 25,889 43,069 64,454 3,953 Utilities 328,438 104,363 42,822 124,935 622,564 144,179 213,333 Other business expenses 1,092,401 177,688 175,361 282,728 1,226,109 488,578 573,292 Home office business deductions, total 17,211 11,161 * 581 8,293 16,281 37,173 * 196 Depreciation, Form 8829 [3] 1,718 1,907 * 22 * 387 2,929 5,659 * 10 Casualty loss, Form 8829 [3] 0 0 0 0 0 * 148 0 Carryover of excess casualty losses and depreciation, Form 8829 [3] * 1,474 * 1,503 0 * 78 * 4,244 12,282 * 20Net income less deficit [1,2] 1,157,521 257,134 177,186 451,380 848,128 487,732 224,822 Net income [1,2] 1,873,279 490,916 240,287 608,626 1,434,498 955,083 393,295 Deficit [2] 715,757 233,781 63,101 157,247 586,370 467,352 168,473Footnotes at end of table.
Retail trade—continued
Table 2. Nonfarm Sole Proprietorships: Income Statements, by Industrial Sectors, Tax Year 2014—Continued
Furnitureand homefurnishing
stores
Electronicstores
and householdappliance
stores
Buildingmaterial and
gardenequipment and
suppliesdealers
Food andbeverage
stores
Motorvehicle and
partsdealers
Net income status, item Health andpersonal care
stores
Gasolinestations
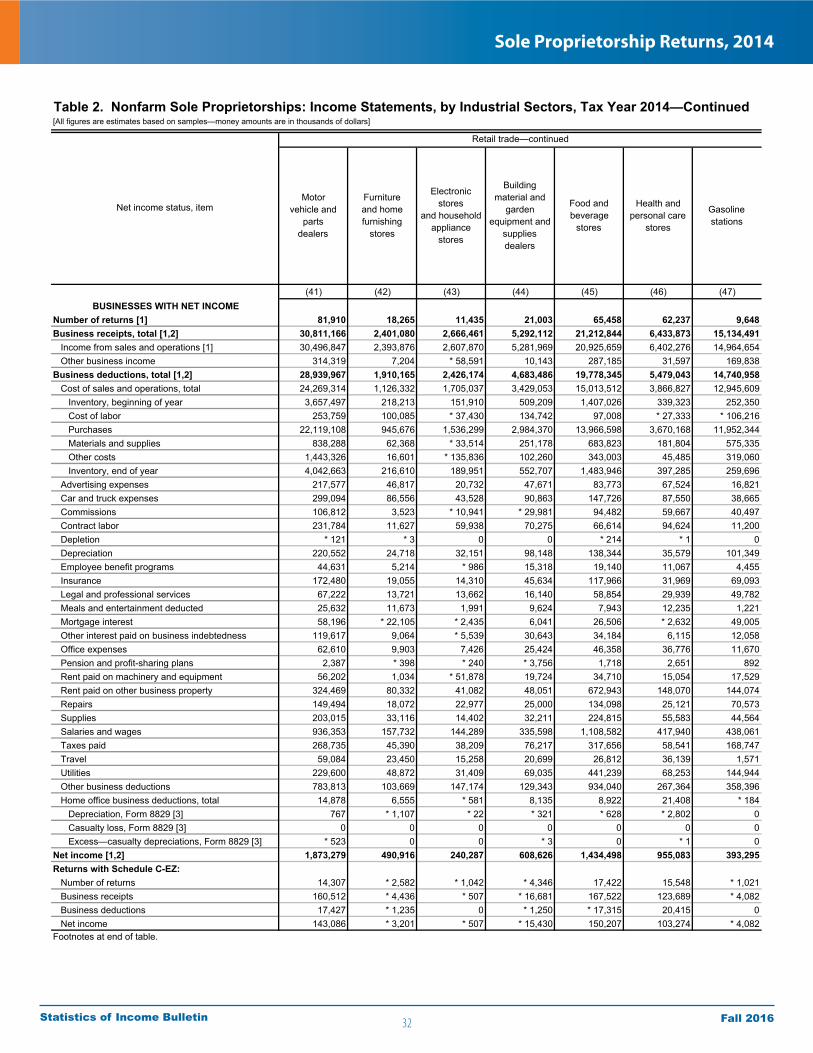
32
Sole Proprietorship Returns, 2014
Fall 2016Statistics of Income Bulletin
[All figures are estimates based on samples—money amounts are in thousands of dollars]
(41) (42) (43) (44) (45) (46) (47)BUSINESSES WITH NET INCOME
Number of returns [1] 81,910 18,265 11,435 21,003 65,458 62,237 9,648Business receipts, total [1,2] 30,811,166 2,401,080 2,666,461 5,292,112 21,212,844 6,433,873 15,134,491 Income from sales and operations [1] 30,496,847 2,393,876 2,607,870 5,281,969 20,925,659 6,402,276 14,964,654 Other business income 314,319 7,204 * 58,591 10,143 287,185 31,597 169,838Business deductions, total [1,2] 28,939,967 1,910,165 2,426,174 4,683,486 19,778,345 5,479,043 14,740,958 Cost of sales and operations, total 24,269,314 1,126,332 1,705,037 3,429,053 15,013,512 3,866,827 12,945,609 Inventory, beginning of year 3,657,497 218,213 151,910 509,209 1,407,026 339,323 252,350 Cost of labor 253,759 100,085 * 37,430 134,742 97,008 * 27,333 * 106,216 Purchases 22,119,108 945,676 1,536,299 2,984,370 13,966,598 3,670,168 11,952,344 Materials and supplies 838,288 62,368 * 33,514 251,178 683,823 181,804 575,335 Other costs 1,443,326 16,601 * 135,836 102,260 343,003 45,485 319,060 Inventory, end of year 4,042,663 216,610 189,951 552,707 1,483,946 397,285 259,696 Advertising expenses 217,577 46,817 20,732 47,671 83,773 67,524 16,821 Car and truck expenses 299,094 86,556 43,528 90,863 147,726 87,550 38,665 Commissions 106,812 3,523 * 10,941 * 29,981 94,482 59,667 40,497 Contract labor 231,784 11,627 59,938 70,275 66,614 94,624 11,200 Depletion * 121 * 3 0 0 * 214 * 1 0 Depreciation 220,552 24,718 32,151 98,148 138,344 35,579 101,349 Employee benefit programs 44,631 5,214 * 986 15,318 19,140 11,067 4,455 Insurance 172,480 19,055 14,310 45,634 117,966 31,969 69,093 Legal and professional services 67,222 13,721 13,662 16,140 58,854 29,939 49,782 Meals and entertainment deducted 25,632 11,673 1,991 9,624 7,943 12,235 1,221 Mortgage interest 58,196 * 22,105 * 2,435 6,041 26,506 * 2,632 49,005 Other interest paid on business indebtedness 119,617 9,064 * 5,539 30,643 34,184 6,115 12,058 Office expenses 62,610 9,903 7,426 25,424 46,358 36,776 11,670 Pension and profit-sharing plans 2,387 * 398 * 240 * 3,756 1,718 2,651 892 Rent paid on machinery and equipment 56,202 1,034 * 51,878 19,724 34,710 15,054 17,529 Rent paid on other business property 324,469 80,332 41,082 48,051 672,943 148,070 144,074 Repairs 149,494 18,072 22,977 25,000 134,098 25,121 70,573 Supplies 203,015 33,116 14,402 32,211 224,815 55,583 44,564 Salaries and wages 936,353 157,732 144,289 335,598 1,108,582 417,940 438,061 Taxes paid 268,735 45,390 38,209 76,217 317,656 58,541 168,747 Travel 59,084 23,450 15,258 20,699 26,812 36,139 1,571 Utilities 229,600 48,872 31,409 69,035 441,239 68,253 144,944 Other business deductions 783,813 103,669 147,174 129,343 934,040 267,364 358,396 Home office business deductions, total 14,878 6,555 * 581 8,135 8,922 21,408 * 184 Depreciation, Form 8829 [3] 767 * 1,107 * 22 * 321 * 628 * 2,802 0 Casualty loss, Form 8829 [3] 0 0 0 0 0 0 0 Excess—casualty depreciations, Form 8829 [3] * 523 0 0 * 3 0 * 1 0Net income [1,2] 1,873,279 490,916 240,287 608,626 1,434,498 955,083 393,295Returns with Schedule C-EZ: Number of returns 14,307 * 2,582 * 1,042 * 4,346 17,422 15,548 * 1,021 Business receipts 160,512 * 4,436 * 507 * 16,681 167,522 123,689 * 4,082 Business deductions 17,427 * 1,235 0 * 1,250 * 17,315 20,415 0 Net income 143,086 * 3,201 * 507 * 15,430 150,207 103,274 * 4,082Footnotes at end of table.
Retail trade—continued
Table 2. Nonfarm Sole Proprietorships: Income Statements, by Industrial Sectors, Tax Year 2014—Continued
Health andpersonal care
stores
Gasolinestations
Motorvehicle and
partsdealers
Furnitureand homefurnishing
stores
Electronicstores
and householdappliance
stores
Buildingmaterial and
gardenequipment and
suppliesdealers
Food andbeverage
stores
Net income status, item

33
Sole Proprietorship Returns, 2014
Fall 2016Statistics of Income Bulletin
[All figures are estimates based on samples—money amounts are in thousands of dollars]
(48) (49) (50) (51) (52) (53) (54)
BUSINESSES WITH AND WITHOUT NET INCOMENumber of returns [1] 145,553 106,266 30,816 659,997 986,333 1,295,553 17,962Business receipts, total [1,2] 9,465,472 6,887,282 2,913,642 32,897,595 29,997,088 105,858,083 1,426,202 Income from sales and operations [1] 9,403,483 6,840,506 2,901,437 32,690,085 29,737,648 104,798,030 1,366,580 Other business income (loss) [1] 61,989 46,776 12,206 207,510 259,441 1,060,053 59,622Business deductions, total [1,2] 8,722,548 6,594,984 2,854,977 30,124,342 26,856,010 91,052,302 1,657,749 Cost of sales and operations, total 4,980,869 3,999,566 2,084,448 17,670,688 14,366,452 12,010,530 460,734 Inventory, beginning of year 1,967,815 2,065,944 395,114 4,632,646 2,354,919 302,751 30,206 Cost of labor 48,948 35,206 * 34,166 387,713 325,759 2,005,112 13,567 Purchases 4,359,456 3,651,511 1,927,709 14,856,279 12,508,850 3,405,792 26,412 Materials and supplies 417,417 313,649 72,943 1,223,342 655,928 1,182,689 216,680 Other costs 93,499 171,334 117,975 1,296,208 1,079,354 5,386,278 200,355 Inventory, end of year 1,906,267 2,238,079 463,460 4,725,500 2,558,359 272,091 26,485 Advertising expenses 194,304 79,378 23,033 445,933 444,714 304,343 12,380 Car and truck expenses 217,951 160,668 75,775 1,377,737 2,455,172 27,588,251 25,037 Commissions 27,922 57,534 * 28,416 326,131 713,427 1,390,700 24,122 Contract labor 77,187 79,653 33,457 327,234 497,090 6,919,692 32,251 Depletion * 403 * 3,036 0 327 * 36 14,766 * 60 Depreciation 91,182 102,692 25,735 566,763 475,322 5,635,180 335,171 Employee benefit programs 14,538 12,060 * 3,946 36,049 24,715 82,857 9,642 Insurance 118,552 62,193 18,311 291,935 167,351 3,398,339 31,314 Legal and professional services 65,936 39,262 8,466 257,283 198,095 390,407 18,128 Meals and entertainment deducted 61,725 20,159 4,639 153,421 193,473 2,231,446 4,313 Mortgage interest 11,758 59,130 * 2,668 89,886 21,006 226,017 18,466 Other interest paid on business indebtedness 40,391 37,063 7,500 164,253 108,418 481,716 25,180 Office expenses 105,885 62,616 13,819 269,357 337,851 447,673 9,825 Pension and profit-sharing plans 2,113 * 680 * 448 7,911 3,236 10,261 * 107 Rent paid on machinery and equipment 37,659 22,225 13,156 141,063 87,475 3,364,206 20,561 Rent paid on other business property 765,036 312,175 143,959 1,570,323 547,424 859,901 23,423 Repairs 58,656 54,413 28,347 290,275 162,743 6,044,361 97,148 Supplies 172,969 139,716 11,207 685,936 714,933 1,434,033 6,125 Salaries and wages 606,784 324,459 51,244 1,685,969 503,817 3,335,954 122,679 Taxes paid 170,091 138,352 39,485 597,827 243,378 1,474,568 17,362 Travel 76,232 44,048 11,778 334,293 482,946 1,039,819 48,421 Utilities 257,217 203,917 80,783 899,763 676,716 1,537,359 13,754 Other business expenses 508,057 528,461 131,880 1,686,376 3,046,955 10,426,620 272,713 Home office business deductions, total 46,871 46,120 * 10,851 134,762 296,278 227,959 23,983 Depreciation, Form 8829 [3] 12,468 5,659 * 2,105 14,323 50,910 24,410 * 983 Casualty loss, Form 8829 [3] 0 0 0 0 0 0 0 Carryover of excess casualty losses and depreciation, Form 8829 [3] 12,542 18,282 * 2,009 28,905 94,663 13,772 * 414Net income less deficit [1,2] 743,115 323,431 63,823 2,791,528 3,210,870 14,914,387 -195,976 Net income [1,2] 1,298,802 687,080 243,946 4,833,435 5,809,225 17,746,094 189,789 Deficit [2] 555,687 363,649 180,122 2,041,907 2,598,355 2,831,707 385,765Footnotes at end of table.
Table 2. Nonfarm Sole Proprietorships: Income Statements, by Industrial Sectors, Tax Year 2014—Continued
Retail trade—continued
Generalmerchandise
stores
Miscellaneousstore
retailers
Nonstoreretailers Total
Clothing andaccessories
stores
Sporting goods,hobby, book,and music
stores
Net income status, item
Transportation and warehousing
Air andrail
transportation
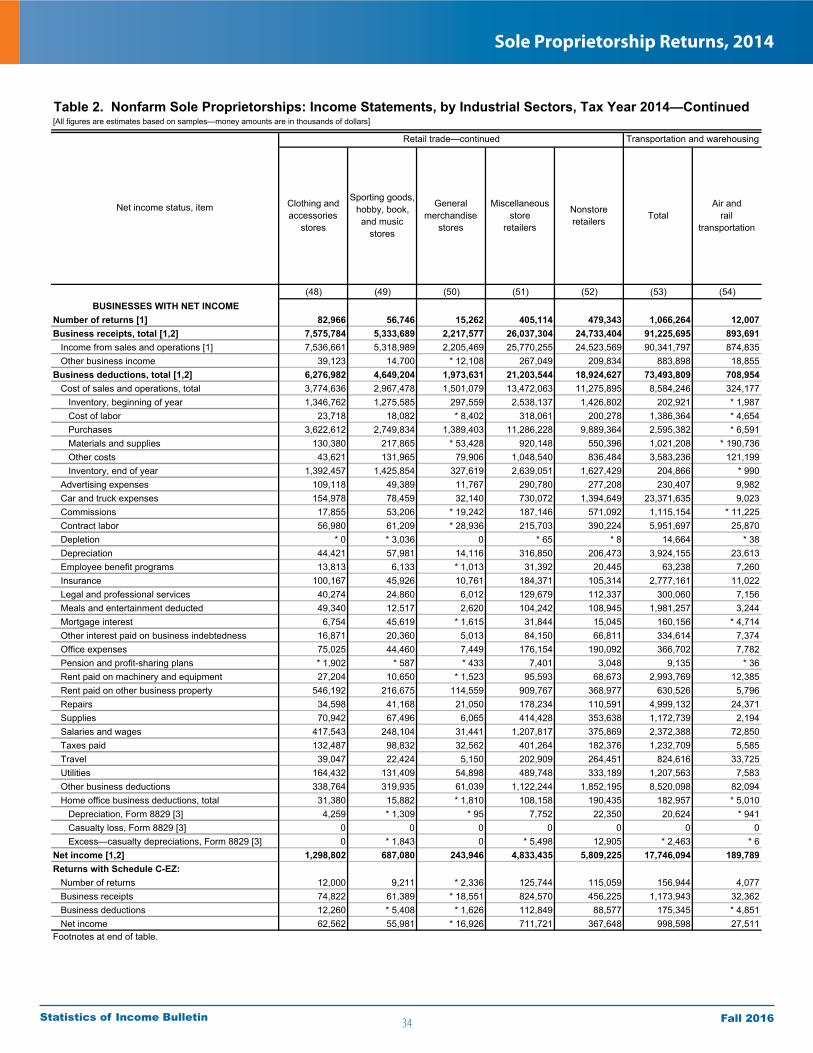
34
Sole Proprietorship Returns, 2014
Fall 2016Statistics of Income Bulletin
[All figures are estimates based on samples—money amounts are in thousands of dollars]
(48) (49) (50) (51) (52) (53) (54)BUSINESSES WITH NET INCOME
Number of returns [1] 82,966 56,746 15,262 405,114 479,343 1,066,264 12,007Business receipts, total [1,2] 7,575,784 5,333,689 2,217,577 26,037,304 24,733,404 91,225,695 893,691 Income from sales and operations [1] 7,536,661 5,318,989 2,205,469 25,770,255 24,523,569 90,341,797 874,835 Other business income 39,123 14,700 * 12,108 267,049 209,834 883,898 18,855Business deductions, total [1,2] 6,276,982 4,649,204 1,973,631 21,203,544 18,924,627 73,493,809 708,954 Cost of sales and operations, total 3,774,636 2,967,478 1,501,079 13,472,063 11,275,895 8,584,246 324,177 Inventory, beginning of year 1,346,762 1,275,585 297,559 2,538,137 1,426,802 202,921 * 1,987 Cost of labor 23,718 18,082 * 8,402 318,061 200,278 1,386,364 * 4,654 Purchases 3,622,612 2,749,834 1,389,403 11,286,228 9,889,364 2,595,382 * 6,591 Materials and supplies 130,380 217,865 * 53,428 920,148 550,396 1,021,208 * 190,736 Other costs 43,621 131,965 79,906 1,048,540 836,484 3,583,236 121,199 Inventory, end of year 1,392,457 1,425,854 327,619 2,639,051 1,627,429 204,866 * 990 Advertising expenses 109,118 49,389 11,767 290,780 277,208 230,407 9,982 Car and truck expenses 154,978 78,459 32,140 730,072 1,394,649 23,371,635 9,023 Commissions 17,855 53,206 * 19,242 187,146 571,092 1,115,154 * 11,225 Contract labor 56,980 61,209 * 28,936 215,703 390,224 5,951,697 25,870 Depletion * 0 * 3,036 0 * 65 * 8 14,664 * 38 Depreciation 44,421 57,981 14,116 316,850 206,473 3,924,155 23,613 Employee benefit programs 13,813 6,133 * 1,013 31,392 20,445 63,238 7,260 Insurance 100,167 45,926 10,761 184,371 105,314 2,777,161 11,022 Legal and professional services 40,274 24,860 6,012 129,679 112,337 300,060 7,156 Meals and entertainment deducted 49,340 12,517 2,620 104,242 108,945 1,981,257 3,244 Mortgage interest 6,754 45,619 * 1,615 31,844 15,045 160,156 * 4,714 Other interest paid on business indebtedness 16,871 20,360 5,013 84,150 66,811 334,614 7,374 Office expenses 75,025 44,460 7,449 176,154 190,092 366,702 7,782 Pension and profit-sharing plans * 1,902 * 587 * 433 7,401 3,048 9,135 * 36 Rent paid on machinery and equipment 27,204 10,650 * 1,523 95,593 68,673 2,993,769 12,385 Rent paid on other business property 546,192 216,675 114,559 909,767 368,977 630,526 5,796 Repairs 34,598 41,168 21,050 178,234 110,591 4,999,132 24,371 Supplies 70,942 67,496 6,065 414,428 353,638 1,172,739 2,194 Salaries and wages 417,543 248,104 31,441 1,207,817 375,869 2,372,388 72,850 Taxes paid 132,487 98,832 32,562 401,264 182,376 1,232,709 5,585 Travel 39,047 22,424 5,150 202,909 264,451 824,616 33,725 Utilities 164,432 131,409 54,898 489,748 333,189 1,207,563 7,583 Other business deductions 338,764 319,935 61,039 1,122,244 1,852,195 8,520,098 82,094 Home office business deductions, total 31,380 15,882 * 1,810 108,158 190,435 182,957 * 5,010 Depreciation, Form 8829 [3] 4,259 * 1,309 * 95 7,752 22,350 20,624 * 941 Casualty loss, Form 8829 [3] 0 0 0 0 0 0 0 Excess—casualty depreciations, Form 8829 [3] 0 * 1,843 0 * 5,498 12,905 * 2,463 * 6Net income [1,2] 1,298,802 687,080 243,946 4,833,435 5,809,225 17,746,094 189,789Returns with Schedule C-EZ: Number of returns 12,000 9,211 * 2,336 125,744 115,059 156,944 4,077 Business receipts 74,822 61,389 * 18,551 824,570 456,225 1,173,943 32,362 Business deductions 12,260 * 5,408 * 1,626 112,849 88,577 175,345 * 4,851 Net income 62,562 55,981 * 16,926 711,721 367,648 998,598 27,511Footnotes at end of table.
Retail trade—continued Transportation and warehousing
Table 2. Nonfarm Sole Proprietorships: Income Statements, by Industrial Sectors, Tax Year 2014—Continued
Nonstoreretailers Total
Air andrail
transportation
Clothing andaccessories
stores
Sporting goods,hobby, book,and music
stores
Generalmerchandise
stores
Miscellaneousstore
retailers
Net income status, item
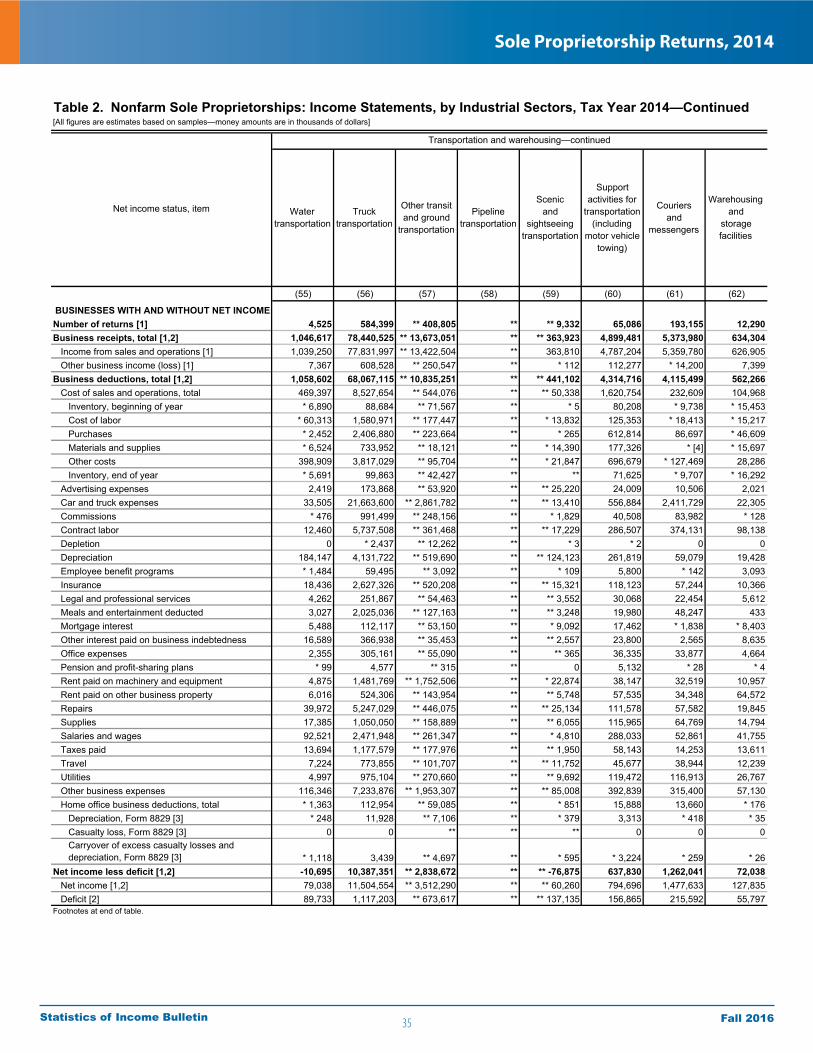
35
Sole Proprietorship Returns, 2014
Fall 2016Statistics of Income Bulletin
[All figures are estimates based on samples—money amounts are in thousands of dollars]
(55) (56) (57) (58) (59) (60) (61) (62)
BUSINESSES WITH AND WITHOUT NET INCOMENumber of returns [1] 4,525 584,399 ** 408,805 ** ** 9,332 65,086 193,155 12,290Business receipts, total [1,2] 1,046,617 78,440,525 ** 13,673,051 ** ** 363,923 4,899,481 5,373,980 634,304 Income from sales and operations [1] 1,039,250 77,831,997 ** 13,422,504 ** 363,810 4,787,204 5,359,780 626,905 Other business income (loss) [1] 7,367 608,528 ** 250,547 ** * 112 112,277 * 14,200 7,399Business deductions, total [1,2] 1,058,602 68,067,115 ** 10,835,251 ** ** 441,102 4,314,716 4,115,499 562,266 Cost of sales and operations, total 469,397 8,527,654 ** 544,076 ** ** 50,338 1,620,754 232,609 104,968 Inventory, beginning of year * 6,890 88,684 ** 71,567 ** * 5 80,208 * 9,738 * 15,453 Cost of labor * 60,313 1,580,971 ** 177,447 ** * 13,832 125,353 * 18,413 * 15,217 Purchases * 2,452 2,406,880 ** 223,664 ** * 265 612,814 86,697 * 46,609 Materials and supplies * 6,524 733,952 ** 18,121 ** * 14,390 177,326 * [4] * 15,697 Other costs 398,909 3,817,029 ** 95,704 ** * 21,847 696,679 * 127,469 28,286 Inventory, end of year * 5,691 99,863 ** 42,427 ** ** 71,625 * 9,707 * 16,292 Advertising expenses 2,419 173,868 ** 53,920 ** ** 25,220 24,009 10,506 2,021 Car and truck expenses 33,505 21,663,600 ** 2,861,782 ** ** 13,410 556,884 2,411,729 22,305 Commissions * 476 991,499 ** 248,156 ** * 1,829 40,508 83,982 * 128 Contract labor 12,460 5,737,508 ** 361,468 ** ** 17,229 286,507 374,131 98,138 Depletion 0 * 2,437 ** 12,262 ** * 3 * 2 0 0 Depreciation 184,147 4,131,722 ** 519,690 ** ** 124,123 261,819 59,079 19,428 Employee benefit programs * 1,484 59,495 ** 3,092 ** * 109 5,800 * 142 3,093 Insurance 18,436 2,627,326 ** 520,208 ** ** 15,321 118,123 57,244 10,366 Legal and professional services 4,262 251,867 ** 54,463 ** ** 3,552 30,068 22,454 5,612 Meals and entertainment deducted 3,027 2,025,036 ** 127,163 ** ** 3,248 19,980 48,247 433 Mortgage interest 5,488 112,117 ** 53,150 ** * 9,092 17,462 * 1,838 * 8,403 Other interest paid on business indebtedness 16,589 366,938 ** 35,453 ** ** 2,557 23,800 2,565 8,635 Office expenses 2,355 305,161 ** 55,090 ** ** 365 36,335 33,877 4,664 Pension and profit-sharing plans * 99 4,577 ** 315 ** 0 5,132 * 28 * 4 Rent paid on machinery and equipment 4,875 1,481,769 ** 1,752,506 ** * 22,874 38,147 32,519 10,957 Rent paid on other business property 6,016 524,306 ** 143,954 ** ** 5,748 57,535 34,348 64,572 Repairs 39,972 5,247,029 ** 446,075 ** ** 25,134 111,578 57,582 19,845 Supplies 17,385 1,050,050 ** 158,889 ** ** 6,055 115,965 64,769 14,794 Salaries and wages 92,521 2,471,948 ** 261,347 ** * 4,810 288,033 52,861 41,755 Taxes paid 13,694 1,177,579 ** 177,976 ** ** 1,950 58,143 14,253 13,611 Travel 7,224 773,855 ** 101,707 ** ** 11,752 45,677 38,944 12,239 Utilities 4,997 975,104 ** 270,660 ** ** 9,692 119,472 116,913 26,767 Other business expenses 116,346 7,233,876 ** 1,953,307 ** ** 85,008 392,839 315,400 57,130 Home office business deductions, total * 1,363 112,954 ** 59,085 ** * 851 15,888 13,660 * 176 Depreciation, Form 8829 [3] * 248 11,928 ** 7,106 ** * 379 3,313 * 418 * 35 Casualty loss, Form 8829 [3] 0 0 ** ** ** 0 0 0 Carryover of excess casualty losses and depreciation, Form 8829 [3] * 1,118 3,439 ** 4,697 ** * 595 * 3,224 * 259 * 26Net income less deficit [1,2] -10,695 10,387,351 ** 2,838,672 ** ** -76,875 637,830 1,262,041 72,038 Net income [1,2] 79,038 11,504,554 ** 3,512,290 ** ** 60,260 794,696 1,477,633 127,835 Deficit [2] 89,733 1,117,203 ** 673,617 ** ** 137,135 156,865 215,592 55,797Footnotes at end of table.
Table 2. Nonfarm Sole Proprietorships: Income Statements, by Industrial Sectors, Tax Year 2014—Continued
Pipelinetransportation
Scenicand
sightseeingtransportation
Supportactivities for
transportation(including
motor vehicletowing)
Couriersand
messengers
Watertransportation
Trucktransportation
Other transitand ground
transportation
Net income status, item
Transportation and warehousing—continued
Warehousingand
storagefacilities

36
Sole Proprietorship Returns, 2014
Fall 2016Statistics of Income Bulletin
[All figures are estimates based on samples—money amounts are in thousands of dollars]
(55) (56) (57) (58) (59) (60) (61) (62)BUSINESSES WITH NET INCOME
Number of returns [1] 3,961 498,708 ** 332,469 ** ** 5,435 50,882 153,936 8,866Business receipts, total [1,2] 497,874 68,134,026 ** 12,352,491 ** ** 292,388 3,998,242 4,589,737 467,247 Income from sales and operations [1] 497,179 67,599,949 ** 12,120,131 ** ** 292,302 3,902,597 4,589,600 465,204 Other business income * 695 534,078 ** 232,360 ** * 86 95,646 * 136 * 2,043Business deductions, total [1,2] 419,129 56,634,319 ** 8,840,202 ** ** 232,583 3,203,546 3,115,664 339,412 Cost of sales and operations, total 146,945 6,160,835 ** 450,551 ** * 24,595 1,354,125 * 64,345 * 58,672 Inventory, beginning of year * 281 79,986 ** 42,794 ** ** * 70,731 * 1,031 * 6,111 Cost of labor * 11 1,074,172 ** 168,911 ** * 9,896 114,036 0 * 14,683 Purchases * 2,450 1,801,896 ** 218,648 ** ** 492,575 * 54,186 * 19,037 Materials and supplies * 1 630,975 ** 15,314 ** * 14,390 169,201 0 * 592 Other costs * 145,020 2,663,973 ** 47,311 ** * 309 569,803 * 10,184 * 25,437 Inventory, end of year * 818 90,166 ** 42,427 ** ** * 62,220 * 1,056 * 7,188 Advertising expenses 180 136,123 ** 37,636 ** * 24,543 16,216 4,854 871 Car and truck expenses 32,835 19,006,485 ** 2,053,392 ** * 7,429 399,802 1,852,400 10,268 Commissions * 3 767,791 ** 239,479 ** * 1,103 28,224 * 67,322 * 6 Contract labor * 7,173 4,992,749 ** 301,278 ** * 15,725 190,446 355,273 * 63,184 Depletion 0 * 2,364 ** 12,256 ** * 3 * 2 0 0 Depreciation 34,747 3,233,243 ** 428,834 ** ** 21,452 128,818 40,361 13,088 Employee benefit programs * 947 44,779 ** 2,548 ** ** 4,684 * 80 * 2,940 Insurance 13,564 2,230,351 ** 399,768 ** ** 9,745 61,018 45,615 6,077 Legal and professional services 1,692 208,679 ** 39,409 ** * 376 22,635 18,336 1,778 Meals and entertainment deducted 1,538 1,821,310 ** 96,327 ** * 509 14,734 43,335 260 Mortgage interest * 1,471 91,230 ** 50,402 ** * 6,787 3,184 * 1,835 * 532 Other interest paid on business indebtedness 4,081 278,631 ** 21,859 ** * 714 11,930 * 2,080 7,944 Office expenses 1,946 262,975 ** 35,756 ** * 266 29,340 25,075 3,563 Pension and profit-sharing plans * 74 3,623 ** 287 ** ** * 5,111 0 * 4 Rent paid on machinery and equipment * 1,634 1,238,010 ** 1,658,643 ** * 22,226 25,354 30,127 * 5,390 Rent paid on other business property 3,046 376,436 ** 133,696 ** * 184 49,659 18,502 43,207 Repairs 17,613 4,459,286 ** 363,074 ** * 12,535 75,838 39,326 7,088 Supplies 13,536 917,039 ** 85,510 ** * 5,101 87,163 53,826 8,370 Salaries and wages 58,827 1,809,700 ** 148,433 ** * 1,388 208,393 * 38,349 34,447 Taxes paid 7,041 1,006,576 ** 151,891 ** * 181 41,317 13,079 7,038 Travel 6,294 655,959 ** 68,807 ** * 5,453 19,309 28,922 6,147 Utilities 2,778 807,984 ** 202,386 ** ** 8,687 90,106 79,216 8,821 Other business deductions 60,405 5,980,160 ** 1,755,381 ** ** 62,529 297,642 244,570 37,318 Home office business deductions, total * 695 104,161 ** 44,803 ** * 219 14,237 13,660 * 172 Depreciation, Form 8829 [3] * 32 10,715 ** 6,326 ** * 61 2,099 * 418 * 30 Casualty loss, Form 8829 [3] 0 0 ** ** ** 0 0 0 Excess—casualty depreciations, Form 8829 [3] 0 * 2,198 ** ** ** 0 * 259 0Net income [1,2] 79,038 11,504,554 ** 3,512,290 ** ** 60,260 794,696 1,477,633 127,835Returns with Schedule C-EZ: Number of returns * 987 42,702 ** 55,613 ** * 1,028 18,373 29,794 * 4,371 Business receipts * 7,904 472,404 ** 318,656 ** * 3,122 130,968 172,883 * 35,645 Business deductions * 64 37,840 ** 59,456 ** * 831 24,257 35,819 * 12,226 Net income * 7,840 434,564 ** 259,199 ** * 2,291 106,711 137,063 * 23,419Footnotes at end of table.
Transportation and warehousing—continued
Table 2. Nonfarm Sole Proprietorships: Income Statements, by Industrial Sectors, Tax Year 2014—Continued
Warehousingand
storagefacilities
Watertransportation
Trucktransportation
Other transitand ground
transportation
Net income status, item Pipelinetransportation
Scenicand
sightseeingtransportation
Supportactivities for
transportation(including
motor vehicletowing)
Couriersand
messengers

37
Sole Proprietorship Returns, 2014
Fall 2016Statistics of Income Bulletin
[All figures are estimates based on samples—money amounts are in thousands of dollars]
(63) (64) (65) (66) (67) (68) (69)
BUSINESSES WITH AND WITHOUT NET INCOMENumber of returns [1] 376,410 58,120 121,705 89,273 107,311 626,057 40,596Business receipts, total [1,2] 13,303,848 1,745,094 4,151,735 4,245,166 3,161,853 81,021,232 2,716,778 Income from sales and operations [1] 12,818,030 1,718,265 3,973,818 4,202,875 2,923,071 79,625,123 2,646,550 Other business income (loss) [1] 485,818 26,829 177,917 42,290 238,782 1,396,109 70,228Business deductions, total [1,2] 10,405,396 1,385,104 3,237,249 3,238,816 2,544,228 60,696,635 2,264,765 Cost of sales and operations, total 3,330,940 583,343 682,171 1,134,671 930,756 27,962,571 882,859 Inventory, beginning of year 177,535 27,715 4,896 138,432 6,492 589,068 68,905 Cost of labor 346,754 * 133,797 151,204 * 52,813 * 8,940 179,385 * 4,879 Purchases 1,458,955 168,468 165,432 825,369 299,686 13,645,515 699,954 Materials and supplies 105,784 12,791 19,207 * 21,770 52,017 124,933 * 68,223 Other costs 1,320,390 277,224 347,580 114,622 580,963 13,957,522 102,399 Inventory, end of year 78,479 36,651 6,149 18,336 17,343 533,852 61,501 Advertising expenses 230,326 16,006 73,003 47,620 93,697 1,111,076 36,759 Car and truck expenses 616,943 69,369 251,432 173,201 122,941 3,053,179 108,229 Commissions 188,585 24,346 19,921 86,781 57,537 3,000,074 46,496 Contract labor 694,850 81,022 195,276 282,893 135,658 1,218,473 83,796 Depletion * 85 0 * 7 * 56 * 23 5,794 * 88 Depreciation 469,261 12,349 300,205 103,690 53,016 690,630 20,992 Employee benefit programs 32,248 10,303 3,213 14,296 4,436 189,315 3,649 Insurance 84,884 9,602 22,255 31,728 21,300 595,935 13,607 Legal and professional services 141,551 21,246 51,185 34,861 34,260 765,692 75,100 Meals and entertainment deducted 110,078 11,498 46,043 34,837 17,700 526,576 14,461 Mortgage interest 7,111 * 135 * 2,248 3,177 * 1,551 102,621 8,543 Other interest paid on business indebtedness 42,200 3,556 18,551 12,418 7,676 420,318 68,216 Office expenses 156,201 20,991 40,766 57,101 37,343 913,922 30,647 Pension and profit-sharing plans 9,467 * 391 6,737 1,441 * 899 126,650 * 3,210 Rent paid on machinery and equipment 92,231 4,633 49,080 26,360 12,158 216,885 12,917 Rent paid on other business property 356,582 40,104 124,167 112,738 79,573 1,581,721 79,726 Repairs 85,547 3,943 34,181 15,251 32,171 238,091 15,918 Supplies 309,746 21,596 162,418 76,531 49,201 509,497 31,670 Salaries and wages 779,941 116,226 184,518 320,169 159,028 4,831,530 126,740 Taxes paid 104,172 17,237 33,108 36,854 16,973 637,728 30,230 Travel 284,064 41,348 124,292 61,704 56,720 913,207 28,454 Utilities 406,827 50,715 110,142 143,041 102,929 1,270,650 60,937 Other business expenses 1,606,942 184,451 582,289 371,484 468,719 9,448,599 451,715 Home office business deductions, total 214,993 27,431 110,181 42,888 34,492 300,874 24,672 Depreciation, Form 8829 [3] 29,183 1,762 14,958 6,728 5,735 49,604 * 3,635 Casualty loss, Form 8829 [3] * 17 0 0 * 17 0 * 61 * 18 Carryover of excess casualty losses and depreciation, Form 8829 [3] 42,285 * 443 30,960 * 7,073 3,809 66,647 * 406Net income less deficit [1,2] 2,917,718 359,339 925,129 1,006,991 626,258 20,364,729 479,969 Net income [1,2] 4,024,710 483,176 1,351,598 1,244,678 945,258 23,668,099 672,787 Deficit [2] 1,106,993 123,837 426,469 237,687 319,000 3,303,369 192,818Footnotes at end of table.
Table 2. Nonfarm Sole Proprietorships: Income Statements, by Industrial Sectors, Tax Year 2014—Continued
Net income status, item
Finance and insuranceInformation
Dataprocessing,
internetpublishing
andbroadcasting,
and Web searchportals
TotalTotal
Publishingindustries(exceptinternet)
Motionpicture and
soundrecording
Broadcasting(exceptInternet)
and telecom-municationsand Internet
serviceproviders
Creditintermediation
and relatedactivities
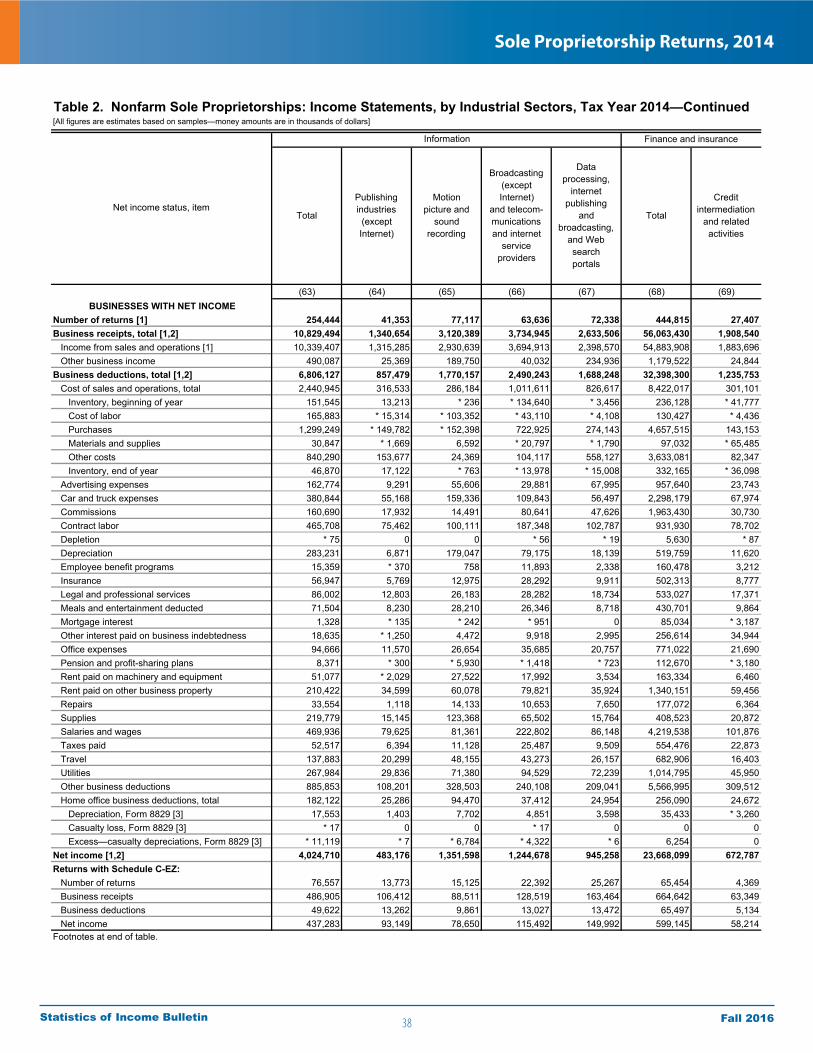
38
Sole Proprietorship Returns, 2014
Fall 2016Statistics of Income Bulletin
[All figures are estimates based on samples—money amounts are in thousands of dollars]
(63) (64) (65) (66) (67) (68) (69)BUSINESSES WITH NET INCOME
Number of returns [1] 254,444 41,353 77,117 63,636 72,338 444,815 27,407Business receipts, total [1,2] 10,829,494 1,340,654 3,120,389 3,734,945 2,633,506 56,063,430 1,908,540 Income from sales and operations [1] 10,339,407 1,315,285 2,930,639 3,694,913 2,398,570 54,883,908 1,883,696 Other business income 490,087 25,369 189,750 40,032 234,936 1,179,522 24,844Business deductions, total [1,2] 6,806,127 857,479 1,770,157 2,490,243 1,688,248 32,398,300 1,235,753 Cost of sales and operations, total 2,440,945 316,533 286,184 1,011,611 826,617 8,422,017 301,101 Inventory, beginning of year 151,545 13,213 * 236 * 134,640 * 3,456 236,128 * 41,777 Cost of labor 165,883 * 15,314 * 103,352 * 43,110 * 4,108 130,427 * 4,436 Purchases 1,299,249 * 149,782 * 152,398 722,925 274,143 4,657,515 143,153 Materials and supplies 30,847 * 1,669 6,592 * 20,797 * 1,790 97,032 * 65,485 Other costs 840,290 153,677 24,369 104,117 558,127 3,633,081 82,347 Inventory, end of year 46,870 17,122 * 763 * 13,978 * 15,008 332,165 * 36,098 Advertising expenses 162,774 9,291 55,606 29,881 67,995 957,640 23,743 Car and truck expenses 380,844 55,168 159,336 109,843 56,497 2,298,179 67,974 Commissions 160,690 17,932 14,491 80,641 47,626 1,963,430 30,730 Contract labor 465,708 75,462 100,111 187,348 102,787 931,930 78,702 Depletion * 75 0 0 * 56 * 19 5,630 * 87 Depreciation 283,231 6,871 179,047 79,175 18,139 519,759 11,620 Employee benefit programs 15,359 * 370 758 11,893 2,338 160,478 3,212 Insurance 56,947 5,769 12,975 28,292 9,911 502,313 8,777 Legal and professional services 86,002 12,803 26,183 28,282 18,734 533,027 17,371 Meals and entertainment deducted 71,504 8,230 28,210 26,346 8,718 430,701 9,864 Mortgage interest 1,328 * 135 * 242 * 951 0 85,034 * 3,187 Other interest paid on business indebtedness 18,635 * 1,250 4,472 9,918 2,995 256,614 34,944 Office expenses 94,666 11,570 26,654 35,685 20,757 771,022 21,690 Pension and profit-sharing plans 8,371 * 300 * 5,930 * 1,418 * 723 112,670 * 3,180 Rent paid on machinery and equipment 51,077 * 2,029 27,522 17,992 3,534 163,334 6,460 Rent paid on other business property 210,422 34,599 60,078 79,821 35,924 1,340,151 59,456 Repairs 33,554 1,118 14,133 10,653 7,650 177,072 6,364 Supplies 219,779 15,145 123,368 65,502 15,764 408,523 20,872 Salaries and wages 469,936 79,625 81,361 222,802 86,148 4,219,538 101,876 Taxes paid 52,517 6,394 11,128 25,487 9,509 554,476 22,873 Travel 137,883 20,299 48,155 43,273 26,157 682,906 16,403 Utilities 267,984 29,836 71,380 94,529 72,239 1,014,795 45,950 Other business deductions 885,853 108,201 328,503 240,108 209,041 5,566,995 309,512 Home office business deductions, total 182,122 25,286 94,470 37,412 24,954 256,090 24,672 Depreciation, Form 8829 [3] 17,553 1,403 7,702 4,851 3,598 35,433 * 3,260 Casualty loss, Form 8829 [3] * 17 0 0 * 17 0 0 0 Excess—casualty depreciations, Form 8829 [3] * 11,119 * 7 * 6,784 * 4,322 * 6 6,254 0Net income [1,2] 4,024,710 483,176 1,351,598 1,244,678 945,258 23,668,099 672,787Returns with Schedule C-EZ: Number of returns 76,557 13,773 15,125 22,392 25,267 65,454 4,369 Business receipts 486,905 106,412 88,511 128,519 163,464 664,642 63,349 Business deductions 49,622 13,262 9,861 13,027 13,472 65,497 5,134 Net income 437,283 93,149 78,650 115,492 149,992 599,145 58,214Footnotes at end of table.
Finance and insurance
Table 2. Nonfarm Sole Proprietorships: Income Statements, by Industrial Sectors, Tax Year 2014—Continued
Total
Creditintermediation
and relatedactivities
Total
Publishingindustries(exceptInternet)
Motionpicture and
soundrecording
Broadcasting(exceptInternet)
and telecom-municationsand internet
serviceproviders
Dataprocessing,
internetpublishing
andbroadcasting,
and Web searchportals
Net income status, item
Information
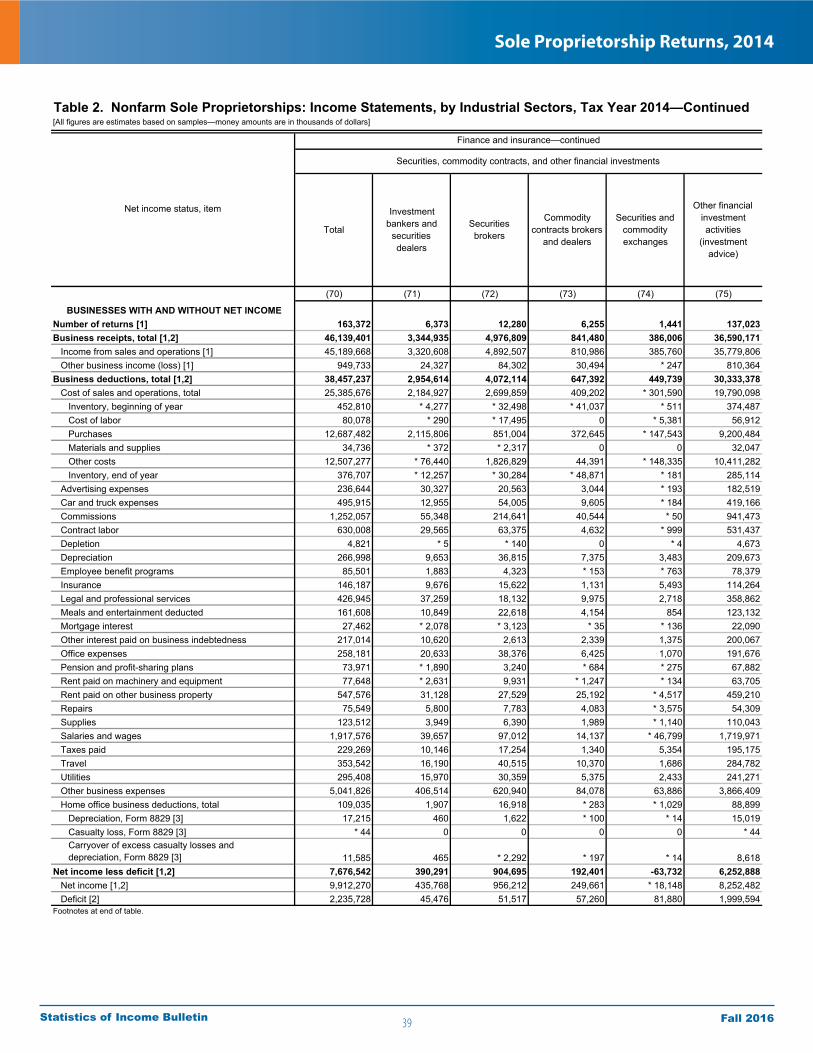
39
Sole Proprietorship Returns, 2014
Fall 2016Statistics of Income Bulletin
[All figures are estimates based on samples—money amounts are in thousands of dollars]
(70) (71) (72) (73) (74) (75)
BUSINESSES WITH AND WITHOUT NET INCOMENumber of returns [1] 163,372 6,373 12,280 6,255 1,441 137,023Business receipts, total [1,2] 46,139,401 3,344,935 4,976,809 841,480 386,006 36,590,171 Income from sales and operations [1] 45,189,668 3,320,608 4,892,507 810,986 385,760 35,779,806 Other business income (loss) [1] 949,733 24,327 84,302 30,494 * 247 810,364Business deductions, total [1,2] 38,457,237 2,954,614 4,072,114 647,392 449,739 30,333,378 Cost of sales and operations, total 25,385,676 2,184,927 2,699,859 409,202 * 301,590 19,790,098 Inventory, beginning of year 452,810 * 4,277 * 32,498 * 41,037 * 511 374,487 Cost of labor 80,078 * 290 * 17,495 0 * 5,381 56,912 Purchases 12,687,482 2,115,806 851,004 372,645 * 147,543 9,200,484 Materials and supplies 34,736 * 372 * 2,317 0 0 32,047 Other costs 12,507,277 * 76,440 1,826,829 44,391 * 148,335 10,411,282 Inventory, end of year 376,707 * 12,257 * 30,284 * 48,871 * 181 285,114 Advertising expenses 236,644 30,327 20,563 3,044 * 193 182,519 Car and truck expenses 495,915 12,955 54,005 9,605 * 184 419,166 Commissions 1,252,057 55,348 214,641 40,544 * 50 941,473 Contract labor 630,008 29,565 63,375 4,632 * 999 531,437 Depletion 4,821 * 5 * 140 0 * 4 4,673 Depreciation 266,998 9,653 36,815 7,375 3,483 209,673 Employee benefit programs 85,501 1,883 4,323 * 153 * 763 78,379 Insurance 146,187 9,676 15,622 1,131 5,493 114,264 Legal and professional services 426,945 37,259 18,132 9,975 2,718 358,862 Meals and entertainment deducted 161,608 10,849 22,618 4,154 854 123,132 Mortgage interest 27,462 * 2,078 * 3,123 * 35 * 136 22,090 Other interest paid on business indebtedness 217,014 10,620 2,613 2,339 1,375 200,067 Office expenses 258,181 20,633 38,376 6,425 1,070 191,676 Pension and profit-sharing plans 73,971 * 1,890 3,240 * 684 * 275 67,882 Rent paid on machinery and equipment 77,648 * 2,631 9,931 * 1,247 * 134 63,705 Rent paid on other business property 547,576 31,128 27,529 25,192 * 4,517 459,210 Repairs 75,549 5,800 7,783 4,083 * 3,575 54,309 Supplies 123,512 3,949 6,390 1,989 * 1,140 110,043 Salaries and wages 1,917,576 39,657 97,012 14,137 * 46,799 1,719,971 Taxes paid 229,269 10,146 17,254 1,340 5,354 195,175 Travel 353,542 16,190 40,515 10,370 1,686 284,782 Utilities 295,408 15,970 30,359 5,375 2,433 241,271 Other business expenses 5,041,826 406,514 620,940 84,078 63,886 3,866,409 Home office business deductions, total 109,035 1,907 16,918 * 283 * 1,029 88,899 Depreciation, Form 8829 [3] 17,215 460 1,622 * 100 * 14 15,019 Casualty loss, Form 8829 [3] * 44 0 0 0 0 * 44 Carryover of excess casualty losses and depreciation, Form 8829 [3] 11,585 465 * 2,292 * 197 * 14 8,618Net income less deficit [1,2] 7,676,542 390,291 904,695 192,401 -63,732 6,252,888 Net income [1,2] 9,912,270 435,768 956,212 249,661 * 18,148 8,252,482 Deficit [2] 2,235,728 45,476 51,517 57,260 81,880 1,999,594Footnotes at end of table.
Table 2. Nonfarm Sole Proprietorships: Income Statements, by Industrial Sectors, Tax Year 2014—Continued
Net income status, item
Finance and insurance—continued
Securities, commodity contracts, and other financial investments
Total
Investmentbankers and
securitiesdealers
Securitiesbrokers
Commoditycontracts brokers
and dealers
Securities andcommodityexchanges
Other financialinvestmentactivities
(investmentadvice)

40
Sole Proprietorship Returns, 2014
Fall 2016Statistics of Income Bulletin
[All figures are estimates based on samples—money amounts are in thousands of dollars]
(70) (71) (72) (73) (74) (75)BUSINESSES WITH NET INCOME
Number of returns [1] 113,917 5,576 8,088 1,499 * 1,052 97,704Business receipts, total [1,2] 25,623,010 1,213,692 3,255,718 594,458 * 127,123 20,432,020 Income from sales and operations [1] 24,973,413 1,195,504 3,231,552 580,514 * 127,123 19,838,719 Other business income 649,598 18,188 24,165 * 13,943 0 593,301Business deductions, total [1,2] 15,701,658 777,895 2,299,506 343,861 * 108,975 12,171,421 Cost of sales and operations, total 7,021,719 * 422,766 1,413,456 * 244,069 * 60,681 4,880,747 Inventory, beginning of year 160,570 * 4,277 * 10,064 * 36,339 * 511 109,378 Cost of labor 37,784 * 290 * 15,097 0 * 5,381 17,016 Purchases 4,283,164 * 419,244 * 392,556 * 244,132 * 52,671 3,174,561 Materials and supplies 10,936 * 372 * 509 0 0 10,056 Other costs 2,763,815 * 398 1,005,087 * 8,989 * 2,299 1,747,042 Inventory, end of year 234,551 * 1,814 * 9,858 * 45,391 * 181 177,307 Advertising expenses 202,394 28,548 14,794 2,471 * 187 156,394 Car and truck expenses 375,528 10,080 36,670 512 * 61 328,204 Commissions 822,410 35,575 175,143 29,987 * 37 581,666 Contract labor 430,389 8,405 30,603 * 4,030 * 849 386,501 Depletion 4,699 * 5 * 137 0 0 4,557 Depreciation 191,889 8,471 35,295 3,244 * 1,037 143,843 Employee benefit programs 64,143 1,796 2,645 * 61 * 394 59,246 Insurance 109,297 8,945 12,937 460 * 2,286 84,669 Legal and professional services 301,644 20,311 15,711 4,839 * 1,315 259,468 Meals and entertainment deducted 119,959 8,037 14,360 2,430 * 95 95,037 Mortgage interest 18,372 * 1,832 * 3,102 * 35 * 55 13,348 Other interest paid on business indebtedness 106,688 2,248 1,068 754 * 794 101,824 Office expenses 210,857 17,509 32,119 1,799 * 335 159,096 Pension and profit-sharing plans 71,212 * 1,884 3,240 * 663 * 275 65,150 Rent paid on machinery and equipment 48,029 * 2,585 9,740 * 592 * 108 35,004 Rent paid on other business property 430,953 21,481 22,983 4,690 * 1,430 380,370 Repairs 49,744 4,866 3,674 * 1,210 * 3,573 36,421 Supplies 85,373 2,445 3,138 * 833 * 1,093 77,865 Salaries and wages 1,534,734 37,468 76,914 * 5,390 * 14,688 1,400,274 Taxes paid 185,307 9,016 15,513 447 * 1,687 158,644 Travel 222,509 12,402 23,999 6,205 * 859 179,043 Utilities 203,719 11,495 21,883 1,421 * 1,550 167,370 Other business deductions 2,779,009 95,348 316,836 27,713 * 15,586 2,323,527 Home office business deductions, total 94,212 * 1,754 13,505 * 3 0 78,950 Depreciation, Form 8829 [3] 14,052 * 301 1,306 0 0 12,445 Casualty loss, Form 8829 [3] 0 0 0 0 0 0 Excess—casualty depreciations, Form 8829 [3] * 49 * 39 0 0 0 * 11Net income [1,2] 9,912,270 435,768 956,212 249,661 * 18,148 8,252,482Returns with Schedule C-EZ: Number of returns 19,924 1,627 * 32 * 1,022 0 17,242 Business receipts 289,519 18,365 * 8,568 * 30,504 0 232,082 Business deductions 17,374 * 3,054 * 40 * 1 0 14,280 Net income 272,144 15,311 * 8,528 * 30,503 0 217,802Footnotes at end of table.
Finance and insurance—continued
Table 2. Nonfarm Sole Proprietorships: Income Statements, by Industrial Sectors, Tax Year 2014—Continued
Total
Investmentbankers and
securitiesdealers
Securitiesbrokers
Commoditycontracts brokers
and dealers
Securities andcommodityexchanges
Securities, commodity contracts, and other financial investments
Other financialinvestmentactivities
(investmentadvice)
Net income status, item
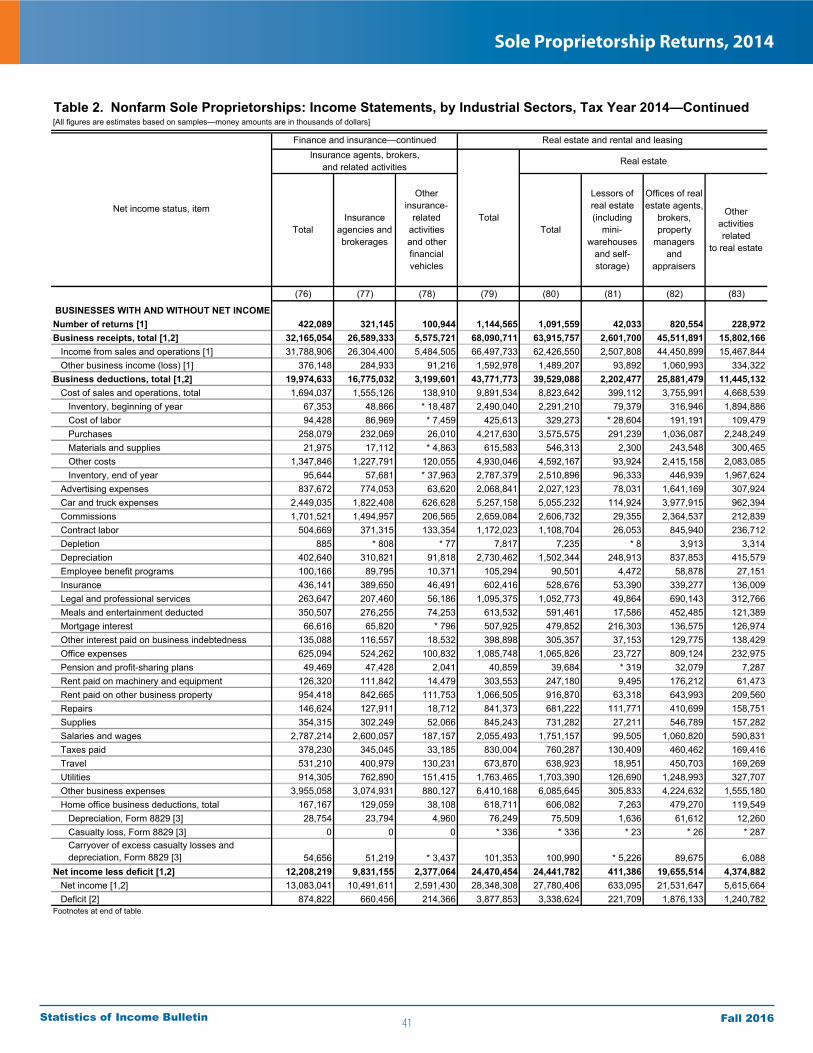
41
Sole Proprietorship Returns, 2014
Fall 2016Statistics of Income Bulletin
[All figures are estimates based on samples—money amounts are in thousands of dollars]
(76) (77) (78) (79) (80) (81) (82) (83)
BUSINESSES WITH AND WITHOUT NET INCOMENumber of returns [1] 422,089 321,145 100,944 1,144,565 1,091,559 42,033 820,554 228,972Business receipts, total [1,2] 32,165,054 26,589,333 5,575,721 68,090,711 63,915,757 2,601,700 45,511,891 15,802,166 Income from sales and operations [1] 31,788,906 26,304,400 5,484,505 66,497,733 62,426,550 2,507,808 44,450,899 15,467,844 Other business income (loss) [1] 376,148 284,933 91,216 1,592,978 1,489,207 93,892 1,060,993 334,322Business deductions, total [1,2] 19,974,633 16,775,032 3,199,601 43,771,773 39,529,088 2,202,477 25,881,479 11,445,132 Cost of sales and operations, total 1,694,037 1,555,126 138,910 9,891,534 8,823,642 399,112 3,755,991 4,668,539 Inventory, beginning of year 67,353 48,866 * 18,487 2,490,040 2,291,210 79,379 316,946 1,894,886 Cost of labor 94,428 86,969 * 7,459 425,613 329,273 * 28,604 191,191 109,479 Purchases 258,079 232,069 26,010 4,217,630 3,575,575 291,239 1,036,087 2,248,249 Materials and supplies 21,975 17,112 * 4,863 615,583 546,313 2,300 243,548 300,465 Other costs 1,347,846 1,227,791 120,055 4,930,046 4,592,167 93,924 2,415,158 2,083,085 Inventory, end of year 95,644 57,681 * 37,963 2,787,379 2,510,896 96,333 446,939 1,967,624 Advertising expenses 837,672 774,053 63,620 2,068,841 2,027,123 78,031 1,641,169 307,924 Car and truck expenses 2,449,035 1,822,408 626,628 5,257,158 5,055,232 114,924 3,977,915 962,394 Commissions 1,701,521 1,494,957 206,565 2,659,084 2,606,732 29,355 2,364,537 212,839 Contract labor 504,669 371,315 133,354 1,172,023 1,108,704 26,053 845,940 236,712 Depletion 885 * 808 * 77 7,817 7,235 * 8 3,913 3,314 Depreciation 402,640 310,821 91,818 2,730,462 1,502,344 248,913 837,853 415,579 Employee benefit programs 100,166 89,795 10,371 105,294 90,501 4,472 58,878 27,151 Insurance 436,141 389,650 46,491 602,416 528,676 53,390 339,277 136,009 Legal and professional services 263,647 207,460 56,186 1,095,375 1,052,773 49,864 690,143 312,766 Meals and entertainment deducted 350,507 276,255 74,253 613,532 591,461 17,586 452,485 121,389 Mortgage interest 66,616 65,820 * 796 507,925 479,852 216,303 136,575 126,974 Other interest paid on business indebtedness 135,088 116,557 18,532 398,898 305,357 37,153 129,775 138,429 Office expenses 625,094 524,262 100,832 1,085,748 1,065,826 23,727 809,124 232,975 Pension and profit-sharing plans 49,469 47,428 2,041 40,859 39,684 * 319 32,079 7,287 Rent paid on machinery and equipment 126,320 111,842 14,479 303,553 247,180 9,495 176,212 61,473 Rent paid on other business property 954,418 842,665 111,753 1,066,505 916,870 63,318 643,993 209,560 Repairs 146,624 127,911 18,712 841,373 681,222 111,771 410,699 158,751 Supplies 354,315 302,249 52,066 845,243 731,282 27,211 546,789 157,282 Salaries and wages 2,787,214 2,600,057 187,157 2,055,493 1,751,157 99,505 1,060,820 590,831 Taxes paid 378,230 345,045 33,185 830,004 760,287 130,409 460,462 169,416 Travel 531,210 400,979 130,231 673,870 638,923 18,951 450,703 169,269 Utilities 914,305 762,890 151,415 1,763,465 1,703,390 126,690 1,248,993 327,707 Other business expenses 3,955,058 3,074,931 880,127 6,410,168 6,085,645 305,833 4,224,632 1,555,180 Home office business deductions, total 167,167 129,059 38,108 618,711 606,082 7,263 479,270 119,549 Depreciation, Form 8829 [3] 28,754 23,794 4,960 76,249 75,509 1,636 61,612 12,260 Casualty loss, Form 8829 [3] 0 0 0 * 336 * 336 * 23 * 26 * 287 Carryover of excess casualty losses and depreciation, Form 8829 [3] 54,656 51,219 * 3,437 101,353 100,990 * 5,226 89,675 6,088Net income less deficit [1,2] 12,208,219 9,831,155 2,377,064 24,470,454 24,441,782 411,386 19,655,514 4,374,882 Net income [1,2] 13,083,041 10,491,611 2,591,430 28,348,308 27,780,406 633,095 21,531,647 5,615,664 Deficit [2] 874,822 660,456 214,366 3,877,853 3,338,624 221,709 1,876,133 1,240,782Footnotes at end of table.
Table 2. Nonfarm Sole Proprietorships: Income Statements, by Industrial Sectors, Tax Year 2014—Continued
Net income status, item
Finance and insurance—continued Real estate and rental and leasing
Real estate
Offices of realestate agents,
brokers,property
managersand
appraisers
Otheractivitiesrelated
to real estate
Insurance agents, brokers, and related activities
Lessors ofreal estate(including
mini-warehouses
and self-storage)
TotalInsurance
agencies andbrokerages
Otherinsurance-
relatedactivitiesand otherfinancialvehicles
TotalTotal
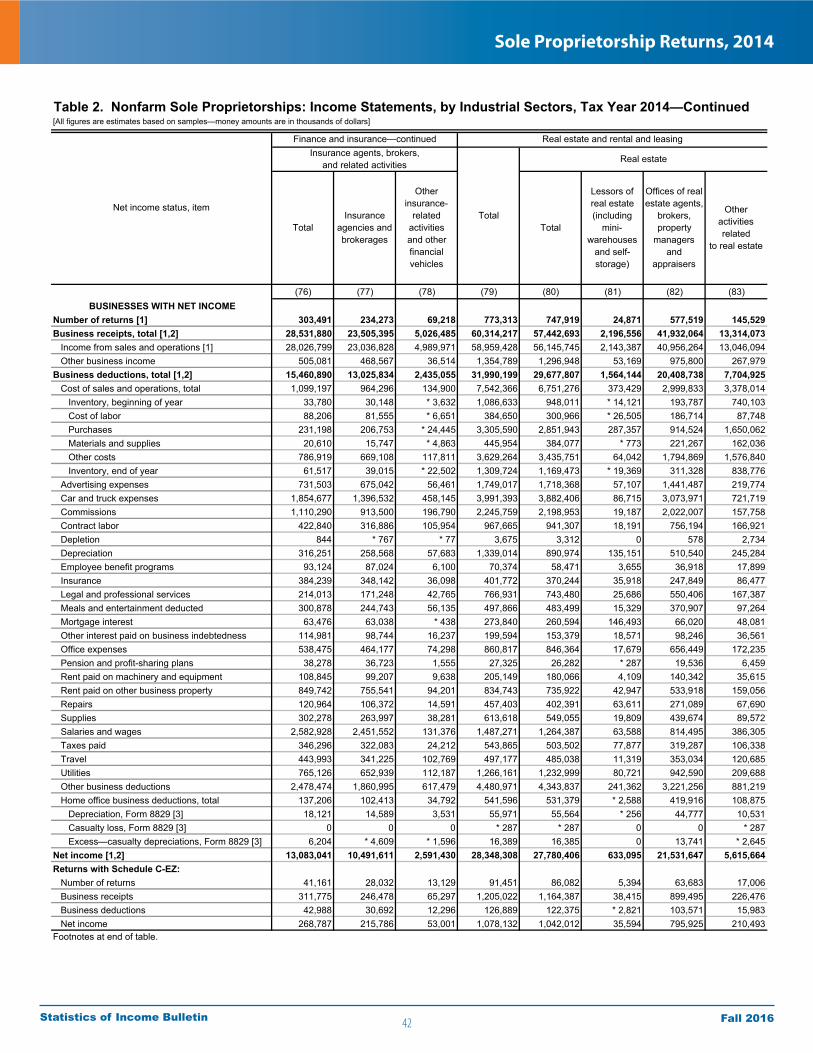
42
Sole Proprietorship Returns, 2014
Fall 2016Statistics of Income Bulletin
[All figures are estimates based on samples—money amounts are in thousands of dollars]
(76) (77) (78) (79) (80) (81) (82) (83)BUSINESSES WITH NET INCOME
Number of returns [1] 303,491 234,273 69,218 773,313 747,919 24,871 577,519 145,529Business receipts, total [1,2] 28,531,880 23,505,395 5,026,485 60,314,217 57,442,693 2,196,556 41,932,064 13,314,073 Income from sales and operations [1] 28,026,799 23,036,828 4,989,971 58,959,428 56,145,745 2,143,387 40,956,264 13,046,094 Other business income 505,081 468,567 36,514 1,354,789 1,296,948 53,169 975,800 267,979Business deductions, total [1,2] 15,460,890 13,025,834 2,435,055 31,990,199 29,677,807 1,564,144 20,408,738 7,704,925 Cost of sales and operations, total 1,099,197 964,296 134,900 7,542,366 6,751,276 373,429 2,999,833 3,378,014 Inventory, beginning of year 33,780 30,148 * 3,632 1,086,633 948,011 * 14,121 193,787 740,103 Cost of labor 88,206 81,555 * 6,651 384,650 300,966 * 26,505 186,714 87,748 Purchases 231,198 206,753 * 24,445 3,305,590 2,851,943 287,357 914,524 1,650,062 Materials and supplies 20,610 15,747 * 4,863 445,954 384,077 * 773 221,267 162,036 Other costs 786,919 669,108 117,811 3,629,264 3,435,751 64,042 1,794,869 1,576,840 Inventory, end of year 61,517 39,015 * 22,502 1,309,724 1,169,473 * 19,369 311,328 838,776 Advertising expenses 731,503 675,042 56,461 1,749,017 1,718,368 57,107 1,441,487 219,774 Car and truck expenses 1,854,677 1,396,532 458,145 3,991,393 3,882,406 86,715 3,073,971 721,719 Commissions 1,110,290 913,500 196,790 2,245,759 2,198,953 19,187 2,022,007 157,758 Contract labor 422,840 316,886 105,954 967,665 941,307 18,191 756,194 166,921 Depletion 844 * 767 * 77 3,675 3,312 0 578 2,734 Depreciation 316,251 258,568 57,683 1,339,014 890,974 135,151 510,540 245,284 Employee benefit programs 93,124 87,024 6,100 70,374 58,471 3,655 36,918 17,899 Insurance 384,239 348,142 36,098 401,772 370,244 35,918 247,849 86,477 Legal and professional services 214,013 171,248 42,765 766,931 743,480 25,686 550,406 167,387 Meals and entertainment deducted 300,878 244,743 56,135 497,866 483,499 15,329 370,907 97,264 Mortgage interest 63,476 63,038 * 438 273,840 260,594 146,493 66,020 48,081 Other interest paid on business indebtedness 114,981 98,744 16,237 199,594 153,379 18,571 98,246 36,561 Office expenses 538,475 464,177 74,298 860,817 846,364 17,679 656,449 172,235 Pension and profit-sharing plans 38,278 36,723 1,555 27,325 26,282 * 287 19,536 6,459 Rent paid on machinery and equipment 108,845 99,207 9,638 205,149 180,066 4,109 140,342 35,615 Rent paid on other business property 849,742 755,541 94,201 834,743 735,922 42,947 533,918 159,056 Repairs 120,964 106,372 14,591 457,403 402,391 63,611 271,089 67,690 Supplies 302,278 263,997 38,281 613,618 549,055 19,809 439,674 89,572 Salaries and wages 2,582,928 2,451,552 131,376 1,487,271 1,264,387 63,588 814,495 386,305 Taxes paid 346,296 322,083 24,212 543,865 503,502 77,877 319,287 106,338 Travel 443,993 341,225 102,769 497,177 485,038 11,319 353,034 120,685 Utilities 765,126 652,939 112,187 1,266,161 1,232,999 80,721 942,590 209,688 Other business deductions 2,478,474 1,860,995 617,479 4,480,971 4,343,837 241,362 3,221,256 881,219 Home office business deductions, total 137,206 102,413 34,792 541,596 531,379 * 2,588 419,916 108,875 Depreciation, Form 8829 [3] 18,121 14,589 3,531 55,971 55,564 * 256 44,777 10,531 Casualty loss, Form 8829 [3] 0 0 0 * 287 * 287 0 0 * 287 Excess—casualty depreciations, Form 8829 [3] 6,204 * 4,609 * 1,596 16,389 16,385 0 13,741 * 2,645Net income [1,2] 13,083,041 10,491,611 2,591,430 28,348,308 27,780,406 633,095 21,531,647 5,615,664Returns with Schedule C-EZ: Number of returns 41,161 28,032 13,129 91,451 86,082 5,394 63,683 17,006 Business receipts 311,775 246,478 65,297 1,205,022 1,164,387 38,415 899,495 226,476 Business deductions 42,988 30,692 12,296 126,889 122,375 * 2,821 103,571 15,983 Net income 268,787 215,786 53,001 1,078,132 1,042,012 35,594 795,925 210,493Footnotes at end of table.
Finance and insurance—continued Real estate and rental and leasing
Table 2. Nonfarm Sole Proprietorships: Income Statements, by Industrial Sectors, Tax Year 2014—Continued
Total
Lessors ofreal estate(including
mini-warehouses
and self-storage)
Offices of realestate agents,
brokers,property
managersand
appraisers
Otheractivitiesrelated
to real estate
Insurance agents, brokers, and related activities
Total
Real estate
TotalInsurance
agencies andbrokerages
Otherinsurance-
relatedactivitiesand otherfinancialvehicles
Net income status, item

43
Sole Proprietorship Returns, 2014
Fall 2016Statistics of Income Bulletin
[All figures are estimates based on samples—money amounts are in thousands of dollars]
(84) (85) (86) (87) (88) (89) (90) (91)
BUSINESSES WITH AND WITHOUT NET INCOMENumber of returns [1] 50,338 18,004 1,901 * 646 * 3,051 11,586 15,150 2,668Business receipts, total [1,2] 4,142,594 880,862 134,345 * 44,560 * 265,195 860,309 1,957,324 * 32,360 Income from sales and operations [1] 4,038,823 875,437 125,880 * 44,560 * 263,693 849,576 1,879,677 * 32,360 Other business income (loss) [1] 103,771 5,424 * 8,465 0 * 1,501 10,733 77,647 0Business deductions, total [1,2] 4,207,107 907,599 143,373 * 38,660 * 271,058 816,563 2,029,855 * 35,578 Cost of sales and operations, total 1,067,876 191,474 * 99,343 * 12,938 * 90,880 205,202 468,038 * 16 Inventory, beginning of year 198,821 54,412 * 22,018 * 6,067 * 9,347 * 63,739 43,238 * 8 Cost of labor 96,340 * 110 * 1,480 0 0 * 70,640 24,110 0 Purchases 642,055 128,410 * 19,504 * 15,641 * 89,283 77,852 311,365 0 Materials and supplies 69,263 * 12,396 * 1,386 * 30 * 737 34,779 19,935 * 7 Other costs 337,879 71,155 * 73,942 * 10,008 * 1,777 9,604 171,393 0 Inventory, end of year 276,483 75,009 * 18,987 * 18,808 * 10,264 51,412 102,002 0 Advertising expenses 41,717 4,088 * 23 * 595 * 2,601 21,408 13,002 * 1 Car and truck expenses 181,338 62,889 * 6,726 * 1,013 * 4,383 69,600 36,728 * 20,588 Commissions 51,746 22,028 * 1,152 * 5,036 * 319 15,130 8,080 * 606 Contract labor 63,319 5,238 * 1,355 0 * 177 30,181 26,368 0 Depletion 582 * 363 0 0 0 * 77 * 142 0 Depreciation 1,228,097 302,591 * 12,489 * 1,081 * 19,490 141,559 750,886 * 21 Employee benefit programs 14,793 * 580 * 290 0 * 465 * 9,347 4,112 0 Insurance 73,725 18,788 * 400 * 388 * 4,923 10,678 38,548 * 14 Legal and professional services 42,416 4,507 * 866 * 340 * 3,214 7,945 25,545 * 187 Meals and entertainment deducted 22,004 8,952 * 95 * 109 * 300 6,115 6,433 * 67 Mortgage interest 28,073 6,867 0 0 * 3,988 5,099 12,120 0 Other interest paid on business indebtedness 93,541 13,280 * 126 * 107 * 1,523 12,073 66,433 0 Office expenses 19,914 2,350 * 47 * 292 * 2,291 7,913 7,021 * 8 Pension and profit-sharing plans 1,174 * 318 0 0 0 * 374 482 0 Rent paid on machinery and equipment 56,373 5,241 * 243 0 0 17,970 32,919 0 Rent paid on other business property 138,952 10,029 * 361 * 4,491 * 37,280 50,954 35,836 * 10,682 Repairs 159,957 29,586 * 338 * 80 * 2,327 15,586 112,040 * 194 Supplies 113,957 52,277 * 144 * 169 * 2,359 15,508 43,500 * 5 Salaries and wages 304,336 68,817 * 2,307 * 6,230 * 52,323 59,238 115,421 0 Taxes paid 69,623 8,310 * 1,235 * 1,506 * 14,697 23,554 20,321 * 94 Travel 34,823 10,718 * 1,031 * 260 0 7,485 15,329 * 125 Utilities 58,636 9,805 * 1,205 * 982 * 9,987 20,017 16,640 * 1,439 Other business expenses 323,134 66,729 * 13,134 * 3,044 * 13,443 54,168 172,616 * 1,389 Home office business deductions, total 12,485 * 1,372 * 460 0 * 438 * 9,195 1,020 * 144 Depreciation, Form 8829 [3] 699 * 9 * 7 * 275 0 * 387 * 22 * 41 Casualty loss, Form 8829 [3] 0 0 0 0 0 0 0 0 Carryover of excess casualty losses and depreciation, Form 8829 [3] * 315 0 * 7 * 275 0 * 20 * 14 * 48Net income less deficit [1,2] 31,890 16,282 -9,028 * 5,899 * -5,863 48,036 -23,438 * -3,217 Net income [1,2] 561,720 109,336 * 12,047 * 6,913 * 12,001 111,159 310,264 * 6,181 Deficit [2] 529,831 93,054 * 21,075 * 1,013 * 17,863 63,123 333,702 * 9,399Footnotes at end of table.
Table 2. Nonfarm Sole Proprietorships: Income Statements, by Industrial Sectors, Tax Year 2014—Continued
Net income status, item
Real estate and rental and leasing—continued
Rental and leasing services
Total
Automotiveequipment
rentaland leasing
Consumerelectronics
andappliances
rental
Formal wearand costume
rental
Video tapeand disc
rental
Generalrental
centers and other
consumergoodsrental
Commercialand
industrialmachinery
andequipment
rentaland leasing
Lessors of nonfinancialintangible
assets(except
copyrightedworks)

44
Sole Proprietorship Returns, 2014
Fall 2016Statistics of Income Bulletin
[All figures are estimates based on samples—money amounts are in thousands of dollars]
(84) (85) (86) (87) (88) (89) (90) (91)BUSINESSES WITH NET INCOME
Number of returns [1] 24,057 9,504 * 352 * 344 * 1,322 5,617 6,917 * 1,337Business receipts, total [1,2] 2,864,552 697,562 * 50,131 * 44,366 * 103,017 675,753 1,293,723 * 6,972 Income from sales and operations [1] 2,806,712 696,612 * 41,666 * 44,366 * 103,017 671,322 1,249,728 * 6,972 Other business income 57,840 950 * 8,465 0 0 4,431 43,994 0Business deductions, total [1,2] 2,311,602 588,727 * 38,084 * 37,454 * 91,017 565,878 990,444 * 790 Cost of sales and operations, total 791,091 147,726 * 19,806 * 12,763 * 23,177 192,554 395,065 0 Inventory, beginning of year 138,622 * 35,817 * 22,018 * 6,007 0 * 41,516 33,264 0 Cost of labor 83,683 * 56 * 125 0 0 * 70,612 * 12,890 0 Purchases 453,648 * 107,619 * 15,227 * 15,556 * 20,663 * 70,809 223,773 0 Materials and supplies 61,877 * 12,227 * 1,386 0 * 737 * 34,726 12,800 0 Other costs 193,513 * 36,293 * 37 * 10,008 * 1,777 * 4,038 141,359 0 Inventory, end of year 140,252 * 44,287 * 18,987 * 18,808 0 * 29,148 29,022 0 Advertising expenses 30,650 3,592 * 23 * 595 * 2,392 14,905 9,142 0 Car and truck expenses 108,987 49,812 * 2,052 * 132 * 3,736 44,572 8,682 0 Commissions 46,200 * 21,321 * 1,152 * 5,036 0 * 13,573 5,119 * 606 Contract labor 26,358 * 4,268 0 0 * 177 12,350 9,563 0 Depletion * 363 * 363 0 0 0 0 0 0 Depreciation 448,040 141,381 * 5,488 * 1,081 * 5,028 62,192 232,870 0 Employee benefit programs 11,903 * 169 * 290 0 0 * 8,923 2,521 0 Insurance 31,529 11,598 * 347 * 237 * 2,070 4,329 12,948 0 Legal and professional services 23,299 3,570 * 834 * 340 * 2,943 6,519 9,094 * 152 Meals and entertainment deducted 14,367 8,837 * 41 * 109 * 184 3,209 1,988 0 Mortgage interest 13,246 * 6,115 0 0 0 * 2,133 4,997 0 Other interest paid on business indebtedness 46,215 5,298 * 126 * 107 * 4 5,646 35,033 0 Office expenses 14,453 2,210 * 47 * 292 * 1,223 6,133 4,548 0 Pension and profit-sharing plans 1,042 * 318 0 0 0 * 374 * 350 0 Rent paid on machinery and equipment 25,083 * 4,855 * 243 0 0 * 930 19,055 0 Rent paid on other business property 98,821 7,863 * 361 * 4,491 * 15,296 46,975 23,835 0 Repairs 55,012 21,210 * 338 * 80 * 1,086 3,830 28,468 0 Supplies 64,563 50,776 * 90 * 169 * 371 6,208 6,949 0 Salaries and wages 222,883 62,381 * 2,307 * 6,230 * 21,463 51,725 78,777 0 Taxes paid 40,331 5,982 * 343 * 1,506 * 2,799 18,939 10,762 * 32 Travel 12,139 5,156 * 960 * 260 0 1,814 3,949 0 Utilities 33,162 7,210 * 516 * 982 * 2,878 13,771 7,805 0 Other business deductions 137,135 15,788 * 2,265 * 3,044 * 2,539 34,895 78,603 0 Home office business deductions, total 10,217 * 531 * 453 0 0 * 9,189 * 44 0 Depreciation, Form 8829 [3] * 408 * 9 0 0 0 * 385 * 14 0 Casualty loss, Form 8829 [3] 0 0 0 0 0 0 0 0 Excess—casualty depreciations, Form 8829 [3] * 4 0 0 0 0 * 4 0 0Net income [1,2] 561,720 109,336 * 12,047 * 6,913 * 12,001 111,159 310,264 * 6,181Returns with Schedule C-EZ: Number of returns 5,070 * 313 * 3 0 * 1,020 * 1,330 2,405 * 299 Business receipts 40,130 * 2,357 * 2 0 * 9,831 * 884 27,057 * 505 Business deductions 4,514 * 401 0 0 * 3,649 * 189 * 275 0 Net income 35,615 * 1,956 * 2 0 * 6,182 * 695 26,782 * 505Footnotes at end of table.
Rental and leasing services
Real estate and rental and leasing—continued
Table 2. Nonfarm Sole Proprietorships: Income Statements, by Industrial Sectors, Tax Year 2014—Continued
Commercialand
industrialmachinery
andequipment
rentaland leasing
Lessors of nonfinancialintangible
assets(except
copyrightedworks)
Total
Automotiveequipment
rentaland leasing
Consumerelectronics
andappliances
rental
Formal wearand costume
rental
Video tapeand disc
rental
Generalrental
centers and other
consumergoodsrental
Net income status, item
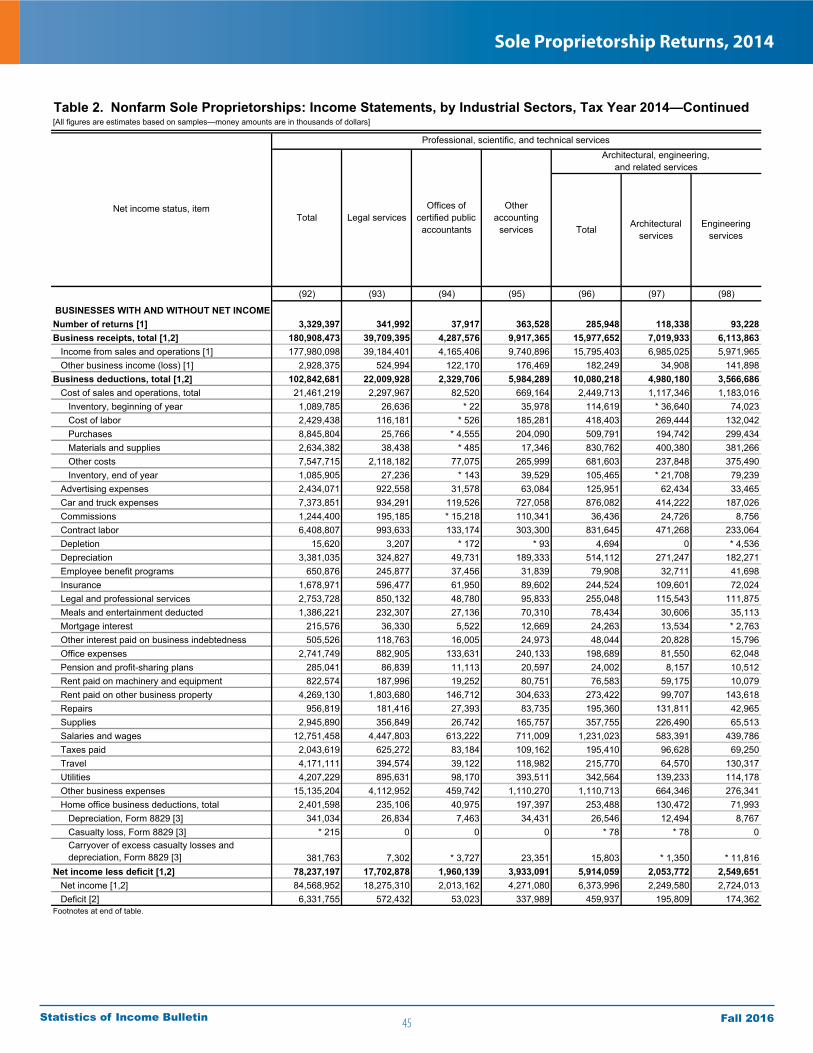
45
Sole Proprietorship Returns, 2014
Fall 2016Statistics of Income Bulletin
[All figures are estimates based on samples—money amounts are in thousands of dollars]
(92) (93) (94) (95) (96) (97) (98)
BUSINESSES WITH AND WITHOUT NET INCOMENumber of returns [1] 3,329,397 341,992 37,917 363,528 285,948 118,338 93,228Business receipts, total [1,2] 180,908,473 39,709,395 4,287,576 9,917,365 15,977,652 7,019,933 6,113,863 Income from sales and operations [1] 177,980,098 39,184,401 4,165,406 9,740,896 15,795,403 6,985,025 5,971,965 Other business income (loss) [1] 2,928,375 524,994 122,170 176,469 182,249 34,908 141,898Business deductions, total [1,2] 102,842,681 22,009,928 2,329,706 5,984,289 10,080,218 4,980,180 3,566,686 Cost of sales and operations, total 21,461,219 2,297,967 82,520 669,164 2,449,713 1,117,346 1,183,016 Inventory, beginning of year 1,089,785 26,636 * 22 35,978 114,619 * 36,640 74,023 Cost of labor 2,429,438 116,181 * 526 185,281 418,403 269,444 132,042 Purchases 8,845,804 25,766 * 4,555 204,090 509,791 194,742 299,434 Materials and supplies 2,634,382 38,438 * 485 17,346 830,762 400,380 381,266 Other costs 7,547,715 2,118,182 77,075 265,999 681,603 237,848 375,490 Inventory, end of year 1,085,905 27,236 * 143 39,529 105,465 * 21,708 79,239 Advertising expenses 2,434,071 922,558 31,578 63,084 125,951 62,434 33,465 Car and truck expenses 7,373,851 934,291 119,526 727,058 876,082 414,222 187,026 Commissions 1,244,400 195,185 * 15,218 110,341 36,436 24,726 8,756 Contract labor 6,408,807 993,633 133,174 303,300 831,645 471,268 233,064 Depletion 15,620 3,207 * 172 * 93 4,694 0 * 4,536 Depreciation 3,381,035 324,827 49,731 189,333 514,112 271,247 182,271 Employee benefit programs 650,876 245,877 37,456 31,839 79,908 32,711 41,698 Insurance 1,678,971 596,477 61,950 89,602 244,524 109,601 72,024 Legal and professional services 2,753,728 850,132 48,780 95,833 255,048 115,543 111,875 Meals and entertainment deducted 1,386,221 232,307 27,136 70,310 78,434 30,606 35,113 Mortgage interest 215,576 36,330 5,522 12,669 24,263 13,534 * 2,763 Other interest paid on business indebtedness 505,526 118,763 16,005 24,973 48,044 20,828 15,796 Office expenses 2,741,749 882,905 133,631 240,133 198,689 81,550 62,048 Pension and profit-sharing plans 285,041 86,839 11,113 20,597 24,002 8,157 10,512 Rent paid on machinery and equipment 822,574 187,996 19,252 80,751 76,583 59,175 10,079 Rent paid on other business property 4,269,130 1,803,680 146,712 304,633 273,422 99,707 143,618 Repairs 956,819 181,416 27,393 83,735 195,360 131,811 42,965 Supplies 2,945,890 356,849 26,742 165,757 357,755 226,490 65,513 Salaries and wages 12,751,458 4,447,803 613,222 711,009 1,231,023 583,391 439,786 Taxes paid 2,043,619 625,272 83,184 109,162 195,410 96,628 69,250 Travel 4,171,111 394,574 39,122 118,982 215,770 64,570 130,317 Utilities 4,207,229 895,631 98,170 393,511 342,564 139,233 114,178 Other business expenses 15,135,204 4,112,952 459,742 1,110,270 1,110,713 664,346 276,341 Home office business deductions, total 2,401,598 235,106 40,975 197,397 253,488 130,472 71,993 Depreciation, Form 8829 [3] 341,034 26,834 7,463 34,431 26,546 12,494 8,767 Casualty loss, Form 8829 [3] * 215 0 0 0 * 78 * 78 0 Carryover of excess casualty losses and depreciation, Form 8829 [3] 381,763 7,302 * 3,727 23,351 15,803 * 1,350 * 11,816Net income less deficit [1,2] 78,237,197 17,702,878 1,960,139 3,933,091 5,914,059 2,053,772 2,549,651 Net income [1,2] 84,568,952 18,275,310 2,013,162 4,271,080 6,373,996 2,249,580 2,724,013 Deficit [2] 6,331,755 572,432 53,023 337,989 459,937 195,809 174,362Footnotes at end of table.
Architectural, engineering, and related services
Table 2. Nonfarm Sole Proprietorships: Income Statements, by Industrial Sectors, Tax Year 2014—Continued
Net income status, item
Professional, scientific, and technical services
Total Legal servicesOffices of
certified publicaccountants
Otheraccounting
services Total Architecturalservices
Engineeringservices
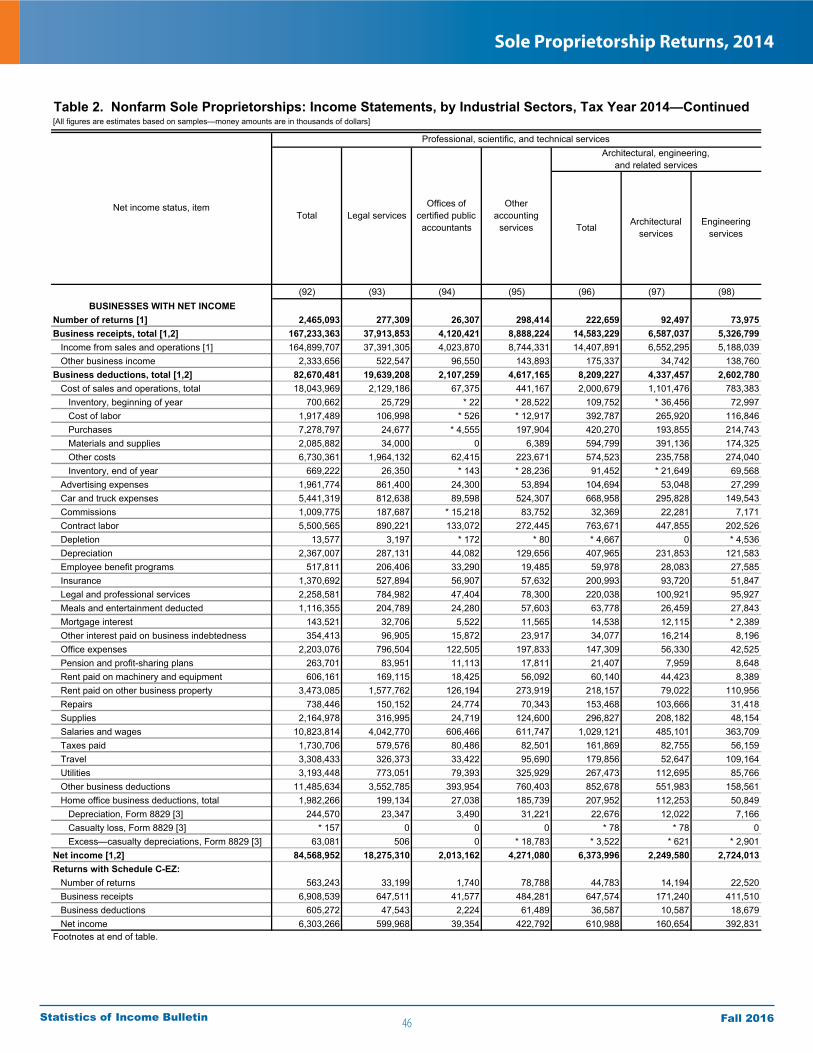
46
Sole Proprietorship Returns, 2014
Fall 2016Statistics of Income Bulletin
[All figures are estimates based on samples—money amounts are in thousands of dollars]
(92) (93) (94) (95) (96) (97) (98)BUSINESSES WITH NET INCOME
Number of returns [1] 2,465,093 277,309 26,307 298,414 222,659 92,497 73,975Business receipts, total [1,2] 167,233,363 37,913,853 4,120,421 8,888,224 14,583,229 6,587,037 5,326,799 Income from sales and operations [1] 164,899,707 37,391,305 4,023,870 8,744,331 14,407,891 6,552,295 5,188,039 Other business income 2,333,656 522,547 96,550 143,893 175,337 34,742 138,760Business deductions, total [1,2] 82,670,481 19,639,208 2,107,259 4,617,165 8,209,227 4,337,457 2,602,780 Cost of sales and operations, total 18,043,969 2,129,186 67,375 441,167 2,000,679 1,101,476 783,383 Inventory, beginning of year 700,662 25,729 * 22 * 28,522 109,752 * 36,456 72,997 Cost of labor 1,917,489 106,998 * 526 * 12,917 392,787 265,920 116,846 Purchases 7,278,797 24,677 * 4,555 197,904 420,270 193,855 214,743 Materials and supplies 2,085,882 34,000 0 6,389 594,799 391,136 174,325 Other costs 6,730,361 1,964,132 62,415 223,671 574,523 235,758 274,040 Inventory, end of year 669,222 26,350 * 143 * 28,236 91,452 * 21,649 69,568 Advertising expenses 1,961,774 861,400 24,300 53,894 104,694 53,048 27,299 Car and truck expenses 5,441,319 812,638 89,598 524,307 668,958 295,828 149,543 Commissions 1,009,775 187,687 * 15,218 83,752 32,369 22,281 7,171 Contract labor 5,500,565 890,221 133,072 272,445 763,671 447,855 202,526 Depletion 13,577 3,197 * 172 * 80 * 4,667 0 * 4,536 Depreciation 2,367,007 287,131 44,082 129,656 407,965 231,853 121,583 Employee benefit programs 517,811 206,406 33,290 19,485 59,978 28,083 27,585 Insurance 1,370,692 527,894 56,907 57,632 200,993 93,720 51,847 Legal and professional services 2,258,581 784,982 47,404 78,300 220,038 100,921 95,927 Meals and entertainment deducted 1,116,355 204,789 24,280 57,603 63,778 26,459 27,843 Mortgage interest 143,521 32,706 5,522 11,565 14,538 12,115 * 2,389 Other interest paid on business indebtedness 354,413 96,905 15,872 23,917 34,077 16,214 8,196 Office expenses 2,203,076 796,504 122,505 197,833 147,309 56,330 42,525 Pension and profit-sharing plans 263,701 83,951 11,113 17,811 21,407 7,959 8,648 Rent paid on machinery and equipment 606,161 169,115 18,425 56,092 60,140 44,423 8,389 Rent paid on other business property 3,473,085 1,577,762 126,194 273,919 218,157 79,022 110,956 Repairs 738,446 150,152 24,774 70,343 153,468 103,666 31,418 Supplies 2,164,978 316,995 24,719 124,600 296,827 208,182 48,154 Salaries and wages 10,823,814 4,042,770 606,466 611,747 1,029,121 485,101 363,709 Taxes paid 1,730,706 579,576 80,486 82,501 161,869 82,755 56,159 Travel 3,308,433 326,373 33,422 95,690 179,856 52,647 109,164 Utilities 3,193,448 773,051 79,393 325,929 267,473 112,695 85,766 Other business deductions 11,485,634 3,552,785 393,954 760,403 852,678 551,983 158,561 Home office business deductions, total 1,982,266 199,134 27,038 185,739 207,952 112,253 50,849 Depreciation, Form 8829 [3] 244,570 23,347 3,490 31,221 22,676 12,022 7,166 Casualty loss, Form 8829 [3] * 157 0 0 0 * 78 * 78 0 Excess—casualty depreciations, Form 8829 [3] 63,081 506 0 * 18,783 * 3,522 * 621 * 2,901Net income [1,2] 84,568,952 18,275,310 2,013,162 4,271,080 6,373,996 2,249,580 2,724,013Returns with Schedule C-EZ: Number of returns 563,243 33,199 1,740 78,788 44,783 14,194 22,520 Business receipts 6,908,539 647,511 41,577 484,281 647,574 171,240 411,510 Business deductions 605,272 47,543 2,224 61,489 36,587 10,587 18,679 Net income 6,303,266 599,968 39,354 422,792 610,988 160,654 392,831Footnotes at end of table.
Architectural, engineering, and related services
Professional, scientific, and technical services
Table 2. Nonfarm Sole Proprietorships: Income Statements, by Industrial Sectors, Tax Year 2014—Continued
Total Architecturalservices
Engineeringservices
Net income status, itemTotal Legal services
Offices ofcertified publicaccountants
Otheraccounting
services
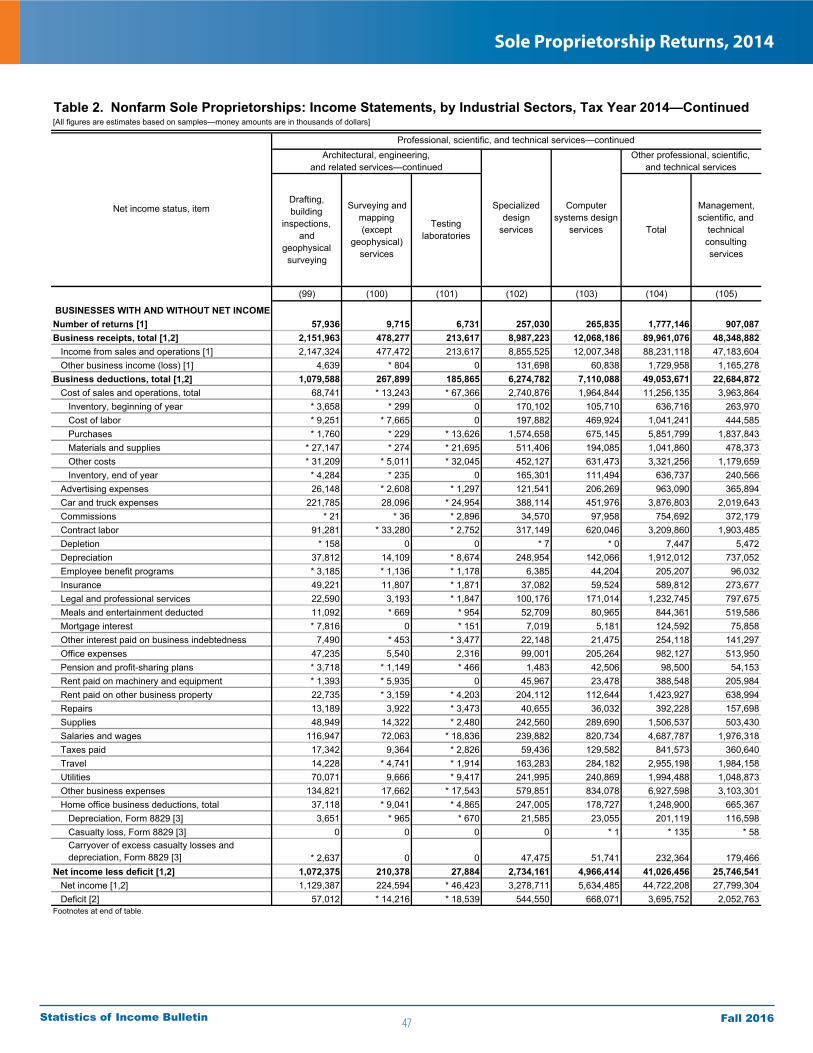
47
Sole Proprietorship Returns, 2014
Fall 2016Statistics of Income Bulletin
[All figures are estimates based on samples—money amounts are in thousands of dollars]
(99) (100) (101) (102) (103) (104) (105)
BUSINESSES WITH AND WITHOUT NET INCOMENumber of returns [1] 57,936 9,715 6,731 257,030 265,835 1,777,146 907,087Business receipts, total [1,2] 2,151,963 478,277 213,617 8,987,223 12,068,186 89,961,076 48,348,882 Income from sales and operations [1] 2,147,324 477,472 213,617 8,855,525 12,007,348 88,231,118 47,183,604 Other business income (loss) [1] 4,639 * 804 0 131,698 60,838 1,729,958 1,165,278Business deductions, total [1,2] 1,079,588 267,899 185,865 6,274,782 7,110,088 49,053,671 22,684,872 Cost of sales and operations, total 68,741 * 13,243 * 67,366 2,740,876 1,964,844 11,256,135 3,963,864 Inventory, beginning of year * 3,658 * 299 0 170,102 105,710 636,716 263,970 Cost of labor * 9,251 * 7,665 0 197,882 469,924 1,041,241 444,585 Purchases * 1,760 * 229 * 13,626 1,574,658 675,145 5,851,799 1,837,843 Materials and supplies * 27,147 * 274 * 21,695 511,406 194,085 1,041,860 478,373 Other costs * 31,209 * 5,011 * 32,045 452,127 631,473 3,321,256 1,179,659 Inventory, end of year * 4,284 * 235 0 165,301 111,494 636,737 240,566 Advertising expenses 26,148 * 2,608 * 1,297 121,541 206,269 963,090 365,894 Car and truck expenses 221,785 28,096 * 24,954 388,114 451,976 3,876,803 2,019,643 Commissions * 21 * 36 * 2,896 34,570 97,958 754,692 372,179 Contract labor 91,281 * 33,280 * 2,752 317,149 620,046 3,209,860 1,903,485 Depletion * 158 0 0 * 7 * 0 7,447 5,472 Depreciation 37,812 14,109 * 8,674 248,954 142,066 1,912,012 737,052 Employee benefit programs * 3,185 * 1,136 * 1,178 6,385 44,204 205,207 96,032 Insurance 49,221 11,807 * 1,871 37,082 59,524 589,812 273,677 Legal and professional services 22,590 3,193 * 1,847 100,176 171,014 1,232,745 797,675 Meals and entertainment deducted 11,092 * 669 * 954 52,709 80,965 844,361 519,586 Mortgage interest * 7,816 0 * 151 7,019 5,181 124,592 75,858 Other interest paid on business indebtedness 7,490 * 453 * 3,477 22,148 21,475 254,118 141,297 Office expenses 47,235 5,540 2,316 99,001 205,264 982,127 513,950 Pension and profit-sharing plans * 3,718 * 1,149 * 466 1,483 42,506 98,500 54,153 Rent paid on machinery and equipment * 1,393 * 5,935 0 45,967 23,478 388,548 205,984 Rent paid on other business property 22,735 * 3,159 * 4,203 204,112 112,644 1,423,927 638,994 Repairs 13,189 3,922 * 3,473 40,655 36,032 392,228 157,698 Supplies 48,949 14,322 * 2,480 242,560 289,690 1,506,537 503,430 Salaries and wages 116,947 72,063 * 18,836 239,882 820,734 4,687,787 1,976,318 Taxes paid 17,342 9,364 * 2,826 59,436 129,582 841,573 360,640 Travel 14,228 * 4,741 * 1,914 163,283 284,182 2,955,198 1,984,158 Utilities 70,071 9,666 * 9,417 241,995 240,869 1,994,488 1,048,873 Other business expenses 134,821 17,662 * 17,543 579,851 834,078 6,927,598 3,103,301 Home office business deductions, total 37,118 * 9,041 * 4,865 247,005 178,727 1,248,900 665,367 Depreciation, Form 8829 [3] 3,651 * 965 * 670 21,585 23,055 201,119 116,598 Casualty loss, Form 8829 [3] 0 0 0 0 * 1 * 135 * 58 Carryover of excess casualty losses and depreciation, Form 8829 [3] * 2,637 0 0 47,475 51,741 232,364 179,466Net income less deficit [1,2] 1,072,375 210,378 27,884 2,734,161 4,966,414 41,026,456 25,746,541 Net income [1,2] 1,129,387 224,594 * 46,423 3,278,711 5,634,485 44,722,208 27,799,304 Deficit [2] 57,012 * 14,216 * 18,539 544,550 668,071 3,695,752 2,052,763Footnotes at end of table.
Architectural, engineering, and related services—continued
Professional, scientific, and technical services—continuedOther professional, scientific,
and technical services
Net income status, item Surveying and mapping(except
geophysical)services
Table 2. Nonfarm Sole Proprietorships: Income Statements, by Industrial Sectors, Tax Year 2014—Continued
Testinglaboratories
Drafting,building
inspections,and
geophysicalsurveying
Specializeddesign
services
Computersystems design
services Total
Management,scientific, and
technicalconsultingservices

48
Sole Proprietorship Returns, 2014
Fall 2016Statistics of Income Bulletin
[All figures are estimates based on samples—money amounts are in thousands of dollars]
(99) (100) (101) (102) (103) (104) (105)BUSINESSES WITH NET INCOME
Number of returns [1] 44,621 7,844 * 3,721 163,457 183,255 1,293,693 665,670Business receipts, total [1,2] 2,022,755 471,611 * 175,027 7,856,895 10,812,536 83,058,206 44,815,157 Income from sales and operations [1] 2,021,724 470,807 * 175,027 7,734,395 10,800,070 81,797,845 43,985,111 Other business income * 1,031 * 804 0 122,500 12,466 1,260,361 830,046Business deductions, total [1,2] 893,368 247,018 * 128,604 4,579,477 5,181,107 38,337,039 17,008,166 Cost of sales and operations, total * 37,853 * 12,740 * 65,228 2,280,491 1,609,273 9,515,798 3,170,298 Inventory, beginning of year 0 * 299 0 59,538 64,105 412,995 154,225 Cost of labor * 2,357 * 7,665 0 194,040 293,783 916,438 399,587 Purchases * 183 * 0 * 11,488 1,258,025 600,363 4,773,003 1,299,134 Materials and supplies * 7,644 0 * 21,695 429,062 125,959 895,672 426,745 Other costs * 27,670 * 5,011 * 32,045 389,070 582,073 2,934,476 1,024,710 Inventory, end of year 0 * 235 0 49,244 57,011 416,786 134,103 Advertising expenses 20,506 * 2,608 * 1,234 89,727 150,340 677,419 224,096 Car and truck expenses 193,240 27,152 * 3,194 267,078 275,048 2,803,692 1,438,908 Commissions * 21 * 36 * 2,860 12,506 81,858 596,384 287,310 Contract labor 90,443 * 21,187 * 1,660 192,121 491,829 2,757,207 1,623,882 Depletion * 130 0 0 * 7 * 0 5,454 3,489 Depreciation 33,133 14,109 * 7,287 97,323 79,659 1,321,192 464,228 Employee benefit programs * 3,164 * 1,136 * 11 5,136 33,551 159,965 71,289 Insurance 42,946 10,889 * 1,591 25,807 44,329 457,132 198,451 Legal and professional services 19,305 2,656 * 1,229 69,895 133,606 924,356 596,805 Meals and entertainment deducted 8,148 * 669 * 659 40,620 59,591 665,693 419,772 Mortgage interest * 33 0 0 * 940 * 3,854 74,395 32,328 Other interest paid on business indebtedness 5,737 * 453 * 3,477 11,424 17,906 154,313 73,184 Office expenses 42,570 5,073 * 812 60,751 117,599 760,574 395,740 Pension and profit-sharing plans * 3,651 * 1,149 0 1,483 42,248 85,687 46,349 Rent paid on machinery and equipment * 1,393 * 5,935 0 18,498 13,267 270,625 119,693 Rent paid on other business property * 21,276 * 3,159 * 3,745 166,766 66,566 1,043,719 415,524 Repairs 11,166 3,784 * 3,434 23,494 15,014 301,202 109,305 Supplies 25,022 14,322 * 1,147 155,611 108,595 1,137,632 352,509 Salaries and wages 106,958 * 69,188 * 4,166 169,815 585,249 3,778,646 1,411,438 Taxes paid 12,841 8,638 * 1,477 38,804 87,855 699,613 286,831 Travel 11,546 * 4,685 * 1,814 115,443 209,618 2,348,030 1,573,477 Utilities 55,468 8,515 * 5,030 149,702 152,038 1,445,860 738,346 Other business deductions 111,329 17,188 * 13,617 371,940 605,404 4,948,470 2,231,386 Home office business deductions, total 30,988 * 9,041 * 4,822 181,272 150,307 1,030,824 524,178 Depreciation, Form 8829 [3] 1,864 * 965 * 659 14,691 14,140 135,004 65,918 Casualty loss, Form 8829 [3] 0 0 0 0 * 1 * 77 * 0 Excess—casualty depreciations, Form 8829 [3] 0 0 0 0 * 652 39,618 20,659Net income [1,2] 1,129,387 224,594 * 46,423 3,278,711 5,634,485 44,722,208 27,799,304Returns with Schedule C-EZ: Number of returns * 4,611 * 2,140 * 1,319 37,248 55,196 312,289 147,382 Business receipts * 50,986 * 4,080 * 9,759 306,143 864,125 3,917,328 2,295,739 Business deductions * 4,502 * 2,706 * 112 32,823 47,320 377,288 200,713 Net income * 46,483 * 1,373 * 9,646 273,320 816,805 3,540,040 2,095,026Footnotes at end of table.
Architectural, engineering, and related services—continued
Other professional, scientific, and technical services
Professional, scientific, and technical services—continued
Table 2. Nonfarm Sole Proprietorships: Income Statements, by Industrial Sectors, Tax Year 2014—Continued
Computersystems design
services Total
Management,scientific, and
technicalconsultingservices
Drafting,building
inspections,and
geophysicalsurveying
Net income status, item Specializeddesign
servicesTestinglaboratories
Surveying and mapping(except
geophysical)services
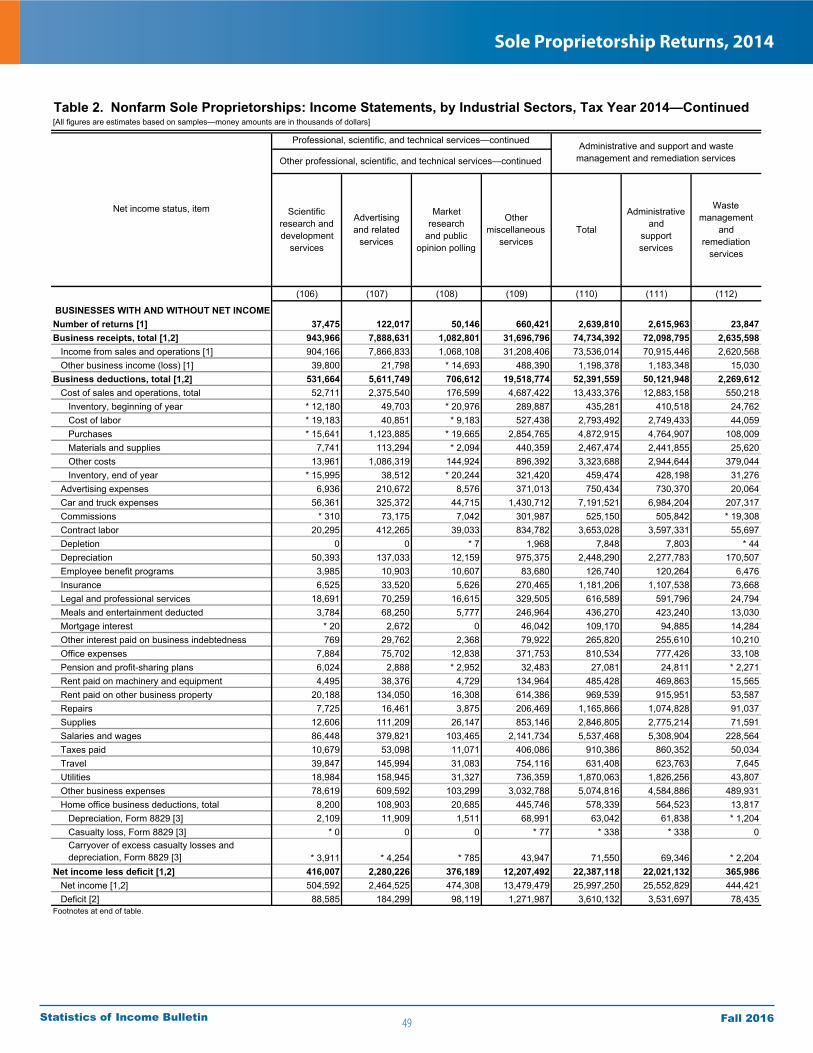
49
Sole Proprietorship Returns, 2014
Fall 2016Statistics of Income Bulletin
[All figures are estimates based on samples—money amounts are in thousands of dollars]
(106) (107) (108) (109) (110) (111) (112)
BUSINESSES WITH AND WITHOUT NET INCOMENumber of returns [1] 37,475 122,017 50,146 660,421 2,639,810 2,615,963 23,847Business receipts, total [1,2] 943,966 7,888,631 1,082,801 31,696,796 74,734,392 72,098,795 2,635,598 Income from sales and operations [1] 904,166 7,866,833 1,068,108 31,208,406 73,536,014 70,915,446 2,620,568 Other business income (loss) [1] 39,800 21,798 * 14,693 488,390 1,198,378 1,183,348 15,030Business deductions, total [1,2] 531,664 5,611,749 706,612 19,518,774 52,391,559 50,121,948 2,269,612 Cost of sales and operations, total 52,711 2,375,540 176,599 4,687,422 13,433,376 12,883,158 550,218 Inventory, beginning of year * 12,180 49,703 * 20,976 289,887 435,281 410,518 24,762 Cost of labor * 19,183 40,851 * 9,183 527,438 2,793,492 2,749,433 44,059 Purchases * 15,641 1,123,885 * 19,665 2,854,765 4,872,915 4,764,907 108,009 Materials and supplies 7,741 113,294 * 2,094 440,359 2,467,474 2,441,855 25,620 Other costs 13,961 1,086,319 144,924 896,392 3,323,688 2,944,644 379,044 Inventory, end of year * 15,995 38,512 * 20,244 321,420 459,474 428,198 31,276 Advertising expenses 6,936 210,672 8,576 371,013 750,434 730,370 20,064 Car and truck expenses 56,361 325,372 44,715 1,430,712 7,191,521 6,984,204 207,317 Commissions * 310 73,175 7,042 301,987 525,150 505,842 * 19,308 Contract labor 20,295 412,265 39,033 834,782 3,653,028 3,597,331 55,697 Depletion 0 0 * 7 1,968 7,848 7,803 * 44 Depreciation 50,393 137,033 12,159 975,375 2,448,290 2,277,783 170,507 Employee benefit programs 3,985 10,903 10,607 83,680 126,740 120,264 6,476 Insurance 6,525 33,520 5,626 270,465 1,181,206 1,107,538 73,668 Legal and professional services 18,691 70,259 16,615 329,505 616,589 591,796 24,794 Meals and entertainment deducted 3,784 68,250 5,777 246,964 436,270 423,240 13,030 Mortgage interest * 20 2,672 0 46,042 109,170 94,885 14,284 Other interest paid on business indebtedness 769 29,762 2,368 79,922 265,820 255,610 10,210 Office expenses 7,884 75,702 12,838 371,753 810,534 777,426 33,108 Pension and profit-sharing plans 6,024 2,888 * 2,952 32,483 27,081 24,811 * 2,271 Rent paid on machinery and equipment 4,495 38,376 4,729 134,964 485,428 469,863 15,565 Rent paid on other business property 20,188 134,050 16,308 614,386 969,539 915,951 53,587 Repairs 7,725 16,461 3,875 206,469 1,165,866 1,074,828 91,037 Supplies 12,606 111,209 26,147 853,146 2,846,805 2,775,214 71,591 Salaries and wages 86,448 379,821 103,465 2,141,734 5,537,468 5,308,904 228,564 Taxes paid 10,679 53,098 11,071 406,086 910,386 860,352 50,034 Travel 39,847 145,994 31,083 754,116 631,408 623,763 7,645 Utilities 18,984 158,945 31,327 736,359 1,870,063 1,826,256 43,807 Other business expenses 78,619 609,592 103,299 3,032,788 5,074,816 4,584,886 489,931 Home office business deductions, total 8,200 108,903 20,685 445,746 578,339 564,523 13,817 Depreciation, Form 8829 [3] 2,109 11,909 1,511 68,991 63,042 61,838 * 1,204 Casualty loss, Form 8829 [3] * 0 0 0 * 77 * 338 * 338 0 Carryover of excess casualty losses and depreciation, Form 8829 [3] * 3,911 * 4,254 * 785 43,947 71,550 69,346 * 2,204Net income less deficit [1,2] 416,007 2,280,226 376,189 12,207,492 22,387,118 22,021,132 365,986 Net income [1,2] 504,592 2,464,525 474,308 13,479,479 25,997,250 25,552,829 444,421 Deficit [2] 88,585 184,299 98,119 1,271,987 3,610,132 3,531,697 78,435Footnotes at end of table.
Professional, scientific, and technical services—continued
Other professional, scientific, and technical services—continued
Marketresearch
and publicopinion polling
Othermiscellaneous
services
Table 2. Nonfarm Sole Proprietorships: Income Statements, by Industrial Sectors, Tax Year 2014—Continued
Net income status, item
Administrative and support and waste management and remediation services
Administrativeand
supportservices
Scientificresearch anddevelopment
services
Advertisingand related
servicesTotal
Wastemanagement
andremediation
services
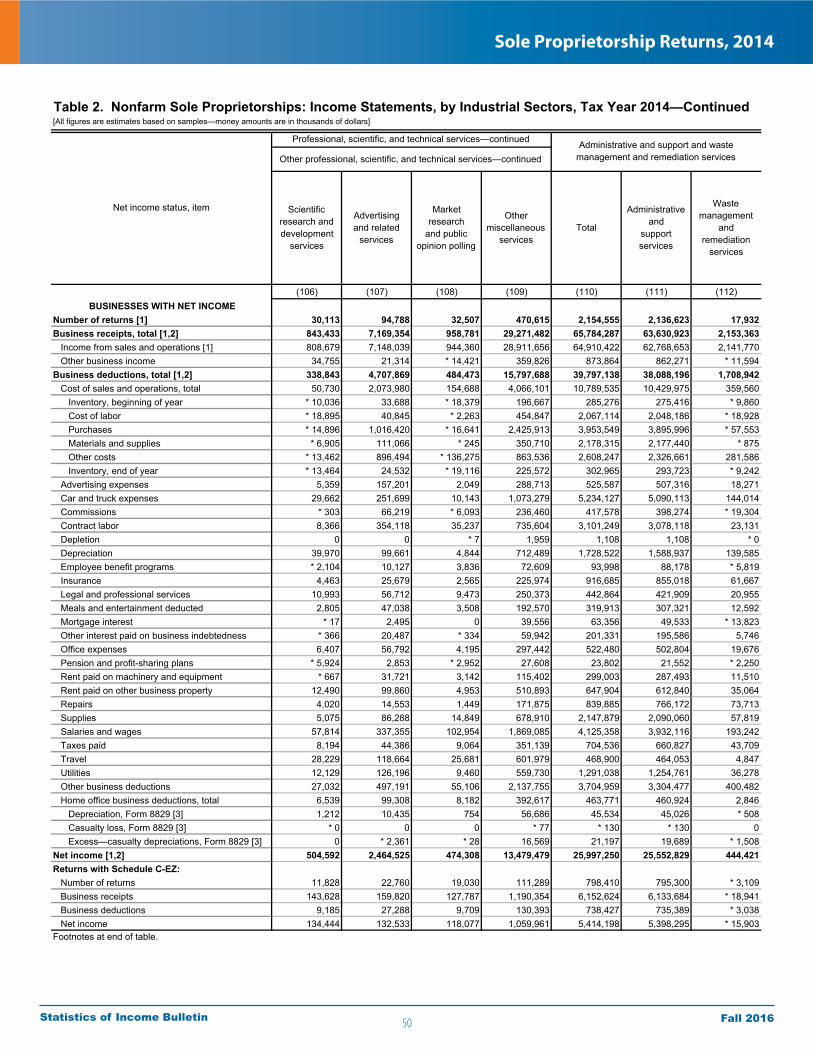
50
Sole Proprietorship Returns, 2014
Fall 2016Statistics of Income Bulletin
[All figures are estimates based on samples—money amounts are in thousands of dollars]
(106) (107) (108) (109) (110) (111) (112)BUSINESSES WITH NET INCOME
Number of returns [1] 30,113 94,788 32,507 470,615 2,154,555 2,136,623 17,932Business receipts, total [1,2] 843,433 7,169,354 958,781 29,271,482 65,784,287 63,630,923 2,153,363 Income from sales and operations [1] 808,679 7,148,039 944,360 28,911,656 64,910,422 62,768,653 2,141,770 Other business income 34,755 21,314 * 14,421 359,826 873,864 862,271 * 11,594Business deductions, total [1,2] 338,843 4,707,869 484,473 15,797,688 39,797,138 38,088,196 1,708,942 Cost of sales and operations, total 50,730 2,073,980 154,688 4,066,101 10,789,535 10,429,975 359,560 Inventory, beginning of year * 10,036 33,688 * 18,379 196,667 285,276 275,416 * 9,860 Cost of labor * 18,895 40,845 * 2,263 454,847 2,067,114 2,048,186 * 18,928 Purchases * 14,896 1,016,420 * 16,641 2,425,913 3,953,549 3,895,996 * 57,553 Materials and supplies * 6,905 111,066 * 245 350,710 2,178,315 2,177,440 * 875 Other costs * 13,462 896,494 * 136,275 863,536 2,608,247 2,326,661 281,586 Inventory, end of year * 13,464 24,532 * 19,116 225,572 302,965 293,723 * 9,242 Advertising expenses 5,359 157,201 2,049 288,713 525,587 507,316 18,271 Car and truck expenses 29,662 251,699 10,143 1,073,279 5,234,127 5,090,113 144,014 Commissions * 303 66,219 * 6,093 236,460 417,578 398,274 * 19,304 Contract labor 8,366 354,118 35,237 735,604 3,101,249 3,078,118 23,131 Depletion 0 0 * 7 1,959 1,108 1,108 * 0 Depreciation 39,970 99,661 4,844 712,489 1,728,522 1,588,937 139,585 Employee benefit programs * 2,104 10,127 3,836 72,609 93,998 88,178 * 5,819 Insurance 4,463 25,679 2,565 225,974 916,685 855,018 61,667 Legal and professional services 10,993 56,712 9,473 250,373 442,864 421,909 20,955 Meals and entertainment deducted 2,805 47,038 3,508 192,570 319,913 307,321 12,592 Mortgage interest * 17 2,495 0 39,556 63,356 49,533 * 13,823 Other interest paid on business indebtedness * 366 20,487 * 334 59,942 201,331 195,586 5,746 Office expenses 6,407 56,792 4,195 297,442 522,480 502,804 19,676 Pension and profit-sharing plans * 5,924 2,853 * 2,952 27,608 23,802 21,552 * 2,250 Rent paid on machinery and equipment * 667 31,721 3,142 115,402 299,003 287,493 11,510 Rent paid on other business property 12,490 99,860 4,953 510,893 647,904 612,840 35,064 Repairs 4,020 14,553 1,449 171,875 839,885 766,172 73,713 Supplies 5,075 86,288 14,849 678,910 2,147,879 2,090,060 57,819 Salaries and wages 57,814 337,355 102,954 1,869,085 4,125,358 3,932,116 193,242 Taxes paid 8,194 44,386 9,064 351,139 704,536 660,827 43,709 Travel 28,229 118,664 25,681 601,979 468,900 464,053 4,847 Utilities 12,129 126,196 9,460 559,730 1,291,038 1,254,761 36,278 Other business deductions 27,032 497,191 55,106 2,137,755 3,704,959 3,304,477 400,482 Home office business deductions, total 6,539 99,308 8,182 392,617 463,771 460,924 2,846 Depreciation, Form 8829 [3] 1,212 10,435 754 56,686 45,534 45,026 * 508 Casualty loss, Form 8829 [3] * 0 0 0 * 77 * 130 * 130 0 Excess—casualty depreciations, Form 8829 [3] 0 * 2,361 * 28 16,569 21,197 19,689 * 1,508Net income [1,2] 504,592 2,464,525 474,308 13,479,479 25,997,250 25,552,829 444,421Returns with Schedule C-EZ: Number of returns 11,828 22,760 19,030 111,289 798,410 795,300 * 3,109 Business receipts 143,628 159,820 127,787 1,190,354 6,152,624 6,133,684 * 18,941 Business deductions 9,185 27,288 9,709 130,393 738,427 735,389 * 3,038 Net income 134,444 132,533 118,077 1,059,961 5,414,198 5,398,295 * 15,903Footnotes at end of table.
Other professional, scientific, and technical services—continued
Professional, scientific, and technical services—continued
Table 2. Nonfarm Sole Proprietorships: Income Statements, by Industrial Sectors, Tax Year 2014—Continued
Othermiscellaneous
servicesTotal
Administrativeand
supportservices
Wastemanagement
andremediation
services
Administrative and support and waste management and remediation services
Scientificresearch anddevelopment
services
Advertisingand related
services
Marketresearch
and publicopinion polling
Net income status, item

51
Sole Proprietorship Returns, 2014
Fall 2016Statistics of Income Bulletin
[All figures are estimates based on samples—money amounts are in thousands of dollars]
Educational services
(113) (114) (115) (116) (117) (118) (119)
BUSINESSES WITH AND WITHOUT NET INCOMENumber of returns [1] 826,208 2,145,748 1,173,607 183,450 35,924 77,737 40,905Business receipts, total [1,2] 11,929,733 120,066,019 97,577,308 32,878,219 3,437,635 25,042,595 4,594,491 Income from sales and operations [1] 11,873,355 118,265,515 96,372,529 32,160,610 3,365,129 24,887,139 4,577,292 Other business income (loss) [1] 56,378 1,800,504 1,204,779 717,609 72,506 155,457 17,199Business deductions, total [1,2] 8,202,740 70,587,439 56,440,951 17,121,932 1,306,310 16,941,671 2,857,645 Cost of sales and operations, total 640,831 5,296,524 4,697,900 1,451,857 8,176 1,414,657 139,062 Inventory, beginning of year 83,433 400,296 378,191 63,322 * 9,615 34,158 * 17,070 Cost of labor 143,392 924,932 805,237 285,148 * 1,289 227,516 * 1,320 Purchases 245,430 1,733,453 1,580,397 487,302 * 6,723 158,259 108,247 Materials and supplies 69,689 867,759 798,769 195,496 * 2 319,027 * 10,790 Other costs 187,510 1,796,033 1,530,664 485,367 * 200 713,923 32,128 Inventory, end of year 88,622 425,949 395,359 64,777 * 9,654 38,227 * 30,493 Advertising expenses 236,645 1,079,375 954,203 172,390 13,685 300,025 115,537 Car and truck expenses 956,466 3,582,861 2,549,217 382,881 75,311 177,813 96,362 Commissions 72,385 386,670 255,384 64,563 776 42,901 * 26,663 Contract labor 402,671 3,297,855 2,563,811 780,097 89,695 398,955 141,445 Depletion * 1,077 10,327 10,327 861 0 * 384 0 Depreciation 286,002 2,131,372 1,764,443 452,537 28,193 706,935 105,238 Employee benefit programs 11,437 617,781 524,624 222,956 9,564 148,635 26,262 Insurance 107,857 2,041,450 1,788,901 832,975 62,787 365,196 93,089 Legal and professional services 132,198 1,389,864 1,213,952 421,063 45,782 267,077 81,461 Meals and entertainment deducted 117,317 1,073,935 372,165 85,835 19,178 56,922 31,671 Mortgage interest 41,679 303,960 176,502 28,872 * 6,647 91,419 * 23,590 Other interest paid on business indebtedness 26,697 465,558 398,345 89,287 4,818 191,437 24,469 Office expenses 206,661 1,708,491 1,513,935 405,866 46,491 415,662 143,170 Pension and profit-sharing plans 13,131 419,827 417,240 222,197 10,864 151,765 2,128 Rent paid on machinery and equipment 66,787 633,159 473,922 140,072 26,086 77,582 38,037 Rent paid on other business property 750,410 5,449,264 4,574,828 1,229,134 136,572 1,092,096 534,684 Repairs 156,352 971,625 681,762 161,689 19,035 243,065 53,281 Supplies 432,594 4,341,836 3,364,841 1,015,902 43,239 1,324,861 223,183 Salaries and wages 658,217 16,758,830 14,067,685 4,091,400 196,928 5,889,712 413,758 Taxes paid 149,946 2,280,526 1,877,884 559,719 38,282 733,182 76,415 Travel 358,255 986,936 848,240 290,522 39,084 89,994 41,327 Utilities 457,155 2,732,230 1,954,185 416,433 69,486 452,352 145,485 Other business expenses 1,417,303 10,732,713 8,715,104 3,485,423 288,144 2,286,348 259,985 Home office business deductions, total 294,485 1,397,288 402,623 79,698 25,068 14,924 15,291 Depreciation, Form 8829 [3] 47,182 158,800 46,289 11,702 2,396 2,010 * 1,634 Casualty loss, Form 8829 [3] * 182 * 146 * 146 * 74 0 0 0 Carryover of excess casualty losses and depreciation, Form 8829 [3] 87,139 68,978 21,854 6,409 * 397 * 1,575 * 558Net income less deficit [1,2] 4,095,512 49,539,626 41,170,523 15,757,114 2,131,325 8,100,969 1,736,846 Net income [1,2] 5,168,036 52,121,130 42,887,082 16,011,907 2,142,753 8,220,265 1,795,565 Deficit [2] 1,072,524 2,581,504 1,716,559 254,793 11,428 119,296 58,720Footnotes at end of table.
Health care and social assistance
Ambulatory health care services
Table 2. Nonfarm Sole Proprietorships: Income Statements, by Industrial Sectors, Tax Year 2014—Continued
TotalNet income status, item
TotalTotal
Offices ofphysicians
(except mentalhealth
specialists)
Offices ofphysicians,
mentalhealth
specialists
Officesof
dentists
Officesof
chiropractors
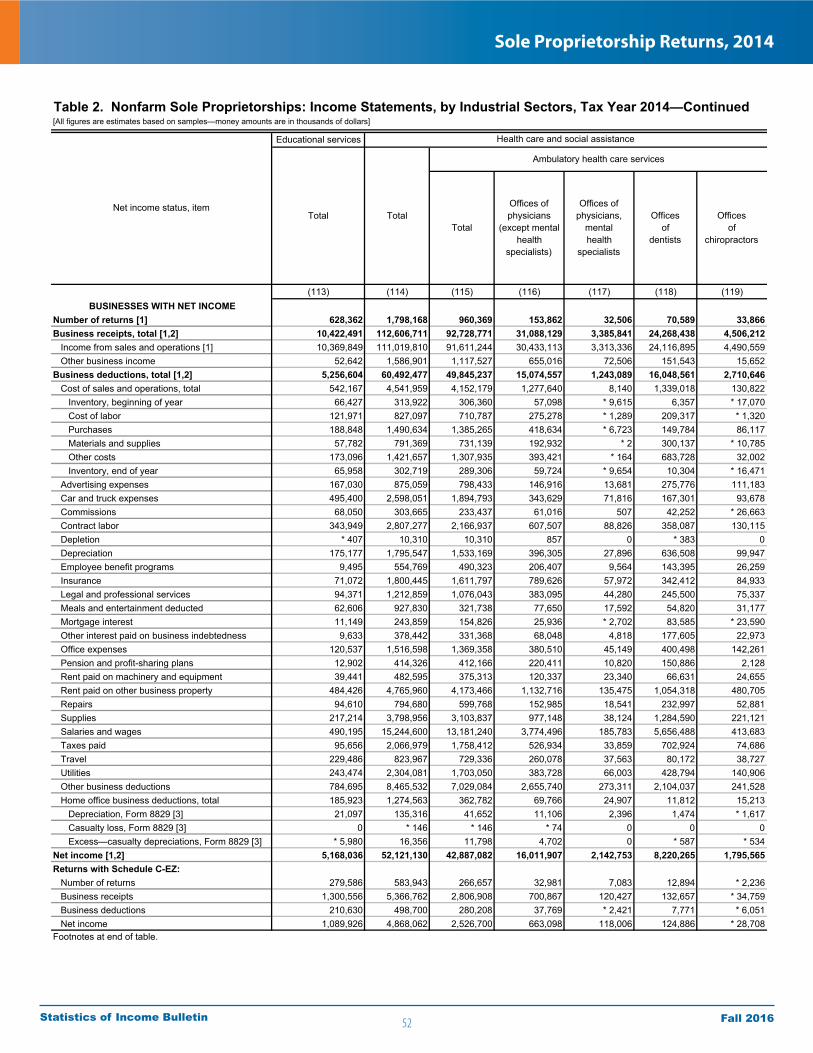
52
Sole Proprietorship Returns, 2014
Fall 2016Statistics of Income Bulletin
[All figures are estimates based on samples—money amounts are in thousands of dollars]
Educational services
(113) (114) (115) (116) (117) (118) (119)BUSINESSES WITH NET INCOME
Number of returns [1] 628,362 1,798,168 960,369 153,862 32,506 70,589 33,866Business receipts, total [1,2] 10,422,491 112,606,711 92,728,771 31,088,129 3,385,841 24,268,438 4,506,212 Income from sales and operations [1] 10,369,849 111,019,810 91,611,244 30,433,113 3,313,336 24,116,895 4,490,559 Other business income 52,642 1,586,901 1,117,527 655,016 72,506 151,543 15,652Business deductions, total [1,2] 5,256,604 60,492,477 49,845,237 15,074,557 1,243,089 16,048,561 2,710,646 Cost of sales and operations, total 542,167 4,541,959 4,152,179 1,277,640 8,140 1,339,018 130,822 Inventory, beginning of year 66,427 313,922 306,360 57,098 * 9,615 6,357 * 17,070 Cost of labor 121,971 827,097 710,787 275,278 * 1,289 209,317 * 1,320 Purchases 188,848 1,490,634 1,385,265 418,634 * 6,723 149,784 86,117 Materials and supplies 57,782 791,369 731,139 192,932 * 2 300,137 * 10,785 Other costs 173,096 1,421,657 1,307,935 393,421 * 164 683,728 32,002 Inventory, end of year 65,958 302,719 289,306 59,724 * 9,654 10,304 * 16,471 Advertising expenses 167,030 875,059 798,433 146,916 13,681 275,776 111,183 Car and truck expenses 495,400 2,598,051 1,894,793 343,629 71,816 167,301 93,678 Commissions 68,050 303,665 233,437 61,016 507 42,252 * 26,663 Contract labor 343,949 2,807,277 2,166,937 607,507 88,826 358,087 130,115 Depletion * 407 10,310 10,310 857 0 * 383 0 Depreciation 175,177 1,795,547 1,533,169 396,305 27,896 636,508 99,947 Employee benefit programs 9,495 554,769 490,323 206,407 9,564 143,395 26,259 Insurance 71,072 1,800,445 1,611,797 789,626 57,972 342,412 84,933 Legal and professional services 94,371 1,212,859 1,076,043 383,095 44,280 245,500 75,337 Meals and entertainment deducted 62,606 927,830 321,738 77,650 17,592 54,820 31,177 Mortgage interest 11,149 243,859 154,826 25,936 * 2,702 83,585 * 23,590 Other interest paid on business indebtedness 9,633 378,442 331,368 68,048 4,818 177,605 22,973 Office expenses 120,537 1,516,598 1,369,358 380,510 45,149 400,498 142,261 Pension and profit-sharing plans 12,902 414,326 412,166 220,411 10,820 150,886 2,128 Rent paid on machinery and equipment 39,441 482,595 375,313 120,337 23,340 66,631 24,655 Rent paid on other business property 484,426 4,765,960 4,173,466 1,132,716 135,475 1,054,318 480,705 Repairs 94,610 794,680 599,768 152,985 18,541 232,997 52,881 Supplies 217,214 3,798,956 3,103,837 977,148 38,124 1,284,590 221,121 Salaries and wages 490,195 15,244,600 13,181,240 3,774,496 185,783 5,656,488 413,683 Taxes paid 95,656 2,066,979 1,758,412 526,934 33,859 702,924 74,686 Travel 229,486 823,967 729,336 260,078 37,563 80,172 38,727 Utilities 243,474 2,304,081 1,703,050 383,728 66,003 428,794 140,906 Other business deductions 784,695 8,465,532 7,029,084 2,655,740 273,311 2,104,037 241,528 Home office business deductions, total 185,923 1,274,563 362,782 69,766 24,907 11,812 15,213 Depreciation, Form 8829 [3] 21,097 135,316 41,652 11,106 2,396 1,474 * 1,617 Casualty loss, Form 8829 [3] 0 * 146 * 146 * 74 0 0 0 Excess—casualty depreciations, Form 8829 [3] * 5,980 16,356 11,798 4,702 0 * 587 * 534Net income [1,2] 5,168,036 52,121,130 42,887,082 16,011,907 2,142,753 8,220,265 1,795,565Returns with Schedule C-EZ: Number of returns 279,586 583,943 266,657 32,981 7,083 12,894 * 2,236 Business receipts 1,300,556 5,366,762 2,806,908 700,867 120,427 132,657 * 34,759 Business deductions 210,630 498,700 280,208 37,769 * 2,421 7,771 * 6,051 Net income 1,089,926 4,868,062 2,526,700 663,098 118,006 124,886 * 28,708Footnotes at end of table.
Net income status, itemTotal Total
Table 2. Nonfarm Sole Proprietorships: Income Statements, by Industrial Sectors, Tax Year 2014—Continued
Officesof
chiropractors
Ambulatory health care services
Health care and social assistance
Offices ofphysicians
(except mentalhealth
specialists)
Offices ofphysicians,
mentalhealth
specialists
Officesof
dentistsTotal
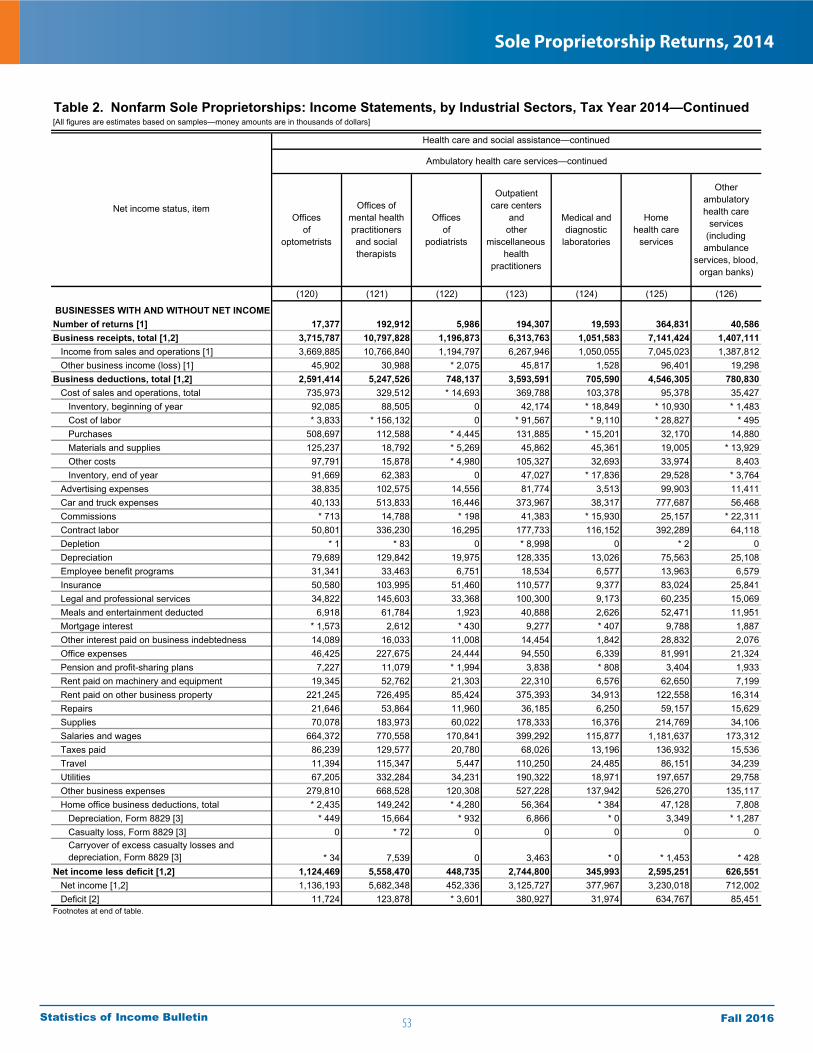
53
Sole Proprietorship Returns, 2014
Fall 2016Statistics of Income Bulletin
[All figures are estimates based on samples—money amounts are in thousands of dollars]
(120) (121) (122) (123) (124) (125) (126)
BUSINESSES WITH AND WITHOUT NET INCOMENumber of returns [1] 17,377 192,912 5,986 194,307 19,593 364,831 40,586Business receipts, total [1,2] 3,715,787 10,797,828 1,196,873 6,313,763 1,051,583 7,141,424 1,407,111 Income from sales and operations [1] 3,669,885 10,766,840 1,194,797 6,267,946 1,050,055 7,045,023 1,387,812 Other business income (loss) [1] 45,902 30,988 * 2,075 45,817 1,528 96,401 19,298Business deductions, total [1,2] 2,591,414 5,247,526 748,137 3,593,591 705,590 4,546,305 780,830 Cost of sales and operations, total 735,973 329,512 * 14,693 369,788 103,378 95,378 35,427 Inventory, beginning of year 92,085 88,505 0 42,174 * 18,849 * 10,930 * 1,483 Cost of labor * 3,833 * 156,132 0 * 91,567 * 9,110 * 28,827 * 495 Purchases 508,697 112,588 * 4,445 131,885 * 15,201 32,170 14,880 Materials and supplies 125,237 18,792 * 5,269 45,862 45,361 19,005 * 13,929 Other costs 97,791 15,878 * 4,980 105,327 32,693 33,974 8,403 Inventory, end of year 91,669 62,383 0 47,027 * 17,836 29,528 * 3,764 Advertising expenses 38,835 102,575 14,556 81,774 3,513 99,903 11,411 Car and truck expenses 40,133 513,833 16,446 373,967 38,317 777,687 56,468 Commissions * 713 14,788 * 198 41,383 * 15,930 25,157 * 22,311 Contract labor 50,801 336,230 16,295 177,733 116,152 392,289 64,118 Depletion * 1 * 83 0 * 8,998 0 * 2 0 Depreciation 79,689 129,842 19,975 128,335 13,026 75,563 25,108 Employee benefit programs 31,341 33,463 6,751 18,534 6,577 13,963 6,579 Insurance 50,580 103,995 51,460 110,577 9,377 83,024 25,841 Legal and professional services 34,822 145,603 33,368 100,300 9,173 60,235 15,069 Meals and entertainment deducted 6,918 61,784 1,923 40,888 2,626 52,471 11,951 Mortgage interest * 1,573 2,612 * 430 9,277 * 407 9,788 1,887 Other interest paid on business indebtedness 14,089 16,033 11,008 14,454 1,842 28,832 2,076 Office expenses 46,425 227,675 24,444 94,550 6,339 81,991 21,324 Pension and profit-sharing plans 7,227 11,079 * 1,994 3,838 * 808 3,404 1,933 Rent paid on machinery and equipment 19,345 52,762 21,303 22,310 6,576 62,650 7,199 Rent paid on other business property 221,245 726,495 85,424 375,393 34,913 122,558 16,314 Repairs 21,646 53,864 11,960 36,185 6,250 59,157 15,629 Supplies 70,078 183,973 60,022 178,333 16,376 214,769 34,106 Salaries and wages 664,372 770,558 170,841 399,292 115,877 1,181,637 173,312 Taxes paid 86,239 129,577 20,780 68,026 13,196 136,932 15,536 Travel 11,394 115,347 5,447 110,250 24,485 86,151 34,239 Utilities 67,205 332,284 34,231 190,322 18,971 197,657 29,758 Other business expenses 279,810 668,528 120,308 527,228 137,942 526,270 135,117 Home office business deductions, total * 2,435 149,242 * 4,280 56,364 * 384 47,128 7,808 Depreciation, Form 8829 [3] * 449 15,664 * 932 6,866 * 0 3,349 * 1,287 Casualty loss, Form 8829 [3] 0 * 72 0 0 0 0 0 Carryover of excess casualty losses and depreciation, Form 8829 [3] * 34 7,539 0 3,463 * 0 * 1,453 * 428Net income less deficit [1,2] 1,124,469 5,558,470 448,735 2,744,800 345,993 2,595,251 626,551 Net income [1,2] 1,136,193 5,682,348 452,336 3,125,727 377,967 3,230,018 712,002 Deficit [2] 11,724 123,878 * 3,601 380,927 31,974 634,767 85,451Footnotes at end of table.
Health care and social assistance—continued
Ambulatory health care services—continued
Net income status, item
Table 2. Nonfarm Sole Proprietorships: Income Statements, by Industrial Sectors, Tax Year 2014—Continued
Medical anddiagnostic
laboratories
Officesof
optometrists
Offices ofmental healthpractitionersand socialtherapists
Homehealth care
services
Otherambulatoryhealth care
services(includingambulance
services, blood, organ banks)
Officesof
podiatrists
Outpatientcare centers
andother
miscellaneoushealth
practitioners

54
Sole Proprietorship Returns, 2014
Fall 2016Statistics of Income Bulletin
[All figures are estimates based on samples—money amounts are in thousands of dollars]
(120) (121) (122) (123) (124) (125) (126)BUSINESSES WITH NET INCOME
Number of returns [1] 15,897 162,678 5,396 143,197 16,979 294,264 31,133Business receipts, total [1,2] 3,509,561 10,318,000 1,155,362 5,673,823 859,556 6,724,781 1,239,067 Income from sales and operations [1] 3,463,767 10,289,705 1,153,287 5,633,972 858,411 6,633,773 1,224,425 Other business income 45,794 28,295 * 2,075 39,851 * 1,144 91,008 14,642Business deductions, total [1,2] 2,373,369 4,635,623 703,026 2,552,819 481,589 3,494,894 527,065 Cost of sales and operations, total 678,562 317,020 * 11,267 207,935 68,909 78,673 34,194 Inventory, beginning of year 87,298 74,287 0 30,474 * 17,085 * 5,800 * 1,278 Cost of labor * 3,833 * 149,682 0 * 41,097 * 9,110 * 19,825 * 35 Purchases 456,240 110,394 * 4,445 122,325 * 5,452 * 10,308 14,844 Materials and supplies 118,404 * 17,568 * 5,269 11,895 * 45,304 * 14,914 * 13,929 Other costs 97,750 14,258 * 1,553 38,080 * 7,370 31,773 * 7,836 Inventory, end of year 84,963 49,168 0 35,935 * 15,412 * 3,948 * 3,728 Advertising expenses 36,019 94,232 14,556 57,702 2,347 35,307 10,714 Car and truck expenses 39,315 417,984 16,316 198,919 36,285 468,222 41,327 Commissions * 622 14,575 * 198 29,715 * 10,683 25,085 * 22,123 Contract labor 48,710 290,876 15,819 155,462 89,880 347,116 34,539 Depletion * 1 * 83 0 * 8,984 0 * 2 0 Depreciation 74,862 104,502 17,892 100,867 7,779 53,419 13,193 Employee benefit programs 28,165 33,065 6,751 15,019 6,193 11,232 4,273 Insurance 37,355 93,050 51,120 74,084 6,574 60,988 13,683 Legal and professional services 31,562 134,523 33,287 73,229 5,405 43,054 6,770 Meals and entertainment deducted 6,721 50,218 1,923 32,567 1,922 40,081 7,067 Mortgage interest * 1,571 2,502 * 430 3,729 * 181 9,503 * 1,096 Other interest paid on business indebtedness 13,265 14,880 10,968 8,916 610 8,167 1,118 Office expenses 44,342 187,439 20,109 73,915 5,406 52,879 16,848 Pension and profit-sharing plans 6,730 10,742 * 1,994 2,719 * 593 3,386 * 1,757 Rent paid on machinery and equipment 18,225 46,241 21,303 10,645 * 4,340 36,686 2,912 Rent paid on other business property 212,040 666,969 84,737 282,630 30,177 80,632 13,068 Repairs 20,741 43,706 11,887 27,646 4,954 28,910 4,520 Supplies 66,857 162,571 55,127 137,399 13,477 122,671 24,753 Salaries and wages 623,031 708,703 166,850 337,647 92,202 1,078,534 143,825 Taxes paid 82,508 116,392 20,096 56,626 9,786 123,032 11,571 Travel 10,532 102,630 5,447 76,609 21,420 72,325 23,833 Utilities 64,162 285,334 34,178 141,560 13,105 129,806 15,473 Other business deductions 216,723 572,446 96,490 332,337 45,839 428,696 61,936 Home office business deductions, total * 2,415 129,720 * 4,280 53,123 * 368 45,016 6,162 Depreciation, Form 8829 [3] * 447 14,059 * 932 6,253 * 0 2,295 * 1,072 Casualty loss, Form 8829 [3] 0 * 72 0 0 0 0 0 Excess—casualty depreciations, Form 8829 [3] 0 3,083 0 * 2,863 0 * 28 0Net income [1,2] 1,136,193 5,682,348 452,336 3,125,727 377,967 3,230,018 712,002Returns with Schedule C-EZ: Number of returns * 4,086 31,582 0 43,823 7,176 111,798 12,999 Business receipts * 85,134 392,061 0 293,256 55,909 905,104 86,734 Business deductions * 8,526 36,967 0 55,507 3,175 111,709 10,311 Net income * 76,608 355,093 0 237,748 52,734 793,395 76,423Footnotes at end of table.
Table 2. Nonfarm Sole Proprietorships: Income Statements, by Industrial Sectors, Tax Year 2014—Continued
Medical anddiagnostic
laboratories
Homehealth care
services
Otherambulatoryhealth care
services(includingambulance
services, blood, organ banks)
Ambulatory health care services—continued
Officesof
optometrists
Offices ofmental healthpractitionersand socialtherapists
Officesof
podiatrists
Net income status, item
Outpatientcare centers
andother
miscellaneoushealth
practitioners
Health care and social assistance—continued
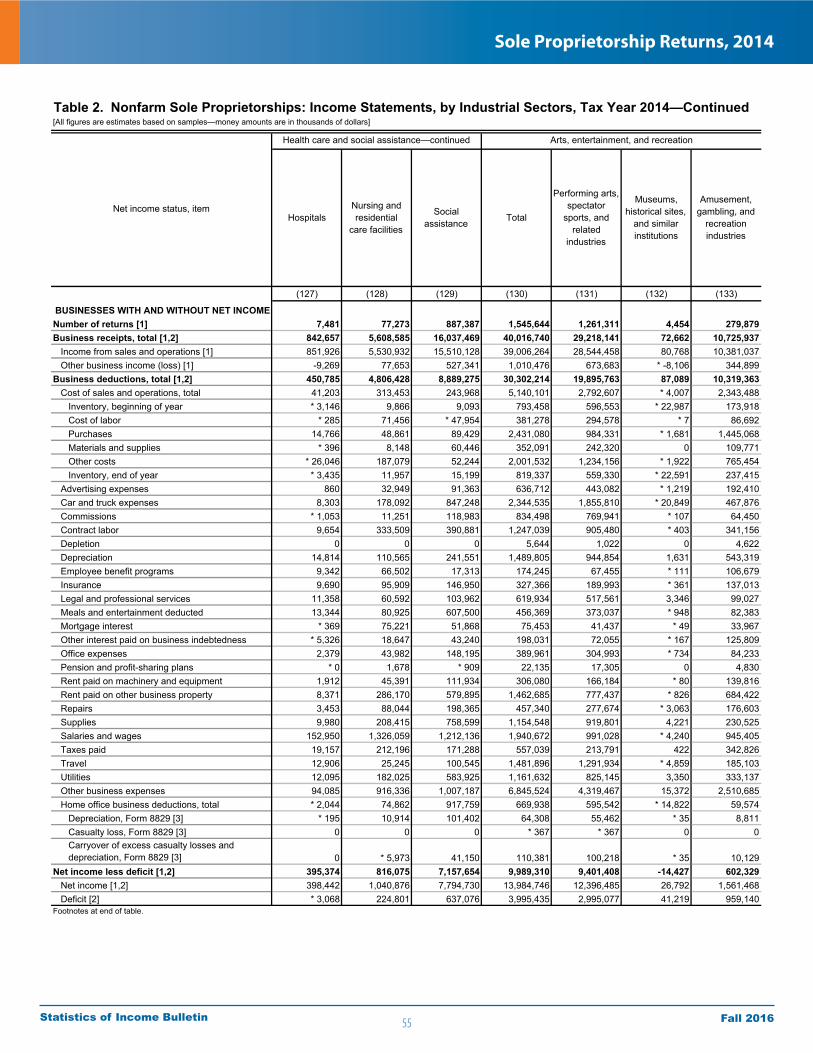
55
Sole Proprietorship Returns, 2014
Fall 2016Statistics of Income Bulletin
[All figures are estimates based on samples—money amounts are in thousands of dollars]
(127) (128) (129) (130) (131) (132) (133)
BUSINESSES WITH AND WITHOUT NET INCOMENumber of returns [1] 7,481 77,273 887,387 1,545,644 1,261,311 4,454 279,879Business receipts, total [1,2] 842,657 5,608,585 16,037,469 40,016,740 29,218,141 72,662 10,725,937 Income from sales and operations [1] 851,926 5,530,932 15,510,128 39,006,264 28,544,458 80,768 10,381,037 Other business income (loss) [1] -9,269 77,653 527,341 1,010,476 673,683 * -8,106 344,899Business deductions, total [1,2] 450,785 4,806,428 8,889,275 30,302,214 19,895,763 87,089 10,319,363 Cost of sales and operations, total 41,203 313,453 243,968 5,140,101 2,792,607 * 4,007 2,343,488 Inventory, beginning of year * 3,146 9,866 9,093 793,458 596,553 * 22,987 173,918 Cost of labor * 285 71,456 * 47,954 381,278 294,578 * 7 86,692 Purchases 14,766 48,861 89,429 2,431,080 984,331 * 1,681 1,445,068 Materials and supplies * 396 8,148 60,446 352,091 242,320 0 109,771 Other costs * 26,046 187,079 52,244 2,001,532 1,234,156 * 1,922 765,454 Inventory, end of year * 3,435 11,957 15,199 819,337 559,330 * 22,591 237,415 Advertising expenses 860 32,949 91,363 636,712 443,082 * 1,219 192,410 Car and truck expenses 8,303 178,092 847,248 2,344,535 1,855,810 * 20,849 467,876 Commissions * 1,053 11,251 118,983 834,498 769,941 * 107 64,450 Contract labor 9,654 333,509 390,881 1,247,039 905,480 * 403 341,156 Depletion 0 0 0 5,644 1,022 0 4,622 Depreciation 14,814 110,565 241,551 1,489,805 944,854 1,631 543,319 Employee benefit programs 9,342 66,502 17,313 174,245 67,455 * 111 106,679 Insurance 9,690 95,909 146,950 327,366 189,993 * 361 137,013 Legal and professional services 11,358 60,592 103,962 619,934 517,561 3,346 99,027 Meals and entertainment deducted 13,344 80,925 607,500 456,369 373,037 * 948 82,383 Mortgage interest * 369 75,221 51,868 75,453 41,437 * 49 33,967 Other interest paid on business indebtedness * 5,326 18,647 43,240 198,031 72,055 * 167 125,809 Office expenses 2,379 43,982 148,195 389,961 304,993 * 734 84,233 Pension and profit-sharing plans * 0 1,678 * 909 22,135 17,305 0 4,830 Rent paid on machinery and equipment 1,912 45,391 111,934 306,080 166,184 * 80 139,816 Rent paid on other business property 8,371 286,170 579,895 1,462,685 777,437 * 826 684,422 Repairs 3,453 88,044 198,365 457,340 277,674 * 3,063 176,603 Supplies 9,980 208,415 758,599 1,154,548 919,801 4,221 230,525 Salaries and wages 152,950 1,326,059 1,212,136 1,940,672 991,028 * 4,240 945,405 Taxes paid 19,157 212,196 171,288 557,039 213,791 422 342,826 Travel 12,906 25,245 100,545 1,481,896 1,291,934 * 4,859 185,103 Utilities 12,095 182,025 583,925 1,161,632 825,145 3,350 333,137 Other business expenses 94,085 916,336 1,007,187 6,845,524 4,319,467 15,372 2,510,685 Home office business deductions, total * 2,044 74,862 917,759 669,938 595,542 * 14,822 59,574 Depreciation, Form 8829 [3] * 195 10,914 101,402 64,308 55,462 * 35 8,811 Casualty loss, Form 8829 [3] 0 0 0 * 367 * 367 0 0 Carryover of excess casualty losses and depreciation, Form 8829 [3] 0 * 5,973 41,150 110,381 100,218 * 35 10,129Net income less deficit [1,2] 395,374 816,075 7,157,654 9,989,310 9,401,408 -14,427 602,329 Net income [1,2] 398,442 1,040,876 7,794,730 13,984,746 12,396,485 26,792 1,561,468 Deficit [2] * 3,068 224,801 637,076 3,995,435 2,995,077 41,219 959,140Footnotes at end of table.
Health care and social assistance—continued
Table 2. Nonfarm Sole Proprietorships: Income Statements, by Industrial Sectors, Tax Year 2014—Continued
Arts, entertainment, and recreation
Net income status, item SocialassistanceHospitals
Nursing andresidential
care facilitiesTotal
Performing arts,spectator
sports, andrelated
industries
Museums,historical sites,
and similarinstitutions
Amusement,gambling, and
recreationindustries
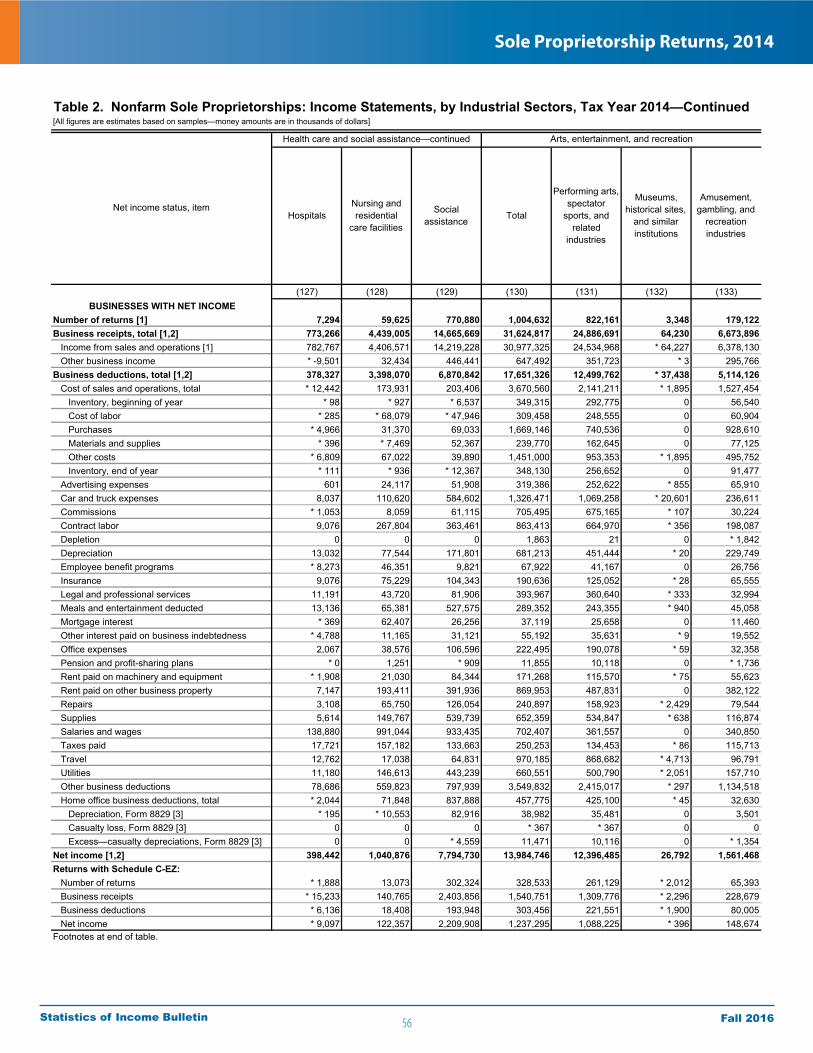
56
Sole Proprietorship Returns, 2014
Fall 2016Statistics of Income Bulletin
[All figures are estimates based on samples—money amounts are in thousands of dollars]
(127) (128) (129) (130) (131) (132) (133)BUSINESSES WITH NET INCOME
Number of returns [1] 7,294 59,625 770,880 1,004,632 822,161 3,348 179,122Business receipts, total [1,2] 773,266 4,439,005 14,665,669 31,624,817 24,886,691 64,230 6,673,896 Income from sales and operations [1] 782,767 4,406,571 14,219,228 30,977,325 24,534,968 * 64,227 6,378,130 Other business income * -9,501 32,434 446,441 647,492 351,723 * 3 295,766Business deductions, total [1,2] 378,327 3,398,070 6,870,842 17,651,326 12,499,762 * 37,438 5,114,126 Cost of sales and operations, total * 12,442 173,931 203,406 3,670,560 2,141,211 * 1,895 1,527,454 Inventory, beginning of year * 98 * 927 * 6,537 349,315 292,775 0 56,540 Cost of labor * 285 * 68,079 * 47,946 309,458 248,555 0 60,904 Purchases * 4,966 31,370 69,033 1,669,146 740,536 0 928,610 Materials and supplies * 396 * 7,469 52,367 239,770 162,645 0 77,125 Other costs * 6,809 67,022 39,890 1,451,000 953,353 * 1,895 495,752 Inventory, end of year * 111 * 936 * 12,367 348,130 256,652 0 91,477 Advertising expenses 601 24,117 51,908 319,386 252,622 * 855 65,910 Car and truck expenses 8,037 110,620 584,602 1,326,471 1,069,258 * 20,601 236,611 Commissions * 1,053 8,059 61,115 705,495 675,165 * 107 30,224 Contract labor 9,076 267,804 363,461 863,413 664,970 * 356 198,087 Depletion 0 0 0 1,863 21 0 * 1,842 Depreciation 13,032 77,544 171,801 681,213 451,444 * 20 229,749 Employee benefit programs * 8,273 46,351 9,821 67,922 41,167 0 26,756 Insurance 9,076 75,229 104,343 190,636 125,052 * 28 65,555 Legal and professional services 11,191 43,720 81,906 393,967 360,640 * 333 32,994 Meals and entertainment deducted 13,136 65,381 527,575 289,352 243,355 * 940 45,058 Mortgage interest * 369 62,407 26,256 37,119 25,658 0 11,460 Other interest paid on business indebtedness * 4,788 11,165 31,121 55,192 35,631 * 9 19,552 Office expenses 2,067 38,576 106,596 222,495 190,078 * 59 32,358 Pension and profit-sharing plans * 0 1,251 * 909 11,855 10,118 0 * 1,736 Rent paid on machinery and equipment * 1,908 21,030 84,344 171,268 115,570 * 75 55,623 Rent paid on other business property 7,147 193,411 391,936 869,953 487,831 0 382,122 Repairs 3,108 65,750 126,054 240,897 158,923 * 2,429 79,544 Supplies 5,614 149,767 539,739 652,359 534,847 * 638 116,874 Salaries and wages 138,880 991,044 933,435 702,407 361,557 0 340,850 Taxes paid 17,721 157,182 133,663 250,253 134,453 * 86 115,713 Travel 12,762 17,038 64,831 970,185 868,682 * 4,713 96,791 Utilities 11,180 146,613 443,239 660,551 500,790 * 2,051 157,710 Other business deductions 78,686 559,823 797,939 3,549,832 2,415,017 * 297 1,134,518 Home office business deductions, total * 2,044 71,848 837,888 457,775 425,100 * 45 32,630 Depreciation, Form 8829 [3] * 195 * 10,553 82,916 38,982 35,481 0 3,501 Casualty loss, Form 8829 [3] 0 0 0 * 367 * 367 0 0 Excess—casualty depreciations, Form 8829 [3] 0 0 * 4,559 11,471 10,116 0 * 1,354Net income [1,2] 398,442 1,040,876 7,794,730 13,984,746 12,396,485 26,792 1,561,468Returns with Schedule C-EZ: Number of returns * 1,888 13,073 302,324 328,533 261,129 * 2,012 65,393 Business receipts * 15,233 140,765 2,403,856 1,540,751 1,309,776 * 2,296 228,679 Business deductions * 6,136 18,408 193,948 303,456 221,551 * 1,900 80,005 Net income * 9,097 122,357 2,209,908 1,237,295 1,088,225 * 396 148,674Footnotes at end of table.
Health care and social assistance—continued
Table 2. Nonfarm Sole Proprietorships: Income Statements, by Industrial Sectors, Tax Year 2014—Continued
Performing arts,spectator
sports, andrelated
industries
Museums,historical sites,
and similarinstitutions
Amusement,gambling, and
recreationindustries
Net income status, item
Arts, entertainment, and recreation
HospitalsNursing andresidential
care facilities
Socialassistance Total
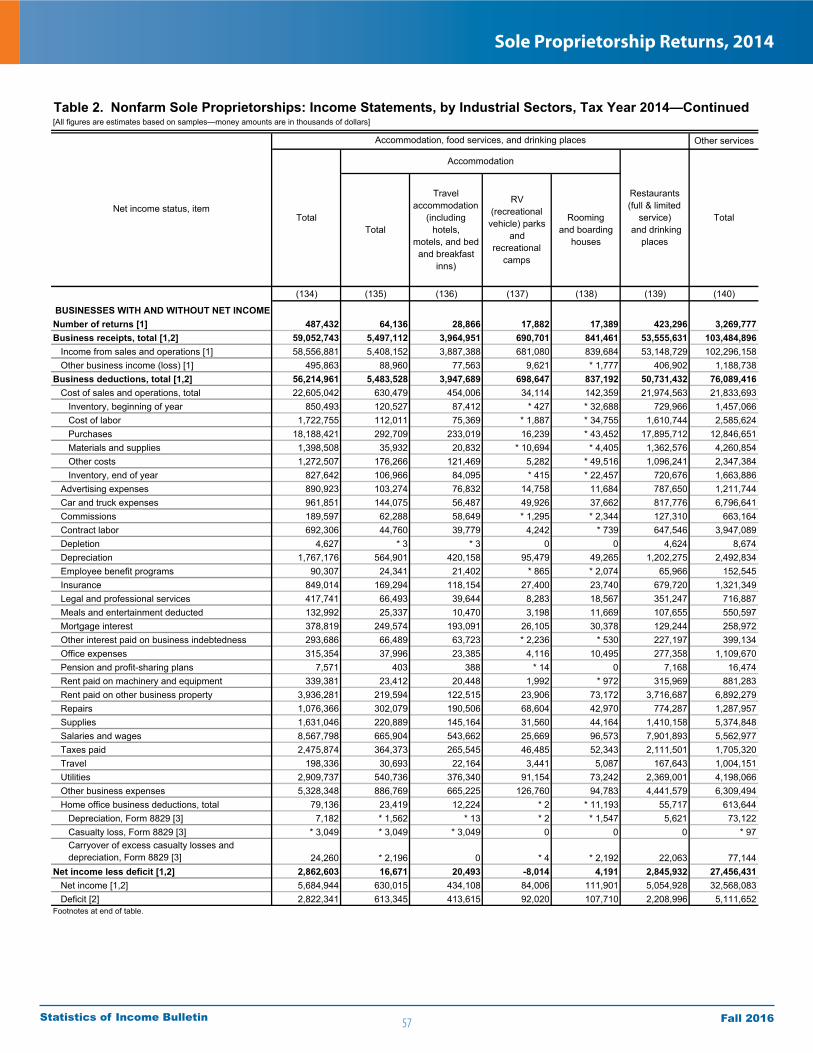
57
Sole Proprietorship Returns, 2014
Fall 2016Statistics of Income Bulletin
[All figures are estimates based on samples—money amounts are in thousands of dollars]
Other services
(134) (135) (136) (137) (138) (139) (140)
BUSINESSES WITH AND WITHOUT NET INCOMENumber of returns [1] 487,432 64,136 28,866 17,882 17,389 423,296 3,269,777Business receipts, total [1,2] 59,052,743 5,497,112 3,964,951 690,701 841,461 53,555,631 103,484,896 Income from sales and operations [1] 58,556,881 5,408,152 3,887,388 681,080 839,684 53,148,729 102,296,158 Other business income (loss) [1] 495,863 88,960 77,563 9,621 * 1,777 406,902 1,188,738Business deductions, total [1,2] 56,214,961 5,483,528 3,947,689 698,647 837,192 50,731,432 76,089,416 Cost of sales and operations, total 22,605,042 630,479 454,006 34,114 142,359 21,974,563 21,833,693 Inventory, beginning of year 850,493 120,527 87,412 * 427 * 32,688 729,966 1,457,066 Cost of labor 1,722,755 112,011 75,369 * 1,887 * 34,755 1,610,744 2,585,624 Purchases 18,188,421 292,709 233,019 16,239 * 43,452 17,895,712 12,846,651 Materials and supplies 1,398,508 35,932 20,832 * 10,694 * 4,405 1,362,576 4,260,854 Other costs 1,272,507 176,266 121,469 5,282 * 49,516 1,096,241 2,347,384 Inventory, end of year 827,642 106,966 84,095 * 415 * 22,457 720,676 1,663,886 Advertising expenses 890,923 103,274 76,832 14,758 11,684 787,650 1,211,744 Car and truck expenses 961,851 144,075 56,487 49,926 37,662 817,776 6,796,641 Commissions 189,597 62,288 58,649 * 1,295 * 2,344 127,310 663,164 Contract labor 692,306 44,760 39,779 4,242 * 739 647,546 3,947,089 Depletion 4,627 * 3 * 3 0 0 4,624 8,674 Depreciation 1,767,176 564,901 420,158 95,479 49,265 1,202,275 2,492,834 Employee benefit programs 90,307 24,341 21,402 * 865 * 2,074 65,966 152,545 Insurance 849,014 169,294 118,154 27,400 23,740 679,720 1,321,349 Legal and professional services 417,741 66,493 39,644 8,283 18,567 351,247 716,887 Meals and entertainment deducted 132,992 25,337 10,470 3,198 11,669 107,655 550,597 Mortgage interest 378,819 249,574 193,091 26,105 30,378 129,244 258,972 Other interest paid on business indebtedness 293,686 66,489 63,723 * 2,236 * 530 227,197 399,134 Office expenses 315,354 37,996 23,385 4,116 10,495 277,358 1,109,670 Pension and profit-sharing plans 7,571 403 388 * 14 0 7,168 16,474 Rent paid on machinery and equipment 339,381 23,412 20,448 1,992 * 972 315,969 881,283 Rent paid on other business property 3,936,281 219,594 122,515 23,906 73,172 3,716,687 6,892,279 Repairs 1,076,366 302,079 190,506 68,604 42,970 774,287 1,287,957 Supplies 1,631,046 220,889 145,164 31,560 44,164 1,410,158 5,374,848 Salaries and wages 8,567,798 665,904 543,662 25,669 96,573 7,901,893 5,562,977 Taxes paid 2,475,874 364,373 265,545 46,485 52,343 2,111,501 1,705,320 Travel 198,336 30,693 22,164 3,441 5,087 167,643 1,004,151 Utilities 2,909,737 540,736 376,340 91,154 73,242 2,369,001 4,198,066 Other business expenses 5,328,348 886,769 665,225 126,760 94,783 4,441,579 6,309,494 Home office business deductions, total 79,136 23,419 12,224 * 2 * 11,193 55,717 613,644 Depreciation, Form 8829 [3] 7,182 * 1,562 * 13 * 2 * 1,547 5,621 73,122 Casualty loss, Form 8829 [3] * 3,049 * 3,049 * 3,049 0 0 0 * 97 Carryover of excess casualty losses and depreciation, Form 8829 [3] 24,260 * 2,196 0 * 4 * 2,192 22,063 77,144Net income less deficit [1,2] 2,862,603 16,671 20,493 -8,014 4,191 2,845,932 27,456,431 Net income [1,2] 5,684,944 630,015 434,108 84,006 111,901 5,054,928 32,568,083 Deficit [2] 2,822,341 613,345 413,615 92,020 107,710 2,208,996 5,111,652Footnotes at end of table.
Accommodation, food services, and drinking places
Accommodation
Table 2. Nonfarm Sole Proprietorships: Income Statements, by Industrial Sectors, Tax Year 2014—Continued
Net income status, itemTotal
Total
Travelaccommodation
(includinghotels,
motels, and bedand breakfast
inns)
RV(recreationalvehicle) parks
andrecreational
camps
Roomingand boarding
houses
Restaurants(full & limited
service) and drinking
places
Total

58
Sole Proprietorship Returns, 2014
Fall 2016Statistics of Income Bulletin
[All figures are estimates based on samples—money amounts are in thousands of dollars]
Other services
(134) (135) (136) (137) (138) (139) (140)BUSINESSES WITH NET INCOME
Number of returns [1] 315,490 37,458 14,800 13,322 9,337 278,032 2,589,823Business receipts, total [1,2] 44,794,246 3,606,622 2,581,811 501,186 523,626 41,187,624 92,676,729 Income from sales and operations [1] 44,482,898 3,586,802 2,568,742 496,033 522,027 40,896,096 91,617,761 Other business income 311,348 19,820 13,069 * 5,152 * 1,599 291,528 1,058,967Business deductions, total [1,2] 39,121,220 2,986,899 2,157,995 417,179 411,725 36,134,321 60,120,017 Cost of sales and operations, total 16,998,929 316,190 252,937 7,698 * 55,555 16,682,739 18,336,380 Inventory, beginning of year 510,522 44,309 38,840 * 12 * 5,456 466,213 998,401 Cost of labor 1,148,361 38,847 32,120 * 161 * 6,566 1,109,514 2,168,717 Purchases 13,993,399 165,265 145,948 * 4,936 * 14,381 13,828,135 10,812,331 Materials and supplies 902,695 13,403 12,681 * 16 * 707 889,291 3,610,956 Other costs 944,540 94,783 55,313 * 2,581 * 36,889 849,757 1,833,034 Inventory, end of year 500,588 40,417 31,965 * 9 * 8,442 460,171 1,087,059 Advertising expenses 587,379 50,611 37,396 7,906 * 5,309 536,768 845,284 Car and truck expenses 551,512 74,790 29,741 31,512 13,536 476,723 4,888,898 Commissions 145,368 40,492 37,508 * 1,252 * 1,732 104,876 560,566 Contract labor 486,605 26,167 25,729 * 438 0 460,438 3,486,109 Depletion * 227 * 1 * 1 0 0 * 225 7,869 Depreciation 868,941 235,760 174,600 35,626 25,534 633,181 1,590,759 Employee benefit programs 52,072 7,314 5,864 * 842 * 607 44,759 129,159 Insurance 538,803 98,561 69,414 17,751 11,396 440,241 979,270 Legal and professional services 222,492 31,866 18,815 5,154 7,897 190,626 520,629 Meals and entertainment deducted 68,618 11,733 3,274 1,101 * 7,359 56,885 396,174 Mortgage interest 194,449 112,876 75,722 * 13,475 * 23,679 81,573 161,177 Other interest paid on business indebtedness 158,000 34,789 34,514 * 71 * 204 123,211 270,593 Office expenses 176,374 17,393 12,891 2,832 1,670 158,981 782,413 Pension and profit-sharing plans 7,060 * 200 * 186 * 14 0 6,860 12,963 Rent paid on machinery and equipment 221,140 9,319 8,557 * 636 * 126 211,821 667,527 Rent paid on other business property 2,746,444 96,502 80,388 * 15,943 * 171 2,649,942 5,705,077 Repairs 687,829 171,865 109,889 46,674 15,303 515,964 884,375 Supplies 986,166 142,259 99,862 24,344 18,054 843,906 4,217,049 Salaries and wages 5,963,918 396,858 299,207 * 16,740 * 80,911 5,567,060 4,561,025 Taxes paid 1,751,888 234,939 159,715 35,549 39,675 1,516,949 1,366,408 Travel 106,893 13,514 8,424 1,535 * 3,555 93,380 685,257 Utilities 1,909,051 331,629 233,361 62,830 35,438 1,577,423 3,084,283 Other business deductions 3,558,863 495,566 363,690 80,211 51,666 3,063,297 4,716,402 Home office business deductions, total 60,106 23,311 * 12,148 0 * 11,163 36,795 499,730 Depreciation, Form 8829 [3] 3,751 * 1,547 * 6 0 * 1,540 2,204 41,418 Casualty loss, Form 8829 [3] 0 0 0 0 0 0 * 97 Excess—casualty depreciations, Form 8829 [3] * 2,199 * 2,186 0 0 * 2,186 * 13 5,003Net income [1,2] 5,684,944 630,015 434,108 84,006 111,901 5,054,928 32,568,083Returns with Schedule C-EZ: Number of returns 69,896 8,946 * 2,631 * 3,958 * 2,357 60,950 750,173 Business receipts 420,254 31,285 * 16,379 * 10,922 * 3,984 388,968 6,155,630 Business deductions 75,653 15,953 * 7,723 * 7,043 * 1,186 59,700 785,358 Net income 344,601 15,333 * 8,655 * 3,879 * 2,798 329,269 5,370,272Footnotes at end of table.
Table 2. Nonfarm Sole Proprietorships: Income Statements, by Industrial Sectors, Tax Year 2014—Continued
Total
Travelaccommodation
(includinghotels,
motels, and bedand breakfast
inns)
Total Total
Restaurants(full & limited
service) and drinking
places
RV(recreationalvehicle) parks
andrecreational
camps
Roomingand boarding
houses
Net income status, item
Accommodation, food services, and drinking places
Accommodation

59
Sole Proprietorship Returns, 2014
Fall 2016Statistics of Income Bulletin
[All figures are estimates based on samples—money amounts are in thousands of dollars]
(141) (142) (143) (144) (145) (146) (147) (148)
BUSINESSES WITH AND WITHOUT NET INCOMENumber of returns [1] 370,788 186,253 81,534 103,001 396,902 2,205,655 296,433 657,089Business receipts, total [1,2] 26,722,123 11,746,990 7,771,063 7,204,070 16,315,951 56,812,505 3,634,317 7,825,625 Income from sales and operations [1] 26,606,135 11,688,116 7,751,476 7,166,543 16,114,298 56,139,466 3,436,259 7,739,875 Other business income (loss) [1] 115,988 58,874 19,587 37,527 201,653 673,039 198,058 85,750Business deductions, total [1,2] 23,668,325 10,154,501 6,870,398 6,643,426 12,908,284 37,500,236 2,012,570 5,319,766 Cost of sales and operations, total 10,998,477 4,608,123 3,469,504 2,920,850 4,842,048 5,969,707 23,461 1,054,603 Inventory, beginning of year 584,704 168,853 173,790 242,061 406,717 465,476 * 169 77,555 Cost of labor 1,172,214 329,424 486,104 356,686 465,431 947,980 0 50,240 Purchases 6,905,371 2,956,805 2,219,459 1,729,107 2,710,228 3,230,458 * 594 539,694 Materials and supplies 1,871,941 927,615 603,860 340,467 1,456,663 927,041 * 5,210 254,380 Other costs 1,187,219 428,970 244,819 513,430 268,836 873,673 * 17,656 230,788 Inventory, end of year 722,971 203,544 258,528 260,900 465,826 474,921 * 167 98,054 Advertising expenses 274,658 100,114 83,306 91,238 138,401 775,534 23,152 57,374 Car and truck expenses 1,163,371 596,695 273,059 293,617 1,573,485 3,458,639 601,146 945,765 Commissions 111,308 61,563 * 39,289 10,456 77,971 465,768 * 8,117 90,090 Contract labor 1,011,235 341,234 318,338 351,662 630,094 2,257,064 48,697 290,639 Depletion * 17 0 0 * 17 * 571 8,086 0 * 31 Depreciation 861,540 356,273 178,322 326,946 456,565 1,136,882 37,846 152,028 Employee benefit programs 93,763 28,625 38,860 26,278 21,617 32,529 * 4,636 2,431 Insurance 431,782 184,145 117,036 130,601 282,976 582,745 23,846 80,081 Legal and professional services 167,102 49,277 56,883 60,943 116,842 403,457 29,486 77,144 Meals and entertainment deducted 91,901 46,256 21,079 24,566 79,171 317,470 62,055 80,866 Mortgage interest 107,901 33,694 23,125 51,082 37,746 109,949 * 3,377 38,502 Other interest paid on business indebtedness 137,892 52,668 36,236 48,988 82,323 169,893 9,026 25,083 Office expenses 219,980 99,194 62,220 58,567 111,908 687,389 90,392 87,821 Pension and profit-sharing plans 1,827 * 2 * 549 * 1,276 2,043 9,885 * 2,720 * 1,858 Rent paid on machinery and equipment 184,754 64,104 57,876 62,774 110,717 573,183 * 12,629 71,347 Rent paid on other business property 1,161,053 558,813 256,232 346,008 377,805 5,300,490 52,931 169,523 Repairs 391,190 156,139 73,733 161,318 185,067 685,767 25,933 114,527 Supplies 1,136,888 575,831 336,582 224,475 860,186 3,262,561 115,213 255,581 Salaries and wages 1,736,183 750,549 544,930 440,703 855,738 2,966,523 * 4,533 123,862 Taxes paid 688,660 286,905 187,534 214,221 273,273 724,614 18,773 37,478 Travel 108,444 39,708 32,579 36,158 133,566 603,081 159,060 123,702 Utilities 987,869 379,210 270,573 338,086 481,340 2,567,014 161,844 262,913 Other business expenses 1,483,511 733,152 372,101 378,258 986,718 3,455,628 383,638 1,005,578 Home office business deductions, total 71,953 33,227 * 14,694 24,032 108,839 372,296 60,555 41,123 Depreciation, Form 8829 [3] 9,206 * 5,401 * 840 * 2,965 15,605 40,698 7,613 2,840 Casualty loss, Form 8829 [3] 0 0 0 0 0 * 97 0 0 Carryover of excess casualty losses and depreciation, Form 8829 [3] 19,619 * 13,020 * 2,939 * 3,661 15,635 34,788 7,102 * 2,190Net income less deficit [1,2] 3,058,463 1,595,415 900,655 562,392 3,416,071 19,341,005 1,640,891 2,511,021 Net income [1,2] 4,140,334 2,015,865 1,072,395 1,052,074 4,204,449 22,225,516 1,997,784 3,569,872 Deficit [2] 1,081,871 420,449 171,740 489,682 788,378 2,884,511 356,892 1,058,851Footnotes at end of table.
Other services—continued
Religious,grantmaking,
civic,professional,and similar
organizations
Table 2. Nonfarm Sole Proprietorships: Income Statements, by Industrial Sectors, Tax Year 2014—Continued
UnclassifiedestablishmentsAutomotive
bodyshops
Other autorepair and
maintenance(including oil
change,lube, and car
washes)
Net income status, item Miscellaneousrepairs
Personaland laundry
servicesTotal
Auto repair and maintenance
Automotivemechanical
andelectrical
repairand
maintenance
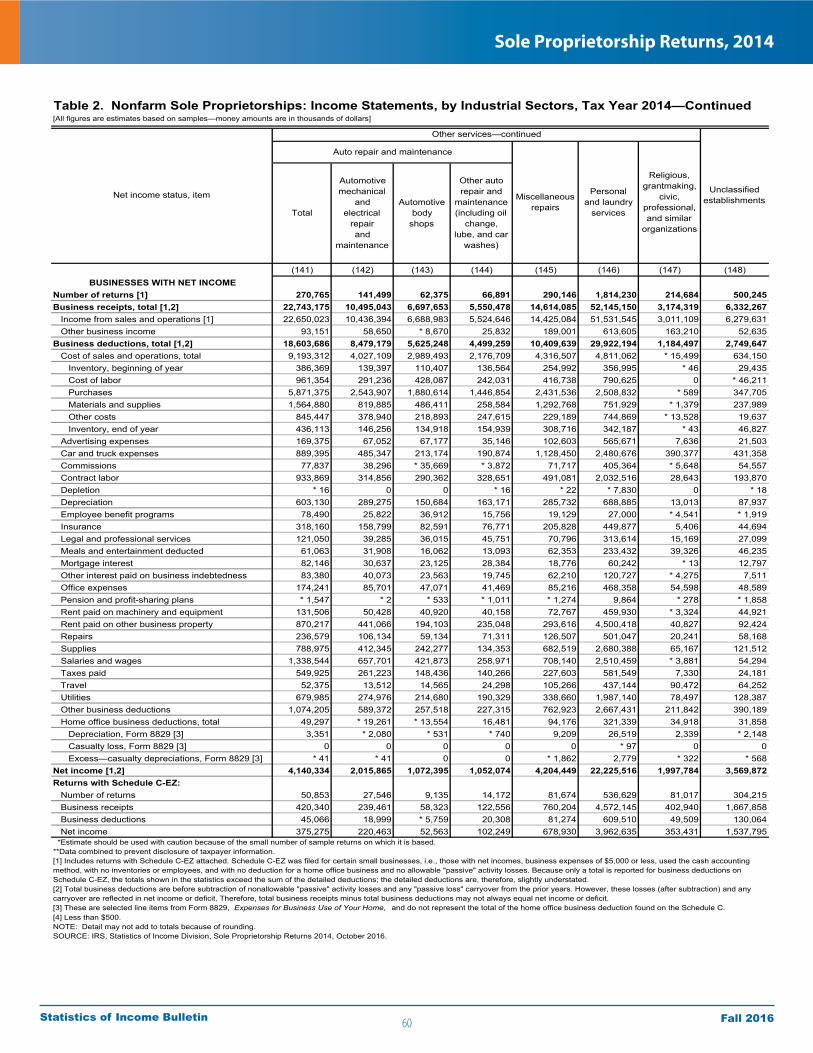
60
Sole Proprietorship Returns, 2014
Fall 2016Statistics of Income Bulletin
[All figures are estimates based on samples—money amounts are in thousands of dollars]
(141) (142) (143) (144) (145) (146) (147) (148)BUSINESSES WITH NET INCOME
Number of returns [1] 270,765 141,499 62,375 66,891 290,146 1,814,230 214,684 500,245Business receipts, total [1,2] 22,743,175 10,495,043 6,697,653 5,550,478 14,614,085 52,145,150 3,174,319 6,332,267 Income from sales and operations [1] 22,650,023 10,436,394 6,688,983 5,524,646 14,425,084 51,531,545 3,011,109 6,279,631 Other business income 93,151 58,650 * 8,670 25,832 189,001 613,605 163,210 52,635Business deductions, total [1,2] 18,603,686 8,479,179 5,625,248 4,499,259 10,409,639 29,922,194 1,184,497 2,749,647 Cost of sales and operations, total 9,193,312 4,027,109 2,989,493 2,176,709 4,316,507 4,811,062 * 15,499 634,150 Inventory, beginning of year 386,369 139,397 110,407 136,564 254,992 356,995 * 46 29,435 Cost of labor 961,354 291,236 428,087 242,031 416,738 790,625 0 * 46,211 Purchases 5,871,375 2,543,907 1,880,614 1,446,854 2,431,536 2,508,832 * 589 347,705 Materials and supplies 1,564,880 819,885 486,411 258,584 1,292,768 751,929 * 1,379 237,989 Other costs 845,447 378,940 218,893 247,615 229,189 744,869 * 13,528 19,637 Inventory, end of year 436,113 146,256 134,918 154,939 308,716 342,187 * 43 46,827 Advertising expenses 169,375 67,052 67,177 35,146 102,603 565,671 7,636 21,503 Car and truck expenses 889,395 485,347 213,174 190,874 1,128,450 2,480,676 390,377 431,358 Commissions 77,837 38,296 * 35,669 * 3,872 71,717 405,364 * 5,648 54,557 Contract labor 933,869 314,856 290,362 328,651 491,081 2,032,516 28,643 193,870 Depletion * 16 0 0 * 16 * 22 * 7,830 0 * 18 Depreciation 603,130 289,275 150,684 163,171 285,732 688,885 13,013 87,937 Employee benefit programs 78,490 25,822 36,912 15,756 19,129 27,000 * 4,541 * 1,919 Insurance 318,160 158,799 82,591 76,771 205,828 449,877 5,406 44,694 Legal and professional services 121,050 39,285 36,015 45,751 70,796 313,614 15,169 27,099 Meals and entertainment deducted 61,063 31,908 16,062 13,093 62,353 233,432 39,326 46,235 Mortgage interest 82,146 30,637 23,125 28,384 18,776 60,242 * 13 12,797 Other interest paid on business indebtedness 83,380 40,073 23,563 19,745 62,210 120,727 * 4,275 7,511 Office expenses 174,241 85,701 47,071 41,469 85,216 468,358 54,598 48,589 Pension and profit-sharing plans * 1,547 * 2 * 533 * 1,011 * 1,274 9,864 * 278 * 1,858 Rent paid on machinery and equipment 131,506 50,428 40,920 40,158 72,767 459,930 * 3,324 44,921 Rent paid on other business property 870,217 441,066 194,103 235,048 293,616 4,500,418 40,827 92,424 Repairs 236,579 106,134 59,134 71,311 126,507 501,047 20,241 58,168 Supplies 788,975 412,345 242,277 134,353 682,519 2,680,388 65,167 121,512 Salaries and wages 1,338,544 657,701 421,873 258,971 708,140 2,510,459 * 3,881 54,294 Taxes paid 549,925 261,223 148,436 140,266 227,603 581,549 7,330 24,181 Travel 52,375 13,512 14,565 24,298 105,266 437,144 90,472 64,252 Utilities 679,985 274,976 214,680 190,329 338,660 1,987,140 78,497 128,387 Other business deductions 1,074,205 589,372 257,518 227,315 762,923 2,667,431 211,842 390,189 Home office business deductions, total 49,297 * 19,261 * 13,554 16,481 94,176 321,339 34,918 31,858 Depreciation, Form 8829 [3] 3,351 * 2,080 * 531 * 740 9,209 26,519 2,339 * 2,148 Casualty loss, Form 8829 [3] 0 0 0 0 0 * 97 0 0 Excess—casualty depreciations, Form 8829 [3] * 41 * 41 0 0 * 1,862 2,779 * 322 * 568Net income [1,2] 4,140,334 2,015,865 1,072,395 1,052,074 4,204,449 22,225,516 1,997,784 3,569,872Returns with Schedule C-EZ: Number of returns 50,853 27,546 9,135 14,172 81,674 536,629 81,017 304,215 Business receipts 420,340 239,461 58,323 122,556 760,204 4,572,145 402,940 1,667,858 Business deductions 45,066 18,999 * 5,759 20,308 81,274 609,510 49,509 130,064 Net income 375,275 220,463 52,563 102,249 678,930 3,962,635 353,431 1,537,795
Other services—continued
Table 2. Nonfarm Sole Proprietorships: Income Statements, by Industrial Sectors, Tax Year 2014—Continued
*Estimate should be used with caution because of the small number of sample returns on which it is based.**Data combined to prevent disclosure of taxpayer information.[1] Includes returns with Schedule C-EZ attached. Schedule C-EZ was filed for certain small businesses, i.e., those with net incomes, business expenses of $5,000 or less, used the cash accounting method, with no inventories or employees, and with no deduction for a home office business and no allowable "passive" activity losses. Because only a total is reported for business deductions on Schedule C-EZ, the totals shown in the statistics exceed the sum of the detailed deductions; the detailed deductions are, therefore, slightly understated.[2] Total business deductions are before subtraction of nonallowable "passive" activity losses and any "passive loss" carryover from the prior years. However, these losses (after subtraction) and any carryover are reflected in net income or deficit. Therefore, total business receipts minus total business deductions may not always equal net income or deficit.[3] These are selected line items from Form 8829, Expenses for Business Use of Your Home, and do not represent the total of the home office business deduction found on the Schedule C.[4] Less than $500.NOTE: Detail may not add to totals because of rounding.SOURCE: IRS, Statistics of Income Division, Sole Proprietorship Returns 2014, October 2016.
Total
Automotivemechanical
andelectrical
repairand
maintenance
Automotivebody
shops
Other autorepair and
maintenance(including oil
change,lube, and car
washes)
Auto repair and maintenance
Miscellaneousrepairs
Personaland laundry
services
Religious,grantmaking,
civic,professional,and similar
organizations
Net income status, item Unclassifiedestablishments

Highlights • Partnerships filed more than 3.6 million tax returns for 2014, a
4.4-percent increase over the number filed for 2013. These returns represented 27.7 million partners, up 0.8 percent from the previous year.
• Domestic limited liability companies (LLCs) made up the majority (67.4 percent) of all partnerships, surpassing all other entity types for the 13th consecutive year.
• Domestic limited partnerships represented only 11.5 percent of all partnerships but reported the most profits (32.2 percent), and the largest share of partners (44.2 percent).
• Real estate and rental and leasing accounted for about half (50.3 percent) of all partnerships and over a quarter (28.5 percent) of all partners. The finance and insurance sector reported the largest shares of total net income (loss) (41.4 percent), total assets (56.4 percent), and total receipts (23.4 percent) for 2014.
• Total assets increased 8.1 percent between 2013 and 2014, from $24.2 trillion to $26.1 trillion. All 20 industrial sectors reported an increase.
• Receipts totaled $7.5 trillion for 2014, up 5.6 percent from the amount reported for 2013. Business receipts made up the majority of total receipts (69.4 percent), rising 2.3 percent for the year.
• Total net income (loss), or profit, increased 8.9 percent, from $768.8 billion for 2013 to $837.4 billion for 2014. Ordinary business income accounted for the majority of this increase.
• Between 2013 and 2014, total income (loss) minus total deductions available for allocation increased from $1,478.5 billion to $1,722.5 billion. Partners classified as partnerships received the largest share of income (loss) allocated to partners, $586.3 billion.
w w w . i r s . g o v / t a x s t a t sStatistics of Income Bulletin | Fall 2016
Partnership Returns, Tax Year 2014 by Ron DeCarlo and Nina Shumofsky
1 This article references Tax Year 2013 data. For further information on these data, see Ron DeCarlo et al., “Partnership Returns, 2013,” Statistics of Income Bulletin, Fall 2015, Volume 35, Number 2.2 For more information on LLCs, see the “Explanation of Selected Terms” section of this article.
Figure APartnership Returns: Percentage Changes in Selected Items, Tax Years 2005–2014
T he number of partnerships and partners in the United States continued to increase for Tax Year 2014. Partnerships filed more than 3.6 million tax returns for the year, representing
more than 27 million partners. The real estate and rental and leasing sector contained just over half of all partnerships (50.3 percent) and over a quarter of all partners (28.5 percent).
Total assets, total receipts, and total net income (loss) all in-creased compared to the previous year (Figure A).1 The finance and insurance sector accounted for the largest portion of each of these three critical financial figures.
SOI Has Published Partnership Data Annually Since 1957A partnership is the relationship between two or more persons who join to carry on a trade or business. Each person contributes money, property, labor, or skill with the expectation of sharing in the profits and losses of the business, regardless of whether a formal partner-ship agreement was made. Every partnership that engages in trade or business, or has income from sources in the United States, must file an annual information return with the Internal Revenue Service, either Form 1065, U.S. Partnership Return of Income, or Form 1065-B, U.S. Return of Income for Electing Large Partnerships.
The IRS Statistics of Income (SOI) Division has published partner-ship data annually since 1957. Prior to that, SOI published financial data for 1939, 1946, 1947, and 1953 only. SOI individual income tax statistics show the number of returns with income or loss from part-nerships, and the corresponding amounts, starting with 1917. SOI data include the number of partnerships since then.
The number of partnerships grew 4.4 percent (from 3,460,699 to 3,611,255) between 2013 and 2014 (Figure B). Since 2005, the number of partnerships has grown at an average annual rate of 2.6 percent. Partnerships classified as limited liability compa-nies (LLCs) accounted for the majority of this growth.2
The number of partners has grown each of the last 10 years, increasing 0.8 percent (from 27,491,241 to 27,714,478) between 2013 and 2014. Partnerships with less than 3 partners made up more than half (55.0 percent) of all partnerships (Figure C). These same-sized partnerships accounted for more than a quar-ter (26.2 percent) of all partnerships with total assets of $100 million or more. Despite the large portion of partnerships with less than 3 partners, partnerships with 100 or more partners
(1) (2) (3) (4) (5)
2005 8.5 4.2 18.3 23.1 41.9 2006 6.6 3.2 24.8 12.5 22.1 2007 5.1 10.7 18.9 14.9 2.5 2008 1.6 4.2 -5.5 -0.3 -33.0 2009 0.7 9.5 -2.4 -18.1 -10.5 2010 2.5 6.1 5.4 14.3 44.9 2011 1.1 8.7 3.8 9.8 -2.2 2012 3.1 3.9 7.0 9.4 33.9 2013 2.1 8.5 9.8 7.1 -1.2 2014 4.4 0.8 8.1 5.6 9.0 SOURCE: IRS, Statistics of Income Division, Partnerships, April 2016.
Total net income(loss)
Taxyear
Totalassets
Totalreceipts
Number of partnerships
Number of partners
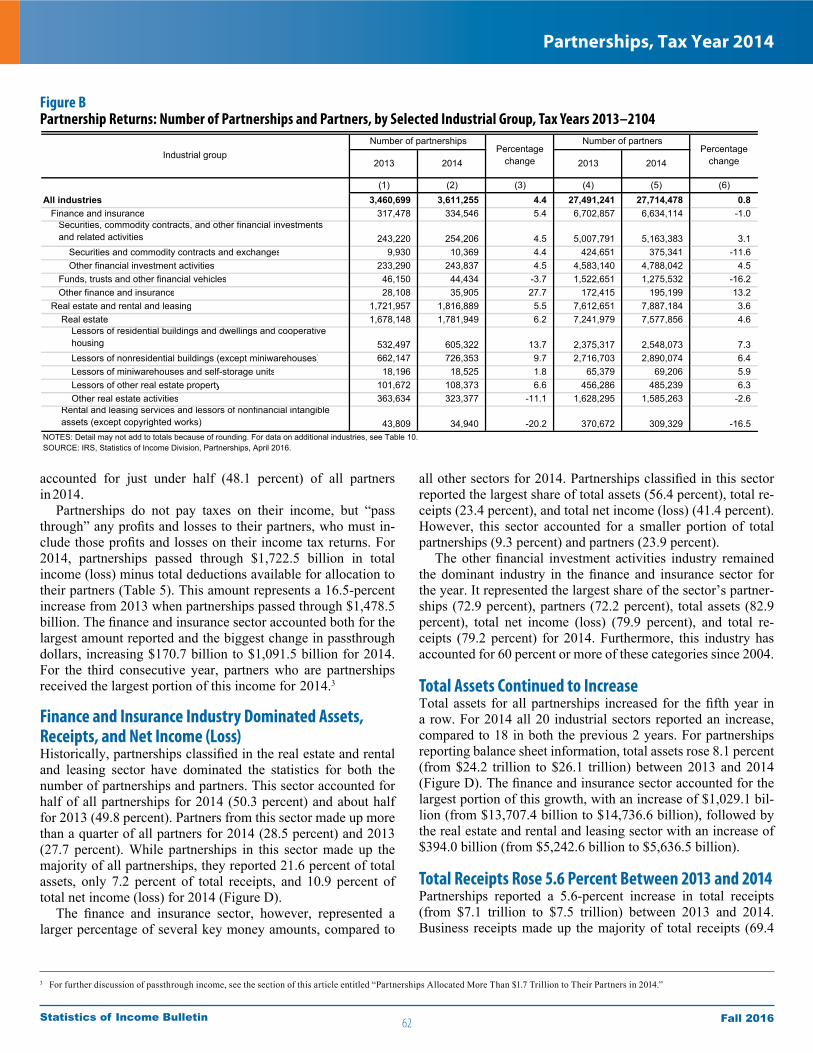
62
Partnerships, Tax Year 2014
Fall 2016Statistics of Income Bulletin
accounted for just under half (48.1 percent) of all partners in 2014.
Partnerships do not pay taxes on their income, but “pass through” any profits and losses to their partners, who must in-clude those profits and losses on their income tax returns. For 2014, partnerships passed through $1,722.5 billion in total income (loss) minus total deductions available for allocation to their partners (Table 5). This amount represents a 16.5-percent increase from 2013 when partnerships passed through $1,478.5 billion. The finance and insurance sector accounted both for the largest amount reported and the biggest change in passthrough dollars, increasing $170.7 billion to $1,091.5 billion for 2014. For the third consecutive year, partners who are partnerships received the largest portion of this income for 2014.3
Finance and Insurance Industry Dominated Assets, Receipts, and Net Income (Loss)Historically, partnerships classified in the real estate and rental and leasing sector have dominated the statistics for both the number of partnerships and partners. This sector accounted for half of all partnerships for 2014 (50.3 percent) and about half for 2013 (49.8 percent). Partners from this sector made up more than a quarter of all partners for 2014 (28.5 percent) and 2013 (27.7 percent). While partnerships in this sector made up the majority of all partnerships, they reported 21.6 percent of total assets, only 7.2 percent of total receipts, and 10.9 percent of total net income (loss) for 2014 (Figure D).
The finance and insurance sector, however, represented a larger percentage of several key money amounts, compared to
all other sectors for 2014. Partnerships classified in this sector reported the largest share of total assets (56.4 percent), total re-ceipts (23.4 percent), and total net income (loss) (41.4 percent). However, this sector accounted for a smaller portion of total partnerships (9.3 percent) and partners (23.9 percent).
The other financial investment activities industry remained the dominant industry in the finance and insurance sector for the year. It represented the largest share of the sector’s partner-ships (72.9 percent), partners (72.2 percent), total assets (82.9 percent), total net income (loss) (79.9 percent), and total re-ceipts (79.2 percent) for 2014. Furthermore, this industry has accounted for 60 percent or more of these categories since 2004.
Total Assets Continued to IncreaseTotal assets for all partnerships increased for the fifth year in a row. For 2014 all 20 industrial sectors reported an increase, compared to 18 in both the previous 2 years. For partnerships reporting balance sheet information, total assets rose 8.1 percent (from $24.2 trillion to $26.1 trillion) between 2013 and 2014 (Figure D). The finance and insurance sector accounted for the largest portion of this growth, with an increase of $1,029.1 bil-lion (from $13,707.4 billion to $14,736.6 billion), followed by the real estate and rental and leasing sector with an increase of $394.0 billion (from $5,242.6 billion to $5,636.5 billion).
Total Receipts Rose 5.6 Percent Between 2013 and 2014Partnerships reported a 5.6-percent increase in total receipts (from $7.1 trillion to $7.5 trillion) between 2013 and 2014. Business receipts made up the majority of total receipts (69.4
Figure BPartnership Returns: Number of Partnerships and Partners, by Selected Industrial Group, Tax Years 2013–2104
(1) (2) (3) (4) (5) (6)All industries 3,460,699 3,611,255 4.4 27,491,241 27,714,478 0.8 Finance and insurance 317,478 334,546 5.4 6,702,857 6,634,114 -1.0
Securities, commodity contracts, and other financial investments and related activities 243,220 254,206 4.5 5,007,791 5,163,383 3.1 Securities and commodity contracts and exchanges 9,930 10,369 4.4 424,651 375,341 -11.6 Other financial investment activities 233,290 243,837 4.5 4,583,140 4,788,042 4.5 Funds, trusts and other financial vehicles 46,150 44,434 -3.7 1,522,651 1,275,532 -16.2 Other finance and insurance 28,108 35,905 27.7 172,415 195,199 13.2 Real estate and rental and leasing 1,721,957 1,816,889 5.5 7,612,651 7,887,184 3.6 Real estate 1,678,148 1,781,949 6.2 7,241,979 7,577,856 4.6
Lessors of residential buildings and dwellings and cooperative housing 532,497 605,322 13.7 2,375,317 2,548,073 7.3 Lessors of nonresidential buildings (except miniwarehouses) 662,147 726,353 9.7 2,716,703 2,890,074 6.4 Lessors of miniwarehouses and self-storage units 18,196 18,525 1.8 65,379 69,206 5.9 Lessors of other real estate property 101,672 108,373 6.6 456,286 485,239 6.3 Other real estate activities 363,634 323,377 -11.1 1,628,295 1,585,263 -2.6
Rental and leasing services and lessors of nonfinancial intangible assets (except copyrighted works) 43,809 34,940 -20.2 370,672 309,329 -16.5
2014Industrial group
NOTES: Detail may not add to totals because of rounding. For data on additional industries, see Table 10.SOURCE: IRS, Statistics of Income Division, Partnerships, April 2016.
Number of partnershipsPercentage
change
Number of partnersPercentage
change2013 2014 2013
3 For further discussion of passthrough income, see the section of this article entitled “Partnerships Allocated More Than $1.7 Trillion to Their Partners in 2014.”

63
Partnerships, Tax Year 2014
Fall 2016Statistics of Income Bulletin
Seventeen Industrial Sectors Reported an Increase in Total Net Income (Loss)Total net income (loss) or profits increased 8.9 percent (from $768.8 billion to $837.4 billion) between 2013 and 2014 (Figure E). Ordinary business income accounted for the major-ity of this increase ($53 billion). Increases in dividends ($13.5 billion) and royalty income ($7.0 billion) also added to the total amount. Partnerships reported the largest decrease in interest income (down $3.2 billion), which offset some of the increases for the year.
For Tax Year 2014, some 17 industrial sectors reported an increase in profits, contrasting to 2013 when 12 sectors showed a decline in profits (Table 10). The finance and insurance sector reported the largest overall increase in profits (up $30.4 billion) for the second consecutive year. The securities, commodity contracts, and other financial investments and related activities subsector reported the largest portion of this increase (up $28.9 billion).
Limited Liability Companies Made Up the Majority of All Partnerships for the 13th Consecutive YearPartnerships classify their business structures as one of six entity types: domestic general partnership, domestic limited partner-ship, domestic limited liability company, domestic limited li-ability partnership, foreign partnership, or “other” partnership. (See the “Explanation of Selected Terms” section for definitions of the entity types.)
Limited liability companies (LLCs) made up the majority of all partnerships (67.4 percent), surpassing all other entity types for the 13th consecutive year. The number of LLCs rose to 2.4 million after increasing 6.4 percent between 2013 and 2014 (Figure F). Partners associated with LLCs increased 5.2 percent (from 9.7 million to 10.2 million) and LLC profits increased 14.9 percent (from $241.9 billion to $277.9 billion) (Figure G). LLCs represented 33.2 percent of the overall profits for all partnerships for 2014, an increase from 31.5 percent in 2013. Looking at gains and losses separately, the losses for LLCs ($212.6 billion) were more than double the combined losses for general and limited partnerships ($93.1 billion) and reduced the net profit amount for partnerships overall.
In contrast to LLCs, limited partnerships represented only 11.5 percent of all partnerships, reported the most profits (32.2 percent), and had the largest share of partners (44.2 percent). Over the last 10 years, the number of limited partnerships has remained constant, while the number of partners associated with those partnerships has risen 76.3 percent and profits have in-creased 50.2 percent (Figure H). The total net income (loss) for limited partnerships increased $10.9 billion (from $249.9 billion to $270 billion) between 2013 and 2014.
Prior to 2002, domestic general partnerships were consis-tently the most common type of partnership and have ranked second since that time. This type of partnership accounted for 15.9 percent (0.6 million) of all partnerships for Tax Year 2014.
Figure CPartnership Returns: Number of Partnerships and Partners, by Number of Partners per Partnership, Tax Year 2014
(1) (2) (3)Number of partnerships, total 3,611,255 26,107 0.7 Number of partners per partnership:
Less than 3 1,985,615 6,851 0.3 3 less than 5 997,722 5,362 0.5 5 less than 10 424,616 3,457 0.8 10 less than 20 116,483 2,425 2.1 20 less than 30 38,033 1,284 3.4 30 less than 40 13,899 966 7.0 40 less than 50 9,691 821 8.5 50 less than 60 4,077 641 15.7 60 less than 70 3,332 520 15.6 70 less than 80 4,323 478 11.1 80 less than 90 1,533 340 22.2 90 less than 100 2,206 332 15.1 100 or greater 9,725 2,629 27.0 1,000 or greater [1] 384 249 64.7
(4) (5) (6)Number of partners, total 27,714,478 10,966,087 39.6 Number of partners per partnership:
Less than 3 3,968,473 13,700 0.3 3 less than 5 3,344,985 17,929 0.5 5 less than 10 2,598,977 22,492 0.9 10 less than 20 1,584,585 33,434 2.1 20 less than 30 909,250 31,326 3.4 30 less than 40 470,833 33,014 7.0 40 less than 50 427,618 36,381 8.5 50 less than 60 222,270 34,851 15.7 60 less than 70 214,282 33,609 15.7 70 less than 80 315,711 35,405 11.2 80 less than 90 129,831 28,683 22.1 90 less than 100 205,716 31,340 15.2 100 or greater 13,321,948 10,613,924 79.7 1,000 or greater [1] 11,455,428 10,049,164 87.7
Partnerships with $100,000,000 or more
in assets
Number of partners
Partnership Returns: Number of Partnerships and Partners, by Number of Partners per Partnership, Tax Year 2014
[1] These statistics are also included on the line entitled “100 or greater.”NOTE: Detail may not add to totals because of rounding.SOURCE: IRS, Statistics of Income Division, Partnerships, April 2016.
Percentageof total
Number of partnersper partnership
Totalnumber of
partnerships
Partnerships with $100,000,000 or more
in assets Number of partnerships
Percentageof total
Number of partnersper partnership
Totalnumber of partners
percent), and showed a corresponding increase of $116.5 billion (to $5.2 trillion) for the year (Table 7). (See the “Explanation of Selected Terms” section for the definition of total receipts and business receipts.) Almost all (19 out of 20) industrial sectors reported a rise in total receipts for the year. Wholesale trade was the exception with a $187.7 billion decline. The finance and insurance sector reported the largest dollar gain in total receipts, rising $209.3 billion (from $1,539.2 billion to $1,748.4 billion).
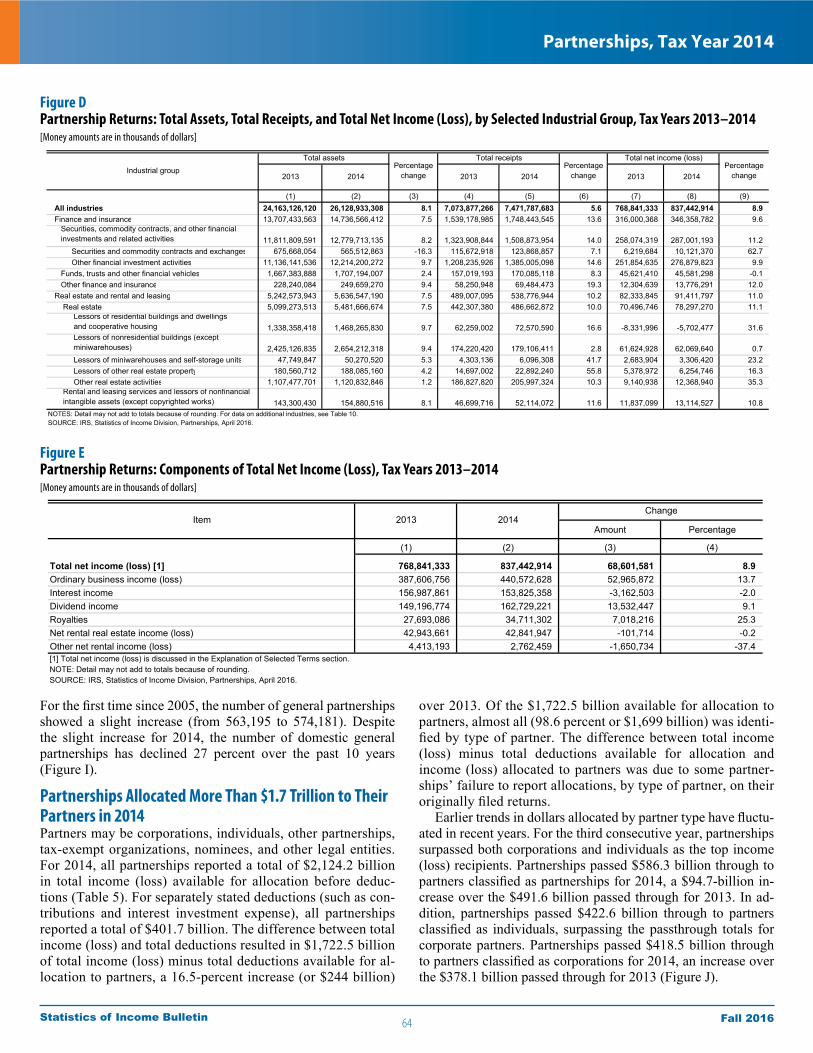
64
Partnerships, Tax Year 2014
Fall 2016Statistics of Income Bulletin
For the first time since 2005, the number of general partnerships showed a slight increase (from 563,195 to 574,181). Despite the slight increase for 2014, the number of domestic general partnerships has declined 27 percent over the past 10 years (Figure I).
Partnerships Allocated More Than $1.7 Trillion to Their Partners in 2014Partners may be corporations, individuals, other partnerships, tax-exempt organizations, nominees, and other legal entities. For 2014, all partnerships reported a total of $2,124.2 billion in total income (loss) available for allocation before deduc-tions (Table 5). For separately stated deductions (such as con-tributions and interest investment expense), all partnerships reported a total of $401.7 billion. The difference between total income (loss) and total deductions resulted in $1,722.5 billion of total income (loss) minus total deductions available for al-location to partners, a 16.5-percent increase (or $244 billion)
over 2013. Of the $1,722.5 billion available for allocation to partners, almost all (98.6 percent or $1,699 billion) was identi-fied by type of partner. The difference between total income (loss) minus total deductions available for allocation and income (loss) allocated to partners was due to some partner-ships’ failure to report allocations, by type of partner, on their originally filed returns.
Earlier trends in dollars allocated by partner type have fluctu-ated in recent years. For the third consecutive year, partnerships surpassed both corporations and individuals as the top income (loss) recipients. Partnerships passed $586.3 billion through to partners classified as partnerships for 2014, a $94.7-billion in-crease over the $491.6 billion passed through for 2013. In ad-dition, partnerships passed $422.6 billion through to partners classified as individuals, surpassing the passthrough totals for corporate partners. Partnerships passed $418.5 billion through to partners classified as corporations for 2014, an increase over the $378.1 billion passed through for 2013 (Figure J).
Figure DPartnership Returns: Total Assets, Total Receipts, and Total Net Income (Loss), by Selected Industrial Group, Tax Years 2013–2014 [Money amounts are in thousands of dollars]
Figure EPartnership Returns: Components of Total Net Income (Loss), Tax Years 2013–2014[Money amounts are in thousands of dollars]
(1) (2) (3) (4) (5) (6) (7) (8) (9) All industries 24,163,126,120 26,128,933,308 8.1 7,073,877,266 7,471,787,683 5.6 768,841,333 837,442,914 8.9 Finance and insurance 13,707,433,563 14,736,566,412 7.5 1,539,178,985 1,748,443,545 13.6 316,000,368 346,358,782 9.6
Securities, commodity contracts, and other financial investments and related activities 11,811,809,591 12,779,713,135 8.2 1,323,908,844 1,508,873,954 14.0 258,074,319 287,001,193 11.2 Securities and commodity contracts and exchanges 675,668,054 565,512,863 -16.3 115,672,918 123,868,857 7.1 6,219,684 10,121,370 62.7 Other financial investment activities 11,136,141,536 12,214,200,272 9.7 1,208,235,926 1,385,005,098 14.6 251,854,635 276,879,823 9.9 Funds, trusts and other financial vehicles 1,667,383,888 1,707,194,007 2.4 157,019,193 170,085,118 8.3 45,621,410 45,581,298 -0.1 Other finance and insurance 228,240,084 249,659,270 9.4 58,250,948 69,484,473 19.3 12,304,639 13,776,291 12.0 Real estate and rental and leasing 5,242,573,943 5,636,547,190 7.5 489,007,095 538,776,944 10.2 82,333,845 91,411,797 11.0 Real estate 5,099,273,513 5,481,666,674 7.5 442,307,380 486,662,872 10.0 70,496,746 78,297,270 11.1
Lessors of residential buildings and dwellings and cooperative housing 1,338,358,418 1,468,265,830 9.7 62,259,002 72,570,590 16.6 -8,331,996 -5,702,477 31.6
Lessors of nonresidential buildings (except miniwarehouses) 2,425,126,835 2,654,212,318 9.4 174,220,420 179,106,411 2.8 61,624,928 62,069,640 0.7 Lessors of miniwarehouses and self-storage units 47,749,847 50,270,520 5.3 4,303,136 6,096,308 41.7 2,683,904 3,306,420 23.2 Lessors of other real estate property 180,560,712 188,085,160 4.2 14,697,002 22,892,240 55.8 5,378,972 6,254,746 16.3 Other real estate activities 1,107,477,701 1,120,832,846 1.2 186,827,820 205,997,324 10.3 9,140,938 12,368,940 35.3
Rental and leasing services and lessors of nonfinancial intangible assets (except copyrighted works) 143,300,430 154,880,516 8.1 46,699,716 52,114,072 11.6 11,837,099 13,114,527 10.8
2014 2013 2014
NOTES: Detail may not add to totals because of rounding. For data on additional industries, see Table 10.SOURCE: IRS, Statistics of Income Division, Partnerships, April 2016.
Industrial groupTotal assets
Percentagechange
Total receiptsPercentage
change
Total net income (loss)Percentage
change2013 2014 2013
Amount Percentage
(1) (2) (3) (4)
Total net income (loss) [1] 768,841,333 837,442,914 68,601,581 8.9 Ordinary business income (loss) 387,606,756 440,572,628 52,965,872 13.7 Interest income 156,987,861 153,825,358 -3,162,503 -2.0 Dividend income 149,196,774 162,729,221 13,532,447 9.1 Royalties 27,693,086 34,711,302 7,018,216 25.3 Net rental real estate income (loss) 42,943,661 42,841,947 -101,714 -0.2 Other net rental income (loss) 4,413,193 2,762,459 -1,650,734 -37.4
Item 2013 2014Change
[1] Total net income (loss) is discussed in the Explanation of Selected Terms section.NOTE: Detail may not add to totals because of rounding.SOURCE: IRS, Statistics of Income Division, Partnerships, April 2016.
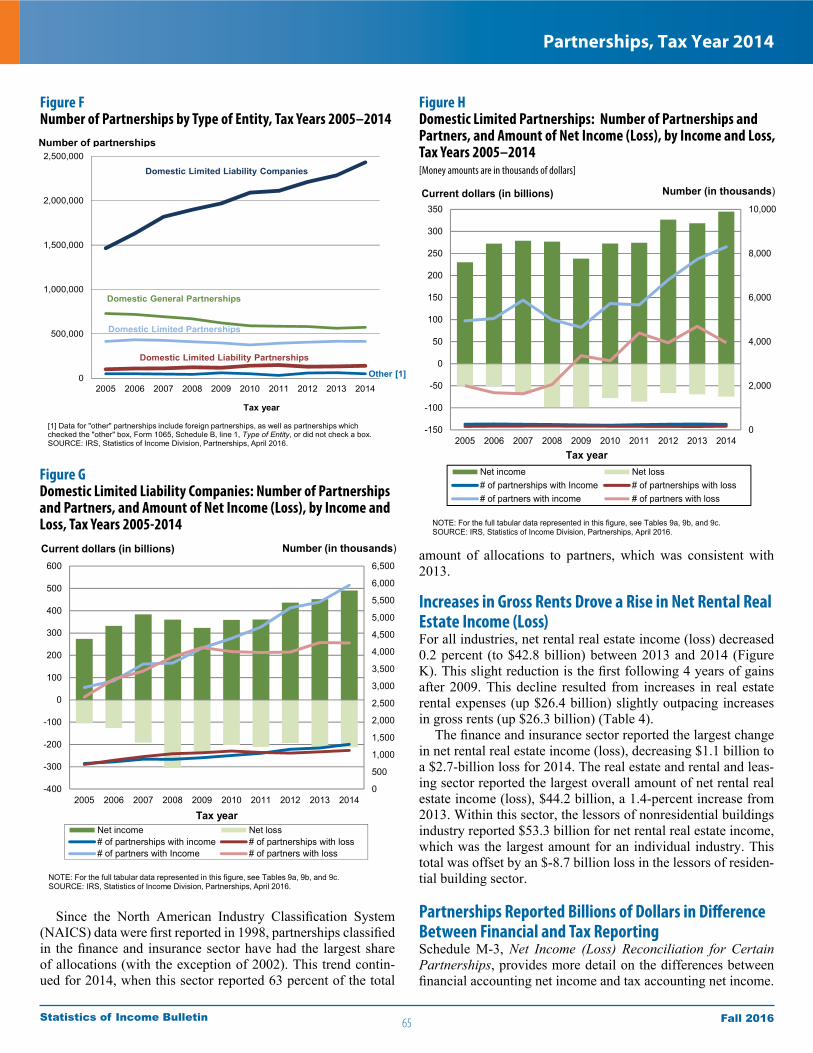
65
Partnerships, Tax Year 2014
Fall 2016Statistics of Income Bulletin
Since the North American Industry Classification System (NAICS) data were first reported in 1998, partnerships classified in the finance and insurance sector have had the largest share of allocations (with the exception of 2002). This trend contin-ued for 2014, when this sector reported 63 percent of the total
Figure FNumber of Partnerships by Type of Entity, Tax Years 2005–2014
Figure GDomestic Limited Liability Companies: Number of Partnerships and Partners, and Amount of Net Income (Loss), by Income and Loss, Tax Years 2005-2014
Figure HDomestic Limited Partnerships: Number of Partnerships and Partners, and Amount of Net Income (Loss), by Income and Loss, Tax Years 2005–2014[Money amounts are in thousands of dollars]
amount of allocations to partners, which was consistent with 2013.
Increases in Gross Rents Drove a Rise in Net Rental Real Estate Income (Loss)For all industries, net rental real estate income (loss) decreased 0.2 percent (to $42.8 billion) between 2013 and 2014 (Figure K). This slight reduction is the first following 4 years of gains after 2009. This decline resulted from increases in real estate rental expenses (up $26.4 billion) slightly outpacing increases in gross rents (up $26.3 billion) (Table 4).
The finance and insurance sector reported the largest change in net rental real estate income (loss), decreasing $1.1 billion to a $2.7-billion loss for 2014. The real estate and rental and leas-ing sector reported the largest overall amount of net rental real estate income (loss), $44.2 billion, a 1.4-percent increase from 2013. Within this sector, the lessors of nonresidential buildings industry reported $53.3 billion for net rental real estate income, which was the largest amount for an individual industry. This total was offset by an $-8.7 billion loss in the lessors of residen-tial building sector.
Partnerships Reported Billions of Dollars in Difference Between Financial and Tax ReportingSchedule M-3, Net Income (Loss) Reconciliation for Certain Partnerships, provides more detail on the differences between financial accounting net income and tax accounting net income.
0
500,000
1,000,000
1,500,000
2,000,000
2,500,000
2005 2006 2007 2008 2009 2010 2011 2012 2013 2014
Tax year
[1] Data for "other" partnerships include foreign partnerships, as well as partnerships which checked the "other" box, Form 1065, Schedule B, line 1, Type of Entity, or did not check a box. SOURCE: IRS, Statistics of Income Division, Partnerships, April 2016.
Domestic Limited Liability Companies
Domestic General Partnerships
Domestic Limited Partnerships
Domestic Limited Liability Partnerships
Number of partnerships
Other [1]
0
500
1,000
1,500
2,000
2,500
3,000
3,500
4,000
4,500
5,000
5,500
6,000
6,500
-400
-300
-200
-100
0
100
200
300
400
500
600
2005 2006 2007 2008 2009 2010 2011 2012 2013 2014
Tax yearNet income Net loss# of partnerships with income # of partnerships with loss# of partners with Income # of partners with loss
Current dollars (in billions) Number (in thousands)
NOTE: For the full tabular data represented in this figure, see Tables 9a, 9b, and 9c.SOURCE: IRS, Statistics of Income Division, Partnerships, April 2016.
0
2,000
4,000
6,000
8,000
10,000
-150
-100
-50
0
50
100
150
200
250
300
350
2005 2006 2007 2008 2009 2010 2011 2012 2013 2014Tax year
Net income Net loss# of partnerships with Income # of partnerships with loss# of partners with income # of partners with loss
NOTE: For the full tabular data represented in this figure, see Tables 9a, 9b, and 9c.SOURCE: IRS, Statistics of Income Division, Partnerships, April 2016.
Number (in thousands)Current dollars (in billions)
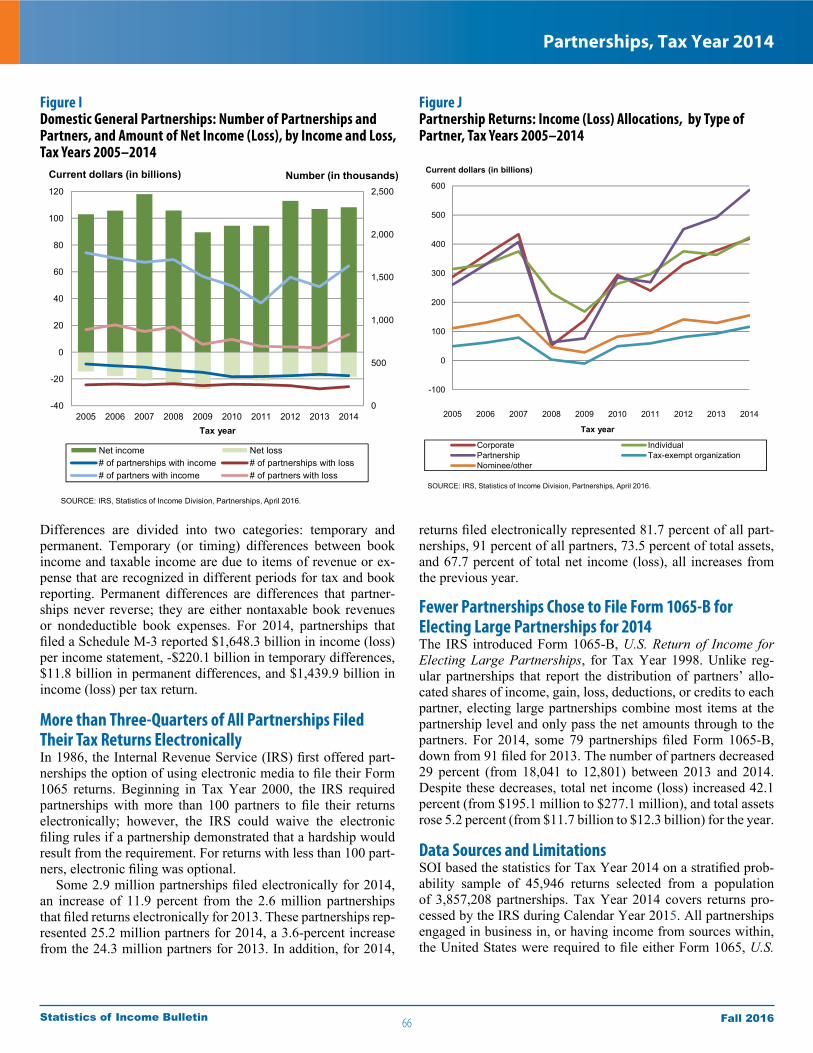
66
Partnerships, Tax Year 2014
Fall 2016Statistics of Income Bulletin
Differences are divided into two categories: temporary and permanent. Temporary (or timing) differences between book income and taxable income are due to items of revenue or ex-pense that are recognized in different periods for tax and book reporting. Permanent differences are differences that partner-ships never reverse; they are either nontaxable book revenues or nondeductible book expenses. For 2014, partnerships that filed a Schedule M-3 reported $1,648.3 billion in income (loss) per income statement, -$220.1 billion in temporary differences, $11.8 billion in permanent differences, and $1,439.9 billion in income (loss) per tax return.
More than Three-Quarters of All Partnerships Filed Their Tax Returns Electronically In 1986, the Internal Revenue Service (IRS) first offered part-nerships the option of using electronic media to file their Form 1065 returns. Beginning in Tax Year 2000, the IRS required partnerships with more than 100 partners to file their returns electronically; however, the IRS could waive the electronic filing rules if a partnership demonstrated that a hardship would result from the requirement. For returns with less than 100 part-ners, electronic filing was optional.
Some 2.9 million partnerships filed electronically for 2014, an increase of 11.9 percent from the 2.6 million partnerships that filed returns electronically for 2013. These partnerships rep-resented 25.2 million partners for 2014, a 3.6-percent increase from the 24.3 million partners for 2013. In addition, for 2014,
returns filed electronically represented 81.7 percent of all part-nerships, 91 percent of all partners, 73.5 percent of total assets, and 67.7 percent of total net income (loss), all increases from the previous year.
Fewer Partnerships Chose to File Form 1065-B for Electing Large Partnerships for 2014The IRS introduced Form 1065-B, U.S. Return of Income for Electing Large Partnerships, for Tax Year 1998. Unlike reg-ular partnerships that report the distribution of partners’ allo-cated shares of income, gain, loss, deductions, or credits to each partner, electing large partnerships combine most items at the partnership level and only pass the net amounts through to the partners. For 2014, some 79 partnerships filed Form 1065-B, down from 91 filed for 2013. The number of partners decreased 29 percent (from 18,041 to 12,801) between 2013 and 2014. Despite these decreases, total net income (loss) increased 42.1 percent (from $195.1 million to $277.1 million), and total assets rose 5.2 percent (from $11.7 billion to $12.3 billion) for the year.
Data Sources and LimitationsSOI based the statistics for Tax Year 2014 on a stratified prob-ability sample of 45,946 returns selected from a population of 3,857,208 partnerships. Tax Year 2014 covers returns pro-cessed by the IRS during Calendar Year 2015. All partnerships engaged in business in, or having income from sources within, the United States were required to file either Form 1065, U.S.
Figure IDomestic General Partnerships: Number of Partnerships and Partners, and Amount of Net Income (Loss), by Income and Loss, Tax Years 2005–2014
Figure JPartnership Returns: Income (Loss) Allocations, by Type of Partner, Tax Years 2005–2014
-100
0
100
200
300
400
500
600
2005 2006 2007 2008 2009 2010 2011 2012 2013 2014
Tax year
Corporate IndividualPartnership Tax-exempt organizationNominee/other
SOURCE: IRS, Statistics of Income Division, Partnerships, April 2016.
Current dollars (in billions)
0
500
1,000
1,500
2,000
2,500
-40
-20
0
20
40
60
80
100
120
2005 2006 2007 2008 2009 2010 2011 2012 2013 2014
Number (in thousands)
Tax year
Net income Net loss# of partnerships with income # of partnerships with loss# of partners with income # of partners with loss
Current dollars (in billions)
SOURCE: IRS, Statistics of Income Division, Partnerships, April 2016.

67
Partnerships, Tax Year 2014
Fall 2016Statistics of Income Bulletin
Partnership Return of Income, or Form 1065-B, U.S. Return of Income for Electing Large Partnerships, to report income or loss, deductions, tax credits, and other tax-related items gener-ated by the partnership. The statistics are only for active partner-ships, defined as those reporting any items of income or deduc-tion derived from a trade or business, or from rental or portfolio income.
SOI stratified the population into classes based on industry, type of return, size of total assets, and size of certain receipt or income amounts from both ordinary business income (loss) and portfolio income (loss). From these classes, SOI selected returns at various probabilities (from 0.02 percent to 100 percent) and weighted them to represent the total population. SOI ruled 574 sampled returns as “out of scope” because they had no activity or duplicated other returns already in the study. This resulted in a final sample of 45,372 returns and an estimated overall active population of 3,621,155.
Because the data presented in this article are based on a sample of returns, they are subject to sampling error. To use the data properly, the magnitude of the potential sampling error needs to be known. Coefficients of variation (CVs), the ratio of an estimate’s standard error to the estimate, are used to measure this magnitude. Figure L presents the coefficients of variation for certain money amounts, for selected industrial sectors. The estimate is judged more reliable the smaller the coefficient of variation.
Notes for Data TablesAll money amounts and frequencies in the data tables were sub-ject to rounding errors. As a result, a row or column of frequen-cies or amounts may fail to add exactly to the corresponding total amount. At the table level, SOI rounded money amounts to the nearest $1,000, and amounts of $500 or more to the next highest thousand. Total amounts between +$500 and -$500 were foot-noted to indicate an amount that rounded to zero was present.
Whenever a cell frequency was less than 3, SOI either com-bined or deleted the estimate to avoid disclosing information
about specific partnerships. A footnote at the end of the table de-scribes how to identify such combinations or deletions. In other cases, an estimate based on fewer than 10 returns, not selected at the 100-percent rate, is indicated by an asterisk (*) and con-sidered statistically unreliable. These estimates should typically be used in combination with other tabulated values due to the small sample size.
The statistical reliability of each cell in the tables was deter-mined separately from all other cells. Thus, it was possible for a total figure to be marked with an asterisk (*), indicating statisti-cal unreliability, while a subset of the total is not so marked. For example, a sector amount could be based on 7 returns, 3 not sampled at the 100-percent rate. The amount would receive an asterisk. However, an industry amount, within the sector, may include all 4 returns sampled at the 100-percent rate and would not receive an asterisk.
Explanation of Selected TermsAssets and liabilities—A partnership was required to provide balance sheet information, in general, only if it had total receipts of $250,000 or more, total assets of $1,000,000 or more, and did not file Schedule M-3. For partnerships with accounting periods ending before 2008, the total asset requirement was $600,000. SOI did not estimate the assets and liabilities of partnerships that did not provide this information. If a partnership provided bal-ance sheet data in a format of its own, instead of that provided on the return form, an effort was made during data collection to associate the amounts provided with the items on the partner-ship balance sheet. In addition, for returns with accounting pe-riods ending after December 31, 2005, total assets should have been determined without offset by liabilities and not reported as a negative amount. If, however, the partnership continued to report negative total assets, no effort was made during data col-lection to change the amount.
Business receipts—Business receipts represent the gross re-ceipts or sales less returns and allowances from trade or busi-ness income. Business receipts were the largest component of
Figure KPartnership Returns: Net Rental Real Estate Income (Loss), by Selected Industrial Group, Tax Years 2013–2014[Money amounts are in thousands of dollars]
Amount Percentage
(1) (2) (3) (4)
All industries 42,943,661 42,841,947 -101,714 -0.2 Real estate and rental and leasing 43,607,632 44,197,972 590,340 1.4 Real estate 43,382,518 43,861,476 478,958 1.1 Lessors of residential buildings and dwellings and cooperative housing -10,024,667 -8,744,593 1,280,074 12.8 Lessors of nonresidential buildings (except miniwarehouses) 53,886,772 53,269,686 -617,086 -1.1 Lessors of miniwarehouses and self-storage units 2,557,319 3,132,198 574,879 22.5 Lessors of other real estate property 3,318,400 4,332,538 1,014,138 30.6 Other real estate activities -6,355,304 -8,128,352 -1,773,048 -27.9
Industrial group 2013 2014Change
NOTE: Detail may not add to totals because of rounding.SOURCE: IRS, Statistics of Income Division, Partnerships, April 2016.

68
Partnerships, Tax Year 2014
Fall 2016Statistics of Income Bulletin
gross receipts for industry groups such as manufacturing. SOI did not adjust business receipts to include rental real estate ac-tivity, which was reported separately on the partnership’s return.
Electing large partnerships—Partnerships with 100 or more partners in the preceding year could elect to file Form 1065-B,
U.S. Return of Income for Electing Large Partnerships, in lieu of the more general Form 1065. Unlike a regular partnership reporting its allocated share of income, gain, loss, deductions, or credits to each partner, an electing large partnership com-bines most items at the partnership level and passes through net amounts to partners.
Electronically filed (ELF) partnerships—Certain partner-ships with more than 100 partners were required to file their returns electronically. Other partnerships could volunteer to file electronically. Partnerships submitting ELF returns electroni-cally did so in lieu of paper returns.
Foreign partnerships—A foreign partnership that has gross income effectively connected with the conduct of a trade or business within the United States or has gross income derived from sources in the United States must file a Form 1065, even if its principal place of business was outside the United States or all its partners were foreign persons.
Limited liability companies (domestic)—A limited liability company (LLC) is an entity formed under State law by filing articles of organization as an LLC. Limited liability compa-nies that choose to be classified as partnerships file Form 1065, U.S. Partnership Return of Income. SOI identified LLCs by their response to a question on Form 1065, Schedule B, Other Information. Limited liability companies combine the corpo-rate characteristics of limited liability for all members with the passthrough income treatment of a partnership. (The owners of an LLC are called members, not partners.) These businesses offer more organizational flexibility than S corporations. (S corporations pass through their income, gains and losses, de-ductions, and credits to their shareholders for tax purposes, like partnerships.) For example, unlike S corporations, LLCs are not limited in the number and type of owners. Unlike partners in limited partnerships, all members of LLCs have limited liability protection, even if they actively participate in the management of the business. In some cases, LLCs file as sole proprietorships on individual income tax returns or as corporations on corpora-tion income tax returns. LLC data reported on these returns were not included in this article.
Limited liability partnerships (domestic)—A limited liabil-ity partnership (LLP) is formed under a State limited liability partnership law. Limited liability partnerships file Form 1065, U.S. Partnership Return of Income. SOI identified LLPs by their response to a question on Form 1065, Schedule B, Other Information. Organizationally, LLPs are available in some States only for professional partnerships, such as law firms or accounting firms. A partner in an LLP receives liability pro-tection from the actions of other partners, but is liable for the partnership debts as well as the consequences of his or her own actions.
Nonrecourse loans—Nonrecourse loans are those partner-ship liabilities for which no partner bears the economic risk of loss.
North American Industry Classification System—Starting with the 1998 partnership study, SOI classified data using the North American Industry Classification System (NAICS), which replaced the Standard Industry Classification system
Figure LPartnership Returns: Coefficients of Variation for Selected Items by Industrial Sector, Tax Year 2014[Coefficients of variation in percentages]
(1) (2) (3) (4)All industries 0.62 0.11 0.18 0.19Agriculture, forestry, fishing, and hunting 8.91 4.89 3.98 4.09
Mining 17.51 1.13 1.03 1.17
Utilities 29.04 1.54 0.50 0.57
Construction 8.14 3.89 1.90 1.92
Manufacturing 12.92 0.57 0.36 0.37
Wholesale trade 12.00 1.28 0.65 0.65
Retail trade 8.17 1.73 0.92 0.93
Transportation and warehousing 15.61 0.78 1.20 1.17
Information 10.13 0.49 0.64 0.74
Finance and insurance 5.20 0.20 1.14 1.28
Real estate and rental and leasing 1.28 0.57 2.45 2.57
Professional, scientific, and technical services 7.06 2.46 1.16 1.24
Management of companies 18.88 1.43 3.15 3.23Administrative and support and waste management and remediation services 12.88 2.98 3.36 3.40Educational services 20.22 16.58 11.36 11.53
Health care and social assistance 5.63 2.18 1.31 1.38
Arts, entertainment, and recreation 13.60 3.34 2.81 2.91
Accommodation and food services 7.68 3.22 2.26 2.26
Other services 12.78 9.14 5.88 5.89Nature of business not allocable 0.00 0.00 0.00 0.00
Number of partnershipsNumber of partnersTotal assetsTotal incomeBusiness receiptsTotal deductionsCost of goods soldInterest paidTaxes and licensesDepreciationOrdinary business incomeOrdinary business lossInterest incomePortfolio income (loss) distributed directly to partners
Net rental real estate incomeNet rental real estate lossOther net rental incomeOther net rental lossTotal net income (loss)Total income (loss) minus total deductions available for allocation
Total receipts 0.24
0.871.752.356.648.070.82
[1] All items in this figure can be found in Table 1 except for: Total income (loss) minus total deductions available for allocation (Table 5) and Total receipts (Table 7).NOTE: For 2014, there were no returns classified as Nature of business not allocable. SOURCE: IRS, Statistics of Income Division, Partnerships, April 2016.
0.580.720.551.330.84
1.16
Industrial sector
0.180.160.190.230.86
Item [1]Coefficients of
variation—continued
0.11
All industries
(5)0.62
Coefficients of variation Number
ofpartnerships
Totalassets
1.57
Totalincome
Totaldeductions
69
Partnerships, Tax Year 2014
Fall 2016Statistics of Income Bulletin
(SIC). NAICS is a hierarchical system that classifies businesses, including partnerships, into sectors, subsectors, industry groups, and industries. Although the complete NAICS uses 20 sectors, SOI grouped the partnership data into 20 industrial divisions in Tax Year 1998 through Tax Year 2001 SOI Bulletin articles for presentation purposes and easier comparison between NAICS and SIC data. SOI dropped the industrial division for the Tax Year 2002 article and grouped the partnership data into the same 20 industrial sectors used in NAICS, except for: 1) excluding public administration, and 2) adding nature of business not allocable. Businesses are only classified in the nature of busi-ness not allocable sector when a more specific activity cannot be identified from the return. SOI classified data within these industrial sectors in industrial groups. The most detailed clas-sification in this article and related data tables is the “industry.” The 20 sectors used in this article are:
● Agriculture, forestry, fishing, and hunting;
● Mining;
● Utilities;
● Construction;
● Manufacturing;
● Wholesale trade;
● Retail trade;
● Transportation and warehousing;
● Information;
● Finance and insurance;
● Real estate and rental and leasing;
● Professional, scientific, and technical services;
● Management of companies (holding companies);
● Administrative and support and waste management and remediation services;
● Educational services;
● Health care and social assistance;
● Arts, entertainment, and recreation;
● Accommodation and food services;
● Other services; and
● Nature of business not allocable.
In addition, in 2002, 2007, and 2012, NAICS updated its classification system. In 2002, the new version included a re-vised structure for both the construction and information sectors and additional detail for the retail trade sector. NAICS updated
the information sector again in 2007, along with one financial industry. In 2012, changes occurred in the following sectors: Manufacturing; Wholesale trade; Retail trade; Real estate and rental and leasing; and Accommodation and food services. The North American Industry Classification System publica-tion contains appendices comparing the 2002, 2007, and 2012 NAICS United States structures to the 1997 NAICS United States structure.4
SOI determined partnership industries based on the activity from which the business derived the largest percentage of its total receipts. For industry coding purposes only, SOI defined total receipts as the sum of:
● gross receipts or sales less returns and allowances (i.e., business receipts in the statistics);
● ordinary income from other partnerships, estates, and trusts;
● net farm profit;
● net gain from Form 4797;
● other income (Form 1065, page 1, line 7);
● other gross rental income;
● interest income;
● dividend income;
● royalties;
● net short-term capital gain;
● net long-term capital gain;
● net section 1231 gain;
● other income (Form 1065, page 4, line 11);
● gross rents from rental real estate;
● net gain from the disposition of property from rental real estate activities; and
● net income from rental real estate activities from partner-ships, estates, and trusts in which the partnership is a part-ner or beneficiary.
Total receipts for the partnership industry coding purposes differs from total receipts used elsewhere in this article (see Total receipts in this section).
Partner—Partners can be individuals, corporations, other partnerships, or any other legal entity. Partners are classified as either general or limited. General partners are those who assume liability for the partnership’s debts and losses. Limited partners are those whose liability in the partnership is limited to their investment. By definition, a partnership must have at least two partners, at least one of which must be a general partner. A
4 For further information about the North American Industry Classification System, including background, formats, and detailed descriptions of the activities included in each classification, see North American Industry Classification System, United States, Executive Office of the President, Office of Management and Budget (http://www.census.gov/eos/www/naics/).

Ron DeCarlo and Nina Shumofsky are economists with the Corporation Special Projects Section. This article was prepared under the direction of Joseph Koshansky, Chief.
70
Partnerships, Tax Year 2014
Fall 2016Statistics of Income Bulletin
general partnership is composed entirely of general partners. A limited partnership has at least one general partner and one or more limited partners.
Partnerships—A partnership is the relationship between two or more persons who join to carry on a trade or business. Each person contributes money, property, labor, or skill with the ex-pectation of sharing in the profits and losses of the business, re-gardless of whether a formal partnership agreement was made. Every partnership that engages in a trade or business or has income from sources in the United States must file an annual in-formation return with the Internal Revenue Service, either Form 1065, U.S. Partnership Return of Income, or Form 1065-B, U.S. Return of Income for Electing Large Partnerships, showing the partnership’s income or loss for the year. A partnership must file this return even if its principal place of business is outside the United States and even if all of its members are nonresident aliens.
Total net income (loss)—Through Tax Year 1986, partner-ships reported the amounts for total net income (loss) as ordi-nary income (loss) on Form 1065. After the tax law changes and tax form revisions in 1987, Statistics of Income studies began computing a similar total figure as the sum of the following:
● ordinary business income (loss); ● interest income; ● dividend income; ● royalties; ● net rental real estate income (loss) from Form 8825; and ● other net rental income (loss).
The sum of these components is a measure of overall part-nership profits or losses, which allows for comparisons with total net income (loss) reported for years before 1987. The profit status of a partnership is determined based on the sum of these six amounts. Partnerships where the sum of these six amounts equals zero are included with loss partnerships. For 2004, the definition of total net income (loss) was revised because other portfolio income (loss) was excluded since it was no longer re-ported separately on Schedule K, but was included on Schedule K, Line 11, “Other income (loss).” This resulted in the 2004 total net income (loss) being understated by that amount when compared to years prior to 2004. However, this understatement was small since, for 2003, other portfolio income (loss) for all partnerships was only $3.1 billion or 1 percent of the $301.4 bil-lion reported for total net income (loss).
Total receipts—Total receipts is computed for the statistics to reflect similar computations published in other Statistics of Income (SOI) studies. It is the sum of positive income received by partnerships for the specific items listed below (Negative amounts or losses are included in the statistics as deduction items.):
● gross receipts or sales less returns and allowances (i.e., business receipts in the statistics);
● ordinary income from other partnerships, estates and trusts;
● net farm profit; ● net gain from Form 4797; ● other income (Form 1065, page 1, line 7); ● net rental real estate income; ● other net rental income; ● interest income; ● dividend income; ● royalties; ● net short-term capital gain; ● net long-term capital gain; ● net section 1231 gain; and ● other income (Form 1065, page 4, line 11).
Total receipts in Table 7 differ from total receipts presented in Table 11 in the Selected Historical and Projected Data ac-cessible online at www.irs.gov/uac/SOI-Tax-Stats-Historical-Table-11. Table 11 excludes certain income items allocated di-rectly to partners (such as net short-term and long-term capital gains, net gain under Internal Revenue Code section 1231, and other income (Schedule K, Line 11)).
Additional Tabular Data on Tax Stats WebsiteFor additional partnership tabular data by size of total assets, see the Partnership section on the Tax Stats Website at www.irs.gov/taxstats/index.html. This site also includes tabular data on partnership returns for prior years, as well as informa-tion on filing requirements, sample designs, an explanation of terms, and links to other SOI studies. Beginning in 2007, tabu-lar data for partnerships that reported foreign transaction data on Form 1065, Schedule K, Partners’ Distributive Share Items, lines 16a–m, were added to Tax Stats. Table 23 shows these foreign transaction data by selected industry group. Table 24 shows total assets, trade or business income and deductions, portfolio income, rental income, and total net income, by size of total assets, for partnerships that reported these foreign transac-tion data. In addition, Table 25 is the same as Table 24, except that it displays data for partnerships that did not report foreign transaction data.

71
Partnerships, Tax Year 2014
Fall 2016Statistics of Income Bulletin
[All figures are estimates based on samples—money amounts are in thousands of dollars]
(1) (2) (3) (4) (5) (6) (7)
Number of partnerships 3,611,255 143,516 60,880 55,539 8,666 2,099 16,332 Number of partners 27,714,478 456,700 193,446 168,790 37,869 5,274 51,321 Total assets 26,128,933,308 219,475,999 80,055,663 70,432,205 49,951,188 5,127,108 13,909,835 Income and deductions from a trade or business: Total income 5,603,166,669 47,340,509 16,350,765 10,997,368 4,147,863 2,448,107 13,396,405 Business receipts 5,185,510,381 33,060,702 7,873,072 6,161,577 4,056,217 2,360,395 12,609,440 Ordinary income from other partnerships and fiduciaries 145,221,603 1,190,802 711,084 220,599 * 4,576 * 26 254,517 Farm net profit 11,103,632 10,857,707 7,009,146 3,689,887 * 311 0 * 158,362 Net gain, noncapital assets 26,841,902 1,514,338 594,764 862,108 * 11,233 * 35,642 10,591 Other income 234,489,152 716,960 162,699 63,198 75,526 52,043 363,494 Total deductions 5,162,594,042 42,184,236 11,738,935 10,045,726 4,791,923 2,506,454 13,101,198 Cost of goods sold 3,065,992,261 21,317,610 4,922,467 4,115,412 2,345,083 1,047,384 8,887,264 Inventory, beginning of year 292,403,115 3,073,244 1,063,923 664,136 193,491 * 76,256 1,075,437 Purchases 2,207,221,054 14,753,828 2,932,394 2,968,651 1,180,200 * 105,268 7,567,315 Cost of labor 148,468,563 1,091,002 387,722 163,972 * 118,431 * 244,747 176,130 Additional inventory costs (section 263A) 16,654,461 344,663 * 270,778 2,390 * 38,323 * 18,125 * 15,048 Other costs 703,725,166 5,493,901 1,361,015 1,157,652 1,000,939 691,533 1,282,762 Less: Inventory, end of year 302,480,098 3,439,029 1,093,365 841,390 186,301 * 88,545 1,229,428 Salaries and wages 541,453,609 2,730,682 763,522 573,789 338,350 44,822 1,010,199 Guaranteed payments to partners 67,100,175 806,209 247,429 353,906 76,684 * 36,058 92,132 Rent paid 92,197,088 353,754 127,023 54,331 55,215 13,628 103,557 Interest paid 82,882,319 618,936 76,961 91,387 107,066 176,819 166,703 Taxes and licenses 83,391,297 474,854 116,393 80,011 94,944 19,917 163,590 Bad debts 15,027,032 109,476 77,807 1,534 * 391 * 19,941 9,802 Repairs and maintenance 30,564,085 466,301 71,961 80,195 64,668 66,529 182,949 Depreciation 167,928,282 1,377,290 236,258 390,815 176,231 139,119 434,867 Depletion 901,941 * 42,851 0 0 * 42,851 0 0 Retirement plans, etc. 13,279,878 31,207 * 8,210 2,918 * 1,695 * 302 18,082 Employee benefit programs 43,493,002 147,082 51,185 35,721 * 7,770 * 2,652 49,754 Ordinary loss from other partnerships and fiduciaries 60,171,596 678,715 69,653 217,576 145,329 * 89,560 156,597 Farm net loss 6,595,942 6,174,220 3,225,329 2,776,182 * 39,487 0 * 133,223 Net loss, noncapital assets 6,031,652 39,296 * 240 * 31,008 * 3,014 * 81 * 4,954 Other deductions 885,583,881 6,815,754 1,744,496 1,240,943 1,293,146 849,644 1,687,525 Ordinary business income (loss) 440,572,628 5,156,273 4,611,830 951,642 -644,060 -58,347 295,207 Net income 690,096,548 13,494,588 7,811,362 4,254,568 116,279 235,568 1,076,811 Loss 249,523,921 8,338,315 3,199,531 3,302,926 760,339 293,914 781,604 Portfolio income (loss) distributed directly to partners 1,076,596,885 3,907,987 1,029,844 1,776,791 861,778 97,783 141,791 Interest income 153,825,358 668,556 172,690 69,121 365,547 18,712 42,486 Dividend income 162,729,221 490,272 187,922 158,406 35,192 * 56,459 52,292 Royalties 34,711,302 1,626,442 * 281,702 933,591 388,209 * 22,623 * 317 Net short-term capital gain (loss) 66,058,368 7,899 19,721 -8,662 * -1,412 0 * -1,749 Net long-term capital gain (loss) 659,272,636 1,114,818 367,808 624,335 * 74,243 * -12 48,444 Net rental real estate income (loss) 42,841,947 409,365 232,829 72,810 56,706 0 47,021 Net income 137,827,541 470,011 256,997 102,203 62,127 0 48,685 Loss 94,985,594 60,646 24,168 29,393 * 5,421 0 * 1,663 Other net rental income (loss) 2,762,459 99,733 * 51,310 28,027 * 18,421 * 1,007 * 968 Net income 7,949,916 104,660 * 51,310 32,886 * 18,421 * 1,007 * 1,035 Loss 5,187,457 * 4,926 0 * 4,859 0 0 * 68 Total net income (loss) [1] 837,442,914 8,450,642 5,538,284 2,213,597 220,014 40,455 438,291 Net income 1,156,121,917 16,200,782 8,554,969 5,309,143 859,844 276,926 1,199,899 Loss 318,679,004 7,750,140 3,016,685 3,095,546 639,830 * 236,471 761,608 Footnotes at end of table.
Supportactivities for
agriculture and forestry
Item
TotalCrop
productionAnimal
productionForestry
and logging
Allindustries Fishing, hunting,
and trapping
Agriculture, forestry, fishing, and hunting
Table 1. All Partnerships: Total Assets, Trade or Business Income and Deductions, Portfolio Income, Rental Income, and Total Net Income, by Selected Industrial Group, Tax Year 2014

72
Partnerships, Tax Year 2014
Fall 2016Statistics of Income Bulletin
[All figures are estimates based on samples—money amounts are in thousands of dollars]
(8) (9) (10) (11) (12) (13) (14)
Number of partnerships 31,489 26,734 1,121 3,635 5,046 142,632 57,011 Number of partners 2,526,857 2,085,747 335,595 105,515 163,591 412,324 197,729 Total assets 638,581,018 548,316,907 61,332,473 28,931,639 399,251,342 215,363,433 128,920,936 Income and deductions from a trade or business: Total income 228,102,591 171,611,641 29,344,231 27,146,718 208,783,791 272,553,169 147,454,038 Business receipts 208,565,314 154,069,030 27,995,167 26,501,116 201,911,133 265,915,376 142,629,664 Ordinary income from other partnerships and fiduciaries 8,642,278 7,750,797 697,003 194,478 4,574,814 1,176,949 931,747 Farm net profit * 2,328 * 2,328 0 0 0 * 7,055 0 Net gain, noncapital assets 4,712,157 4,446,687 188,548 76,921 411,436 340,411 47,263 Other income 6,180,514 5,342,799 463,513 374,203 1,886,408 5,113,377 3,845,364 Total deductions 170,600,277 116,148,760 28,204,076 26,247,441 213,343,970 260,188,618 141,846,721 Cost of goods sold 73,140,523 37,706,940 22,499,668 12,933,915 166,587,259 219,034,069 126,158,049 Inventory, beginning of year 4,734,910 896,993 2,897,620 940,298 3,253,765 35,916,597 25,519,457 Purchases 17,182,805 10,872,591 2,808,966 3,501,248 138,086,923 60,769,422 35,009,537 Cost of labor 6,182,967 1,016,878 2,746,442 2,419,647 583,977 22,129,090 5,749,921 Additional inventory costs (section 263A) 600,770 219,013 332,254 49,504 -99,928 3,653,238 2,069,527 Other costs 49,751,344 25,697,396 16,928,257 7,125,691 27,865,195 134,382,430 84,718,565 Less: Inventory, end of year 5,312,274 995,930 3,213,871 1,102,472 3,102,674 37,816,708 26,908,958 Salaries and wages 7,775,918 4,238,304 638,545 2,899,070 2,017,596 10,142,386 3,587,723 Guaranteed payments to partners 315,490 233,398 20,586 61,506 262,009 2,415,465 724,124 Rent paid 1,328,929 630,386 123,420 575,124 973,557 1,361,554 432,361 Interest paid 7,187,632 5,967,610 705,894 514,129 5,502,687 1,784,604 889,588 Taxes and licenses 4,599,529 4,048,684 199,080 351,765 1,742,649 1,660,023 587,200 Bad debts 79,086 24,337 12,972 41,777 68,453 299,610 181,680 Repairs and maintenance 1,428,054 825,773 92,021 510,260 1,910,582 691,919 195,339 Depreciation 22,145,916 18,863,565 599,548 2,682,804 18,516,454 1,773,532 462,951 Depletion 616,328 9,305 600,221 * 6,803 1,123 * 64 * 61 Retirement plans, etc. 123,938 76,094 28,379 19,465 101,402 151,900 62,742 Employee benefit programs 736,982 472,911 84,059 180,012 224,021 618,500 168,516 Ordinary loss from other partnerships and fiduciaries 3,445,081 3,171,937 97,114 176,029 1,716,852 401,278 258,054 Farm net loss 15,740 * 15,478 262 0 0 * 3,567 0 Net loss, noncapital assets 274,957 169,071 98,135 7,751 62,145 18,738 11,812 Other deductions 47,386,173 39,694,967 2,404,175 5,287,031 13,657,181 19,831,408 8,126,519 Ordinary business income (loss) 57,502,313 55,462,881 1,140,155 899,277 -4,560,180 12,364,550 5,607,318 Net income 76,070,880 70,286,924 3,225,659 2,558,297 10,559,166 18,554,973 8,575,408 Loss 18,568,566 14,824,042 2,085,503 1,659,021 15,119,346 6,190,423 2,968,091 Portfolio income (loss) distributed directly to partners 10,735,812 9,579,495 721,029 435,288 1,691,682 1,317,613 321,812 Interest income 783,216 617,502 126,792 38,922 272,205 394,573 160,143 Dividend income 600,393 504,449 45,294 * 50,650 25,623 202,576 12,090 Royalties 6,109,318 5,915,975 66,288 * 127,054 4,244 475 * 5 Net short-term capital gain (loss) -53,272 -65,294 2,572 * 9,449 4,025 141,897 -7,693 Net long-term capital gain (loss) 3,296,157 2,606,862 480,083 * 209,212 1,385,586 578,092 157,266 Net rental real estate income (loss) -197,617 -204,380 4,649 * 2,114 1,250 -104,489 -46,527 Net income 67,356 59,182 5,966 * 2,208 1,331 219,961 175,772 Loss 264,973 263,562 * 1,317 * 94 * 81 324,450 222,299 Other net rental income (loss) 104,811 37,063 3,097 * 64,650 -603,519 33,416 -95 Net income 110,387 42,531 3,206 * 64,650 37,348 35,114 * 1,524 Loss * 5,576 * 5,467 109 0 * 640,867 * 1,698 * 1,618 Total net income (loss) [1] 64,902,434 62,333,492 1,386,275 1,182,667 -4,860,377 12,891,102 5,732,935 Net income 83,211,649 77,094,150 3,403,336 2,714,164 10,720,546 19,001,194 8,696,233 Loss 18,309,215 14,760,657 2,017,061 1,531,497 15,580,923 6,110,092 2,963,298 Footnotes at end of table.
TotalOil and gas extraction Other mining
Supportactivitiesfor mining
Constructionof buildings
Mining
Total
UtilitiesItem
Table 1. All Partnerships: Total Assets, Trade or Business Income and Deductions, Portfolio Income, Rental Income, and Total Net Income, by Selected Industrial Group, Tax Year 2014—Continued
Construction
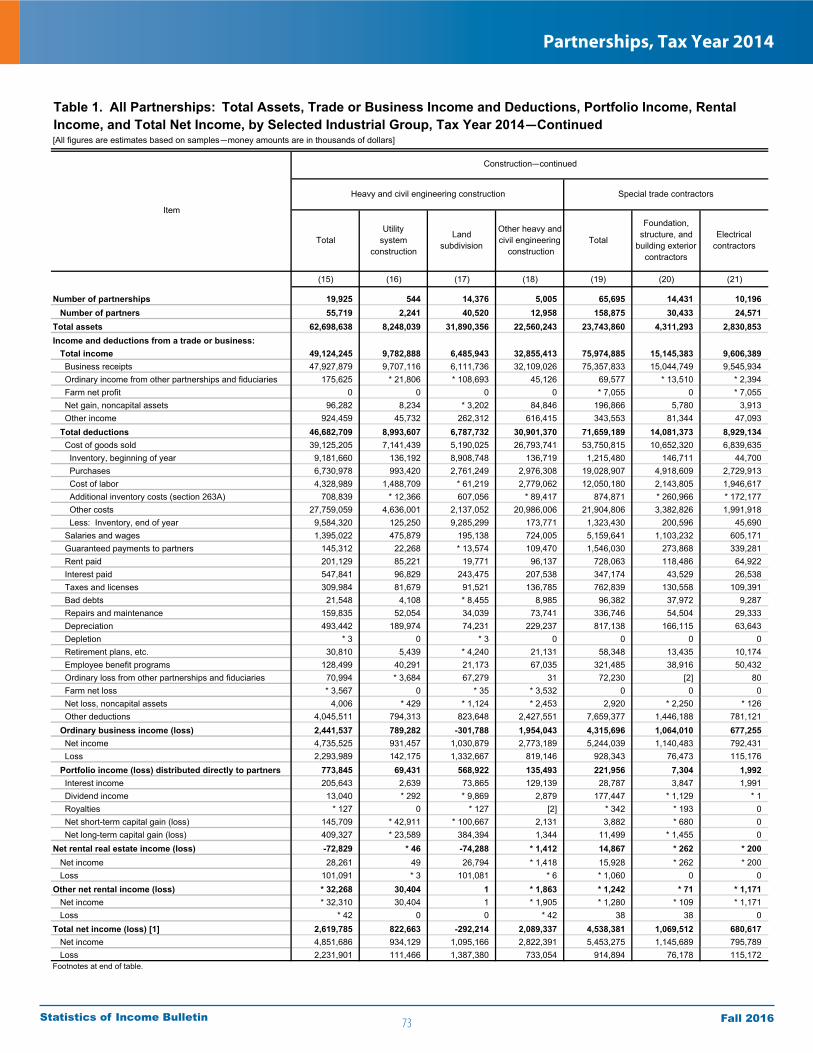
73
Partnerships, Tax Year 2014
Fall 2016Statistics of Income Bulletin
[All figures are estimates based on samples—money amounts are in thousands of dollars]
(15) (16) (17) (18) (19) (20) (21)
Number of partnerships 19,925 544 14,376 5,005 65,695 14,431 10,196 Number of partners 55,719 2,241 40,520 12,958 158,875 30,433 24,571 Total assets 62,698,638 8,248,039 31,890,356 22,560,243 23,743,860 4,311,293 2,830,853 Income and deductions from a trade or business: Total income 49,124,245 9,782,888 6,485,943 32,855,413 75,974,885 15,145,383 9,606,389 Business receipts 47,927,879 9,707,116 6,111,736 32,109,026 75,357,833 15,044,749 9,545,934 Ordinary income from other partnerships and fiduciaries 175,625 * 21,806 * 108,693 45,126 69,577 * 13,510 * 2,394 Farm net profit 0 0 0 0 * 7,055 0 * 7,055 Net gain, noncapital assets 96,282 8,234 * 3,202 84,846 196,866 5,780 3,913 Other income 924,459 45,732 262,312 616,415 343,553 81,344 47,093 Total deductions 46,682,709 8,993,607 6,787,732 30,901,370 71,659,189 14,081,373 8,929,134 Cost of goods sold 39,125,205 7,141,439 5,190,025 26,793,741 53,750,815 10,652,320 6,839,635 Inventory, beginning of year 9,181,660 136,192 8,908,748 136,719 1,215,480 146,711 44,700 Purchases 6,730,978 993,420 2,761,249 2,976,308 19,028,907 4,918,609 2,729,913 Cost of labor 4,328,989 1,488,709 * 61,219 2,779,062 12,050,180 2,143,805 1,946,617 Additional inventory costs (section 263A) 708,839 * 12,366 607,056 * 89,417 874,871 * 260,966 * 172,177 Other costs 27,759,059 4,636,001 2,137,052 20,986,006 21,904,806 3,382,826 1,991,918 Less: Inventory, end of year 9,584,320 125,250 9,285,299 173,771 1,323,430 200,596 45,690 Salaries and wages 1,395,022 475,879 195,138 724,005 5,159,641 1,103,232 605,171 Guaranteed payments to partners 145,312 22,268 * 13,574 109,470 1,546,030 273,868 339,281 Rent paid 201,129 85,221 19,771 96,137 728,063 118,486 64,922 Interest paid 547,841 96,829 243,475 207,538 347,174 43,529 26,538 Taxes and licenses 309,984 81,679 91,521 136,785 762,839 130,558 109,391 Bad debts 21,548 4,108 * 8,455 8,985 96,382 37,972 9,287 Repairs and maintenance 159,835 52,054 34,039 73,741 336,746 54,504 29,333 Depreciation 493,442 189,974 74,231 229,237 817,138 166,115 63,643 Depletion * 3 0 * 3 0 0 0 0 Retirement plans, etc. 30,810 5,439 * 4,240 21,131 58,348 13,435 10,174 Employee benefit programs 128,499 40,291 21,173 67,035 321,485 38,916 50,432 Ordinary loss from other partnerships and fiduciaries 70,994 * 3,684 67,279 31 72,230 [2] 80 Farm net loss * 3,567 0 * 35 * 3,532 0 0 0 Net loss, noncapital assets 4,006 * 429 * 1,124 * 2,453 2,920 * 2,250 * 126 Other deductions 4,045,511 794,313 823,648 2,427,551 7,659,377 1,446,188 781,121 Ordinary business income (loss) 2,441,537 789,282 -301,788 1,954,043 4,315,696 1,064,010 677,255 Net income 4,735,525 931,457 1,030,879 2,773,189 5,244,039 1,140,483 792,431 Loss 2,293,989 142,175 1,332,667 819,146 928,343 76,473 115,176 Portfolio income (loss) distributed directly to partners 773,845 69,431 568,922 135,493 221,956 7,304 1,992 Interest income 205,643 2,639 73,865 129,139 28,787 3,847 1,991 Dividend income 13,040 * 292 * 9,869 2,879 177,447 * 1,129 * 1 Royalties * 127 0 * 127 [2] * 342 * 193 0 Net short-term capital gain (loss) 145,709 * 42,911 * 100,667 2,131 3,882 * 680 0 Net long-term capital gain (loss) 409,327 * 23,589 384,394 1,344 11,499 * 1,455 0 Net rental real estate income (loss) -72,829 * 46 -74,288 * 1,412 14,867 * 262 * 200 Net income 28,261 49 26,794 * 1,418 15,928 * 262 * 200 Loss 101,091 * 3 101,081 * 6 * 1,060 0 0 Other net rental income (loss) * 32,268 30,404 1 * 1,863 * 1,242 * 71 * 1,171 Net income * 32,310 30,404 1 * 1,905 * 1,280 * 109 * 1,171 Loss * 42 0 0 * 42 38 38 0 Total net income (loss) [1] 2,619,785 822,663 -292,214 2,089,337 4,538,381 1,069,512 680,617 Net income 4,851,686 934,129 1,095,166 2,822,391 5,453,275 1,145,689 795,789 Loss 2,231,901 111,466 1,387,380 733,054 914,894 76,178 115,172 Footnotes at end of table.
Foundation,structure, and
building exteriorcontractors
Electricalcontractors
Heavy and civil engineering construction
Item
TotalUtility
systemconstruction
Landsubdivision
Other heavy and civil engineering
constructionTotal
Table 1. All Partnerships: Total Assets, Trade or Business Income and Deductions, Portfolio Income, Rental Income, and Total Net Income, by Selected Industrial Group, Tax Year 2014—Continued
Construction—continued
Special trade contractors

74
Partnerships, Tax Year 2014
Fall 2016Statistics of Income Bulletin
[All figures are estimates based on samples—money amounts are in thousands of dollars]
(22) (23) (24) (25) (26) (27) (28)
Number of partnerships 8,169 15,457 17,442 66,775 3,612 4,364 319 Number of partners 18,666 41,664 43,542 836,615 25,948 30,080 1,853 Total assets 3,156,744 2,841,745 10,603,223 836,920,696 60,233,391 51,708,793 2,827,763 Income and deductions from a trade or business: Total income 13,151,262 11,309,196 26,762,655 1,162,673,838 105,249,625 34,209,982 5,432,085 Business receipts 12,907,112 11,295,926 26,564,112 1,141,692,489 104,395,089 32,967,937 5,343,746 Ordinary income from other partnerships and fiduciaries * 42,910 * 605 * 10,158 5,855,423 402,237 * 10,802 631 Farm net profit 0 0 0 * 3,248 * 2,986 * 210 0 Net gain, noncapital assets 130,187 * 1,037 55,950 1,190,475 39,746 30,993 * 8,481 Other income 71,053 11,629 132,435 13,932,203 409,567 1,200,039 79,226 Total deductions 12,439,857 10,506,465 25,702,360 1,115,867,643 102,048,272 32,060,467 5,328,798 Cost of goods sold 8,954,720 8,015,942 19,288,198 949,517,764 89,719,530 21,034,258 4,459,569 Inventory, beginning of year 183,006 188,293 652,770 80,377,765 8,699,477 3,909,843 856,949 Purchases 3,274,061 3,027,794 5,078,530 719,026,301 74,262,287 15,308,091 3,132,445 Cost of labor 2,141,794 2,110,305 3,707,659 39,299,034 4,505,696 1,091,092 558,603 Additional inventory costs (section 263A) * 22,333 267,813 151,583 4,486,287 487,062 70,755 41,216 Other costs 3,510,074 2,680,573 10,339,416 193,985,244 11,138,725 4,928,665 755,081 Less: Inventory, end of year 176,547 258,835 641,762 87,656,868 9,373,716 4,274,187 884,726 Salaries and wages 1,125,579 426,157 1,899,503 32,573,849 2,609,628 2,645,352 265,888 Guaranteed payments to partners 193,084 413,844 325,954 2,636,060 130,124 116,689 * 14,976 Rent paid 135,827 143,239 265,589 4,276,947 395,124 207,195 21,361 Interest paid 82,457 29,978 164,672 8,259,116 622,652 400,256 76,642 Taxes and licenses 211,569 91,205 220,116 12,639,694 336,576 525,325 31,289 Bad debts 16,894 8,219 24,009 566,317 31,099 19,634 9,848 Repairs and maintenance 42,411 37,118 173,379 3,213,994 298,358 168,480 15,486 Depreciation 83,415 55,674 448,291 13,692,488 853,811 551,811 17,374 Depletion 0 0 0 192,085 0 0 0 Retirement plans, etc. 17,874 1,667 15,198 1,973,988 118,635 196,900 7,717 Employee benefit programs 81,957 24,305 125,875 10,188,999 220,326 562,200 17,093 Ordinary loss from other partnerships and fiduciaries * 1,835 * 3,886 * 66,428 601,384 123,630 * 12,006 * 3,742 Farm net loss 0 0 0 57,182 3,923 53,259 0 Net loss, noncapital assets * 4 * 153 * 386 326,942 15,647 * 4,810 * 9 Other deductions 1,492,230 1,255,077 2,684,761 75,150,835 6,569,211 5,562,293 387,803 Ordinary business income (loss) 711,405 802,731 1,060,295 46,806,195 3,201,352 2,149,515 103,286 Net income 881,505 844,162 1,585,457 68,487,291 4,474,267 2,915,739 156,611 Loss 170,100 * 41,431 525,162 21,681,096 1,272,914 766,224 * 53,324 Portfolio income (loss) distributed directly to partners 179,117 18,187 15,356 16,127,512 306,369 194,685 53,256 Interest income 5,566 7,374 10,008 3,818,515 62,557 86,785 1,025 Dividend income * 173,218 * 1,822 1,277 4,227,126 142,044 18,969 * 35,415 Royalties [2] 0 * 149 6,033,678 14,968 34,959 * 16,240 Net short-term capital gain (loss) * 12 * 2,871 * 318 36,432 -30 451 * 38 Net long-term capital gain (loss) * 321 * 6,120 * 3,603 2,011,761 86,831 * 53,521 * 537 Net rental real estate income (loss) * 1,278 * 279 * 12,848 39,781 1,580 * 1,965 * 902 Net income * 1,549 * 467 * 13,450 48,171 2,733 * 1,995 * 902 Loss * 271 * 188 * 602 8,390 * 1,153 30 0 Other net rental income (loss) 0 0 0 733,405 3,494 43,517 335 Net income 0 0 0 734,916 3,494 43,517 335 Loss 0 0 0 1,510 0 0 0 Total net income (loss) [1] 891,467 812,206 1,084,579 61,658,700 3,425,994 2,335,711 157,203 Net income 1,061,136 853,043 1,597,618 80,877,499 4,688,400 3,020,486 191,786 Loss 169,669 * 40,836 513,039 19,218,799 1,262,406 684,775 * 34,583 Footnotes at end of table.
Plumbing,heating and
air-conditioningcontractors
Buildingfinishing
contractors
Other specialty
tradecontractors
TotalTextile millsand textile
product mills
Foodmanufacturing
Beverage andtobaccoproduct
manufacturing
Item
Table 1. All Partnerships: Total Assets, Trade or Business Income and Deductions, Portfolio Income, Rental Income, and Total Net Income, by Selected Industrial Group, Tax Year 2014—Continued
Construction—continued
Special trade contractors—continued
Manufacturing
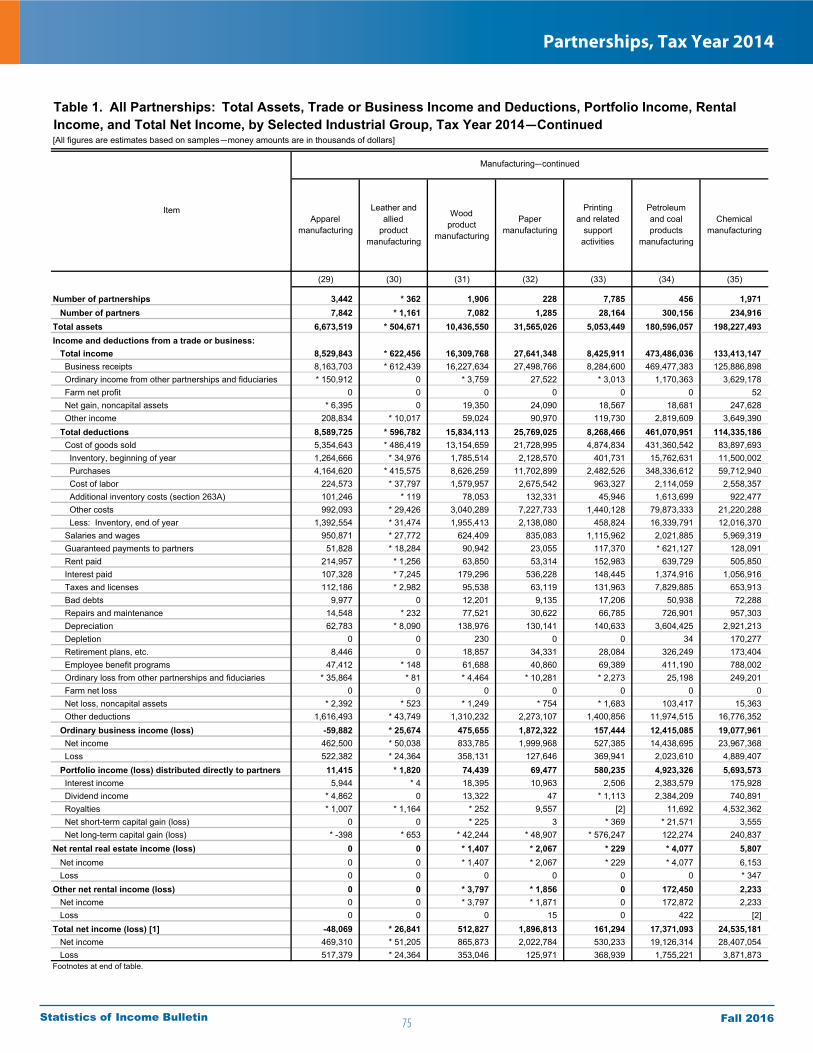
75
Partnerships, Tax Year 2014
Fall 2016Statistics of Income Bulletin
[All figures are estimates based on samples—money amounts are in thousands of dollars]
(29) (30) (31) (32) (33) (34) (35)
Number of partnerships 3,442 * 362 1,906 228 7,785 456 1,971 Number of partners 7,842 * 1,161 7,082 1,285 28,164 300,156 234,916 Total assets 6,673,519 * 504,671 10,436,550 31,565,026 5,053,449 180,596,057 198,227,493 Income and deductions from a trade or business: Total income 8,529,843 * 622,456 16,309,768 27,641,348 8,425,911 473,486,036 133,413,147 Business receipts 8,163,703 * 612,439 16,227,634 27,498,766 8,284,600 469,477,383 125,886,898 Ordinary income from other partnerships and fiduciaries * 150,912 0 * 3,759 27,522 * 3,013 1,170,363 3,629,178 Farm net profit 0 0 0 0 0 0 52 Net gain, noncapital assets * 6,395 0 19,350 24,090 18,567 18,681 247,628 Other income 208,834 * 10,017 59,024 90,970 119,730 2,819,609 3,649,390 Total deductions 8,589,725 * 596,782 15,834,113 25,769,025 8,268,466 461,070,951 114,335,186 Cost of goods sold 5,354,643 * 486,419 13,154,659 21,728,995 4,874,834 431,360,542 83,897,693 Inventory, beginning of year 1,264,666 * 34,976 1,785,514 2,128,570 401,731 15,762,631 11,500,002 Purchases 4,164,620 * 415,575 8,626,259 11,702,899 2,482,526 348,336,612 59,712,940 Cost of labor 224,573 * 37,797 1,579,957 2,675,542 963,327 2,114,059 2,558,357 Additional inventory costs (section 263A) 101,246 * 119 78,053 132,331 45,946 1,613,699 922,477 Other costs 992,093 * 29,426 3,040,289 7,227,733 1,440,128 79,873,333 21,220,288 Less: Inventory, end of year 1,392,554 * 31,474 1,955,413 2,138,080 458,824 16,339,791 12,016,370 Salaries and wages 950,871 * 27,772 624,409 835,083 1,115,962 2,021,885 5,969,319 Guaranteed payments to partners 51,828 * 18,284 90,942 23,055 117,370 * 621,127 128,091 Rent paid 214,957 * 1,256 63,850 53,314 152,983 639,729 505,850 Interest paid 107,328 * 7,245 179,296 536,228 148,445 1,374,916 1,056,916 Taxes and licenses 112,186 * 2,982 95,538 63,119 131,963 7,829,885 653,913 Bad debts 9,977 0 12,201 9,135 17,206 50,938 72,288 Repairs and maintenance 14,548 * 232 77,521 30,622 66,785 726,901 957,303 Depreciation 62,783 * 8,090 138,976 130,141 140,633 3,604,425 2,921,213 Depletion 0 0 230 0 0 34 170,277 Retirement plans, etc. 8,446 0 18,857 34,331 28,084 326,249 173,404 Employee benefit programs 47,412 * 148 61,688 40,860 69,389 411,190 788,002 Ordinary loss from other partnerships and fiduciaries * 35,864 * 81 * 4,464 * 10,281 * 2,273 25,198 249,201 Farm net loss 0 0 0 0 0 0 0 Net loss, noncapital assets * 2,392 * 523 * 1,249 * 754 * 1,683 103,417 15,363 Other deductions 1,616,493 * 43,749 1,310,232 2,273,107 1,400,856 11,974,515 16,776,352 Ordinary business income (loss) -59,882 * 25,674 475,655 1,872,322 157,444 12,415,085 19,077,961 Net income 462,500 * 50,038 833,785 1,999,968 527,385 14,438,695 23,967,368 Loss 522,382 * 24,364 358,131 127,646 369,941 2,023,610 4,889,407 Portfolio income (loss) distributed directly to partners 11,415 * 1,820 74,439 69,477 580,235 4,923,326 5,693,573 Interest income 5,944 * 4 18,395 10,963 2,506 2,383,579 175,928 Dividend income * 4,862 0 13,322 47 * 1,113 2,384,209 740,891 Royalties * 1,007 * 1,164 * 252 9,557 [2] 11,692 4,532,362 Net short-term capital gain (loss) 0 0 * 225 3 * 369 * 21,571 3,555 Net long-term capital gain (loss) * -398 * 653 * 42,244 * 48,907 * 576,247 122,274 240,837 Net rental real estate income (loss) 0 0 * 1,407 * 2,067 * 229 * 4,077 5,807 Net income 0 0 * 1,407 * 2,067 * 229 * 4,077 6,153 Loss 0 0 0 0 0 0 * 347 Other net rental income (loss) 0 0 * 3,797 * 1,856 0 172,450 2,233 Net income 0 0 * 3,797 * 1,871 0 172,872 2,233 Loss 0 0 0 15 0 422 [2] Total net income (loss) [1] -48,069 * 26,841 512,827 1,896,813 161,294 17,371,093 24,535,181 Net income 469,310 * 51,205 865,873 2,022,784 530,233 19,126,314 28,407,054 Loss 517,379 * 24,364 353,046 125,971 368,939 1,755,221 3,871,873 Footnotes at end of table.
Apparelmanufacturing
Leather andallied
productmanufacturing
Woodproduct
manufacturing
Petroleumand coal products
manufacturing
Papermanufacturing
Printingand related
supportactivities
ItemChemical
manufacturing
Table 1. All Partnerships: Total Assets, Trade or Business Income and Deductions, Portfolio Income, Rental Income, and Total Net Income, by Selected Industrial Group, Tax Year 2014—Continued
Manufacturing—continued

76
Partnerships, Tax Year 2014
Fall 2016Statistics of Income Bulletin
[All figures are estimates based on samples—money amounts are in thousands of dollars]
(36) (37) (38) (39) (40) (41) (42)
Number of partnerships 830 1,541 436 6,982 4,227 2,562 440 Number of partners 4,338 5,926 2,690 24,927 44,088 24,094 2,287 Total assets 21,585,377 8,768,543 26,852,857 29,468,994 64,376,056 17,850,723 6,812,703 Income and deductions from a trade or business: Total income 24,415,483 10,545,815 45,390,059 34,650,347 42,918,232 20,194,682 7,930,625 Business receipts 24,149,910 10,237,984 45,051,036 34,142,244 41,989,140 19,934,715 7,690,850 Ordinary income from other partnerships and fiduciaries * 6,453 * 81,852 * 68,194 * 39,534 * 15,471 * 2,665 * 191,487 Farm net profit 0 0 0 0 0 0 0 Net gain, noncapital assets 74,184 18,756 13,289 8,957 78,121 4,484 * 1,061 Other income 184,935 207,224 257,540 459,613 835,501 252,818 47,227 Total deductions 23,416,345 10,305,251 44,360,483 32,694,755 41,330,017 21,154,613 7,437,555 Cost of goods sold 19,078,273 7,615,927 40,942,964 25,367,032 31,947,143 13,758,788 5,611,495 Inventory, beginning of year 2,397,625 1,131,434 4,393,976 3,276,716 6,692,785 1,701,804 930,685 Purchases 11,764,977 3,171,825 30,851,449 16,345,975 14,438,951 7,879,304 3,423,711 Cost of labor 2,505,350 1,043,766 2,121,815 3,480,615 3,611,220 1,210,749 770,994 Additional inventory costs (section 263A) 254,725 29,503 71,274 162,842 51,271 60,396 73,984 Other costs 4,863,347 3,424,511 8,378,796 6,745,711 13,969,207 5,079,312 1,525,411 Less: Inventory, end of year 2,707,752 1,185,112 4,874,346 4,644,829 6,816,291 2,172,777 1,113,290 Salaries and wages 1,129,021 649,298 825,975 2,151,051 2,736,631 1,978,144 542,105 Guaranteed payments to partners 52,876 36,468 47,525 257,278 144,340 95,579 42,009 Rent paid 81,980 174,331 66,420 361,544 426,502 167,384 57,980 Interest paid 480,824 198,723 478,057 312,253 329,718 331,953 93,850 Taxes and licenses 145,676 122,279 151,115 283,892 826,042 128,942 54,872 Bad debts 14,061 8,392 17,534 41,665 31,850 7,983 21,074 Repairs and maintenance 88,090 84,998 63,774 167,599 119,887 63,909 19,353 Depreciation 215,827 248,276 242,228 440,331 356,882 703,102 53,219 Depletion 0 21,543 0 0 0 0 0 Retirement plans, etc. 80,748 35,211 45,370 95,621 47,374 128,004 10,334 Employee benefit programs 201,880 70,200 88,806 331,730 376,161 304,126 37,116 Ordinary loss from other partnerships and fiduciaries * 3,238 * 1,156 * 39,200 5,083 * 487 * 24,219 106 Farm net loss 0 0 0 0 0 0 0 Net loss, noncapital assets 40,186 * 2,098 1,775 15,922 16,173 * 799 * 1,484 Other deductions 1,803,664 1,036,351 1,349,740 2,863,755 3,970,828 3,461,681 892,558 Ordinary business income (loss) 999,138 240,564 1,029,576 1,955,593 1,588,214 -959,932 493,070 Net income 1,473,172 632,123 1,847,692 2,842,474 3,163,935 1,306,507 789,911 Loss 474,035 391,560 818,116 886,882 1,575,720 2,266,438 296,841 Portfolio income (loss) distributed directly to partners 235,003 285,910 67,477 380,754 1,049,342 39,350 72,946 Interest income 80,943 2,874 83,287 313,061 451,979 17,355 8,264 Dividend income 61,460 * 9,658 108,355 52,124 309,042 36,538 79,464 Royalties * 35,335 * 921 * 3,127 * 10,960 * 244,009 * 34,969 3,376 Net short-term capital gain (loss) * -113 0 60 * 7 * -5 * 7,423 -80 Net long-term capital gain (loss) * 57,377 * 272,457 * -127,352 * 4,602 * 44,317 * -56,934 * -18,079 Net rental real estate income (loss) * 3,892 * 1,265 * 2,905 -1,542 982 * 314 * 2,734 Net income * 3,892 * 1,285 * 2,905 * 2,281 982 * 723 * 2,734 Loss 0 * 20 0 * 3,823 0 409 0 Other net rental income (loss) * 169 815 * 16,292 * 1,189 * 402,197 110 2 Net income * 169 815 * 16,413 * 1,189 * 402,197 110 2 Loss 0 0 121 0 0 0 0 Total net income (loss) [1] 1,180,937 256,097 1,243,542 2,331,384 2,996,423 -870,645 586,909 Net income 1,572,783 645,481 2,005,007 3,188,889 4,065,553 1,345,500 882,384 Loss 391,846 389,383 761,465 857,505 1,069,130 2,216,146 295,474 Footnotes at end of table.
Computerand electrical
productmanufacturing
Plastics andrubber
productsmanufacturing
Nonmetallic mineralproducts
manufacturing
Primarymetal
manufacturing
Fabricatedmetal
productsmanufacturing
Machinerymanufacturing
Electricalequipment,
appliance andcomponent
manufacturing
Item
Table 1. All Partnerships: Total Assets, Trade or Business Income and Deductions, Portfolio Income, Rental Income, and Total Net Income, by Selected Industrial Group, Tax Year 2014—Continued
Manufacturing—continued
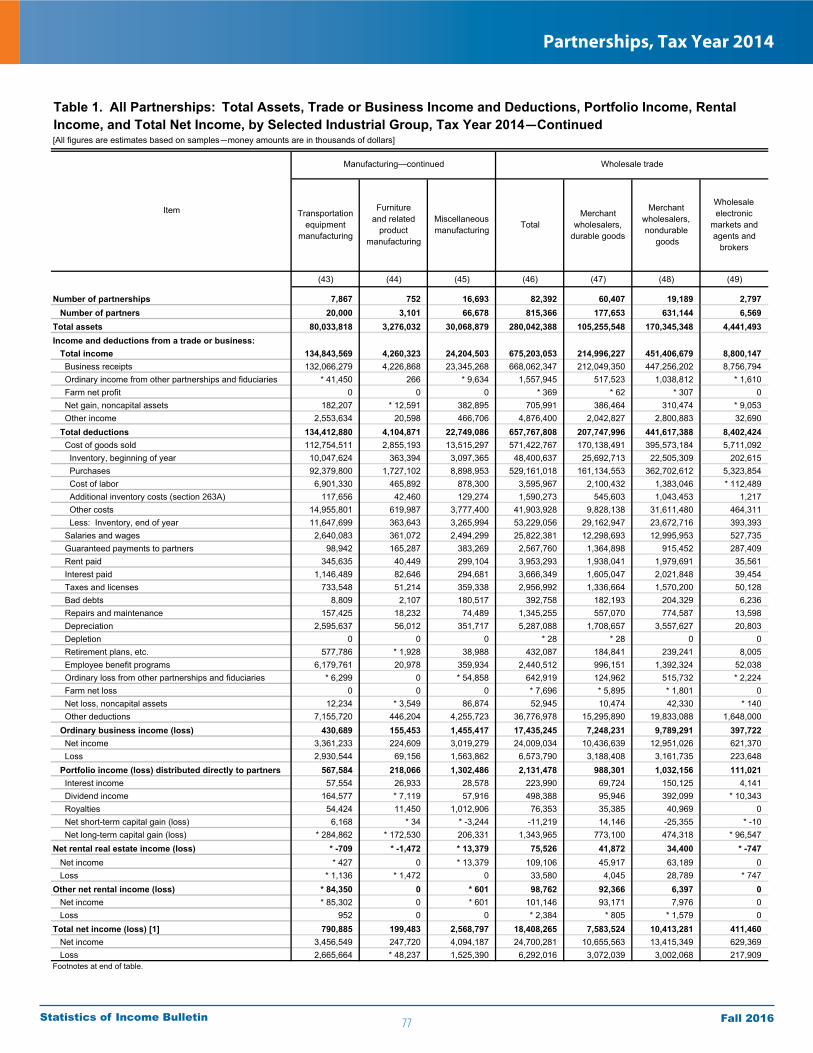
77
Partnerships, Tax Year 2014
Fall 2016Statistics of Income Bulletin
[All figures are estimates based on samples—money amounts are in thousands of dollars]
(43) (44) (45) (46) (47) (48) (49)
Number of partnerships 7,867 752 16,693 82,392 60,407 19,189 2,797 Number of partners 20,000 3,101 66,678 815,366 177,653 631,144 6,569 Total assets 80,033,818 3,276,032 30,068,879 280,042,388 105,255,548 170,345,348 4,441,493 Income and deductions from a trade or business: Total income 134,843,569 4,260,323 24,204,503 675,203,053 214,996,227 451,406,679 8,800,147 Business receipts 132,066,279 4,226,868 23,345,268 668,062,347 212,049,350 447,256,202 8,756,794 Ordinary income from other partnerships and fiduciaries * 41,450 266 * 9,634 1,557,945 517,523 1,038,812 * 1,610 Farm net profit 0 0 0 * 369 * 62 * 307 0 Net gain, noncapital assets 182,207 * 12,591 382,895 705,991 386,464 310,474 * 9,053 Other income 2,553,634 20,598 466,706 4,876,400 2,042,827 2,800,883 32,690 Total deductions 134,412,880 4,104,871 22,749,086 657,767,808 207,747,996 441,617,388 8,402,424 Cost of goods sold 112,754,511 2,855,193 13,515,297 571,422,767 170,138,491 395,573,184 5,711,092 Inventory, beginning of year 10,047,624 363,394 3,097,365 48,400,637 25,692,713 22,505,309 202,615 Purchases 92,379,800 1,727,102 8,898,953 529,161,018 161,134,553 362,702,612 5,323,854 Cost of labor 6,901,330 465,892 878,300 3,595,967 2,100,432 1,383,046 * 112,489 Additional inventory costs (section 263A) 117,656 42,460 129,274 1,590,273 545,603 1,043,453 1,217 Other costs 14,955,801 619,987 3,777,400 41,903,928 9,828,138 31,611,480 464,311 Less: Inventory, end of year 11,647,699 363,643 3,265,994 53,229,056 29,162,947 23,672,716 393,393 Salaries and wages 2,640,083 361,072 2,494,299 25,822,381 12,298,693 12,995,953 527,735 Guaranteed payments to partners 98,942 165,287 383,269 2,567,760 1,364,898 915,452 287,409 Rent paid 345,635 40,449 299,104 3,953,293 1,938,041 1,979,691 35,561 Interest paid 1,146,489 82,646 294,681 3,666,349 1,605,047 2,021,848 39,454 Taxes and licenses 733,548 51,214 359,338 2,956,992 1,336,664 1,570,200 50,128 Bad debts 8,809 2,107 180,517 392,758 182,193 204,329 6,236 Repairs and maintenance 157,425 18,232 74,489 1,345,255 557,070 774,587 13,598 Depreciation 2,595,637 56,012 351,717 5,287,088 1,708,657 3,557,627 20,803 Depletion 0 0 0 * 28 * 28 0 0 Retirement plans, etc. 577,786 * 1,928 38,988 432,087 184,841 239,241 8,005 Employee benefit programs 6,179,761 20,978 359,934 2,440,512 996,151 1,392,324 52,038 Ordinary loss from other partnerships and fiduciaries * 6,299 0 * 54,858 642,919 124,962 515,732 * 2,224 Farm net loss 0 0 0 * 7,696 * 5,895 * 1,801 0 Net loss, noncapital assets 12,234 * 3,549 86,874 52,945 10,474 42,330 * 140 Other deductions 7,155,720 446,204 4,255,723 36,776,978 15,295,890 19,833,088 1,648,000 Ordinary business income (loss) 430,689 155,453 1,455,417 17,435,245 7,248,231 9,789,291 397,722 Net income 3,361,233 224,609 3,019,279 24,009,034 10,436,639 12,951,026 621,370 Loss 2,930,544 69,156 1,563,862 6,573,790 3,188,408 3,161,735 223,648 Portfolio income (loss) distributed directly to partners 567,584 218,066 1,302,486 2,131,478 988,301 1,032,156 111,021 Interest income 57,554 26,933 28,578 223,990 69,724 150,125 4,141 Dividend income 164,577 * 7,119 57,916 498,388 95,946 392,099 * 10,343 Royalties 54,424 11,450 1,012,906 76,353 35,385 40,969 0 Net short-term capital gain (loss) 6,168 * 34 * -3,244 -11,219 14,146 -25,355 * -10 Net long-term capital gain (loss) * 284,862 * 172,530 206,331 1,343,965 773,100 474,318 * 96,547 Net rental real estate income (loss) * -709 * -1,472 * 13,379 75,526 41,872 34,400 * -747 Net income * 427 0 * 13,379 109,106 45,917 63,189 0 Loss * 1,136 * 1,472 0 33,580 4,045 28,789 * 747 Other net rental income (loss) * 84,350 0 * 601 98,762 92,366 6,397 0 Net income * 85,302 0 * 601 101,146 93,171 7,976 0 Loss 952 0 0 * 2,384 * 805 * 1,579 0 Total net income (loss) [1] 790,885 199,483 2,568,797 18,408,265 7,583,524 10,413,281 411,460 Net income 3,456,549 247,720 4,094,187 24,700,281 10,655,563 13,415,349 629,369 Loss 2,665,664 * 48,237 1,525,390 6,292,016 3,072,039 3,002,068 217,909 Footnotes at end of table.
Total
Furnitureand related
productmanufacturing
Transportationequipment
manufacturing
Wholesale trade
ItemMiscellaneousmanufacturing
Merchantwholesalers,
durable goods
Merchantwholesalers,nondurable
goods
Wholesaleelectronic
markets andagents and
brokers
Table 1. All Partnerships: Total Assets, Trade or Business Income and Deductions, Portfolio Income, Rental Income, and Total Net Income, by Selected Industrial Group, Tax Year 2014—Continued
Manufacturing—continued
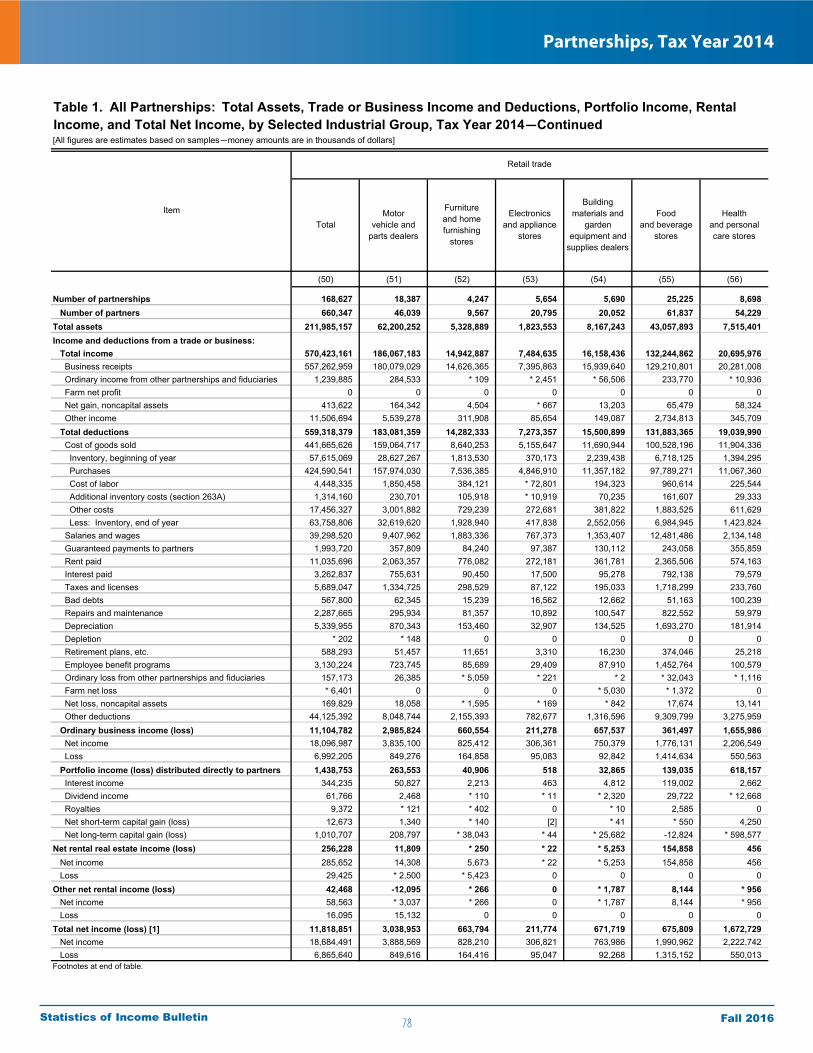
78
Partnerships, Tax Year 2014
Fall 2016Statistics of Income Bulletin
[All figures are estimates based on samples—money amounts are in thousands of dollars]
(50) (51) (52) (53) (54) (55) (56)
Number of partnerships 168,627 18,387 4,247 5,654 5,690 25,225 8,698 Number of partners 660,347 46,039 9,567 20,795 20,052 61,837 54,229 Total assets 211,985,157 62,200,252 5,328,889 1,823,553 8,167,243 43,057,893 7,515,401 Income and deductions from a trade or business: Total income 570,423,161 186,067,183 14,942,887 7,484,635 16,158,436 132,244,862 20,695,976 Business receipts 557,262,959 180,079,029 14,626,365 7,395,863 15,939,640 129,210,801 20,281,008 Ordinary income from other partnerships and fiduciaries 1,239,885 284,533 * 109 * 2,451 * 56,506 233,770 * 10,936 Farm net profit 0 0 0 0 0 0 0 Net gain, noncapital assets 413,622 164,342 4,504 * 667 13,203 65,479 58,324 Other income 11,506,694 5,539,278 311,908 85,654 149,087 2,734,813 345,709 Total deductions 559,318,379 183,081,359 14,282,333 7,273,357 15,500,899 131,883,365 19,039,990 Cost of goods sold 441,665,626 159,064,717 8,640,253 5,155,647 11,690,944 100,528,196 11,904,336 Inventory, beginning of year 57,615,069 28,627,267 1,813,530 370,173 2,239,438 6,718,125 1,394,295 Purchases 424,590,541 157,974,030 7,536,385 4,846,910 11,357,182 97,789,271 11,067,360 Cost of labor 4,448,335 1,850,458 384,121 * 72,801 194,323 960,614 225,544 Additional inventory costs (section 263A) 1,314,160 230,701 105,918 * 10,919 70,235 161,607 29,333 Other costs 17,456,327 3,001,882 729,239 272,681 381,822 1,883,525 611,629 Less: Inventory, end of year 63,758,806 32,619,620 1,928,940 417,838 2,552,056 6,984,945 1,423,824 Salaries and wages 39,298,520 9,407,962 1,883,336 767,373 1,353,407 12,481,486 2,134,148 Guaranteed payments to partners 1,993,720 357,809 84,240 97,387 130,112 243,058 355,859 Rent paid 11,035,696 2,063,357 776,082 272,181 361,781 2,365,506 574,163 Interest paid 3,262,837 755,631 90,450 17,500 95,278 792,138 79,579 Taxes and licenses 5,689,047 1,334,725 298,529 87,122 195,033 1,718,299 233,760 Bad debts 567,800 62,345 15,239 16,562 12,662 51,163 100,239 Repairs and maintenance 2,287,665 295,934 81,357 10,892 100,547 822,552 59,979 Depreciation 5,339,955 870,343 153,460 32,907 134,525 1,693,270 181,914 Depletion * 202 * 148 0 0 0 0 0 Retirement plans, etc. 588,293 51,457 11,651 3,310 16,230 374,046 25,218 Employee benefit programs 3,130,224 723,745 85,689 29,409 87,910 1,452,764 100,579 Ordinary loss from other partnerships and fiduciaries 157,173 26,385 * 5,059 * 221 * 2 * 32,043 * 1,116 Farm net loss * 6,401 0 0 0 * 5,030 * 1,372 0 Net loss, noncapital assets 169,829 18,058 * 1,595 * 169 * 842 17,674 13,141 Other deductions 44,125,392 8,048,744 2,155,393 782,677 1,316,596 9,309,799 3,275,959 Ordinary business income (loss) 11,104,782 2,985,824 660,554 211,278 657,537 361,497 1,655,986 Net income 18,096,987 3,835,100 825,412 306,361 750,379 1,776,131 2,206,549 Loss 6,992,205 849,276 164,858 95,083 92,842 1,414,634 550,563 Portfolio income (loss) distributed directly to partners 1,438,753 263,553 40,906 518 32,865 139,035 618,157 Interest income 344,235 50,827 2,213 463 4,812 119,002 2,662 Dividend income 61,766 2,468 * 110 * 11 * 2,320 29,722 * 12,668 Royalties 9,372 * 121 * 402 0 * 10 2,585 0 Net short-term capital gain (loss) 12,673 1,340 * 140 [2] * 41 * 550 4,250 Net long-term capital gain (loss) 1,010,707 208,797 * 38,043 * 44 * 25,682 -12,824 * 598,577 Net rental real estate income (loss) 256,228 11,809 * 250 * 22 * 5,253 154,858 456 Net income 285,652 14,308 5,673 * 22 * 5,253 154,858 456 Loss 29,425 * 2,500 * 5,423 0 0 0 0 Other net rental income (loss) 42,468 -12,095 * 266 0 * 1,787 8,144 * 956 Net income 58,563 * 3,037 * 266 0 * 1,787 8,144 * 956 Loss 16,095 15,132 0 0 0 0 0 Total net income (loss) [1] 11,818,851 3,038,953 663,794 211,774 671,719 675,809 1,672,729 Net income 18,684,491 3,888,569 828,210 306,821 763,986 1,990,962 2,222,742 Loss 6,865,640 849,616 164,416 95,047 92,268 1,315,152 550,013 Footnotes at end of table.
Buildingmaterials and
gardenequipment and
supplies dealers
Foodand beverage
stores
Healthand personalcare stores
Item Furnitureand homefurnishing
stores
Electronicsand appliance
storesTotal
Motorvehicle and
parts dealers
Table 1. All Partnerships: Total Assets, Trade or Business Income and Deductions, Portfolio Income, Rental Income, and Total Net Income, by Selected Industrial Group, Tax Year 2014—Continued
Retail trade
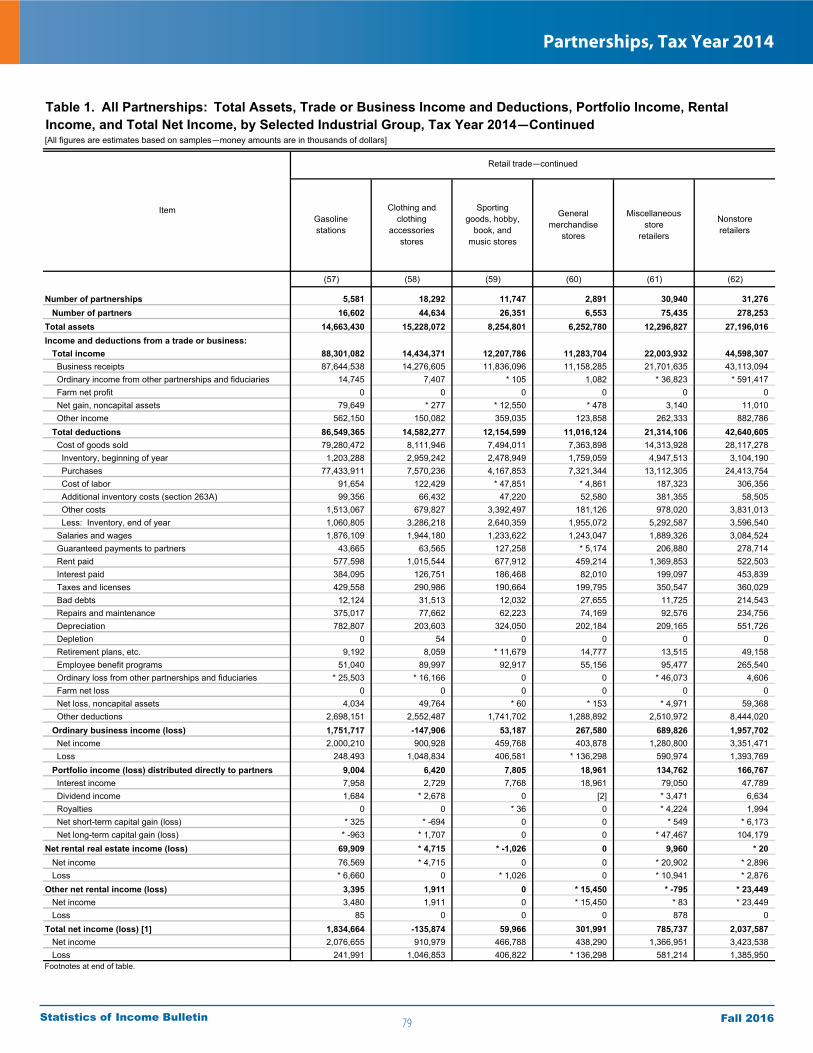
79
Partnerships, Tax Year 2014
Fall 2016Statistics of Income Bulletin
[All figures are estimates based on samples—money amounts are in thousands of dollars]
(57) (58) (59) (60) (61) (62)
Number of partnerships 5,581 18,292 11,747 2,891 30,940 31,276 Number of partners 16,602 44,634 26,351 6,553 75,435 278,253 Total assets 14,663,430 15,228,072 8,254,801 6,252,780 12,296,827 27,196,016 Income and deductions from a trade or business: Total income 88,301,082 14,434,371 12,207,786 11,283,704 22,003,932 44,598,307 Business receipts 87,644,538 14,276,605 11,836,096 11,158,285 21,701,635 43,113,094 Ordinary income from other partnerships and fiduciaries 14,745 7,407 * 105 1,082 * 36,823 * 591,417 Farm net profit 0 0 0 0 0 0 Net gain, noncapital assets 79,649 * 277 * 12,550 * 478 3,140 11,010 Other income 562,150 150,082 359,035 123,858 262,333 882,786 Total deductions 86,549,365 14,582,277 12,154,599 11,016,124 21,314,106 42,640,605 Cost of goods sold 79,280,472 8,111,946 7,494,011 7,363,898 14,313,928 28,117,278 Inventory, beginning of year 1,203,288 2,959,242 2,478,949 1,759,059 4,947,513 3,104,190 Purchases 77,433,911 7,570,236 4,167,853 7,321,344 13,112,305 24,413,754 Cost of labor 91,654 122,429 * 47,851 * 4,861 187,323 306,356 Additional inventory costs (section 263A) 99,356 66,432 47,220 52,580 381,355 58,505 Other costs 1,513,067 679,827 3,392,497 181,126 978,020 3,831,013 Less: Inventory, end of year 1,060,805 3,286,218 2,640,359 1,955,072 5,292,587 3,596,540 Salaries and wages 1,876,109 1,944,180 1,233,622 1,243,047 1,889,326 3,084,524 Guaranteed payments to partners 43,665 63,565 127,258 * 5,174 206,880 278,714 Rent paid 577,598 1,015,544 677,912 459,214 1,369,853 522,503 Interest paid 384,095 126,751 186,468 82,010 199,097 453,839 Taxes and licenses 429,558 290,986 190,664 199,795 350,547 360,029 Bad debts 12,124 31,513 12,032 27,655 11,725 214,543 Repairs and maintenance 375,017 77,662 62,223 74,169 92,576 234,756 Depreciation 782,807 203,603 324,050 202,184 209,165 551,726 Depletion 0 54 0 0 0 0 Retirement plans, etc. 9,192 8,059 * 11,679 14,777 13,515 49,158 Employee benefit programs 51,040 89,997 92,917 55,156 95,477 265,540 Ordinary loss from other partnerships and fiduciaries * 25,503 * 16,166 0 0 * 46,073 4,606 Farm net loss 0 0 0 0 0 0 Net loss, noncapital assets 4,034 49,764 * 60 * 153 * 4,971 59,368 Other deductions 2,698,151 2,552,487 1,741,702 1,288,892 2,510,972 8,444,020 Ordinary business income (loss) 1,751,717 -147,906 53,187 267,580 689,826 1,957,702 Net income 2,000,210 900,928 459,768 403,878 1,280,800 3,351,471 Loss 248,493 1,048,834 406,581 * 136,298 590,974 1,393,769 Portfolio income (loss) distributed directly to partners 9,004 6,420 7,805 18,961 134,762 166,767 Interest income 7,958 2,729 7,768 18,961 79,050 47,789 Dividend income 1,684 * 2,678 0 [2] * 3,471 6,634 Royalties 0 0 * 36 0 * 4,224 1,994 Net short-term capital gain (loss) * 325 * -694 0 0 * 549 * 6,173 Net long-term capital gain (loss) * -963 * 1,707 0 0 * 47,467 104,179 Net rental real estate income (loss) 69,909 * 4,715 * -1,026 0 9,960 * 20 Net income 76,569 * 4,715 0 0 * 20,902 * 2,896 Loss * 6,660 0 * 1,026 0 * 10,941 * 2,876 Other net rental income (loss) 3,395 1,911 0 * 15,450 * -795 * 23,449 Net income 3,480 1,911 0 * 15,450 * 83 * 23,449 Loss 85 0 0 0 878 0 Total net income (loss) [1] 1,834,664 -135,874 59,966 301,991 785,737 2,037,587 Net income 2,076,655 910,979 466,788 438,290 1,366,951 3,423,538 Loss 241,991 1,046,853 406,822 * 136,298 581,214 1,385,950 Footnotes at end of table.
Gasolinestations
Clothing andclothing
accessoriesstores
Sportinggoods, hobby,
book, andmusic stores
Generalmerchandise
stores
Miscellaneousstore
retailers
Nonstoreretailers
Item
Table 1. All Partnerships: Total Assets, Trade or Business Income and Deductions, Portfolio Income, Rental Income, and Total Net Income, by Selected Industrial Group, Tax Year 2014—Continued
Retail trade—continued
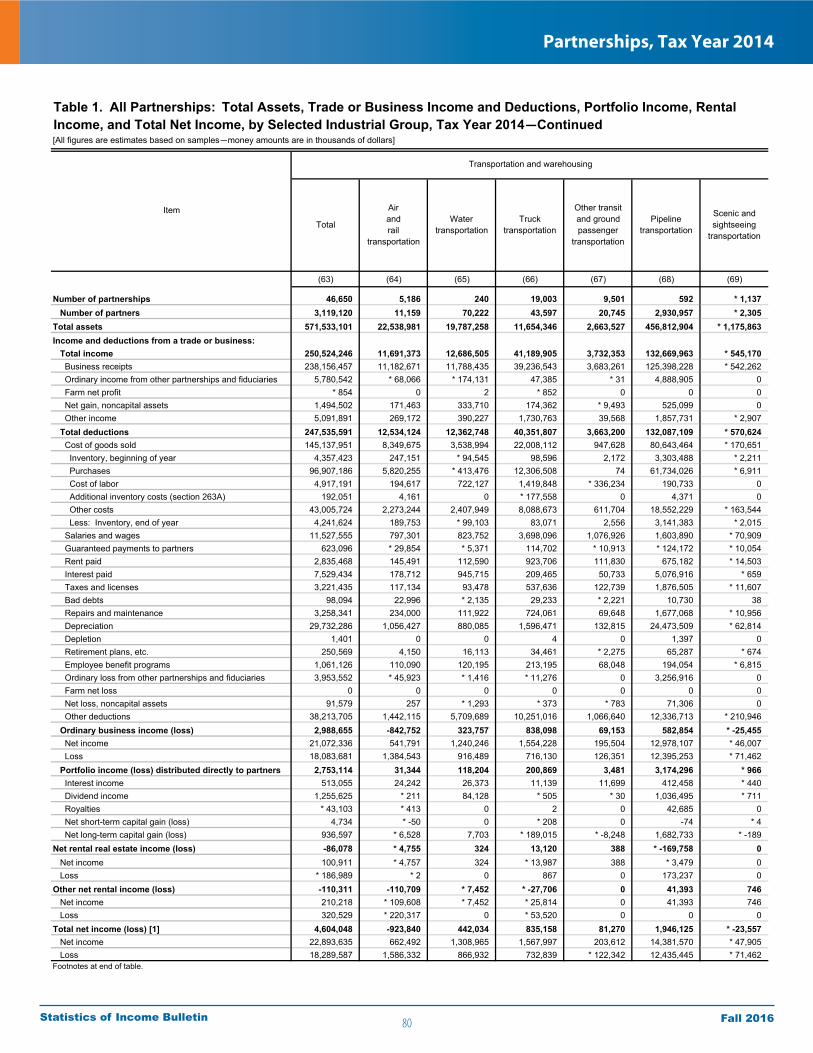
80
Partnerships, Tax Year 2014
Fall 2016Statistics of Income Bulletin
[All figures are estimates based on samples—money amounts are in thousands of dollars]
(63) (64) (65) (66) (67) (68) (69)
Number of partnerships 46,650 5,186 240 19,003 9,501 592 * 1,137 Number of partners 3,119,120 11,159 70,222 43,597 20,745 2,930,957 * 2,305 Total assets 571,533,101 22,538,981 19,787,258 11,654,346 2,663,527 456,812,904 * 1,175,863 Income and deductions from a trade or business: Total income 250,524,246 11,691,373 12,686,505 41,189,905 3,732,353 132,669,963 * 545,170 Business receipts 238,156,457 11,182,671 11,788,435 39,236,543 3,683,261 125,398,228 * 542,262 Ordinary income from other partnerships and fiduciaries 5,780,542 * 68,066 * 174,131 47,385 * 31 4,888,905 0 Farm net profit * 854 0 2 * 852 0 0 0 Net gain, noncapital assets 1,494,502 171,463 333,710 174,362 * 9,493 525,099 0 Other income 5,091,891 269,172 390,227 1,730,763 39,568 1,857,731 * 2,907 Total deductions 247,535,591 12,534,124 12,362,748 40,351,807 3,663,200 132,087,109 * 570,624 Cost of goods sold 145,137,951 8,349,675 3,538,994 22,008,112 947,628 80,643,464 * 170,651 Inventory, beginning of year 4,357,423 247,151 * 94,545 98,596 2,172 3,303,488 * 2,211 Purchases 96,907,186 5,820,255 * 413,476 12,306,508 74 61,734,026 * 6,911 Cost of labor 4,917,191 194,617 722,127 1,419,848 * 336,234 190,733 0 Additional inventory costs (section 263A) 192,051 4,161 0 * 177,558 0 4,371 0 Other costs 43,005,724 2,273,244 2,407,949 8,088,673 611,704 18,552,229 * 163,544 Less: Inventory, end of year 4,241,624 189,753 * 99,103 83,071 2,556 3,141,383 * 2,015 Salaries and wages 11,527,555 797,301 823,752 3,698,096 1,076,926 1,603,890 * 70,909 Guaranteed payments to partners 623,096 * 29,854 * 5,371 114,702 * 10,913 * 124,172 * 10,054 Rent paid 2,835,468 145,491 112,590 923,706 111,830 675,182 * 14,503 Interest paid 7,529,434 178,712 945,715 209,465 50,733 5,076,916 * 659 Taxes and licenses 3,221,435 117,134 93,478 537,636 122,739 1,876,505 * 11,607 Bad debts 98,094 22,996 * 2,135 29,233 * 2,221 10,730 38 Repairs and maintenance 3,258,341 234,000 111,922 724,061 69,648 1,677,068 * 10,956 Depreciation 29,732,286 1,056,427 880,085 1,596,471 132,815 24,473,509 * 62,814 Depletion 1,401 0 0 4 0 1,397 0 Retirement plans, etc. 250,569 4,150 16,113 34,461 * 2,275 65,287 * 674 Employee benefit programs 1,061,126 110,090 120,195 213,195 68,048 194,054 * 6,815 Ordinary loss from other partnerships and fiduciaries 3,953,552 * 45,923 * 1,416 * 11,276 0 3,256,916 0 Farm net loss 0 0 0 0 0 0 0 Net loss, noncapital assets 91,579 257 * 1,293 * 373 * 783 71,306 0 Other deductions 38,213,705 1,442,115 5,709,689 10,251,016 1,066,640 12,336,713 * 210,946 Ordinary business income (loss) 2,988,655 -842,752 323,757 838,098 69,153 582,854 * -25,455 Net income 21,072,336 541,791 1,240,246 1,554,228 195,504 12,978,107 * 46,007 Loss 18,083,681 1,384,543 916,489 716,130 126,351 12,395,253 * 71,462 Portfolio income (loss) distributed directly to partners 2,753,114 31,344 118,204 200,869 3,481 3,174,296 * 966 Interest income 513,055 24,242 26,373 11,139 11,699 412,458 * 440 Dividend income 1,255,625 * 211 84,128 * 505 * 30 1,036,495 * 711 Royalties * 43,103 * 413 0 2 0 42,685 0 Net short-term capital gain (loss) 4,734 * -50 0 * 208 0 -74 * 4 Net long-term capital gain (loss) 936,597 * 6,528 7,703 * 189,015 * -8,248 1,682,733 * -189 Net rental real estate income (loss) -86,078 * 4,755 324 13,120 388 * -169,758 0 Net income 100,911 * 4,757 324 * 13,987 388 * 3,479 0 Loss * 186,989 * 2 0 867 0 173,237 0 Other net rental income (loss) -110,311 -110,709 * 7,452 * -27,706 0 41,393 746 Net income 210,218 * 109,608 * 7,452 * 25,814 0 41,393 746 Loss 320,529 * 220,317 0 * 53,520 0 0 0 Total net income (loss) [1] 4,604,048 -923,840 442,034 835,158 81,270 1,946,125 * -23,557 Net income 22,893,635 662,492 1,308,965 1,567,997 203,612 14,381,570 * 47,905 Loss 18,289,587 1,586,332 866,932 732,839 * 122,342 12,435,445 * 71,462 Footnotes at end of table.
Trucktransportation
Other transitand groundpassenger
transportation
Pipelinetransportation
Scenic andsightseeing
transportationTotal
Airandrail
transportation
Watertransportation
Item
Transportation and warehousing
Table 1. All Partnerships: Total Assets, Trade or Business Income and Deductions, Portfolio Income, Rental Income, and Total Net Income, by Selected Industrial Group, Tax Year 2014—Continued
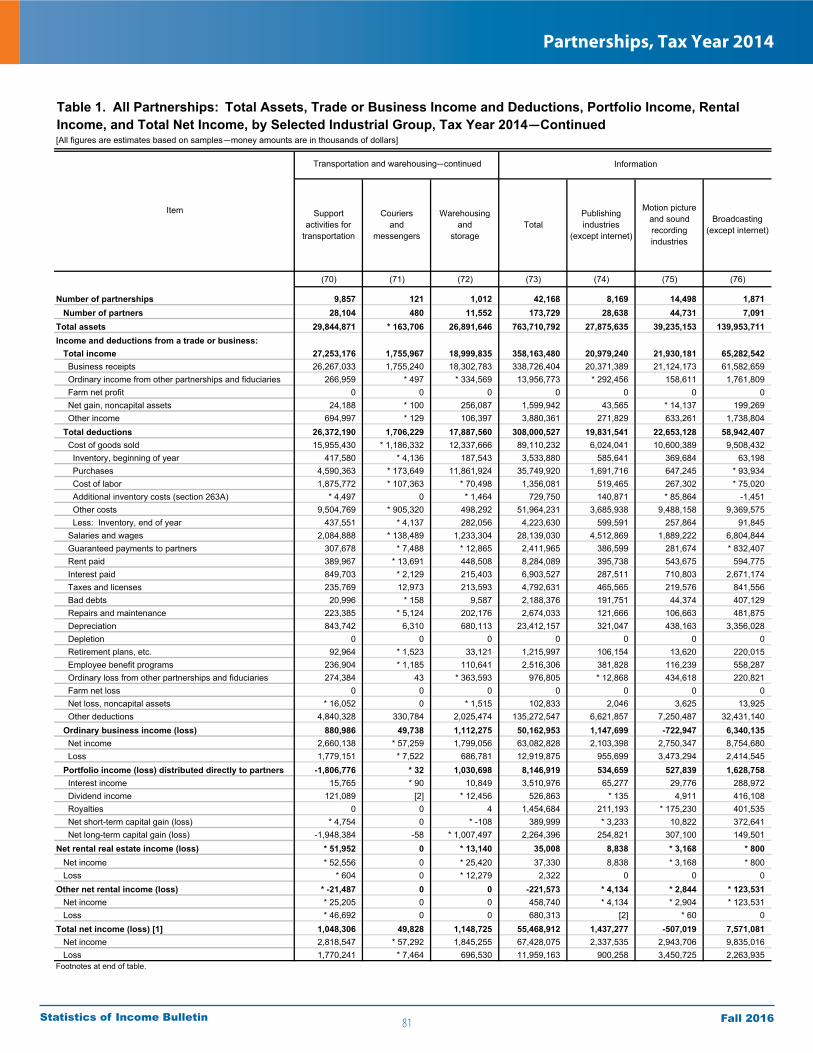
81
Partnerships, Tax Year 2014
Fall 2016Statistics of Income Bulletin
[All figures are estimates based on samples—money amounts are in thousands of dollars]
(70) (71) (72) (73) (74) (75) (76)
Number of partnerships 9,857 121 1,012 42,168 8,169 14,498 1,871 Number of partners 28,104 480 11,552 173,729 28,638 44,731 7,091 Total assets 29,844,871 * 163,706 26,891,646 763,710,792 27,875,635 39,235,153 139,953,711 Income and deductions from a trade or business: Total income 27,253,176 1,755,967 18,999,835 358,163,480 20,979,240 21,930,181 65,282,542 Business receipts 26,267,033 1,755,240 18,302,783 338,726,404 20,371,389 21,124,173 61,582,659 Ordinary income from other partnerships and fiduciaries 266,959 * 497 * 334,569 13,956,773 * 292,456 158,611 1,761,809 Farm net profit 0 0 0 0 0 0 0 Net gain, noncapital assets 24,188 * 100 256,087 1,599,942 43,565 * 14,137 199,269 Other income 694,997 * 129 106,397 3,880,361 271,829 633,261 1,738,804 Total deductions 26,372,190 1,706,229 17,887,560 308,000,527 19,831,541 22,653,128 58,942,407 Cost of goods sold 15,955,430 * 1,186,332 12,337,666 89,110,232 6,024,041 10,600,389 9,508,432 Inventory, beginning of year 417,580 * 4,136 187,543 3,533,880 585,641 369,684 63,198 Purchases 4,590,363 * 173,649 11,861,924 35,749,920 1,691,716 647,245 * 93,934 Cost of labor 1,875,772 * 107,363 * 70,498 1,356,081 519,465 267,302 * 75,020 Additional inventory costs (section 263A) * 4,497 0 * 1,464 729,750 140,871 * 85,864 -1,451 Other costs 9,504,769 * 905,320 498,292 51,964,231 3,685,938 9,488,158 9,369,575 Less: Inventory, end of year 437,551 * 4,137 282,056 4,223,630 599,591 257,864 91,845 Salaries and wages 2,084,888 * 138,489 1,233,304 28,139,030 4,512,869 1,889,222 6,804,844 Guaranteed payments to partners 307,678 * 7,488 * 12,865 2,411,965 386,599 281,674 * 832,407 Rent paid 389,967 * 13,691 448,508 8,284,089 395,738 543,675 594,775 Interest paid 849,703 * 2,129 215,403 6,903,527 287,511 710,803 2,671,174 Taxes and licenses 235,769 12,973 213,593 4,792,631 465,565 219,576 841,556 Bad debts 20,996 * 158 9,587 2,188,376 191,751 44,374 407,129 Repairs and maintenance 223,385 * 5,124 202,176 2,674,033 121,666 106,663 481,875 Depreciation 843,742 6,310 680,113 23,412,157 321,047 438,163 3,356,028 Depletion 0 0 0 0 0 0 0 Retirement plans, etc. 92,964 * 1,523 33,121 1,215,997 106,154 13,620 220,015 Employee benefit programs 236,904 * 1,185 110,641 2,516,306 381,828 116,239 558,287 Ordinary loss from other partnerships and fiduciaries 274,384 43 * 363,593 976,805 * 12,868 434,618 220,821 Farm net loss 0 0 0 0 0 0 0 Net loss, noncapital assets * 16,052 0 * 1,515 102,833 2,046 3,625 13,925 Other deductions 4,840,328 330,784 2,025,474 135,272,547 6,621,857 7,250,487 32,431,140 Ordinary business income (loss) 880,986 49,738 1,112,275 50,162,953 1,147,699 -722,947 6,340,135 Net income 2,660,138 * 57,259 1,799,056 63,082,828 2,103,398 2,750,347 8,754,680 Loss 1,779,151 * 7,522 686,781 12,919,875 955,699 3,473,294 2,414,545 Portfolio income (loss) distributed directly to partners -1,806,776 * 32 1,030,698 8,146,919 534,659 527,839 1,628,758 Interest income 15,765 * 90 10,849 3,510,976 65,277 29,776 288,972 Dividend income 121,089 [2] * 12,456 526,863 * 135 4,911 416,108 Royalties 0 0 4 1,454,684 211,193 * 175,230 401,535 Net short-term capital gain (loss) * 4,754 0 * -108 389,999 * 3,233 10,822 372,641 Net long-term capital gain (loss) -1,948,384 -58 * 1,007,497 2,264,396 254,821 307,100 149,501 Net rental real estate income (loss) * 51,952 0 * 13,140 35,008 8,838 * 3,168 * 800 Net income * 52,556 0 * 25,420 37,330 8,838 * 3,168 * 800 Loss * 604 0 * 12,279 2,322 0 0 0 Other net rental income (loss) * -21,487 0 0 -221,573 * 4,134 * 2,844 * 123,531 Net income * 25,205 0 0 458,740 * 4,134 * 2,904 * 123,531 Loss * 46,692 0 0 680,313 [2] * 60 0 Total net income (loss) [1] 1,048,306 49,828 1,148,725 55,468,912 1,437,277 -507,019 7,571,081 Net income 2,818,547 * 57,292 1,845,255 67,428,075 2,337,535 2,943,706 9,835,016 Loss 1,770,241 * 7,464 696,530 11,959,163 900,258 3,450,725 2,263,935 Footnotes at end of table.
Supportactivities for
transportation
Couriersand
messengers
Warehousingand
storageTotal
Publishingindustries
(except internet)
Motion pictureand soundrecordingindustries
Broadcasting(except internet)
Item
Transportation and warehousing—continued Information
Table 1. All Partnerships: Total Assets, Trade or Business Income and Deductions, Portfolio Income, Rental Income, and Total Net Income, by Selected Industrial Group, Tax Year 2014—Continued
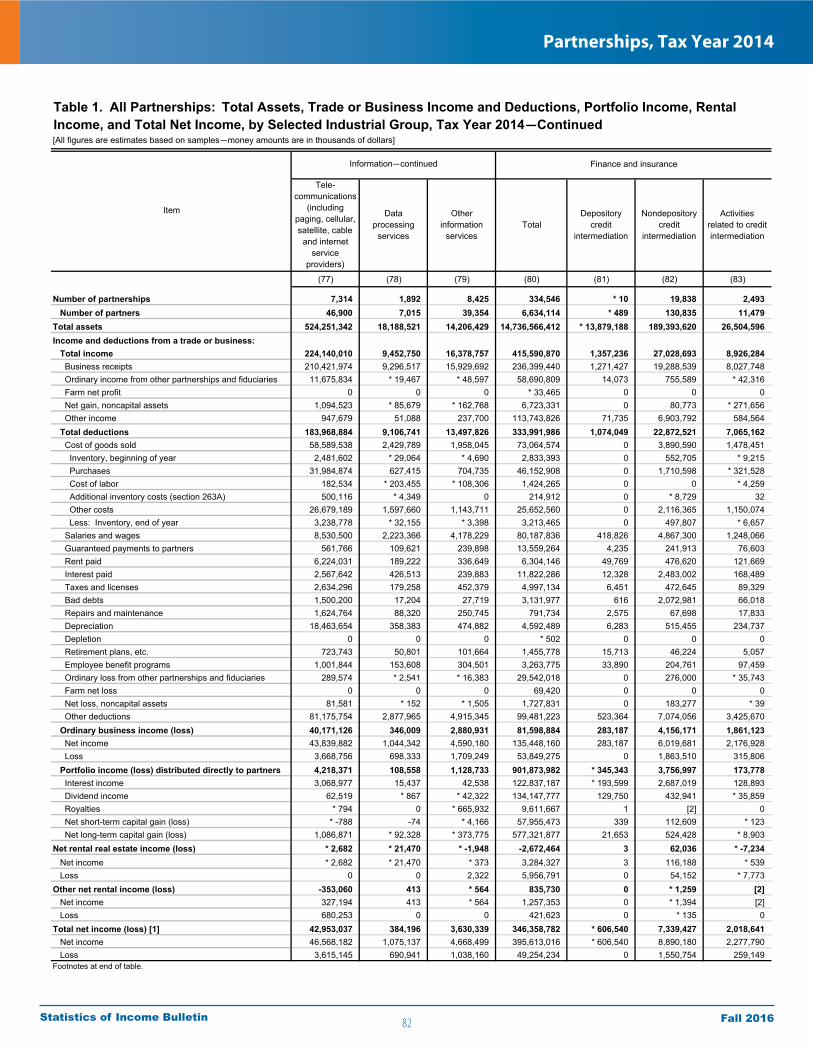
82
Partnerships, Tax Year 2014
Fall 2016Statistics of Income Bulletin
[All figures are estimates based on samples—money amounts are in thousands of dollars]
(77) (78) (79) (80) (81) (82) (83)
Number of partnerships 7,314 1,892 8,425 334,546 * 10 19,838 2,493 Number of partners 46,900 7,015 39,354 6,634,114 * 489 130,835 11,479 Total assets 524,251,342 18,188,521 14,206,429 14,736,566,412 * 13,879,188 189,393,620 26,504,596 Income and deductions from a trade or business: Total income 224,140,010 9,452,750 16,378,757 415,590,870 1,357,236 27,028,693 8,926,284 Business receipts 210,421,974 9,296,517 15,929,692 236,399,440 1,271,427 19,288,539 8,027,748 Ordinary income from other partnerships and fiduciaries 11,675,834 * 19,467 * 48,597 58,690,809 14,073 755,589 * 42,316 Farm net profit 0 0 0 * 33,465 0 0 0 Net gain, noncapital assets 1,094,523 * 85,679 * 162,768 6,723,331 0 80,773 * 271,656 Other income 947,679 51,088 237,700 113,743,826 71,735 6,903,792 584,564 Total deductions 183,968,884 9,106,741 13,497,826 333,991,986 1,074,049 22,872,521 7,065,162 Cost of goods sold 58,589,538 2,429,789 1,958,045 73,064,574 0 3,890,590 1,478,451 Inventory, beginning of year 2,481,602 * 29,064 * 4,690 2,833,393 0 552,705 * 9,215 Purchases 31,984,874 627,415 704,735 46,152,908 0 1,710,598 * 321,528 Cost of labor 182,534 * 203,455 * 108,306 1,424,265 0 0 * 4,259 Additional inventory costs (section 263A) 500,116 * 4,349 0 214,912 0 * 8,729 32 Other costs 26,679,189 1,597,660 1,143,711 25,652,560 0 2,116,365 1,150,074 Less: Inventory, end of year 3,238,778 * 32,155 * 3,398 3,213,465 0 497,807 * 6,657 Salaries and wages 8,530,500 2,223,366 4,178,229 80,187,836 418,826 4,867,300 1,248,066 Guaranteed payments to partners 561,766 109,621 239,898 13,559,264 4,235 241,913 76,603 Rent paid 6,224,031 189,222 336,649 6,304,146 49,769 476,620 121,669 Interest paid 2,567,642 426,513 239,883 11,822,286 12,328 2,483,002 168,489 Taxes and licenses 2,634,296 179,258 452,379 4,997,134 6,451 472,645 89,329 Bad debts 1,500,200 17,204 27,719 3,131,977 616 2,072,981 66,018 Repairs and maintenance 1,624,764 88,320 250,745 791,734 2,575 67,698 17,833 Depreciation 18,463,654 358,383 474,882 4,592,489 6,283 515,455 234,737 Depletion 0 0 0 * 502 0 0 0 Retirement plans, etc. 723,743 50,801 101,664 1,455,778 15,713 46,224 5,057 Employee benefit programs 1,001,844 153,608 304,501 3,263,775 33,890 204,761 97,459 Ordinary loss from other partnerships and fiduciaries 289,574 * 2,541 * 16,383 29,542,018 0 276,000 * 35,743 Farm net loss 0 0 0 69,420 0 0 0 Net loss, noncapital assets 81,581 * 152 * 1,505 1,727,831 0 183,277 * 39 Other deductions 81,175,754 2,877,965 4,915,345 99,481,223 523,364 7,074,056 3,425,670 Ordinary business income (loss) 40,171,126 346,009 2,880,931 81,598,884 283,187 4,156,171 1,861,123 Net income 43,839,882 1,044,342 4,590,180 135,448,160 283,187 6,019,681 2,176,928 Loss 3,668,756 698,333 1,709,249 53,849,275 0 1,863,510 315,806 Portfolio income (loss) distributed directly to partners 4,218,371 108,558 1,128,733 901,873,982 * 345,343 3,756,997 173,778 Interest income 3,068,977 15,437 42,538 122,837,187 * 193,599 2,687,019 128,893 Dividend income 62,519 * 867 * 42,322 134,147,777 129,750 432,941 * 35,859 Royalties * 794 0 * 665,932 9,611,667 1 [2] 0 Net short-term capital gain (loss) * -788 -74 * 4,166 57,955,473 339 112,609 * 123 Net long-term capital gain (loss) 1,086,871 * 92,328 * 373,775 577,321,877 21,653 524,428 * 8,903 Net rental real estate income (loss) * 2,682 * 21,470 * -1,948 -2,672,464 3 62,036 * -7,234 Net income * 2,682 * 21,470 * 373 3,284,327 3 116,188 * 539 Loss 0 0 2,322 5,956,791 0 54,152 * 7,773 Other net rental income (loss) -353,060 413 * 564 835,730 0 * 1,259 [2] Net income 327,194 413 * 564 1,257,353 0 * 1,394 [2] Loss 680,253 0 0 421,623 0 * 135 0 Total net income (loss) [1] 42,953,037 384,196 3,630,339 346,358,782 * 606,540 7,339,427 2,018,641 Net income 46,568,182 1,075,137 4,668,499 395,613,016 * 606,540 8,890,180 2,277,790 Loss 3,615,145 690,941 1,038,160 49,254,234 0 1,550,754 259,149 Footnotes at end of table.
Otherinformation
services
Tele-communications
(includingpaging, cellular, satellite, cable
and internet service
providers)
Dataprocessing
services
Item
TotalDepository
creditintermediation
Nondepositorycredit
intermediation
Activitiesrelated to creditintermediation
Table 1. All Partnerships: Total Assets, Trade or Business Income and Deductions, Portfolio Income, Rental Income, and Total Net Income, by Selected Industrial Group, Tax Year 2014—Continued
Information—continued Finance and insurance

83
Partnerships, Tax Year 2014
Fall 2016Statistics of Income Bulletin
[All figures are estimates based on samples—money amounts are in thousands of dollars]
Real estate
(84) (85) (86) (87) (88) (89) (90)
Number of partnerships 254,206 10,369 243,837 13,564 44,434 1,816,889 1,781,949 Number of partners 5,163,383 375,341 4,788,042 52,396 1,275,532 7,887,184 7,577,856 Total assets 12,779,713,135 565,512,863 12,214,200,272 19,881,866 1,707,194,007 5,636,547,190 5,481,666,674 Income and deductions from a trade or business: Total income 331,507,776 104,678,630 226,829,146 25,805,101 20,965,780 184,766,056 144,558,087 Business receipts 172,438,858 59,560,195 112,878,663 24,441,842 10,931,024 150,321,821 114,662,678 Ordinary income from other partnerships and fiduciaries 53,722,679 1,978,859 51,743,821 65,357 4,090,794 12,748,143 12,362,409 Farm net profit * 33,337 0 * 33,337 0 * 128 187,684 186,101 Net gain, noncapital assets 6,084,104 328,397 5,755,706 21,494 265,304 4,895,853 3,101,593 Other income 99,228,797 42,811,178 56,417,619 1,276,407 5,678,530 16,612,556 14,245,305 Total deductions 261,478,595 98,366,193 163,112,402 22,061,613 19,440,047 169,290,150 134,645,816 Cost of goods sold 54,537,496 43,987,043 10,550,452 7,965,643 5,192,394 68,429,574 57,311,069 Inventory, beginning of year 1,971,753 917,045 1,054,708 * 9,463 290,257 39,212,873 38,019,046 Purchases 39,901,427 35,677,258 4,224,169 781,847 3,437,508 25,181,849 21,866,715 Cost of labor 870,088 * 259,441 610,648 * 362,232 187,685 2,804,650 1,655,637 Additional inventory costs (section 263A) 81,888 62,165 19,723 * 127,252 * -2,989 1,729,289 1,725,317 Other costs 13,978,594 8,152,389 5,826,205 6,696,746 1,710,781 26,440,997 19,719,553 Less: Inventory, end of year 2,266,255 1,081,255 1,185,000 * 11,898 430,848 26,940,083 25,675,199 Salaries and wages 66,840,263 24,020,269 42,819,993 4,195,911 2,617,470 18,873,169 15,445,469 Guaranteed payments to partners 11,385,582 1,567,890 9,817,692 927,314 923,616 2,366,248 2,198,534 Rent paid 4,838,394 1,372,808 3,465,586 506,861 310,833 3,668,710 2,895,249 Interest paid 8,361,641 2,120,351 6,241,290 254,688 542,139 7,151,125 5,603,367 Taxes and licenses 3,923,311 1,331,677 2,591,634 341,466 163,932 3,288,106 2,725,637 Bad debts 683,578 77,512 606,066 35,853 272,932 516,700 381,357 Repairs and maintenance 591,128 151,698 439,430 65,862 46,639 1,415,774 1,058,235 Depreciation 3,280,262 817,283 2,462,979 134,676 421,077 13,411,263 3,297,085 Depletion * 502 0 * 502 0 0 * 685 * 685 Retirement plans, etc. 1,272,542 692,977 579,565 71,900 44,342 160,364 105,184 Employee benefit programs 2,503,083 901,854 1,601,229 330,529 94,054 1,100,875 808,646 Ordinary loss from other partnerships and fiduciaries 25,337,833 918,661 24,419,172 * 7,839 3,884,604 7,451,915 7,127,235 Farm net loss 62,456 * 589 61,867 0 * 6,964 236,437 223,153 Net loss, noncapital assets 1,503,327 6,730 1,496,597 * 375 * 40,814 2,077,299 2,007,020 Other deductions 76,357,198 20,398,851 55,958,347 7,222,698 4,878,237 39,141,904 33,457,890 Ordinary business income (loss) 70,029,182 6,312,437 63,716,745 3,743,488 1,525,733 15,475,907 9,912,270 Net income 115,773,371 11,176,948 104,596,423 4,053,659 7,141,334 43,518,415 33,702,511 Loss 45,744,189 4,864,511 40,879,678 310,170 5,615,600 28,042,509 23,790,240 Portfolio income (loss) distributed directly to partners 772,783,623 6,983,804 765,799,819 622,412 124,191,830 74,927,822 68,104,378 Interest income 103,230,519 2,165,903 101,064,616 57,611 16,539,547 12,875,039 12,067,635 Dividend income 106,489,497 1,478,147 105,011,349 10,211 27,049,520 10,264,088 10,131,084 Royalties 9,052,021 102,510 8,949,511 * 4 559,641 7,129,491 1,927,585 Net short-term capital gain (loss) 50,642,642 -223,806 50,866,448 * 5,349 7,194,411 6,504,769 6,499,674 Net long-term capital gain (loss) 503,368,945 3,461,049 499,907,896 549,238 72,848,711 38,154,436 37,478,400 Net rental real estate income (loss) -2,499,725 31,663 -2,531,388 * 95 -227,638 44,197,972 43,861,476 Net income 2,574,650 60,781 2,513,869 * 416 592,532 131,173,174 130,814,136 Loss 5,074,375 29,118 5,045,257 * 321 820,170 86,975,202 86,952,660 Other net rental income (loss) 699,699 30,709 668,990 * 275 134,495 1,469,301 397,220 Net income 1,117,968 33,850 1,084,118 * 275 137,715 4,288,338 899,706 Loss 418,268 * 3,141 415,128 0 3,220 2,819,037 502,486 Total net income (loss) [1] 287,001,193 10,121,370 276,879,823 3,811,683 45,581,298 91,411,797 78,297,270 Net income 328,666,475 14,497,519 314,168,956 4,091,092 51,080,938 199,693,922 180,845,671 Loss 41,665,282 4,376,149 37,289,133 279,408 5,499,640 108,282,125 102,548,402 Footnotes at end of table.
Total
Securities, commodity contracts and other financial investments and related activities
Item
Total
Securitiesand
commoditycontracts
and exchanges
Otherfinancial
investmentactivities
Insurancecarriers
andrelated
activities
Funds, trusts,and otherfinancial vehicles
Total
Table 1. All Partnerships: Total Assets, Trade or Business Income and Deductions, Portfolio Income, Rental Income, and Total Net Income, by Selected Industrial Group, Tax Year 2014—Continued
Real estate and rental and leasingFinance and insurance—continued
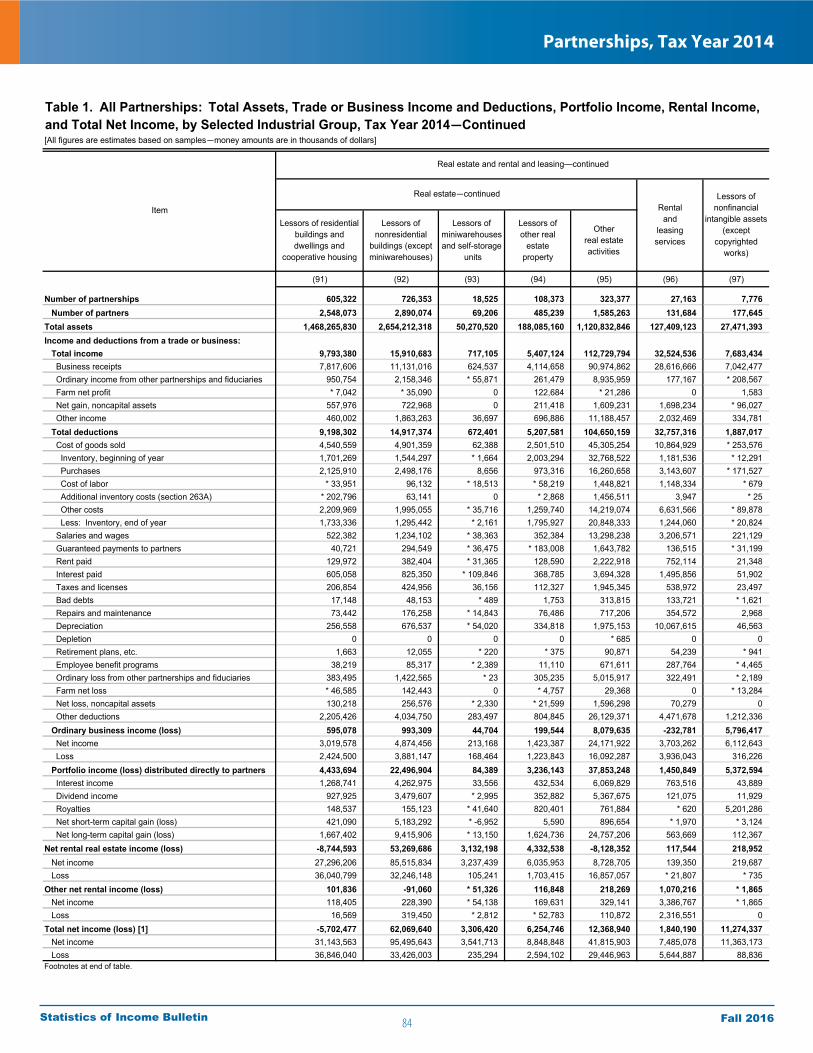
84
Partnerships, Tax Year 2014
Fall 2016Statistics of Income Bulletin
[All figures are estimates based on samples—money amounts are in thousands of dollars]
(91) (92) (93) (94) (95) (96) (97)
Number of partnerships 605,322 726,353 18,525 108,373 323,377 27,163 7,776 Number of partners 2,548,073 2,890,074 69,206 485,239 1,585,263 131,684 177,645 Total assets 1,468,265,830 2,654,212,318 50,270,520 188,085,160 1,120,832,846 127,409,123 27,471,393 Income and deductions from a trade or business: Total income 9,793,380 15,910,683 717,105 5,407,124 112,729,794 32,524,536 7,683,434 Business receipts 7,817,606 11,131,016 624,537 4,114,658 90,974,862 28,616,666 7,042,477 Ordinary income from other partnerships and fiduciaries 950,754 2,158,346 * 55,871 261,479 8,935,959 177,167 * 208,567 Farm net profit * 7,042 * 35,090 0 122,684 * 21,286 0 1,583 Net gain, noncapital assets 557,976 722,968 0 211,418 1,609,231 1,698,234 * 96,027 Other income 460,002 1,863,263 36,697 696,886 11,188,457 2,032,469 334,781 Total deductions 9,198,302 14,917,374 672,401 5,207,581 104,650,159 32,757,316 1,887,017 Cost of goods sold 4,540,559 4,901,359 62,388 2,501,510 45,305,254 10,864,929 * 253,576 Inventory, beginning of year 1,701,269 1,544,297 * 1,664 2,003,294 32,768,522 1,181,536 * 12,291 Purchases 2,125,910 2,498,176 8,656 973,316 16,260,658 3,143,607 * 171,527 Cost of labor * 33,951 96,132 * 18,513 * 58,219 1,448,821 1,148,334 * 679 Additional inventory costs (section 263A) * 202,796 63,141 0 * 2,868 1,456,511 3,947 * 25 Other costs 2,209,969 1,995,055 * 35,716 1,259,740 14,219,074 6,631,566 * 89,878 Less: Inventory, end of year 1,733,336 1,295,442 * 2,161 1,795,927 20,848,333 1,244,060 * 20,824 Salaries and wages 522,382 1,234,102 * 38,363 352,384 13,298,238 3,206,571 221,129 Guaranteed payments to partners 40,721 294,549 * 36,475 * 183,008 1,643,782 136,515 * 31,199 Rent paid 129,972 382,404 * 31,365 128,590 2,222,918 752,114 21,348 Interest paid 605,058 825,350 * 109,846 368,785 3,694,328 1,495,856 51,902 Taxes and licenses 206,854 424,956 36,156 112,327 1,945,345 538,972 23,497 Bad debts 17,148 48,153 * 489 1,753 313,815 133,721 * 1,621 Repairs and maintenance 73,442 176,258 * 14,843 76,486 717,206 354,572 2,968 Depreciation 256,558 676,537 * 54,020 334,818 1,975,153 10,067,615 46,563 Depletion 0 0 0 0 * 685 0 0 Retirement plans, etc. 1,663 12,055 * 220 * 375 90,871 54,239 * 941 Employee benefit programs 38,219 85,317 * 2,389 11,110 671,611 287,764 * 4,465 Ordinary loss from other partnerships and fiduciaries 383,495 1,422,565 * 23 305,235 5,015,917 322,491 * 2,189 Farm net loss * 46,585 142,443 0 * 4,757 29,368 0 * 13,284 Net loss, noncapital assets 130,218 256,576 * 2,330 * 21,599 1,596,298 70,279 0 Other deductions 2,205,426 4,034,750 283,497 804,845 26,129,371 4,471,678 1,212,336 Ordinary business income (loss) 595,078 993,309 44,704 199,544 8,079,635 -232,781 5,796,417 Net income 3,019,578 4,874,456 213,168 1,423,387 24,171,922 3,703,262 6,112,643 Loss 2,424,500 3,881,147 168,464 1,223,843 16,092,287 3,936,043 316,226 Portfolio income (loss) distributed directly to partners 4,433,694 22,496,904 84,389 3,236,143 37,853,248 1,450,849 5,372,594 Interest income 1,268,741 4,262,975 33,556 432,534 6,069,829 763,516 43,889 Dividend income 927,925 3,479,607 * 2,995 352,882 5,367,675 121,075 11,929 Royalties 148,537 155,123 * 41,640 820,401 761,884 * 620 5,201,286 Net short-term capital gain (loss) 421,090 5,183,292 * -6,952 5,590 896,654 * 1,970 * 3,124 Net long-term capital gain (loss) 1,667,402 9,415,906 * 13,150 1,624,736 24,757,206 563,669 112,367 Net rental real estate income (loss) -8,744,593 53,269,686 3,132,198 4,332,538 -8,128,352 117,544 218,952 Net income 27,296,206 85,515,834 3,237,439 6,035,953 8,728,705 139,350 219,687 Loss 36,040,799 32,246,148 105,241 1,703,415 16,857,057 * 21,807 * 735 Other net rental income (loss) 101,836 -91,060 * 51,326 116,848 218,269 1,070,216 * 1,865 Net income 118,405 228,390 * 54,138 169,631 329,141 3,386,767 * 1,865 Loss 16,569 319,450 * 2,812 * 52,783 110,872 2,316,551 0 Total net income (loss) [1] -5,702,477 62,069,640 3,306,420 6,254,746 12,368,940 1,840,190 11,274,337 Net income 31,143,563 95,495,643 3,541,713 8,848,848 41,815,903 7,485,078 11,363,173 Loss 36,846,040 33,426,003 235,294 2,594,102 29,446,963 5,644,887 88,836 Footnotes at end of table.
Rentaland
leasingservices
Lessors of residential buildings and dwellings and
cooperative housing
Lessors ofnonresidential
buildings (except miniwarehouses)
Lessors ofnonfinancial
intangible assets (except
copyrightedworks)
ItemLessors of
miniwarehousesand self-storage
units
Lessors ofother real
estateproperty
Otherreal estateactivities
Table 1. All Partnerships: Total Assets, Trade or Business Income and Deductions, Portfolio Income, Rental Income, and Total Net Income, by Selected Industrial Group, Tax Year 2014—Continued
Real estate and rental and leasing—continued
Real estate—continued

85
Partnerships, Tax Year 2014
Fall 2016Statistics of Income Bulletin
[All figures are estimates based on samples—money amounts are in thousands of dollars]
(98) (99) (100) (101) (102) (103) (104) (105)
Number of partnerships 219,798 27,552 23,570 19,709 14,018 27,820 107,129 60,035 Number of partners 810,461 156,069 86,357 50,854 51,930 117,614 347,638 191,602 Total assets 254,070,855 43,431,071 24,950,824 11,797,430 4,135,948 27,080,394 142,675,189 79,606,471 Income and deductions from a trade or business: Total income 473,961,507 154,597,856 82,286,034 26,074,331 3,690,635 34,769,207 172,543,444 98,069,761 Business receipts 456,769,722 153,211,778 80,722,532 25,478,005 3,604,363 34,230,508 159,522,536 87,833,299 Ordinary income from other partnerships and fiduciaries 5,879,094 330,356 170,201 362,110 0 67,859 4,948,569 4,502,383 Farm net profit 0 0 0 0 0 0 0 0 Net gain, noncapital assets 299,065 18,712 3,204 3,097 * 10,013 40,411 223,628 86,942 Other income 11,013,627 1,037,010 1,390,097 231,120 76,259 430,430 7,848,711 5,647,137 Total deductions 382,747,104 99,487,488 65,965,765 23,439,180 3,567,179 33,901,815 156,385,676 84,316,917 Cost of goods sold 90,337,104 1,729,468 7,272,921 10,967,394 1,413,711 11,727,415 57,226,195 21,692,823 Inventory, beginning of year 2,027,536 * 2,705 * 947 56,499 185,676 166,214 1,615,495 486,676 Purchases 28,804,438 * 10,840 * 307,962 1,405,536 729,863 4,451,402 21,898,836 6,642,139 Cost of labor 17,893,715 * 341,385 * 5,011,647 2,598,426 * 232,608 3,001,678 6,707,972 3,816,306 Additional inventory costs (section 263A) 647,196 * 15,419 * 37,970 * -179 * 24,410 * 246,451 323,125 * 118,488 Other costs 42,420,689 1,361,091 1,915,808 6,983,590 446,331 4,049,596 27,664,272 11,125,860 Less: Inventory, end of year 1,456,470 * 1,972 * 1,413 76,479 205,176 187,926 983,505 496,646 Salaries and wages 115,092,435 42,849,320 25,436,835 4,894,038 626,833 7,809,408 33,476,001 23,312,603 Guaranteed payments to partners 23,662,759 11,167,291 4,401,680 955,415 180,109 1,801,888 5,156,376 3,546,192 Rent paid 15,811,775 9,406,588 2,308,551 573,822 166,085 577,995 2,778,734 1,445,860 Interest paid 2,422,915 298,827 278,355 98,754 28,922 299,891 1,418,165 792,637 Taxes and licenses 10,247,595 3,957,973 2,011,248 531,239 72,039 740,635 2,934,462 1,945,222 Bad debts 429,126 179,707 18,421 16,866 * 8,456 90,421 115,256 70,526 Repairs and maintenance 1,548,091 725,923 229,320 86,748 15,801 85,688 404,610 179,006 Depreciation 4,142,483 1,266,009 541,085 489,086 56,118 448,911 1,341,273 718,641 Depletion 0 0 0 0 0 0 0 0 Retirement plans, etc. 4,645,069 1,802,596 1,174,431 140,780 5,958 212,692 1,308,611 1,122,389 Employee benefit programs 7,075,013 2,643,883 1,432,011 326,427 44,488 503,186 2,125,018 1,501,363 Ordinary loss from other partnerships and fiduciaries 1,615,988 165,205 4,401 139,930 0 126,408 1,180,045 689,443 Farm net loss * 14,024 0 0 0 0 0 * 14,024 0 Net loss, noncapital assets 157,565 67,738 5,581 400 [2] 44,238 39,607 19,607 Other deductions 105,545,163 23,226,958 20,850,926 4,218,282 948,659 9,433,039 46,867,298 27,280,604 Ordinary business income (loss) 91,214,403 55,110,368 16,320,269 2,635,151 123,456 867,392 16,157,767 13,752,844 Net income 103,390,925 55,847,949 16,502,323 3,340,217 420,408 3,340,529 23,939,499 16,163,808 Loss 12,176,522 737,581 182,054 705,065 296,953 2,473,137 7,781,732 2,410,964 Portfolio income (loss) distributed directly to partners 6,372,329 106,179 312,428 260,939 242,999 818,942 4,630,841 1,800,723 Interest income 1,025,107 35,527 24,015 66,110 400 175,013 724,042 568,271 Dividend income 432,268 10,207 76,065 145,984 0 21,668 178,344 128,365 Royalties 1,029,280 1,457 0 * 1,872 * 134,559 * 50,360 841,033 25,721 Net short-term capital gain (loss) -86,964 1,538 * 735 * 19,431 0 * -56,410 -52,257 -87,342 Net long-term capital gain (loss) 3,972,638 57,450 211,613 27,543 * 108,040 628,312 2,939,680 1,165,708 Net rental real estate income (loss) 249,301 29,793 24,309 * 1,031 0 * 12,192 181,976 143,472 Net income 305,629 36,280 * 24,361 * 2,542 0 * 12,192 230,254 178,318 Loss 56,328 6,487 * 52 * 1,511 0 0 48,278 34,846 Other net rental income (loss) 10,165 -136 * 1,937 * -5,127 407 1,165 11,917 861 Net income 89,011 * 1,188 * 1,937 0 407 1,165 84,313 7,416 Loss 78,846 * 1,323 0 * 5,127 0 0 72,395 * 6,555 Total net income (loss) [1] 93,960,525 55,187,217 16,446,596 2,845,022 258,822 1,127,790 18,095,079 14,619,534 Net income 105,762,984 55,919,841 16,628,152 3,520,881 484,027 3,515,537 25,694,546 16,913,365 Loss 11,802,459 732,624 181,556 675,859 225,206 2,387,747 7,599,467 2,293,831 Footnotes at end of table.
Professional, scientific, and technical services
Other professional, scientific, and technical services
Specializeddesign
services
Computersystems
design andrelated
services
Architectural,engineeringand related
services
TotalLegal
services
Accounting,tax preparation,
bookkeepingand payroll
servicesTotal
Management,scientific, and
technicalconsultingservices
Item
Table 1. All Partnerships: Total Assets, Trade or Business Income and Deductions, Portfolio Income, Rental Income, and Total Net Income, by Selected Industrial Group, Tax Year 2014—Continued
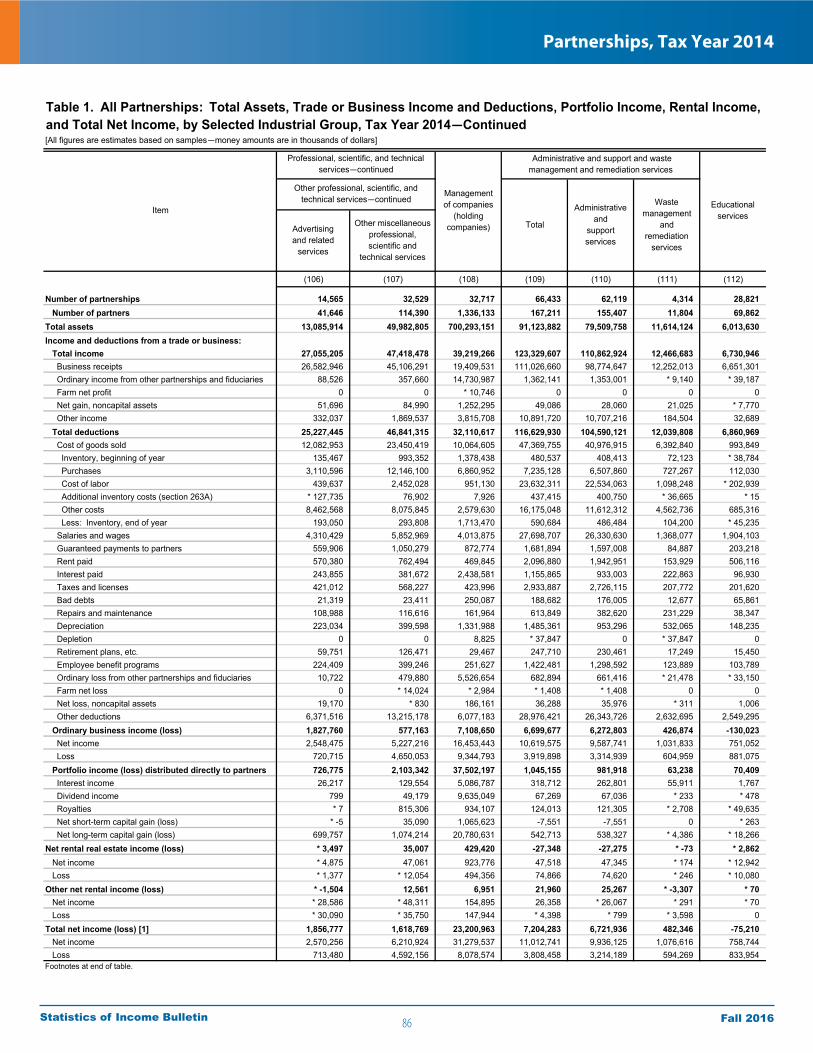
86
Partnerships, Tax Year 2014
Fall 2016Statistics of Income Bulletin
[All figures are estimates based on samples—money amounts are in thousands of dollars]
(106) (107) (108) (109) (110) (111) (112)
Number of partnerships 14,565 32,529 32,717 66,433 62,119 4,314 28,821 Number of partners 41,646 114,390 1,336,133 167,211 155,407 11,804 69,862 Total assets 13,085,914 49,982,805 700,293,151 91,123,882 79,509,758 11,614,124 6,013,630 Income and deductions from a trade or business: Total income 27,055,205 47,418,478 39,219,266 123,329,607 110,862,924 12,466,683 6,730,946 Business receipts 26,582,946 45,106,291 19,409,531 111,026,660 98,774,647 12,252,013 6,651,301 Ordinary income from other partnerships and fiduciaries 88,526 357,660 14,730,987 1,362,141 1,353,001 * 9,140 * 39,187 Farm net profit 0 0 * 10,746 0 0 0 0 Net gain, noncapital assets 51,696 84,990 1,252,295 49,086 28,060 21,025 * 7,770 Other income 332,037 1,869,537 3,815,708 10,891,720 10,707,216 184,504 32,689 Total deductions 25,227,445 46,841,315 32,110,617 116,629,930 104,590,121 12,039,808 6,860,969 Cost of goods sold 12,082,953 23,450,419 10,064,605 47,369,755 40,976,915 6,392,840 993,849 Inventory, beginning of year 135,467 993,352 1,378,438 480,537 408,413 72,123 * 38,784 Purchases 3,110,596 12,146,100 6,860,952 7,235,128 6,507,860 727,267 112,030 Cost of labor 439,637 2,452,028 951,130 23,632,311 22,534,063 1,098,248 * 202,939 Additional inventory costs (section 263A) * 127,735 76,902 7,926 437,415 400,750 * 36,665 * 15 Other costs 8,462,568 8,075,845 2,579,630 16,175,048 11,612,312 4,562,736 685,316 Less: Inventory, end of year 193,050 293,808 1,713,470 590,684 486,484 104,200 * 45,235 Salaries and wages 4,310,429 5,852,969 4,013,875 27,698,707 26,330,630 1,368,077 1,904,103 Guaranteed payments to partners 559,906 1,050,279 872,774 1,681,894 1,597,008 84,887 203,218 Rent paid 570,380 762,494 469,845 2,096,880 1,942,951 153,929 506,116 Interest paid 243,855 381,672 2,438,581 1,155,865 933,003 222,863 96,930 Taxes and licenses 421,012 568,227 423,996 2,933,887 2,726,115 207,772 201,620 Bad debts 21,319 23,411 250,087 188,682 176,005 12,677 65,861 Repairs and maintenance 108,988 116,616 161,964 613,849 382,620 231,229 38,347 Depreciation 223,034 399,598 1,331,988 1,485,361 953,296 532,065 148,235 Depletion 0 0 8,825 * 37,847 0 * 37,847 0 Retirement plans, etc. 59,751 126,471 29,467 247,710 230,461 17,249 15,450 Employee benefit programs 224,409 399,246 251,627 1,422,481 1,298,592 123,889 103,789 Ordinary loss from other partnerships and fiduciaries 10,722 479,880 5,526,654 682,894 661,416 * 21,478 * 33,150 Farm net loss 0 * 14,024 * 2,984 * 1,408 * 1,408 0 0 Net loss, noncapital assets 19,170 * 830 186,161 36,288 35,976 * 311 1,006 Other deductions 6,371,516 13,215,178 6,077,183 28,976,421 26,343,726 2,632,695 2,549,295 Ordinary business income (loss) 1,827,760 577,163 7,108,650 6,699,677 6,272,803 426,874 -130,023 Net income 2,548,475 5,227,216 16,453,443 10,619,575 9,587,741 1,031,833 751,052 Loss 720,715 4,650,053 9,344,793 3,919,898 3,314,939 604,959 881,075 Portfolio income (loss) distributed directly to partners 726,775 2,103,342 37,502,197 1,045,155 981,918 63,238 70,409 Interest income 26,217 129,554 5,086,787 318,712 262,801 55,911 1,767 Dividend income 799 49,179 9,635,049 67,269 67,036 * 233 * 478 Royalties * 7 815,306 934,107 124,013 121,305 * 2,708 * 49,635 Net short-term capital gain (loss) * -5 35,090 1,065,623 -7,551 -7,551 0 * 263 Net long-term capital gain (loss) 699,757 1,074,214 20,780,631 542,713 538,327 * 4,386 * 18,266 Net rental real estate income (loss) * 3,497 35,007 429,420 -27,348 -27,275 * -73 * 2,862 Net income * 4,875 47,061 923,776 47,518 47,345 * 174 * 12,942 Loss * 1,377 * 12,054 494,356 74,866 74,620 * 246 * 10,080 Other net rental income (loss) * -1,504 12,561 6,951 21,960 25,267 * -3,307 * 70 Net income * 28,586 * 48,311 154,895 26,358 * 26,067 * 291 * 70 Loss * 30,090 * 35,750 147,944 * 4,398 * 799 * 3,598 0 Total net income (loss) [1] 1,856,777 1,618,769 23,200,963 7,204,283 6,721,936 482,346 -75,210 Net income 2,570,256 6,210,924 31,279,537 11,012,741 9,936,125 1,076,616 758,744 Loss 713,480 4,592,156 8,078,574 3,808,458 3,214,189 594,269 833,954 Footnotes at end of table.
Professional, scientific, and technical services—continued
Other professional, scientific, and technical services—continued
Administrativeand
supportservices
Other miscellaneous professional,scientific and
technical services
Managementof companies
(holdingcompanies)Advertising
and relatedservices
Administrative and support and waste management and remediation services
Wastemanagement
andremediation
services
Educationalservices
Item
Total
Table 1. All Partnerships: Total Assets, Trade or Business Income and Deductions, Portfolio Income, Rental Income, and Total Net Income, by Selected Industrial Group, Tax Year 2014—Continued

87
Partnerships, Tax Year 2014
Fall 2016Statistics of Income Bulletin
[All figures are estimates based on samples—money amounts are in thousands of dollars]
(113) (114) (115) (116) (117) (118) (119)
Number of partnerships 85,027 32,023 15,119 6,338 5,055 3,856 1,053 Number of partners 374,499 141,690 36,804 53,873 28,642 12,273 14,825 Total assets 162,530,713 17,024,310 4,136,069 25,011,661 8,914,969 2,827,885 855,309 Income and deductions from a trade or business: Total income 270,045,415 76,913,114 10,271,733 37,728,280 15,734,792 8,624,220 1,905,163 Business receipts 252,992,046 67,383,809 9,682,255 35,722,727 13,917,024 8,580,354 1,883,081 Ordinary income from other partnerships and fiduciaries 2,986,453 361,924 * 350,090 652,254 557,106 * 605 * 128 Farm net profit 0 0 0 0 0 0 0 Net gain, noncapital assets 240,588 24,630 * 21 22,187 49,444 * 6,275 * 12,025 Other income 13,826,327 9,142,751 239,367 1,331,112 1,211,218 36,986 * 9,928 Total deductions 237,237,739 62,415,460 8,776,963 30,356,947 13,437,533 8,478,099 1,795,988 Cost of goods sold 15,144,581 3,371,674 1,100,608 1,401,025 1,874,686 1,649,121 * 546,970 Inventory, beginning of year 276,065 34,737 * 41,990 99,444 26,419 * 19,361 0 Purchases 3,918,414 1,367,826 551,078 649,866 401,716 324,370 106,194 Cost of labor 4,492,490 344,929 * 251,051 * 216,650 551,858 801,746 * 157,613 Additional inventory costs (section 263A) 180,362 * 63,182 * 3,028 * 38,857 * 8,805 * 1,669 0 Other costs 6,594,396 1,589,860 319,490 505,238 912,103 525,220 * 283,162 Less: Inventory, end of year 317,146 28,860 66,029 109,030 26,215 * 23,243 0 Salaries and wages 70,151,900 20,368,380 2,874,188 6,364,756 3,027,001 3,414,575 * 364,763 Guaranteed payments to partners 7,968,969 6,692,297 336,338 169,191 271,077 129,563 * 198,289 Rent paid 12,076,045 2,811,629 485,080 1,515,584 601,162 243,310 35,346 Interest paid 2,773,891 246,792 94,703 298,437 215,239 56,846 * 15,367 Taxes and licenses 8,940,572 1,460,616 254,239 909,215 328,574 306,124 35,376 Bad debts 5,707,799 153,117 20,843 589,327 168,897 98,678 * 22,123 Repairs and maintenance 3,040,285 538,508 43,781 483,718 376,481 32,761 * 8,675 Depreciation 5,548,554 697,294 86,272 824,035 587,144 88,493 40,680 Depletion 0 0 0 0 0 0 0 Retirement plans, etc. 1,300,017 960,831 24,499 82,278 52,552 9,626 * 3,111 Employee benefit programs 5,951,873 1,070,957 165,256 688,419 338,558 151,830 * 16,001 Ordinary loss from other partnerships and fiduciaries 353,457 15,334 * 20,645 * 88,708 * 7,107 * 25,429 0 Farm net loss 0 0 0 0 0 0 0 Net loss, noncapital assets 77,211 1,053 0 8,743 * 25,976 * 58 * 33 Other deductions 98,202,584 24,026,980 3,270,510 16,933,512 5,563,078 2,271,684 509,255 Ordinary business income (loss) 32,807,676 14,497,654 1,494,770 7,371,333 2,297,258 146,121 109,174 Net income 39,456,922 15,142,310 1,623,380 8,831,028 2,919,383 497,067 * 163,902 Loss 6,649,246 644,655 128,609 1,459,695 622,124 350,947 * 54,728 Portfolio income (loss) distributed directly to partners 2,473,836 766,686 55,814 216,731 214,982 467 * 108 Interest income 529,016 20,602 3,312 16,455 5,118 388 * 108 Dividend income 16,134 5,383 * 894 * 174 * 3,523 * 79 0 Royalties * 55,026 2 0 0 0 0 0 Net short-term capital gain (loss) 68,738 * -213 * 56,997 * 1,567 [2] 0 0 Net long-term capital gain (loss) 1,804,922 740,912 * -5,389 198,534 * 206,342 0 0 Net rental real estate income (loss) 118,097 47,837 * 2,589 65,864 * -2,477 * -125 0 Net income 295,405 51,389 * 2,589 * 66,030 * 1,981 0 0 Loss 177,308 * 3,552 0 * 167 * 4,457 * 125 0 Other net rental income (loss) 68,965 * 23,800 0 * 1,230 * 14,413 0 0 Net income 109,346 * 23,800 0 * 1,230 * 14,413 0 0 Loss * 40,381 0 0 0 0 0 0 Total net income (loss) [1] 33,594,914 14,595,278 1,501,567 7,455,056 2,317,836 146,463 109,282 Net income 40,203,434 15,224,239 1,630,164 8,846,768 2,936,723 497,221 * 164,009 Loss 6,608,520 628,961 128,597 1,391,712 618,887 350,759 * 54,727 Footnotes at end of table.
Health care and social assistance
TotalOffices ofphysicians
and dentists
Officesof otherhealth
practitioners
Outpatientcare
centers
Medicaland
diagnosticlaboratories
Homehealthcare
services
Otherambulatoryhealth care
services
Item
Table 1. All Partnerships: Total Assets, Trade or Business Income and Deductions, Portfolio Income, Rental Income, and Total Net Income, by Selected Industrial Group, Tax Year 2014—Continued
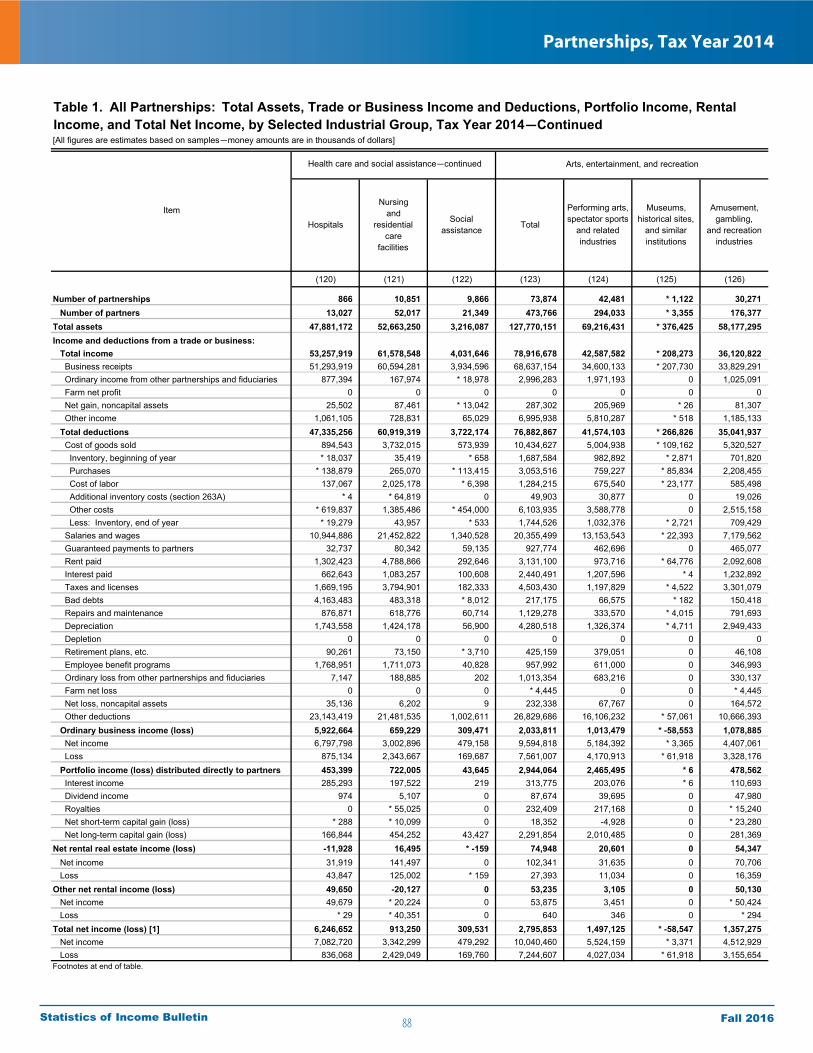
88
Partnerships, Tax Year 2014
Fall 2016Statistics of Income Bulletin
[All figures are estimates based on samples—money amounts are in thousands of dollars]
(120) (121) (122) (123) (124) (125) (126)
Number of partnerships 866 10,851 9,866 73,874 42,481 * 1,122 30,271 Number of partners 13,027 52,017 21,349 473,766 294,033 * 3,355 176,377 Total assets 47,881,172 52,663,250 3,216,087 127,770,151 69,216,431 * 376,425 58,177,295 Income and deductions from a trade or business: Total income 53,257,919 61,578,548 4,031,646 78,916,678 42,587,582 * 208,273 36,120,822 Business receipts 51,293,919 60,594,281 3,934,596 68,637,154 34,600,133 * 207,730 33,829,291 Ordinary income from other partnerships and fiduciaries 877,394 167,974 * 18,978 2,996,283 1,971,193 0 1,025,091 Farm net profit 0 0 0 0 0 0 0 Net gain, noncapital assets 25,502 87,461 * 13,042 287,302 205,969 * 26 81,307 Other income 1,061,105 728,831 65,029 6,995,938 5,810,287 * 518 1,185,133 Total deductions 47,335,256 60,919,319 3,722,174 76,882,867 41,574,103 * 266,826 35,041,937 Cost of goods sold 894,543 3,732,015 573,939 10,434,627 5,004,938 * 109,162 5,320,527 Inventory, beginning of year * 18,037 35,419 * 658 1,687,584 982,892 * 2,871 701,820 Purchases * 138,879 265,070 * 113,415 3,053,516 759,227 * 85,834 2,208,455 Cost of labor 137,067 2,025,178 * 6,398 1,284,215 675,540 * 23,177 585,498 Additional inventory costs (section 263A) * 4 * 64,819 0 49,903 30,877 0 19,026 Other costs * 619,837 1,385,486 * 454,000 6,103,935 3,588,778 0 2,515,158 Less: Inventory, end of year * 19,279 43,957 * 533 1,744,526 1,032,376 * 2,721 709,429 Salaries and wages 10,944,886 21,452,822 1,340,528 20,355,499 13,153,543 * 22,393 7,179,562 Guaranteed payments to partners 32,737 80,342 59,135 927,774 462,696 0 465,077 Rent paid 1,302,423 4,788,866 292,646 3,131,100 973,716 * 64,776 2,092,608 Interest paid 662,643 1,083,257 100,608 2,440,491 1,207,596 * 4 1,232,892 Taxes and licenses 1,669,195 3,794,901 182,333 4,503,430 1,197,829 * 4,522 3,301,079 Bad debts 4,163,483 483,318 * 8,012 217,175 66,575 * 182 150,418 Repairs and maintenance 876,871 618,776 60,714 1,129,278 333,570 * 4,015 791,693 Depreciation 1,743,558 1,424,178 56,900 4,280,518 1,326,374 * 4,711 2,949,433 Depletion 0 0 0 0 0 0 0 Retirement plans, etc. 90,261 73,150 * 3,710 425,159 379,051 0 46,108 Employee benefit programs 1,768,951 1,711,073 40,828 957,992 611,000 0 346,993 Ordinary loss from other partnerships and fiduciaries 7,147 188,885 202 1,013,354 683,216 0 330,137 Farm net loss 0 0 0 * 4,445 0 0 * 4,445 Net loss, noncapital assets 35,136 6,202 9 232,338 67,767 0 164,572 Other deductions 23,143,419 21,481,535 1,002,611 26,829,686 16,106,232 * 57,061 10,666,393 Ordinary business income (loss) 5,922,664 659,229 309,471 2,033,811 1,013,479 * -58,553 1,078,885 Net income 6,797,798 3,002,896 479,158 9,594,818 5,184,392 * 3,365 4,407,061 Loss 875,134 2,343,667 169,687 7,561,007 4,170,913 * 61,918 3,328,176 Portfolio income (loss) distributed directly to partners 453,399 722,005 43,645 2,944,064 2,465,495 * 6 478,562 Interest income 285,293 197,522 219 313,775 203,076 * 6 110,693 Dividend income 974 5,107 0 87,674 39,695 0 47,980 Royalties 0 * 55,025 0 232,409 217,168 0 * 15,240 Net short-term capital gain (loss) * 288 * 10,099 0 18,352 -4,928 0 * 23,280 Net long-term capital gain (loss) 166,844 454,252 43,427 2,291,854 2,010,485 0 281,369 Net rental real estate income (loss) -11,928 16,495 * -159 74,948 20,601 0 54,347 Net income 31,919 141,497 0 102,341 31,635 0 70,706 Loss 43,847 125,002 * 159 27,393 11,034 0 16,359 Other net rental income (loss) 49,650 -20,127 0 53,235 3,105 0 50,130 Net income 49,679 * 20,224 0 53,875 3,451 0 * 50,424 Loss * 29 * 40,351 0 640 346 0 * 294 Total net income (loss) [1] 6,246,652 913,250 309,531 2,795,853 1,497,125 * -58,547 1,357,275 Net income 7,082,720 3,342,299 479,292 10,040,460 5,524,159 * 3,371 4,512,929 Loss 836,068 2,429,049 169,760 7,244,607 4,027,034 * 61,918 3,155,654 Footnotes at end of table.
Health care and social assistance—continued
Amusement,gambling,
and recreationindustries
Performing arts,spectator sports
and relatedindustries
Arts, entertainment, and recreation
Hospitals
Nursingand
residentialcare
facilities
Socialassistance Total
Item Museums,historical sites,
and similarinstitutions
Table 1. All Partnerships: Total Assets, Trade or Business Income and Deductions, Portfolio Income, Rental Income, and Total Net Income, by Selected Industrial Group, Tax Year 2014—Continued

89
Partnerships, Tax Year 2014
Fall 2016Statistics of Income Bulletin
[All figures are estimates based on samples—money amounts are in thousands of dollars]
Repair and maintenance
(127) (128) (129) (130) (131)
Number of partnerships 138,213 42,484 95,729 85,640 42,645 Number of partners 516,694 192,332 324,362 279,902 90,600 Total assets 252,088,086 196,472,614 55,615,472 25,065,311 12,172,736 Income and deductions from a trade or business: Total income 203,175,747 76,637,170 126,538,578 33,662,740 19,137,571 Business receipts 196,872,096 73,290,041 123,582,055 33,077,430 18,957,955 Ordinary income from other partnerships and fiduciaries 1,731,152 1,033,019 698,134 * 81,942 * 2,956 Farm net profit * 176 0 * 176 0 0 Net gain, noncapital assets 525,023 276,004 249,019 178,716 34,567 Other income 4,047,301 2,038,106 2,009,194 324,653 142,093 Total deductions 199,911,926 75,731,721 124,180,205 32,123,705 18,528,738 Cost of goods sold 60,902,258 9,676,641 51,225,617 12,317,534 9,479,585 Inventory, beginning of year 2,182,805 716,789 1,466,016 1,021,810 796,147 Purchases 42,035,830 3,769,649 38,266,181 7,638,044 6,783,358 Cost of labor 9,717,079 1,787,614 7,929,464 2,462,126 1,779,707 Additional inventory costs (section 263A) 472,729 48,956 423,773 103,451 98,966 Other costs 8,902,247 4,127,117 4,775,131 2,362,021 1,040,515 Less: Inventory, end of year 2,408,432 773,483 1,634,949 1,269,917 1,019,108 Salaries and wages 37,228,446 13,536,956 23,691,491 5,919,722 2,557,809 Guaranteed payments to partners 1,034,713 270,855 763,858 790,789 336,648 Rent paid 11,478,646 2,450,291 9,028,356 2,250,537 1,007,975 Interest paid 7,185,377 6,053,961 1,131,416 679,736 403,172 Taxes and licenses 9,145,443 4,698,969 4,446,474 932,660 461,449 Bad debts 128,900 83,749 45,151 20,755 16,595 Repairs and maintenance 4,080,847 2,067,141 2,013,706 467,771 266,066 Depreciation 10,754,623 6,966,220 3,788,403 955,602 447,996 Depletion 0 0 0 0 0 Retirement plans, etc. 103,208 53,611 49,597 28,276 14,864 Employee benefit programs 2,039,018 1,347,891 691,127 262,805 99,275 Ordinary loss from other partnerships and fiduciaries 1,254,575 938,829 315,746 * 123,833 * 118,371 Farm net loss * 2,417 * 2,417 0 0 0 Net loss, noncapital assets 390,849 73,392 317,457 5,840 * 1,809 Other deductions 54,182,607 27,510,799 26,671,808 7,367,845 3,317,124 Ordinary business income (loss) 3,263,822 905,449 2,358,373 1,539,035 608,834 Net income 14,285,786 7,127,153 7,158,633 3,149,368 1,448,256 Loss 11,021,964 6,221,704 4,800,260 1,610,333 839,422 Portfolio income (loss) distributed directly to partners 912,763 747,614 165,149 223,458 96,404 Interest income 288,748 235,141 53,607 19,898 2,610 Dividend income 147,180 144,787 2,393 42,672 * 134 Royalties 188,001 145,042 42,959 5 5 Net short-term capital gain (loss) 6,145 1,691 4,454 * 351 * -478 Net long-term capital gain (loss) 282,688 220,952 61,736 160,533 * 94,133 Net rental real estate income (loss) 13,491 -35,589 49,080 26,693 * -21,039 Net income 290,895 234,674 56,221 51,703 * 3,664 Loss 277,404 270,263 * 7,141 * 25,010 * 24,703 Other net rental income (loss) 105,869 * 104,415 * 1,454 * 13,019 * 2,465 Net income * 106,560 * 105,020 * 1,539 * 13,019 * 2,465 Loss * 691 * 605 * 86 0 0 Total net income (loss) [1] 4,007,110 1,499,245 2,507,865 1,641,321 593,008 Net income 14,785,982 7,558,490 7,227,492 3,252,945 1,449,774 Loss 10,778,871 6,059,245 4,719,627 1,611,625 856,766 Footnotes at end of table.
Other services
Foodservices
anddrinkingplaces
Total
Total
Total
Accommodation and food services
Accommodation
Item
Table 1. All Partnerships: Total Assets, Trade or Business Income and Deductions, Portfolio Income, Rental Income, and Total Net Income, by Selected Industrial Group, Tax Year 2014—Continued

90
Partnerships, Tax Year 2014
Fall 2016Statistics of Income Bulletin
[All figures are estimates based on samples—money amounts are in thousands of dollars]
(132) (133) (134) (135) (136)
Number of partnerships 27,503 15,142 42,878 * 117 0 Number of partners 58,383 32,217 188,819 * 484 0 Total assets 9,710,085 2,462,651 12,398,853 * 493,722 0 Income and deductions from a trade or business: Total income 12,689,961 6,447,610 14,318,340 * 206,829 0 Business receipts 12,586,200 6,371,755 13,912,646 * 206,829 0 Ordinary income from other partnerships and fiduciaries * 2,956 0 * 78,986 0 0 Farm net profit 0 0 0 0 0 Net gain, noncapital assets 22,582 * 11,985 144,149 0 0 Other income 78,223 63,870 182,559 0 0 Total deductions 12,599,746 5,928,992 13,425,501 * 169,466 0 Cost of goods sold 5,845,172 3,634,413 2,691,305 * 146,644 0 Inventory, beginning of year 335,105 461,042 225,664 0 0 Purchases 4,514,131 2,269,227 854,686 0 0 Cost of labor 1,080,149 699,558 682,419 0 0 Additional inventory costs (section 263A) * 13,606 * 85,360 * 4,485 0 0 Other costs 404,562 635,953 1,174,862 * 146,644 0 Less: Inventory, end of year 502,381 516,726 250,810 0 0 Salaries and wages 1,893,573 664,236 3,359,118 * 2,796 0 Guaranteed payments to partners 169,612 167,037 441,897 * 12,243 0 Rent paid 813,004 194,971 1,240,095 * 2,467 0 Interest paid 361,266 41,906 276,256 * 308 0 Taxes and licenses 376,755 84,694 470,778 * 434 0 Bad debts 9,203 7,392 4,159 0 0 Repairs and maintenance 225,552 40,514 201,704 0 0 Depreciation 379,341 68,655 507,465 * 140 0 Depletion 0 0 0 0 0 Retirement plans, etc. 10,368 4,496 12,513 * 899 0 Employee benefit programs 60,350 38,924 163,531 0 0 Ordinary loss from other partnerships and fiduciaries * 118,357 14 * 5,462 0 0 Farm net loss 0 0 0 0 0 Net loss, noncapital assets * 380 1,428 * 4,031 0 0 Other deductions 2,336,813 980,311 4,047,187 * 3,535 0 Ordinary business income (loss) 90,215 518,619 892,839 * 37,362 0 Net income 822,674 625,582 1,663,750 * 37,362 0 Loss 732,459 106,963 770,911 0 0 Portfolio income (loss) distributed directly to partners 89,101 7,303 107,620 * 19,434 0 Interest income 2,452 159 17,287 0 0 Dividend income * 104 * 30 * 36,449 * 6,088 0 Royalties 2 3 0 0 0 Net short-term capital gain (loss) * -469 -9 * 829 0 0 Net long-term capital gain (loss) * 87,013 * 7,120 * 53,055 * 13,346 0 Net rental real estate income (loss) * -21,039 0 47,732 0 0 Net income * 3,664 0 48,040 0 0 Loss * 24,703 0 * 308 0 0 Other net rental income (loss) * 2,465 0 * 10,555 0 0 Net income * 2,465 0 * 10,555 0 0 Loss 0 0 0 0 0 Total net income (loss) [1] 74,198 518,810 1,004,862 * 43,451 0 Net income 824,017 625,758 1,759,720 * 43,451 0 Loss 749,819 106,948 754,858 0 0
Repair and maintenance—continued
Other services—continued
Religious,grantmaking,
civic, professional,and similar
organizations
Personaland laundry
servicesAutomotiverepair and
maintenance
Otherrepair and
maintenance
* Estimate should be used with caution because of the small number of sample returns on which it is based.[1] Total net income (loss) is the sum of ordinary business income (loss), interest income, dividend income, royalties, net rental real estate income (loss) and other net rental income (loss). For more information, see Explanation of Selected Terms for total net income (loss) at the end of the article text.[2] Between -$500 and +$500.NOTE: Detail may not add to totals because of rounding.SOURCE: IRS, Statistics of Income Division, Partnerships, April 2016.
Nature of business
not allocableItem
Table 1. All Partnerships: Total Assets, Trade or Business Income and Deductions, Portfolio Income, Rental Income, and Total Net Income, by Selected Industrial Group, Tax Year 2014—Continued
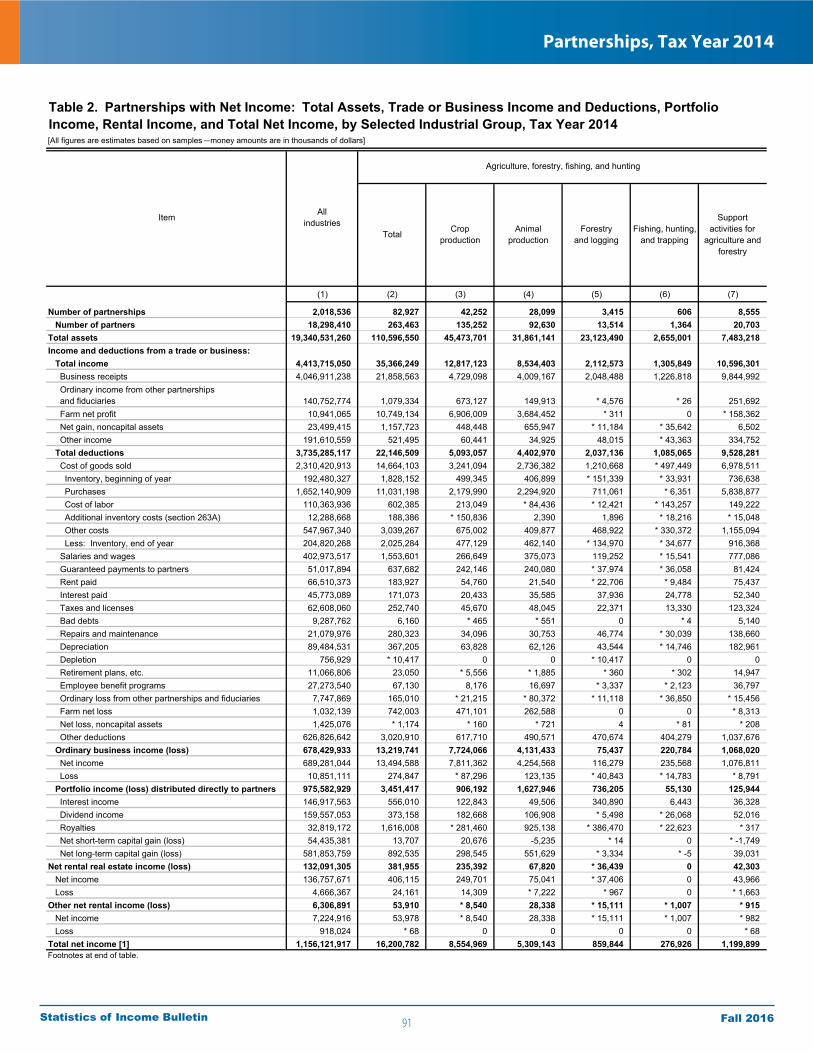
91
Partnerships, Tax Year 2014
Fall 2016Statistics of Income Bulletin
[All figures are estimates based on samples—money amounts are in thousands of dollars]
(1) (2) (3) (4) (5) (6) (7)
Number of partnerships 2,018,536 82,927 42,252 28,099 3,415 606 8,555 Number of partners 18,298,410 263,463 135,252 92,630 13,514 1,364 20,703 Total assets 19,340,531,260 110,596,550 45,473,701 31,861,141 23,123,490 2,655,001 7,483,218 Income and deductions from a trade or business: Total income 4,413,715,050 35,366,249 12,817,123 8,534,403 2,112,573 1,305,849 10,596,301 Business receipts 4,046,911,238 21,858,563 4,729,098 4,009,167 2,048,488 1,226,818 9,844,992 Ordinary income from other partnerships and fiduciaries 140,752,774 1,079,334 673,127 149,913 * 4,576 * 26 251,692 Farm net profit 10,941,065 10,749,134 6,906,009 3,684,452 * 311 0 * 158,362 Net gain, noncapital assets 23,499,415 1,157,723 448,448 655,947 * 11,184 * 35,642 6,502 Other income 191,610,559 521,495 60,441 34,925 48,015 * 43,363 334,752 Total deductions 3,735,285,117 22,146,509 5,093,057 4,402,970 2,037,136 1,085,065 9,528,281 Cost of goods sold 2,310,420,913 14,664,103 3,241,094 2,736,382 1,210,668 * 497,449 6,978,511 Inventory, beginning of year 192,480,327 1,828,152 499,345 406,899 * 151,339 * 33,931 736,638 Purchases 1,652,140,909 11,031,198 2,179,990 2,294,920 711,061 * 6,351 5,838,877 Cost of labor 110,363,936 602,385 213,049 * 84,436 * 12,421 * 143,257 149,222 Additional inventory costs (section 263A) 12,288,668 188,386 * 150,836 2,390 1,896 * 18,216 * 15,048 Other costs 547,967,340 3,039,267 675,002 409,877 468,922 * 330,372 1,155,094 Less: Inventory, end of year 204,820,268 2,025,284 477,129 462,140 * 134,970 * 34,677 916,368 Salaries and wages 402,973,517 1,553,601 266,649 375,073 119,252 * 15,541 777,086 Guaranteed payments to partners 51,017,894 637,682 242,146 240,080 * 37,974 * 36,058 81,424 Rent paid 66,510,373 183,927 54,760 21,540 * 22,706 * 9,484 75,437 Interest paid 45,773,089 171,073 20,433 35,585 37,936 24,778 52,340 Taxes and licenses 62,608,060 252,740 45,670 48,045 22,371 13,330 123,324 Bad debts 9,287,762 6,160 * 465 * 551 0 * 4 5,140 Repairs and maintenance 21,079,976 280,323 34,096 30,753 46,774 * 30,039 138,660 Depreciation 89,484,531 367,205 63,828 62,126 43,544 * 14,746 182,961 Depletion 756,929 * 10,417 0 0 * 10,417 0 0 Retirement plans, etc. 11,066,806 23,050 * 5,556 * 1,885 * 360 * 302 14,947 Employee benefit programs 27,273,540 67,130 8,176 16,697 * 3,337 * 2,123 36,797 Ordinary loss from other partnerships and fiduciaries 7,747,869 165,010 * 21,215 * 80,372 * 11,118 * 36,850 * 15,456 Farm net loss 1,032,139 742,003 471,101 262,588 0 0 * 8,313 Net loss, noncapital assets 1,425,076 * 1,174 * 160 * 721 4 * 81 * 208 Other deductions 626,826,642 3,020,910 617,710 490,571 470,674 404,279 1,037,676 Ordinary business income (loss) 678,429,933 13,219,741 7,724,066 4,131,433 75,437 220,784 1,068,020 Net income 689,281,044 13,494,588 7,811,362 4,254,568 116,279 235,568 1,076,811 Loss 10,851,111 274,847 * 87,296 123,135 * 40,843 * 14,783 * 8,791 Portfolio income (loss) distributed directly to partners 975,582,929 3,451,417 906,192 1,627,946 736,205 55,130 125,944 Interest income 146,917,563 556,010 122,843 49,506 340,890 6,443 36,328 Dividend income 159,557,053 373,158 182,668 106,908 * 5,498 * 26,068 52,016 Royalties 32,819,172 1,616,008 * 281,460 925,138 * 386,470 * 22,623 * 317 Net short-term capital gain (loss) 54,435,381 13,707 20,676 -5,235 * 14 0 * -1,749 Net long-term capital gain (loss) 581,853,759 892,535 298,545 551,629 * 3,334 * -5 39,031 Net rental real estate income (loss) 132,091,305 381,955 235,392 67,820 * 36,439 0 42,303 Net income 136,757,671 406,115 249,701 75,041 * 37,406 0 43,966 Loss 4,666,367 24,161 14,309 * 7,222 * 967 0 * 1,663 Other net rental income (loss) 6,306,891 53,910 * 8,540 28,338 * 15,111 * 1,007 * 915 Net income 7,224,916 53,978 * 8,540 28,338 * 15,111 * 1,007 * 982 Loss 918,024 * 68 0 0 0 0 * 68 Total net income [1] 1,156,121,917 16,200,782 8,554,969 5,309,143 859,844 276,926 1,199,899 Footnotes at end of table.
Table 2. Partnerships with Net Income: Total Assets, Trade or Business Income and Deductions, Portfolio Income, Rental Income, and Total Net Income, by Selected Industrial Group, Tax Year 2014
ItemAll
industries
Agriculture, forestry, fishing, and hunting
Total Cropproduction
Animalproduction
Forestryand logging
Fishing, hunting, and trapping
Supportactivities for
agriculture and forestry
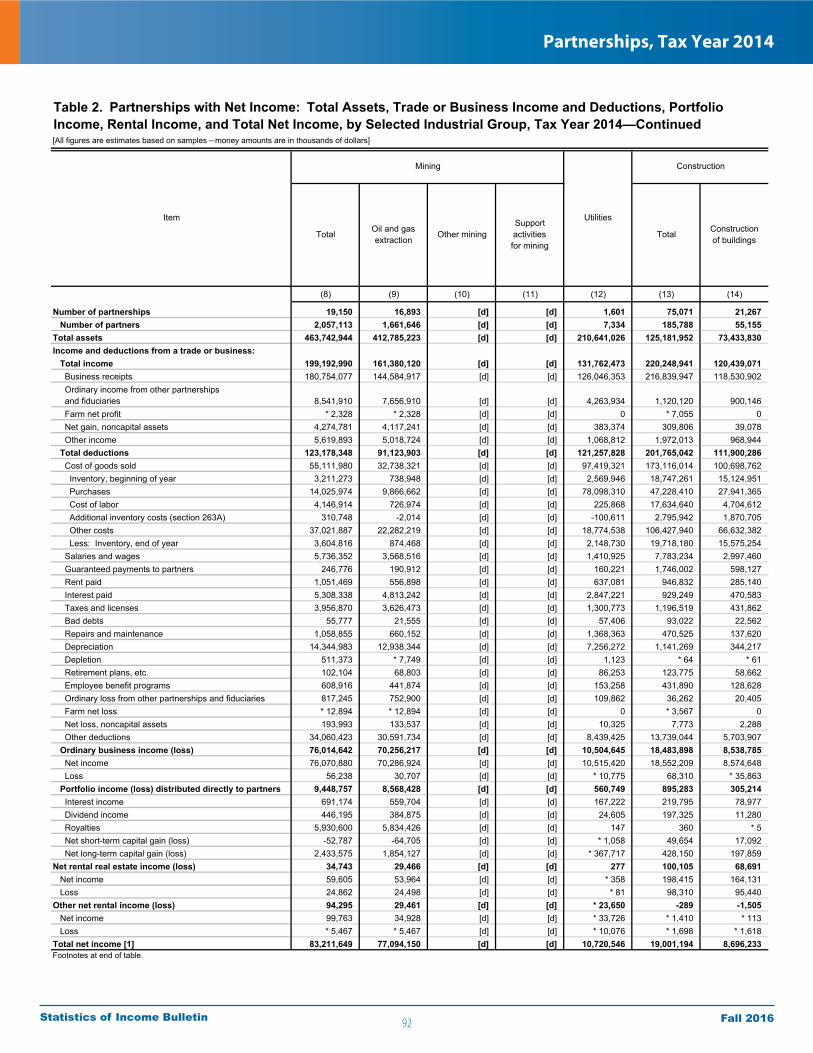
92
Partnerships, Tax Year 2014
Fall 2016Statistics of Income Bulletin
[All figures are estimates based on samples—money amounts are in thousands of dollars]
(8) (9) (10) (11) (12) (13) (14)
Number of partnerships 19,150 16,893 [d] [d] 1,601 75,071 21,267 Number of partners 2,057,113 1,661,646 [d] [d] 7,334 185,788 55,155 Total assets 463,742,944 412,785,223 [d] [d] 210,641,026 125,181,952 73,433,830 Income and deductions from a trade or business: Total income 199,192,990 161,380,120 [d] [d] 131,762,473 220,248,941 120,439,071 Business receipts 180,754,077 144,584,917 [d] [d] 126,046,353 216,839,947 118,530,902 Ordinary income from other partnerships and fiduciaries 8,541,910 7,656,910 [d] [d] 4,263,934 1,120,120 900,146 Farm net profit * 2,328 * 2,328 [d] [d] 0 * 7,055 0 Net gain, noncapital assets 4,274,781 4,117,241 [d] [d] 383,374 309,806 39,078 Other income 5,619,893 5,018,724 [d] [d] 1,068,812 1,972,013 968,944 Total deductions 123,178,348 91,123,903 [d] [d] 121,257,828 201,765,042 111,900,286 Cost of goods sold 55,111,980 32,738,321 [d] [d] 97,419,321 173,116,014 100,698,762 Inventory, beginning of year 3,211,273 738,948 [d] [d] 2,569,946 18,747,261 15,124,951 Purchases 14,025,974 9,866,662 [d] [d] 78,098,310 47,228,410 27,941,365 Cost of labor 4,146,914 726,974 [d] [d] 225,868 17,634,640 4,704,612 Additional inventory costs (section 263A) 310,748 -2,014 [d] [d] -100,611 2,795,942 1,870,705 Other costs 37,021,887 22,282,219 [d] [d] 18,774,538 106,427,940 66,632,382 Less: Inventory, end of year 3,604,816 874,468 [d] [d] 2,148,730 19,718,180 15,575,254 Salaries and wages 5,736,352 3,568,516 [d] [d] 1,410,925 7,783,234 2,997,460 Guaranteed payments to partners 246,776 190,912 [d] [d] 160,221 1,746,002 598,127 Rent paid 1,051,469 556,898 [d] [d] 637,081 946,832 285,140 Interest paid 5,308,338 4,813,242 [d] [d] 2,847,221 929,249 470,583 Taxes and licenses 3,956,870 3,626,473 [d] [d] 1,300,773 1,196,519 431,862 Bad debts 55,777 21,555 [d] [d] 57,406 93,022 22,562 Repairs and maintenance 1,058,855 660,152 [d] [d] 1,368,363 470,525 137,620 Depreciation 14,344,983 12,938,344 [d] [d] 7,256,272 1,141,269 344,217 Depletion 511,373 * 7,749 [d] [d] 1,123 * 64 * 61 Retirement plans, etc. 102,104 68,803 [d] [d] 86,253 123,775 58,662 Employee benefit programs 608,916 441,874 [d] [d] 153,258 431,890 128,628 Ordinary loss from other partnerships and fiduciaries 817,245 752,900 [d] [d] 109,862 36,262 20,405 Farm net loss * 12,894 * 12,894 [d] [d] 0 * 3,567 0 Net loss, noncapital assets 193,993 133,537 [d] [d] 10,325 7,773 2,288 Other deductions 34,060,423 30,591,734 [d] [d] 8,439,425 13,739,044 5,703,907 Ordinary business income (loss) 76,014,642 70,256,217 [d] [d] 10,504,645 18,483,898 8,538,785 Net income 76,070,880 70,286,924 [d] [d] 10,515,420 18,552,209 8,574,648 Loss 56,238 30,707 [d] [d] * 10,775 68,310 * 35,863 Portfolio income (loss) distributed directly to partners 9,448,757 8,568,428 [d] [d] 560,749 895,283 305,214 Interest income 691,174 559,704 [d] [d] 167,222 219,795 78,977 Dividend income 446,195 384,875 [d] [d] 24,605 197,325 11,280 Royalties 5,930,600 5,834,426 [d] [d] 147 360 * 5 Net short-term capital gain (loss) -52,787 -64,705 [d] [d] * 1,058 49,654 17,092 Net long-term capital gain (loss) 2,433,575 1,854,127 [d] [d] * 367,717 428,150 197,859 Net rental real estate income (loss) 34,743 29,466 [d] [d] 277 100,105 68,691 Net income 59,605 53,964 [d] [d] * 358 198,415 164,131 Loss 24,862 24,498 [d] [d] * 81 98,310 95,440 Other net rental income (loss) 94,295 29,461 [d] [d] * 23,650 -289 -1,505 Net income 99,763 34,928 [d] [d] * 33,726 * 1,410 * 113 Loss * 5,467 * 5,467 [d] [d] * 10,076 * 1,698 * 1,618 Total net income [1] 83,211,649 77,094,150 [d] [d] 10,720,546 19,001,194 8,696,233 Footnotes at end of table.
Table 2. Partnerships with Net Income: Total Assets, Trade or Business Income and Deductions, Portfolio Income, Rental Income, and Total Net Income, by Selected Industrial Group, Tax Year 2014—Continued
Construction
Item Supportactivitiesfor mining
Mining
Utilities
Total Oil and gas extraction
Other mining Total Constructionof buildings

93
Partnerships, Tax Year 2014
Fall 2016Statistics of Income Bulletin
[All figures are estimates based on samples—money amounts are in thousands of dollars]
(15) (16) (17) (18) (19) (20) (21)
Number of partnerships 4,771 424 2,489 1,858 49,033 12,519 7,667 Number of partners 14,236 1,760 7,649 4,827 116,397 26,326 18,317 Total assets 33,024,630 5,786,828 9,070,449 18,167,354 18,723,492 3,318,370 2,504,968 Income and deductions from a trade or business: Total income 39,094,668 8,120,470 3,986,079 26,988,120 60,715,201 12,678,761 7,462,346 Business receipts 38,141,931 8,063,238 3,739,339 26,339,355 60,167,114 12,589,089 7,403,457 Ordinary income from other partnerships and fiduciaries 152,110 21,098 * 105,487 25,525 67,864 * 12,473 * 2,360 Farm net profit 0 0 0 0 * 7,055 0 * 7,055 Net gain, noncapital assets 85,373 7,737 * 1,573 76,064 185,355 3,145 3,913 Other income 715,255 28,397 139,681 547,176 287,814 74,054 45,561 Total deductions 34,393,186 7,189,013 2,974,775 24,229,399 55,471,571 11,538,278 6,669,915 Cost of goods sold 30,389,494 6,121,759 2,613,305 21,654,430 42,027,758 8,622,057 5,468,627 Inventory, beginning of year 2,714,004 20,081 2,578,879 115,045 908,306 113,258 32,579 Purchases 4,566,148 778,318 1,356,994 2,430,836 14,720,897 3,991,713 2,078,179 Cost of labor 3,615,845 1,354,488 * 43,998 2,217,360 9,314,182 1,770,024 1,608,244 Additional inventory costs (section 263A) 322,380 * 12,366 * 231,863 * 78,151 602,857 * 161,871 * 69,553 Other costs 22,279,568 3,984,393 1,348,340 16,946,835 17,515,990 2,745,560 1,713,572 Less: Inventory, end of year 3,108,451 27,887 2,946,768 133,796 1,034,475 160,368 33,499 Salaries and wages 897,727 289,090 22,387 586,249 3,888,047 904,951 321,310 Guaranteed payments to partners 107,625 * 7,569 0 100,056 1,040,250 241,619 100,480 Rent paid 105,563 52,270 3,063 50,230 556,130 94,911 45,325 Interest paid 242,302 67,360 48,775 126,167 216,364 29,395 19,925 Taxes and licenses 180,274 61,407 18,199 100,667 584,384 115,099 76,951 Bad debts 7,379 1,681 * 132 5,566 63,080 17,124 9,048 Repairs and maintenance 79,156 31,981 3,851 43,324 253,749 50,441 18,348 Depreciation 248,106 123,719 4,582 119,805 548,946 140,873 45,121 Depletion * 3 0 * 3 0 0 0 0 Retirement plans, etc. 23,271 * 4,362 * 665 18,244 41,842 11,367 7,395 Employee benefit programs 94,766 32,911 * 2,930 58,925 208,496 32,094 28,317 Ordinary loss from other partnerships and fiduciaries * 7,049 153 * 6,872 25 * 8,808 [2] 80 Farm net loss * 3,567 0 * 35 * 3,532 0 0 0 Net loss, noncapital assets * 2,576 123 0 * 2,453 2,909 * 2,250 * 126 Other deductions 2,004,329 394,628 249,976 1,359,725 6,030,808 1,276,096 528,860 Ordinary business income (loss) 4,701,482 931,457 1,011,304 2,758,721 5,243,631 1,140,483 792,431 Net income 4,733,521 931,457 1,028,875 2,773,189 5,244,039 1,140,483 792,431 Loss * 32,039 0 * 17,570 * 14,468 * 409 0 0 Portfolio income (loss) distributed directly to partners 375,418 -9 309,430 65,997 214,651 7,008 1,987 Interest income 118,658 2,331 56,880 59,447 22,160 3,551 1,987 Dividend income 9,227 * 292 * 6,059 2,877 176,817 * 1,129 * 1 Royalties * 12 0 * 12 [2] * 342 * 193 0 Net short-term capital gain (loss) 28,701 * -2,881 * 29,445 2,137 3,860 * 680 0 Net long-term capital gain (loss) 218,819 * 249 * 217,033 1,537 11,472 * 1,455 0 Net rental real estate income (loss) 22,331 49 20,911 * 1,372 9,083 * 262 * 200 Net income 24,141 49 * 22,714 * 1,378 10,143 * 262 * 200 Loss * 1,810 0 * 1,804 * 6 * 1,060 0 0 Other net rental income (loss) * -26 0 0 * -26 * 1,242 * 71 * 1,171 Net income 16 0 0 16 * 1,280 * 109 * 1,171 Loss * 42 0 0 * 42 38 38 0 Total net income [1] 4,851,686 934,129 1,095,166 2,822,391 5,453,275 1,145,689 795,789 Footnotes at end of table.
Table 2. Partnerships with Net Income: Total Assets, Trade or Business Income and Deductions, Portfolio Income, Rental Income, and Total Net Income, by Selected Industrial Group, Tax Year 2014—Continued
Construction—continued
Special trade contractors
Item
Heavy and civil engineering construction
TotalUtility
systemconstruction
Land subdivisionOther heavy and civil engineering
constructionTotal
Foundation,structure, and
building exteriorcontractors
Electricalcontractors

94
Partnerships, Tax Year 2014
Fall 2016Statistics of Income Bulletin
[All figures are estimates based on samples—money amounts are in thousands of dollars]
(22) (23) (24) (25) (26) (27) (28)
Number of partnerships 5,020 13,096 10,730 24,389 2,500 604 293 Number of partners 10,600 36,275 24,879 388,672 15,590 3,367 1,724 Total assets 1,957,381 2,652,350 8,290,423 615,116,754 48,587,468 27,755,024 2,368,583 Income and deductions from a trade or business: Total income 9,757,370 9,689,557 21,127,167 898,734,899 81,972,389 20,182,562 4,271,679 Business receipts 9,521,462 9,677,058 20,976,047 882,827,882 81,185,606 19,925,471 4,205,353 Ordinary income from other partnerships and fiduciaries * 42,871 * 605 * 9,555 5,754,113 402,230 * 10,802 631 Farm net profit 0 0 0 * 3,248 * 2,986 * 210 0 Net gain, noncapital assets 130,166 * 431 47,699 946,315 31,485 28,149 * 42 Other income 62,871 11,463 93,866 9,203,341 350,082 217,930 65,654 Total deductions 8,875,865 8,845,395 19,542,119 831,677,213 77,501,145 17,266,823 4,133,747 Cost of goods sold 6,469,748 6,733,070 14,734,255 725,141,676 68,211,580 12,650,943 3,462,747 Inventory, beginning of year 131,128 170,728 460,614 58,919,932 7,118,565 2,778,897 650,445 Purchases 2,330,988 2,666,973 3,653,044 538,458,480 55,289,764 7,725,437 2,482,475 Cost of labor 1,577,025 1,477,521 2,881,369 28,038,577 3,526,499 971,970 382,825 Additional inventory costs (section 263A) * 14,301 * 254,392 102,741 3,099,853 312,352 22,722 38,994 Other costs 2,552,013 2,410,319 8,094,526 159,641,357 9,564,877 4,198,496 593,917 Less: Inventory, end of year 135,706 246,862 458,039 63,016,521 7,600,477 3,046,580 685,909 Salaries and wages 809,824 374,857 1,477,105 22,020,601 1,881,805 968,652 188,166 Guaranteed payments to partners 79,802 337,749 280,600 1,984,453 83,961 78,362 * 11,290 Rent paid 94,171 121,853 199,870 2,852,412 286,933 97,722 17,663 Interest paid 36,463 24,685 105,896 4,169,887 378,696 120,347 59,592 Taxes and licenses 139,801 81,422 171,112 10,847,736 248,977 245,204 22,090 Bad debts 13,749 8,214 14,946 265,279 20,172 16,729 8,332 Repairs and maintenance 31,887 30,022 123,051 2,395,236 215,244 87,513 12,730 Depreciation 50,548 42,956 269,448 7,819,689 500,815 207,575 16,103 Depletion 0 0 0 185,352 0 0 0 Retirement plans, etc. 7,999 1,654 13,427 1,236,472 94,816 144,443 5,960 Employee benefit programs 42,707 21,741 83,637 2,937,941 173,987 159,191 11,848 Ordinary loss from other partnerships and fiduciaries 1,365 3,869 * 3,494 207,956 13,396 2,360 * 2,143 Farm net loss 0 0 0 * 50,442 0 * 50,442 0 Net loss, noncapital assets * 4 142 * 386 167,348 8,669 * 3,289 * 9 Other deductions 1,097,797 1,063,162 2,064,893 49,394,734 5,382,095 2,434,052 315,071 Ordinary business income (loss) 881,505 844,162 1,585,048 67,057,686 4,471,244 2,915,739 137,933 Net income 881,505 844,162 1,585,457 68,487,291 4,474,267 2,915,739 156,611 Loss 0 0 * 409 1,429,605 * 3,022 0 * 18,678 Portfolio income (loss) distributed directly to partners 178,657 17,592 9,406 15,472,748 345,855 156,667 53,191 Interest income 5,152 7,141 4,330 3,628,349 57,807 50,170 961 Dividend income * 173,202 * 1,460 1,027 3,964,692 140,613 17,566 * 35,415 Royalties 0 0 * 149 5,676,419 14,803 34,959 * 16,240 Net short-term capital gain (loss) * -9 * 2,871 * 318 33,071 -24 451 * 38 Net long-term capital gain (loss) 313 * 6,120 * 3,583 2,170,217 132,655 * 53,521 * 537 Net rental real estate income (loss) * 1,278 * 279 * 7,064 32,252 787 * 1,421 * 902 Net income * 1,549 * 467 * 7,665 39,022 1,940 * 1,451 * 902 Loss * 271 * 188 * 602 6,771 1,153 30 0 Other net rental income (loss) 0 0 0 518,103 3,145 631 335 Net income 0 0 0 519,477 3,145 631 335 Loss 0 0 0 1,375 0 0 0 Total net income [1] 1,061,136 853,043 1,597,618 80,877,499 4,688,400 3,020,486 191,786 Footnotes at end of table.
Table 2. Partnerships with Net Income: Total Assets, Trade or Business Income and Deductions, Portfolio Income, Rental Income, and Total Net Income, by Selected Industrial Group, Tax Year 2014—Continued
Item
Special trade contractors—continued
Construction—continued Manufacturing
Foodmanufacturing
Beverage andtobaccoproduct
manufacturing
Textile millsand textile
product millsTotalPlumbing,
heating andair-conditioning
contractors
Buildingfinishing
contractors
Other specialty
tradecontractors
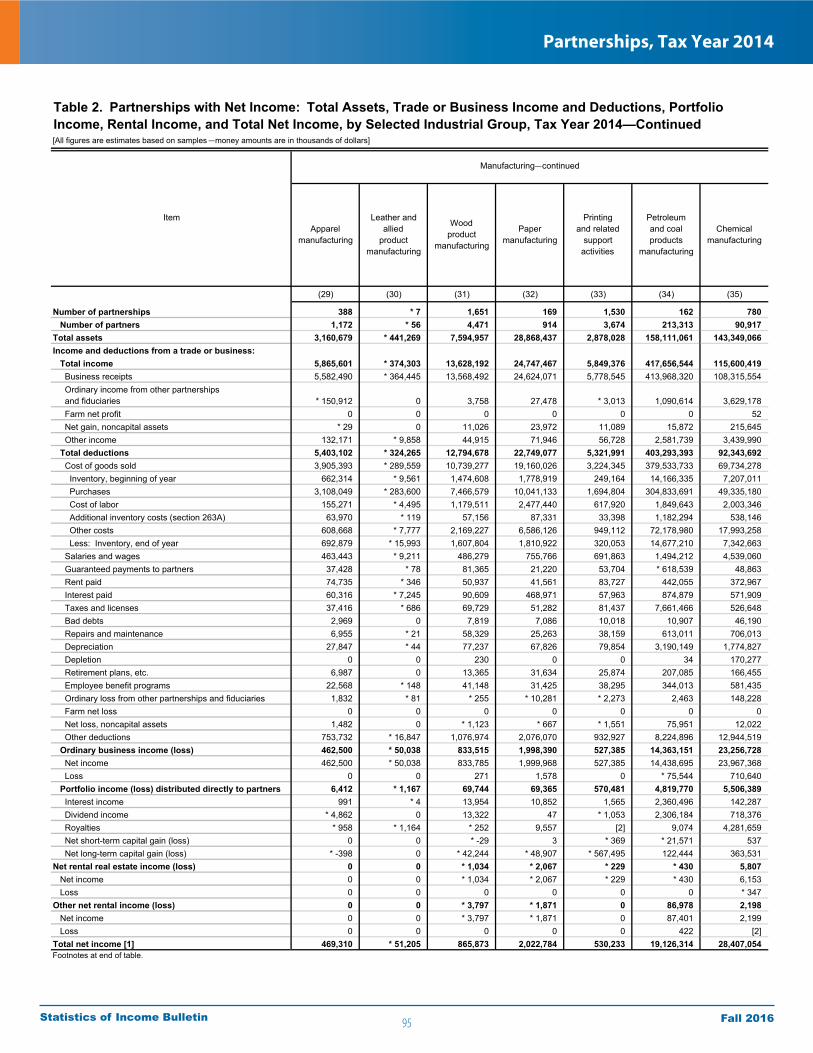
95
Partnerships, Tax Year 2014
Fall 2016Statistics of Income Bulletin
[All figures are estimates based on samples—money amounts are in thousands of dollars]
(29) (30) (31) (32) (33) (34) (35)
Number of partnerships 388 * 7 1,651 169 1,530 162 780 Number of partners 1,172 * 56 4,471 914 3,674 213,313 90,917 Total assets 3,160,679 * 441,269 7,594,957 28,868,437 2,878,028 158,111,061 143,349,066 Income and deductions from a trade or business: Total income 5,865,601 * 374,303 13,628,192 24,747,467 5,849,376 417,656,544 115,600,419 Business receipts 5,582,490 * 364,445 13,568,492 24,624,071 5,778,545 413,968,320 108,315,554 Ordinary income from other partnerships and fiduciaries * 150,912 0 3,758 27,478 * 3,013 1,090,614 3,629,178 Farm net profit 0 0 0 0 0 0 52 Net gain, noncapital assets * 29 0 11,026 23,972 11,089 15,872 215,645 Other income 132,171 * 9,858 44,915 71,946 56,728 2,581,739 3,439,990 Total deductions 5,403,102 * 324,265 12,794,678 22,749,077 5,321,991 403,293,393 92,343,692 Cost of goods sold 3,905,393 * 289,559 10,739,277 19,160,026 3,224,345 379,533,733 69,734,278 Inventory, beginning of year 662,314 * 9,561 1,474,608 1,778,919 249,164 14,166,335 7,207,011 Purchases 3,108,049 * 283,600 7,466,579 10,041,133 1,694,804 304,833,691 49,335,180 Cost of labor 155,271 * 4,495 1,179,511 2,477,440 617,920 1,849,643 2,003,346 Additional inventory costs (section 263A) 63,970 * 119 57,156 87,331 33,398 1,182,294 538,146 Other costs 608,668 * 7,777 2,169,227 6,586,126 949,112 72,178,980 17,993,258 Less: Inventory, end of year 692,879 * 15,993 1,607,804 1,810,922 320,053 14,677,210 7,342,663 Salaries and wages 463,443 * 9,211 486,279 755,766 691,863 1,494,212 4,539,060 Guaranteed payments to partners 37,428 * 78 81,365 21,220 53,704 * 618,539 48,863 Rent paid 74,735 * 346 50,937 41,561 83,727 442,055 372,967 Interest paid 60,316 * 7,245 90,609 468,971 57,963 874,879 571,909 Taxes and licenses 37,416 * 686 69,729 51,282 81,437 7,661,466 526,648 Bad debts 2,969 0 7,819 7,086 10,018 10,907 46,190 Repairs and maintenance 6,955 * 21 58,329 25,263 38,159 613,011 706,013 Depreciation 27,847 * 44 77,237 67,826 79,854 3,190,149 1,774,827 Depletion 0 0 230 0 0 34 170,277 Retirement plans, etc. 6,987 0 13,365 31,634 25,874 207,085 166,455 Employee benefit programs 22,568 * 148 41,148 31,425 38,295 344,013 581,435 Ordinary loss from other partnerships and fiduciaries 1,832 * 81 * 255 * 10,281 * 2,273 2,463 148,228 Farm net loss 0 0 0 0 0 0 0 Net loss, noncapital assets 1,482 0 * 1,123 * 667 * 1,551 75,951 12,022 Other deductions 753,732 * 16,847 1,076,974 2,076,070 932,927 8,224,896 12,944,519 Ordinary business income (loss) 462,500 * 50,038 833,515 1,998,390 527,385 14,363,151 23,256,728 Net income 462,500 * 50,038 833,785 1,999,968 527,385 14,438,695 23,967,368 Loss 0 0 271 1,578 0 * 75,544 710,640 Portfolio income (loss) distributed directly to partners 6,412 * 1,167 69,744 69,365 570,481 4,819,770 5,506,389 Interest income 991 * 4 13,954 10,852 1,565 2,360,496 142,287 Dividend income * 4,862 0 13,322 47 * 1,053 2,306,184 718,376 Royalties * 958 * 1,164 * 252 9,557 [2] 9,074 4,281,659 Net short-term capital gain (loss) 0 0 * -29 3 * 369 * 21,571 537 Net long-term capital gain (loss) * -398 0 * 42,244 * 48,907 * 567,495 122,444 363,531 Net rental real estate income (loss) 0 0 * 1,034 * 2,067 * 229 * 430 5,807 Net income 0 0 * 1,034 * 2,067 * 229 * 430 6,153 Loss 0 0 0 0 0 0 * 347 Other net rental income (loss) 0 0 * 3,797 * 1,871 0 86,978 2,198 Net income 0 0 * 3,797 * 1,871 0 87,401 2,199 Loss 0 0 0 0 0 422 [2] Total net income [1] 469,310 * 51,205 865,873 2,022,784 530,233 19,126,314 28,407,054 Footnotes at end of table.
Table 2. Partnerships with Net Income: Total Assets, Trade or Business Income and Deductions, Portfolio Income, Rental Income, and Total Net Income, by Selected Industrial Group, Tax Year 2014—Continued
Item
Manufacturing—continued
Apparelmanufacturing
Leather andallied
productmanufacturing
Woodproduct
manufacturing
Papermanufacturing
Printingand related
supportactivities
Petroleumand coal products
manufacturing
Chemicalmanufacturing

96
Partnerships, Tax Year 2014
Fall 2016Statistics of Income Bulletin
[All figures are estimates based on samples—money amounts are in thousands of dollars]
(36) (37) (38) (39) (40) (41) (42)
Number of partnerships 517 1,381 290 4,606 1,988 614 213 Number of partners 3,243 5,288 1,303 12,836 7,006 2,252 1,110 Total assets 17,005,684 5,094,595 15,594,096 23,296,092 57,630,292 9,823,289 5,379,583 Income and deductions from a trade or business: Total income 19,328,401 7,799,150 28,628,333 27,944,301 37,302,638 14,535,508 6,568,675 Business receipts 19,075,563 7,523,811 28,429,183 27,661,423 36,691,810 14,328,256 6,343,862 Ordinary income from other partnerships and fiduciaries * 4,737 * 81,852 * 68,194 * 29,650 * 15,244 * 59 * 191,285 Farm net profit 0 0 0 0 0 0 0 Net gain, noncapital assets 71,066 10,469 2,507 4,709 35,168 * 1,698 * 1,055 Other income 177,036 183,018 128,449 248,518 560,416 205,494 32,473 Total deductions 17,926,147 7,167,027 26,782,061 25,111,941 34,626,943 13,229,002 5,779,669 Cost of goods sold 14,773,408 5,344,024 24,729,732 20,023,149 27,887,265 9,553,112 4,398,109 Inventory, beginning of year 1,853,369 722,852 2,590,578 2,388,127 5,684,197 997,748 790,578 Purchases 9,232,373 2,484,807 19,336,615 12,741,009 11,324,731 5,967,855 2,873,935 Cost of labor 1,890,667 641,063 1,223,926 2,680,568 3,250,644 822,039 526,521 Additional inventory costs (section 263A) 227,027 27,890 23,947 138,575 67,436 38,320 32,439 Other costs 3,594,193 2,219,936 4,321,931 5,542,063 13,261,550 2,923,090 1,135,453 Less: Inventory, end of year 2,024,220 752,525 2,767,266 3,467,193 5,701,293 1,195,942 960,818 Salaries and wages 834,957 487,175 580,200 1,530,533 1,871,234 1,289,408 414,051 Guaranteed payments to partners 41,699 * 17,826 17,045 247,879 91,949 64,092 * 16,641 Rent paid 65,230 140,535 43,384 271,056 335,897 89,751 37,451 Interest paid 294,182 84,867 123,859 194,982 142,293 68,427 61,206 Taxes and licenses 114,924 76,321 113,707 202,173 760,019 76,730 37,820 Bad debts 12,396 5,552 4,238 38,342 20,294 5,170 20,151 Repairs and maintenance 75,166 69,218 57,133 124,135 79,107 53,468 17,718 Depreciation 163,803 182,224 141,596 246,679 269,698 189,527 30,311 Depletion 0 * 14,811 0 0 0 0 0 Retirement plans, etc. 78,884 29,293 28,616 77,848 42,901 122,323 8,937 Employee benefit programs 164,193 41,112 71,652 268,979 292,207 196,621 29,078 Ordinary loss from other partnerships and fiduciaries * 1,757 * 1,156 354 * 3,019 * 470 * 344 106 Farm net loss 0 0 0 0 0 0 0 Net loss, noncapital assets 26,235 * 263 * 1,032 8,795 * 14,634 * 421 * 1,143 Other deductions 1,279,313 672,651 869,513 1,874,372 2,818,974 1,519,609 706,948 Ordinary business income (loss) 1,402,255 632,123 1,846,272 2,832,360 2,675,695 1,306,507 789,006 Net income 1,473,172 632,123 1,847,692 2,842,474 3,163,935 1,306,507 789,911 Loss 70,918 0 1,420 * 10,114 488,239 0 * 905 Portfolio income (loss) distributed directly to partners 223,778 284,983 139,735 358,518 994,078 141,500 70,707 Interest income 77,392 1,947 61,721 302,357 446,967 9,987 7,802 Dividend income 57,932 * 9,658 * 75,044 50,915 303,904 * 28,960 79,464 Royalties * 31,148 * 921 * 2,930 * 4,501 * 238,554 * 46 3,376 Net short-term capital gain (loss) * -113 0 60 * 7 * -5 * 7,346 -80 Net long-term capital gain (loss) * 57,419 * 272,457 -21 * 737 * 4,657 * 95,160 * -19,856 Net rental real estate income (loss) * 3,887 * 16 * 2,884 * -2,392 160 0 * 2,734 Net income * 3,887 * 36 * 2,884 * 1,431 160 0 * 2,734 Loss 0 * 20 0 * 3,823 0 0 0 Other net rental income (loss) * 169 815 * 16,156 * 1,149 * 400,272 0 2 Net income * 169 815 * 16,156 * 1,149 * 400,272 0 2 Loss 0 0 0 0 0 0 0 Total net income [1] 1,572,783 645,481 2,005,007 3,188,889 4,065,553 1,345,500 882,384 Footnotes at end of table.
Table 2. Partnerships with Net Income: Total Assets, Trade or Business Income and Deductions, Portfolio Income, Rental Income, and Total Net Income, by Selected Industrial Group, Tax Year 2014—Continued
Item
Manufacturing—continued
Primarymetal
manufacturing
Fabricatedmetal
productsmanufacturing
Machinerymanufacturing
Computerand electrical
productmanufacturing
Electricalequipment,
appliance andcomponent
manufacturing
Plastics andrubber
productsmanufacturing
Nonmetallic mineralproducts
manufacturing

97
Partnerships, Tax Year 2014
Fall 2016Statistics of Income Bulletin
[All figures are estimates based on samples—money amounts are in thousands of dollars]
(43) (44) (45) (46) (47) (48) (49)
Number of partnerships 1,164 638 4,893 37,023 26,707 8,471 1,844 Number of partners 3,443 2,342 14,649 512,079 80,880 426,856 4,342 Total assets 35,708,193 2,786,715 19,683,644 215,609,662 77,146,230 135,024,857 3,438,575 Income and deductions from a trade or business: Total income 42,384,913 3,483,128 20,611,317 562,483,584 171,350,595 384,437,080 6,695,909 Business receipts 41,971,932 3,457,222 19,826,472 557,051,085 169,431,726 380,959,726 6,659,632 Ordinary income from other partnerships and fiduciaries * 41,450 266 * 2,758 1,371,123 395,657 973,856 * 1,610 Farm net profit 0 0 0 * 369 * 62 * 307 0 Net gain, noncapital assets 92,605 * 12,591 377,138 669,880 365,955 294,894 * 9,032 Other income 278,927 13,048 404,948 3,391,127 1,157,195 2,208,297 25,634 Total deductions 39,023,681 3,280,423 17,618,409 538,514,529 160,938,985 371,496,786 6,078,758 Cost of goods sold 34,078,507 2,277,710 11,164,779 476,657,525 136,120,597 335,847,124 4,689,804 Inventory, beginning of year 5,097,387 269,354 2,429,921 37,450,208 19,762,762 17,514,480 172,967 Purchases 23,633,597 1,366,217 7,236,628 440,136,950 129,959,024 305,719,984 4,457,943 Cost of labor 2,782,783 361,991 689,454 2,776,121 1,642,969 1,073,372 * 59,780 Additional inventory costs (section 263A) 72,539 * 23,583 111,614 1,283,529 441,321 840,991 1,217 Other costs 7,879,469 540,539 3,372,692 36,565,769 7,327,604 28,886,328 351,837 Less: Inventory, end of year 5,387,268 283,975 2,675,530 41,555,052 23,013,082 18,188,030 353,939 Salaries and wages 1,382,202 297,523 1,854,862 19,831,601 8,362,764 10,989,491 479,346 Guaranteed payments to partners 41,349 162,360 248,803 1,596,885 985,168 458,273 153,445 Rent paid 192,746 33,714 174,002 2,912,819 1,356,078 1,523,698 33,043 Interest paid 285,181 70,454 153,909 2,250,124 825,033 1,402,933 22,158 Taxes and licenses 186,680 39,344 295,082 2,319,597 993,504 1,284,788 41,305 Bad debts 4,793 1,109 23,010 238,965 120,532 115,798 2,635 Repairs and maintenance 89,901 11,596 54,558 1,018,149 388,508 616,967 12,673 Depreciation 339,953 22,871 290,751 3,375,052 745,938 2,611,521 17,593 Depletion 0 0 0 * 28 * 28 0 0 Retirement plans, etc. 116,074 * 1,692 33,284 383,191 151,184 224,538 7,469 Employee benefit programs 149,957 12,427 307,659 1,880,942 648,849 1,208,444 23,649 Ordinary loss from other partnerships and fiduciaries * 160 0 * 17,279 87,479 18,637 66,617 * 2,224 Farm net loss 0 0 0 * 7,696 * 5,895 * 1,801 0 Net loss, noncapital assets 9,035 151 * 875 16,971 7,090 9,740 * 140 Other deductions 2,147,143 349,471 2,999,557 25,937,505 10,209,180 15,135,051 593,274 Ordinary business income (loss) 3,361,233 202,705 2,992,908 23,969,055 10,411,611 12,940,294 617,151 Net income 3,361,233 224,609 3,019,279 24,009,034 10,436,639 12,951,026 621,370 Loss 0 21,904 * 26,371 39,979 * 25,028 10,732 * 4,219 Portfolio income (loss) distributed directly to partners 283,876 217,825 1,158,706 1,750,462 897,558 743,864 109,040 Interest income 31,979 26,771 22,338 150,347 50,417 97,117 2,812 Dividend income 59,795 * 7,056 54,524 367,872 52,912 305,555 * 9,406 Royalties 4,389 11,450 1,010,438 57,473 18,652 38,821 0 Net short-term capital gain (loss) 6,168 * 17 * -3,244 9,525 14,679 -5,340 186 Net long-term capital gain (loss) 181,545 * 172,531 * 74,651 1,165,244 760,897 307,711 * 96,636 Net rental real estate income (loss) * -831 * -262 * 13,379 59,754 30,812 28,942 0 Net income * 304 0 * 13,379 90,065 32,334 57,731 0 Loss * 1,135 * 262 0 30,310 1,522 28,789 0 Other net rental income (loss) * -16 0 * 601 95,779 91,159 4,620 0 Net income * 936 0 * 601 98,102 91,964 6,138 0 Loss 952 0 0 * 2,323 * 805 * 1,518 0 Total net income [1] 3,456,549 247,720 4,094,187 24,700,281 10,655,563 13,415,349 629,369 Footnotes at end of table.
Table 2. Partnerships with Net Income: Total Assets, Trade or Business Income and Deductions, Portfolio Income, Rental Income, and Total Net Income, by Selected Industrial Group, Tax Year 2014—Continued
Item
Manufacturing—continued Wholesale trade
Transportationequipment
manufacturing
Furnitureand related
productmanufacturing
Miscellaneousmanufacturing
TotalMerchant
wholesalers,durable goods
Merchantwholesalers,nondurable
goods
Wholesaleelectronic
markets andagents and
brokers

98
Partnerships, Tax Year 2014
Fall 2016Statistics of Income Bulletin
[All figures are estimates based on samples—money amounts are in thousands of dollars]
(50) (51) (52) (53) (54) (55) (56)
Number of partnerships 86,749 9,563 3,716 [d] 4,700 12,024 6,234 Number of partners 399,356 24,294 8,263 [d] 17,647 30,039 45,384 Total assets 153,702,694 47,972,883 4,196,650 [d] 5,240,219 25,986,311 5,270,456 Income and deductions from a trade or business: Total income 414,420,528 155,952,918 11,919,220 [d] 13,789,857 55,276,398 16,503,378 Business receipts 405,016,465 150,888,381 11,623,101 [d] 13,628,412 54,230,747 16,149,251 Ordinary income from other partnerships and fiduciaries 1,186,074 283,009 17 [d] * 56,506 * 226,695 * 10,633 Farm net profit 0 0 0 [d] 0 0 0 Net gain, noncapital assets 349,489 136,320 3,848 [d] 10,601 41,395 54,523 Other income 7,868,500 4,645,208 292,254 [d] 94,338 777,560 288,970 Total deductions 396,417,208 152,119,956 11,093,808 [d] 13,039,478 53,576,165 14,296,829 Cost of goods sold 320,297,305 132,840,944 6,995,369 [d] 9,917,224 40,093,521 8,953,086 Inventory, beginning of year 41,612,077 23,088,584 1,289,030 [d] 1,788,283 3,348,542 1,019,699 Purchases 306,832,127 131,105,975 6,181,107 [d] 9,700,614 39,033,285 8,334,087 Cost of labor 2,827,272 1,407,972 228,712 [d] 158,360 362,882 179,794 Additional inventory costs (section 263A) 1,030,288 215,422 99,152 [d] 16,806 88,292 21,088 Other costs 13,490,805 2,640,779 587,406 [d] 311,501 698,167 409,758 Less: Inventory, end of year 45,495,262 25,617,788 1,390,038 [d] 2,058,340 3,437,647 1,011,340 Salaries and wages 25,845,390 7,870,976 1,406,322 [d] 1,179,709 5,260,278 1,506,849 Guaranteed payments to partners 1,299,291 247,816 70,746 [d] 116,661 142,004 250,415 Rent paid 7,384,380 1,640,004 609,434 [d] 306,167 1,225,169 414,590 Interest paid 2,130,770 550,317 46,794 [d] 75,703 373,088 52,968 Taxes and licenses 3,750,135 1,092,882 230,544 [d] 164,459 709,466 151,275 Bad debts 417,663 51,546 14,189 [d] 9,846 21,943 91,347 Repairs and maintenance 1,644,153 235,806 69,394 [d] 91,362 434,058 50,369 Depreciation 3,047,975 587,458 100,266 [d] 91,464 626,969 118,724 Depletion 0 0 0 [d] 0 0 0 Retirement plans, etc. 250,363 45,144 8,807 [d] 14,638 62,888 22,932 Employee benefit programs 1,729,856 571,100 58,019 [d] 73,553 478,711 77,281 Ordinary loss from other partnerships and fiduciaries 37,133 11,211 * 4,591 [d] * 2 * 14,678 * 669 Farm net loss * 1,372 0 0 [d] 0 * 1,372 0 Net loss, noncapital assets 83,481 9,512 * 1,580 [d] * 136 * 92 12,844 Other deductions 28,497,940 6,365,240 1,477,751 [d] 998,555 4,131,927 2,593,481 Ordinary business income (loss) 18,003,320 3,832,962 825,412 [d] 750,379 1,700,233 2,206,549 Net income 18,096,987 3,835,100 825,412 [d] 750,379 1,776,131 2,206,549 Loss 93,667 * 2,138 0 [d] 0 * 75,898 0 Portfolio income (loss) distributed directly to partners 1,330,437 227,939 40,464 [d] 7,318 114,128 616,538 Interest income 310,702 42,819 1,770 [d] 4,669 102,906 2,626 Dividend income 54,768 1,876 * 110 [d] * 2,318 27,530 * 12,534 Royalties 5,304 * 121 * 402 [d] 0 2,585 0 Net short-term capital gain (loss) 11,944 * 596 * 140 [d] * 41 559 4,250 Net long-term capital gain (loss) 947,719 182,527 * 38,043 [d] * 290 * -19,452 * 597,128 Net rental real estate income (loss) 260,283 10,700 * 250 [d] * 4,833 152,568 456 Net income 271,472 11,137 5,673 [d] * 4,833 152,568 456 Loss 11,188 * 437 * 5,423 [d] 0 0 0 Other net rental income (loss) 50,114 * 91 * 266 [d] * 1,787 * 5,139 577 Net income 54,023 * 3,037 * 266 [d] * 1,787 * 5,139 577 Loss 3,909 2,946 0 [d] 0 0 0 Total net income [1] 18,684,491 3,888,569 828,210 [d] 763,986 1,990,962 2,222,742 Footnotes at end of table.
Table 2. Partnerships with Net Income: Total Assets, Trade or Business Income and Deductions, Portfolio Income, Rental Income, and Total Net Income, by Selected Industrial Group, Tax Year 2014—Continued
Item
Retail trade
TotalMotor
vehicle andparts dealers
Furnitureand homefurnishing
stores
Electronicsand appliance
stores
Buildingmaterials and
gardenequipment and
supplies dealers
Foodand beverage
stores
Healthand personalcare stores
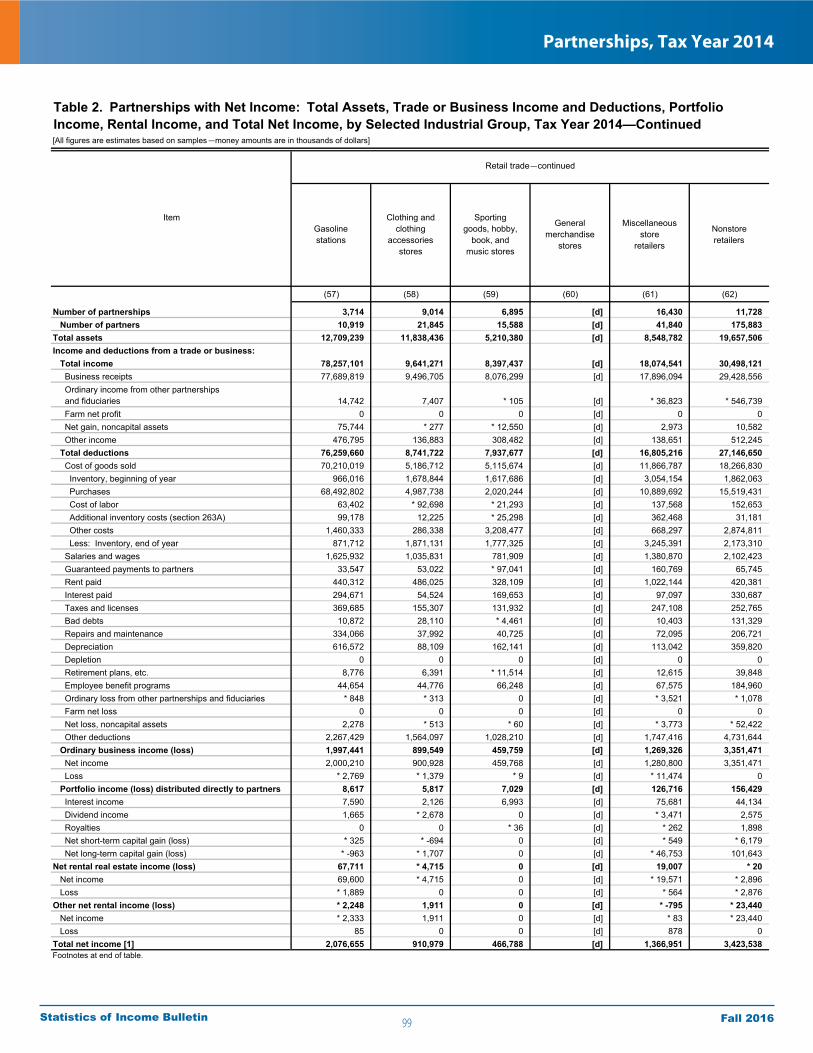
99
Partnerships, Tax Year 2014
Fall 2016Statistics of Income Bulletin
[All figures are estimates based on samples—money amounts are in thousands of dollars]
(57) (58) (59) (60) (61) (62)
Number of partnerships 3,714 9,014 6,895 [d] 16,430 11,728 Number of partners 10,919 21,845 15,588 [d] 41,840 175,883 Total assets 12,709,239 11,838,436 5,210,380 [d] 8,548,782 19,657,506 Income and deductions from a trade or business: Total income 78,257,101 9,641,271 8,397,437 [d] 18,074,541 30,498,121 Business receipts 77,689,819 9,496,705 8,076,299 [d] 17,896,094 29,428,556 Ordinary income from other partnerships and fiduciaries 14,742 7,407 * 105 [d] * 36,823 * 546,739 Farm net profit 0 0 0 [d] 0 0 Net gain, noncapital assets 75,744 * 277 * 12,550 [d] 2,973 10,582 Other income 476,795 136,883 308,482 [d] 138,651 512,245 Total deductions 76,259,660 8,741,722 7,937,677 [d] 16,805,216 27,146,650 Cost of goods sold 70,210,019 5,186,712 5,115,674 [d] 11,866,787 18,266,830 Inventory, beginning of year 966,016 1,678,844 1,617,686 [d] 3,054,154 1,862,063 Purchases 68,492,802 4,987,738 2,020,244 [d] 10,889,692 15,519,431 Cost of labor 63,402 * 92,698 * 21,293 [d] 137,568 152,653 Additional inventory costs (section 263A) 99,178 12,225 * 25,298 [d] 362,468 31,181 Other costs 1,460,333 286,338 3,208,477 [d] 668,297 2,874,811 Less: Inventory, end of year 871,712 1,871,131 1,777,325 [d] 3,245,391 2,173,310 Salaries and wages 1,625,932 1,035,831 781,909 [d] 1,380,870 2,102,423 Guaranteed payments to partners 33,547 53,022 * 97,041 [d] 160,769 65,745 Rent paid 440,312 486,025 328,109 [d] 1,022,144 420,381 Interest paid 294,671 54,524 169,653 [d] 97,097 330,687 Taxes and licenses 369,685 155,307 131,932 [d] 247,108 252,765 Bad debts 10,872 28,110 * 4,461 [d] 10,403 131,329 Repairs and maintenance 334,066 37,992 40,725 [d] 72,095 206,721 Depreciation 616,572 88,109 162,141 [d] 113,042 359,820 Depletion 0 0 0 [d] 0 0 Retirement plans, etc. 8,776 6,391 * 11,514 [d] 12,615 39,848 Employee benefit programs 44,654 44,776 66,248 [d] 67,575 184,960 Ordinary loss from other partnerships and fiduciaries * 848 * 313 0 [d] * 3,521 * 1,078 Farm net loss 0 0 0 [d] 0 0 Net loss, noncapital assets 2,278 * 513 * 60 [d] * 3,773 * 52,422 Other deductions 2,267,429 1,564,097 1,028,210 [d] 1,747,416 4,731,644 Ordinary business income (loss) 1,997,441 899,549 459,759 [d] 1,269,326 3,351,471 Net income 2,000,210 900,928 459,768 [d] 1,280,800 3,351,471 Loss * 2,769 * 1,379 * 9 [d] * 11,474 0 Portfolio income (loss) distributed directly to partners 8,617 5,817 7,029 [d] 126,716 156,429 Interest income 7,590 2,126 6,993 [d] 75,681 44,134 Dividend income 1,665 * 2,678 0 [d] * 3,471 2,575 Royalties 0 0 * 36 [d] * 262 1,898 Net short-term capital gain (loss) * 325 * -694 0 [d] * 549 * 6,179 Net long-term capital gain (loss) * -963 * 1,707 0 [d] * 46,753 101,643 Net rental real estate income (loss) 67,711 * 4,715 0 [d] 19,007 * 20 Net income 69,600 * 4,715 0 [d] * 19,571 * 2,896 Loss * 1,889 0 0 [d] * 564 * 2,876 Other net rental income (loss) * 2,248 1,911 0 [d] * -795 * 23,440 Net income * 2,333 1,911 0 [d] * 83 * 23,440 Loss 85 0 0 [d] 878 0 Total net income [1] 2,076,655 910,979 466,788 [d] 1,366,951 3,423,538 Footnotes at end of table.
Table 2. Partnerships with Net Income: Total Assets, Trade or Business Income and Deductions, Portfolio Income, Rental Income, and Total Net Income, by Selected Industrial Group, Tax Year 2014—Continued
Item
Retail trade—continued
Nonstoreretailers
Gasolinestations
Clothing andclothing
accessoriesstores
Sportinggoods, hobby,
book, andmusic stores
Generalmerchandise
stores
Miscellaneousstore
retailers
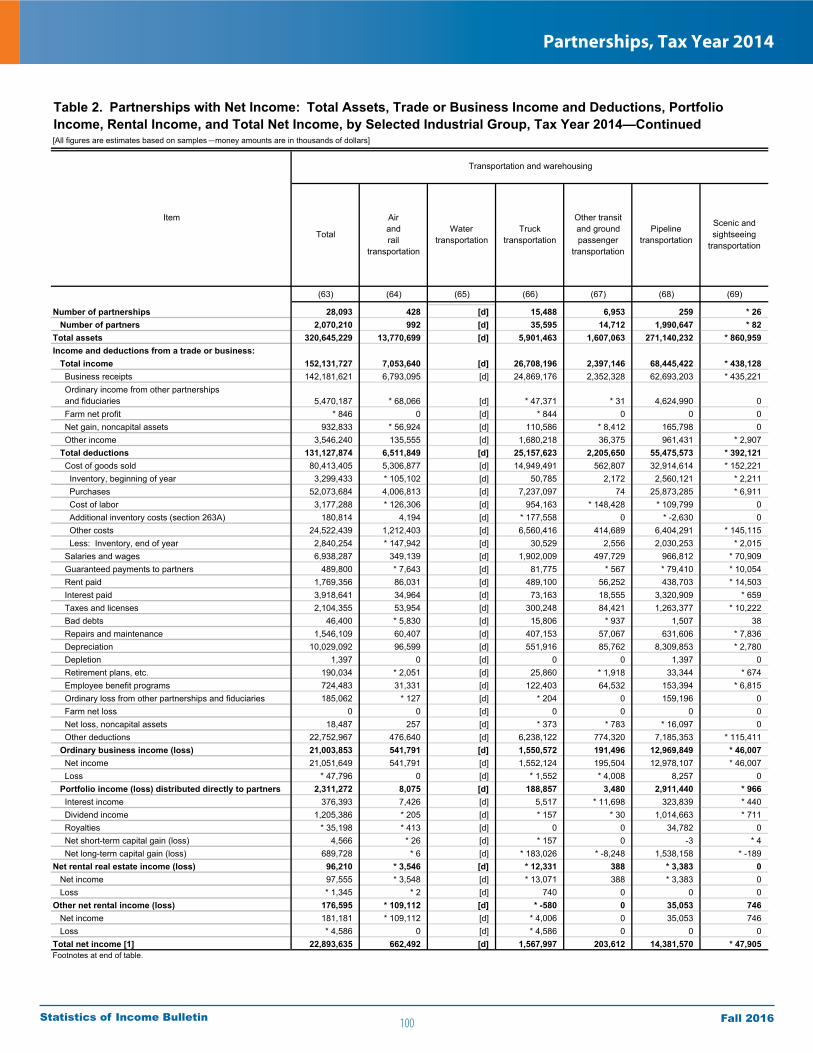
100
Partnerships, Tax Year 2014
Fall 2016Statistics of Income Bulletin
[All figures are estimates based on samples—money amounts are in thousands of dollars]
(63) (64) (65) (66) (67) (68) (69)
Number of partnerships 28,093 428 [d] 15,488 6,953 259 * 26 Number of partners 2,070,210 992 [d] 35,595 14,712 1,990,647 * 82 Total assets 320,645,229 13,770,699 [d] 5,901,463 1,607,063 271,140,232 * 860,959 Income and deductions from a trade or business: Total income 152,131,727 7,053,640 [d] 26,708,196 2,397,146 68,445,422 * 438,128 Business receipts 142,181,621 6,793,095 [d] 24,869,176 2,352,328 62,693,203 * 435,221 Ordinary income from other partnerships and fiduciaries 5,470,187 * 68,066 [d] * 47,371 * 31 4,624,990 0 Farm net profit * 846 0 [d] * 844 0 0 0 Net gain, noncapital assets 932,833 * 56,924 [d] 110,586 * 8,412 165,798 0 Other income 3,546,240 135,555 [d] 1,680,218 36,375 961,431 * 2,907 Total deductions 131,127,874 6,511,849 [d] 25,157,623 2,205,650 55,475,573 * 392,121 Cost of goods sold 80,413,405 5,306,877 [d] 14,949,491 562,807 32,914,614 * 152,221 Inventory, beginning of year 3,299,433 * 105,102 [d] 50,785 2,172 2,560,121 * 2,211 Purchases 52,073,684 4,006,813 [d] 7,237,097 74 25,873,285 * 6,911 Cost of labor 3,177,288 * 126,306 [d] 954,163 * 148,428 * 109,799 0 Additional inventory costs (section 263A) 180,814 4,194 [d] * 177,558 0 * -2,630 0 Other costs 24,522,439 1,212,403 [d] 6,560,416 414,689 6,404,291 * 145,115 Less: Inventory, end of year 2,840,254 * 147,942 [d] 30,529 2,556 2,030,253 * 2,015 Salaries and wages 6,938,287 349,139 [d] 1,902,009 497,729 966,812 * 70,909 Guaranteed payments to partners 489,800 * 7,643 [d] 81,775 * 567 * 79,410 * 10,054 Rent paid 1,769,356 86,031 [d] 489,100 56,252 438,703 * 14,503 Interest paid 3,918,641 34,964 [d] 73,163 18,555 3,320,909 * 659 Taxes and licenses 2,104,355 53,954 [d] 300,248 84,421 1,263,377 * 10,222 Bad debts 46,400 * 5,830 [d] 15,806 * 937 1,507 38 Repairs and maintenance 1,546,109 60,407 [d] 407,153 57,067 631,606 * 7,836 Depreciation 10,029,092 96,599 [d] 551,916 85,762 8,309,853 * 2,780 Depletion 1,397 0 [d] 0 0 1,397 0 Retirement plans, etc. 190,034 * 2,051 [d] 25,860 * 1,918 33,344 * 674 Employee benefit programs 724,483 31,331 [d] 122,403 64,532 153,394 * 6,815 Ordinary loss from other partnerships and fiduciaries 185,062 * 127 [d] * 204 0 159,196 0 Farm net loss 0 0 [d] 0 0 0 0 Net loss, noncapital assets 18,487 257 [d] * 373 * 783 * 16,097 0 Other deductions 22,752,967 476,640 [d] 6,238,122 774,320 7,185,353 * 115,411 Ordinary business income (loss) 21,003,853 541,791 [d] 1,550,572 191,496 12,969,849 * 46,007 Net income 21,051,649 541,791 [d] 1,552,124 195,504 12,978,107 * 46,007 Loss * 47,796 0 [d] * 1,552 * 4,008 8,257 0 Portfolio income (loss) distributed directly to partners 2,311,272 8,075 [d] 188,857 3,480 2,911,440 * 966 Interest income 376,393 7,426 [d] 5,517 * 11,698 323,839 * 440 Dividend income 1,205,386 * 205 [d] * 157 * 30 1,014,663 * 711 Royalties * 35,198 * 413 [d] 0 0 34,782 0 Net short-term capital gain (loss) 4,566 * 26 [d] * 157 0 -3 * 4 Net long-term capital gain (loss) 689,728 * 6 [d] * 183,026 * -8,248 1,538,158 * -189 Net rental real estate income (loss) 96,210 * 3,546 [d] * 12,331 388 * 3,383 0 Net income 97,555 * 3,548 [d] * 13,071 388 * 3,383 0 Loss * 1,345 * 2 [d] 740 0 0 0 Other net rental income (loss) 176,595 * 109,112 [d] * -580 0 35,053 746 Net income 181,181 * 109,112 [d] * 4,006 0 35,053 746 Loss * 4,586 0 [d] * 4,586 0 0 0 Total net income [1] 22,893,635 662,492 [d] 1,567,997 203,612 14,381,570 * 47,905 Footnotes at end of table.
Transportation and warehousing
Table 2. Partnerships with Net Income: Total Assets, Trade or Business Income and Deductions, Portfolio Income, Rental Income, and Total Net Income, by Selected Industrial Group, Tax Year 2014—Continued
Pipelinetransportation
Scenic andsightseeing
transportation
Item
Total
Airandrail
transportation
Watertransportation
Trucktransportation
Other transitand groundpassenger
transportation

101
Partnerships, Tax Year 2014
Fall 2016Statistics of Income Bulletin
[All figures are estimates based on samples—money amounts are in thousands of dollars]
(70) (71) (72) (73) (74) (75) (76)
Number of partnerships 3,894 [d] 762 19,253 3,352 7,009 1,364 Number of partners 14,134 [d] 11,015 74,649 12,972 17,507 4,040 Total assets 10,137,773 [d] 6,822,165 620,228,648 19,678,477 19,578,224 97,066,154 Income and deductions from a trade or business: Total income 21,904,222 [d] 16,588,720 310,933,142 15,550,343 13,996,192 51,020,107 Business receipts 21,043,275 [d] 15,901,532 292,542,407 15,209,100 13,352,952 47,682,466 Ordinary income from other partnerships and fiduciaries 239,325 [d] * 334,569 13,682,763 86,795 117,453 1,742,971 Farm net profit 0 [d] 0 0 0 0 0 Net gain, noncapital assets 8,238 [d] 256,085 1,501,944 40,434 * 103 * 131,920 Other income 613,384 [d] 96,534 3,206,029 214,014 525,684 1,462,751 Total deductions 19,296,646 [d] 14,789,663 247,905,895 13,490,607 11,249,803 42,272,873 Cost of goods sold 12,029,475 [d] 11,335,248 75,934,757 4,286,575 5,653,668 7,979,095 Inventory, beginning of year 340,401 [d] 172,860 3,021,597 445,921 341,532 63,198 Purchases 3,749,133 [d] 10,832,664 33,262,965 1,311,477 440,880 61,348 Cost of labor 1,347,538 [d] * 70,498 771,918 273,457 * 178,182 * 67,851 Additional inventory costs (section 263A) * 228 [d] * 1,464 665,156 77,588 * 85,600 -1,451 Other costs 6,935,016 [d] 461,967 41,769,491 2,638,207 4,706,676 7,879,993 Less: Inventory, end of year 342,842 [d] 204,205 3,556,371 460,076 99,203 91,845 Salaries and wages 1,770,582 [d] 712,671 20,341,443 3,120,220 1,117,477 4,936,279 Guaranteed payments to partners 289,834 [d] * 12,371 1,812,914 340,911 169,811 * 795,713 Rent paid 291,771 [d] 360,378 7,099,481 274,546 376,535 362,796 Interest paid 84,012 [d] 108,736 3,127,420 194,826 207,227 1,193,152 Taxes and licenses 199,278 [d] 132,250 3,859,154 325,399 142,834 540,424 Bad debts 12,775 [d] 8,386 1,822,089 131,611 15,942 207,448 Repairs and maintenance 161,869 [d] 154,616 2,144,236 101,412 75,522 302,972 Depreciation 297,072 [d] 278,292 19,363,999 220,588 129,324 1,552,196 Depletion 0 [d] 0 0 0 0 0 Retirement plans, etc. 90,679 [d] 18,091 1,106,870 83,118 6,888 208,149 Employee benefit programs 211,297 [d] 62,711 1,689,350 262,502 59,131 271,394 Ordinary loss from other partnerships and fiduciaries * 25,409 [d] * 84 76,616 1,417 9,913 * 7,543 Farm net loss 0 [d] 0 0 0 0 0 Net loss, noncapital assets * 878 [d] * 99 58,482 * 985 * 1,759 7,808 Other deductions 3,831,715 [d] 1,605,731 109,469,085 4,146,498 3,283,772 23,907,903 Ordinary business income (loss) 2,607,576 [d] 1,799,056 63,027,247 2,059,736 2,746,389 8,747,234 Net income 2,641,555 [d] 1,799,056 63,082,828 2,103,398 2,750,347 8,754,680 Loss * 33,979 [d] 0 * 55,581 * 43,662 * 3,958 * 7,446 Portfolio income (loss) distributed directly to partners -1,891,095 [d] 1,020,660 5,246,943 505,465 197,663 1,324,034 Interest income 14,367 [d] 8,320 3,317,691 62,485 17,743 245,114 Dividend income 120,707 [d] * 12,456 513,899 * 135 4,354 411,574 Royalties 0 [d] 4 687,591 * 203,727 * 172,526 310,372 Net short-term capital gain (loss) * 4,491 [d] * -108 377,516 * 976 * 879 * 372,437 Net long-term capital gain (loss) * -2,030,659 [d] * 999,989 350,246 238,142 * 2,161 -15,465 Net rental real estate income (loss) * 51,085 [d] * 25,420 31,532 * 7,317 * 1,722 * 800 Net income * 51,689 [d] * 25,420 33,854 * 7,317 * 1,722 * 800 Loss * 604 [d] 0 2,322 0 0 0 Other net rental income (loss) * 24,812 [d] 0 -149,884 * 4,134 * 972 119,922 Net income * 24,812 [d] 0 452,377 * 4,134 1,032 119,922 Loss 0 [d] 0 602,261 [2] * 60 0 Total net income [1] 2,818,547 [d] 1,845,255 67,428,075 2,337,535 2,943,706 9,835,016 Footnotes at end of table.
Transportation and warehousing—continued Information
Couriersand
messengers
Warehousingand
storageTotal
Table 2. Partnerships with Net Income: Total Assets, Trade or Business Income and Deductions, Portfolio Income, Rental Income, and Total Net Income, by Selected Industrial Group, Tax Year 2014—Continued
Item Supportactivities for
transportation
Publishingindustries
(except internet)
Motion pictureand soundrecordingindustries
Broadcasting(except internet)
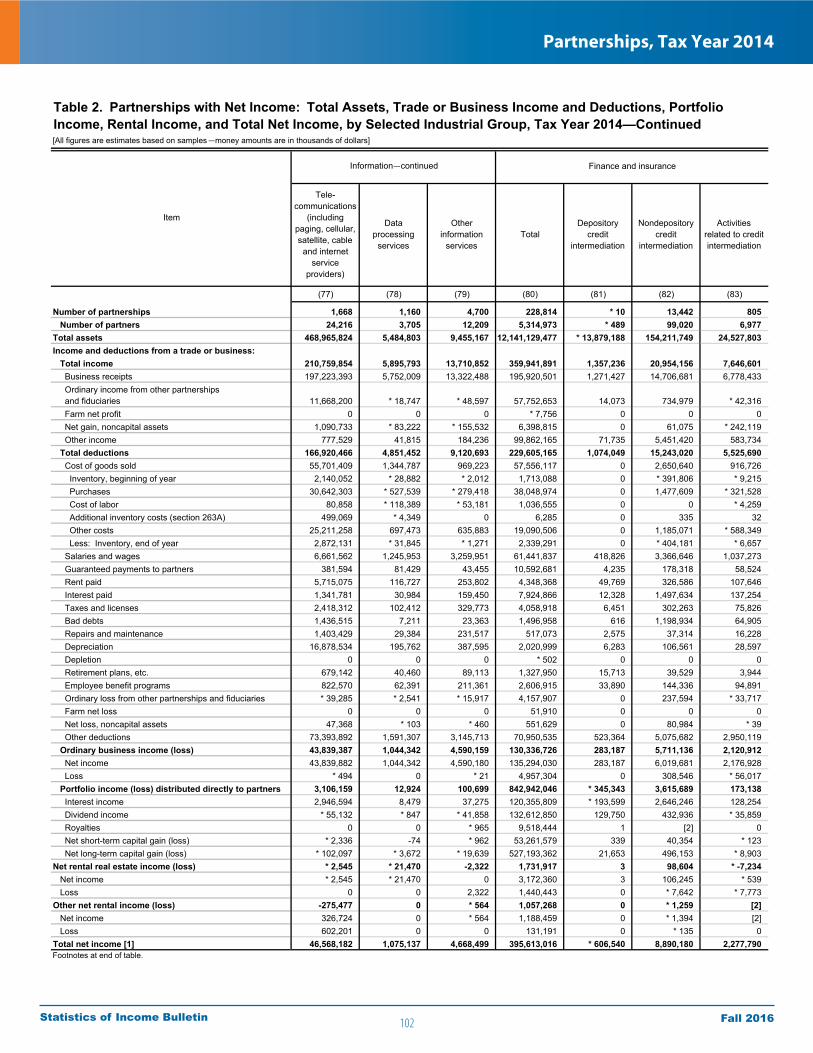
102
Partnerships, Tax Year 2014
Fall 2016Statistics of Income Bulletin
[All figures are estimates based on samples—money amounts are in thousands of dollars]
(77) (78) (79) (80) (81) (82) (83)
Number of partnerships 1,668 1,160 4,700 228,814 * 10 13,442 805 Number of partners 24,216 3,705 12,209 5,314,973 * 489 99,020 6,977 Total assets 468,965,824 5,484,803 9,455,167 12,141,129,477 * 13,879,188 154,211,749 24,527,803 Income and deductions from a trade or business: Total income 210,759,854 5,895,793 13,710,852 359,941,891 1,357,236 20,954,156 7,646,601 Business receipts 197,223,393 5,752,009 13,322,488 195,920,501 1,271,427 14,706,681 6,778,433 Ordinary income from other partnerships and fiduciaries 11,668,200 * 18,747 * 48,597 57,752,653 14,073 734,979 * 42,316 Farm net profit 0 0 0 * 7,756 0 0 0 Net gain, noncapital assets 1,090,733 * 83,222 * 155,532 6,398,815 0 61,075 * 242,119 Other income 777,529 41,815 184,236 99,862,165 71,735 5,451,420 583,734 Total deductions 166,920,466 4,851,452 9,120,693 229,605,165 1,074,049 15,243,020 5,525,690 Cost of goods sold 55,701,409 1,344,787 969,223 57,556,117 0 2,650,640 916,726 Inventory, beginning of year 2,140,052 * 28,882 * 2,012 1,713,088 0 * 391,806 * 9,215 Purchases 30,642,303 * 527,539 * 279,418 38,048,974 0 1,477,609 * 321,528 Cost of labor 80,858 * 118,389 * 53,181 1,036,555 0 0 * 4,259 Additional inventory costs (section 263A) 499,069 * 4,349 0 6,285 0 335 32 Other costs 25,211,258 697,473 635,883 19,090,506 0 1,185,071 * 588,349 Less: Inventory, end of year 2,872,131 * 31,845 * 1,271 2,339,291 0 * 404,181 * 6,657 Salaries and wages 6,661,562 1,245,953 3,259,951 61,441,837 418,826 3,366,646 1,037,273 Guaranteed payments to partners 381,594 81,429 43,455 10,592,681 4,235 178,318 58,524 Rent paid 5,715,075 116,727 253,802 4,348,368 49,769 326,586 107,646 Interest paid 1,341,781 30,984 159,450 7,924,866 12,328 1,497,634 137,254 Taxes and licenses 2,418,312 102,412 329,773 4,058,918 6,451 302,263 75,826 Bad debts 1,436,515 7,211 23,363 1,496,958 616 1,198,934 64,905 Repairs and maintenance 1,403,429 29,384 231,517 517,073 2,575 37,314 16,228 Depreciation 16,878,534 195,762 387,595 2,020,999 6,283 106,561 28,597 Depletion 0 0 0 * 502 0 0 0 Retirement plans, etc. 679,142 40,460 89,113 1,327,950 15,713 39,529 3,944 Employee benefit programs 822,570 62,391 211,361 2,606,915 33,890 144,336 94,891 Ordinary loss from other partnerships and fiduciaries * 39,285 * 2,541 * 15,917 4,157,907 0 237,594 * 33,717 Farm net loss 0 0 0 51,910 0 0 0 Net loss, noncapital assets 47,368 * 103 * 460 551,629 0 80,984 * 39 Other deductions 73,393,892 1,591,307 3,145,713 70,950,535 523,364 5,075,682 2,950,119 Ordinary business income (loss) 43,839,387 1,044,342 4,590,159 130,336,726 283,187 5,711,136 2,120,912 Net income 43,839,882 1,044,342 4,590,180 135,294,030 283,187 6,019,681 2,176,928 Loss * 494 0 * 21 4,957,304 0 308,546 * 56,017 Portfolio income (loss) distributed directly to partners 3,106,159 12,924 100,699 842,942,046 * 345,343 3,615,689 173,138 Interest income 2,946,594 8,479 37,275 120,355,809 * 193,599 2,646,246 128,254 Dividend income * 55,132 * 847 * 41,858 132,612,850 129,750 432,936 * 35,859 Royalties 0 0 * 965 9,518,444 1 [2] 0 Net short-term capital gain (loss) * 2,336 -74 * 962 53,261,579 339 40,354 * 123 Net long-term capital gain (loss) * 102,097 * 3,672 * 19,639 527,193,362 21,653 496,153 * 8,903 Net rental real estate income (loss) * 2,545 * 21,470 -2,322 1,731,917 3 98,604 * -7,234 Net income * 2,545 * 21,470 0 3,172,360 3 106,245 * 539 Loss 0 0 2,322 1,440,443 0 * 7,642 * 7,773 Other net rental income (loss) -275,477 0 * 564 1,057,268 0 * 1,259 [2] Net income 326,724 0 * 564 1,188,459 0 * 1,394 [2] Loss 602,201 0 0 131,191 0 * 135 0 Total net income [1] 46,568,182 1,075,137 4,668,499 395,613,016 * 606,540 8,890,180 2,277,790 Footnotes at end of table.
Information—continued Finance and insurance
Dataprocessing
services
Otherinformation
servicesTotal
Depositorycredit
intermediation
Nondepositorycredit
intermediation
Activitiesrelated to creditintermediation
Table 2. Partnerships with Net Income: Total Assets, Trade or Business Income and Deductions, Portfolio Income, Rental Income, and Total Net Income, by Selected Industrial Group, Tax Year 2014—Continued
Item
Tele-communications
(includingpaging, cellular, satellite, cable
and internet service
providers)
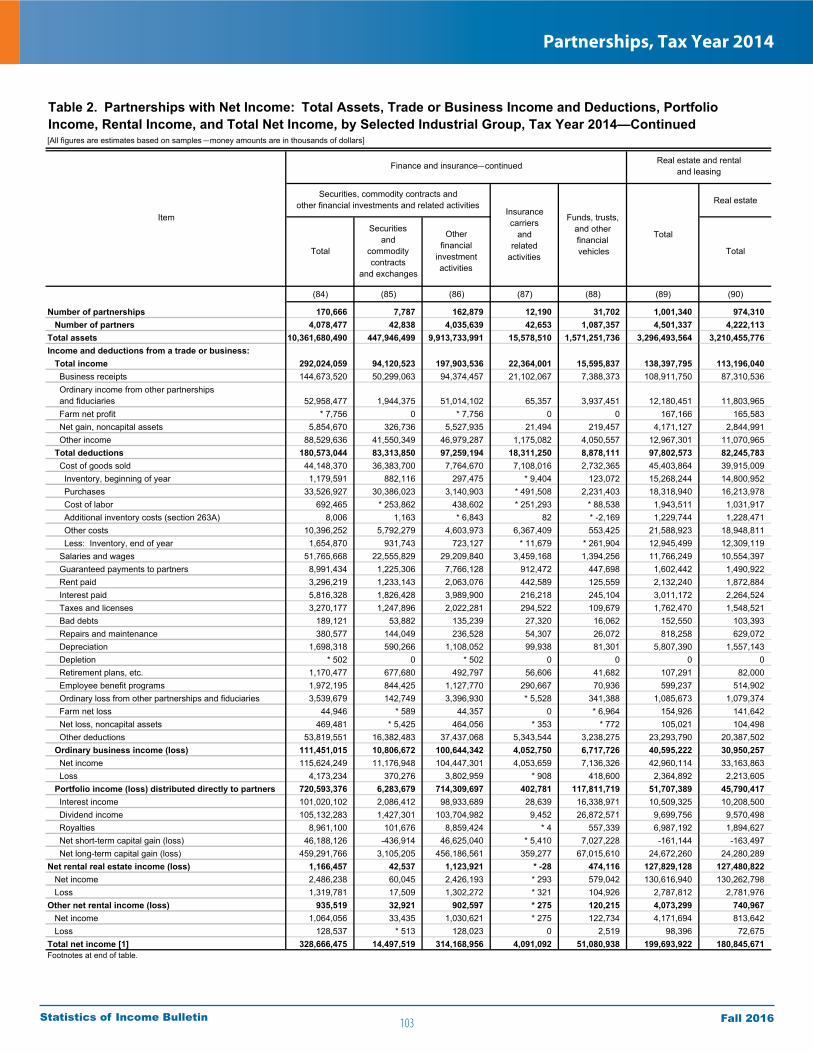
103
Partnerships, Tax Year 2014
Fall 2016Statistics of Income Bulletin
[All figures are estimates based on samples—money amounts are in thousands of dollars]
Real estate
(84) (85) (86) (87) (88) (89) (90)
Number of partnerships 170,666 7,787 162,879 12,190 31,702 1,001,340 974,310 Number of partners 4,078,477 42,838 4,035,639 42,653 1,087,357 4,501,337 4,222,113 Total assets 10,361,680,490 447,946,499 9,913,733,991 15,578,510 1,571,251,736 3,296,493,564 3,210,455,776 Income and deductions from a trade or business: Total income 292,024,059 94,120,523 197,903,536 22,364,001 15,595,837 138,397,795 113,196,040 Business receipts 144,673,520 50,299,063 94,374,457 21,102,067 7,388,373 108,911,750 87,310,536 Ordinary income from other partnerships and fiduciaries 52,958,477 1,944,375 51,014,102 65,357 3,937,451 12,180,451 11,803,965 Farm net profit * 7,756 0 * 7,756 0 0 167,166 165,583 Net gain, noncapital assets 5,854,670 326,736 5,527,935 21,494 219,457 4,171,127 2,844,991 Other income 88,529,636 41,550,349 46,979,287 1,175,082 4,050,557 12,967,301 11,070,965 Total deductions 180,573,044 83,313,850 97,259,194 18,311,250 8,878,111 97,802,573 82,245,783 Cost of goods sold 44,148,370 36,383,700 7,764,670 7,108,016 2,732,365 45,403,864 39,915,009 Inventory, beginning of year 1,179,591 882,116 297,475 * 9,404 123,072 15,268,244 14,800,952 Purchases 33,526,927 30,386,023 3,140,903 * 491,508 2,231,403 18,318,940 16,213,978 Cost of labor 692,465 * 253,862 438,602 * 251,293 * 88,538 1,943,511 1,031,917 Additional inventory costs (section 263A) 8,006 1,163 * 6,843 82 * -2,169 1,229,744 1,228,471 Other costs 10,396,252 5,792,279 4,603,973 6,367,409 553,425 21,588,923 18,948,811 Less: Inventory, end of year 1,654,870 931,743 723,127 * 11,679 * 261,904 12,945,499 12,309,119 Salaries and wages 51,765,668 22,555,829 29,209,840 3,459,168 1,394,256 11,766,249 10,554,397 Guaranteed payments to partners 8,991,434 1,225,306 7,766,128 912,472 447,698 1,602,442 1,490,922 Rent paid 3,296,219 1,233,143 2,063,076 442,589 125,559 2,132,240 1,872,884 Interest paid 5,816,328 1,826,428 3,989,900 216,218 245,104 3,011,172 2,264,524 Taxes and licenses 3,270,177 1,247,896 2,022,281 294,522 109,679 1,762,470 1,548,521 Bad debts 189,121 53,882 135,239 27,320 16,062 152,550 103,393 Repairs and maintenance 380,577 144,049 236,528 54,307 26,072 818,258 629,072 Depreciation 1,698,318 590,266 1,108,052 99,938 81,301 5,807,390 1,557,143 Depletion * 502 0 * 502 0 0 0 0 Retirement plans, etc. 1,170,477 677,680 492,797 56,606 41,682 107,291 82,000 Employee benefit programs 1,972,195 844,425 1,127,770 290,667 70,936 599,237 514,902 Ordinary loss from other partnerships and fiduciaries 3,539,679 142,749 3,396,930 * 5,528 341,388 1,085,673 1,079,374 Farm net loss 44,946 * 589 44,357 0 * 6,964 154,926 141,642 Net loss, noncapital assets 469,481 * 5,425 464,056 * 353 * 772 105,021 104,498 Other deductions 53,819,551 16,382,483 37,437,068 5,343,544 3,238,275 23,293,790 20,387,502 Ordinary business income (loss) 111,451,015 10,806,672 100,644,342 4,052,750 6,717,726 40,595,222 30,950,257 Net income 115,624,249 11,176,948 104,447,301 4,053,659 7,136,326 42,960,114 33,163,863 Loss 4,173,234 370,276 3,802,959 * 908 418,600 2,364,892 2,213,605 Portfolio income (loss) distributed directly to partners 720,593,376 6,283,679 714,309,697 402,781 117,811,719 51,707,389 45,790,417 Interest income 101,020,102 2,086,412 98,933,689 28,639 16,338,971 10,509,325 10,208,500 Dividend income 105,132,283 1,427,301 103,704,982 9,452 26,872,571 9,699,756 9,570,498 Royalties 8,961,100 101,676 8,859,424 * 4 557,339 6,987,192 1,894,627 Net short-term capital gain (loss) 46,188,126 -436,914 46,625,040 * 5,410 7,027,228 -161,144 -163,497 Net long-term capital gain (loss) 459,291,766 3,105,205 456,186,561 359,277 67,015,610 24,672,260 24,280,289 Net rental real estate income (loss) 1,166,457 42,537 1,123,921 * -28 474,116 127,829,128 127,480,822 Net income 2,486,238 60,045 2,426,193 * 293 579,042 130,616,940 130,262,798 Loss 1,319,781 17,509 1,302,272 * 321 104,926 2,787,812 2,781,976 Other net rental income (loss) 935,519 32,921 902,597 * 275 120,215 4,073,299 740,967 Net income 1,064,056 33,435 1,030,621 * 275 122,734 4,171,694 813,642 Loss 128,537 * 513 128,023 0 2,519 98,396 72,675 Total net income [1] 328,666,475 14,497,519 314,168,956 4,091,092 51,080,938 199,693,922 180,845,671 Footnotes at end of table.
Finance and insurance—continued Real estate and rental and leasing
Table 2. Partnerships with Net Income: Total Assets, Trade or Business Income and Deductions, Portfolio Income, Rental Income, and Total Net Income, by Selected Industrial Group, Tax Year 2014—Continued
ItemInsurancecarriers
andrelated
activities
Funds, trusts,and otherfinancial vehicles
Total
Total
Securitiesand
commoditycontracts
and exchanges
Otherfinancial
investmentactivities
Total
Securities, commodity contracts and other financial investments and related activities
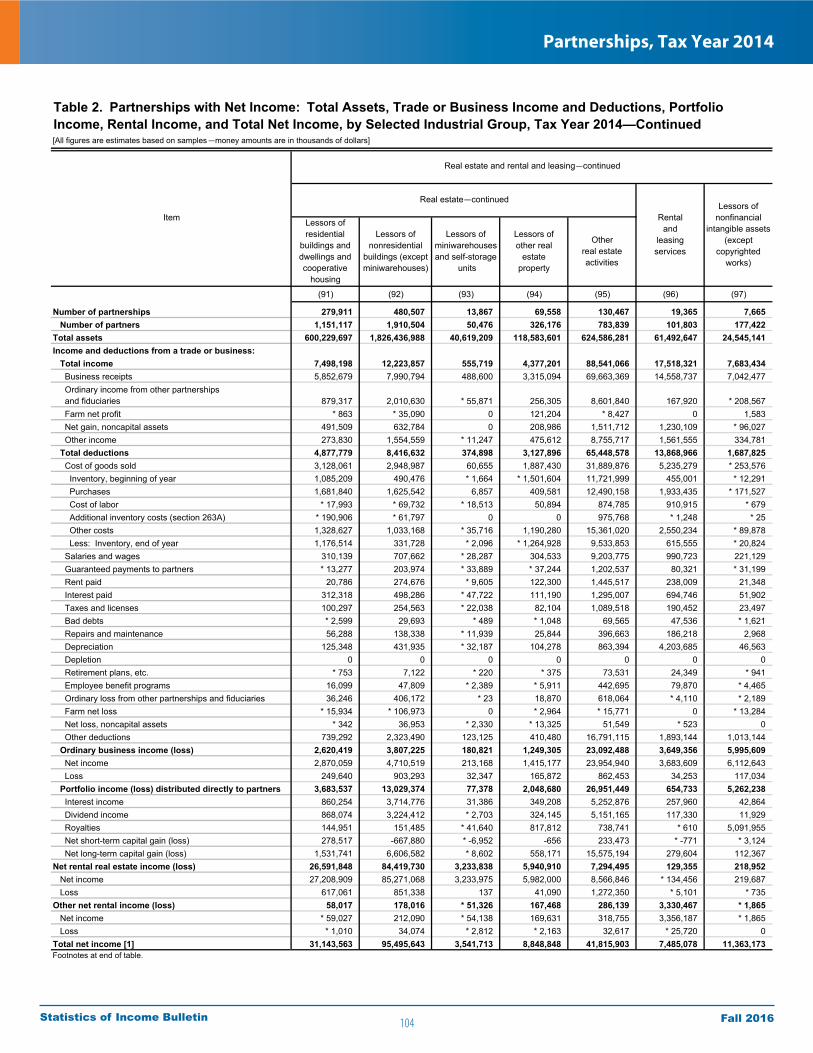
104
Partnerships, Tax Year 2014
Fall 2016Statistics of Income Bulletin
[All figures are estimates based on samples—money amounts are in thousands of dollars]
(91) (92) (93) (94) (95) (96) (97)
Number of partnerships 279,911 480,507 13,867 69,558 130,467 19,365 7,665 Number of partners 1,151,117 1,910,504 50,476 326,176 783,839 101,803 177,422 Total assets 600,229,697 1,826,436,988 40,619,209 118,583,601 624,586,281 61,492,647 24,545,141 Income and deductions from a trade or business: Total income 7,498,198 12,223,857 555,719 4,377,201 88,541,066 17,518,321 7,683,434 Business receipts 5,852,679 7,990,794 488,600 3,315,094 69,663,369 14,558,737 7,042,477 Ordinary income from other partnerships and fiduciaries 879,317 2,010,630 * 55,871 256,305 8,601,840 167,920 * 208,567 Farm net profit * 863 * 35,090 0 121,204 * 8,427 0 1,583 Net gain, noncapital assets 491,509 632,784 0 208,986 1,511,712 1,230,109 * 96,027 Other income 273,830 1,554,559 * 11,247 475,612 8,755,717 1,561,555 334,781 Total deductions 4,877,779 8,416,632 374,898 3,127,896 65,448,578 13,868,966 1,687,825 Cost of goods sold 3,128,061 2,948,987 60,655 1,887,430 31,889,876 5,235,279 * 253,576 Inventory, beginning of year 1,085,209 490,476 * 1,664 * 1,501,604 11,721,999 455,001 * 12,291 Purchases 1,681,840 1,625,542 6,857 409,581 12,490,158 1,933,435 * 171,527 Cost of labor * 17,993 * 69,732 * 18,513 50,894 874,785 910,915 * 679 Additional inventory costs (section 263A) * 190,906 * 61,797 0 0 975,768 * 1,248 * 25 Other costs 1,328,627 1,033,168 * 35,716 1,190,280 15,361,020 2,550,234 * 89,878 Less: Inventory, end of year 1,176,514 331,728 * 2,096 * 1,264,928 9,533,853 615,555 * 20,824 Salaries and wages 310,139 707,662 * 28,287 304,533 9,203,775 990,723 221,129 Guaranteed payments to partners * 13,277 203,974 * 33,889 * 37,244 1,202,537 80,321 * 31,199 Rent paid 20,786 274,676 * 9,605 122,300 1,445,517 238,009 21,348 Interest paid 312,318 498,286 * 47,722 111,190 1,295,007 694,746 51,902 Taxes and licenses 100,297 254,563 * 22,038 82,104 1,089,518 190,452 23,497 Bad debts * 2,599 29,693 * 489 * 1,048 69,565 47,536 * 1,621 Repairs and maintenance 56,288 138,338 * 11,939 25,844 396,663 186,218 2,968 Depreciation 125,348 431,935 * 32,187 104,278 863,394 4,203,685 46,563 Depletion 0 0 0 0 0 0 0 Retirement plans, etc. * 753 7,122 * 220 * 375 73,531 24,349 * 941 Employee benefit programs 16,099 47,809 * 2,389 * 5,911 442,695 79,870 * 4,465 Ordinary loss from other partnerships and fiduciaries 36,246 406,172 * 23 18,870 618,064 * 4,110 * 2,189 Farm net loss * 15,934 * 106,973 0 * 2,964 * 15,771 0 * 13,284 Net loss, noncapital assets * 342 36,953 * 2,330 * 13,325 51,549 * 523 0 Other deductions 739,292 2,323,490 123,125 410,480 16,791,115 1,893,144 1,013,144 Ordinary business income (loss) 2,620,419 3,807,225 180,821 1,249,305 23,092,488 3,649,356 5,995,609 Net income 2,870,059 4,710,519 213,168 1,415,177 23,954,940 3,683,609 6,112,643 Loss 249,640 903,293 32,347 165,872 862,453 34,253 117,034 Portfolio income (loss) distributed directly to partners 3,683,537 13,029,374 77,378 2,048,680 26,951,449 654,733 5,262,238 Interest income 860,254 3,714,776 31,386 349,208 5,252,876 257,960 42,864 Dividend income 868,074 3,224,412 * 2,703 324,145 5,151,165 117,330 11,929 Royalties 144,951 151,485 * 41,640 817,812 738,741 * 610 5,091,955 Net short-term capital gain (loss) 278,517 -667,880 * -6,952 -656 233,473 * -771 * 3,124 Net long-term capital gain (loss) 1,531,741 6,606,582 * 8,602 558,171 15,575,194 279,604 112,367 Net rental real estate income (loss) 26,591,848 84,419,730 3,233,838 5,940,910 7,294,495 129,355 218,952 Net income 27,208,909 85,271,068 3,233,975 5,982,000 8,566,846 * 134,456 219,687 Loss 617,061 851,338 137 41,090 1,272,350 * 5,101 * 735 Other net rental income (loss) 58,017 178,016 * 51,326 167,468 286,139 3,330,467 * 1,865 Net income * 59,027 212,090 * 54,138 169,631 318,755 3,356,187 * 1,865 Loss * 1,010 34,074 * 2,812 * 2,163 32,617 * 25,720 0 Total net income [1] 31,143,563 95,495,643 3,541,713 8,848,848 41,815,903 7,485,078 11,363,173 Footnotes at end of table.
Real estate—continued
Rentaland
leasingservices
Real estate and rental and leasing—continued
Table 2. Partnerships with Net Income: Total Assets, Trade or Business Income and Deductions, Portfolio Income, Rental Income, and Total Net Income, by Selected Industrial Group, Tax Year 2014—Continued
ItemLessors of
nonfinancialintangible assets
(exceptcopyrighted
works)
Lessors ofresidential
buildings and dwellings and cooperative
housing
Lessors ofnonresidential
buildings (except miniwarehouses)
Lessors ofminiwarehousesand self-storage
units
Lessors ofother real
estateproperty
Otherreal estateactivities

105
Partnerships, Tax Year 2014
Fall 2016Statistics of Income Bulletin
[All figures are estimates based on samples—money amounts are in thousands of dollars]
(98) (99) (100) (101) (102) (103) (104) (105)
Number of partnerships 126,490 24,965 18,404 15,813 4,014 7,592 55,702 35,999 Number of partners 463,828 147,565 75,560 40,222 8,790 20,566 171,125 120,121 Total assets 182,938,012 40,630,639 23,815,985 8,468,221 2,753,917 14,099,548 93,169,702 56,789,927 Income and deductions from a trade or business: Total income 423,543,254 149,808,810 79,790,200 22,012,432 2,407,608 25,245,191 144,279,012 85,337,467 Business receipts 408,450,057 148,437,045 78,239,406 21,479,430 2,383,871 24,880,976 133,029,331 76,423,971 Ordinary income from other partnerships and fiduciaries 5,638,843 328,477 169,856 360,603 0 * 55,762 4,724,144 4,448,079 Farm net profit 0 0 0 0 0 0 0 0 Net gain, noncapital assets 172,141 18,712 3,204 2,771 * 10,013 36,206 101,235 58,869 Other income 9,282,213 1,024,576 1,377,734 169,628 13,725 272,248 6,424,302 4,406,548 Total deductions 320,260,463 93,961,968 63,288,270 18,679,581 1,987,200 21,966,125 120,377,319 69,204,944 Cost of goods sold 74,801,445 1,338,236 6,781,938 8,747,124 767,880 9,605,925 47,560,342 18,990,805 Inventory, beginning of year 916,853 * 2,705 * 947 56,060 * 56,982 94,550 705,609 418,729 Purchases 23,982,190 * 10,840 * 307,962 1,149,759 * 437,556 3,607,346 18,468,727 6,064,324 Cost of labor 14,652,350 * 118,130 * 4,687,332 2,101,022 * 137,805 2,391,331 5,216,730 2,922,507 Additional inventory costs (section 263A) 620,467 * 15,419 * 37,970 * -179 * 2,064 * 244,731 320,462 * 118,226 Other costs 35,639,450 1,193,115 1,749,139 5,514,670 202,795 3,360,182 23,619,549 9,932,146 Less: Inventory, end of year 1,009,867 * 1,972 * 1,413 74,208 * 69,323 92,215 770,736 465,127 Salaries and wages 101,741,508 41,215,990 24,353,366 4,194,750 435,634 4,642,859 26,898,909 19,762,195 Guaranteed payments to partners 19,765,300 9,837,728 4,271,587 751,654 131,714 920,575 3,852,042 2,758,440 Rent paid 14,266,205 9,140,352 2,201,427 509,346 78,629 287,230 2,049,221 1,129,576 Interest paid 1,392,225 238,462 228,432 58,481 11,387 140,781 714,683 392,716 Taxes and licenses 9,011,392 3,817,287 1,927,472 446,517 48,887 458,463 2,312,766 1,614,679 Bad debts 296,397 166,405 17,605 16,266 * 912 22,395 72,815 41,169 Repairs and maintenance 1,372,324 702,603 224,446 73,843 8,052 52,933 310,446 140,900 Depreciation 2,985,108 1,232,510 509,560 247,499 23,480 202,616 769,443 461,248 Depletion 0 0 0 0 0 0 0 0 Retirement plans, etc. 4,412,339 1,780,438 1,170,708 134,432 * 5,294 136,249 1,185,217 1,037,615 Employee benefit programs 6,222,252 2,537,432 1,368,910 285,672 27,034 322,564 1,680,640 1,278,819 Ordinary loss from other partnerships and fiduciaries 137,989 36,911 4,393 * 1,363 0 * 15,249 80,073 61,966 Farm net loss 0 0 0 0 0 0 0 0 Net loss, noncapital assets 90,425 67,415 4,037 * 378 [2] * 1,145 17,449 3,497 Other deductions 83,765,555 21,850,198 20,224,390 3,212,256 448,298 5,157,141 32,873,273 21,531,319 Ordinary business income (loss) 103,282,791 55,846,842 16,501,930 3,332,851 420,408 3,279,067 23,901,693 16,132,523 Net income 103,390,925 55,847,949 16,502,323 3,340,217 420,408 3,340,529 23,939,499 16,163,808 Loss 108,134 * 1,107 * 393 * 7,366 0 * 61,463 37,806 31,285 Portfolio income (loss) distributed directly to partners 3,816,849 98,522 312,323 239,090 171,659 371,052 2,624,202 1,194,790 Interest income 892,854 32,143 23,910 61,238 104 167,814 607,646 491,711 Dividend income 368,430 9,742 76,065 129,008 0 11,093 142,522 106,900 Royalties 927,253 1,457 0 * 1,872 * 63,515 * 50,360 810,050 25,721 Net short-term capital gain (loss) -81,667 1,538 * 735 * 19,431 0 * -4 -103,366 -107,838 Net long-term capital gain (loss) 1,709,979 53,644 211,613 27,543 * 108,040 * 141,789 1,167,351 678,296 Net rental real estate income (loss) 255,375 29,793 24,309 * 1,039 0 * 6,038 194,195 152,152 Net income 288,686 36,280 * 24,361 * 2,542 0 * 6,038 219,465 175,075 Loss 33,312 6,487 * 52 * 1,503 0 0 25,270 22,923 Other net rental income (loss) 36,281 -136 * 1,937 * -5,127 0 1,165 38,440 4,358 Net income 45,740 * 1,188 * 1,937 0 0 1,165 41,449 * 6,977 Loss 9,459 * 1,323 0 * 5,127 0 0 * 3,009 * 2,620 Total net income [1] 105,762,984 55,919,841 16,628,152 3,520,881 484,027 3,515,537 25,694,546 16,913,365 Footnotes at end of table.
Table 2. Partnerships with Net Income: Total Assets, Trade or Business Income and Deductions, Portfolio Income, Rental Income, and Total Net Income, by Selected Industrial Group, Tax Year 2014—Continued
Item
Professional, scientific, and technical services
Other professional, scientific, and technical services
Total
Management,scientific, and
technicalconsultingservices
Total Legalservices
Accounting,tax preparation,
bookkeepingand payroll
services
Architectural,engineeringand related
services
Specializeddesign
services
Computersystems
design andrelated
services

106
Partnerships, Tax Year 2014
Fall 2016Statistics of Income Bulletin
[All figures are estimates based on samples—money amounts are in thousands of dollars]
(106) (107) (108) (109) (110) (111) (112)
Number of partnerships 8,017 11,686 16,352 42,149 39,861 2,288 13,183 Number of partners 18,468 32,536 940,852 100,646 95,172 5,474 31,120 Total assets 8,405,347 27,974,428 481,855,319 65,521,370 60,901,100 4,620,270 2,549,175 Income and deductions from a trade or business: Total income 21,465,750 37,475,795 33,707,440 99,859,633 91,214,134 8,645,498 4,237,698 Business receipts 21,049,203 35,556,157 15,479,784 88,010,130 79,519,507 8,490,622 4,185,231 Ordinary income from other partnerships and fiduciaries 77,397 198,668 14,086,907 1,312,845 1,309,784 * 3,061 * 38,602 Farm net profit 0 0 * 2,987 0 0 0 0 Net gain, noncapital assets * 33,846 8,520 1,195,184 20,516 15,819 4,697 * 338 Other income 305,304 1,712,449 2,942,577 10,516,142 10,369,024 147,118 * 13,527 Total deductions 18,917,697 32,254,679 18,199,499 89,321,014 81,707,349 7,613,665 3,492,007 Cost of goods sold 9,561,172 19,008,365 8,389,566 36,713,962 32,544,955 4,169,008 552,185 Inventory, beginning of year 81,748 205,132 1,215,795 300,795 267,692 33,103 * 30,682 Purchases 2,176,732 10,227,672 6,089,237 6,008,645 5,523,354 485,291 * 65,737 Cost of labor 259,427 2,034,796 867,677 19,065,338 18,425,704 639,634 * 198,301 Additional inventory costs (section 263A) * 126,105 * 76,131 8,767 376,972 376,983 * -11 * 50 Other costs 7,035,248 6,652,155 1,729,633 11,365,086 8,323,986 3,041,099 * 295,888 Less: Inventory, end of year 118,088 187,521 1,521,543 402,873 372,765 30,108 * 38,472 Salaries and wages 3,081,596 4,055,118 2,937,541 21,626,539 20,609,371 1,017,168 908,252 Guaranteed payments to partners 348,334 745,268 463,827 1,107,109 1,080,921 * 26,187 * 90,354 Rent paid 417,426 502,219 294,398 1,548,845 1,444,723 104,122 191,116 Interest paid 137,532 184,434 996,923 735,798 674,125 61,673 35,837 Taxes and licenses 304,519 393,568 230,648 2,328,139 2,183,102 145,037 107,225 Bad debts 18,410 13,236 89,635 158,636 150,937 7,699 * 48,063 Repairs and maintenance 87,518 82,029 115,129 499,838 310,766 189,073 19,570 Depreciation 141,054 167,142 216,247 928,870 698,147 230,724 46,502 Depletion 0 0 8,825 * 37,847 0 * 37,847 0 Retirement plans, etc. 52,774 94,829 24,626 197,043 185,196 11,848 10,903 Employee benefit programs 165,768 236,053 185,891 1,051,435 957,637 93,798 48,912 Ordinary loss from other partnerships and fiduciaries * 8,939 9,168 494,682 29,438 16,305 * 13,133 * 5,400 Farm net loss 0 0 * 2,885 0 0 0 0 Net loss, noncapital assets 13,447 * 504 * 1,173 14,166 13,976 * 189 * 228 Other deductions 4,579,208 6,762,746 3,747,504 22,343,349 20,837,190 1,506,160 1,427,461 Ordinary business income (loss) 2,548,053 5,221,117 15,507,941 10,538,618 9,506,785 1,031,833 745,691 Net income 2,548,475 5,227,216 16,432,975 10,618,516 9,586,682 1,031,833 745,691 Loss 422 * 6,099 925,034 * 79,897 * 79,897 0 0 Portfolio income (loss) distributed directly to partners 175,685 1,253,726 30,658,866 809,642 757,132 52,510 6,172 Interest income 20,106 95,829 4,699,912 245,644 197,560 48,084 1,129 Dividend income 774 34,847 9,393,340 53,521 53,287 * 233 * 330 Royalties * 7 784,322 865,448 * 121,292 * 121,292 0 * 3,595 Net short-term capital gain (loss) * -5 4,477 932,256 -7,815 -7,815 0 * -6 Net long-term capital gain (loss) 154,803 334,251 14,767,909 397,000 392,807 * 4,193 * 1,124 Net rental real estate income (loss) * 1,187 40,856 763,433 44,400 44,553 * -154 * 7,930 Net income * 1,187 43,202 883,301 47,300 47,208 * 93 * 7,930 Loss 0 * 2,347 119,868 * 2,901 * 2,655 * 246 0 Other net rental income (loss) * 129 * 33,954 49,463 9,266 * 12,648 * -3,381 * 70 Net income * 133 * 34,339 92,356 * 12,866 * 12,649 * 217 * 70 Loss 4 * 386 42,893 * 3,599 * 1 * 3,598 0 Total net income [1] 2,570,256 6,210,924 31,279,537 11,012,741 9,936,125 1,076,616 758,744 Footnotes at end of table.
Table 2. Partnerships with Net Income: Total Assets, Trade or Business Income and Deductions, Portfolio Income, Rental Income, and Total Net Income, by Selected Industrial Group, Tax Year 2014—Continued
Item
Other professional, scientific, and technical services—continued
Professional, scientific, and technical services—continued
Managementof companies
(holdingcompanies)
Administrative and support and waste management and remediation services
Educationalservices
Total
Administrativeand
supportservices
Wastemanagement
andremediation
services
Advertisingand related
services
Othermiscellaneousprofessional,scientific and
technicalservices

107
Partnerships, Tax Year 2014
Fall 2016Statistics of Income Bulletin
[All figures are estimates based on samples—money amounts are in thousands of dollars]
(113) (114) (115) (116) (117) (118) (119)
Number of partnerships 54,499 23,989 8,624 5,324 3,620 1,889 * 221 Number of partners 238,877 98,302 20,439 46,155 22,231 6,234 * 1,706 Total assets 114,639,111 13,587,936 3,379,220 21,169,232 6,077,277 1,668,073 * 602,871 Income and deductions from a trade or business: Total income 214,705,340 66,520,374 8,292,594 32,543,457 12,765,933 6,028,350 * 1,458,600 Business receipts 199,148,917 57,239,664 7,894,891 30,960,798 11,022,001 5,999,167 * 1,436,702 Ordinary income from other partnerships and fiduciaries 2,917,258 361,013 * 350,090 645,766 533,949 * 605 * 128 Farm net profit 0 0 0 0 0 0 0 Net gain, noncapital assets 177,894 4,955 * 21 15,382 * 41,461 * 6,275 * 12,025 Other income 12,461,271 8,914,743 47,591 921,511 1,168,522 22,302 * 9,745 Total deductions 175,303,494 51,380,488 6,669,215 23,712,429 9,846,551 5,531,282 * 1,294,698 Cost of goods sold 12,572,686 2,976,121 933,089 1,263,248 1,299,010 1,377,682 * 546,970 Inventory, beginning of year 169,864 20,884 * 36,913 50,910 * 13,744 * 14,496 0 Purchases 3,194,038 1,159,115 388,706 632,806 239,975 271,346 106,194 Cost of labor 3,508,370 275,730 * 238,130 * 146,452 310,278 * 659,898 * 157,613 Additional inventory costs (section 263A) * 169,792 * 63,182 * 3,028 * 38,857 * 6 0 0 Other costs 5,732,845 1,479,443 * 317,924 451,977 749,888 449,801 * 283,162 Less: Inventory, end of year 202,223 22,232 * 51,612 57,753 * 14,882 * 17,859 0 Salaries and wages 51,811,808 17,595,756 2,128,365 5,082,136 2,391,978 2,155,876 * 273,306 Guaranteed payments to partners 5,705,561 4,896,142 156,272 157,930 256,617 117,292 * 15,661 Rent paid 8,794,926 2,366,316 368,969 1,219,612 458,202 170,495 * 24,632 Interest paid 1,564,485 164,307 87,717 158,173 89,049 15,618 * 13,145 Taxes and licenses 6,371,921 1,218,877 189,508 712,745 261,757 227,568 * 26,336 Bad debts 3,928,522 81,721 20,843 439,292 128,617 27,953 * 22,115 Repairs and maintenance 2,354,027 476,018 32,098 401,150 323,868 24,159 * 5,750 Depreciation 3,380,784 493,001 59,199 514,998 301,794 47,764 * 27,022 Depletion 0 0 0 0 0 0 0 Retirement plans, etc. 1,118,543 860,950 17,416 57,696 48,460 9,360 * 3,111 Employee benefit programs 4,373,784 857,702 121,595 557,845 278,296 101,040 * 15,936 Ordinary loss from other partnerships and fiduciaries 31,144 5,733 * 1,694 * 5,842 * 2,804 * 928 0 Farm net loss 0 0 0 0 0 0 0 Net loss, noncapital assets 29,389 603 0 8,458 * 1,531 0 * 33 Other deductions 73,265,914 19,387,241 2,552,448 13,133,303 4,004,567 1,255,548 * 320,681 Ordinary business income (loss) 39,401,846 15,139,886 1,623,380 8,831,028 2,919,383 497,067 * 163,902 Net income 39,447,934 15,142,310 1,623,380 8,831,028 2,919,383 497,067 * 163,902 Loss 46,088 * 2,424 0 0 0 0 0 Portfolio income (loss) distributed directly to partners 2,139,711 759,622 55,802 142,246 238,193 279 * 107 Interest income 488,639 15,497 3,300 10,285 3,579 200 * 107 Dividend income 11,807 3,425 * 894 * 174 * 3,522 * 79 0 Royalties * 55,026 2 0 0 0 0 0 Net short-term capital gain (loss) 58,586 * -213 * 56,997 * 587 -1 0 0 Net long-term capital gain (loss) 1,525,653 740,912 * -5,389 131,201 * 231,092 0 0 Net rental real estate income (loss) 152,051 41,630 * 2,589 * 4,515 * -2,477 * -125 0 Net income 205,118 45,182 * 2,589 * 4,515 * 1,981 0 0 Loss 53,067 * 3,552 0 0 * 4,457 * 125 0 Other net rental income (loss) 94,065 * 23,800 0 * 766 * 12,716 0 0 Net income 94,065 * 23,800 0 * 766 * 12,716 0 0 Loss 0 0 0 0 0 0 0 Total net income [1] 40,203,434 15,224,239 1,630,164 8,846,768 2,936,723 497,221 * 164,009 Footnotes at end of table.
Table 2. Partnerships with Net Income: Total Assets, Trade or Business Income and Deductions, Portfolio Income, Rental Income, and Total Net Income, by Selected Industrial Group, Tax Year 2014—Continued
Item
Health care and social assistance
Officesof otherhealth
practitioners
Outpatientcare
centers
Medicaland
diagnosticlaboratories
Homehealthcare
services
Otherambulatoryhealth care
services
TotalOffices ofphysicians
and dentists

108
Partnerships, Tax Year 2014
Fall 2016Statistics of Income Bulletin
[All figures are estimates based on samples—money amounts are in thousands of dollars]
(120) (121) (122) (123) (124) (125) (126)
Number of partnerships 640 5,339 4,853 35,232 21,655 * 10 13,567 Number of partners 9,573 23,581 10,655 259,078 212,716 * 20 46,341 Total assets 38,848,640 27,828,125 1,477,738 71,204,197 40,353,469 * 59,532 30,791,195 Income and deductions from a trade or business: Total income 43,636,326 40,465,177 2,994,528 50,790,797 28,839,800 * 126,506 21,824,491 Business receipts 41,952,536 39,704,461 2,938,696 43,648,817 23,448,787 * 126,022 20,074,008 Ordinary income from other partnerships and fiduciaries 861,594 164,113 0 2,562,142 1,753,390 0 808,752 Farm net profit 0 0 0 0 0 0 0 Net gain, noncapital assets 18,048 79,719 * 9 276,034 196,627 * 26 79,382 Other income 804,148 516,884 * 55,823 4,303,803 3,440,996 * 459 862,349 Total deductions 36,846,685 37,506,777 2,515,370 41,256,601 23,692,420 * 123,141 17,441,040 Cost of goods sold 859,798 2,925,517 * 391,252 6,567,220 3,796,518 * 49,029 2,721,673 Inventory, beginning of year * 18,037 * 14,222 * 658 394,159 73,032 * 2,871 318,256 Purchases * 138,879 143,601 * 113,415 1,772,098 462,374 * 25,701 1,284,022 Cost of labor 137,067 1,583,202 0 845,573 667,148 * 23,177 * 155,249 Additional inventory costs (section 263A) * 4 * 64,717 0 4,292 * -627 0 * 4,919 Other costs * 585,092 1,137,848 * 277,712 3,960,236 2,674,503 0 1,285,733 Less: Inventory, end of year * 19,279 * 18,073 * 533 409,138 79,913 * 2,721 326,505 Salaries and wages 8,040,362 13,173,566 970,463 11,594,883 7,960,990 * 22,393 3,611,500 Guaranteed payments to partners 22,055 56,103 * 27,488 463,200 289,881 0 173,319 Rent paid 979,501 3,010,027 197,173 1,811,884 554,655 * 11,417 1,245,812 Interest paid 441,001 539,135 56,341 1,037,458 627,262 * 4 410,192 Taxes and licenses 1,276,542 2,343,208 115,380 2,575,066 578,550 * 4,522 1,991,994 Bad debts 2,933,494 271,455 * 3,032 30,912 22,281 * 182 8,448 Repairs and maintenance 688,215 370,469 32,300 607,124 222,627 * 3,965 380,532 Depreciation 1,272,523 640,161 24,321 1,866,965 620,466 * 967 1,245,532 Depletion 0 0 0 0 0 0 0 Retirement plans, etc. 64,897 52,942 * 3,710 284,612 266,836 0 17,776 Employee benefit programs 1,331,747 1,079,409 * 30,214 540,397 380,951 0 159,446 Ordinary loss from other partnerships and fiduciaries 1,710 12,230 202 42,614 37,745 0 * 4,870 Farm net loss 0 0 0 * 4,445 0 0 * 4,445 Net loss, noncapital assets 14,437 4,317 9 23,706 13,161 0 10,545 Other deductions 18,920,403 13,028,238 663,486 13,806,116 8,320,499 * 30,662 5,454,955 Ordinary business income (loss) 6,789,641 2,958,400 479,158 9,534,196 5,147,380 * 3,365 4,383,451 Net income 6,797,798 2,993,908 479,158 9,594,818 5,184,392 * 3,365 4,407,061 Loss 8,157 * 35,508 0 * 60,622 * 37,012 0 * 23,610 Portfolio income (loss) distributed directly to partners 438,694 461,208 * 43,560 2,342,220 2,034,632 * 6 307,582 Interest income 272,977 182,561 * 133 162,512 148,151 * 6 14,355 Dividend income 972 * 2,740 0 80,762 33,114 0 47,648 Royalties 0 * 55,025 0 185,743 170,503 0 * 15,240 Net short-term capital gain (loss) * 288 * 928 0 -11,958 -11,760 0 * -198 Net long-term capital gain (loss) 164,456 219,954 43,427 1,925,161 1,694,624 0 230,537 Net rental real estate income (loss) -18,280 124,199 0 69,487 22,101 0 47,385 Net income 25,433 125,418 0 86,937 30,763 0 56,175 Loss 43,713 * 1,219 0 * 17,451 * 8,661 0 * 8,790 Other net rental income (loss) 37,410 * 19,374 0 7,760 2,910 0 * 4,849 Net income 37,410 * 19,374 0 8,399 3,255 0 * 5,143 Loss 0 0 0 639 * 345 0 * 294 Total net income [1] 7,082,720 3,342,299 479,292 10,040,460 5,524,159 * 3,371 4,512,929 Footnotes at end of table.
Table 2. Partnerships with Net Income: Total Assets, Trade or Business Income and Deductions, Portfolio Income, Rental Income, and Total Net Income, by Selected Industrial Group, Tax Year 2014—Continued
Item
Health care and social assistance—continued Arts, entertainment, and recreation
Museums,historical sites,
and similarinstitutions
Amusement,gambling,
and recreationindustries
Hospitals
Nursingand
residentialcare
facilities
Socialassistance
Total
Performing arts,spectator sports
and relatedindustries

109
Partnerships, Tax Year 2014
Fall 2016Statistics of Income Bulletin
[All figures are estimates based on samples—money amounts are in thousands of dollars]
Repair and maintenance
(127) (128) (129) (130) (131)
Number of partnerships 73,576 19,115 54,461 52,642 24,609 Number of partners 276,654 88,292 188,362 212,380 55,026 Total assets 135,502,214 106,051,085 29,451,130 13,233,362 6,139,298 Income and deductions from a trade or business: Total income 139,335,817 51,261,620 88,074,197 23,920,853 13,888,542 Business receipts 134,613,479 48,877,726 85,735,753 23,424,172 13,759,496 Ordinary income from other partnerships and fiduciaries 1,711,620 1,031,783 679,837 * 81,894 * 2,909 Farm net profit * 176 0 * 176 0 0 Net gain, noncapital assets 399,140 185,095 214,045 162,080 20,245 Other income 2,611,402 1,167,016 1,444,386 252,707 105,892 Total deductions 125,274,080 44,342,407 80,931,673 20,779,775 12,440,286 Cost of goods sold 40,532,301 5,858,535 34,673,766 8,575,482 6,622,889 Inventory, beginning of year 1,316,278 361,683 954,595 494,690 362,354 Purchases 28,405,194 2,148,310 26,256,883 5,107,759 4,514,416 Cost of labor 6,452,240 1,244,715 5,207,525 1,593,037 1,284,894 Additional inventory costs (section 263A) 329,417 34,177 295,240 88,778 * 84,294 Other costs 5,478,978 2,434,168 3,044,810 1,832,303 808,436 Less: Inventory, end of year 1,449,806 364,517 1,085,288 541,085 431,504 Salaries and wages 23,624,656 8,003,079 15,621,577 4,058,809 1,854,750 Guaranteed payments to partners 722,605 214,624 507,981 530,794 306,169 Rent paid 6,969,362 1,211,805 5,757,557 1,315,272 462,127 Interest paid 3,917,587 3,419,924 497,663 304,017 158,816 Taxes and licenses 5,959,557 3,063,987 2,895,571 614,845 311,051 Bad debts 70,021 55,776 14,245 13,307 12,215 Repairs and maintenance 2,585,443 1,250,727 1,334,716 265,242 170,971 Depreciation 5,091,102 3,450,938 1,640,163 395,029 235,860 Depletion 0 0 0 0 0 Retirement plans, etc. 60,719 33,002 27,717 20,666 11,622 Employee benefit programs 1,225,953 752,351 473,601 195,000 72,824 Ordinary loss from other partnerships and fiduciaries 35,007 31,089 3,918 * 5,391 0 Farm net loss 0 0 0 0 0 Net loss, noncapital assets 51,036 10,952 40,084 * 267 * 74 Other deductions 34,428,730 16,985,616 17,443,114 4,485,654 2,220,918 Ordinary business income (loss) 14,061,737 6,919,213 7,142,524 3,141,078 1,448,256 Net income 14,285,786 7,127,153 7,158,633 3,149,368 1,448,256 Loss 224,049 207,940 * 16,109 * 8,291 0 Portfolio income (loss) distributed directly to partners 522,564 455,085 67,480 169,403 95,183 Interest income 126,217 89,581 36,636 17,839 1,394 Dividend income 145,698 144,181 1,517 42,657 * 134 Royalties 146,080 * 143,577 * 2,503 [2] [2] Net short-term capital gain (loss) -3,056 1,381 -4,438 * 352 * -478 Net long-term capital gain (loss) 107,625 76,364 31,261 * 108,554 * 94,133 Net rental real estate income (loss) 199,775 156,918 42,858 40,699 * -176 Net income 211,691 163,519 48,172 * 40,948 * 73 Loss 11,915 6,601 * 5,314 * 249 * 249 Other net rental income (loss) * 106,474 * 105,020 * 1,454 * 10,673 * 166 Net income * 106,560 * 105,020 * 1,539 * 10,673 * 166 Loss * 86 0 * 86 0 0 Total net income [1] 14,785,982 7,558,490 7,227,492 3,252,945 1,449,774 Footnotes at end of table.
Other services
Table 2. Partnerships with Net Income: Total Assets, Trade or Business Income and Deductions, Portfolio Income, Rental Income, and Total Net Income, by Selected Industrial Group, Tax Year 2014—Continued
Item
Accommodation and food services
Total Accommodation
Foodservices
anddrinkingplaces
Total
Total
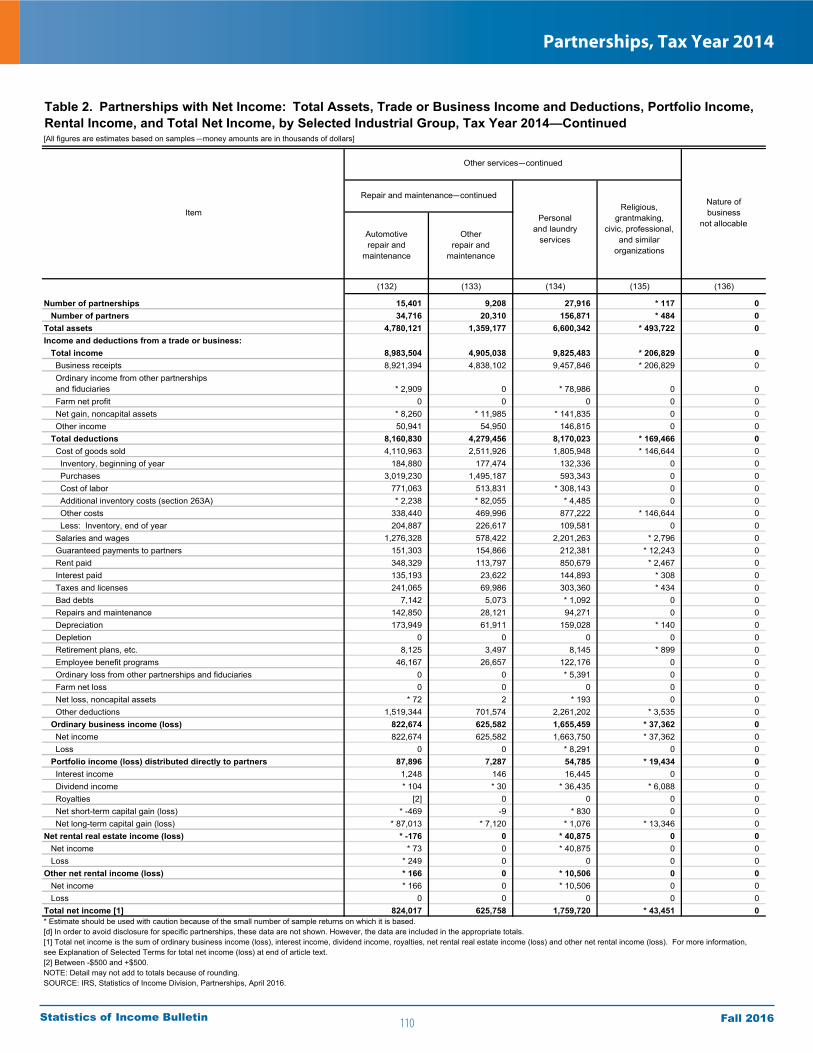
110
Partnerships, Tax Year 2014
Fall 2016Statistics of Income Bulletin
[All figures are estimates based on samples—money amounts are in thousands of dollars]
(132) (133) (134) (135) (136)
Number of partnerships 15,401 9,208 27,916 * 117 0 Number of partners 34,716 20,310 156,871 * 484 0 Total assets 4,780,121 1,359,177 6,600,342 * 493,722 0 Income and deductions from a trade or business: Total income 8,983,504 4,905,038 9,825,483 * 206,829 0 Business receipts 8,921,394 4,838,102 9,457,846 * 206,829 0 Ordinary income from other partnerships and fiduciaries * 2,909 0 * 78,986 0 0 Farm net profit 0 0 0 0 0 Net gain, noncapital assets * 8,260 * 11,985 * 141,835 0 0 Other income 50,941 54,950 146,815 0 0 Total deductions 8,160,830 4,279,456 8,170,023 * 169,466 0 Cost of goods sold 4,110,963 2,511,926 1,805,948 * 146,644 0 Inventory, beginning of year 184,880 177,474 132,336 0 0 Purchases 3,019,230 1,495,187 593,343 0 0 Cost of labor 771,063 513,831 * 308,143 0 0 Additional inventory costs (section 263A) * 2,238 * 82,055 * 4,485 0 0 Other costs 338,440 469,996 877,222 * 146,644 0 Less: Inventory, end of year 204,887 226,617 109,581 0 0 Salaries and wages 1,276,328 578,422 2,201,263 * 2,796 0 Guaranteed payments to partners 151,303 154,866 212,381 * 12,243 0 Rent paid 348,329 113,797 850,679 * 2,467 0 Interest paid 135,193 23,622 144,893 * 308 0 Taxes and licenses 241,065 69,986 303,360 * 434 0 Bad debts 7,142 5,073 * 1,092 0 0 Repairs and maintenance 142,850 28,121 94,271 0 0 Depreciation 173,949 61,911 159,028 * 140 0 Depletion 0 0 0 0 0 Retirement plans, etc. 8,125 3,497 8,145 * 899 0 Employee benefit programs 46,167 26,657 122,176 0 0 Ordinary loss from other partnerships and fiduciaries 0 0 * 5,391 0 0 Farm net loss 0 0 0 0 0 Net loss, noncapital assets * 72 2 * 193 0 0 Other deductions 1,519,344 701,574 2,261,202 * 3,535 0 Ordinary business income (loss) 822,674 625,582 1,655,459 * 37,362 0 Net income 822,674 625,582 1,663,750 * 37,362 0 Loss 0 0 * 8,291 0 0 Portfolio income (loss) distributed directly to partners 87,896 7,287 54,785 * 19,434 0 Interest income 1,248 146 16,445 0 0 Dividend income * 104 * 30 * 36,435 * 6,088 0 Royalties [2] 0 0 0 0 Net short-term capital gain (loss) * -469 -9 * 830 0 0 Net long-term capital gain (loss) * 87,013 * 7,120 * 1,076 * 13,346 0 Net rental real estate income (loss) * -176 0 * 40,875 0 0 Net income * 73 0 * 40,875 0 0 Loss * 249 0 0 0 0 Other net rental income (loss) * 166 0 * 10,506 0 0 Net income * 166 0 * 10,506 0 0 Loss 0 0 0 0 0 Total net income [1] 824,017 625,758 1,759,720 * 43,451 0
Other services—continued
Repair and maintenance—continued
* Estimate should be used with caution because of the small number of sample returns on which it is based.[d] In order to avoid disclosure for specific partnerships, these data are not shown. However, the data are included in the appropriate totals.[1] Total net income is the sum of ordinary business income (loss), interest income, dividend income, royalties, net rental real estate income (loss) and other net rental income (loss). For more information, see Explanation of Selected Terms for total net income (loss) at end of article text.[2] Between -$500 and +$500. NOTE: Detail may not add to totals because of rounding.SOURCE: IRS, Statistics of Income Division, Partnerships, April 2016.
Item
Table 2. Partnerships with Net Income: Total Assets, Trade or Business Income and Deductions, Portfolio Income, Rental Income, and Total Net Income, by Selected Industrial Group, Tax Year 2014—Continued
Nature of business
not allocablePersonal
and laundryservices
Religious,grantmaking,
civic, professional,and similar
organizations
Automotiverepair and
maintenance
Otherrepair and
maintenance

111
Partnerships, Tax Year 2014
Fall 2016Statistics of Income Bulletin
[All figures are estimates based on samples—money amounts are in thousands of dollars]
(1) (2) (3) (4) (5) (6) (7)
Number of partnerships [1] 3,611,255 143,516 60,880 55,539 8,666 2,099 16,332 Number of partners 27,714,478 456,700 193,446 168,790 37,869 5,274 51,321 Partnerships reporting balance sheet data: Number of partnerships 2,743,876 115,053 44,769 47,908 7,879 2,099 12,397 Number of partners 23,965,867 375,919 147,178 143,720 36,295 5,274 43,451 Total assets 26,128,933,308 219,475,999 80,055,663 70,432,205 49,951,188 5,127,108 13,909,835 Cash 1,249,156,699 11,516,780 5,165,332 3,916,735 1,199,284 242,557 992,871 Trade notes and accounts receivable 768,151,318 7,549,949 2,240,842 3,125,555 845,917 58,758 1,278,876 Less: Allowance for bad debts 21,281,732 30,218 7,620 * 3,322 * 221 * 183 18,872 Inventories 330,745,639 11,487,880 2,701,254 7,008,551 207,685 * 86,203 1,484,188 U.S. Government obligations 174,879,883 * 484 0 * 403 * 3 * 78 0 Tax-exempt securities 45,364,519 * 300,223 * 212,323 * 2,755 * 85,144 0 0 Other current assets 2,465,278,938 12,997,579 5,562,553 4,941,936 1,777,653 199,941 515,496 Loans to partners 94,866,511 595,024 * 261,335 102,828 * 45,616 * 101,725 * 83,519 Mortgage and real estate loans 89,098,321 3,068,573 * 1,570,127 * 474,845 * 1,023,601 0 0 Other investments 13,151,034,753 20,252,771 4,781,280 3,429,958 9,621,024 * 843,082 1,577,426 Depreciable assets 6,060,241,038 123,324,682 57,669,385 51,548,511 2,415,651 3,416,763 8,274,372 Less: Accumulated depreciation 1,967,698,084 77,006,517 38,008,646 31,731,288 1,153,287 1,483,611 4,629,686 Depletable assets 349,536,576 10,856,975 * 26,067 * 68,011 10,480,535 0 * 282,363 Less: Accumulated depletion 87,874,908 1,228,424 * 18,266 * 30,361 1,163,961 0 * 15,835 Land 1,069,052,409 59,354,636 25,708,887 21,245,373 9,949,339 * 434,474 2,016,562 Intangible assets 1,023,340,567 4,897,723 1,237,438 1,204,408 87,016 874,624 1,494,236 Less: Accumulated amortization 211,538,070 1,556,416 475,486 471,101 59,022 216,656 334,152 Other assets 1,546,578,930 33,094,297 11,428,857 5,598,406 14,589,211 569,352 908,472 Total liabilities and capital 26,128,933,308 219,475,999 80,055,663 70,432,205 49,951,188 5,127,108 13,909,835 Accounts payable 537,406,923 4,028,568 1,390,110 1,254,383 74,338 480,331 829,407 Mortgages, notes, bonds payable in less than 1 year 328,111,955 20,602,909 12,512,326 6,816,368 * 161,700 * 316,654 795,860 Other current liabilities 3,447,604,886 12,881,981 6,995,495 3,913,631 376,769 312,683 1,283,402 Nonrecourse loans 1,254,352,302 2,247,438 * 325,874 * 493,521 * 1,421,258 0 6,786 Loans from partners 259,673,194 1,919,232 748,331 129,909 * 109,993 * 249,141 681,859 Mortgages, notes, bonds payable in 1 year or more 2,993,283,748 53,469,433 25,037,169 21,350,664 2,650,569 1,734,776 2,696,254 Other liabilities 1,804,837,348 10,814,701 2,751,141 5,296,477 877,549 * 1,459,494 430,040 Partners capital accounts 15,503,662,951 113,511,738 30,295,217 31,177,253 44,279,011 574,028 7,186,228 Footnotes at end of table.
Total Cropproduction
Animalproduction
Forestryand logging
Fishing, hunting, and trapping
Support activities for
agriculture and forestry
Agriculture, forestry, fishing, and hunting
Table 3. All Partnerships and Partnerships with Net Income: Balance Sheets by Profit Status and Selected Industrial Group, Tax Year 2014
Item Allindustries

112
Partnerships, Tax Year 2014
Fall 2016Statistics of Income Bulletin
[All figures are estimates based on samples—money amounts are in thousands of dollars]
(1) (2) (3) (4) (5) (6) (7)PARTNERSHIPS WITH NET INCOME
Number of partnerships [1] 2,018,536 82,927 42,252 28,099 3,415 606 8,555 Number of partners 18,298,410 263,463 135,252 92,630 13,514 1,364 20,703 Partnerships reporting balance sheet data: Number of partnerships 1,588,062 64,770 32,105 24,811 2,627 606 4,620 Number of partners 16,004,540 214,938 103,457 85,344 11,939 1,364 12,834 Total assets 19,340,531,260 110,596,550 45,473,701 31,861,141 23,123,490 2,655,001 7,483,218 Cash 945,745,838 8,163,549 4,280,218 2,803,064 367,761 150,404 562,103 Trade notes and accounts receivable 606,416,855 4,741,281 1,202,549 1,687,761 710,425 * 18,927 1,121,619 Less: Allowance for bad debts 14,266,532 22,209 * 2,347 * 1,144 22 * 142 18,553 Inventories 215,320,367 6,083,309 1,471,231 3,371,516 152,862 * 32,335 1,055,365 U.S. Government obligations 169,131,229 * 481 0 * 403 0 * 78 0 Tax-exempt securities 40,352,878 * 300,223 * 212,323 * 2,755 * 85,144 0 0 Other current assets 1,684,464,426 7,859,675 4,075,808 1,834,002 1,527,206 112,106 310,554 Loans to partners 69,608,507 366,553 * 266,251 * 34,149 * 20,787 * 112 * 45,253 Mortgage and real estate loans 73,045,785 2,710,188 * 1,454,212 * 465,598 790,379 0 0 Other investments 10,765,403,150 9,243,877 4,087,344 1,987,169 987,619 * 634,913 1,546,832 Depreciable assets 3,674,431,066 70,738,210 40,834,239 24,232,072 778,876 1,086,688 3,806,335 Less: Accumulated depreciation 1,366,848,112 49,579,137 30,039,618 15,956,735 564,495 586,954 2,431,335 Depletable assets 285,415,376 3,660,342 * 24,626 * 68,011 3,567,706 0 0 Less: Accumulated depletion 82,355,114 781,356 * 18,266 * 30,361 * 732,729 0 0 Land 643,095,781 27,817,851 14,038,649 9,320,051 3,567,258 * 274,407 617,487 Intangible assets 693,066,488 1,837,840 534,664 515,087 * 13,129 * 571,467 203,495 Less: Accumulated amortization 144,386,052 574,493 163,650 266,145 * 10,361 * 90,233 44,104 Other assets 1,082,889,325 18,030,367 3,215,469 1,793,890 11,861,944 * 450,895 708,169 Total liabilities and capital 19,340,531,260 110,596,550 45,473,701 31,861,141 23,123,490 2,655,001 7,483,218 Accounts payable 391,867,729 2,452,936 753,620 979,666 28,405 * 23,077 668,167 Mortgages, notes, bonds payable in less than 1 year 204,192,979 11,560,456 8,210,622 2,514,559 * 102,683 * 104,742 627,849 Other current liabilities 2,381,700,204 4,824,884 2,840,218 1,015,931 166,940 * 40,124 761,671 Nonrecourse loans 663,782,018 * 1,517,667 * 325,874 * 480,734 704,274 0 6,786 Loans from partners 128,242,675 671,872 * 329,105 * 16,372 * 10,150 * 208,221 * 108,023 Mortgages, notes, bonds payable in 1 year or more 1,685,064,818 22,407,497 12,773,033 7,474,147 991,716 * 326,511 842,089 Other liabilities 1,178,876,674 7,693,576 1,188,447 4,513,764 515,442 * 1,410,107 65,816 Partners capital accounts 12,706,804,162 59,467,663 19,052,782 14,865,967 20,603,878 542,218 4,402,817 Footnotes at end of table.
ItemAll
industries
Agriculture, forestry, fishing, and hunting
TotalCrop
productionAnimal
productionForestry
and loggingFishing, hunting,
and trapping
Support activities for
agriculture and forestry
Table 3. All Partnerships and Partnerships with Net Income: Balance Sheets by Profit Status and Selected Industrial Group, Tax Year 2014—Continued
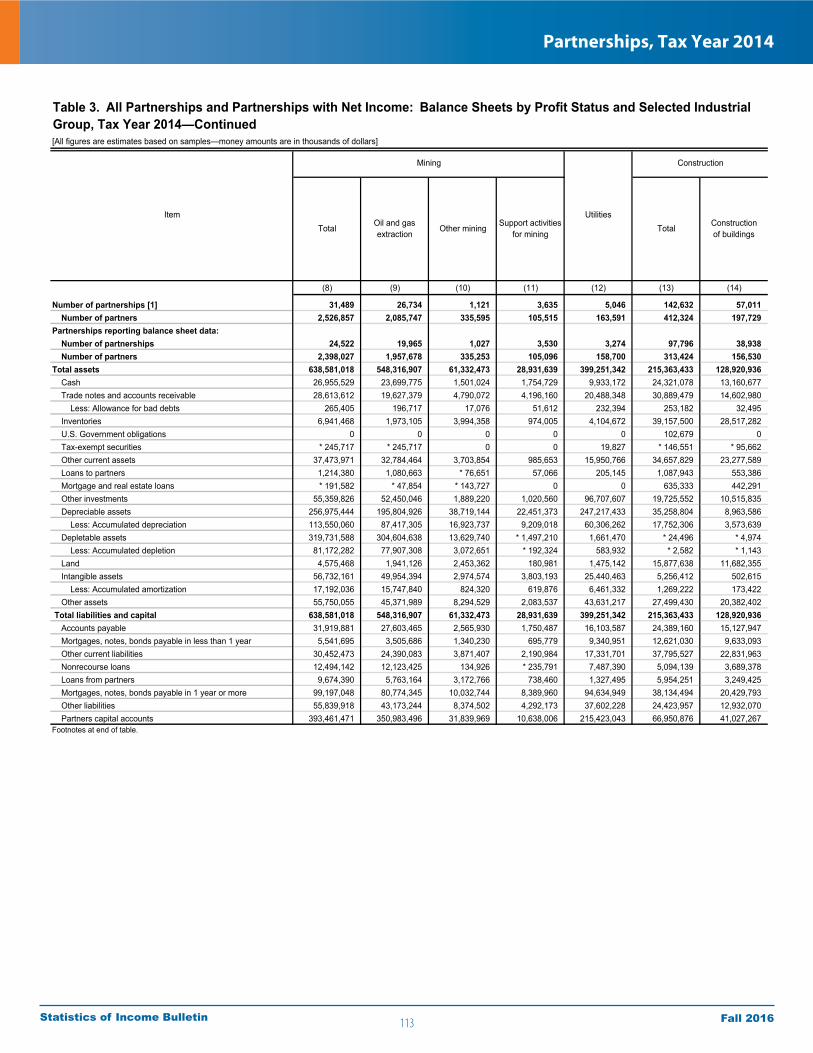
113
Partnerships, Tax Year 2014
Fall 2016Statistics of Income Bulletin
[All figures are estimates based on samples—money amounts are in thousands of dollars]
(8) (9) (10) (11) (12) (13) (14)
Number of partnerships [1] 31,489 26,734 1,121 3,635 5,046 142,632 57,011 Number of partners 2,526,857 2,085,747 335,595 105,515 163,591 412,324 197,729 Partnerships reporting balance sheet data: Number of partnerships 24,522 19,965 1,027 3,530 3,274 97,796 38,938 Number of partners 2,398,027 1,957,678 335,253 105,096 158,700 313,424 156,530 Total assets 638,581,018 548,316,907 61,332,473 28,931,639 399,251,342 215,363,433 128,920,936 Cash 26,955,529 23,699,775 1,501,024 1,754,729 9,933,172 24,321,078 13,160,677 Trade notes and accounts receivable 28,613,612 19,627,379 4,790,072 4,196,160 20,488,348 30,889,479 14,602,980 Less: Allowance for bad debts 265,405 196,717 17,076 51,612 232,394 253,182 32,495 Inventories 6,941,468 1,973,105 3,994,358 974,005 4,104,672 39,157,500 28,517,282 U.S. Government obligations 0 0 0 0 0 102,679 0 Tax-exempt securities * 245,717 * 245,717 0 0 19,827 * 146,551 * 95,662 Other current assets 37,473,971 32,784,464 3,703,854 985,653 15,950,766 34,657,829 23,277,589 Loans to partners 1,214,380 1,080,663 * 76,651 57,066 205,145 1,087,943 553,386 Mortgage and real estate loans * 191,582 * 47,854 * 143,727 0 0 635,333 442,291 Other investments 55,359,826 52,450,046 1,889,220 1,020,560 96,707,607 19,725,552 10,515,835 Depreciable assets 256,975,444 195,804,926 38,719,144 22,451,373 247,217,433 35,258,804 8,963,586 Less: Accumulated depreciation 113,550,060 87,417,305 16,923,737 9,209,018 60,306,262 17,752,306 3,573,639 Depletable assets 319,731,588 304,604,638 13,629,740 * 1,497,210 1,661,470 * 24,496 * 4,974 Less: Accumulated depletion 81,172,282 77,907,308 3,072,651 * 192,324 583,932 * 2,582 * 1,143 Land 4,575,468 1,941,126 2,453,362 180,981 1,475,142 15,877,638 11,682,355 Intangible assets 56,732,161 49,954,394 2,974,574 3,803,193 25,440,463 5,256,412 502,615 Less: Accumulated amortization 17,192,036 15,747,840 824,320 619,876 6,461,332 1,269,222 173,422 Other assets 55,750,055 45,371,989 8,294,529 2,083,537 43,631,217 27,499,430 20,382,402 Total liabilities and capital 638,581,018 548,316,907 61,332,473 28,931,639 399,251,342 215,363,433 128,920,936 Accounts payable 31,919,881 27,603,465 2,565,930 1,750,487 16,103,587 24,389,160 15,127,947 Mortgages, notes, bonds payable in less than 1 year 5,541,695 3,505,686 1,340,230 695,779 9,340,951 12,621,030 9,633,093 Other current liabilities 30,452,473 24,390,083 3,871,407 2,190,984 17,331,701 37,795,527 22,831,963 Nonrecourse loans 12,494,142 12,123,425 134,926 * 235,791 7,487,390 5,094,139 3,689,378 Loans from partners 9,674,390 5,763,164 3,172,766 738,460 1,327,495 5,954,251 3,249,425 Mortgages, notes, bonds payable in 1 year or more 99,197,048 80,774,345 10,032,744 8,389,960 94,634,949 38,134,494 20,429,793 Other liabilities 55,839,918 43,173,244 8,374,502 4,292,173 37,602,228 24,423,957 12,932,070 Partners capital accounts 393,461,471 350,983,496 31,839,969 10,638,006 215,423,043 66,950,876 41,027,267 Footnotes at end of table.
Mining
UtilitiesTotal Oil and gas
extraction
Table 3. All Partnerships and Partnerships with Net Income: Balance Sheets by Profit Status and Selected Industrial Group, Tax Year 2014—Continued
Construction
ItemOther mining Support activities
for miningTotal Construction
of buildings
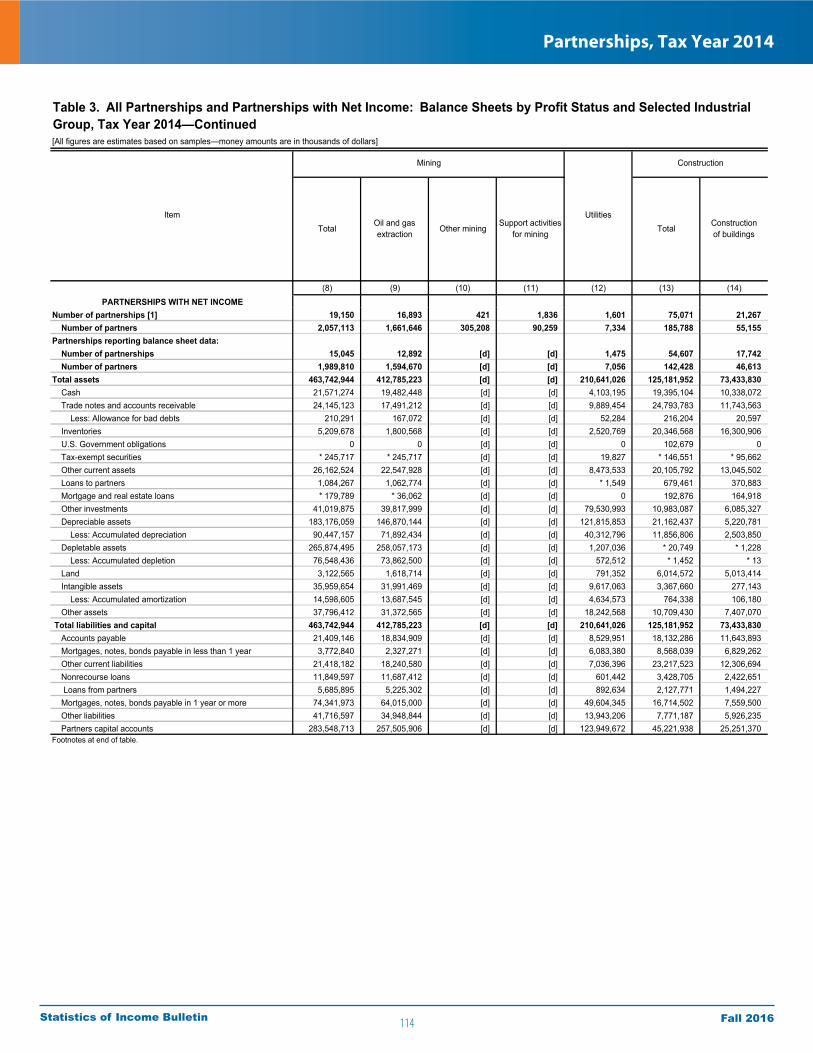
114
Partnerships, Tax Year 2014
Fall 2016Statistics of Income Bulletin
[All figures are estimates based on samples—money amounts are in thousands of dollars]
(8) (9) (10) (11) (12) (13) (14)PARTNERSHIPS WITH NET INCOME
Number of partnerships [1] 19,150 16,893 421 1,836 1,601 75,071 21,267 Number of partners 2,057,113 1,661,646 305,208 90,259 7,334 185,788 55,155 Partnerships reporting balance sheet data: Number of partnerships 15,045 12,892 [d] [d] 1,475 54,607 17,742 Number of partners 1,989,810 1,594,670 [d] [d] 7,056 142,428 46,613 Total assets 463,742,944 412,785,223 [d] [d] 210,641,026 125,181,952 73,433,830 Cash 21,571,274 19,482,448 [d] [d] 4,103,195 19,395,104 10,338,072 Trade notes and accounts receivable 24,145,123 17,491,212 [d] [d] 9,889,454 24,793,783 11,743,563 Less: Allowance for bad debts 210,291 167,072 [d] [d] 52,284 216,204 20,597 Inventories 5,209,678 1,800,568 [d] [d] 2,520,769 20,346,568 16,300,906 U.S. Government obligations 0 0 [d] [d] 0 102,679 0 Tax-exempt securities * 245,717 * 245,717 [d] [d] 19,827 * 146,551 * 95,662 Other current assets 26,162,524 22,547,928 [d] [d] 8,473,533 20,105,792 13,045,502 Loans to partners 1,084,267 1,062,774 [d] [d] * 1,549 679,461 370,883 Mortgage and real estate loans * 179,789 * 36,062 [d] [d] 0 192,876 164,918 Other investments 41,019,875 39,817,999 [d] [d] 79,530,993 10,983,087 6,085,327 Depreciable assets 183,176,059 146,870,144 [d] [d] 121,815,853 21,162,437 5,220,781 Less: Accumulated depreciation 90,447,157 71,892,434 [d] [d] 40,312,796 11,856,806 2,503,850 Depletable assets 265,874,495 258,057,173 [d] [d] 1,207,036 * 20,749 * 1,228 Less: Accumulated depletion 76,548,436 73,862,500 [d] [d] 572,512 * 1,452 * 13 Land 3,122,565 1,618,714 [d] [d] 791,352 6,014,572 5,013,414 Intangible assets 35,959,654 31,991,469 [d] [d] 9,617,063 3,367,660 277,143 Less: Accumulated amortization 14,598,605 13,687,545 [d] [d] 4,634,573 764,338 106,180 Other assets 37,796,412 31,372,565 [d] [d] 18,242,568 10,709,430 7,407,070 Total liabilities and capital 463,742,944 412,785,223 [d] [d] 210,641,026 125,181,952 73,433,830 Accounts payable 21,409,146 18,834,909 [d] [d] 8,529,951 18,132,286 11,643,893 Mortgages, notes, bonds payable in less than 1 year 3,772,840 2,327,271 [d] [d] 6,083,380 8,568,039 6,829,262 Other current liabilities 21,418,182 18,240,580 [d] [d] 7,036,396 23,217,523 12,306,694 Nonrecourse loans 11,849,597 11,687,412 [d] [d] 601,442 3,428,705 2,422,651 Loans from partners 5,685,895 5,225,302 [d] [d] 892,634 2,127,771 1,494,227 Mortgages, notes, bonds payable in 1 year or more 74,341,973 64,015,000 [d] [d] 49,604,345 16,714,502 7,559,500 Other liabilities 41,716,597 34,948,844 [d] [d] 13,943,206 7,771,187 5,926,235 Partners capital accounts 283,548,713 257,505,906 [d] [d] 123,949,672 45,221,938 25,251,370 Footnotes at end of table.
Mining
UtilitiesTotal
Oil and gas extraction Other mining
Support activities for mining Total
Constructionof buildings
Table 3. All Partnerships and Partnerships with Net Income: Balance Sheets by Profit Status and Selected Industrial Group, Tax Year 2014—Continued
Construction
Item
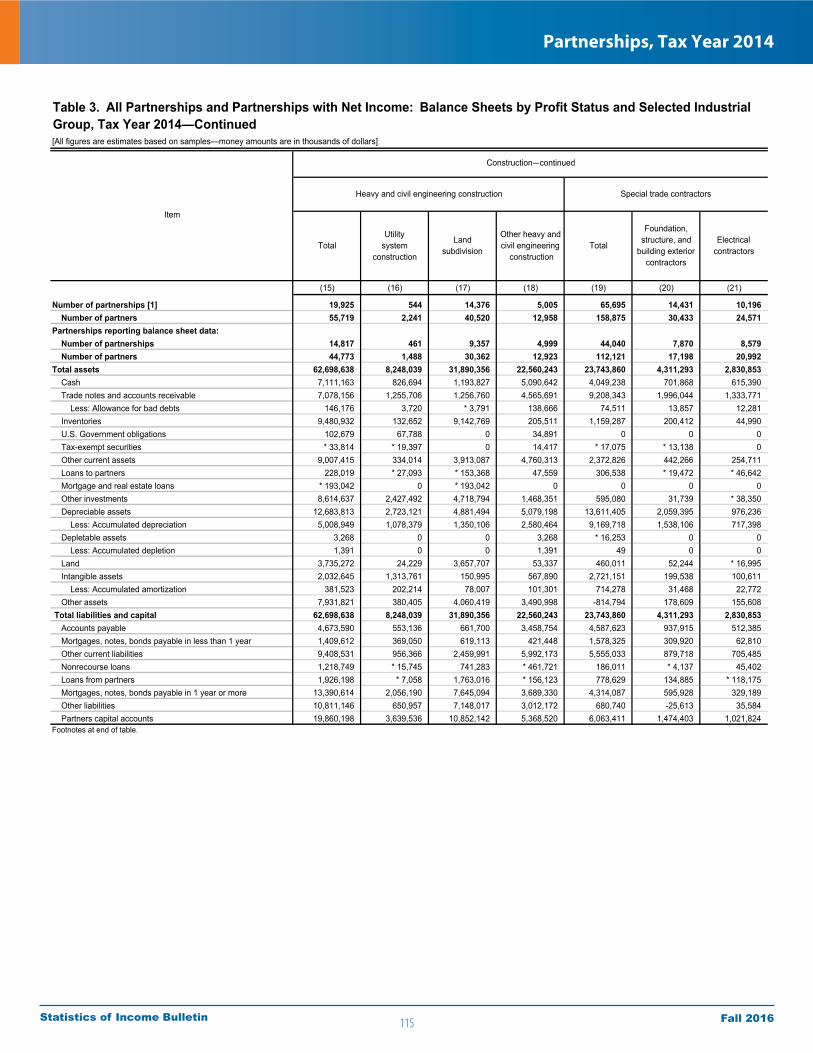
115
Partnerships, Tax Year 2014
Fall 2016Statistics of Income Bulletin
[All figures are estimates based on samples—money amounts are in thousands of dollars]
(15) (16) (17) (18) (19) (20) (21)
Number of partnerships [1] 19,925 544 14,376 5,005 65,695 14,431 10,196 Number of partners 55,719 2,241 40,520 12,958 158,875 30,433 24,571 Partnerships reporting balance sheet data: Number of partnerships 14,817 461 9,357 4,999 44,040 7,870 8,579 Number of partners 44,773 1,488 30,362 12,923 112,121 17,198 20,992 Total assets 62,698,638 8,248,039 31,890,356 22,560,243 23,743,860 4,311,293 2,830,853 Cash 7,111,163 826,694 1,193,827 5,090,642 4,049,238 701,868 615,390 Trade notes and accounts receivable 7,078,156 1,255,706 1,256,760 4,565,691 9,208,343 1,996,044 1,333,771 Less: Allowance for bad debts 146,176 3,720 * 3,791 138,666 74,511 13,857 12,281 Inventories 9,480,932 132,652 9,142,769 205,511 1,159,287 200,412 44,990 U.S. Government obligations 102,679 67,788 0 34,891 0 0 0 Tax-exempt securities * 33,814 * 19,397 0 14,417 * 17,075 * 13,138 0 Other current assets 9,007,415 334,014 3,913,087 4,760,313 2,372,826 442,266 254,711 Loans to partners 228,019 * 27,093 * 153,368 47,559 306,538 * 19,472 * 46,642 Mortgage and real estate loans * 193,042 0 * 193,042 0 0 0 0 Other investments 8,614,637 2,427,492 4,718,794 1,468,351 595,080 31,739 * 38,350 Depreciable assets 12,683,813 2,723,121 4,881,494 5,079,198 13,611,405 2,059,395 976,236 Less: Accumulated depreciation 5,008,949 1,078,379 1,350,106 2,580,464 9,169,718 1,538,106 717,398 Depletable assets 3,268 0 0 3,268 * 16,253 0 0 Less: Accumulated depletion 1,391 0 0 1,391 49 0 0 Land 3,735,272 24,229 3,657,707 53,337 460,011 52,244 * 16,995 Intangible assets 2,032,645 1,313,761 150,995 567,890 2,721,151 199,538 100,611 Less: Accumulated amortization 381,523 202,214 78,007 101,301 714,278 31,468 22,772 Other assets 7,931,821 380,405 4,060,419 3,490,998 -814,794 178,609 155,608 Total liabilities and capital 62,698,638 8,248,039 31,890,356 22,560,243 23,743,860 4,311,293 2,830,853 Accounts payable 4,673,590 553,136 661,700 3,458,754 4,587,623 937,915 512,385 Mortgages, notes, bonds payable in less than 1 year 1,409,612 369,050 619,113 421,448 1,578,325 309,920 62,810 Other current liabilities 9,408,531 956,366 2,459,991 5,992,173 5,555,033 879,718 705,485 Nonrecourse loans 1,218,749 * 15,745 741,283 * 461,721 186,011 * 4,137 45,402 Loans from partners 1,926,198 * 7,058 1,763,016 * 156,123 778,629 134,885 * 118,175 Mortgages, notes, bonds payable in 1 year or more 13,390,614 2,056,190 7,645,094 3,689,330 4,314,087 595,928 329,189 Other liabilities 10,811,146 650,957 7,148,017 3,012,172 680,740 -25,613 35,584 Partners capital accounts 19,860,198 3,639,536 10,852,142 5,368,520 6,063,411 1,474,403 1,021,824 Footnotes at end of table.
TotalUtility
systemconstruction
Landsubdivision
Other heavy and civil engineering
constructionTotal
Foundation,structure, and
building exteriorcontractors
Electricalcontractors
Table 3. All Partnerships and Partnerships with Net Income: Balance Sheets by Profit Status and Selected Industrial Group, Tax Year 2014—Continued
Item
Construction—continued
Special trade contractorsHeavy and civil engineering construction
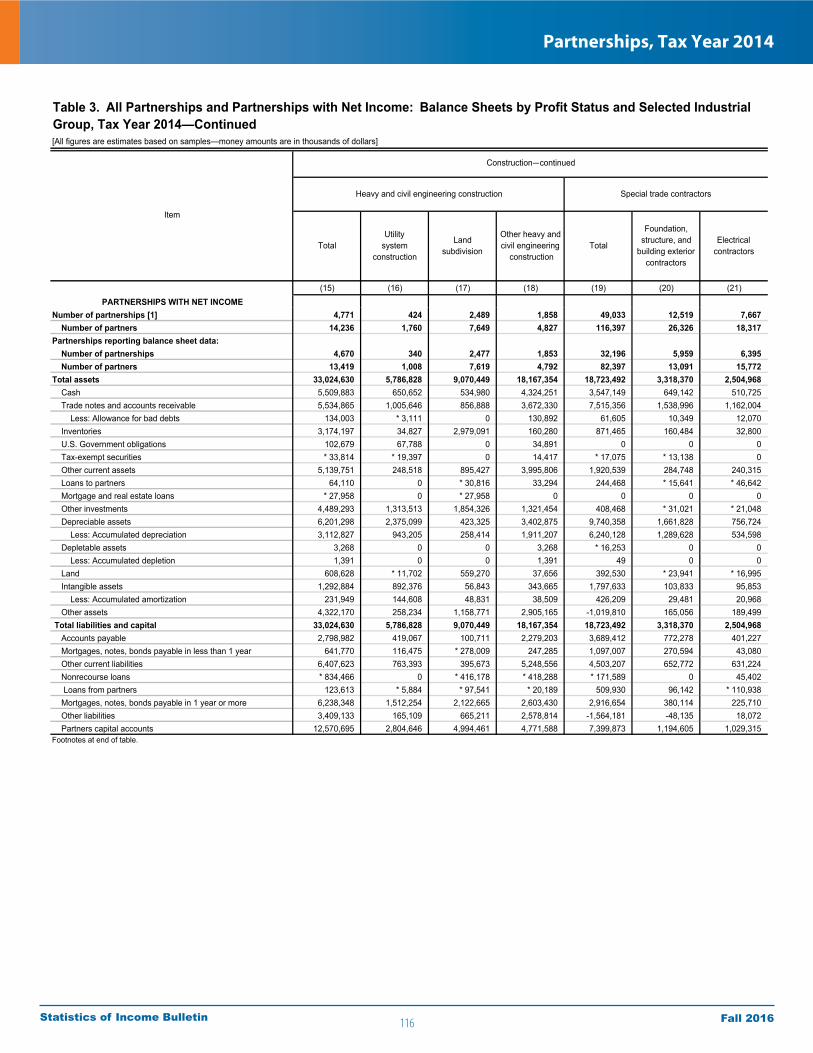
116
Partnerships, Tax Year 2014
Fall 2016Statistics of Income Bulletin
[All figures are estimates based on samples—money amounts are in thousands of dollars]
(15) (16) (17) (18) (19) (20) (21)PARTNERSHIPS WITH NET INCOME
Number of partnerships [1] 4,771 424 2,489 1,858 49,033 12,519 7,667 Number of partners 14,236 1,760 7,649 4,827 116,397 26,326 18,317 Partnerships reporting balance sheet data: Number of partnerships 4,670 340 2,477 1,853 32,196 5,959 6,395 Number of partners 13,419 1,008 7,619 4,792 82,397 13,091 15,772 Total assets 33,024,630 5,786,828 9,070,449 18,167,354 18,723,492 3,318,370 2,504,968 Cash 5,509,883 650,652 534,980 4,324,251 3,547,149 649,142 510,725 Trade notes and accounts receivable 5,534,865 1,005,646 856,888 3,672,330 7,515,356 1,538,996 1,162,004 Less: Allowance for bad debts 134,003 * 3,111 0 130,892 61,605 10,349 12,070 Inventories 3,174,197 34,827 2,979,091 160,280 871,465 160,484 32,800 U.S. Government obligations 102,679 67,788 0 34,891 0 0 0 Tax-exempt securities * 33,814 * 19,397 0 14,417 * 17,075 * 13,138 0 Other current assets 5,139,751 248,518 895,427 3,995,806 1,920,539 284,748 240,315 Loans to partners 64,110 0 * 30,816 33,294 244,468 * 15,641 * 46,642 Mortgage and real estate loans * 27,958 0 * 27,958 0 0 0 0 Other investments 4,489,293 1,313,513 1,854,326 1,321,454 408,468 * 31,021 * 21,048 Depreciable assets 6,201,298 2,375,099 423,325 3,402,875 9,740,358 1,661,828 756,724 Less: Accumulated depreciation 3,112,827 943,205 258,414 1,911,207 6,240,128 1,289,628 534,598 Depletable assets 3,268 0 0 3,268 * 16,253 0 0 Less: Accumulated depletion 1,391 0 0 1,391 49 0 0 Land 608,628 * 11,702 559,270 37,656 392,530 * 23,941 * 16,995 Intangible assets 1,292,884 892,376 56,843 343,665 1,797,633 103,833 95,853 Less: Accumulated amortization 231,949 144,608 48,831 38,509 426,209 29,481 20,968 Other assets 4,322,170 258,234 1,158,771 2,905,165 -1,019,810 165,056 189,499 Total liabilities and capital 33,024,630 5,786,828 9,070,449 18,167,354 18,723,492 3,318,370 2,504,968 Accounts payable 2,798,982 419,067 100,711 2,279,203 3,689,412 772,278 401,227 Mortgages, notes, bonds payable in less than 1 year 641,770 116,475 * 278,009 247,285 1,097,007 270,594 43,080 Other current liabilities 6,407,623 763,393 395,673 5,248,556 4,503,207 652,772 631,224 Nonrecourse loans * 834,466 0 * 416,178 * 418,288 * 171,589 0 45,402 Loans from partners 123,613 * 5,884 * 97,541 * 20,189 509,930 96,142 * 110,938 Mortgages, notes, bonds payable in 1 year or more 6,238,348 1,512,254 2,122,665 2,603,430 2,916,654 380,114 225,710 Other liabilities 3,409,133 165,109 665,211 2,578,814 -1,564,181 -48,135 18,072 Partners capital accounts 12,570,695 2,804,646 4,994,461 4,771,588 7,399,873 1,194,605 1,029,315 Footnotes at end of table.
Heavy and civil engineering construction
TotalUtility
systemconstruction
Landsubdivision
Other heavy and civil engineering
constructionTotal
Foundation,structure, and
building exteriorcontractors
Electricalcontractors
Table 3. All Partnerships and Partnerships with Net Income: Balance Sheets by Profit Status and Selected Industrial Group, Tax Year 2014—Continued
Construction—continued
Item
Special trade contractors

117
Partnerships, Tax Year 2014
Fall 2016Statistics of Income Bulletin
[All figures are estimates based on samples—money amounts are in thousands of dollars]
(22) (23) (24) (25) (26) (27) (28)
Number of partnerships [1] 8,169 15,457 17,442 66,775 3,612 4,364 319 Number of partners 18,666 41,664 43,542 836,615 25,948 30,080 1,853 Partnerships reporting balance sheet data: Number of partnerships 6,497 8,917 12,177 45,918 3,572 3,221 314 Number of partners 15,227 28,439 30,266 776,566 25,786 23,022 1,833 Total assets 3,156,744 2,841,745 10,603,223 836,920,696 60,233,391 51,708,793 2,827,763 Cash 953,437 539,291 1,239,253 44,443,004 2,723,090 991,848 108,041 Trade notes and accounts receivable 1,556,275 1,059,624 3,262,628 126,562,457 7,446,717 7,982,114 600,428 Less: Allowance for bad debts 13,808 6,373 28,192 1,054,232 102,127 30,908 17,880 Inventories 175,471 115,037 623,377 85,713,563 8,934,867 4,075,556 791,584 U.S. Government obligations 0 0 0 13,491 1 0 0 Tax-exempt securities 0 0 * 3,936 * 42,915 0 15,683 0 Other current assets 375,831 401,649 898,369 41,783,479 3,723,602 752,243 74,511 Loans to partners * 71,684 * 2,612 166,130 5,877,516 75,080 * 34,566 * 257 Mortgage and real estate loans 0 0 0 * 11,747 * 1,372 3,360 0 Other investments 290,514 * -27,736 262,213 139,320,929 6,859,772 2,744,849 * 68,106 Depreciable assets 2,076,957 1,131,879 7,366,939 356,955,352 24,378,031 16,039,006 2,244,838 Less: Accumulated depreciation 1,120,610 789,803 5,003,801 163,282,265 10,862,298 7,063,467 1,465,914 Depletable assets 1,950 0 * 14,303 1,693,312 * 9,646 0 0 Less: Accumulated depletion 49 0 0 352,743 * 9,646 0 0 Land 47,615 * 181,016 162,141 7,122,636 522,337 1,190,456 26,446 Intangible assets 869,965 258,214 1,292,822 143,242,425 15,515,878 20,143,954 376,812 Less: Accumulated amortization 288,732 117,780 253,525 25,809,955 988,077 1,505,940 63,593 Other assets -1,839,756 94,116 596,630 74,637,064 2,005,147 6,335,472 84,128 Total liabilities and capital 3,156,744 2,841,745 10,603,223 836,920,696 60,233,391 51,708,793 2,827,763 Accounts payable 790,060 456,944 1,890,319 95,264,980 5,520,020 9,924,641 332,248 Mortgages, notes, bonds payable in less than 1 year 256,865 279,077 669,653 20,995,487 2,786,404 356,195 165,854 Other current liabilities 1,107,611 456,072 2,406,148 77,359,697 4,390,911 5,601,600 400,124 Nonrecourse loans * 906 * 24,466 * 111,100 14,462,820 * 546,600 * 262,716 * 1,566 Loans from partners 75,957 * 63,824 385,787 26,901,049 1,077,703 494,317 * 497,010 Mortgages, notes, bonds payable in 1 year or more 858,816 284,399 2,245,754 96,775,896 9,784,742 5,322,508 750,940 Other liabilities -1,793,701 137,975 2,326,496 29,630,550 661,410 1,512,491 108,679 Partners capital accounts 1,860,230 1,138,988 567,967 475,530,217 35,465,601 28,234,325 571,343 Footnotes at end of table.
Plumbing,heating and
air-conditioningcontractors
Buildingfinishing
contractors
Table 3. All Partnerships and Partnerships with Net Income: Balance Sheets by Profit Status and Selected Industrial Group, Tax Year 2014—Continued
ItemOther
specialtytrade
contractors
Construction—continued Manufacturing
Special trade contractors—continued
Beverage andtobaccoproduct
manufacturing
Textile millsand textile
product millsTotal Food
manufacturing
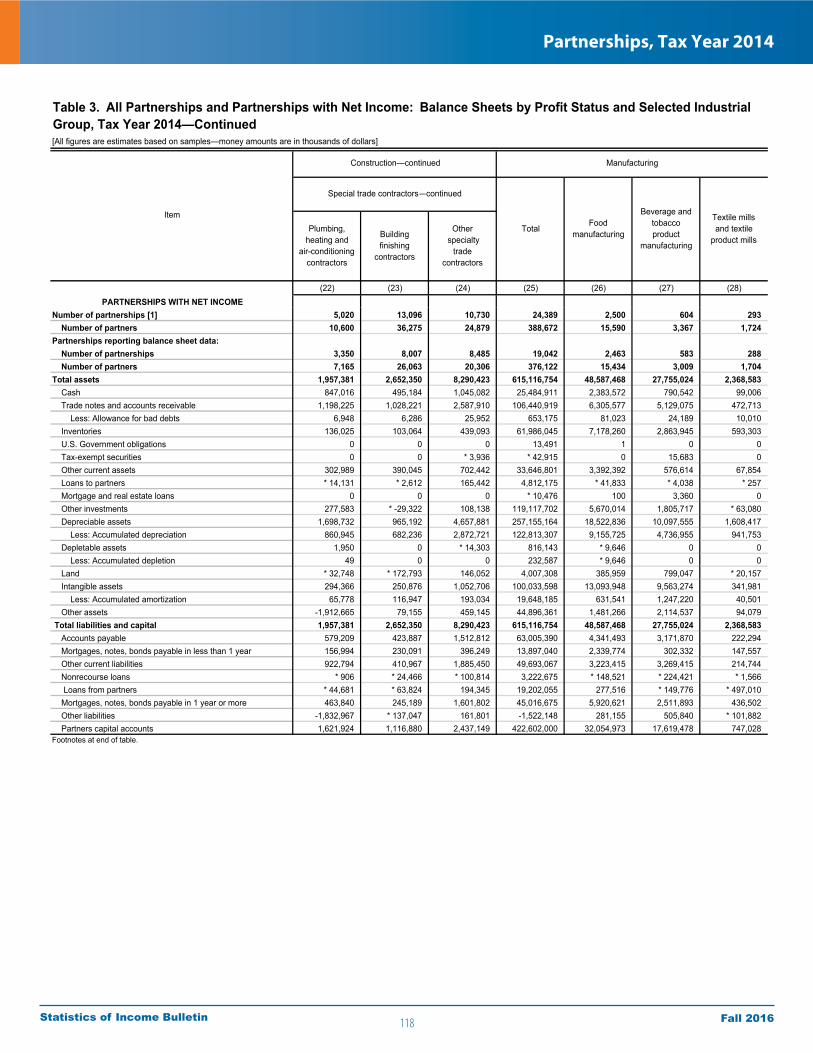
118
Partnerships, Tax Year 2014
Fall 2016Statistics of Income Bulletin
[All figures are estimates based on samples—money amounts are in thousands of dollars]
(22) (23) (24) (25) (26) (27) (28)PARTNERSHIPS WITH NET INCOME
Number of partnerships [1] 5,020 13,096 10,730 24,389 2,500 604 293 Number of partners 10,600 36,275 24,879 388,672 15,590 3,367 1,724 Partnerships reporting balance sheet data: Number of partnerships 3,350 8,007 8,485 19,042 2,463 583 288 Number of partners 7,165 26,063 20,306 376,122 15,434 3,009 1,704 Total assets 1,957,381 2,652,350 8,290,423 615,116,754 48,587,468 27,755,024 2,368,583 Cash 847,016 495,184 1,045,082 25,484,911 2,383,572 790,542 99,006 Trade notes and accounts receivable 1,198,225 1,028,221 2,587,910 106,440,919 6,305,577 5,129,075 472,713 Less: Allowance for bad debts 6,948 6,286 25,952 653,175 81,023 24,189 10,010 Inventories 136,025 103,064 439,093 61,986,045 7,178,260 2,863,945 593,303 U.S. Government obligations 0 0 0 13,491 1 0 0 Tax-exempt securities 0 0 * 3,936 * 42,915 0 15,683 0 Other current assets 302,989 390,045 702,442 33,646,801 3,392,392 576,614 67,854 Loans to partners * 14,131 * 2,612 165,442 4,812,175 * 41,833 * 4,038 * 257 Mortgage and real estate loans 0 0 0 * 10,476 100 3,360 0 Other investments 277,583 * -29,322 108,138 119,117,702 5,670,014 1,805,717 * 63,080 Depreciable assets 1,698,732 965,192 4,657,881 257,155,164 18,522,836 10,097,555 1,608,417 Less: Accumulated depreciation 860,945 682,236 2,872,721 122,813,307 9,155,725 4,736,955 941,753 Depletable assets 1,950 0 * 14,303 816,143 * 9,646 0 0 Less: Accumulated depletion 49 0 0 232,587 * 9,646 0 0 Land * 32,748 * 172,793 146,052 4,007,308 385,959 799,047 * 20,157 Intangible assets 294,366 250,876 1,052,706 100,033,598 13,093,948 9,563,274 341,981 Less: Accumulated amortization 65,778 116,947 193,034 19,648,185 631,541 1,247,220 40,501 Other assets -1,912,665 79,155 459,145 44,896,361 1,481,266 2,114,537 94,079 Total liabilities and capital 1,957,381 2,652,350 8,290,423 615,116,754 48,587,468 27,755,024 2,368,583 Accounts payable 579,209 423,887 1,512,812 63,005,390 4,341,493 3,171,870 222,294 Mortgages, notes, bonds payable in less than 1 year 156,994 230,091 396,249 13,897,040 2,339,774 302,332 147,557 Other current liabilities 922,794 410,967 1,885,450 49,693,067 3,223,415 3,269,415 214,744 Nonrecourse loans * 906 * 24,466 * 100,814 3,222,675 * 148,521 * 224,421 * 1,566 Loans from partners * 44,681 * 63,824 194,345 19,202,055 277,516 * 149,776 * 497,010 Mortgages, notes, bonds payable in 1 year or more 463,840 245,189 1,601,802 45,016,675 5,920,621 2,511,893 436,502 Other liabilities -1,832,967 * 137,047 161,801 -1,522,148 281,155 505,840 * 101,882 Partners capital accounts 1,621,924 1,116,880 2,437,149 422,602,000 32,054,973 17,619,478 747,028 Footnotes at end of table.
TotalFood
manufacturing
Beverage andtobaccoproduct
manufacturing
Textile millsand textile
product millsPlumbing,
heating andair-conditioning
contractors
Buildingfinishing
contractors
Other specialty
tradecontractors
Table 3. All Partnerships and Partnerships with Net Income: Balance Sheets by Profit Status and Selected Industrial Group, Tax Year 2014—Continued
Special trade contractors—continued
Construction—continued Manufacturing
Item

119
Partnerships, Tax Year 2014
Fall 2016Statistics of Income Bulletin
[All figures are estimates based on samples—money amounts are in thousands of dollars]
(29) (30) (31) (32) (33) (34) (35)
Number of partnerships [1] 3,442 * 362 1,906 228 7,785 456 1,971 Number of partners 7,842 * 1,161 7,082 1,285 28,164 300,156 234,916 Partnerships reporting balance sheet data: Number of partnerships 3,428 * 358 1,119 217 5,101 446 1,919 Number of partners 7,419 * 1,137 5,508 1,259 22,764 300,118 234,379 Total assets 6,673,519 * 504,671 10,436,550 31,565,026 5,053,449 180,596,057 198,227,493 Cash 276,632 * 6,216 289,280 479,759 975,153 3,618,240 10,447,119 Trade notes and accounts receivable 652,354 * 30,949 1,073,027 2,604,208 1,170,124 21,185,339 30,588,832 Less: Allowance for bad debts 44,078 * 217 14,514 29,244 25,094 54,494 217,201 Inventories 1,361,228 * 27,170 1,967,982 2,408,632 425,052 15,502,370 12,743,649 U.S. Government obligations 0 0 0 0 0 0 13,491 Tax-exempt securities 0 0 24,450 0 0 0 0 Other current assets 417,269 * 138,917 928,854 2,112,669 270,365 6,697,849 7,668,440 Loans to partners * 4,664 0 * 13,896 * 6,161 * 11,511 178,397 907,862 Mortgage and real estate loans 0 0 0 0 0 0 6,797 Other investments 349,653 * 54,249 473,060 825,949 6,597 62,380,903 39,271,640 Depreciable assets 1,030,559 * 66,036 6,491,903 21,274,045 3,186,518 100,155,309 77,585,719 Less: Accumulated depreciation 690,846 * 14,280 3,132,739 9,978,222 1,929,390 35,967,351 37,615,538 Depletable assets 0 0 * 758,938 332,382 0 7,133 405,537 Less: Accumulated depletion 0 0 * 83,773 144,922 0 1,262 68,962 Land * 358 * 273 241,484 119,794 * 11,616 1,066,834 1,598,283 Intangible assets 2,175,893 * 206,552 836,422 11,773,392 1,182,849 2,355,476 39,086,786 Less: Accumulated amortization 183,474 * 14,051 125,557 1,011,315 415,786 659,118 11,823,897 Other assets 1,323,306 * 2,858 693,837 791,738 183,935 4,130,431 27,628,937 Total liabilities and capital 6,673,519 * 504,671 10,436,550 31,565,026 5,053,449 180,596,057 198,227,493 Accounts payable 728,699 * 8,717 632,296 1,671,011 730,671 16,405,533 10,878,653 Mortgages, notes, bonds payable in less than 1 year 163,569 * 5,016 625,059 426,053 404,413 3,144,724 2,127,102 Other current liabilities 1,081,323 * 131,719 768,043 2,345,928 705,983 10,369,151 19,490,505 Nonrecourse loans * 75,368 0 24,382 * 263,720 0 * 687,983 9,834,257 Loans from partners * 201,381 0 603,722 * 8,173,569 * 256,548 5,879,206 2,703,360 Mortgages, notes, bonds payable in 1 year or more 2,347,173 * 125,289 2,554,400 2,101,614 1,490,731 15,664,267 13,766,213 Other liabilities 1,853,405 * 2,145 691,877 1,192,964 83,137 -15,731,939 8,569,760 Partners capital accounts 222,601 * 231,785 4,536,772 15,390,167 1,381,966 144,177,130 130,857,643 Footnotes at end of table.
Table 3. All Partnerships and Partnerships with Net Income: Balance Sheets by Profit Status and Selected Industrial Group, Tax Year 2014—Continued
Item
Manufacturing—continued
Printingand related
supportactivities
Petroleumand coal products
manufacturing
Chemicalmanufacturing
Apparelmanufacturing
Leather andallied
productmanufacturing
Woodproduct
manufacturing
Papermanufacturing
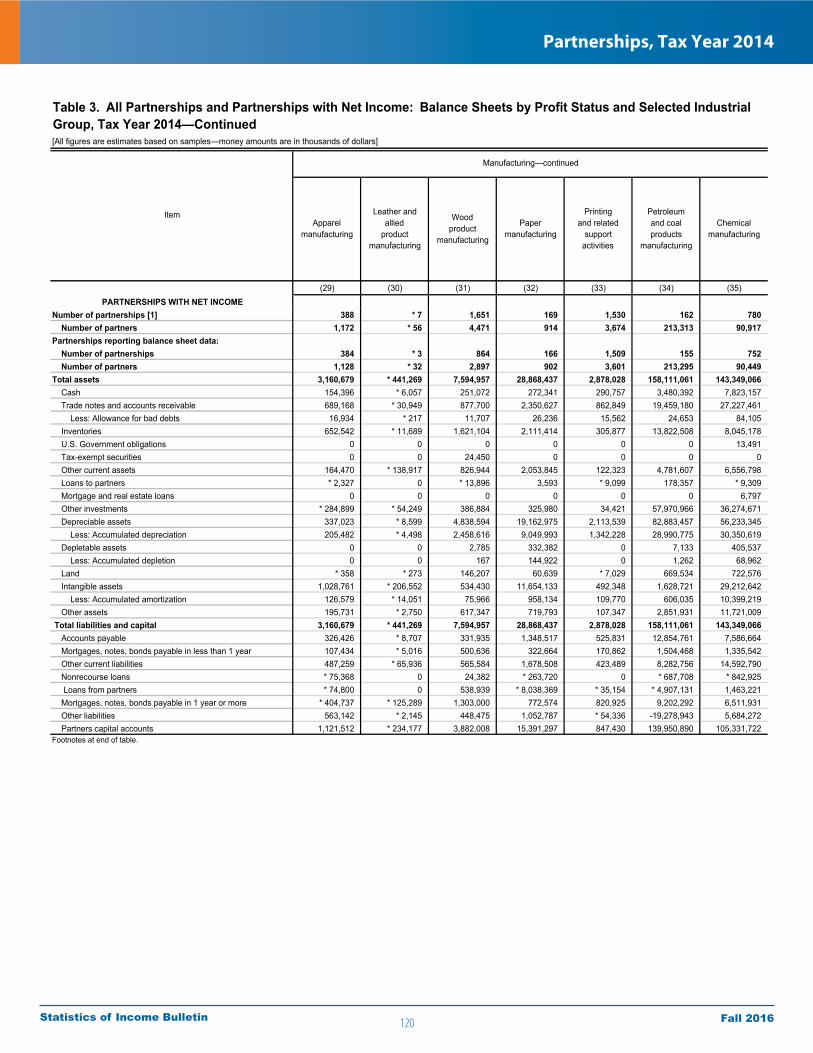
120
Partnerships, Tax Year 2014
Fall 2016Statistics of Income Bulletin
[All figures are estimates based on samples—money amounts are in thousands of dollars]
(29) (30) (31) (32) (33) (34) (35)PARTNERSHIPS WITH NET INCOME
Number of partnerships [1] 388 * 7 1,651 169 1,530 162 780 Number of partners 1,172 * 56 4,471 914 3,674 213,313 90,917 Partnerships reporting balance sheet data: Number of partnerships 384 * 3 864 166 1,509 155 752 Number of partners 1,128 * 32 2,897 902 3,601 213,295 90,449 Total assets 3,160,679 * 441,269 7,594,957 28,868,437 2,878,028 158,111,061 143,349,066 Cash 154,396 * 6,057 251,072 272,341 290,757 3,480,392 7,823,157 Trade notes and accounts receivable 689,168 * 30,949 877,700 2,350,627 862,849 19,459,180 27,227,461 Less: Allowance for bad debts 16,934 * 217 11,707 26,236 15,562 24,653 84,105 Inventories 652,542 * 11,689 1,621,104 2,111,414 305,877 13,822,508 8,045,178 U.S. Government obligations 0 0 0 0 0 0 13,491 Tax-exempt securities 0 0 24,450 0 0 0 0 Other current assets 164,470 * 138,917 826,944 2,053,845 122,323 4,781,607 6,556,798 Loans to partners * 2,327 0 * 13,896 3,593 * 9,099 178,357 * 9,309 Mortgage and real estate loans 0 0 0 0 0 0 6,797 Other investments * 284,899 * 54,249 386,884 325,980 34,421 57,970,966 36,274,671 Depreciable assets 337,023 * 8,599 4,838,594 19,162,975 2,113,539 82,883,457 56,233,345 Less: Accumulated depreciation 205,482 * 4,498 2,458,616 9,049,993 1,342,228 28,990,775 30,350,619 Depletable assets 0 0 2,785 332,382 0 7,133 405,537 Less: Accumulated depletion 0 0 167 144,922 0 1,262 68,962 Land * 358 * 273 146,207 60,639 * 7,029 669,534 722,576 Intangible assets 1,028,761 * 206,552 534,430 11,654,133 492,348 1,628,721 29,212,642 Less: Accumulated amortization 126,579 * 14,051 75,966 958,134 109,770 606,035 10,399,219 Other assets 195,731 * 2,750 617,347 719,793 107,347 2,851,931 11,721,009 Total liabilities and capital 3,160,679 * 441,269 7,594,957 28,868,437 2,878,028 158,111,061 143,349,066 Accounts payable 326,426 * 8,707 331,935 1,348,517 525,831 12,854,761 7,586,664 Mortgages, notes, bonds payable in less than 1 year 107,434 * 5,016 500,636 322,664 170,862 1,504,468 1,335,542 Other current liabilities 487,259 * 65,936 565,584 1,678,508 423,489 8,282,756 14,592,790 Nonrecourse loans * 75,368 0 24,382 * 263,720 0 * 687,708 * 842,925 Loans from partners * 74,800 0 538,939 * 8,038,369 * 35,154 * 4,907,131 1,463,221 Mortgages, notes, bonds payable in 1 year or more * 404,737 * 125,289 1,303,000 772,574 820,925 9,202,292 6,511,931 Other liabilities 563,142 * 2,145 448,475 1,052,787 * 54,336 -19,278,943 5,684,272 Partners capital accounts 1,121,512 * 234,177 3,882,008 15,391,297 847,430 139,950,890 105,331,722 Footnotes at end of table.
Woodproduct
manufacturing
Papermanufacturing
Printingand related
supportactivities
Petroleumand coal products
manufacturing
Chemicalmanufacturing
Apparelmanufacturing
Leather andallied
productmanufacturing
Table 3. All Partnerships and Partnerships with Net Income: Balance Sheets by Profit Status and Selected Industrial Group, Tax Year 2014—Continued
Manufacturing—continued
Item
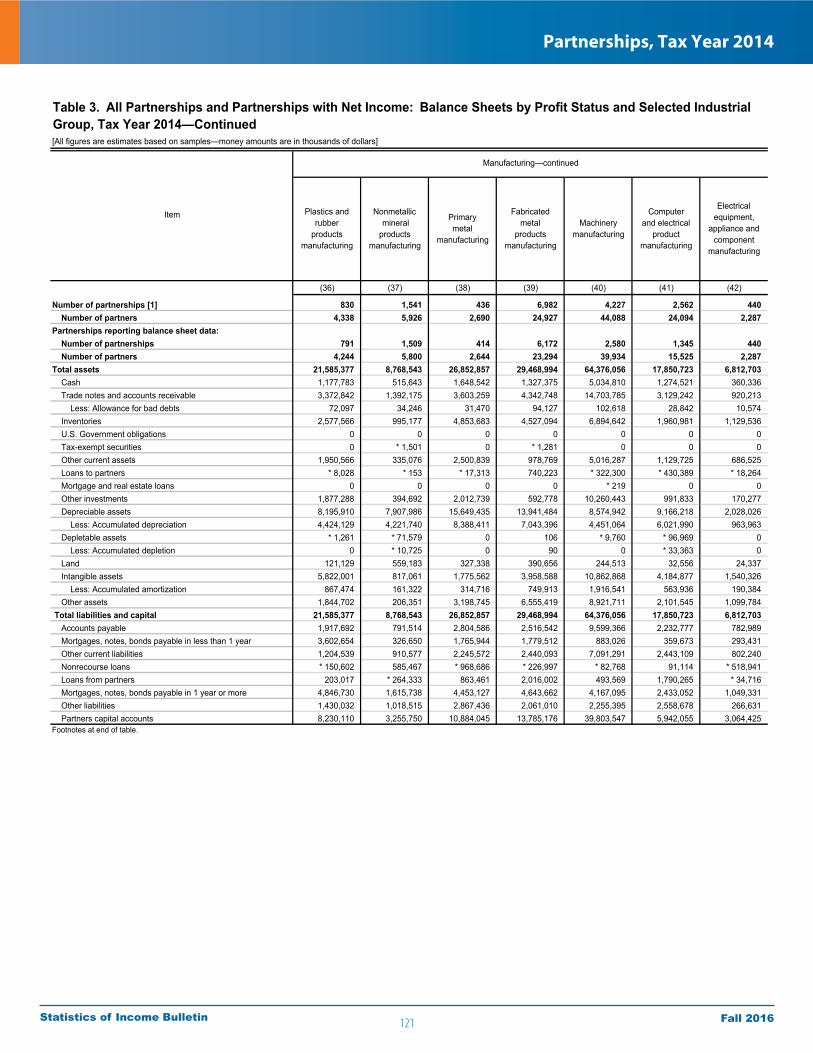
121
Partnerships, Tax Year 2014
Fall 2016Statistics of Income Bulletin
[All figures are estimates based on samples—money amounts are in thousands of dollars]
(36) (37) (38) (39) (40) (41) (42)
Number of partnerships [1] 830 1,541 436 6,982 4,227 2,562 440 Number of partners 4,338 5,926 2,690 24,927 44,088 24,094 2,287 Partnerships reporting balance sheet data: Number of partnerships 791 1,509 414 6,172 2,580 1,345 440 Number of partners 4,244 5,800 2,644 23,294 39,934 15,525 2,287 Total assets 21,585,377 8,768,543 26,852,857 29,468,994 64,376,056 17,850,723 6,812,703 Cash 1,177,783 515,643 1,648,542 1,327,375 5,034,810 1,274,521 360,336 Trade notes and accounts receivable 3,372,842 1,392,175 3,603,259 4,342,748 14,703,785 3,129,242 920,213 Less: Allowance for bad debts 72,097 34,246 31,470 94,127 102,618 28,842 10,574 Inventories 2,577,566 995,177 4,853,683 4,527,094 6,894,642 1,960,981 1,129,536 U.S. Government obligations 0 0 0 0 0 0 0 Tax-exempt securities 0 * 1,501 0 * 1,281 0 0 0 Other current assets 1,950,566 335,076 2,500,839 978,769 5,016,287 1,129,725 686,525 Loans to partners * 8,028 * 153 * 17,313 740,223 * 322,300 * 430,389 * 18,264 Mortgage and real estate loans 0 0 0 0 * 219 0 0 Other investments 1,877,288 394,692 2,012,739 592,778 10,260,443 991,833 170,277 Depreciable assets 8,195,910 7,907,986 15,649,435 13,941,484 8,574,942 9,166,218 2,028,026 Less: Accumulated depreciation 4,424,129 4,221,740 8,388,411 7,043,396 4,451,064 6,021,990 963,963 Depletable assets * 1,261 * 71,579 0 106 * 9,760 * 96,969 0 Less: Accumulated depletion 0 * 10,725 0 90 0 * 33,363 0 Land 121,129 559,183 327,338 390,656 244,513 32,556 24,337 Intangible assets 5,822,001 817,061 1,775,562 3,958,588 10,862,868 4,184,877 1,540,326 Less: Accumulated amortization 867,474 161,322 314,716 749,913 1,916,541 563,936 190,384 Other assets 1,844,702 206,351 3,198,745 6,555,419 8,921,711 2,101,545 1,099,784 Total liabilities and capital 21,585,377 8,768,543 26,852,857 29,468,994 64,376,056 17,850,723 6,812,703 Accounts payable 1,917,692 791,514 2,804,586 2,516,542 9,599,366 2,232,777 782,989 Mortgages, notes, bonds payable in less than 1 year 3,602,654 326,650 1,765,944 1,779,512 883,026 359,673 293,431 Other current liabilities 1,204,539 910,577 2,245,572 2,440,093 7,091,291 2,443,109 802,240 Nonrecourse loans * 150,602 585,467 * 968,686 * 226,997 * 82,768 91,114 * 518,941 Loans from partners 203,017 * 264,333 863,461 2,016,002 493,569 1,790,265 * 34,716 Mortgages, notes, bonds payable in 1 year or more 4,846,730 1,615,738 4,453,127 4,643,662 4,167,095 2,433,052 1,049,331 Other liabilities 1,430,032 1,018,515 2,867,436 2,061,010 2,255,395 2,558,678 266,631 Partners capital accounts 8,230,110 3,255,750 10,884,045 13,785,176 39,803,547 5,942,055 3,064,425 Footnotes at end of table.
Plastics andrubber
productsmanufacturing
Nonmetallic mineralproducts
manufacturing
Primarymetal
manufacturing
Table 3. All Partnerships and Partnerships with Net Income: Balance Sheets by Profit Status and Selected Industrial Group, Tax Year 2014—Continued
Manufacturing—continued
Item Fabricatedmetal
productsmanufacturing
Machinerymanufacturing
Computerand electrical
productmanufacturing
Electricalequipment,
appliance andcomponent
manufacturing

122
Partnerships, Tax Year 2014
Fall 2016Statistics of Income Bulletin
[All figures are estimates based on samples—money amounts are in thousands of dollars]
(36) (37) (38) (39) (40) (41) (42)PARTNERSHIPS WITH NET INCOME
Number of partnerships [1] 517 1,381 290 4,606 1,988 614 213 Number of partners 3,243 5,288 1,303 12,836 7,006 2,252 1,110 Partnerships reporting balance sheet data: Number of partnerships 478 1,361 269 3,807 1,618 548 213 Number of partners 3,149 5,226 1,259 11,234 5,435 2,121 1,110 Total assets 17,005,684 5,094,595 15,594,096 23,296,092 57,630,292 9,823,289 5,379,583 Cash 1,026,552 398,153 763,361 1,066,977 4,747,202 883,752 225,738 Trade notes and accounts receivable 2,644,469 990,463 2,300,394 3,354,016 13,739,930 2,044,916 795,396 Less: Allowance for bad debts 45,054 21,464 22,017 74,851 73,014 18,165 9,041 Inventories 1,899,711 615,466 2,808,520 3,369,267 5,873,618 1,172,826 949,569 U.S. Government obligations 0 0 0 0 0 0 0 Tax-exempt securities 0 * 1,501 0 * 1,281 0 0 0 Other current assets 1,793,927 230,619 1,443,364 729,761 4,806,327 354,988 609,057 Loans to partners * 5,769 * 153 * 17,147 739,662 * 316,195 * 345,168 * 18,264 Mortgage and real estate loans 0 0 0 0 * 219 0 0 Other investments 1,822,908 397,907 511,686 345,096 9,817,496 72,605 160,766 Depreciable assets 6,228,345 3,941,723 9,463,213 11,333,968 7,220,494 7,081,334 1,258,621 Less: Accumulated depreciation 3,691,567 2,278,588 5,435,344 5,946,720 3,947,441 5,013,424 776,393 Depletable assets * 1,261 * 47,532 0 106 * 9,760 0 0 Less: Accumulated depletion 0 * 7,538 0 90 0 0 0 Land 97,558 199,176 224,855 154,444 210,262 * 18,084 * 17,622 Intangible assets 4,061,100 552,214 1,334,518 2,919,735 8,324,886 2,580,478 1,401,058 Less: Accumulated amortization 551,187 126,583 165,053 687,154 1,360,657 241,273 126,037 Other assets 1,711,891 153,861 2,349,452 5,990,594 7,945,015 541,998 854,963 Total liabilities and capital 17,005,684 5,094,595 15,594,096 23,296,092 57,630,292 9,823,289 5,379,583 Accounts payable 1,365,084 597,110 1,680,736 1,662,895 9,038,920 1,580,356 594,283 Mortgages, notes, bonds payable in less than 1 year 3,093,182 234,766 778,574 1,073,556 538,875 178,411 264,100 Other current liabilities 890,839 419,353 646,771 1,685,934 5,942,226 1,351,956 605,390 Nonrecourse loans * 7,083 0 * 593,859 * 226,997 * 81,475 0 0 Loans from partners 44,119 * 40,248 * 648,139 1,743,706 249,976 * 118,891 * 5,115 Mortgages, notes, bonds payable in 1 year or more 2,240,211 1,136,382 1,111,200 3,013,966 2,977,940 895,250 835,393 Other liabilities 1,110,199 516,822 693,827 1,637,526 672,641 393,194 213,399 Partners capital accounts 8,254,968 2,149,915 9,440,991 12,251,511 38,128,239 5,305,231 2,861,903 Footnotes at end of table.
Plastics andrubber
productsmanufacturing
Nonmetallic mineralproducts
manufacturing
Primarymetal
manufacturing
Fabricatedmetal
productsmanufacturing
Machinerymanufacturing
Computerand electrical
productmanufacturing
Electricalequipment,
appliance andcomponent
manufacturing
Item
Table 3. All Partnerships and Partnerships with Net Income: Balance Sheets by Profit Status and Selected Industrial Group, Tax Year 2014—Continued
Manufacturing—continued
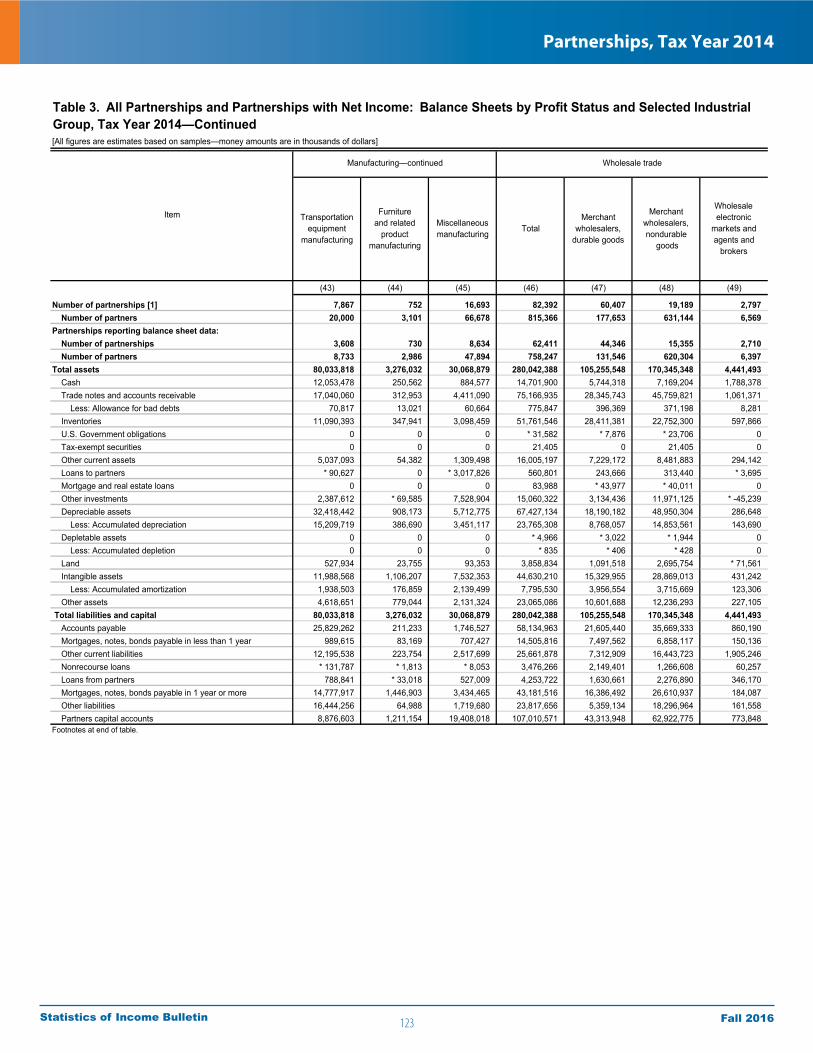
123
Partnerships, Tax Year 2014
Fall 2016Statistics of Income Bulletin
[All figures are estimates based on samples—money amounts are in thousands of dollars]
(43) (44) (45) (46) (47) (48) (49)
Number of partnerships [1] 7,867 752 16,693 82,392 60,407 19,189 2,797 Number of partners 20,000 3,101 66,678 815,366 177,653 631,144 6,569 Partnerships reporting balance sheet data: Number of partnerships 3,608 730 8,634 62,411 44,346 15,355 2,710 Number of partners 8,733 2,986 47,894 758,247 131,546 620,304 6,397 Total assets 80,033,818 3,276,032 30,068,879 280,042,388 105,255,548 170,345,348 4,441,493 Cash 12,053,478 250,562 884,577 14,701,900 5,744,318 7,169,204 1,788,378 Trade notes and accounts receivable 17,040,060 312,953 4,411,090 75,166,935 28,345,743 45,759,821 1,061,371 Less: Allowance for bad debts 70,817 13,021 60,664 775,847 396,369 371,198 8,281 Inventories 11,090,393 347,941 3,098,459 51,761,546 28,411,381 22,752,300 597,866 U.S. Government obligations 0 0 0 * 31,582 * 7,876 * 23,706 0 Tax-exempt securities 0 0 0 21,405 0 21,405 0 Other current assets 5,037,093 54,382 1,309,498 16,005,197 7,229,172 8,481,883 294,142 Loans to partners * 90,627 0 * 3,017,826 560,801 243,666 313,440 * 3,695 Mortgage and real estate loans 0 0 0 83,988 * 43,977 * 40,011 0 Other investments 2,387,612 * 69,585 7,528,904 15,060,322 3,134,436 11,971,125 * -45,239 Depreciable assets 32,418,442 908,173 5,712,775 67,427,134 18,190,182 48,950,304 286,648 Less: Accumulated depreciation 15,209,719 386,690 3,451,117 23,765,308 8,768,057 14,853,561 143,690 Depletable assets 0 0 0 * 4,966 * 3,022 * 1,944 0 Less: Accumulated depletion 0 0 0 * 835 * 406 * 428 0 Land 527,934 23,755 93,353 3,858,834 1,091,518 2,695,754 * 71,561 Intangible assets 11,988,568 1,106,207 7,532,353 44,630,210 15,329,955 28,869,013 431,242 Less: Accumulated amortization 1,938,503 176,859 2,139,499 7,795,530 3,956,554 3,715,669 123,306 Other assets 4,618,651 779,044 2,131,324 23,065,086 10,601,688 12,236,293 227,105 Total liabilities and capital 80,033,818 3,276,032 30,068,879 280,042,388 105,255,548 170,345,348 4,441,493 Accounts payable 25,829,262 211,233 1,746,527 58,134,963 21,605,440 35,669,333 860,190 Mortgages, notes, bonds payable in less than 1 year 989,615 83,169 707,427 14,505,816 7,497,562 6,858,117 150,136 Other current liabilities 12,195,538 223,754 2,517,699 25,661,878 7,312,909 16,443,723 1,905,246 Nonrecourse loans * 131,787 * 1,813 * 8,053 3,476,266 2,149,401 1,266,608 60,257 Loans from partners 788,841 * 33,018 527,009 4,253,722 1,630,661 2,276,890 346,170 Mortgages, notes, bonds payable in 1 year or more 14,777,917 1,446,903 3,434,465 43,181,516 16,386,492 26,610,937 184,087 Other liabilities 16,444,256 64,988 1,719,680 23,817,656 5,359,134 18,296,964 161,558 Partners capital accounts 8,876,603 1,211,154 19,408,018 107,010,571 43,313,948 62,922,775 773,848 Footnotes at end of table.
Wholesale trade
Item
Table 3. All Partnerships and Partnerships with Net Income: Balance Sheets by Profit Status and Selected Industrial Group, Tax Year 2014—Continued
Miscellaneousmanufacturing
TotalMerchant
wholesalers,durable goods
Merchantwholesalers,nondurable
goods
Wholesaleelectronic
markets andagents and
brokers
Manufacturing—continued
Transportationequipment
manufacturing
Furnitureand related
productmanufacturing
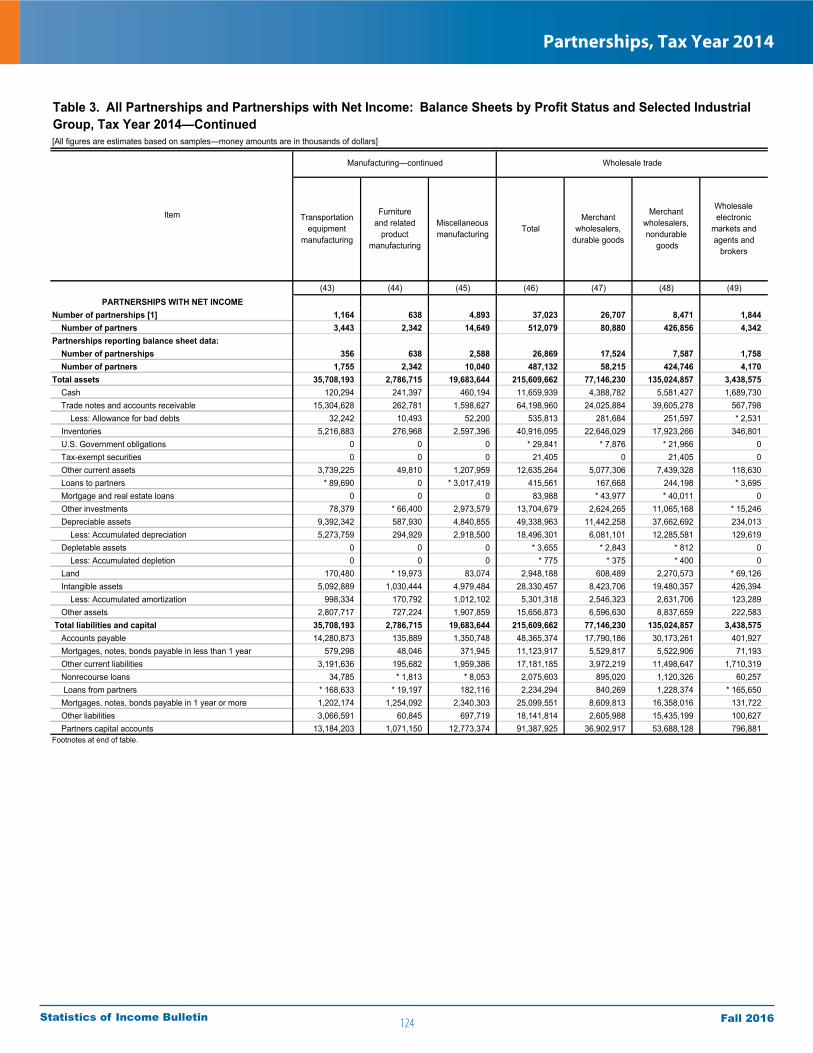
124
Partnerships, Tax Year 2014
Fall 2016Statistics of Income Bulletin
[All figures are estimates based on samples—money amounts are in thousands of dollars]
(43) (44) (45) (46) (47) (48) (49)PARTNERSHIPS WITH NET INCOME
Number of partnerships [1] 1,164 638 4,893 37,023 26,707 8,471 1,844 Number of partners 3,443 2,342 14,649 512,079 80,880 426,856 4,342 Partnerships reporting balance sheet data: Number of partnerships 356 638 2,588 26,869 17,524 7,587 1,758 Number of partners 1,755 2,342 10,040 487,132 58,215 424,746 4,170 Total assets 35,708,193 2,786,715 19,683,644 215,609,662 77,146,230 135,024,857 3,438,575 Cash 120,294 241,397 460,194 11,659,939 4,388,782 5,581,427 1,689,730 Trade notes and accounts receivable 15,304,628 262,781 1,598,627 64,198,960 24,025,884 39,605,278 567,798 Less: Allowance for bad debts 32,242 10,493 52,200 535,813 281,684 251,597 * 2,531 Inventories 5,216,883 276,968 2,597,396 40,916,095 22,646,029 17,923,266 346,801 U.S. Government obligations 0 0 0 * 29,841 * 7,876 * 21,966 0 Tax-exempt securities 0 0 0 21,405 0 21,405 0 Other current assets 3,739,225 49,810 1,207,959 12,635,264 5,077,306 7,439,328 118,630 Loans to partners * 89,690 0 * 3,017,419 415,561 167,668 244,198 * 3,695 Mortgage and real estate loans 0 0 0 83,988 * 43,977 * 40,011 0 Other investments 78,379 * 66,400 2,973,579 13,704,679 2,624,265 11,065,168 * 15,246 Depreciable assets 9,392,342 587,930 4,840,855 49,338,963 11,442,258 37,662,692 234,013 Less: Accumulated depreciation 5,273,759 294,929 2,918,500 18,496,301 6,081,101 12,285,581 129,619 Depletable assets 0 0 0 * 3,655 * 2,843 * 812 0 Less: Accumulated depletion 0 0 0 * 775 * 375 * 400 0 Land 170,480 * 19,973 83,074 2,948,188 608,489 2,270,573 * 69,126 Intangible assets 5,092,889 1,030,444 4,979,484 28,330,457 8,423,706 19,480,357 426,394 Less: Accumulated amortization 998,334 170,792 1,012,102 5,301,318 2,546,323 2,631,706 123,289 Other assets 2,807,717 727,224 1,907,859 15,656,873 6,596,630 8,837,659 222,583 Total liabilities and capital 35,708,193 2,786,715 19,683,644 215,609,662 77,146,230 135,024,857 3,438,575 Accounts payable 14,280,873 135,889 1,350,748 48,365,374 17,790,186 30,173,261 401,927 Mortgages, notes, bonds payable in less than 1 year 579,298 48,046 371,945 11,123,917 5,529,817 5,522,906 71,193 Other current liabilities 3,191,636 195,682 1,959,386 17,181,185 3,972,219 11,498,647 1,710,319 Nonrecourse loans 34,785 * 1,813 * 8,053 2,075,603 895,020 1,120,326 60,257 Loans from partners * 168,633 * 19,197 182,116 2,234,294 840,269 1,228,374 * 165,650 Mortgages, notes, bonds payable in 1 year or more 1,202,174 1,254,092 2,340,303 25,099,551 8,609,813 16,358,016 131,722 Other liabilities 3,066,591 60,845 697,719 18,141,814 2,605,988 15,435,199 100,627 Partners capital accounts 13,184,203 1,071,150 12,773,374 91,387,925 36,902,917 53,688,128 796,881 Footnotes at end of table.
Wholesale trade
TotalMerchant
wholesalers,durable goods
Merchantwholesalers,nondurable
goods
Wholesaleelectronic
markets andagents and
brokers
Item Transportationequipment
manufacturing
Furnitureand related
productmanufacturing
Miscellaneousmanufacturing
Table 3. All Partnerships and Partnerships with Net Income: Balance Sheets by Profit Status and Selected Industrial Group, Tax Year 2014—Continued
Manufacturing—continued

125
Partnerships, Tax Year 2014
Fall 2016Statistics of Income Bulletin
[All figures are estimates based on samples—money amounts are in thousands of dollars]
(50) (51) (52) (53) (54) (55) (56)
Number of partnerships [1] 168,627 18,387 4,247 5,654 5,690 25,225 8,698 Number of partners 660,347 46,039 9,567 20,795 20,052 61,837 54,229 Partnerships reporting balance sheet data: Number of partnerships 105,654 14,020 3,884 4,633 5,364 18,942 3,955 Number of partners 512,300 37,059 8,841 18,752 19,297 48,926 42,118 Total assets 211,985,157 62,200,252 5,328,889 1,823,553 8,167,243 43,057,893 7,515,401 Cash 15,122,060 5,100,094 661,537 264,458 350,468 2,468,181 762,051 Trade notes and accounts receivable 18,828,842 6,345,588 822,075 735,634 1,326,374 2,156,892 1,543,961 Less: Allowance for bad debts 438,488 45,633 19,018 * 4,935 24,611 20,219 107,929 Inventories 61,299,078 31,853,784 1,669,737 345,009 2,462,592 6,915,097 1,394,040 U.S. Government obligations 198,627 0 0 0 0 0 0 Tax-exempt securities * 11,386 0 0 0 0 0 * 1,606 Other current assets 10,416,564 2,285,223 298,354 100,591 1,388,456 1,483,718 340,103 Loans to partners 999,057 211,132 * 5,438 * 15,089 * 23,018 28,999 * 25,050 Mortgage and real estate loans * 140,553 0 0 0 * 3,599 0 * 963 Other investments 10,436,999 1,852,097 * 95,288 * 2,744 82,854 2,845,288 25,936 Depreciable assets 79,053,593 9,883,420 2,265,835 328,278 3,421,022 29,595,712 2,023,061 Less: Accumulated depreciation 40,249,151 4,447,024 1,086,135 197,746 2,455,606 15,296,115 983,083 Depletable assets * 12,517 * 220 * 32 0 0 0 0 Less: Accumulated depletion * 7,637 0 0 0 0 0 0 Land 9,629,963 1,144,758 116,397 * 3,712 833,330 3,698,451 10,975 Intangible assets 28,937,356 6,622,160 303,754 201,613 454,409 3,551,617 1,844,834 Less: Accumulated amortization 4,660,760 843,159 36,499 32,236 118,234 920,825 393,759 Other assets 22,254,598 2,237,594 232,093 61,342 419,571 6,551,098 1,027,594 Total liabilities and capital 211,985,157 62,200,252 5,328,889 1,823,553 8,167,243 43,057,893 7,515,401 Accounts payable 20,435,004 3,261,750 792,746 630,393 1,392,328 5,850,762 849,193 Mortgages, notes, bonds payable in less than 1 year 30,564,135 26,204,560 219,169 66,162 664,481 621,169 176,437 Other current liabilities 23,576,703 4,921,135 1,157,500 409,518 2,282,725 5,003,820 874,742 Nonrecourse loans 8,524,811 501,092 * 59,510 * 4,424 * 21,261 * 7,300,123 * 70,465 Loans from partners 6,018,904 1,201,299 * 117,154 * 212,941 234,586 1,349,891 282,109 Mortgages, notes, bonds payable in 1 year or more 41,194,411 6,965,646 1,236,772 139,946 1,612,936 11,407,748 1,428,286 Other liabilities 19,474,654 1,545,966 709,505 42,376 191,317 2,981,925 364,971 Partners capital accounts 62,196,536 17,598,803 1,036,535 317,794 1,767,609 8,542,456 3,469,198 Footnotes at end of table.
Item
Table 3. All Partnerships and Partnerships with Net Income: Balance Sheets by Profit Status and Selected Industrial Group, Tax Year 2014—Continued
Retail trade
Motorvehicle and
parts dealers
Furnitureand homefurnishing
stores
Electronicsand appliance
stores
Buildingmaterials and
gardenequipment and
supplies dealers
Foodand beverage
stores
Healthand personalcare stores
Total
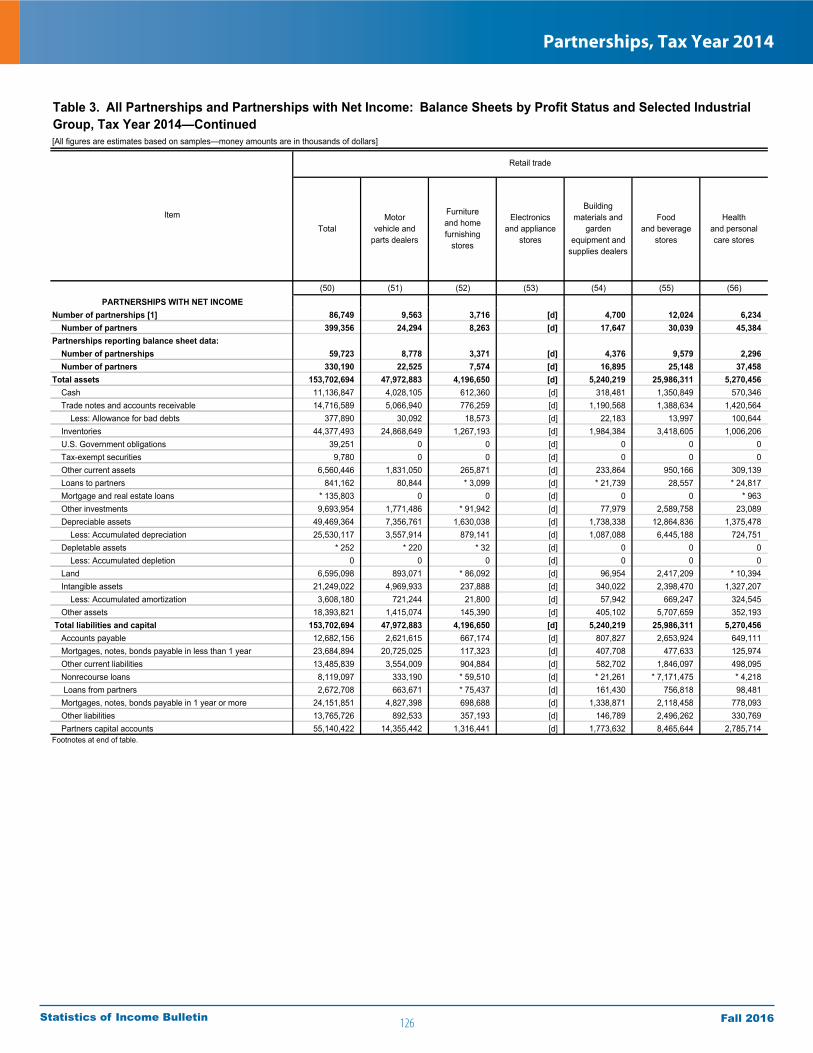
126
Partnerships, Tax Year 2014
Fall 2016Statistics of Income Bulletin
[All figures are estimates based on samples—money amounts are in thousands of dollars]
(50) (51) (52) (53) (54) (55) (56)PARTNERSHIPS WITH NET INCOME
Number of partnerships [1] 86,749 9,563 3,716 [d] 4,700 12,024 6,234 Number of partners 399,356 24,294 8,263 [d] 17,647 30,039 45,384 Partnerships reporting balance sheet data: Number of partnerships 59,723 8,778 3,371 [d] 4,376 9,579 2,296 Number of partners 330,190 22,525 7,574 [d] 16,895 25,148 37,458 Total assets 153,702,694 47,972,883 4,196,650 [d] 5,240,219 25,986,311 5,270,456 Cash 11,136,847 4,028,105 612,360 [d] 318,481 1,350,849 570,346 Trade notes and accounts receivable 14,716,589 5,066,940 776,259 [d] 1,190,568 1,388,634 1,420,564 Less: Allowance for bad debts 377,890 30,092 18,573 [d] 22,183 13,997 100,644 Inventories 44,377,493 24,868,649 1,267,193 [d] 1,984,384 3,418,605 1,006,206 U.S. Government obligations 39,251 0 0 [d] 0 0 0 Tax-exempt securities 9,780 0 0 [d] 0 0 0 Other current assets 6,560,446 1,831,050 265,871 [d] 233,864 950,166 309,139 Loans to partners 841,162 80,844 * 3,099 [d] * 21,739 28,557 * 24,817 Mortgage and real estate loans * 135,803 0 0 [d] 0 0 * 963 Other investments 9,693,954 1,771,486 * 91,942 [d] 77,979 2,589,758 23,089 Depreciable assets 49,469,364 7,356,761 1,630,038 [d] 1,738,338 12,864,836 1,375,478 Less: Accumulated depreciation 25,530,117 3,557,914 879,141 [d] 1,087,088 6,445,188 724,751 Depletable assets * 252 * 220 * 32 [d] 0 0 0 Less: Accumulated depletion 0 0 0 [d] 0 0 0 Land 6,595,098 893,071 * 86,092 [d] 96,954 2,417,209 * 10,394 Intangible assets 21,249,022 4,969,933 237,888 [d] 340,022 2,398,470 1,327,207 Less: Accumulated amortization 3,608,180 721,244 21,800 [d] 57,942 669,247 324,545 Other assets 18,393,821 1,415,074 145,390 [d] 405,102 5,707,659 352,193 Total liabilities and capital 153,702,694 47,972,883 4,196,650 [d] 5,240,219 25,986,311 5,270,456 Accounts payable 12,682,156 2,621,615 667,174 [d] 807,827 2,653,924 649,111 Mortgages, notes, bonds payable in less than 1 year 23,684,894 20,725,025 117,323 [d] 407,708 477,633 125,974 Other current liabilities 13,485,839 3,554,009 904,884 [d] 582,702 1,846,097 498,095 Nonrecourse loans 8,119,097 333,190 * 59,510 [d] * 21,261 * 7,171,475 * 4,218 Loans from partners 2,672,708 663,671 * 75,437 [d] 161,430 756,818 98,481 Mortgages, notes, bonds payable in 1 year or more 24,151,851 4,827,398 698,688 [d] 1,338,871 2,118,458 778,093 Other liabilities 13,765,726 892,533 357,193 [d] 146,789 2,496,262 330,769 Partners capital accounts 55,140,422 14,355,442 1,316,441 [d] 1,773,632 8,465,644 2,785,714 Footnotes at end of table.
TotalMotor
vehicle andparts dealers
Furnitureand homefurnishing
stores
Electronicsand appliance
stores
Buildingmaterials and
gardenequipment and
supplies dealers
Item Foodand beverage
stores
Healthand personalcare stores
Table 3. All Partnerships and Partnerships with Net Income: Balance Sheets by Profit Status and Selected Industrial Group, Tax Year 2014—Continued
Retail trade

127
Partnerships, Tax Year 2014
Fall 2016Statistics of Income Bulletin
[All figures are estimates based on samples—money amounts are in thousands of dollars]
(57) (58) (59) (60) (61) (62)
Number of partnerships [1] 5,581 18,292 11,747 2,891 30,940 31,276 Number of partners 16,602 44,634 26,351 6,553 75,435 278,253 Partnerships reporting balance sheet data: Number of partnerships 4,333 11,384 5,622 2,544 18,073 12,902 Number of partners 13,324 28,115 13,314 5,858 48,424 228,272 Total assets 14,663,430 15,228,072 8,254,801 6,252,780 12,296,827 27,196,016 Cash 845,382 845,748 803,243 153,602 1,059,716 1,807,580 Trade notes and accounts receivable 885,422 842,286 397,762 299,310 694,588 2,778,951 Less: Allowance for bad debts 26,833 26,425 * 5,449 * 21,703 5,751 129,979 Inventories 1,023,258 2,926,045 2,470,272 1,975,924 5,098,766 3,164,554 U.S. Government obligations 0 198,627 0 0 0 0 Tax-exempt securities 0 9,780 0 0 0 0 Other current assets 447,530 908,440 715,120 366,540 639,549 1,442,940 Loans to partners 27,869 * 76,931 * 6,472 533,748 * 30,359 * 14,953 Mortgage and real estate loans * 1,532 0 0 0 * 134,459 0 Other investments 583,856 * 118,423 0 * 319 374,528 4,455,667 Depreciable assets 10,654,164 2,411,800 2,714,182 4,494,849 3,564,935 7,696,334 Less: Accumulated depreciation 5,147,157 1,229,216 1,404,519 2,300,738 1,938,561 3,763,252 Depletable assets 0 0 0 0 0 * 12,265 Less: Accumulated depletion 0 0 0 0 0 * 7,637 Land 2,865,590 * 33,307 * 41,877 125,562 113,742 642,261 Intangible assets 2,234,609 879,120 2,305,389 98,657 1,338,960 9,102,233 Less: Accumulated amortization 357,110 177,525 68,708 * 36,652 278,659 1,397,393 Other assets 625,317 7,410,731 279,161 563,361 1,470,196 1,376,540 Total liabilities and capital 14,663,430 15,228,072 8,254,801 6,252,780 12,296,827 27,196,016 Accounts payable 1,451,125 1,188,220 1,446,561 369,541 897,436 2,304,948 Mortgages, notes, bonds payable in less than 1 year 330,822 490,041 179,072 * 32,503 793,559 786,159 Other current liabilities 979,229 1,396,820 930,687 1,021,701 1,675,763 2,923,063 Nonrecourse loans 358,672 * 10,893 * 26,445 0 * 10,036 * 161,890 Loans from partners 294,090 352,299 * 23,827 * 503 1,096,693 853,512 Mortgages, notes, bonds payable in 1 year or more 6,905,374 1,410,973 2,385,193 346,182 1,486,758 5,868,599 Other liabilities 621,115 8,690,131 168,206 336,928 1,660,463 2,161,752 Partners capital accounts 3,723,004 1,688,694 3,094,811 4,145,422 4,676,118 12,136,091 Footnotes at end of table.
ItemGasolinestations
Clothing andclothing
accessoriesstores
Sportinggoods, hobby,
book, andmusic stores
Generalmerchandise
stores
Table 3. All Partnerships and Partnerships with Net Income: Balance Sheets by Profit Status and Selected Industrial Group, Tax Year 2014—Continued
Retail trade—continued
Miscellaneousstore
retailers
Nonstoreretailers
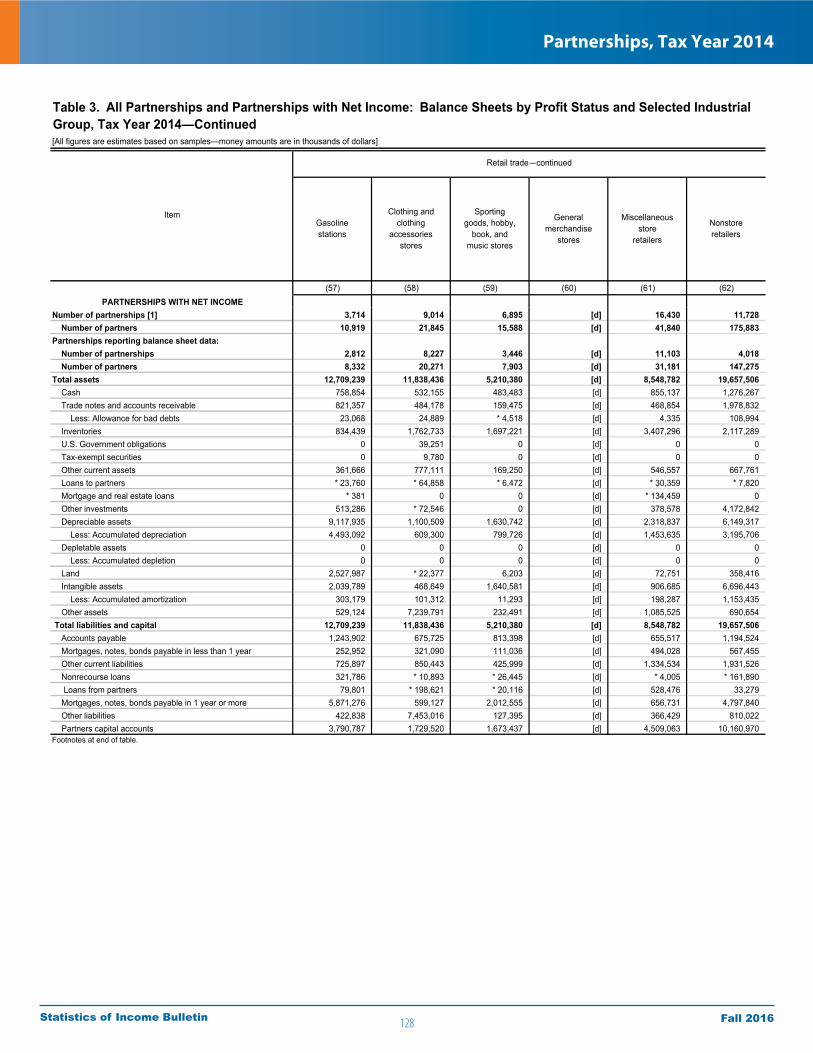
128
Partnerships, Tax Year 2014
Fall 2016Statistics of Income Bulletin
[All figures are estimates based on samples—money amounts are in thousands of dollars]
(57) (58) (59) (60) (61) (62)PARTNERSHIPS WITH NET INCOME
Number of partnerships [1] 3,714 9,014 6,895 [d] 16,430 11,728 Number of partners 10,919 21,845 15,588 [d] 41,840 175,883 Partnerships reporting balance sheet data: Number of partnerships 2,812 8,227 3,446 [d] 11,103 4,018 Number of partners 8,332 20,271 7,903 [d] 31,181 147,275 Total assets 12,709,239 11,838,436 5,210,380 [d] 8,548,782 19,657,506 Cash 758,854 532,155 483,483 [d] 855,137 1,276,267 Trade notes and accounts receivable 821,357 484,178 159,475 [d] 468,854 1,978,832 Less: Allowance for bad debts 23,068 24,889 * 4,518 [d] 4,335 108,994 Inventories 834,439 1,762,733 1,697,221 [d] 3,407,296 2,117,289 U.S. Government obligations 0 39,251 0 [d] 0 0 Tax-exempt securities 0 9,780 0 [d] 0 0 Other current assets 361,666 777,111 169,250 [d] 546,557 667,761 Loans to partners * 23,760 * 64,858 * 6,472 [d] * 30,359 * 7,820 Mortgage and real estate loans * 381 0 0 [d] * 134,459 0 Other investments 513,286 * 72,546 0 [d] 378,578 4,172,842 Depreciable assets 9,117,935 1,100,509 1,630,742 [d] 2,318,837 6,149,317 Less: Accumulated depreciation 4,493,092 609,300 799,726 [d] 1,453,635 3,195,706 Depletable assets 0 0 0 [d] 0 0 Less: Accumulated depletion 0 0 0 [d] 0 0 Land 2,527,987 * 22,377 6,203 [d] 72,751 358,416 Intangible assets 2,039,789 468,649 1,640,581 [d] 906,685 6,696,443 Less: Accumulated amortization 303,179 101,312 11,293 [d] 198,287 1,153,435 Other assets 529,124 7,239,791 232,491 [d] 1,085,525 690,654 Total liabilities and capital 12,709,239 11,838,436 5,210,380 [d] 8,548,782 19,657,506 Accounts payable 1,243,902 675,725 813,398 [d] 655,517 1,194,524 Mortgages, notes, bonds payable in less than 1 year 252,952 321,090 111,036 [d] 494,028 567,455 Other current liabilities 725,897 850,443 425,999 [d] 1,334,534 1,931,526 Nonrecourse loans 321,786 * 10,893 * 26,445 [d] * 4,005 * 161,890 Loans from partners 79,801 * 198,621 * 20,116 [d] 528,476 33,279 Mortgages, notes, bonds payable in 1 year or more 5,871,276 599,127 2,012,555 [d] 656,731 4,797,840 Other liabilities 422,838 7,453,016 127,395 [d] 366,429 810,022 Partners capital accounts 3,790,787 1,729,520 1,673,437 [d] 4,509,063 10,160,970 Footnotes at end of table.
ItemGasolinestations
Clothing andclothing
accessoriesstores
Sportinggoods, hobby,
book, andmusic stores
Generalmerchandise
stores
Miscellaneousstore
retailers
Nonstoreretailers
Table 3. All Partnerships and Partnerships with Net Income: Balance Sheets by Profit Status and Selected Industrial Group, Tax Year 2014—Continued
Retail trade—continued

129
Partnerships, Tax Year 2014
Fall 2016Statistics of Income Bulletin
[All figures are estimates based on samples—money amounts are in thousands of dollars]
(63) (64) (65) (66) (67) (68) (69)
Number of partnerships [1] 46,650 5,186 [d] 19,003 9,501 592 * 1,137 Number of partners 3,119,120 11,159 [d] 43,597 20,745 2,930,957 * 2,305 Partnerships reporting balance sheet data: Number of partnerships 35,835 5,156 [d] 11,812 6,495 526 * 1,137 Number of partners 2,275,856 11,098 [d] 28,428 14,732 2,110,408 * 2,305 Total assets 571,533,101 22,538,981 [d] 11,654,346 2,663,527 456,812,904 * 1,175,863 Cash 10,131,390 735,193 [d] 982,435 166,319 5,168,800 * 87,085 Trade notes and accounts receivable 63,198,673 11,660,209 [d] 3,137,341 433,153 32,683,292 * 43,787 Less: Allowance for bad debts 124,385 11,257 [d] 28,228 * 7,914 15,259 158 Inventories 4,639,919 204,472 [d] 88,552 * 5,770 3,576,451 * 2,015 U.S. Government obligations 0 0 [d] 0 0 0 0 Tax-exempt securities 0 0 [d] 0 0 0 0 Other current assets 11,579,141 1,053,456 [d] 966,854 208,888 6,692,816 * 100,803 Loans to partners 904,971 * 20,072 [d] 54,913 * 48,705 * 236,157 0 Mortgage and real estate loans 0 0 [d] 0 0 0 0 Other investments 73,561,716 351,916 [d] 290,799 * 61,069 66,294,421 * 52,697 Depreciable assets 404,226,304 11,970,948 [d] 10,855,115 1,362,526 337,158,314 * 1,067,149 Less: Accumulated depreciation 89,600,756 5,251,772 [d] 5,631,530 577,903 66,559,863 * 220,983 Depletable assets * 75,761 0 [d] 0 0 * 75,761 0 Less: Accumulated depletion * 9,455 0 [d] 0 0 * 9,455 0 Land 2,680,098 * 126,995 [d] 93,186 2 1,820,717 0 Intangible assets 54,119,922 472,776 [d] 612,173 1,067,921 38,075,658 * 93,794 Less: Accumulated amortization 4,873,768 145,363 [d] 204,507 127,352 2,663,421 * 68,417 Other assets 41,023,570 1,351,333 [d] 437,244 22,344 34,278,516 * 18,090 Total liabilities and capital 571,533,101 22,538,981 [d] 11,654,346 2,663,527 456,812,904 * 1,175,863 Accounts payable 46,054,886 10,060,388 [d] 1,746,680 167,387 21,964,835 * 9,497 Mortgages, notes, bonds payable in less than 1 year 13,428,400 231,395 [d] 911,453 535,485 10,496,160 0 Other current liabilities 26,018,977 2,699,026 [d] 1,361,502 515,886 17,124,930 * 220,295 Nonrecourse loans 10,279,532 * 178,804 [d] 477,855 0 2,527,039 0 Loans from partners 3,755,850 * 622,559 [d] 327,878 * 20,114 * 1,625,476 * 1,535 Mortgages, notes, bonds payable in 1 year or more 141,191,253 3,779,111 [d] 3,141,690 284,731 116,783,764 * 71,591 Other liabilities 47,187,284 1,495,477 [d] 1,004,686 141,427 33,491,682 * 32,103 Partners capital accounts 283,616,920 3,472,221 [d] 2,682,602 998,498 252,799,018 * 840,842 Footnotes at end of table.
Item
Table 3. All Partnerships and Partnerships with Net Income: Balance Sheets by Profit Status and Selected Industrial Group, Tax Year 2014—Continued
Scenic andsightseeing
transportationTotal Air and rail
transportation
Transportation and warehousing
Watertransportation
Trucktransportation
Other transitand groundpassenger
transportation
Pipelinetransportation
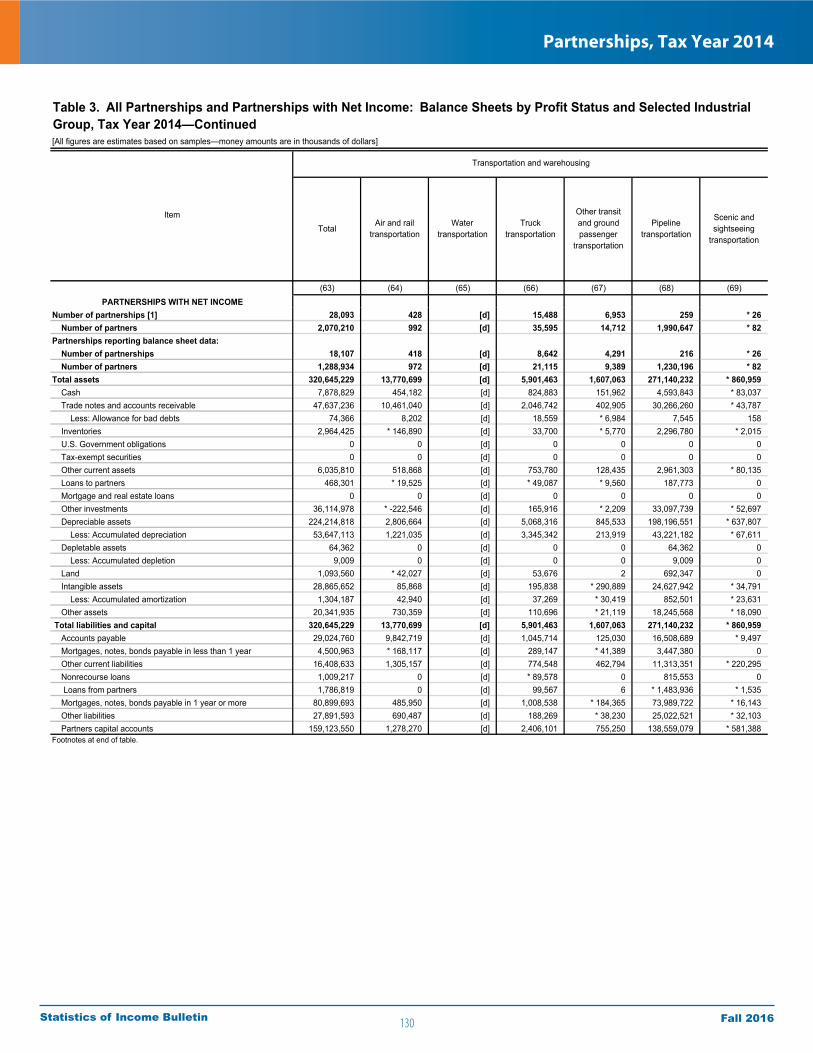
130
Partnerships, Tax Year 2014
Fall 2016Statistics of Income Bulletin
[All figures are estimates based on samples—money amounts are in thousands of dollars]
(63) (64) (65) (66) (67) (68) (69)PARTNERSHIPS WITH NET INCOME
Number of partnerships [1] 28,093 428 [d] 15,488 6,953 259 * 26 Number of partners 2,070,210 992 [d] 35,595 14,712 1,990,647 * 82 Partnerships reporting balance sheet data: Number of partnerships 18,107 418 [d] 8,642 4,291 216 * 26 Number of partners 1,288,934 972 [d] 21,115 9,389 1,230,196 * 82 Total assets 320,645,229 13,770,699 [d] 5,901,463 1,607,063 271,140,232 * 860,959 Cash 7,878,829 454,182 [d] 824,883 151,962 4,593,843 * 83,037 Trade notes and accounts receivable 47,637,236 10,461,040 [d] 2,046,742 402,905 30,266,260 * 43,787 Less: Allowance for bad debts 74,366 8,202 [d] 18,559 * 6,984 7,545 158 Inventories 2,964,425 * 146,890 [d] 33,700 * 5,770 2,296,780 * 2,015 U.S. Government obligations 0 0 [d] 0 0 0 0 Tax-exempt securities 0 0 [d] 0 0 0 0 Other current assets 6,035,810 518,868 [d] 753,780 128,435 2,961,303 * 80,135 Loans to partners 468,301 * 19,525 [d] * 49,087 * 9,560 187,773 0 Mortgage and real estate loans 0 0 [d] 0 0 0 0 Other investments 36,114,978 * -222,546 [d] 165,916 * 2,209 33,097,739 * 52,697 Depreciable assets 224,214,818 2,806,664 [d] 5,068,316 845,533 198,196,551 * 637,807 Less: Accumulated depreciation 53,647,113 1,221,035 [d] 3,345,342 213,919 43,221,182 * 67,611 Depletable assets 64,362 0 [d] 0 0 64,362 0 Less: Accumulated depletion 9,009 0 [d] 0 0 9,009 0 Land 1,093,560 * 42,027 [d] 53,676 2 692,347 0 Intangible assets 28,865,652 85,868 [d] 195,838 * 290,889 24,627,942 * 34,791 Less: Accumulated amortization 1,304,187 42,940 [d] 37,269 * 30,419 852,501 * 23,631 Other assets 20,341,935 730,359 [d] 110,696 * 21,119 18,245,568 * 18,090 Total liabilities and capital 320,645,229 13,770,699 [d] 5,901,463 1,607,063 271,140,232 * 860,959 Accounts payable 29,024,760 9,842,719 [d] 1,045,714 125,030 16,508,689 * 9,497 Mortgages, notes, bonds payable in less than 1 year 4,500,963 * 168,117 [d] 289,147 * 41,389 3,447,380 0 Other current liabilities 16,408,633 1,305,157 [d] 774,548 462,794 11,313,351 * 220,295 Nonrecourse loans 1,009,217 0 [d] * 89,578 0 815,553 0 Loans from partners 1,786,819 0 [d] 99,567 6 * 1,483,936 * 1,535 Mortgages, notes, bonds payable in 1 year or more 80,899,693 485,950 [d] 1,008,538 * 184,365 73,989,722 * 16,143 Other liabilities 27,891,593 690,487 [d] 188,269 * 38,230 25,022,521 * 32,103 Partners capital accounts 159,123,550 1,278,270 [d] 2,406,101 755,250 138,559,079 * 581,388 Footnotes at end of table.
Air and railtransportation
Watertransportation
Trucktransportation
Other transitand groundpassenger
transportation
Pipelinetransportation
Scenic andsightseeing
transportationTotal
Item
Table 3. All Partnerships and Partnerships with Net Income: Balance Sheets by Profit Status and Selected Industrial Group, Tax Year 2014—Continued
Transportation and warehousing

131
Partnerships, Tax Year 2014
Fall 2016Statistics of Income Bulletin
[All figures are estimates based on samples—money amounts are in thousands of dollars]
(70) (71) (72) (73) (74) (75) (76)
Number of partnerships [1] 9,857 [d] 1,012 42,168 8,169 14,498 1,871 Number of partners 28,104 [d] 11,552 173,729 28,638 44,731 7,091 Partnerships reporting balance sheet data: Number of partnerships 9,373 [d] 987 32,649 4,230 11,240 1,145 Number of partners 26,822 [d] 11,455 147,747 16,217 37,897 4,710 Total assets 29,844,871 [d] 26,891,646 763,710,792 27,875,635 39,235,153 139,953,711 Cash 1,822,118 [d] 400,209 16,464,756 1,519,770 2,691,751 4,763,797 Trade notes and accounts receivable 3,812,219 [d] 10,425,431 50,263,310 3,211,288 5,203,060 10,104,615 Less: Allowance for bad debts 45,201 [d] 5,781 2,225,388 444,265 152,926 435,395 Inventories 410,012 [d] 283,362 9,512,044 719,687 4,199,138 * 256,071 U.S. Government obligations 0 [d] 0 0 0 0 0 Tax-exempt securities 0 [d] 0 * 17,029 0 * 13,055 0 Other current assets 1,423,648 [d] 279,367 60,713,231 4,381,760 3,720,974 7,305,864 Loans to partners 190,241 [d] * 350,100 13,019,310 * 47,239 * 33,589 * 9,591 Mortgage and real estate loans 0 [d] 0 * 19,264 0 0 * 19,264 Other investments 764,801 [d] 2,624,302 178,237,141 3,855,363 4,155,123 19,451,236 Depreciable assets 16,590,255 [d] 12,434,540 248,267,762 4,734,668 8,365,936 40,949,475 Less: Accumulated depreciation 5,289,921 [d] 2,915,597 128,570,808 2,935,250 5,291,395 19,638,558 Depletable assets 0 [d] 0 0 0 0 0 Less: Accumulated depletion 0 [d] 0 0 0 0 0 Land 233,695 [d] 372,696 1,677,112 175,232 134,174 717,545 Intangible assets 8,628,534 [d] 2,585,013 260,566,065 11,574,065 12,153,857 67,055,259 Less: Accumulated amortization 1,036,643 [d] 104,714 32,026,511 4,897,754 7,868,874 10,651,269 Other assets 2,341,114 [d] 162,718 87,776,473 5,933,833 11,877,692 20,046,214 Total liabilities and capital 29,844,871 [d] 26,891,646 763,710,792 27,875,635 39,235,153 139,953,711 Accounts payable 1,491,222 [d] 10,314,502 39,678,899 1,087,651 1,239,317 3,948,699 Mortgages, notes, bonds payable in less than 1 year 639,621 [d] 130,694 9,342,923 339,658 873,569 3,904,380 Other current liabilities 1,814,718 [d] 985,143 56,663,206 5,974,824 11,128,849 7,094,988 Nonrecourse loans * 7,023,693 [d] * 72,141 5,621,951 * 54,101 * 1,335,297 0 Loans from partners 705,802 [d] * 374,823 24,662,682 * 205,452 194,839 * 1,494,583 Mortgages, notes, bonds payable in 1 year or more 6,225,462 [d] 4,007,265 79,283,540 3,091,672 8,359,318 44,055,910 Other liabilities 7,623,995 [d] 383,058 39,462,954 5,937,622 9,863,070 15,853,576 Partners capital accounts 4,320,357 [d] 10,624,019 508,994,635 11,184,656 6,240,892 63,601,576 Footnotes at end of table.
Table 3. All Partnerships and Partnerships with Net Income: Balance Sheets by Profit Status and Selected Industrial Group, Tax Year 2014—Continued
Item Motion pictureand soundrecordingindustries
Broadcasting(except internet)
Supportactivities for
transportation
Couriersand
messengers
Warehousingand
storageTotal
Publishingindustries
(except internet)
Transportation and warehousing—continued Information
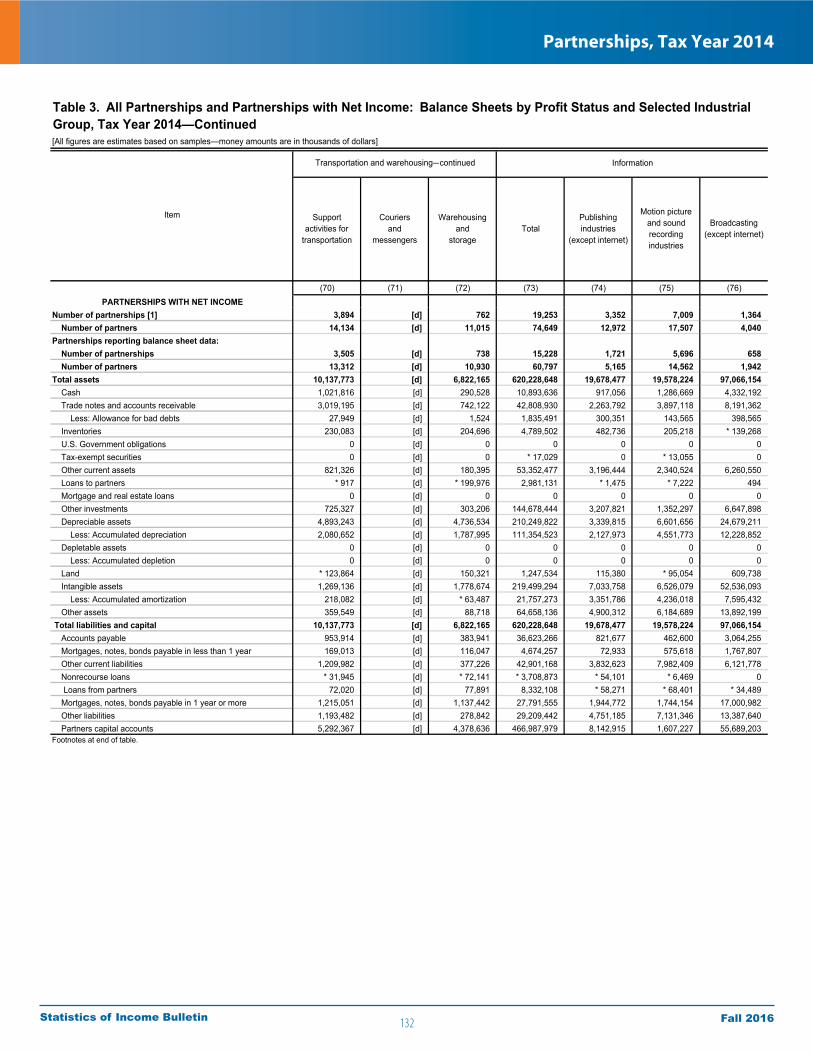
132
Partnerships, Tax Year 2014
Fall 2016Statistics of Income Bulletin
[All figures are estimates based on samples—money amounts are in thousands of dollars]
(70) (71) (72) (73) (74) (75) (76)PARTNERSHIPS WITH NET INCOME
Number of partnerships [1] 3,894 [d] 762 19,253 3,352 7,009 1,364 Number of partners 14,134 [d] 11,015 74,649 12,972 17,507 4,040 Partnerships reporting balance sheet data: Number of partnerships 3,505 [d] 738 15,228 1,721 5,696 658 Number of partners 13,312 [d] 10,930 60,797 5,165 14,562 1,942 Total assets 10,137,773 [d] 6,822,165 620,228,648 19,678,477 19,578,224 97,066,154 Cash 1,021,816 [d] 290,528 10,893,636 917,056 1,286,669 4,332,192 Trade notes and accounts receivable 3,019,195 [d] 742,122 42,808,930 2,263,792 3,897,118 8,191,362 Less: Allowance for bad debts 27,949 [d] 1,524 1,835,491 300,351 143,565 398,565 Inventories 230,083 [d] 204,696 4,789,502 482,736 205,218 * 139,268 U.S. Government obligations 0 [d] 0 0 0 0 0 Tax-exempt securities 0 [d] 0 * 17,029 0 * 13,055 0 Other current assets 821,326 [d] 180,395 53,352,477 3,196,444 2,340,524 6,260,550 Loans to partners * 917 [d] * 199,976 2,981,131 * 1,475 * 7,222 494 Mortgage and real estate loans 0 [d] 0 0 0 0 0 Other investments 725,327 [d] 303,206 144,678,444 3,207,821 1,352,297 6,647,898 Depreciable assets 4,893,243 [d] 4,736,534 210,249,822 3,339,815 6,601,656 24,679,211 Less: Accumulated depreciation 2,080,652 [d] 1,787,995 111,354,523 2,127,973 4,551,773 12,228,852 Depletable assets 0 [d] 0 0 0 0 0 Less: Accumulated depletion 0 [d] 0 0 0 0 0 Land * 123,864 [d] 150,321 1,247,534 115,380 * 95,054 609,738 Intangible assets 1,269,136 [d] 1,778,674 219,499,294 7,033,758 6,526,079 52,536,093 Less: Accumulated amortization 218,082 [d] * 63,487 21,757,273 3,351,786 4,236,018 7,595,432 Other assets 359,549 [d] 88,718 64,658,136 4,900,312 6,184,689 13,892,199 Total liabilities and capital 10,137,773 [d] 6,822,165 620,228,648 19,678,477 19,578,224 97,066,154 Accounts payable 953,914 [d] 383,941 36,623,266 821,677 462,600 3,064,255 Mortgages, notes, bonds payable in less than 1 year 169,013 [d] 116,047 4,674,257 72,933 575,618 1,767,807 Other current liabilities 1,209,982 [d] 377,226 42,901,168 3,832,623 7,982,409 6,121,778 Nonrecourse loans * 31,945 [d] * 72,141 * 3,708,873 * 54,101 * 6,469 0 Loans from partners 72,020 [d] 77,891 8,332,108 * 58,271 * 68,401 * 34,489 Mortgages, notes, bonds payable in 1 year or more 1,215,051 [d] 1,137,442 27,791,555 1,944,772 1,744,154 17,000,982 Other liabilities 1,193,482 [d] 278,842 29,209,442 4,751,185 7,131,346 13,387,640 Partners capital accounts 5,292,367 [d] 4,378,636 466,987,979 8,142,915 1,607,227 55,689,203 Footnotes at end of table.
TotalPublishingindustries
(except internet)
Motion pictureand soundrecordingindustries
Broadcasting(except internet)
Supportactivities for
transportation
Couriersand
messengers
Warehousingand
storage
Item
Table 3. All Partnerships and Partnerships with Net Income: Balance Sheets by Profit Status and Selected Industrial Group, Tax Year 2014—Continued
Transportation and warehousing—continued Information
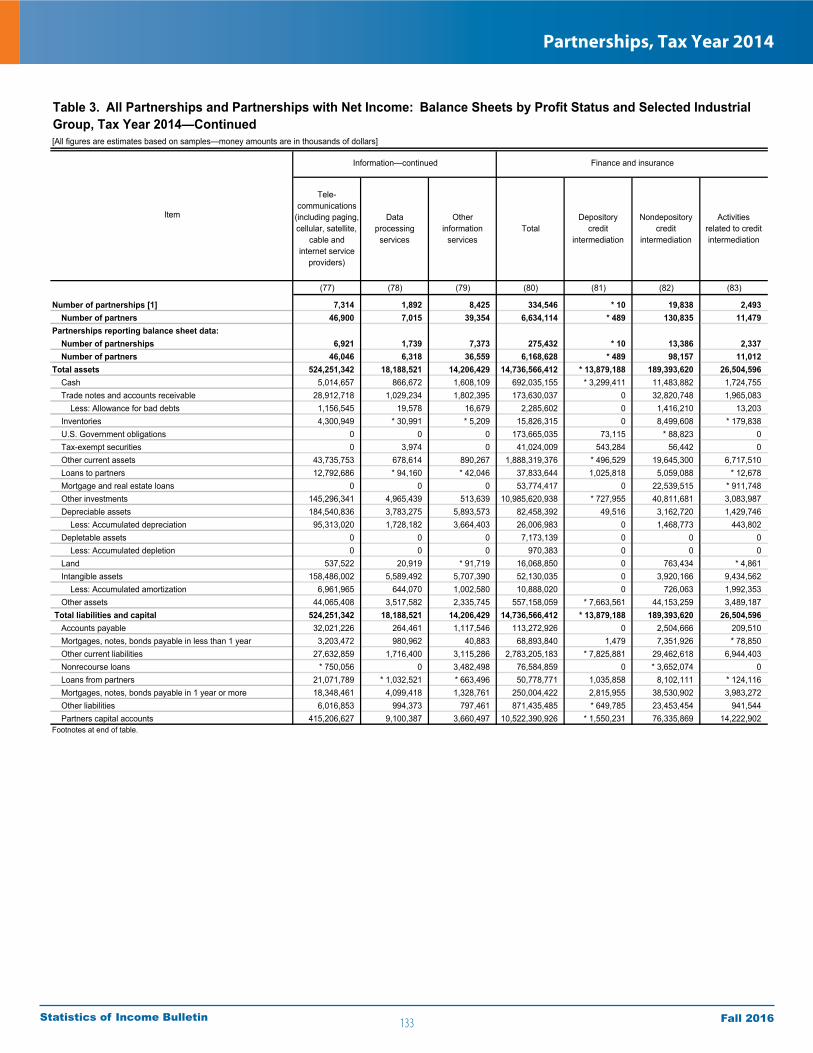
133
Partnerships, Tax Year 2014
Fall 2016Statistics of Income Bulletin
[All figures are estimates based on samples—money amounts are in thousands of dollars]
(77) (78) (79) (80) (81) (82) (83)
Number of partnerships [1] 7,314 1,892 8,425 334,546 * 10 19,838 2,493 Number of partners 46,900 7,015 39,354 6,634,114 * 489 130,835 11,479 Partnerships reporting balance sheet data: Number of partnerships 6,921 1,739 7,373 275,432 * 10 13,386 2,337 Number of partners 46,046 6,318 36,559 6,168,628 * 489 98,157 11,012 Total assets 524,251,342 18,188,521 14,206,429 14,736,566,412 * 13,879,188 189,393,620 26,504,596 Cash 5,014,657 866,672 1,608,109 692,035,155 * 3,299,411 11,483,882 1,724,755 Trade notes and accounts receivable 28,912,718 1,029,234 1,802,395 173,630,037 0 32,820,748 1,965,083 Less: Allowance for bad debts 1,156,545 19,578 16,679 2,285,602 0 1,416,210 13,203 Inventories 4,300,949 * 30,991 * 5,209 15,826,315 0 8,499,608 * 179,838 U.S. Government obligations 0 0 0 173,665,035 73,115 * 88,823 0 Tax-exempt securities 0 3,974 0 41,024,009 543,284 56,442 0 Other current assets 43,735,753 678,614 890,267 1,888,319,376 * 496,529 19,645,300 6,717,510 Loans to partners 12,792,686 * 94,160 * 42,046 37,833,644 1,025,818 5,059,088 * 12,678 Mortgage and real estate loans 0 0 0 53,774,417 0 22,539,515 * 911,748 Other investments 145,296,341 4,965,439 513,639 10,985,620,938 * 727,955 40,811,681 3,083,987 Depreciable assets 184,540,836 3,783,275 5,893,573 82,458,392 49,516 3,162,720 1,429,746 Less: Accumulated depreciation 95,313,020 1,728,182 3,664,403 26,006,983 0 1,468,773 443,802 Depletable assets 0 0 0 7,173,139 0 0 0 Less: Accumulated depletion 0 0 0 970,383 0 0 0 Land 537,522 20,919 * 91,719 16,068,850 0 763,434 * 4,861 Intangible assets 158,486,002 5,589,492 5,707,390 52,130,035 0 3,920,166 9,434,562 Less: Accumulated amortization 6,961,965 644,070 1,002,580 10,888,020 0 726,063 1,992,353 Other assets 44,065,408 3,517,582 2,335,745 557,158,059 * 7,663,561 44,153,259 3,489,187 Total liabilities and capital 524,251,342 18,188,521 14,206,429 14,736,566,412 * 13,879,188 189,393,620 26,504,596 Accounts payable 32,021,226 264,461 1,117,546 113,272,926 0 2,504,666 209,510 Mortgages, notes, bonds payable in less than 1 year 3,203,472 980,962 40,883 68,893,840 1,479 7,351,926 * 78,850 Other current liabilities 27,632,859 1,716,400 3,115,286 2,783,205,183 * 7,825,881 29,462,618 6,944,403 Nonrecourse loans * 750,056 0 3,482,498 76,584,859 0 * 3,652,074 0 Loans from partners 21,071,789 * 1,032,521 * 663,496 50,778,771 1,035,858 8,102,111 * 124,116 Mortgages, notes, bonds payable in 1 year or more 18,348,461 4,099,418 1,328,761 250,004,422 2,815,955 38,530,902 3,983,272 Other liabilities 6,016,853 994,373 797,461 871,435,485 * 649,785 23,453,454 941,544 Partners capital accounts 415,206,627 9,100,387 3,660,497 10,522,390,926 * 1,550,231 76,335,869 14,222,902 Footnotes at end of table.
Nondepositorycredit
intermediation
Activitiesrelated to creditintermediation
Depositorycredit
intermediation
Item
Table 3. All Partnerships and Partnerships with Net Income: Balance Sheets by Profit Status and Selected Industrial Group, Tax Year 2014—Continued
Tele-communications
(including paging, cellular, satellite,
cable and internet service
providers)
Dataprocessing
services
Otherinformation
servicesTotal
Information—continued Finance and insurance

134
Partnerships, Tax Year 2014
Fall 2016Statistics of Income Bulletin
[All figures are estimates based on samples—money amounts are in thousands of dollars]
(77) (78) (79) (80) (81) (82) (83)PARTNERSHIPS WITH NET INCOME
Number of partnerships [1] 1,668 1,160 4,700 228,814 * 10 13,442 805 Number of partners 24,216 3,705 12,209 5,314,973 * 489 99,020 6,977 Partnerships reporting balance sheet data: Number of partnerships 1,660 1,157 4,335 191,034 * 10 8,346 649 Number of partners 24,194 3,457 11,476 4,967,408 * 489 69,075 6,511 Total assets 468,965,824 5,484,803 9,455,167 12,141,129,477 * 13,879,188 154,211,749 24,527,803 Cash 2,494,571 563,492 1,299,656 550,090,809 * 3,299,411 6,942,069 1,450,154 Trade notes and accounts receivable 26,463,452 769,533 1,223,674 147,632,303 0 28,773,029 1,852,831 Less: Allowance for bad debts 973,432 9,950 9,627 1,440,030 0 1,050,672 12,977 Inventories 3,928,619 * 30,685 * 2,976 6,588,735 0 * 281,056 * 177,589 U.S. Government obligations 0 0 0 168,190,103 73,115 * 88,823 0 Tax-exempt securities 0 3,974 0 36,730,222 543,284 56,442 0 Other current assets 40,604,049 252,981 697,930 1,308,875,037 * 496,529 17,297,538 6,601,370 Loans to partners * 2,836,681 * 94,160 * 41,099 32,327,859 1,025,818 4,644,696 * 12,250 Mortgage and real estate loans 0 0 0 45,935,562 0 18,364,720 * 911,748 Other investments 132,863,007 340,382 267,040 9,286,843,902 * 727,955 36,587,398 3,083,987 Depreciable assets 168,689,177 2,015,161 4,924,802 50,854,914 49,516 1,628,826 247,441 Less: Accumulated depreciation 88,401,392 1,079,661 2,964,872 16,175,007 0 679,898 141,178 Depletable assets 0 0 0 6,258,434 0 0 0 Less: Accumulated depletion 0 0 0 886,614 0 0 0 Land 347,983 0 79,378 9,554,136 0 486,504 * 4,861 Intangible assets 148,248,259 2,106,673 3,048,432 44,477,628 0 3,204,412 8,808,434 Less: Accumulated amortization 5,549,840 270,558 753,637 8,761,675 0 537,753 1,866,285 Other assets 37,414,690 667,931 1,598,316 474,033,157 * 7,663,561 38,124,558 3,397,579 Total liabilities and capital 468,965,824 5,484,803 9,455,167 12,141,129,477 * 13,879,188 154,211,749 24,527,803 Accounts payable 31,302,304 177,753 794,677 102,345,757 0 2,268,812 158,775 Mortgages, notes, bonds payable in less than 1 year 2,116,075 * 110,832 * 30,991 55,292,036 1,479 6,085,694 * 53,814 Other current liabilities 21,800,174 446,910 2,717,273 1,987,895,680 * 7,825,881 16,783,721 6,616,005 Nonrecourse loans 165,806 0 3,482,498 63,625,085 0 * 2,684,837 0 Loans from partners 8,090,436 * 3,645 * 76,866 40,403,376 1,035,858 6,264,464 * 1,524 Mortgages, notes, bonds payable in 1 year or more 6,359,031 * 283,805 458,810 194,905,505 2,815,955 33,215,247 2,600,792 Other liabilities 3,134,124 291,433 513,714 667,365,179 * 649,785 19,445,285 807,807 Partners capital accounts 395,997,874 4,170,423 1,380,336 9,029,296,859 * 1,550,231 67,463,689 14,289,085 Footnotes at end of table.
Tele-communications
(including paging, cellular, satellite,
cable and internet service
providers)
Dataprocessing
services
Otherinformation
servicesTotal
Depositorycredit
intermediation
Nondepositorycredit
intermediation
Activitiesrelated to creditintermediation
Item
Table 3. All Partnerships and Partnerships with Net Income: Balance Sheets by Profit Status and Selected Industrial Group, Tax Year 2014—Continued
Information—continued Finance and insurance

135
Partnerships, Tax Year 2014
Fall 2016Statistics of Income Bulletin
[All figures are estimates based on samples—money amounts are in thousands of dollars]
Real estate
(84) (85) (86) (87) (88) (89) (90)
Number of partnerships [1] 254,206 10,369 243,837 13,564 44,434 1,816,889 1,781,949 Number of partners 5,163,383 375,341 4,788,042 52,396 1,275,532 7,887,184 7,577,856 Partnerships reporting balance sheet data: Number of partnerships 207,823 7,667 200,156 12,669 39,207 1,438,669 1,413,777 Number of partners 4,932,859 369,836 4,563,022 48,172 1,077,939 6,601,052 6,319,072 Total assets 12,779,713,135 565,512,863 12,214,200,272 19,881,866 1,707,194,007 5,636,547,190 5,481,666,674 Cash 621,365,719 59,247,491 562,118,228 3,837,118 50,324,269 240,128,359 232,493,453 Trade notes and accounts receivable 110,978,148 44,101,495 66,876,654 2,240,001 25,626,058 54,352,994 41,800,357 Less: Allowance for bad debts 631,019 42,875 588,144 32,867 192,304 2,042,332 1,856,472 Inventories 6,778,670 2,770,676 4,007,994 * 6,876 361,323 29,363,562 28,053,980 U.S. Government obligations 160,868,096 998,508 159,869,588 * 23,972 12,611,029 468,508 468,508 Tax-exempt securities 36,145,419 * 12,012,482 24,132,937 0 4,278,863 3,455,554 3,455,554 Other current assets 1,746,105,277 243,362,498 1,502,742,779 2,225,164 113,129,597 225,850,029 218,017,259 Loans to partners 23,955,094 949,267 23,005,827 * 34,885 7,746,080 18,249,172 17,630,683 Mortgage and real estate loans 21,485,100 * 247,960 21,237,139 0 8,838,054 30,098,205 30,083,050 Other investments 9,594,775,581 82,426,376 9,512,349,204 4,189,062 1,342,032,673 1,071,733,163 1,049,144,718 Depreciable assets 67,252,935 8,176,439 59,076,495 1,216,983 9,346,493 3,591,207,100 3,480,756,284 Less: Accumulated depreciation 21,265,495 4,352,573 16,912,922 805,571 2,023,342 998,526,601 956,094,365 Depletable assets 5,657,963 * 493,607 5,164,356 0 * 1,515,176 7,385,954 430,065 Less: Accumulated depletion 765,879 * 27,036 738,843 0 * 204,505 3,430,143 231,040 Land 12,758,480 162,567 12,595,913 * 23,802 2,518,273 892,716,088 890,649,027 Intangible assets 25,903,773 5,650,342 20,253,430 5,456,985 7,414,549 162,966,102 150,267,279 Less: Accumulated amortization 6,311,522 398,397 5,913,125 1,036,468 821,613 59,791,739 58,477,544 Other assets 374,656,795 109,734,035 264,922,760 2,501,924 124,693,334 372,363,216 355,075,880 Total liabilities and capital 12,779,713,135 565,512,863 12,214,200,272 19,881,866 1,707,194,007 5,636,547,190 5,481,666,674 Accounts payable 102,388,155 69,816,230 32,571,925 2,378,371 5,792,224 45,335,162 41,703,271 Mortgages, notes, bonds payable in less than 1 year 35,077,084 14,548,448 20,528,637 179,678 26,204,823 89,573,298 84,942,619 Other current liabilities 2,627,717,306 252,914,039 2,374,803,268 4,238,690 107,016,286 205,653,007 198,683,473 Nonrecourse loans 71,078,153 * 118,298 70,959,855 * 211,398 1,643,234 1,064,289,331 1,042,096,232 Loans from partners 38,052,795 4,920,482 33,132,313 * 67,629 3,396,262 89,879,299 77,485,804 Mortgages, notes, bonds payable in 1 year or more 173,673,025 17,799,128 155,873,897 2,682,221 28,319,047 1,737,239,285 1,698,911,367 Other liabilities 770,836,797 73,508,035 697,328,762 2,142,231 73,411,674 418,972,038 408,825,351 Partners capital accounts 8,960,889,819 131,888,204 8,829,001,615 7,981,648 1,461,410,457 1,985,605,770 1,929,018,558Footnotes at end of table.
Securities, commodity contracts and other financial investments and related activities
Insurancecarriers
andrelated
activities
Funds, trusts,and otherfinancial vehiclesTotal
Securitiesand
commoditycontracts
and exchanges
Otherfinancial
investmentactivities
Total
TotalItem
Table 3. All Partnerships and Partnerships with Net Income: Balance Sheets by Profit Status and Selected Industrial Group, Tax Year 2014—Continued
Real estate and rental and leasingFinance and insurance—continued

136
Partnerships, Tax Year 2014
Fall 2016Statistics of Income Bulletin
[All figures are estimates based on samples—money amounts are in thousands of dollars]
Real estate
(84) (85) (86) (87) (88) (89) (90)PARTNERSHIPS WITH NET INCOME
Number of partnerships [1] 170,666 7,787 162,879 12,190 31,702 1,001,340 974,310 Number of partners 4,078,477 42,838 4,035,639 42,653 1,087,357 4,501,337 4,222,113 Partnerships reporting balance sheet data: Number of partnerships 141,619 5,106 136,514 12,084 28,325 815,993 798,581 Number of partners 3,908,320 37,438 3,870,883 42,373 940,640 3,864,802 3,611,899 Total assets 10,361,680,490 447,946,499 9,913,733,991 15,578,510 1,571,251,736 3,296,493,564 3,210,455,776 Cash 491,759,950 51,236,204 440,523,746 3,515,343 43,123,881 161,805,123 156,711,323 Trade notes and accounts receivable 90,476,825 40,705,380 49,771,444 2,001,410 24,528,209 34,149,570 26,695,934 Less: Allowance for bad debts 201,515 41,802 159,713 29,629 145,238 854,263 761,862 Inventories 5,932,249 2,505,267 3,426,981 * 6,657 * 191,184 14,303,296 13,635,737 U.S. Government obligations 158,257,517 998,508 157,259,010 1,505 9,769,143 430,854 430,854 Tax-exempt securities 32,351,952 * 12,012,482 20,339,470 0 3,778,543 2,740,320 2,740,320 Other current assets 1,189,589,969 178,606,094 1,010,983,874 1,408,830 93,480,802 124,903,754 118,765,440 Loans to partners 18,907,512 789,717 18,117,795 * 31,898 7,705,684 13,278,959 13,001,386 Mortgage and real estate loans 18,891,575 * 247,960 18,643,615 0 7,767,519 23,271,164 23,259,068 Other investments 7,991,158,870 63,925,985 7,927,232,885 2,231,876 1,253,053,816 654,624,383 638,971,141 Depreciable assets 42,690,043 5,753,034 36,937,009 1,036,784 5,202,305 2,110,064,842 2,060,281,641 Less: Accumulated depreciation 13,437,466 3,267,355 10,170,111 706,726 1,209,739 664,735,552 641,119,843 Depletable assets 5,076,909 * 493,607 4,583,302 0 * 1,181,525 6,757,365 240,413 Less: Accumulated depletion 721,853 * 27,036 694,816 0 * 164,762 3,281,360 99,694 Land 7,282,377 * 77,625 7,204,751 * 22,587 1,757,807 551,541,194 550,320,577 Intangible assets 22,112,011 5,480,023 16,631,987 4,857,769 5,495,004 101,351,949 91,158,739 Less: Accumulated amortization 4,746,692 344,624 4,402,068 1,017,060 593,884 39,815,778 38,854,181 Other assets 306,300,256 88,795,426 217,504,830 2,217,267 116,329,937 205,957,743 195,078,782 Total liabilities and capital 10,361,680,490 447,946,499 9,913,733,991 15,578,510 1,571,251,736 3,296,493,564 3,210,455,776 Accounts payable 93,849,697 66,306,932 27,542,765 2,179,617 3,888,856 23,542,332 21,861,853 Mortgages, notes, bonds payable in less than 1 year 24,901,449 14,513,667 10,387,782 135,066 24,114,535 43,208,579 41,020,872 Other current liabilities 1,871,158,997 224,659,962 1,646,499,035 2,730,849 82,780,228 101,876,795 97,315,174 Nonrecourse loans 59,698,160 * 21,150 59,677,011 * 211,398 * 1,030,689 534,399,840 524,865,330 Loans from partners 30,736,903 4,770,316 25,966,587 * 37,430 2,327,197 31,374,704 30,308,676 Mortgages, notes, bonds payable in 1 year or more 134,128,332 17,083,457 117,044,875 2,269,687 19,875,493 969,865,025 951,350,078 Other liabilities 575,744,706 21,850,718 553,893,987 1,717,058 69,000,538 232,535,983 230,228,148 Partners capital accounts 7,571,462,247 98,740,298 7,472,721,948 6,297,406 1,368,234,200 1,359,690,307 1,313,505,645 Footnotes at end of table.
Securities, commodity contracts and other financial investments and related activities
Insurancecarriers
andrelated
activities
Funds, trusts,and otherfinancial vehicles
Total
Total
Securitiesand
commoditycontracts
and exchanges
Otherfinancial
investmentactivities
Total
Item
Real estate and rental and leasing
Table 3. All Partnerships and Partnerships with Net Income: Balance Sheets by Profit Status and Selected Industrial Group, Tax Year 2014—Continued
Finance and insurance—continued

137
Partnerships, Tax Year 2014
Fall 2016Statistics of Income Bulletin
[All figures are estimates based on samples—money amounts are in thousands of dollars]
(91) (92) (93) (94) (95) (96) (97)
Number of partnerships [1] 605,322 726,353 18,525 108,373 323,377 27,163 7,776 Number of partners 2,548,073 2,890,074 69,206 485,239 1,585,263 131,684 177,645 Partnerships reporting balance sheet data: Number of partnerships 452,701 608,069 14,580 72,330 266,097 19,965 4,927 Number of partners 2,123,152 2,406,768 61,307 320,538 1,407,307 115,820 166,160 Total assets 1,468,265,830 2,654,212,318 50,270,520 188,085,160 1,120,832,846 127,409,123 27,471,393 Cash 61,470,379 108,988,224 1,313,960 9,857,646 50,863,243 5,678,188 1,956,719 Trade notes and accounts receivable 4,377,228 22,918,330 133,929 1,676,567 12,694,303 10,312,070 2,240,567 Less: Allowance for bad debts 455,143 861,076 2,779 82,395 455,080 183,624 * 2,236 Inventories 2,646,924 775,557 3,353 1,940,776 22,687,371 1,221,980 * 87,601 U.S. Government obligations * 17,800 * 406,135 0 0 * 44,574 0 0 Tax-exempt securities * 703,498 1,651,409 0 0 * 1,100,646 0 0 Other current assets 48,843,703 91,916,954 851,075 5,984,302 70,421,224 7,079,782 752,988 Loans to partners 5,388,675 6,181,984 * 117,022 493,021 5,449,981 618,489 0 Mortgage and real estate loans 4,814,545 12,225,227 * 3,781 * 1,853,669 11,185,827 * 15,155 0 Other investments 152,807,258 274,347,256 3,710,006 35,634,716 582,645,482 17,843,880 4,744,564 Depreciable assets 1,230,522,639 1,988,108,732 42,271,558 50,746,431 169,106,925 109,185,949 1,264,867 Less: Accumulated depreciation 349,745,215 539,572,995 12,755,144 19,856,205 34,164,807 41,957,194 475,041 Depletable assets * 53,587 * 130,995 0 * 72,801 * 172,683 * 2,382 6,953,507 Less: Accumulated depletion * 20,000 * 69,134 0 * 26,619 * 115,287 * 2,256 3,196,847 Land 214,800,705 476,640,425 10,887,769 81,836,925 106,483,204 1,023,907 1,043,154 Intangible assets 31,824,762 96,428,839 1,453,931 4,175,872 16,383,874 3,882,884 8,815,939 Less: Accumulated amortization 11,188,478 40,365,928 673,222 1,407,886 4,842,031 704,734 609,461 Other assets 71,402,965 154,361,385 2,955,279 15,185,538 111,170,713 13,392,264 3,895,073 Total liabilities and capital 1,468,265,830 2,654,212,318 50,270,520 188,085,160 1,120,832,846 127,409,123 27,471,393 Accounts payable 7,865,798 21,136,953 160,965 887,872 11,651,682 3,298,015 333,877 Mortgages, notes, bonds payable in less than 1 year 16,552,278 47,747,430 1,056,031 2,794,163 16,792,717 4,567,465 * 63,213 Other current liabilities 62,762,318 79,337,561 1,361,900 3,816,193 51,405,501 6,453,880 515,655 Nonrecourse loans 442,488,635 508,316,579 4,676,210 11,560,908 75,053,901 22,088,163 * 104,937 Loans from partners 19,918,711 38,105,647 * 1,031,534 2,821,969 15,607,943 12,388,806 * 4,689 Mortgages, notes, bonds payable in 1 year or more 501,780,636 974,675,059 20,485,665 39,176,998 162,793,009 37,837,780 * 490,138 Other liabilities 92,658,823 176,173,139 2,959,637 7,870,532 129,163,220 9,547,831 598,856 Partners capital accounts 324,238,631 808,719,951 18,538,578 119,156,525 658,364,872 31,227,184 25,360,028 Footnotes at end of table.
Lessors ofresidential
buildings and dwellings and cooperative
housing
Lessors ofnonresidential
buildings (except miniwarehouses)
Lessors ofminiwarehousesand self-storage
units
Lessors ofother real
estateproperty
Rentaland
leasingservices
Lessors ofnonfinancial
intangible assets (except
copyrightedworks)
Otherreal estateactivities
Item
Table 3. All Partnerships and Partnerships with Net Income: Balance Sheets by Profit Status and Selected Industrial Group, Tax Year 2014—Continued
Real estate and rental and leasing—continued
Real estate—continued

138
Partnerships, Tax Year 2014
Fall 2016Statistics of Income Bulletin
[All figures are estimates based on samples—money amounts are in thousands of dollars]
(91) (92) (93) (94) (95) (96) (97)PARTNERSHIPS WITH NET INCOME
Number of partnerships [1] 279,911 480,507 13,867 69,558 130,467 19,365 7,665 Number of partners 1,151,117 1,910,504 50,476 326,176 783,839 101,803 177,422 Partnerships reporting balance sheet data: Number of partnerships 215,449 410,565 9,922 45,628 117,017 12,596 4,816 Number of partners 954,758 1,667,034 42,576 206,130 741,401 86,965 165,937 Total assets 600,229,697 1,826,436,988 40,619,209 118,583,601 624,586,281 61,492,647 24,545,141 Cash 37,126,039 78,559,148 1,032,400 5,956,155 34,037,582 3,167,659 1,926,141 Trade notes and accounts receivable 2,315,414 15,538,281 118,798 1,410,425 7,313,017 5,213,069 2,240,567 Less: Allowance for bad debts 121,634 436,263 1,535 * 4,653 197,776 90,164 * 2,236 Inventories 1,877,153 370,597 3,288 * 1,391,183 9,993,515 579,958 * 87,601 U.S. Government obligations * 11,187 * 375,093 0 0 * 44,574 0 0 Tax-exempt securities * 571,497 1,203,417 0 0 * 965,407 0 0 Other current assets 23,241,959 53,298,502 607,098 4,173,242 37,444,639 5,386,627 751,687 Loans to partners 3,352,881 5,048,507 * 117,022 * 452,025 4,030,950 277,573 0 Mortgage and real estate loans 3,925,451 11,099,768 * 3,781 * 1,071,169 7,158,898 * 12,096 0 Other investments 59,736,158 195,993,637 3,462,032 24,025,083 355,754,231 12,855,669 2,797,573 Depreciable assets 515,786,910 1,394,216,619 35,851,992 30,118,809 84,307,311 48,615,308 1,167,893 Less: Accumulated depreciation 190,027,984 404,690,515 11,797,930 13,930,614 20,672,800 23,145,517 470,192 Depletable assets * 19,929 * 92,117 0 * 72,801 * 55,567 * 2,382 6,514,570 Less: Accumulated depletion * 1,903 * 58,739 0 * 26,619 * 12,433 * 2,256 3,179,410 Land 103,534,590 333,792,559 9,539,786 55,921,062 47,532,581 486,701 733,915 Intangible assets 11,496,448 68,219,237 1,259,514 2,004,900 8,178,640 1,377,528 8,815,683 Less: Accumulated amortization 4,886,607 29,643,121 630,401 848,017 2,846,035 352,154 609,442 Other assets 32,272,209 103,458,146 1,053,364 6,796,649 51,498,414 7,108,169 3,770,792 Total liabilities and capital 600,229,697 1,826,436,988 40,619,209 118,583,601 624,586,281 61,492,647 24,545,141 Accounts payable 2,588,623 11,974,015 134,709 520,052 6,644,454 1,346,705 333,773 Mortgages, notes, bonds payable in less than 1 year 6,571,644 25,985,639 930,275 1,108,913 6,424,402 2,124,494 * 63,213 Other current liabilities 25,454,060 49,753,812 833,789 2,160,173 19,113,341 4,045,967 515,655 Nonrecourse loans 183,380,200 304,851,336 4,330,634 6,532,439 25,770,721 9,429,573 * 104,937 Loans from partners 5,679,479 17,409,393 * 617,406 1,096,285 5,506,113 1,061,339 * 4,689 Mortgages, notes, bonds payable in 1 year or more 213,277,383 628,812,557 16,520,552 21,027,673 71,711,912 18,024,810 * 490,138 Other liabilities 37,577,578 116,962,458 2,277,981 4,401,134 69,008,997 1,708,979 598,856 Partners capital accounts 125,700,731 670,687,780 14,973,863 81,736,932 420,406,340 23,750,780 22,433,881 Footnotes at end of table.
Lessors ofother real
estateproperty
Otherreal estateactivities
Rentaland
leasingservices
Lessors ofnonfinancial
intangible assets (except
copyrightedworks)
Lessors ofresidential
buildings and dwellings and cooperative
housing
Lessors ofnonresidential
buildings (except miniwarehouses)
Item
Real estate and rental and leasing—continued
Real estate—continued
Table 3. All Partnerships and Partnerships with Net Income: Balance Sheets by Profit Status and Selected Industrial Group, Tax Year 2014—Continued
Lessors ofminiwarehousesand self-storage
units
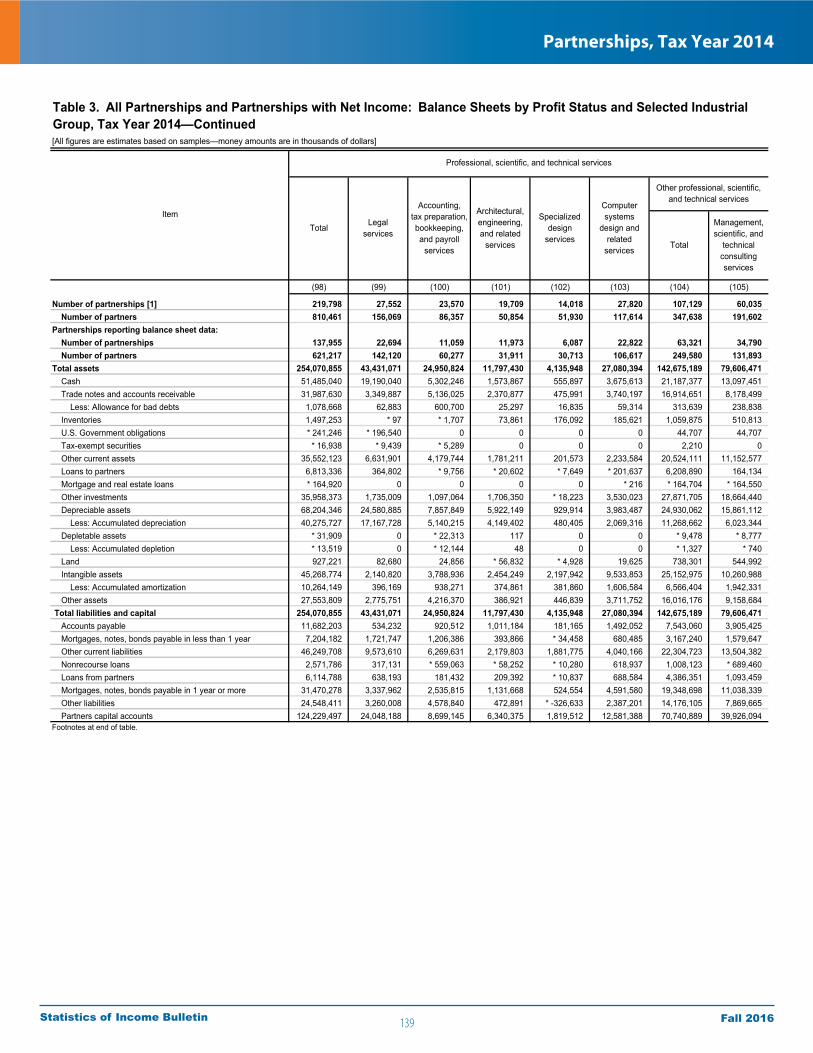
139
Partnerships, Tax Year 2014
Fall 2016Statistics of Income Bulletin
[All figures are estimates based on samples—money amounts are in thousands of dollars]
(98) (99) (100) (101) (102) (103) (104) (105)
Number of partnerships [1] 219,798 27,552 23,570 19,709 14,018 27,820 107,129 60,035 Number of partners 810,461 156,069 86,357 50,854 51,930 117,614 347,638 191,602 Partnerships reporting balance sheet data: Number of partnerships 137,955 22,694 11,059 11,973 6,087 22,822 63,321 34,790 Number of partners 621,217 142,120 60,277 31,911 30,713 106,617 249,580 131,893 Total assets 254,070,855 43,431,071 24,950,824 11,797,430 4,135,948 27,080,394 142,675,189 79,606,471 Cash 51,485,040 19,190,040 5,302,246 1,573,867 555,897 3,675,613 21,187,377 13,097,451 Trade notes and accounts receivable 31,987,630 3,349,887 5,136,025 2,370,877 475,991 3,740,197 16,914,651 8,178,499 Less: Allowance for bad debts 1,078,668 62,883 600,700 25,297 16,835 59,314 313,639 238,838 Inventories 1,497,253 * 97 * 1,707 73,861 176,092 185,621 1,059,875 510,813 U.S. Government obligations * 241,246 * 196,540 0 0 0 0 44,707 44,707 Tax-exempt securities * 16,938 * 9,439 * 5,289 0 0 0 2,210 0 Other current assets 35,552,123 6,631,901 4,179,744 1,781,211 201,573 2,233,584 20,524,111 11,152,577 Loans to partners 6,813,336 364,802 * 9,756 * 20,602 * 7,649 * 201,637 6,208,890 164,134 Mortgage and real estate loans * 164,920 0 0 0 0 * 216 * 164,704 * 164,550 Other investments 35,958,373 1,735,009 1,097,064 1,706,350 * 18,223 3,530,023 27,871,705 18,664,440 Depreciable assets 68,204,346 24,580,885 7,857,849 5,922,149 929,914 3,983,487 24,930,062 15,861,112 Less: Accumulated depreciation 40,275,727 17,167,728 5,140,215 4,149,402 480,405 2,069,316 11,268,662 6,023,344 Depletable assets * 31,909 0 * 22,313 117 0 0 * 9,478 * 8,777 Less: Accumulated depletion * 13,519 0 * 12,144 48 0 0 * 1,327 * 740 Land 927,221 82,680 24,856 * 56,832 * 4,928 19,625 738,301 544,992 Intangible assets 45,268,774 2,140,820 3,788,936 2,454,249 2,197,942 9,533,853 25,152,975 10,260,988 Less: Accumulated amortization 10,264,149 396,169 938,271 374,861 381,860 1,606,584 6,566,404 1,942,331 Other assets 27,553,809 2,775,751 4,216,370 386,921 446,839 3,711,752 16,016,176 9,158,684 Total liabilities and capital 254,070,855 43,431,071 24,950,824 11,797,430 4,135,948 27,080,394 142,675,189 79,606,471 Accounts payable 11,682,203 534,232 920,512 1,011,184 181,165 1,492,052 7,543,060 3,905,425 Mortgages, notes, bonds payable in less than 1 year 7,204,182 1,721,747 1,206,386 393,866 * 34,458 680,485 3,167,240 1,579,647 Other current liabilities 46,249,708 9,573,610 6,269,631 2,179,803 1,881,775 4,040,166 22,304,723 13,504,382 Nonrecourse loans 2,571,786 317,131 * 559,063 * 58,252 * 10,280 618,937 1,008,123 * 689,460 Loans from partners 6,114,788 638,193 181,432 209,392 * 10,837 688,584 4,386,351 1,093,459 Mortgages, notes, bonds payable in 1 year or more 31,470,278 3,337,962 2,535,815 1,131,668 524,554 4,591,580 19,348,698 11,038,339 Other liabilities 24,548,411 3,260,008 4,578,840 472,891 * -326,633 2,387,201 14,176,105 7,869,665 Partners capital accounts 124,229,497 24,048,188 8,699,145 6,340,375 1,819,512 12,581,388 70,740,889 39,926,094 Footnotes at end of table.
Accounting,tax preparation,bookkeeping,and payroll
services
Architectural,engineering,and related
services
Specializeddesign
services
Computersystems
design andrelated
services Total
Management,scientific, and
technicalconsultingservices
Item
Table 3. All Partnerships and Partnerships with Net Income: Balance Sheets by Profit Status and Selected Industrial Group, Tax Year 2014—Continued
Professional, scientific, and technical services
Other professional, scientific, and technical services
Total Legalservices
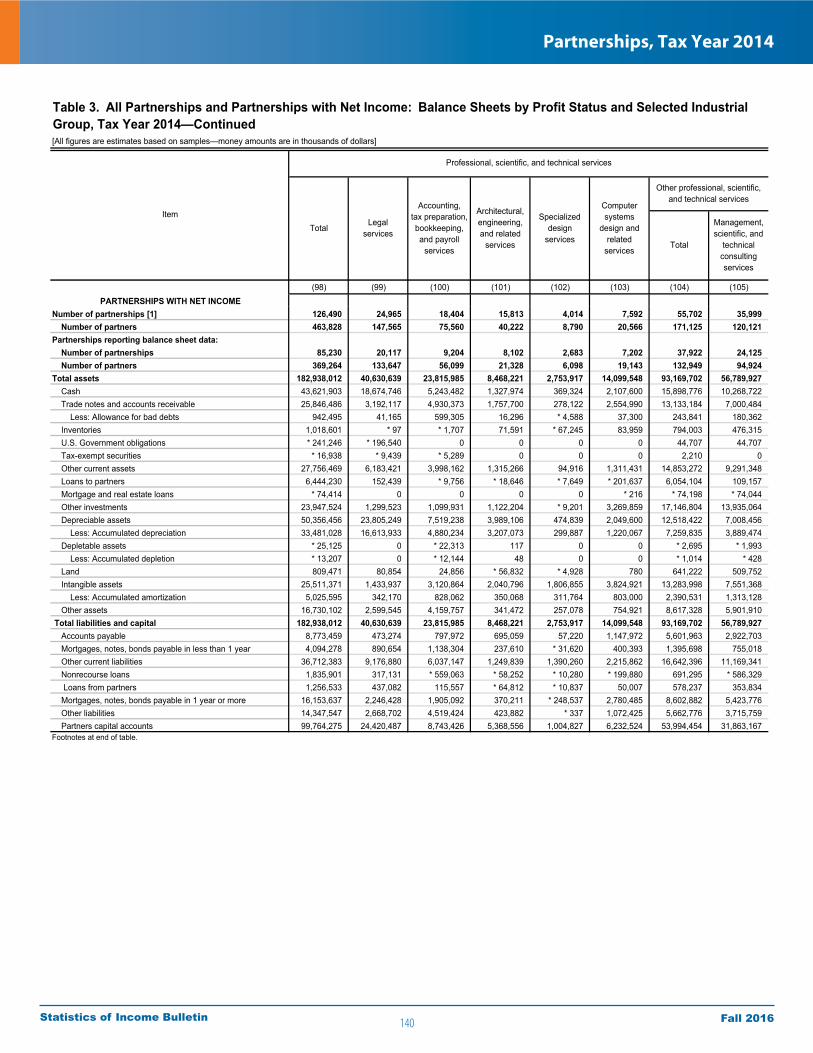
140
Partnerships, Tax Year 2014
Fall 2016Statistics of Income Bulletin
[All figures are estimates based on samples—money amounts are in thousands of dollars]
(98) (99) (100) (101) (102) (103) (104) (105)PARTNERSHIPS WITH NET INCOME
Number of partnerships [1] 126,490 24,965 18,404 15,813 4,014 7,592 55,702 35,999 Number of partners 463,828 147,565 75,560 40,222 8,790 20,566 171,125 120,121 Partnerships reporting balance sheet data: Number of partnerships 85,230 20,117 9,204 8,102 2,683 7,202 37,922 24,125 Number of partners 369,264 133,647 56,099 21,328 6,098 19,143 132,949 94,924 Total assets 182,938,012 40,630,639 23,815,985 8,468,221 2,753,917 14,099,548 93,169,702 56,789,927 Cash 43,621,903 18,674,746 5,243,482 1,327,974 369,324 2,107,600 15,898,776 10,268,722 Trade notes and accounts receivable 25,846,486 3,192,117 4,930,373 1,757,700 278,122 2,554,990 13,133,184 7,000,484 Less: Allowance for bad debts 942,495 41,165 599,305 16,296 * 4,588 37,300 243,841 180,362 Inventories 1,018,601 * 97 * 1,707 71,591 * 67,245 83,959 794,003 476,315 U.S. Government obligations * 241,246 * 196,540 0 0 0 0 44,707 44,707 Tax-exempt securities * 16,938 * 9,439 * 5,289 0 0 0 2,210 0 Other current assets 27,756,469 6,183,421 3,998,162 1,315,266 94,916 1,311,431 14,853,272 9,291,348 Loans to partners 6,444,230 152,439 * 9,756 * 18,646 * 7,649 * 201,637 6,054,104 109,157 Mortgage and real estate loans * 74,414 0 0 0 0 * 216 * 74,198 * 74,044 Other investments 23,947,524 1,299,523 1,099,931 1,122,204 * 9,201 3,269,859 17,146,804 13,935,064 Depreciable assets 50,356,456 23,805,249 7,519,238 3,989,106 474,839 2,049,600 12,518,422 7,008,456 Less: Accumulated depreciation 33,481,028 16,613,933 4,880,234 3,207,073 299,887 1,220,067 7,259,835 3,889,474 Depletable assets * 25,125 0 * 22,313 117 0 0 * 2,695 * 1,993 Less: Accumulated depletion * 13,207 0 * 12,144 48 0 0 * 1,014 * 428 Land 809,471 80,854 24,856 * 56,832 * 4,928 780 641,222 509,752 Intangible assets 25,511,371 1,433,937 3,120,864 2,040,796 1,806,855 3,824,921 13,283,998 7,551,368 Less: Accumulated amortization 5,025,595 342,170 828,062 350,068 311,764 803,000 2,390,531 1,313,128 Other assets 16,730,102 2,599,545 4,159,757 341,472 257,078 754,921 8,617,328 5,901,910 Total liabilities and capital 182,938,012 40,630,639 23,815,985 8,468,221 2,753,917 14,099,548 93,169,702 56,789,927 Accounts payable 8,773,459 473,274 797,972 695,059 57,220 1,147,972 5,601,963 2,922,703 Mortgages, notes, bonds payable in less than 1 year 4,094,278 890,654 1,138,304 237,610 * 31,620 400,393 1,395,698 755,018 Other current liabilities 36,712,383 9,176,880 6,037,147 1,249,839 1,390,260 2,215,862 16,642,396 11,169,341 Nonrecourse loans 1,835,901 317,131 * 559,063 * 58,252 * 10,280 * 199,880 691,295 * 586,329 Loans from partners 1,256,533 437,082 115,557 * 64,812 * 10,837 50,007 578,237 353,834 Mortgages, notes, bonds payable in 1 year or more 16,153,637 2,246,428 1,905,092 370,211 * 248,537 2,780,485 8,602,882 5,423,776 Other liabilities 14,347,547 2,668,702 4,519,424 423,882 * 337 1,072,425 5,662,776 3,715,759 Partners capital accounts 99,764,275 24,420,487 8,743,426 5,368,556 1,004,827 6,232,524 53,994,454 31,863,167 Footnotes at end of table.
Total
Management,scientific, and
technicalconsultingservices
TotalLegal
services
Accounting,tax preparation,bookkeeping,and payroll
services
Architectural,engineering,and related
services
Specializeddesign
services
Computersystems
design andrelated
services
Item
Professional, scientific, and technical services
Other professional, scientific, and technical services
Table 3. All Partnerships and Partnerships with Net Income: Balance Sheets by Profit Status and Selected Industrial Group, Tax Year 2014—Continued

141
Partnerships, Tax Year 2014
Fall 2016Statistics of Income Bulletin
[All figures are estimates based on samples—money amounts are in thousands of dollars]
(106) (107) (108) (109) (110) (111) (112)
Number of partnerships [1] 14,565 32,529 32,717 66,433 62,119 4,314 28,821 Number of partners 41,646 114,390 1,336,133 167,211 155,407 11,804 69,862 Partnerships reporting balance sheet data: Number of partnerships 10,131 18,400 24,319 43,635 39,678 3,956 16,210 Number of partners 32,732 84,955 1,315,980 119,210 108,162 11,048 40,140 Total assets 13,085,914 49,982,805 700,293,151 91,123,882 79,509,758 11,614,124 6,013,630 Cash 2,053,365 6,036,561 37,221,559 7,300,335 6,729,677 570,658 812,595 Trade notes and accounts receivable 2,719,270 6,016,882 21,800,424 20,841,020 19,637,832 1,203,187 854,141 Less: Allowance for bad debts 40,861 33,940 431,725 990,617 953,305 37,312 31,369 Inventories 144,254 404,808 2,580,927 599,063 491,866 107,197 44,799 U.S. Government obligations 0 0 * 32,473 0 0 0 0 Tax-exempt securities 2,210 0 * 9,132 * 745 * 407 * 338 0 Other current assets 2,026,159 7,345,375 32,746,191 10,021,311 9,394,916 626,394 320,399 Loans to partners 156,411 5,888,345 4,006,651 229,885 106,776 * 123,109 * 9,499 Mortgage and real estate loans 0 * 153 * 605,760 * 198,630 * 198,630 0 * 27,879 Other investments 362,545 8,844,721 402,857,847 11,241,510 10,280,742 960,768 * 739,366 Depreciable assets 3,671,802 5,397,148 69,469,064 22,627,028 13,518,147 9,108,881 1,927,395 Less: Accumulated depreciation 2,225,129 3,020,189 9,725,840 12,770,826 8,499,701 4,271,125 729,133 Depletable assets 0 * 701 * 709,303 * 145,443 0 * 145,443 0 Less: Accumulated depletion 0 * 587 * 3,795 * 74,785 0 * 74,785 0 Land * 61,386 131,922 3,888,869 513,614 373,112 140,502 * 387,319 Intangible assets 3,490,496 11,401,491 27,059,998 23,392,279 22,016,137 1,376,142 1,768,345 Less: Accumulated amortization 645,265 3,978,808 4,045,478 5,998,870 5,700,244 298,625 496,590 Other assets 1,309,272 5,548,220 111,511,792 13,848,116 11,914,766 1,933,350 378,985 Total liabilities and capital 13,085,914 49,982,805 700,293,151 91,123,882 79,509,758 11,614,124 6,013,630 Accounts payable 1,870,548 1,767,087 6,131,723 5,268,028 4,623,897 644,131 208,594 Mortgages, notes, bonds payable in less than 1 year 375,253 1,212,341 8,139,412 2,058,137 1,715,430 342,708 119,838 Other current liabilities 2,184,439 6,615,902 29,763,051 13,048,850 12,108,687 940,163 1,189,186 Nonrecourse loans * 95,948 * 222,715 7,610,411 309,077 260,946 * 48,130 0 Loans from partners 228,660 3,064,232 8,995,024 1,633,739 1,519,915 * 113,824 335,698 Mortgages, notes, bonds payable in 1 year or more 3,581,745 4,728,614 61,073,308 20,596,756 17,017,162 3,579,594 1,258,766 Other liabilities 1,137,239 5,169,201 117,425,103 10,587,773 10,286,228 301,545 1,299,887 Partners capital accounts 3,612,083 27,202,713 461,155,119 37,621,522 31,977,493 5,644,029 1,601,661 Footnotes at end of table.
Managementof companies
(holdingcompanies)
Administrative and support and waste management and remediation services
Educationalservices
Total
Administrativeand
supportservices
Wastemanagement
andremediation
services
Advertisingand related
services
Othermiscellaneousprofessional,scientific, and
technicalservices
Item
Table 3. All Partnerships and Partnerships with Net Income: Balance Sheets by Profit Status and Selected Industrial Group, Tax Year 2014—Continued
Professional, scientific, and technical services—continued
Other professional, scientific, and technical services—continued
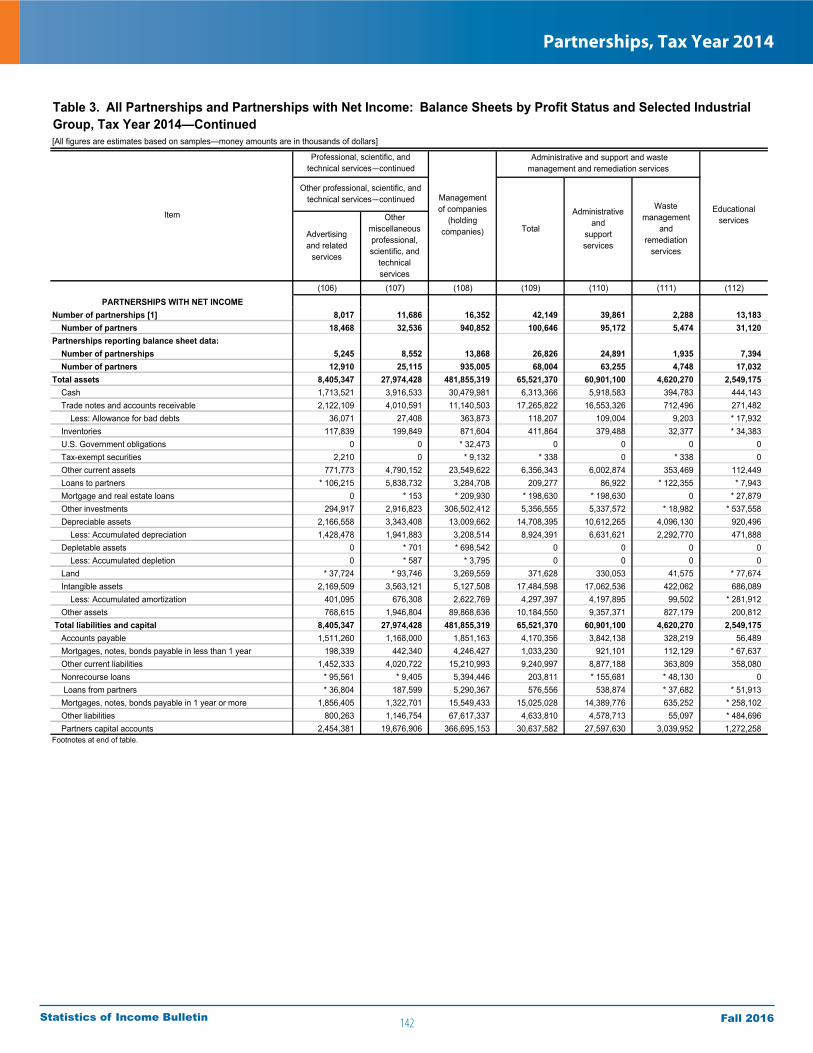
142
Partnerships, Tax Year 2014
Fall 2016Statistics of Income Bulletin
[All figures are estimates based on samples—money amounts are in thousands of dollars]
(106) (107) (108) (109) (110) (111) (112)PARTNERSHIPS WITH NET INCOME
Number of partnerships [1] 8,017 11,686 16,352 42,149 39,861 2,288 13,183 Number of partners 18,468 32,536 940,852 100,646 95,172 5,474 31,120 Partnerships reporting balance sheet data: Number of partnerships 5,245 8,552 13,868 26,826 24,891 1,935 7,394 Number of partners 12,910 25,115 935,005 68,004 63,255 4,748 17,032 Total assets 8,405,347 27,974,428 481,855,319 65,521,370 60,901,100 4,620,270 2,549,175 Cash 1,713,521 3,916,533 30,479,981 6,313,366 5,918,583 394,783 444,143 Trade notes and accounts receivable 2,122,109 4,010,591 11,140,503 17,265,822 16,553,326 712,496 271,482 Less: Allowance for bad debts 36,071 27,408 363,873 118,207 109,004 9,203 * 17,932 Inventories 117,839 199,849 871,604 411,864 379,488 32,377 * 34,383 U.S. Government obligations 0 0 * 32,473 0 0 0 0 Tax-exempt securities 2,210 0 * 9,132 * 338 0 * 338 0 Other current assets 771,773 4,790,152 23,549,622 6,356,343 6,002,874 353,469 112,449 Loans to partners * 106,215 5,838,732 3,284,708 209,277 86,922 * 122,355 * 7,943 Mortgage and real estate loans 0 * 153 * 209,930 * 198,630 * 198,630 0 * 27,879 Other investments 294,917 2,916,823 306,502,412 5,356,555 5,337,572 * 18,982 * 537,558 Depreciable assets 2,166,558 3,343,408 13,009,662 14,708,395 10,612,265 4,096,130 920,496 Less: Accumulated depreciation 1,428,478 1,941,883 3,208,514 8,924,391 6,631,621 2,292,770 471,888 Depletable assets 0 * 701 * 698,542 0 0 0 0 Less: Accumulated depletion 0 * 587 * 3,795 0 0 0 0 Land * 37,724 * 93,746 3,269,559 371,628 330,053 41,575 * 77,674 Intangible assets 2,169,509 3,563,121 5,127,508 17,484,598 17,062,536 422,062 686,089 Less: Accumulated amortization 401,095 676,308 2,622,769 4,297,397 4,197,895 99,502 * 281,912 Other assets 768,615 1,946,804 89,868,636 10,184,550 9,357,371 827,179 200,812 Total liabilities and capital 8,405,347 27,974,428 481,855,319 65,521,370 60,901,100 4,620,270 2,549,175 Accounts payable 1,511,260 1,168,000 1,851,163 4,170,356 3,842,138 328,219 56,489 Mortgages, notes, bonds payable in less than 1 year 198,339 442,340 4,246,427 1,033,230 921,101 112,129 * 67,637 Other current liabilities 1,452,333 4,020,722 15,210,993 9,240,997 8,877,188 363,809 358,080 Nonrecourse loans * 95,561 * 9,405 5,394,446 203,811 * 155,681 * 48,130 0 Loans from partners * 36,804 187,599 5,290,367 576,556 538,874 * 37,682 * 51,913 Mortgages, notes, bonds payable in 1 year or more 1,856,405 1,322,701 15,549,433 15,025,028 14,389,776 635,252 * 258,102 Other liabilities 800,263 1,146,754 67,617,337 4,633,810 4,578,713 55,097 * 484,696 Partners capital accounts 2,454,381 19,676,906 366,695,153 30,637,582 27,597,630 3,039,952 1,272,258 Footnotes at end of table.
Managementof companies
(holdingcompanies)
Administrative and support and waste management and remediation services
Educationalservices
Advertisingand related
services
Othermiscellaneousprofessional,scientific, and
technicalservices
Professional, scientific, and technical services—continued
Other professional, scientific, and technical services—continued
Total
Administrativeand
supportservices
Wastemanagement
andremediation
services
Item
Table 3. All Partnerships and Partnerships with Net Income: Balance Sheets by Profit Status and Selected Industrial Group, Tax Year 2014—Continued

143
Partnerships, Tax Year 2014
Fall 2016Statistics of Income Bulletin
[All figures are estimates based on samples—money amounts are in thousands of dollars]
(113) (114) (115) (116) (117) (118) (119)
Number of partnerships [1] 85,027 32,023 15,119 6,338 5,055 3,856 1,053 Number of partners 374,499 141,690 36,804 53,873 28,642 12,273 14,825 Partnerships reporting balance sheet data: Number of partnerships 71,296 27,770 12,375 6,127 4,379 3,842 405 Number of partners 335,728 132,540 30,135 51,913 25,345 12,245 12,880 Total assets 162,530,713 17,024,310 4,136,069 25,011,661 8,914,969 2,827,885 855,309 Cash 15,907,459 4,084,919 768,291 3,876,195 1,287,883 387,336 123,765 Trade notes and accounts receivable 31,423,076 2,782,327 635,847 4,980,544 1,770,152 896,649 * 345,196 Less: Allowance for bad debts 8,622,492 474,273 42,254 1,267,125 397,877 99,585 * 190,035 Inventories 800,254 152,415 70,441 258,275 65,813 * 22,468 * 2,700 U.S. Government obligations 500 500 0 0 0 0 0 Tax-exempt securities * 3,099 * 850 0 0 * 415 0 0 Other current assets 10,876,440 1,336,698 317,876 1,171,405 547,434 286,988 * 64,950 Loans to partners 710,957 436,098 * 10,355 35,953 * 15,934 * 26,687 * 3,019 Mortgage and real estate loans 0 0 0 0 0 0 0 Other investments 6,481,941 689,781 * 389,282 2,136,671 1,109,506 * -29,248 * 188,617 Depreciable assets 103,098,623 12,004,950 1,448,077 11,972,498 7,983,983 641,008 355,538 Less: Accumulated depreciation 47,334,880 8,419,433 948,983 6,842,367 5,703,994 436,017 163,729 Depletable assets * 2,858 1,149 0 0 0 0 0 Less: Accumulated depletion * 600 211 0 0 0 0 0 Land 5,126,302 113,305 * 75,873 162,143 * 25,346 * 4,622 0 Intangible assets 27,457,083 3,554,632 1,177,944 7,181,159 2,489,791 844,384 * 83,836 Less: Accumulated amortization 3,786,361 831,463 194,526 595,863 574,563 79,286 * 10,901 Other assets 20,386,454 1,592,064 427,845 1,942,173 295,146 361,879 * 52,355 Total liabilities and capital 162,530,713 17,024,310 4,136,069 25,011,661 8,914,969 2,827,885 855,309 Accounts payable 7,720,282 649,843 120,857 953,144 296,359 191,187 * 35,782 Mortgages, notes, bonds payable in less than 1 year 4,504,869 726,582 122,575 919,353 243,166 132,041 * 52,848 Other current liabilities 19,790,552 4,076,153 474,827 2,295,480 960,672 487,641 * 60,214 Nonrecourse loans 5,669,684 * 213,977 * 162,080 * 83,409 * 159,096 * 77,565 0 Loans from partners 2,002,829 281,128 * 94,958 391,890 127,152 * 38,339 * 1,611 Mortgages, notes, bonds payable in 1 year or more 44,517,863 4,143,302 1,022,943 3,653,155 3,736,697 395,974 * 171,672 Other liabilities 25,725,559 6,503,307 481,652 3,735,647 293,723 821,256 * 68,439 Partners capital accounts 52,599,074 430,017 1,656,177 12,979,582 3,098,104 683,881 464,744 Footnotes at end of table.
TotalOffices ofphysicians
and dentists
Item
Table 3. All Partnerships and Partnerships with Net Income: Balance Sheets by Profit Status and Selected Industrial Group, Tax Year 2014—Continued
Health care and social assistance
Officesof otherhealth
practitioners
Outpatientcare
centers
Medicaland
diagnosticlaboratories
Homehealthcare
services
Otherambulatoryhealth care
services
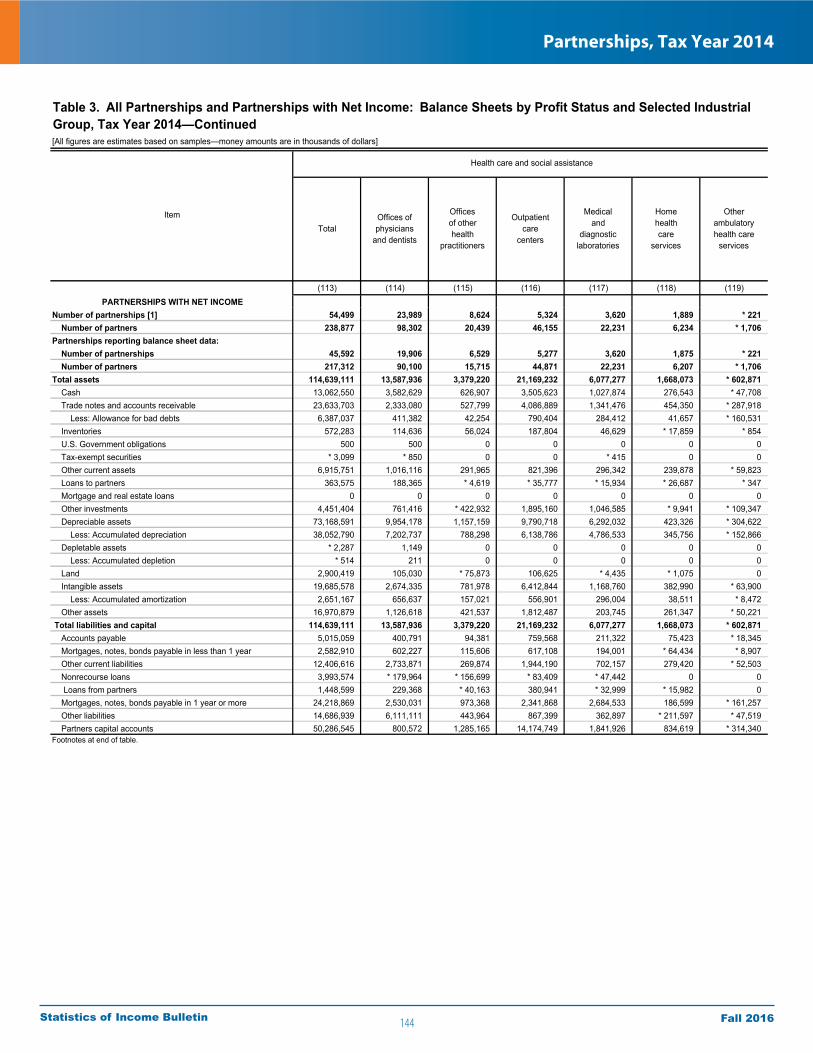
144
Partnerships, Tax Year 2014
Fall 2016Statistics of Income Bulletin
[All figures are estimates based on samples—money amounts are in thousands of dollars]
(113) (114) (115) (116) (117) (118) (119)PARTNERSHIPS WITH NET INCOME
Number of partnerships [1] 54,499 23,989 8,624 5,324 3,620 1,889 * 221 Number of partners 238,877 98,302 20,439 46,155 22,231 6,234 * 1,706 Partnerships reporting balance sheet data: Number of partnerships 45,592 19,906 6,529 5,277 3,620 1,875 * 221 Number of partners 217,312 90,100 15,715 44,871 22,231 6,207 * 1,706 Total assets 114,639,111 13,587,936 3,379,220 21,169,232 6,077,277 1,668,073 * 602,871 Cash 13,062,550 3,582,629 626,907 3,505,623 1,027,874 276,543 * 47,708 Trade notes and accounts receivable 23,633,703 2,333,080 527,799 4,086,889 1,341,476 454,350 * 287,918 Less: Allowance for bad debts 6,387,037 411,382 42,254 790,404 284,412 41,657 * 160,531 Inventories 572,283 114,636 56,024 187,804 46,629 * 17,859 * 854 U.S. Government obligations 500 500 0 0 0 0 0 Tax-exempt securities * 3,099 * 850 0 0 * 415 0 0 Other current assets 6,915,751 1,016,116 291,965 821,396 296,342 239,878 * 59,823 Loans to partners 363,575 188,365 * 4,619 * 35,777 * 15,934 * 26,687 * 347 Mortgage and real estate loans 0 0 0 0 0 0 0 Other investments 4,451,404 761,416 * 422,932 1,895,160 1,046,585 * 9,941 * 109,347 Depreciable assets 73,168,591 9,954,178 1,157,159 9,790,718 6,292,032 423,326 * 304,622 Less: Accumulated depreciation 38,052,790 7,202,737 788,298 6,138,786 4,786,533 345,756 * 152,866 Depletable assets * 2,287 1,149 0 0 0 0 0 Less: Accumulated depletion * 514 211 0 0 0 0 0 Land 2,900,419 105,030 * 75,873 106,625 * 4,435 * 1,075 0 Intangible assets 19,685,578 2,674,335 781,978 6,412,844 1,168,760 382,990 * 63,900 Less: Accumulated amortization 2,651,167 656,637 157,021 556,901 296,004 38,511 * 8,472 Other assets 16,970,879 1,126,618 421,537 1,812,487 203,745 261,347 * 50,221 Total liabilities and capital 114,639,111 13,587,936 3,379,220 21,169,232 6,077,277 1,668,073 * 602,871 Accounts payable 5,015,059 400,791 94,381 759,568 211,322 75,423 * 18,345 Mortgages, notes, bonds payable in less than 1 year 2,582,910 602,227 115,606 617,108 194,001 * 64,434 * 8,907 Other current liabilities 12,406,616 2,733,871 269,874 1,944,190 702,157 279,420 * 52,503 Nonrecourse loans 3,993,574 * 179,964 * 156,699 * 83,409 * 47,442 0 0 Loans from partners 1,448,599 229,368 * 40,163 380,941 * 32,999 * 15,982 0 Mortgages, notes, bonds payable in 1 year or more 24,218,869 2,530,031 973,368 2,341,868 2,684,533 186,599 * 161,257 Other liabilities 14,686,939 6,111,111 443,964 867,399 362,897 * 211,597 * 47,519 Partners capital accounts 50,286,545 800,572 1,285,165 14,174,749 1,841,926 834,619 * 314,340 Footnotes at end of table.
Item
Health care and social assistance
TotalOffices ofphysicians
and dentists
Officesof otherhealth
practitioners
Outpatientcare
centers
Medicaland
diagnosticlaboratories
Table 3. All Partnerships and Partnerships with Net Income: Balance Sheets by Profit Status and Selected Industrial Group, Tax Year 2014—Continued
Homehealthcare
services
Otherambulatoryhealth care
services
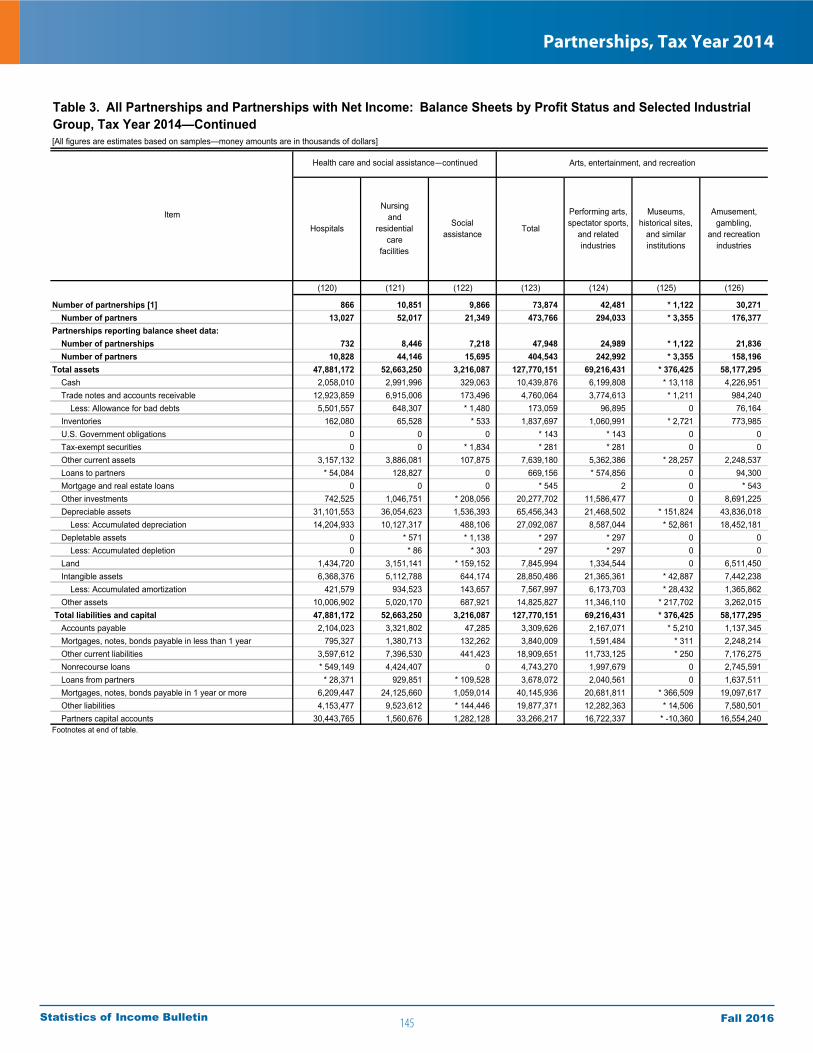
145
Partnerships, Tax Year 2014
Fall 2016Statistics of Income Bulletin
[All figures are estimates based on samples—money amounts are in thousands of dollars]
(120) (121) (122) (123) (124) (125) (126)
Number of partnerships [1] 866 10,851 9,866 73,874 42,481 * 1,122 30,271 Number of partners 13,027 52,017 21,349 473,766 294,033 * 3,355 176,377 Partnerships reporting balance sheet data: Number of partnerships 732 8,446 7,218 47,948 24,989 * 1,122 21,836 Number of partners 10,828 44,146 15,695 404,543 242,992 * 3,355 158,196 Total assets 47,881,172 52,663,250 3,216,087 127,770,151 69,216,431 * 376,425 58,177,295 Cash 2,058,010 2,991,996 329,063 10,439,876 6,199,808 * 13,118 4,226,951 Trade notes and accounts receivable 12,923,859 6,915,006 173,496 4,760,064 3,774,613 * 1,211 984,240 Less: Allowance for bad debts 5,501,557 648,307 * 1,480 173,059 96,895 0 76,164 Inventories 162,080 65,528 * 533 1,837,697 1,060,991 * 2,721 773,985 U.S. Government obligations 0 0 0 * 143 * 143 0 0 Tax-exempt securities 0 0 * 1,834 * 281 * 281 0 0 Other current assets 3,157,132 3,886,081 107,875 7,639,180 5,362,386 * 28,257 2,248,537 Loans to partners * 54,084 128,827 0 669,156 * 574,856 0 94,300 Mortgage and real estate loans 0 0 0 * 545 2 0 * 543 Other investments 742,525 1,046,751 * 208,056 20,277,702 11,586,477 0 8,691,225 Depreciable assets 31,101,553 36,054,623 1,536,393 65,456,343 21,468,502 * 151,824 43,836,018 Less: Accumulated depreciation 14,204,933 10,127,317 488,106 27,092,087 8,587,044 * 52,861 18,452,181 Depletable assets 0 * 571 * 1,138 * 297 * 297 0 0 Less: Accumulated depletion 0 * 86 * 303 * 297 * 297 0 0 Land 1,434,720 3,151,141 * 159,152 7,845,994 1,334,544 0 6,511,450 Intangible assets 6,368,376 5,112,788 644,174 28,850,486 21,365,361 * 42,887 7,442,238 Less: Accumulated amortization 421,579 934,523 143,657 7,567,997 6,173,703 * 28,432 1,365,862 Other assets 10,006,902 5,020,170 687,921 14,825,827 11,346,110 * 217,702 3,262,015 Total liabilities and capital 47,881,172 52,663,250 3,216,087 127,770,151 69,216,431 * 376,425 58,177,295 Accounts payable 2,104,023 3,321,802 47,285 3,309,626 2,167,071 * 5,210 1,137,345 Mortgages, notes, bonds payable in less than 1 year 795,327 1,380,713 132,262 3,840,009 1,591,484 * 311 2,248,214 Other current liabilities 3,597,612 7,396,530 441,423 18,909,651 11,733,125 * 250 7,176,275 Nonrecourse loans * 549,149 4,424,407 0 4,743,270 1,997,679 0 2,745,591 Loans from partners * 28,371 929,851 * 109,528 3,678,072 2,040,561 0 1,637,511 Mortgages, notes, bonds payable in 1 year or more 6,209,447 24,125,660 1,059,014 40,145,936 20,681,811 * 366,509 19,097,617 Other liabilities 4,153,477 9,523,612 * 144,446 19,877,371 12,282,363 * 14,506 7,580,501 Partners capital accounts 30,443,765 1,560,676 1,282,128 33,266,217 16,722,337 * -10,360 16,554,240 Footnotes at end of table.
Arts, entertainment, and recreation
HospitalsItem
Nursingand
residentialcare
facilities
Socialassistance
Total
Performing arts,spectator sports,
and relatedindustries
Museums,historical sites,
and similarinstitutions
Amusement,gambling,
and recreationindustries
Table 3. All Partnerships and Partnerships with Net Income: Balance Sheets by Profit Status and Selected Industrial Group, Tax Year 2014—Continued
Health care and social assistance—continued
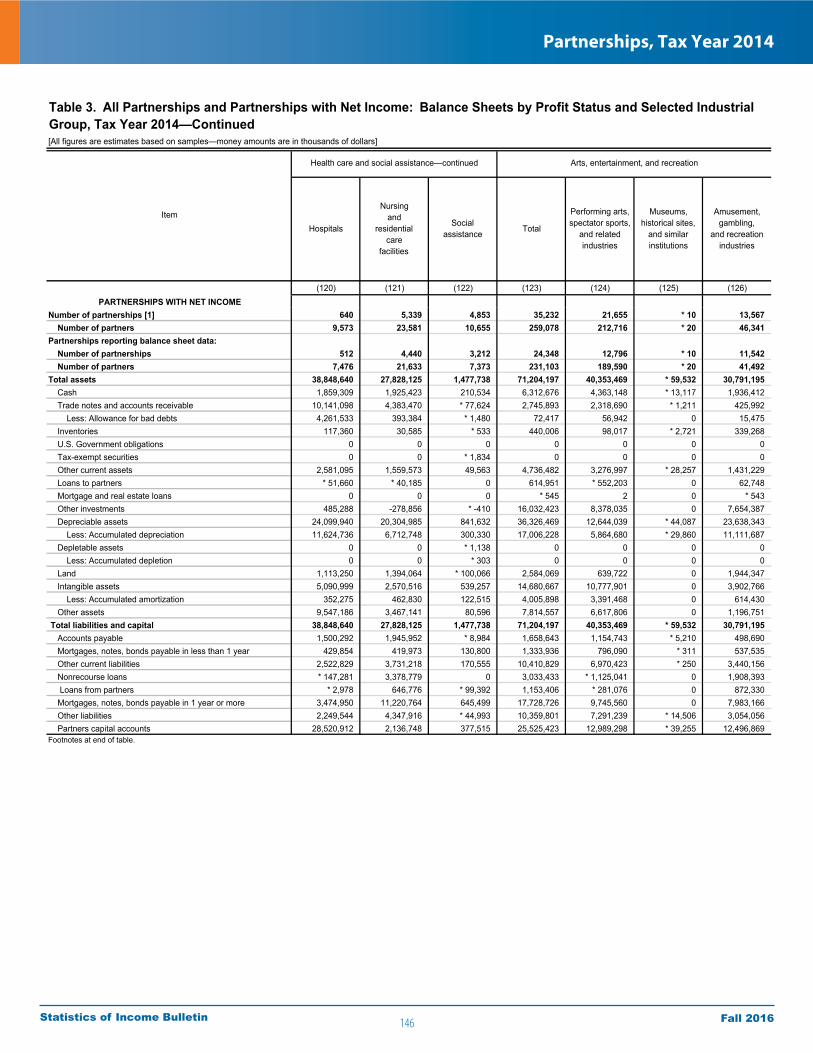
146
Partnerships, Tax Year 2014
Fall 2016Statistics of Income Bulletin
[All figures are estimates based on samples—money amounts are in thousands of dollars]
(120) (121) (122) (123) (124) (125) (126)PARTNERSHIPS WITH NET INCOME
Number of partnerships [1] 640 5,339 4,853 35,232 21,655 * 10 13,567 Number of partners 9,573 23,581 10,655 259,078 212,716 * 20 46,341 Partnerships reporting balance sheet data: Number of partnerships 512 4,440 3,212 24,348 12,796 * 10 11,542 Number of partners 7,476 21,633 7,373 231,103 189,590 * 20 41,492 Total assets 38,848,640 27,828,125 1,477,738 71,204,197 40,353,469 * 59,532 30,791,195 Cash 1,859,309 1,925,423 210,534 6,312,676 4,363,148 * 13,117 1,936,412 Trade notes and accounts receivable 10,141,098 4,383,470 * 77,624 2,745,893 2,318,690 * 1,211 425,992 Less: Allowance for bad debts 4,261,533 393,384 * 1,480 72,417 56,942 0 15,475 Inventories 117,360 30,585 * 533 440,006 98,017 * 2,721 339,268 U.S. Government obligations 0 0 0 0 0 0 0 Tax-exempt securities 0 0 * 1,834 0 0 0 0 Other current assets 2,581,095 1,559,573 49,563 4,736,482 3,276,997 * 28,257 1,431,229 Loans to partners * 51,660 * 40,185 0 614,951 * 552,203 0 62,748 Mortgage and real estate loans 0 0 0 * 545 2 0 * 543 Other investments 485,288 -278,856 * -410 16,032,423 8,378,035 0 7,654,387 Depreciable assets 24,099,940 20,304,985 841,632 36,326,469 12,644,039 * 44,087 23,638,343 Less: Accumulated depreciation 11,624,736 6,712,748 300,330 17,006,228 5,864,680 * 29,860 11,111,687 Depletable assets 0 0 * 1,138 0 0 0 0 Less: Accumulated depletion 0 0 * 303 0 0 0 0 Land 1,113,250 1,394,064 * 100,066 2,584,069 639,722 0 1,944,347 Intangible assets 5,090,999 2,570,516 539,257 14,680,667 10,777,901 0 3,902,766 Less: Accumulated amortization 352,275 462,830 122,515 4,005,898 3,391,468 0 614,430 Other assets 9,547,186 3,467,141 80,596 7,814,557 6,617,806 0 1,196,751 Total liabilities and capital 38,848,640 27,828,125 1,477,738 71,204,197 40,353,469 * 59,532 30,791,195 Accounts payable 1,500,292 1,945,952 * 8,984 1,658,643 1,154,743 * 5,210 498,690 Mortgages, notes, bonds payable in less than 1 year 429,854 419,973 130,800 1,333,936 796,090 * 311 537,535 Other current liabilities 2,522,829 3,731,218 170,555 10,410,829 6,970,423 * 250 3,440,156 Nonrecourse loans * 147,281 3,378,779 0 3,033,433 * 1,125,041 0 1,908,393 Loans from partners * 2,978 646,776 * 99,392 1,153,406 * 281,076 0 872,330 Mortgages, notes, bonds payable in 1 year or more 3,474,950 11,220,764 645,499 17,728,726 9,745,560 0 7,983,166 Other liabilities 2,249,544 4,347,916 * 44,993 10,359,801 7,291,239 * 14,506 3,054,056 Partners capital accounts 28,520,912 2,136,748 377,515 25,525,423 12,989,298 * 39,255 12,496,869 Footnotes at end of table.
Total
Performing arts,spectator sports,
and relatedindustries
Museums,historical sites,
and similarinstitutions
Amusement,gambling,
and recreationindustries
Item
Arts, entertainment, and recreation
Table 3. All Partnerships and Partnerships with Net Income: Balance Sheets by Profit Status and Selected Industrial Group, Tax Year 2014—Continued
Health care and social assistance—continued
Hospitals
Nursingand
residentialcare
facilities
Socialassistance

147
Partnerships, Tax Year 2014
Fall 2016Statistics of Income Bulletin
[All figures are estimates based on samples—money amounts are in thousands of dollars]
Repair and maintenance
(127) (128) (129) (130) (131)
Number of partnerships [1] 138,213 42,484 95,729 85,640 42,645 Number of partners 516,694 192,332 324,362 279,902 90,600 Partnerships reporting balance sheet data: Number of partnerships 103,730 31,620 72,109 61,573 27,358 Number of partners 410,422 141,515 268,908 232,160 61,574 Total assets 252,088,086 196,472,614 55,615,472 25,065,311 12,172,736 Cash 18,014,680 12,509,739 5,504,941 2,221,972 1,066,236 Trade notes and accounts receivable 5,583,858 3,441,703 2,142,155 1,356,470 734,884 Less: Allowance for bad debts 170,977 161,767 9,210 55,352 9,013 Inventories 2,443,164 850,621 1,592,543 1,134,935 862,106 U.S. Government obligations 74,806 74,806 0 * 50,309 0 Tax-exempt securities * 49,707 * 49,707 0 0 0 Other current assets 11,249,486 5,812,587 5,436,899 1,126,645 599,327 Loans to partners 1,726,568 1,468,133 258,434 153,495 * 42,221 Mortgage and real estate loans * 52,749 * 51,646 * 1,104 * 24,176 * 5,283 Other investments 7,726,743 5,538,091 2,188,653 -265,693 45,444 Depreciable assets 221,926,057 174,938,869 46,987,188 15,160,180 8,131,263 Less: Accumulated depreciation 83,439,896 57,957,282 25,482,614 7,712,678 4,468,699 Depletable assets * 26,589 * 8,366 * 18,223 0 0 Less: Accumulated depletion * 23,495 * 5,272 * 18,223 0 0 Land 32,515,269 31,053,265 1,462,004 2,811,357 1,888,053 Intangible assets 24,706,835 9,341,842 15,364,993 5,917,893 3,130,316 Less: Accumulated amortization 5,979,347 2,296,811 3,682,537 1,073,989 647,912 Other assets 15,605,290 11,754,370 3,850,920 4,215,591 793,228 Total liabilities and capital 252,088,086 196,472,614 55,615,472 25,065,311 12,172,736 Accounts payable 7,610,787 3,697,251 3,913,536 857,663 533,628 Mortgages, notes, bonds payable in less than 1 year 6,370,153 4,551,933 1,818,220 464,873 260,919 Other current liabilities 20,279,445 11,659,061 8,620,384 1,774,109 991,273 Nonrecourse loans 22,658,123 21,421,604 1,236,519 * 227,273 * 9,618 Loans from partners 9,395,851 6,814,720 2,581,132 2,391,547 2,156,581 Mortgages, notes, bonds payable in 1 year or more 109,822,588 92,595,565 17,227,023 10,092,009 5,626,010 Other liabilities 23,563,321 18,591,021 4,972,300 3,148,497 1,363,272 Partners capital accounts 52,387,817 37,141,458 15,246,359 6,109,340 1,231,435 Footnotes at end of table.
Other servicesAccommodation and food services
Total Accommodation
Foodservices
anddrinkingplaces
Total
Total
Table 3. All Partnerships and Partnerships with Net Income: Balance Sheets by Profit Status and Selected Industrial Group, Tax Year 2014—Continued
Item

148
Partnerships, Tax Year 2014
Fall 2016Statistics of Income Bulletin
[All figures are estimates based on samples—money amounts are in thousands of dollars]
Repair and maintenance
(127) (128) (129) (130) (131)PARTNERSHIPS WITH NET INCOME
Number of partnerships [1] 73,576 19,115 54,461 52,642 24,609 Number of partners 276,654 88,292 188,362 212,380 55,026 Partnerships reporting balance sheet data: Number of partnerships 63,224 17,373 45,850 39,686 16,310 Number of partners 252,218 84,313 167,905 184,987 37,734 Total assets 135,502,214 106,051,085 29,451,130 13,233,362 6,139,298 Cash 11,816,026 8,160,689 3,655,337 1,511,977 931,317 Trade notes and accounts receivable 3,470,684 1,595,628 1,875,056 888,132 474,301 Less: Allowance for bad debts 51,099 45,584 5,515 41,456 6,590 Inventories 1,462,730 409,402 1,053,328 422,982 314,447 U.S. Government obligations 0 0 0 * 50,309 0 Tax-exempt securities * 49,380 * 49,380 0 0 0 Other current assets 5,787,967 3,761,081 2,026,887 638,228 309,045 Loans to partners 1,304,005 1,185,361 118,644 * 122,842 * 23,678 Mortgage and real estate loans * 9,259 * 8,155 * 1,104 * 5,283 * 5,283 Other investments 3,378,096 2,682,115 695,980 -358,693 * 7,628 Depreciable assets 129,536,728 100,669,249 28,867,479 8,163,823 4,601,763 Less: Accumulated depreciation 56,075,500 38,787,085 17,288,415 4,679,957 2,711,510 Depletable assets * 26,589 * 8,366 * 18,223 0 0 Less: Accumulated depletion * 23,495 * 5,272 * 18,223 0 0 Land 16,727,726 15,891,436 836,290 1,621,877 1,003,903 Intangible assets 13,233,114 5,183,620 8,049,494 2,067,746 1,274,502 Less: Accumulated amortization 4,228,368 1,501,209 2,727,160 504,342 324,032 Other assets 9,078,373 6,785,752 2,292,620 3,324,612 235,562 Total liabilities and capital 135,502,214 106,051,085 29,451,130 13,233,362 6,139,298 Accounts payable 3,756,577 1,390,485 2,366,092 472,629 301,972 Mortgages, notes, bonds payable in less than 1 year 4,217,115 3,112,826 1,104,290 251,045 166,165 Other current liabilities 10,266,583 6,072,606 4,193,977 1,154,370 757,785 Nonrecourse loans 15,543,384 15,067,890 475,494 * 219,668 * 2,013 Loans from partners 2,750,190 1,997,702 752,487 330,875 209,265 Mortgages, notes, bonds payable in 1 year or more 60,815,051 53,035,793 7,779,257 4,517,799 2,633,295 Other liabilities 6,556,302 4,863,155 1,693,147 1,678,088 386,947 Partners capital accounts 31,597,013 20,510,628 11,086,385 4,608,889 1,681,856 Footnotes at end of table.
Other servicesAccommodation and food services
Total Accommodation
Foodservices
anddrinkingplaces
Total
Table 3. All Partnerships and Partnerships with Net Income: Balance Sheets by Profit Status and Selected Industrial Group, Tax Year 2014—Continued
Total
Item

149
Partnerships, Tax Year 2014
Fall 2016Statistics of Income Bulletin
[All figures are estimates based on samples—money amounts are in thousands of dollars]
(132) (133) (134) (135) (136)
Number of partnerships [1] 27,503 15,142 42,878 * 117 0 Number of partners 58,383 32,217 188,819 * 484 0 Partnerships reporting balance sheet data: Number of partnerships 19,471 7,887 34,098 * 117 0 Number of partners 43,869 17,705 170,102 * 484 0 Total assets 9,710,085 2,462,651 12,398,853 * 493,722 0 Cash 669,611 396,625 1,096,005 * 59,732 0 Trade notes and accounts receivable 309,108 425,775 620,674 * 912 0 Less: Allowance for bad debts 4,229 * 4,784 46,339 0 0 Inventories 467,965 394,140 272,829 0 0 U.S. Government obligations 0 0 * 50,309 0 0 Tax-exempt securities 0 0 0 0 0 Other current assets 384,392 214,934 526,586 * 733 0 Loans to partners * 18,543 * 23,678 * 111,274 0 0 Mortgage and real estate loans * 5,283 0 * 18,893 0 0 Other investments 10,754 * 34,690 -742,993 * 431,857 0 Depreciable assets 7,331,507 799,756 7,028,322 * 595 0 Less: Accumulated depreciation 3,966,718 501,981 3,243,665 * 315 0 Depletable assets 0 0 0 0 0 Less: Accumulated depletion 0 0 0 0 0 Land 1,886,424 * 1,630 923,304 0 0 Intangible assets 2,693,658 436,658 2,787,392 * 185 0 Less: Accumulated amortization 599,501 48,410 426,057 * 20 0 Other assets 503,288 289,940 3,422,319 * 43 0 Total liabilities and capital 9,710,085 2,462,651 12,398,853 * 493,722 0 Accounts payable 336,169 197,459 322,242 * 1,793 0 Mortgages, notes, bonds payable in less than 1 year 195,243 65,676 203,954 0 0 Other current liabilities 717,128 274,145 776,416 * 6,420 0 Nonrecourse loans * 7,605 * 2,013 * 217,655 0 0 Loans from partners 2,110,303 * 46,278 234,966 0 0 Mortgages, notes, bonds payable in 1 year or more 5,103,947 522,063 4,465,999 0 0 Other liabilities 962,932 400,340 1,785,225 0 0 Partners capital accounts 276,759 954,676 4,392,396 * 485,508 0 Footnotes at end of table.
Repair and maintenance—continued
Other services—continued
Nature of business
not allocable
Religious,grantmaking,
civic, professional,and similar
organizations
Personaland laundry
servicesAutomotiverepair and
maintenance
Otherrepair and
maintenance
Table 3. All Partnerships and Partnerships with Net Income: Balance Sheets by Profit Status and Selected Industrial Group, Tax Year 2014—Continued
Item
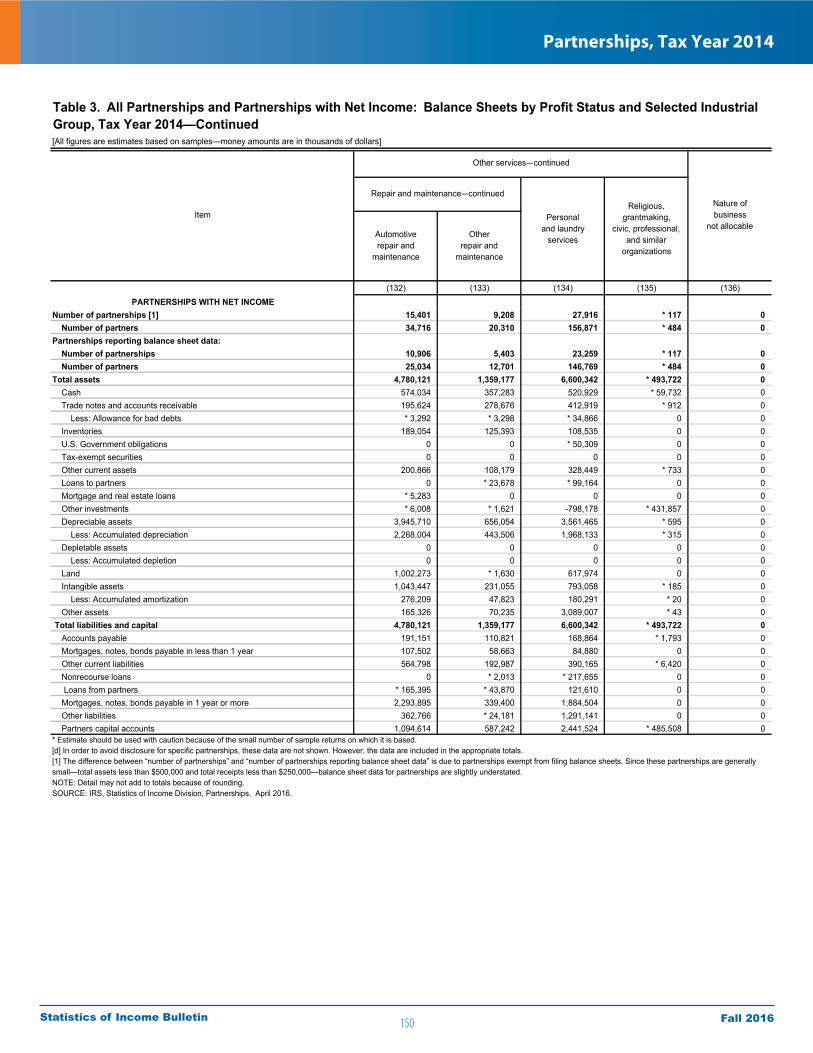
150
Partnerships, Tax Year 2014
Fall 2016Statistics of Income Bulletin
[All figures are estimates based on samples—money amounts are in thousands of dollars]
(132) (133) (134) (135) (136)PARTNERSHIPS WITH NET INCOME
Number of partnerships [1] 15,401 9,208 27,916 * 117 0 Number of partners 34,716 20,310 156,871 * 484 0 Partnerships reporting balance sheet data: Number of partnerships 10,906 5,403 23,259 * 117 0 Number of partners 25,034 12,701 146,769 * 484 0 Total assets 4,780,121 1,359,177 6,600,342 * 493,722 0 Cash 574,034 357,283 520,929 * 59,732 0 Trade notes and accounts receivable 195,624 278,676 412,919 * 912 0 Less: Allowance for bad debts * 3,292 * 3,298 * 34,866 0 0 Inventories 189,054 125,393 108,535 0 0 U.S. Government obligations 0 0 * 50,309 0 0 Tax-exempt securities 0 0 0 0 0 Other current assets 200,866 108,179 328,449 * 733 0 Loans to partners 0 * 23,678 * 99,164 0 0 Mortgage and real estate loans * 5,283 0 0 0 0 Other investments * 6,008 * 1,621 -798,178 * 431,857 0 Depreciable assets 3,945,710 656,054 3,561,465 * 595 0 Less: Accumulated depreciation 2,268,004 443,506 1,968,133 * 315 0 Depletable assets 0 0 0 0 0 Less: Accumulated depletion 0 0 0 0 0 Land 1,002,273 * 1,630 617,974 0 0 Intangible assets 1,043,447 231,055 793,058 * 185 0 Less: Accumulated amortization 276,209 47,823 180,291 * 20 0 Other assets 165,326 70,235 3,089,007 * 43 0 Total liabilities and capital 4,780,121 1,359,177 6,600,342 * 493,722 0 Accounts payable 191,151 110,821 168,864 * 1,793 0 Mortgages, notes, bonds payable in less than 1 year 107,502 58,663 84,880 0 0 Other current liabilities 564,798 192,987 390,165 * 6,420 0 Nonrecourse loans 0 * 2,013 * 217,655 0 0 Loans from partners * 165,395 * 43,870 121,610 0 0 Mortgages, notes, bonds payable in 1 year or more 2,293,895 339,400 1,884,504 0 0 Other liabilities 362,766 * 24,181 1,291,141 0 0 Partners capital accounts 1,094,614 587,242 2,441,524 * 485,508 0
Repair and maintenance—continued
Other services—continued
Nature of business
not allocablePersonal
and laundryservices
Religious,grantmaking,
civic, professional,and similar
organizations
Automotiverepair and
maintenance
* Estimate should be used with caution because of the small number of sample returns on which it is based.[d] In order to avoid disclosure for specific partnerships, these data are not shown. However, the data are included in the appropriate totals.[1] The difference between “number of partnerships” and “number of partnerships reporting balance sheet data” is due to partnerships exempt from filing balance sheets. Since these partnerships are generally small—total assets less than $500,000 and total receipts less than $250,000—balance sheet data for partnerships are slightly understated.NOTE: Detail may not add to totals because of rounding.SOURCE: IRS, Statistics of Income Division, Partnerships, April 2016.
Item
Table 3. All Partnerships and Partnerships with Net Income: Balance Sheets by Profit Status and Selected Industrial Group, Tax Year 2014—Continued
Otherrepair and
maintenance
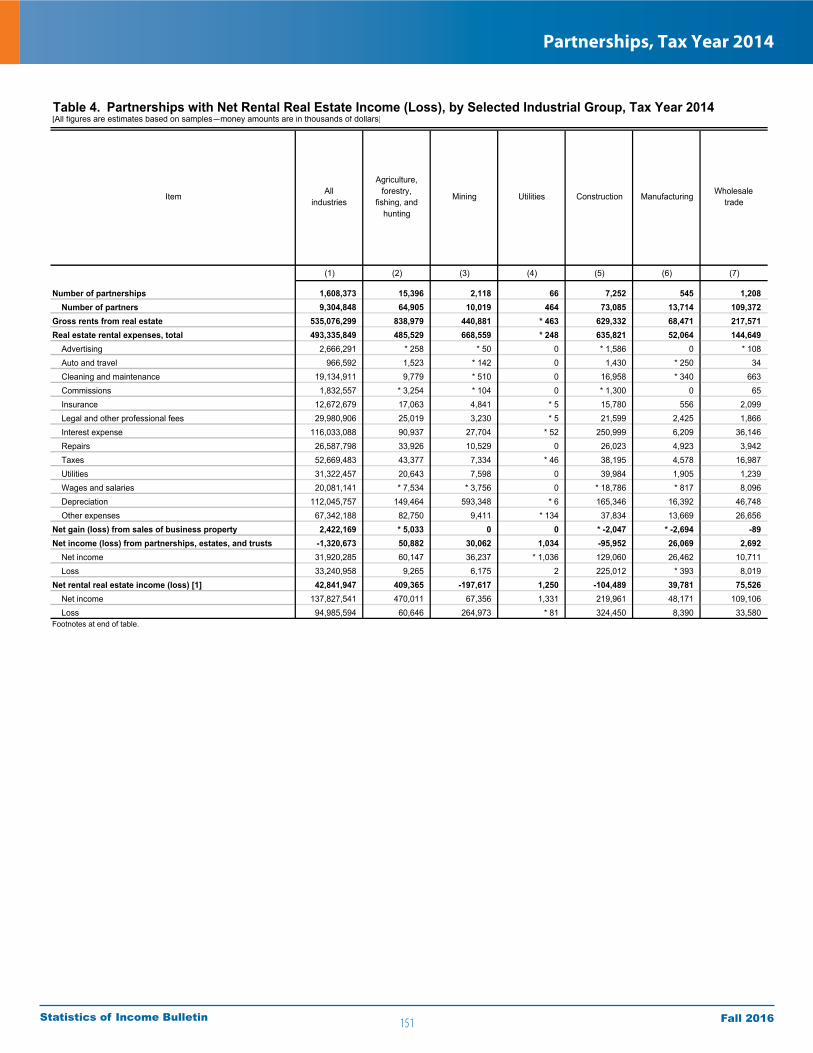
151
Partnerships, Tax Year 2014
Fall 2016Statistics of Income Bulletin
[All figures are estimates based on samples—money amounts are in thousands of dollars]
(1) (2) (3) (4) (5) (6) (7)
Number of partnerships 1,608,373 15,396 2,118 66 7,252 545 1,208 Number of partners 9,304,848 64,905 10,019 464 73,085 13,714 109,372 Gross rents from real estate 535,076,299 838,979 440,881 * 463 629,332 68,471 217,571 Real estate rental expenses, total 493,335,849 485,529 668,559 * 248 635,821 52,064 144,649 Advertising 2,666,291 * 258 * 50 0 * 1,586 0 * 108 Auto and travel 966,592 1,523 * 142 0 1,430 * 250 34 Cleaning and maintenance 19,134,911 9,779 * 510 0 16,958 * 340 663 Commissions 1,832,557 * 3,254 * 104 0 * 1,300 0 65 Insurance 12,672,679 17,063 4,841 * 5 15,780 556 2,099 Legal and other professional fees 29,980,906 25,019 3,230 * 5 21,599 2,425 1,866 Interest expense 116,033,088 90,937 27,704 * 52 250,999 6,209 36,146 Repairs 26,587,798 33,926 10,529 0 26,023 4,923 3,942 Taxes 52,669,483 43,377 7,334 * 46 38,195 4,578 16,987 Utilities 31,322,457 20,643 7,598 0 39,984 1,905 1,239 Wages and salaries 20,081,141 * 7,534 * 3,756 0 * 18,786 * 817 8,096 Depreciation 112,045,757 149,464 593,348 * 6 165,346 16,392 46,748 Other expenses 67,342,188 82,750 9,411 * 134 37,834 13,669 26,656 Net gain (loss) from sales of business property 2,422,169 * 5,033 0 0 * -2,047 * -2,694 -89 Net income (loss) from partnerships, estates, and trusts -1,320,673 50,882 30,062 1,034 -95,952 26,069 2,692 Net income 31,920,285 60,147 36,237 * 1,036 129,060 26,462 10,711 Loss 33,240,958 9,265 6,175 2 225,012 * 393 8,019 Net rental real estate income (loss) [1] 42,841,947 409,365 -197,617 1,250 -104,489 39,781 75,526 Net income 137,827,541 470,011 67,356 1,331 219,961 48,171 109,106 Loss 94,985,594 60,646 264,973 * 81 324,450 8,390 33,580 Footnotes at end of table.
Construction Manufacturing Wholesaletrade
Table 4. Partnerships with Net Rental Real Estate Income (Loss), by Selected Industrial Group, Tax Year 2014
Item Allindustries
Agriculture,forestry,
fishing, andhunting
Mining Utilities
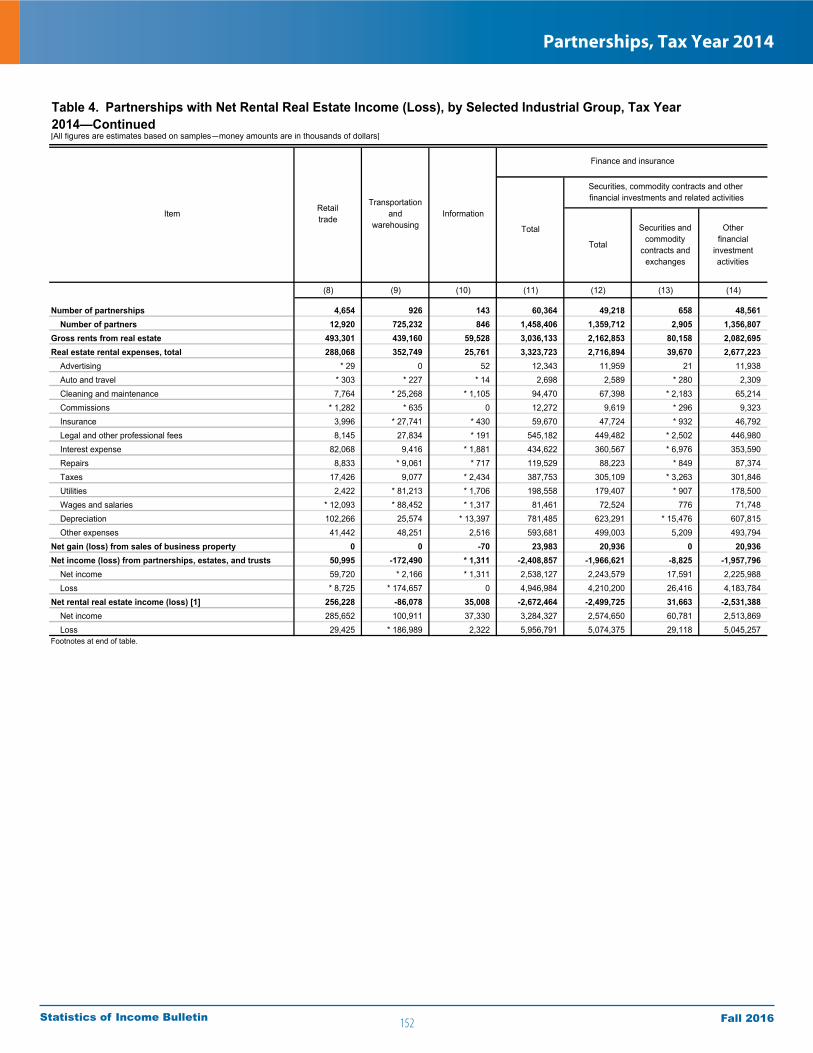
152
Partnerships, Tax Year 2014
Fall 2016Statistics of Income Bulletin
[All figures are estimates based on samples—money amounts are in thousands of dollars]
(8) (9) (10) (11) (12) (13) (14)
Number of partnerships 4,654 926 143 60,364 49,218 658 48,561 Number of partners 12,920 725,232 846 1,458,406 1,359,712 2,905 1,356,807 Gross rents from real estate 493,301 439,160 59,528 3,036,133 2,162,853 80,158 2,082,695 Real estate rental expenses, total 288,068 352,749 25,761 3,323,723 2,716,894 39,670 2,677,223 Advertising * 29 0 52 12,343 11,959 21 11,938 Auto and travel * 303 * 227 * 14 2,698 2,589 * 280 2,309 Cleaning and maintenance 7,764 * 25,268 * 1,105 94,470 67,398 * 2,183 65,214 Commissions * 1,282 * 635 0 12,272 9,619 * 296 9,323 Insurance 3,996 * 27,741 * 430 59,670 47,724 * 932 46,792 Legal and other professional fees 8,145 27,834 * 191 545,182 449,482 * 2,502 446,980 Interest expense 82,068 9,416 * 1,881 434,622 360,567 * 6,976 353,590 Repairs 8,833 * 9,061 * 717 119,529 88,223 * 849 87,374 Taxes 17,426 9,077 * 2,434 387,753 305,109 * 3,263 301,846 Utilities 2,422 * 81,213 * 1,706 198,558 179,407 * 907 178,500 Wages and salaries * 12,093 * 88,452 * 1,317 81,461 72,524 776 71,748 Depreciation 102,266 25,574 * 13,397 781,485 623,291 * 15,476 607,815 Other expenses 41,442 48,251 2,516 593,681 499,003 5,209 493,794 Net gain (loss) from sales of business property 0 0 -70 23,983 20,936 0 20,936 Net income (loss) from partnerships, estates, and trusts 50,995 -172,490 * 1,311 -2,408,857 -1,966,621 -8,825 -1,957,796 Net income 59,720 * 2,166 * 1,311 2,538,127 2,243,579 17,591 2,225,988 Loss * 8,725 * 174,657 0 4,946,984 4,210,200 26,416 4,183,784 Net rental real estate income (loss) [1] 256,228 -86,078 35,008 -2,672,464 -2,499,725 31,663 -2,531,388 Net income 285,652 100,911 37,330 3,284,327 2,574,650 60,781 2,513,869 Loss 29,425 * 186,989 2,322 5,956,791 5,074,375 29,118 5,045,257 Footnotes at end of table.
Transportationand
warehousing Otherfinancial
investmentactivities
Information
Finance and insurance
Retailtrade
Item
Total
Table 4. Partnerships with Net Rental Real Estate Income (Loss), by Selected Industrial Group, Tax Year 2014—Continued
Securities, commodity contracts and other financial investments and related activities
Total
Securities andcommodity
contracts and exchanges

153
Partnerships, Tax Year 2014
Fall 2016Statistics of Income Bulletin
[All figures are estimates based on samples—money amounts are in thousands of dollars]
(15) (16) (17) (18) (19) (20) (21)
Number of partnerships 10,203 943 1,484,142 1,479,602 567,636 684,361 14,387 Number of partners 84,249 14,446 6,387,423 6,368,298 2,431,778 2,759,442 56,233 Gross rents from real estate 693,897 179,384 524,903,159 524,413,689 192,026,011 297,593,742 8,327,280 Real estate rental expenses, total 469,994 136,835 483,933,680 483,745,356 198,048,918 253,799,381 5,926,867 Advertising * 305 * 78 2,626,995 2,626,508 1,410,097 911,103 126,961 Auto and travel * 84 * 25 953,720 953,097 521,350 344,142 32,722 Cleaning and maintenance 22,676 * 4,397 18,931,943 18,931,444 7,489,457 10,693,126 118,683 Commissions * 1,875 * 777 1,810,249 1,807,529 610,560 1,089,245 17,079 Insurance 8,224 3,722 12,457,718 12,455,005 6,491,207 5,229,888 174,305 Legal and other professional fees 84,585 * 11,115 29,186,001 29,178,509 12,380,460 14,080,121 486,038 Interest expense 57,389 16,666 114,454,716 114,421,453 40,370,096 66,798,658 1,160,266 Repairs 19,979 * 11,327 26,277,333 26,274,197 12,892,139 12,161,407 172,675 Taxes 54,988 27,656 51,871,342 51,847,176 17,547,135 30,912,318 666,534 Utilities 14,340 4,811 30,829,825 30,827,869 15,428,653 13,877,097 284,700 Wages and salaries * 8,466 * 471 19,576,309 19,570,388 12,083,969 5,808,945 586,151 Depreciation 112,296 45,897 109,559,028 109,495,628 45,804,497 57,226,214 1,052,525 Other expenses 84,785 9,893 65,398,502 65,356,553 25,019,299 34,667,119 1,048,228 Net gain (loss) from sales of business property * 3,046 0 2,340,597 2,340,597 552,118 1,027,567 * 31,478 Net income (loss) from partnerships, estates, and trusts -454,588 12,351 887,895 852,545 -3,273,804 8,447,758 700,306 Net income 232,776 61,771 28,049,628 28,010,331 4,938,660 14,457,059 709,971 Loss 687,364 49,420 27,161,732 27,157,786 8,212,464 6,009,300 * 9,665 Net rental real estate income (loss) [1] -227,638 54,899 44,197,972 43,861,476 -8,744,593 53,269,686 3,132,198 Net income 592,532 117,145 131,173,174 130,814,136 27,296,206 85,515,834 3,237,439 Loss 820,170 62,246 86,975,202 86,952,660 36,040,799 32,246,148 105,241 Footnotes at end of table.
Total
Lessors ofresidential
buildings and dwellings and cooperative
housing
Lessors ofnonresidential
buildings(except
miniwarehouses)
Lessors ofminiwarehousesand self-storage
units
Finance and insurance—continued Real estate and rental and leasing
Real estate
Item
Table 4. Partnerships with Net Rental Real Estate Income (Loss), by Selected Industrial Group, Tax Year 2014—Continued
Funds,trusts,
and otherfinancialvehicles
Otherfinance and insurance
Total

154
Partnerships, Tax Year 2014
Fall 2016Statistics of Income Bulletin
[All figures are estimates based on samples—money amounts are in thousands of dollars]
(22) (23) (24) (25) (26) (27) (28)
Number of partnerships 84,129 129,089 4,540 6,216 10,211 4,348 * 826 Number of partners 360,802 760,042 19,125 31,590 208,708 10,904 * 3,514 Gross rents from real estate 11,664,813 14,801,844 489,470 347,392 777,635 137,407 * 21,522 Real estate rental expenses, total 8,209,417 17,760,772 188,324 302,700 562,971 96,497 * 18,522 Advertising 33,210 145,136 * 487 * 285 * 2,616 0 * 81 Auto and travel 23,960 30,923 * 623 * 1,335 * 417 0 * 48 Cleaning and maintenance 204,734 425,444 * 499 2,338 15,997 * 2,197 * 49 Commissions 21,813 68,832 * 2,720 * 1,429 * 706 0 0 Insurance 193,553 366,052 2,712 2,933 12,096 * 637 * 264 Legal and other professional fees 713,514 1,518,378 7,492 5,751 69,410 * 140 * 55 Interest expense 1,798,581 4,293,853 * 33,263 37,763 88,413 * 4,914 * 8,182 Repairs 379,933 668,043 * 3,136 8,399 22,645 * 1,069 * 694 Taxes 1,117,102 1,604,087 24,167 18,096 65,371 * 29,563 * 232 Utilities 534,664 702,755 * 1,955 11,460 13,168 * 1,317 * 510 Wages and salaries 364,072 727,252 * 5,921 * 31,810 * 10,170 * 66 * 663 Depreciation 1,448,871 3,963,520 63,400 36,182 87,043 * 13,984 * 7,361 Other expenses 1,375,410 3,246,498 41,949 144,918 174,921 42,609 * 382 Net gain (loss) from sales of business property 289,603 439,831 0 10,669 0 0 * -12 Net income (loss) from partnerships, estates, and trusts 587,539 -5,609,255 35,350 193,940 214,756 -68,257 * -125 Net income 1,208,429 6,696,212 * 39,297 224,546 628,379 * 54 0 Loss 620,890 12,305,467 * 3,947 30,606 413,623 * 68,311 * 125 Net rental real estate income (loss) [1] 4,332,538 -8,128,352 336,496 249,301 429,420 -27,348 * 2,862 Net income 6,035,953 8,728,705 359,037 305,629 923,776 47,518 * 12,942 Loss 1,703,415 16,857,057 22,541 56,328 494,356 74,866 * 10,080 Footnotes at end of table.
Real estate and rental and leasing—continued
Real estate—continued Professional,scientific, and
technicalservices
Managementof companies
(holdingcompanies)
ItemLessors ofother real
estateproperty
Otherreal
estateactivities
Table 4. Partnerships with Net Rental Real Estate Income (Loss), by Selected Industrial Group, Tax Year 2014—Continued
Rental and leasing services and lessors of nonfinancial
intangible assets (except
copyrightedworks)
Administrativeand support and waste
managementand remediation
services
Educationalservices
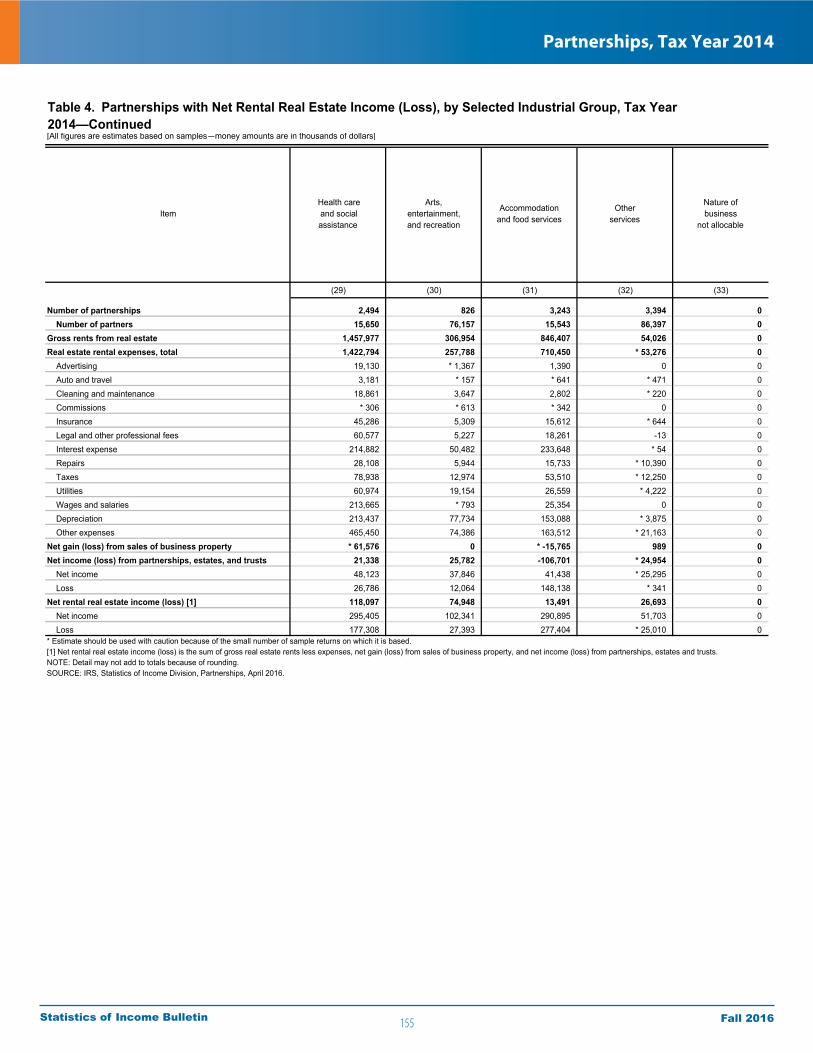
155
Partnerships, Tax Year 2014
Fall 2016Statistics of Income Bulletin
[All figures are estimates based on samples—money amounts are in thousands of dollars]
(29) (30) (31) (32) (33)
Number of partnerships 2,494 826 3,243 3,394 0 Number of partners 15,650 76,157 15,543 86,397 0 Gross rents from real estate 1,457,977 306,954 846,407 54,026 0 Real estate rental expenses, total 1,422,794 257,788 710,450 * 53,276 0 Advertising 19,130 * 1,367 1,390 0 0 Auto and travel 3,181 * 157 * 641 * 471 0 Cleaning and maintenance 18,861 3,647 2,802 * 220 0 Commissions * 306 * 613 * 342 0 0 Insurance 45,286 5,309 15,612 * 644 0 Legal and other professional fees 60,577 5,227 18,261 -13 0 Interest expense 214,882 50,482 233,648 * 54 0 Repairs 28,108 5,944 15,733 * 10,390 0 Taxes 78,938 12,974 53,510 * 12,250 0 Utilities 60,974 19,154 26,559 * 4,222 0 Wages and salaries 213,665 * 793 25,354 0 0 Depreciation 213,437 77,734 153,088 * 3,875 0 Other expenses 465,450 74,386 163,512 * 21,163 0 Net gain (loss) from sales of business property * 61,576 0 * -15,765 989 0 Net income (loss) from partnerships, estates, and trusts 21,338 25,782 -106,701 * 24,954 0 Net income 48,123 37,846 41,438 * 25,295 0 Loss 26,786 12,064 148,138 * 341 0 Net rental real estate income (loss) [1] 118,097 74,948 13,491 26,693 0 Net income 295,405 102,341 290,895 51,703 0 Loss 177,308 27,393 277,404 * 25,010 0
Arts,entertainment,and recreation
Accommodationand food services
Otherservices
Item
* Estimate should be used with caution because of the small number of sample returns on which it is based.[1] Net rental real estate income (loss) is the sum of gross real estate rents less expenses, net gain (loss) from sales of business property, and net income (loss) from partnerships, estates and trusts. NOTE: Detail may not add to totals because of rounding.SOURCE: IRS, Statistics of Income Division, Partnerships, April 2016.
Table 4. Partnerships with Net Rental Real Estate Income (Loss), by Selected Industrial Group, Tax Year 2014—Continued
Nature of business
not allocable
Health care and social assistance
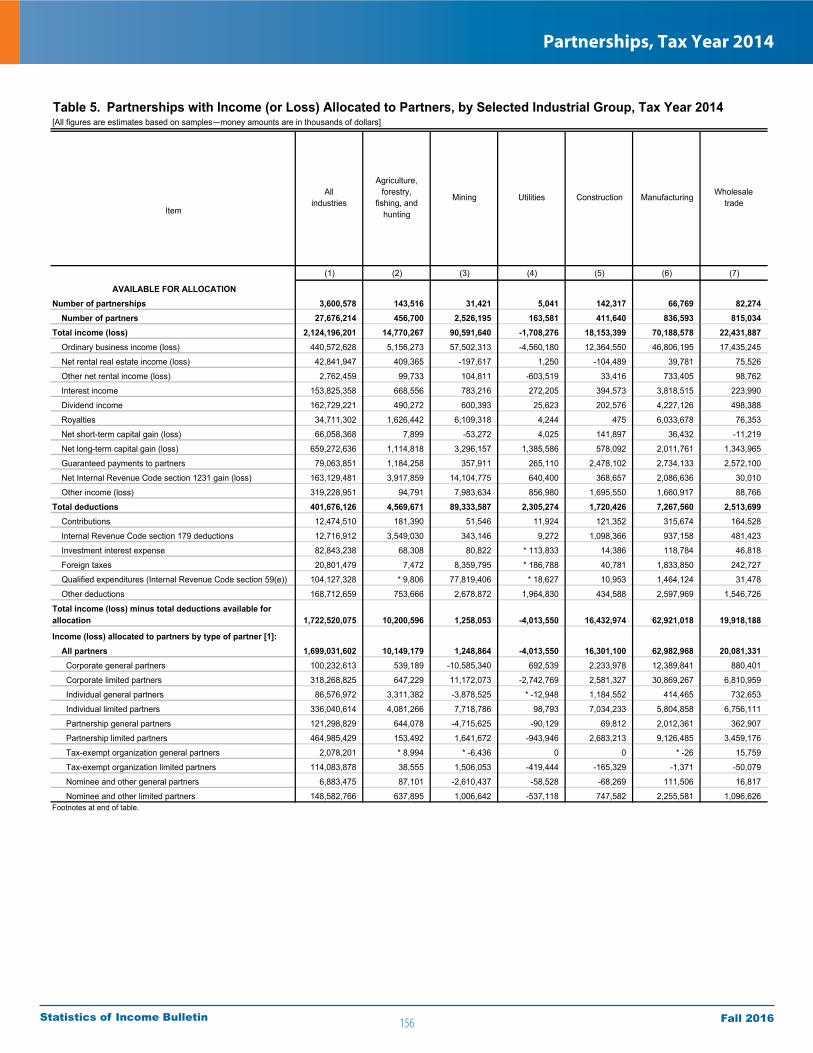
156
Partnerships, Tax Year 2014
Fall 2016Statistics of Income Bulletin
[All figures are estimates based on samples—money amounts are in thousands of dollars]
Item
(1) (2) (3) (4) (5) (6) (7)
AVAILABLE FOR ALLOCATIONNumber of partnerships 3,600,578 143,516 31,421 5,041 142,317 66,769 82,274 Number of partners 27,676,214 456,700 2,526,195 163,581 411,640 836,593 815,034 Total income (loss) 2,124,196,201 14,770,267 90,591,640 -1,708,276 18,153,399 70,188,578 22,431,887 Ordinary business income (loss) 440,572,628 5,156,273 57,502,313 -4,560,180 12,364,550 46,806,195 17,435,245
Net rental real estate income (loss) 42,841,947 409,365 -197,617 1,250 -104,489 39,781 75,526
Other net rental income (loss) 2,762,459 99,733 104,811 -603,519 33,416 733,405 98,762
Interest income 153,825,358 668,556 783,216 272,205 394,573 3,818,515 223,990
Dividend income 162,729,221 490,272 600,393 25,623 202,576 4,227,126 498,388
Royalties 34,711,302 1,626,442 6,109,318 4,244 475 6,033,678 76,353
Net short-term capital gain (loss) 66,058,368 7,899 -53,272 4,025 141,897 36,432 -11,219
Net long-term capital gain (loss) 659,272,636 1,114,818 3,296,157 1,385,586 578,092 2,011,761 1,343,965
Guaranteed payments to partners 79,063,851 1,184,258 357,911 265,110 2,478,102 2,734,133 2,572,100
Net Internal Revenue Code section 1231 gain (loss) 163,129,481 3,917,859 14,104,775 640,400 368,657 2,086,636 30,010
Other income (loss) 319,228,951 94,791 7,983,634 856,980 1,695,550 1,660,917 88,766
Total deductions 401,676,126 4,569,671 89,333,587 2,305,274 1,720,426 7,267,560 2,513,699 Contributions 12,474,510 181,390 51,546 11,924 121,352 315,674 164,528
Internal Revenue Code section 179 deductions 12,716,912 3,549,030 343,146 9,272 1,098,366 937,158 481,423
Investment interest expense 82,843,238 68,308 80,822 * 113,833 14,386 118,784 46,818
Foreign taxes 20,801,479 7,472 8,359,795 * 186,788 40,781 1,833,850 242,727
Qualified expenditures (Internal Revenue Code section 59(e)) 104,127,328 * 9,806 77,819,406 * 18,627 10,953 1,464,124 31,478
Other deductions 168,712,659 753,666 2,678,872 1,964,830 434,588 2,597,969 1,546,726
Total income (loss) minus total deductions available for allocation 1,722,520,075 10,200,596 1,258,053 -4,013,550 16,432,974 62,921,018 19,918,188
Income (loss) allocated to partners by type of partner [1]: All partners 1,699,031,602 10,149,179 1,248,864 -4,013,550 16,301,100 62,982,968 20,081,331 Corporate general partners 100,232,613 539,189 -10,585,340 692,539 2,233,978 12,389,841 880,401
Corporate limited partners 318,268,825 647,229 11,172,073 -2,742,769 2,581,327 30,869,267 6,810,959
Individual general partners 86,576,972 3,311,382 -3,878,525 * -12,948 1,184,552 414,465 732,653
Individual limited partners 336,040,614 4,081,266 7,718,786 98,793 7,034,233 5,804,858 6,756,111
Partnership general partners 121,298,829 644,078 -4,715,625 -90,129 69,812 2,012,361 362,907
Partnership limited partners 464,985,429 153,492 1,641,672 -943,946 2,683,213 9,126,485 3,459,176
Tax-exempt organization general partners 2,078,201 * 8,994 * -6,436 0 0 * -26 15,759
Tax-exempt organization limited partners 114,083,878 38,555 1,506,053 -419,444 -165,329 -1,371 -50,079
Nominee and other general partners 6,883,475 87,101 -2,610,437 -58,528 -68,269 111,506 16,817
Nominee and other limited partners 148,582,766 637,895 1,006,642 -537,118 747,582 2,255,581 1,096,626 Footnotes at end of table.
Allindustries
Agriculture,forestry,
fishing, andhunting
Mining Utilities Construction Wholesaletrade
Table 5. Partnerships with Income (or Loss) Allocated to Partners, by Selected Industrial Group, Tax Year 2014
Manufacturing
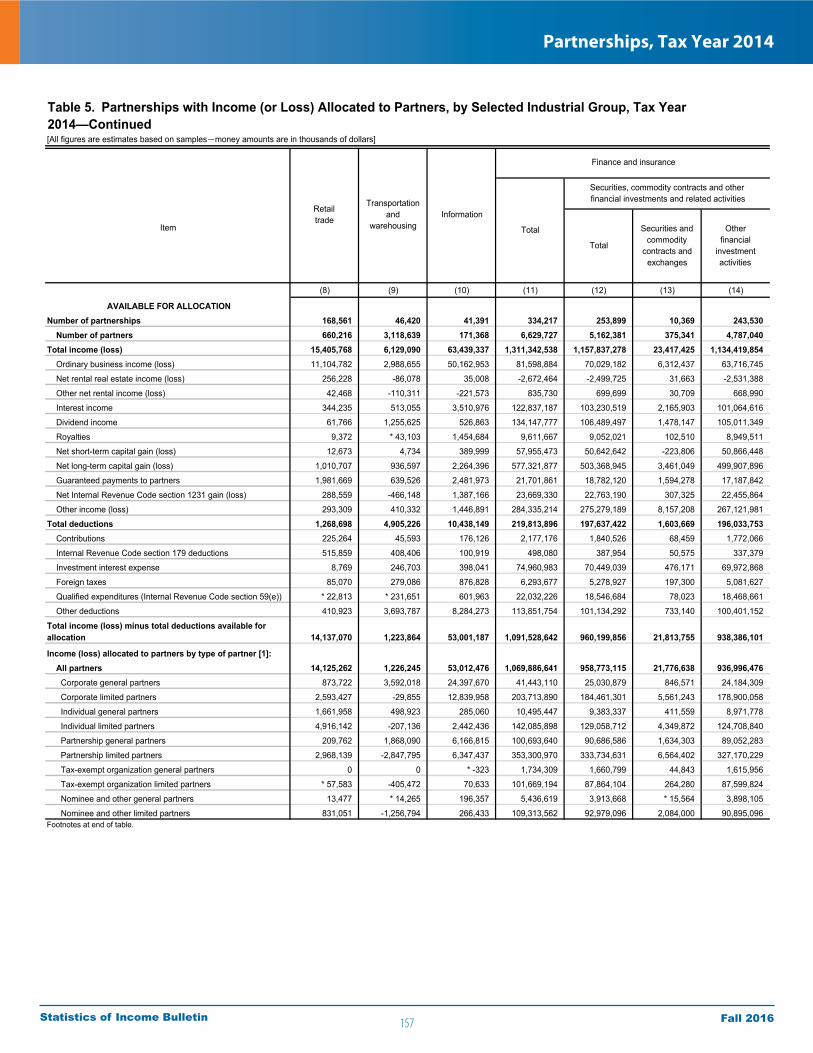
157
Partnerships, Tax Year 2014
Fall 2016Statistics of Income Bulletin
[All figures are estimates based on samples—money amounts are in thousands of dollars]
Item
(8) (9) (10) (11) (12) (13) (14)
AVAILABLE FOR ALLOCATIONNumber of partnerships 168,561 46,420 41,391 334,217 253,899 10,369 243,530 Number of partners 660,216 3,118,639 171,368 6,629,727 5,162,381 375,341 4,787,040 Total income (loss) 15,405,768 6,129,090 63,439,337 1,311,342,538 1,157,837,278 23,417,425 1,134,419,854 Ordinary business income (loss) 11,104,782 2,988,655 50,162,953 81,598,884 70,029,182 6,312,437 63,716,745
Net rental real estate income (loss) 256,228 -86,078 35,008 -2,672,464 -2,499,725 31,663 -2,531,388
Other net rental income (loss) 42,468 -110,311 -221,573 835,730 699,699 30,709 668,990
Interest income 344,235 513,055 3,510,976 122,837,187 103,230,519 2,165,903 101,064,616
Dividend income 61,766 1,255,625 526,863 134,147,777 106,489,497 1,478,147 105,011,349
Royalties 9,372 * 43,103 1,454,684 9,611,667 9,052,021 102,510 8,949,511
Net short-term capital gain (loss) 12,673 4,734 389,999 57,955,473 50,642,642 -223,806 50,866,448
Net long-term capital gain (loss) 1,010,707 936,597 2,264,396 577,321,877 503,368,945 3,461,049 499,907,896
Guaranteed payments to partners 1,981,669 639,526 2,481,973 21,701,861 18,782,120 1,594,278 17,187,842
Net Internal Revenue Code section 1231 gain (loss) 288,559 -466,148 1,387,166 23,669,330 22,763,190 307,325 22,455,864
Other income (loss) 293,309 410,332 1,446,891 284,335,214 275,279,189 8,157,208 267,121,981
Total deductions 1,268,698 4,905,226 10,438,149 219,813,896 197,637,422 1,603,669 196,033,753 Contributions 225,264 45,593 176,126 2,177,176 1,840,526 68,459 1,772,066
Internal Revenue Code section 179 deductions 515,859 408,406 100,919 498,080 387,954 50,575 337,379
Investment interest expense 8,769 246,703 398,041 74,960,983 70,449,039 476,171 69,972,868
Foreign taxes 85,070 279,086 876,828 6,293,677 5,278,927 197,300 5,081,627
Qualified expenditures (Internal Revenue Code section 59(e)) * 22,813 * 231,651 601,963 22,032,226 18,546,684 78,023 18,468,661
Other deductions 410,923 3,693,787 8,284,273 113,851,754 101,134,292 733,140 100,401,152
Total income (loss) minus total deductions available for allocation 14,137,070 1,223,864 53,001,187 1,091,528,642 960,199,856 21,813,755 938,386,101
Income (loss) allocated to partners by type of partner [1]: All partners 14,125,262 1,226,245 53,012,476 1,069,886,641 958,773,115 21,776,638 936,996,476 Corporate general partners 873,722 3,592,018 24,397,670 41,443,110 25,030,879 846,571 24,184,309
Corporate limited partners 2,593,427 -29,855 12,839,958 203,713,890 184,461,301 5,561,243 178,900,058
Individual general partners 1,661,958 498,923 285,060 10,495,447 9,383,337 411,559 8,971,778
Individual limited partners 4,916,142 -207,136 2,442,436 142,085,898 129,058,712 4,349,872 124,708,840
Partnership general partners 209,762 1,868,090 6,166,815 100,693,640 90,686,586 1,634,303 89,052,283
Partnership limited partners 2,968,139 -2,847,795 6,347,437 353,300,970 333,734,631 6,564,402 327,170,229
Tax-exempt organization general partners 0 0 * -323 1,734,309 1,660,799 44,843 1,615,956
Tax-exempt organization limited partners * 57,583 -405,472 70,633 101,669,194 87,864,104 264,280 87,599,824
Nominee and other general partners 13,477 * 14,265 196,357 5,436,619 3,913,668 * 15,564 3,898,105
Nominee and other limited partners 831,051 -1,256,794 266,433 109,313,562 92,979,096 2,084,000 90,895,096 Footnotes at end of table.
Information
Finance and insurance
Retailtrade
Transportationand
warehousing Total
Securities, commodity contracts and other financial investments and related activities
Total
Securities andcommodity
contracts and exchanges
Otherfinancial
investmentactivities
Table 5. Partnerships with Income (or Loss) Allocated to Partners, by Selected Industrial Group, Tax Year 2014—Continued
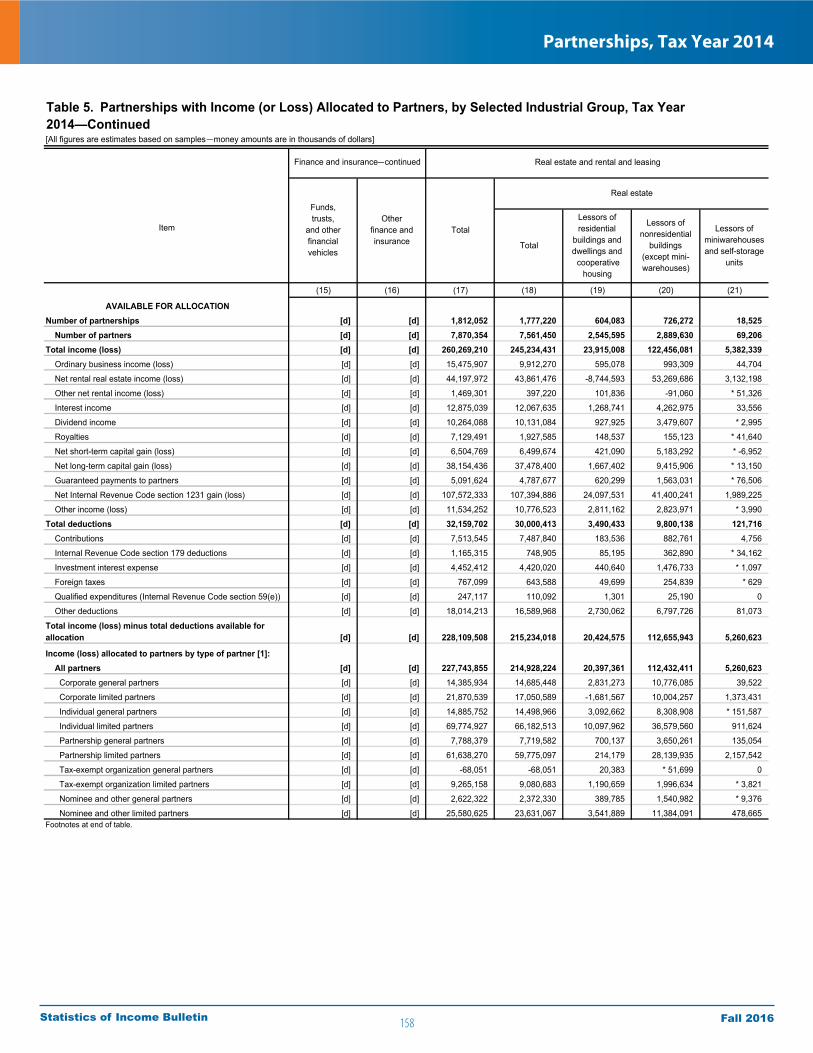
158
Partnerships, Tax Year 2014
Fall 2016Statistics of Income Bulletin
[All figures are estimates based on samples—money amounts are in thousands of dollars]
Item
(15) (16) (17) (18) (19) (20) (21)
AVAILABLE FOR ALLOCATIONNumber of partnerships [d] [d] 1,812,052 1,777,220 604,083 726,272 18,525 Number of partners [d] [d] 7,870,354 7,561,450 2,545,595 2,889,630 69,206 Total income (loss) [d] [d] 260,269,210 245,234,431 23,915,008 122,456,081 5,382,339 Ordinary business income (loss) [d] [d] 15,475,907 9,912,270 595,078 993,309 44,704
Net rental real estate income (loss) [d] [d] 44,197,972 43,861,476 -8,744,593 53,269,686 3,132,198
Other net rental income (loss) [d] [d] 1,469,301 397,220 101,836 -91,060 * 51,326
Interest income [d] [d] 12,875,039 12,067,635 1,268,741 4,262,975 33,556
Dividend income [d] [d] 10,264,088 10,131,084 927,925 3,479,607 * 2,995
Royalties [d] [d] 7,129,491 1,927,585 148,537 155,123 * 41,640
Net short-term capital gain (loss) [d] [d] 6,504,769 6,499,674 421,090 5,183,292 * -6,952
Net long-term capital gain (loss) [d] [d] 38,154,436 37,478,400 1,667,402 9,415,906 * 13,150
Guaranteed payments to partners [d] [d] 5,091,624 4,787,677 620,299 1,563,031 * 76,506
Net Internal Revenue Code section 1231 gain (loss) [d] [d] 107,572,333 107,394,886 24,097,531 41,400,241 1,989,225
Other income (loss) [d] [d] 11,534,252 10,776,523 2,811,162 2,823,971 * 3,990
Total deductions [d] [d] 32,159,702 30,000,413 3,490,433 9,800,138 121,716 Contributions [d] [d] 7,513,545 7,487,840 183,536 882,761 4,756
Internal Revenue Code section 179 deductions [d] [d] 1,165,315 748,905 85,195 362,890 * 34,162
Investment interest expense [d] [d] 4,452,412 4,420,020 440,640 1,476,733 * 1,097
Foreign taxes [d] [d] 767,099 643,588 49,699 254,839 * 629
Qualified expenditures (Internal Revenue Code section 59(e)) [d] [d] 247,117 110,092 1,301 25,190 0
Other deductions [d] [d] 18,014,213 16,589,968 2,730,062 6,797,726 81,073
Total income (loss) minus total deductions available for allocation [d] [d] 228,109,508 215,234,018 20,424,575 112,655,943 5,260,623
Income (loss) allocated to partners by type of partner [1]: All partners [d] [d] 227,743,855 214,928,224 20,397,361 112,432,411 5,260,623 Corporate general partners [d] [d] 14,385,934 14,685,448 2,831,273 10,776,085 39,522
Corporate limited partners [d] [d] 21,870,539 17,050,589 -1,681,567 10,004,257 1,373,431
Individual general partners [d] [d] 14,885,752 14,498,966 3,092,662 8,308,908 * 151,587
Individual limited partners [d] [d] 69,774,927 66,182,513 10,097,962 36,579,560 911,624
Partnership general partners [d] [d] 7,788,379 7,719,582 700,137 3,650,261 135,054
Partnership limited partners [d] [d] 61,638,270 59,775,097 214,179 28,139,935 2,157,542
Tax-exempt organization general partners [d] [d] -68,051 -68,051 20,383 * 51,699 0
Tax-exempt organization limited partners [d] [d] 9,265,158 9,080,683 1,190,659 1,996,634 * 3,821
Nominee and other general partners [d] [d] 2,622,322 2,372,330 389,785 1,540,982 * 9,376
Nominee and other limited partners [d] [d] 25,580,625 23,631,067 3,541,889 11,384,091 478,665 Footnotes at end of table.
Lessors ofnonresidential
buildings(except mini-warehouses)
Total
Funds,trusts,
and otherfinancialvehicles
Otherfinance and insurance Total
Lessors ofresidential
buildings and dwellings and cooperative
housing
Table 5. Partnerships with Income (or Loss) Allocated to Partners, by Selected Industrial Group, Tax Year 2014—Continued
Real estate and rental and leasing
Real estate
Finance and insurance—continued
Lessors ofminiwarehousesand self-storage
units
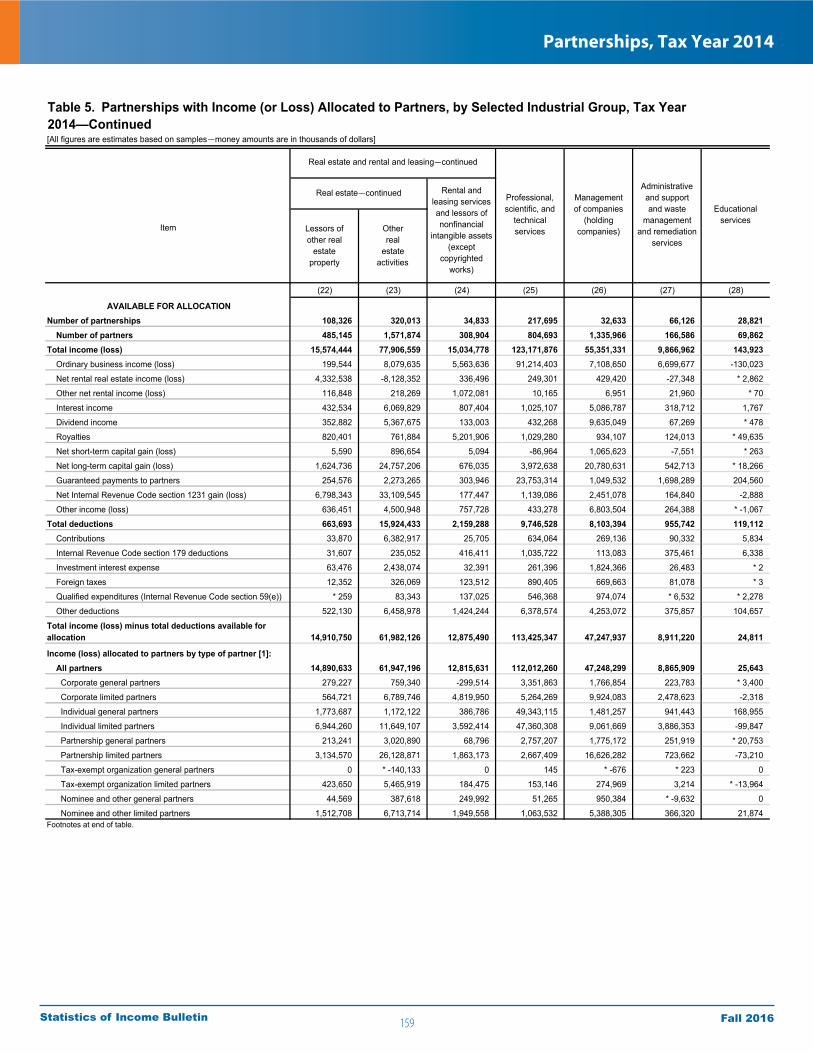
159
Partnerships, Tax Year 2014
Fall 2016Statistics of Income Bulletin
[All figures are estimates based on samples—money amounts are in thousands of dollars]
Item
(22) (23) (24) (25) (26) (27) (28)
AVAILABLE FOR ALLOCATIONNumber of partnerships 108,326 320,013 34,833 217,695 32,633 66,126 28,821 Number of partners 485,145 1,571,874 308,904 804,693 1,335,966 166,586 69,862 Total income (loss) 15,574,444 77,906,559 15,034,778 123,171,876 55,351,331 9,866,962 143,923 Ordinary business income (loss) 199,544 8,079,635 5,563,636 91,214,403 7,108,650 6,699,677 -130,023
Net rental real estate income (loss) 4,332,538 -8,128,352 336,496 249,301 429,420 -27,348 * 2,862
Other net rental income (loss) 116,848 218,269 1,072,081 10,165 6,951 21,960 * 70
Interest income 432,534 6,069,829 807,404 1,025,107 5,086,787 318,712 1,767
Dividend income 352,882 5,367,675 133,003 432,268 9,635,049 67,269 * 478
Royalties 820,401 761,884 5,201,906 1,029,280 934,107 124,013 * 49,635
Net short-term capital gain (loss) 5,590 896,654 5,094 -86,964 1,065,623 -7,551 * 263
Net long-term capital gain (loss) 1,624,736 24,757,206 676,035 3,972,638 20,780,631 542,713 * 18,266
Guaranteed payments to partners 254,576 2,273,265 303,946 23,753,314 1,049,532 1,698,289 204,560
Net Internal Revenue Code section 1231 gain (loss) 6,798,343 33,109,545 177,447 1,139,086 2,451,078 164,840 -2,888
Other income (loss) 636,451 4,500,948 757,728 433,278 6,803,504 264,388 * -1,067
Total deductions 663,693 15,924,433 2,159,288 9,746,528 8,103,394 955,742 119,112 Contributions 33,870 6,382,917 25,705 634,064 269,136 90,332 5,834
Internal Revenue Code section 179 deductions 31,607 235,052 416,411 1,035,722 113,083 375,461 6,338
Investment interest expense 63,476 2,438,074 32,391 261,396 1,824,366 26,483 * 2
Foreign taxes 12,352 326,069 123,512 890,405 669,663 81,078 * 3
Qualified expenditures (Internal Revenue Code section 59(e)) * 259 83,343 137,025 546,368 974,074 * 6,532 * 2,278
Other deductions 522,130 6,458,978 1,424,244 6,378,574 4,253,072 375,857 104,657
Total income (loss) minus total deductions available for allocation 14,910,750 61,982,126 12,875,490 113,425,347 47,247,937 8,911,220 24,811
Income (loss) allocated to partners by type of partner [1]: All partners 14,890,633 61,947,196 12,815,631 112,012,260 47,248,299 8,865,909 25,643 Corporate general partners 279,227 759,340 -299,514 3,351,863 1,766,854 223,783 * 3,400
Corporate limited partners 564,721 6,789,746 4,819,950 5,264,269 9,924,083 2,478,623 -2,318
Individual general partners 1,773,687 1,172,122 386,786 49,343,115 1,481,257 941,443 168,955
Individual limited partners 6,944,260 11,649,107 3,592,414 47,360,308 9,061,669 3,886,353 -99,847
Partnership general partners 213,241 3,020,890 68,796 2,757,207 1,775,172 251,919 * 20,753
Partnership limited partners 3,134,570 26,128,871 1,863,173 2,667,409 16,626,282 723,662 -73,210
Tax-exempt organization general partners 0 * -140,133 0 145 * -676 * 223 0
Tax-exempt organization limited partners 423,650 5,465,919 184,475 153,146 274,969 3,214 * -13,964
Nominee and other general partners 44,569 387,618 249,992 51,265 950,384 * -9,632 0
Nominee and other limited partners 1,512,708 6,713,714 1,949,558 1,063,532 5,388,305 366,320 21,874 Footnotes at end of table.
Professional,scientific, and
technicalservices
Rental and leasing services and lessors of nonfinancial
intangible assets (except
copyrightedworks)
Lessors ofother real
estateproperty
Otherreal
estateactivities
Managementof companies
(holdingcompanies)
Administrativeand support and waste
managementand remediation
services
Table 5. Partnerships with Income (or Loss) Allocated to Partners, by Selected Industrial Group, Tax Year 2014—Continued
Real estate—continued
Real estate and rental and leasing—continued
Educationalservices
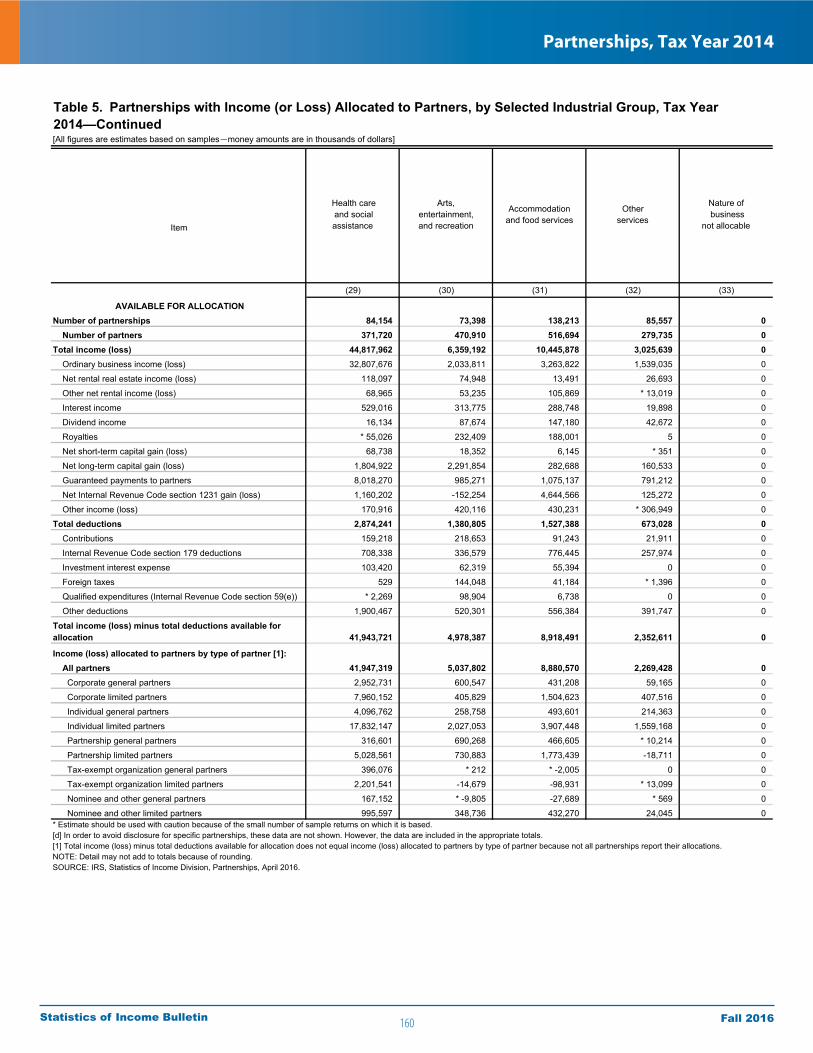
160
Partnerships, Tax Year 2014
Fall 2016Statistics of Income Bulletin
[All figures are estimates based on samples—money amounts are in thousands of dollars]
Item
(29) (30) (31) (32) (33)
AVAILABLE FOR ALLOCATIONNumber of partnerships 84,154 73,398 138,213 85,557 0 Number of partners 371,720 470,910 516,694 279,735 0 Total income (loss) 44,817,962 6,359,192 10,445,878 3,025,639 0 Ordinary business income (loss) 32,807,676 2,033,811 3,263,822 1,539,035 0
Net rental real estate income (loss) 118,097 74,948 13,491 26,693 0
Other net rental income (loss) 68,965 53,235 105,869 * 13,019 0
Interest income 529,016 313,775 288,748 19,898 0
Dividend income 16,134 87,674 147,180 42,672 0
Royalties * 55,026 232,409 188,001 5 0
Net short-term capital gain (loss) 68,738 18,352 6,145 * 351 0
Net long-term capital gain (loss) 1,804,922 2,291,854 282,688 160,533 0
Guaranteed payments to partners 8,018,270 985,271 1,075,137 791,212 0
Net Internal Revenue Code section 1231 gain (loss) 1,160,202 -152,254 4,644,566 125,272 0
Other income (loss) 170,916 420,116 430,231 * 306,949 0
Total deductions 2,874,241 1,380,805 1,527,388 673,028 0 Contributions 159,218 218,653 91,243 21,911 0
Internal Revenue Code section 179 deductions 708,338 336,579 776,445 257,974 0
Investment interest expense 103,420 62,319 55,394 0 0
Foreign taxes 529 144,048 41,184 * 1,396 0
Qualified expenditures (Internal Revenue Code section 59(e)) * 2,269 98,904 6,738 0 0
Other deductions 1,900,467 520,301 556,384 391,747 0
Total income (loss) minus total deductions available for allocation 41,943,721 4,978,387 8,918,491 2,352,611 0
Income (loss) allocated to partners by type of partner [1]: All partners 41,947,319 5,037,802 8,880,570 2,269,428 0 Corporate general partners 2,952,731 600,547 431,208 59,165 0
Corporate limited partners 7,960,152 405,829 1,504,623 407,516 0
Individual general partners 4,096,762 258,758 493,601 214,363 0
Individual limited partners 17,832,147 2,027,053 3,907,448 1,559,168 0
Partnership general partners 316,601 690,268 466,605 * 10,214 0
Partnership limited partners 5,028,561 730,883 1,773,439 -18,711 0
Tax-exempt organization general partners 396,076 * 212 * -2,005 0 0
Tax-exempt organization limited partners 2,201,541 -14,679 -98,931 * 13,099 0
Nominee and other general partners 167,152 * -9,805 -27,689 * 569 0
Nominee and other limited partners 995,597 348,736 432,270 24,045 0
Nature of business
not allocable
Otherservices
Accommodationand food services
* Estimate should be used with caution because of the small number of sample returns on which it is based.[d] In order to avoid disclosure for specific partnerships, these data are not shown. However, the data are included in the appropriate totals.[1] Total income (loss) minus total deductions available for allocation does not equal income (loss) allocated to partners by type of partner because not all partnerships report their allocations.NOTE: Detail may not add to totals because of rounding.SOURCE: IRS, Statistics of Income Division, Partnerships, April 2016.
Table 5. Partnerships with Income (or Loss) Allocated to Partners, by Selected Industrial Group, Tax Year 2014—Continued
Health care and social assistance
Arts,entertainment,and recreation

161
Partnerships, Tax Year 2014
Fall 2016Statistics of Income Bulletin
(1) (2) (3) (4) (5) (6) (7)
Number of LLCs 2,432,303 72,077 12,051 4,377 109,611 44,640 61,772 Number of partners 10,202,627 238,319 634,903 16,537 332,358 308,415 181,996 Total assets 9,683,117,241 128,639,178 288,690,390 323,857,847 146,647,792 472,122,969 172,609,320 Total income 3,449,993,883 29,493,651 109,921,333 146,622,136 182,737,710 679,456,502 439,663,824 Total deductions 3,286,406,019 27,987,447 86,634,658 151,208,752 174,931,143 660,675,989 427,585,409 Ordinary business income (loss) 163,587,865 1,506,205 23,286,674 -4,586,616 7,806,567 18,780,512 12,078,415 Portfolio income (loss) distributed directly to partners 269,028,030 1,521,643 4,595,249 373,448 777,391 6,109,358 1,010,411 Interest income 44,497,445 516,017 317,594 157,926 182,083 1,117,792 128,823 Dividend income 41,742,709 157,031 278,028 24,809 198,049 1,608,517 298,906 Royalties 8,974,198 363,149 1,375,478 1,382 314 1,473,387 57,963 Net short-term capital gain (loss) 19,546,359 -5,691 -30,067 * 1,006 165,953 17,834 9,844 Net long-term capital gain (loss) 154,267,319 491,137 2,654,217 * 188,326 230,991 1,891,828 514,874 Net rental real estate income (loss) 18,250,881 143,488 -210,196 * 228 -81,104 18,859 72,184 Other net rental income (loss) 886,812 27,439 79,869 -629,420 1,671 244,693 11,351 Total net income (loss) [1] 277,939,910 2,713,329 25,127,447 -5,031,692 8,107,580 23,243,761 12,647,642
(8) (9) (10) (11) (12) (13) (14)
Number of LLCs 103,781 35,057 33,231 178,777 131,953 5,600 126,352 Number of partners 315,263 115,338 146,461 1,658,253 1,310,692 23,163 1,287,529 Total assets 134,084,006 158,791,871 455,831,294 3,285,839,374 2,756,395,433 358,360,842 2,398,034,591 Total income 386,891,297 112,782,246 203,411,885 257,889,034 195,436,455 87,583,918 107,852,537 Total deductions 380,490,348 115,869,941 192,150,528 224,168,328 168,751,942 82,090,363 86,661,579 Ordinary business income (loss) 6,400,949 -3,087,695 11,261,358 33,720,706 26,684,514 5,493,556 21,190,958 Portfolio income (loss) distributed directly to partners 561,183 2,353,505 4,080,665 181,877,414 155,283,492 3,253,285 152,030,207 Interest income 125,186 95,686 1,466,452 29,374,596 23,765,219 1,408,741 22,356,478 Dividend income 34,446 293,655 443,478 29,945,316 25,416,453 943,152 24,473,301 Royalties 6,486 * 414 637,563 1,245,417 1,107,242 12,983 1,094,259 Net short-term capital gain (loss) 7,847 610 129,747 11,953,863 10,498,608 -695,521 11,194,129 Net long-term capital gain (loss) 387,217 1,963,138 1,403,425 109,358,223 94,495,970 1,583,931 92,912,039 Net rental real estate income (loss) 155,008 76,570 8,601 -1,641,210 -1,418,038 8,173 -1,426,211 Other net rental income (loss) -674 -142,088 357,256 352,122 257,047 482 256,565 Total net income (loss) [1] 6,721,401 -2,763,457 14,174,708 92,996,946 75,812,437 7,867,086 67,945,351 Footnotes at end of table.
Item
Item
Table 6. Domestic Limited Liability Companies: Selected Items for Selected Industrial Groups, Tax Year 2014[All figures are estimates based on samples—money amounts are in thousands of dollars]
Information
Finance and insurance
Allindustries
Agriculture,forestry,
fishing, andhunting
Mining Utilities Construction ManufacturingWholesale
trade
Retailtrade
Transportationand
warehousing Total
Securities, commodity contracts and other financial investments and related activities
Otherfinancial
investmentactivities
Total
Securities andcommodity
contracts and exchanges

162
Partnerships, Tax Year 2014
Fall 2016Statistics of Income Bulletin
Item
(15) (16) (17) (18) (19) (20) (21)
Number of LLCs 21,831 24,994 1,269,183 1,249,047 406,282 527,065 13,622 Number of partners 227,309 120,251 4,534,967 4,439,736 1,350,487 1,886,331 43,133 Total assets 353,115,111 176,328,830 3,111,367,781 3,022,562,099 810,826,820 1,486,947,761 28,168,409 Total income 11,439,598 51,012,982 131,834,242 110,096,164 6,985,044 10,315,864 614,805 Total deductions 11,615,148 43,801,239 124,391,962 102,527,318 6,903,822 10,322,952 563,603 Ordinary business income (loss) -175,550 7,211,742 7,442,280 7,568,847 81,222 -7,087 51,202 Portfolio income (loss) distributed directly to partners 23,478,115 3,115,807 34,830,283 31,679,482 1,860,770 11,957,893 8,549 Interest income 3,937,109 1,672,267 6,297,717 5,618,071 582,552 1,671,808 16,865 Dividend income 4,093,184 435,678 2,245,031 2,196,151 422,202 683,846 * 211 Royalties 138,171 * 4 2,411,828 494,968 26,671 60,154 * 19 Net short-term capital gain (loss) 1,338,011 117,244 6,632,390 6,631,658 409,295 5,747,844 * -8,612 Net long-term capital gain (loss) 13,971,639 890,613 17,243,318 16,738,634 420,049 3,794,242 * 66 Net rental real estate income (loss) -292,481 69,309 19,392,350 19,137,443 -3,911,126 24,258,698 1,640,462 Other net rental income (loss) 93,546 * 1,529 305,866 142,066 97,520 -130,694 * 25,428 Total net income (loss) [1] 7,793,980 9,390,529 38,095,073 35,157,544 -2,700,958 26,536,724 1,734,188
Item
(22) (23) (24) (25) (26) (27) (28)
Number of LLCs 59,801 242,277 20,136 146,315 18,437 41,307 12,383 Number of partners 216,977 942,807 95,232 482,691 109,731 107,917 34,942 Total assets 105,468,746 591,150,362 88,805,682 131,447,538 380,966,983 60,667,555 4,489,942 Total income 4,395,691 87,784,759 21,738,078 215,598,872 24,450,181 91,287,441 5,239,639 Total deductions 3,884,291 80,852,650 21,864,644 197,462,811 20,857,279 87,085,708 5,532,486 Ordinary business income (loss) 511,400 6,932,110 -126,566 18,136,061 3,592,903 4,201,733 -292,847 Portfolio income (loss) distributed directly to partners 505,203 17,347,066 3,150,802 3,607,955 23,282,575 708,358 69,182 Interest income 205,463 3,141,383 679,646 630,393 3,223,385 173,374 1,634 Dividend income 104,023 985,868 48,880 222,659 5,852,758 12,961 * 338 Royalties 160,585 247,539 1,916,860 367,806 591,982 * 2,786 * 49,489 Net short-term capital gain (loss) 5,179 477,953 * 731 -134,112 709,348 -7,099 * -4 Net long-term capital gain (loss) 29,953 12,494,324 504,683 2,521,209 12,905,102 526,336 * 17,726 Net rental real estate income (loss) 1,801,861 -4,652,453 254,908 176,971 -31,701 23,829 * 7,245 Other net rental income (loss) 127,959 21,853 163,800 -32,486 50,328 25,438 * 70 Total net income (loss) [1] 2,911,292 6,676,299 2,937,529 19,501,404 13,279,654 4,440,121 -234,072 Footnotes at end of table.
Table 6. Domestic Limited Liability Companies: Selected Items for Selected Industrial Groups, Tax Year 2014—Continued[All figures are estimates based on samples—money amounts are in thousands of dollars]
Real estate and rental and leasing
Real estate
Real estate and rental and leasing—continued
Real estate—continued
Otherreal
estateactivities
Finance and insurance—continued
Funds,trusts,
and otherfinancialvehicles
Otherfinance and insurance
Lessors ofminiwarehousesand self-storage
units
TotalTotal
Lessors ofresidential
buildings and dwellings and cooperative
housing
Lessors ofnonresidential
buildings(except
miniwarehouses)
Educationalservices
Professional,scientific, and
technicalservices
Managementof companies
(holdingcompanies)
Administrativeand support and waste
managementand remediation
services
Lessors ofother real
estateproperty
Rental and leasing services and lessors of nonfinancial
intangible assets (except
copyrightedworks)

163
Partnerships, Tax Year 2014
Fall 2016Statistics of Income Bulletin
(29) (30) (31) (32) (33)
Number of LLCs 65,526 54,263 105,732 63,784 0 Number of partners 257,485 173,657 399,606 153,789 0 Total assets 123,242,356 85,679,422 198,518,657 19,622,966 0 Total income 193,835,494 54,751,140 157,470,077 26,657,179 0 Total deductions 172,577,212 54,515,985 156,455,607 25,824,426 0 Ordinary business income (loss) 21,258,282 235,154 1,014,470 832,752 0 Portfolio income (loss) distributed directly to partners 1,798,276 801,486 506,019 163,629 0 Interest income 324,007 185,348 168,339 11,094 0 Dividend income 13,843 25,203 82,680 * 4,999 0 Royalties * 50,264 184,787 153,699 5 0 Net short-term capital gain (loss) 67,361 20,638 6,532 * 360 0 Net long-term capital gain (loss) 1,342,802 385,510 94,768 * 147,171 0 Net rental real estate income (loss) 77,102 40,360 21,080 1,217 0 Other net rental income (loss) 73,427 48,252 * 102,978 * 10,721 0 Total net income (loss) [1] 21,796,924 719,105 1,543,247 860,788 0
[All figures are estimates based on samples—money amounts are in thousands of dollars]
Health care and social assistance
Arts,entertainment,and recreation
Accommodationand food services
Otherservices
Nature of business not allocable
* Estimate should be used with caution because of the small number of sample returns on which it is based.[1] Total net income (loss) is the sum of ordinary business income (loss), interest income, dividend income, royalties, net rental real estate income (loss), and other net rental income (loss). For more information, see Explanation of Selected Terms for total net income (loss) at end of article text.NOTE: Detail may not add to totals because of rounding.SOURCE: IRS, Statistics of Income Division, Partnerships, April 2016.
Table 6. Domestic Limited Liability Companies: Selected Items for Selected Industrial Groups, Tax Year 2014—Continued
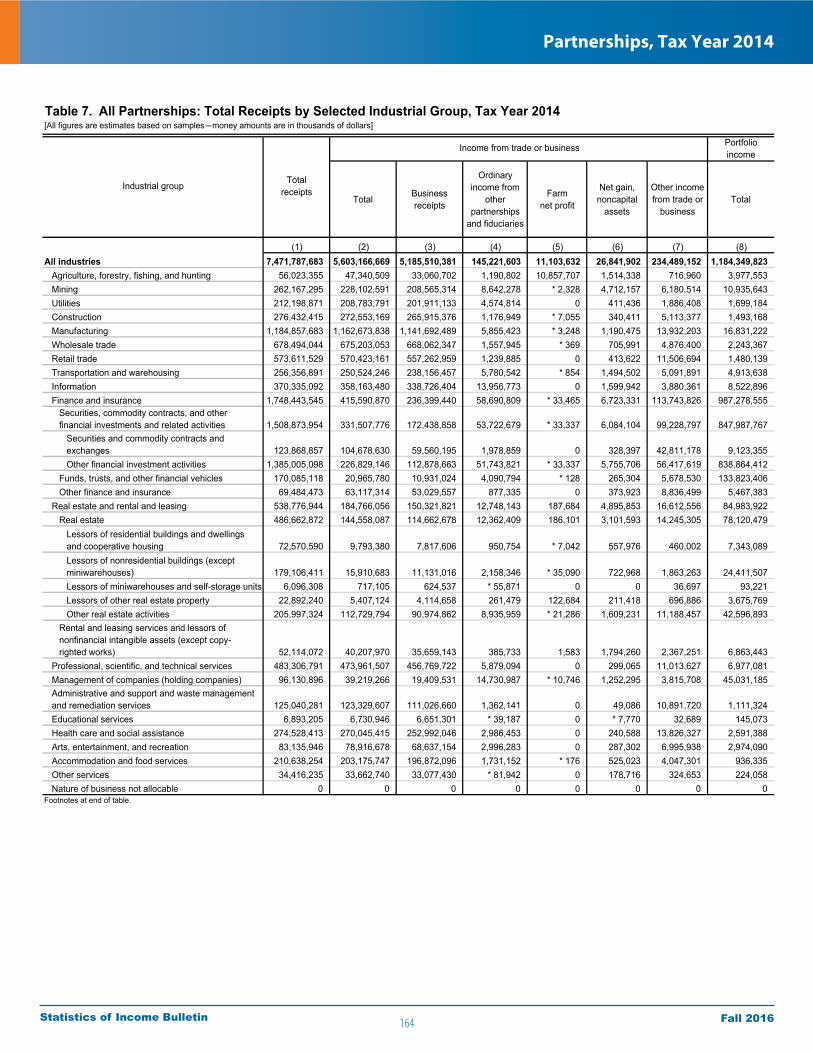
164
Partnerships, Tax Year 2014
Fall 2016Statistics of Income Bulletin
[All figures are estimates based on samples—money amounts are in thousands of dollars]
Portfolioincome
Total Businessreceipts
Ordinaryincome from
otherpartnerships
and fiduciaries
Farmnet profit
Net gain, noncapital
assets
Other income from trade or
businessTotal
(1) (2) (3) (4) (5) (6) (7) (8)All industries 7,471,787,683 5,603,166,669 5,185,510,381 145,221,603 11,103,632 26,841,902 234,489,152 1,184,349,823 Agriculture, forestry, fishing, and hunting 56,023,355 47,340,509 33,060,702 1,190,802 10,857,707 1,514,338 716,960 3,977,553 Mining 262,167,295 228,102,591 208,565,314 8,642,278 * 2,328 4,712,157 6,180,514 10,935,643 Utilities 212,198,871 208,783,791 201,911,133 4,574,814 0 411,436 1,886,408 1,699,184 Construction 276,432,415 272,553,169 265,915,376 1,176,949 * 7,055 340,411 5,113,377 1,493,168 Manufacturing 1,184,857,683 1,162,673,838 1,141,692,489 5,855,423 * 3,248 1,190,475 13,932,203 16,831,222 Wholesale trade 678,494,044 675,203,053 668,062,347 1,557,945 * 369 705,991 4,876,400 2,243,367 Retail trade 573,611,529 570,423,161 557,262,959 1,239,885 0 413,622 11,506,694 1,480,139 Transportation and warehousing 256,356,891 250,524,246 238,156,457 5,780,542 * 854 1,494,502 5,091,891 4,913,638 Information 370,335,092 358,163,480 338,726,404 13,956,773 0 1,599,942 3,880,361 8,522,896 Finance and insurance 1,748,443,545 415,590,870 236,399,440 58,690,809 * 33,465 6,723,331 113,743,826 987,278,555 Securities, commodity contracts, and other financial investments and related activities 1,508,873,954 331,507,776 172,438,858 53,722,679 * 33,337 6,084,104 99,228,797 847,987,767 Securities and commodity contracts and exchanges 123,868,857 104,678,630 59,560,195 1,978,859 0 328,397 42,811,178 9,123,355 Other financial investment activities 1,385,005,098 226,829,146 112,878,663 51,743,821 * 33,337 5,755,706 56,417,619 838,864,412 Funds, trusts, and other financial vehicles 170,085,118 20,965,780 10,931,024 4,090,794 * 128 265,304 5,678,530 133,823,406 Other finance and insurance 69,484,473 63,117,314 53,029,557 877,335 0 373,923 8,836,499 5,467,383 Real estate and rental and leasing 538,776,944 184,766,056 150,321,821 12,748,143 187,684 4,895,853 16,612,556 84,983,922 Real estate 486,662,872 144,558,087 114,662,678 12,362,409 186,101 3,101,593 14,245,305 78,120,479 Lessors of residential buildings and dwellings and cooperative housing 72,570,590 9,793,380 7,817,606 950,754 * 7,042 557,976 460,002 7,343,089 Lessors of nonresidential buildings (except miniwarehouses) 179,106,411 15,910,683 11,131,016 2,158,346 * 35,090 722,968 1,863,263 24,411,507 Lessors of miniwarehouses and self-storage units 6,096,308 717,105 624,537 * 55,871 0 0 36,697 93,221 Lessors of other real estate property 22,892,240 5,407,124 4,114,658 261,479 122,684 211,418 696,886 3,675,769 Other real estate activities 205,997,324 112,729,794 90,974,862 8,935,959 * 21,286 1,609,231 11,188,457 42,596,893 Rental and leasing services and lessors of nonfinancial intangible assets (except copy- righted works) 52,114,072 40,207,970 35,659,143 385,733 1,583 1,794,260 2,367,251 6,863,443 Professional, scientific, and technical services 483,306,791 473,961,507 456,769,722 5,879,094 0 299,065 11,013,627 6,977,081 Management of companies (holding companies) 96,130,896 39,219,266 19,409,531 14,730,987 * 10,746 1,252,295 3,815,708 45,031,185 Administrative and support and waste management and remediation services 125,040,281 123,329,607 111,026,660 1,362,141 0 49,086 10,891,720 1,111,324 Educational services 6,893,205 6,730,946 6,651,301 * 39,187 0 * 7,770 32,689 145,073 Health care and social assistance 274,528,413 270,045,415 252,992,046 2,986,453 0 240,588 13,826,327 2,591,388 Arts, entertainment, and recreation 83,135,946 78,916,678 68,637,154 2,996,283 0 287,302 6,995,938 2,974,090 Accommodation and food services 210,638,254 203,175,747 196,872,096 1,731,152 * 176 525,023 4,047,301 936,335 Other services 34,416,235 33,662,740 33,077,430 * 81,942 0 178,716 324,653 224,058 Nature of business not allocable 0 0 0 0 0 0 0 0 Footnotes at end of table.
Table 7. All Partnerships: Total Receipts by Selected Industrial Group, Tax Year 2014
Income from trade or business
Industrial group Totalreceipts

165
Partnerships, Tax Year 2014
Fall 2016Statistics of Income Bulletin
[All figures are estimates based on samples—money amounts are in thousands of dollars]
Interestincome
Dividendincome Royalties
Net short-term capital
gain
Net long-term capital gain
(9) (10) (11) (12) (13) (14) (15) (16) (17)All industries 153,825,358 162,729,221 34,711,302 102,628,921 730,455,021 187,024,859 351,468,876 137,827,541 7,949,916 Agriculture, forestry, fishing, and hunting 668,556 490,272 1,626,442 27,006 1,165,277 4,026,667 103,955 470,011 104,660 Mining 783,216 600,393 6,109,318 36,477 3,406,238 14,687,511 8,263,808 67,356 110,387 Utilities 272,205 25,623 4,244 * 4,539 1,392,574 756,003 921,216 1,331 37,348 Construction 394,573 202,576 475 171,575 723,968 421,283 1,709,720 219,961 35,114 Manufacturing 3,818,515 4,227,126 6,033,678 46,067 2,705,837 2,393,875 2,175,661 48,171 734,916 Wholesale trade 223,990 498,388 76,353 16,302 1,428,334 688,840 148,531 109,106 101,146 Retail trade 344,235 61,766 9,372 13,673 1,051,094 1,065,192 298,822 285,652 58,563 Transportation and warehousing 513,055 1,255,625 * 43,103 5,388 3,096,467 155,207 452,671 100,911 210,218 Information 3,510,976 526,863 1,454,684 393,751 2,636,621 1,681,268 1,471,377 37,330 458,740 Finance and insurance 122,837,187 134,147,777 9,611,667 92,582,255 628,099,669 27,256,954 313,775,485 3,284,327 1,257,353 Securities, commodity contracts, and other financial investments and related activities 103,230,519 106,489,497 9,052,021 82,904,311 546,311,420 24,817,178 300,868,616 2,574,650 1,117,968 Securities and commodity contracts and exchanges 2,165,903 1,478,147 102,510 1,548,837 3,827,957 337,541 9,634,699 60,781 33,850 Other financial investment activities 101,064,616 105,011,349 8,949,511 81,355,473 542,483,463 24,479,636 291,233,917 2,513,869 1,084,118 Funds, trusts, and other financial vehicles 16,539,547 27,049,520 559,641 9,538,460 80,136,238 2,160,037 12,405,648 592,532 137,715 Other finance and insurance 3,067,121 608,761 * 5 139,484 1,652,011 279,739 501,222 117,145 * 1,670 Real estate and rental and leasing 12,875,039 10,264,088 7,129,491 7,717,759 46,997,546 120,972,117 12,593,337 131,173,174 4,288,338 Real estate 12,067,635 10,131,084 1,927,585 7,709,621 46,284,555 120,634,288 11,636,175 130,814,136 899,706 Lessors of residential buildings and dwellings and cooperative housing 1,268,741 927,925 148,537 482,037 4,515,849 25,127,695 2,891,816 27,296,206 118,405 Lessors of nonresidential buildings (except miniwarehouses) 4,262,975 3,479,607 155,123 6,079,567 10,434,235 49,846,430 3,193,566 85,515,834 228,390 Lessors of miniwarehouses and self-storage units 33,556 * 2,995 * 41,640 * 1,703 * 13,327 * 1,990,348 * 4,056 3,237,439 * 54,138 Lessors of other real estate property 432,534 352,882 820,401 17,693 2,052,259 6,966,043 637,719 6,035,953 169,631 Other real estate activities 6,069,829 5,367,675 761,884 1,128,620 29,268,885 36,703,772 4,909,018 8,728,705 329,141 Rental and leasing services and lessors of nonfinancial intangible assets (except copy- righted works) 807,404 133,003 5,201,906 * 8,138 712,991 337,829 957,162 359,037 3,388,632 Professional, scientific, and technical services 1,025,107 432,268 1,029,280 127,556 4,362,870 1,410,184 563,378 305,629 89,011 Management of companies (holding companies) 5,086,787 9,635,049 934,107 1,367,490 28,007,753 3,540,280 7,261,494 923,776 154,895 Administrative and support and waste management and remediation services 318,712 67,269 124,013 2,915 598,416 217,969 307,506 47,518 26,358 Educational services 1,767 * 478 * 49,635 * 273 * 92,919 * 4,044 * 130 * 12,942 * 70 Health care and social assistance 529,016 16,134 * 55,026 69,046 1,922,166 1,297,362 189,498 295,405 109,346 Arts, entertainment, and recreation 313,775 87,674 232,409 33,594 2,306,638 619,736 469,225 102,341 53,875 Accommodation and food services 288,748 147,180 188,001 12,415 299,991 5,673,265 455,452 290,895 * 106,560 Other services 19,898 42,672 5 * 841 160,643 157,104 * 307,610 51,703 * 13,019 Nature of business not allocable 0 0 0 0 0 0 0 0 0
Table 7. All Partnerships: Total Receipts by Selected Industrial Group, Tax Year 2014—Continued
* Estimate should be used with caution because of the small number of sample returns on which it is based.NOTE: Detail may not add to totals because of rounding. For more information, see Explanation of Selected Terms for total receipts at the end of the article text. SOURCE: IRS, Statistics of Income Division, Partnerships, April 2016.
Otherrental net income
Net section 1231 gain
(loss)
Otherincome
Real estate rental net income
Industrial group
Portfolio income—continued
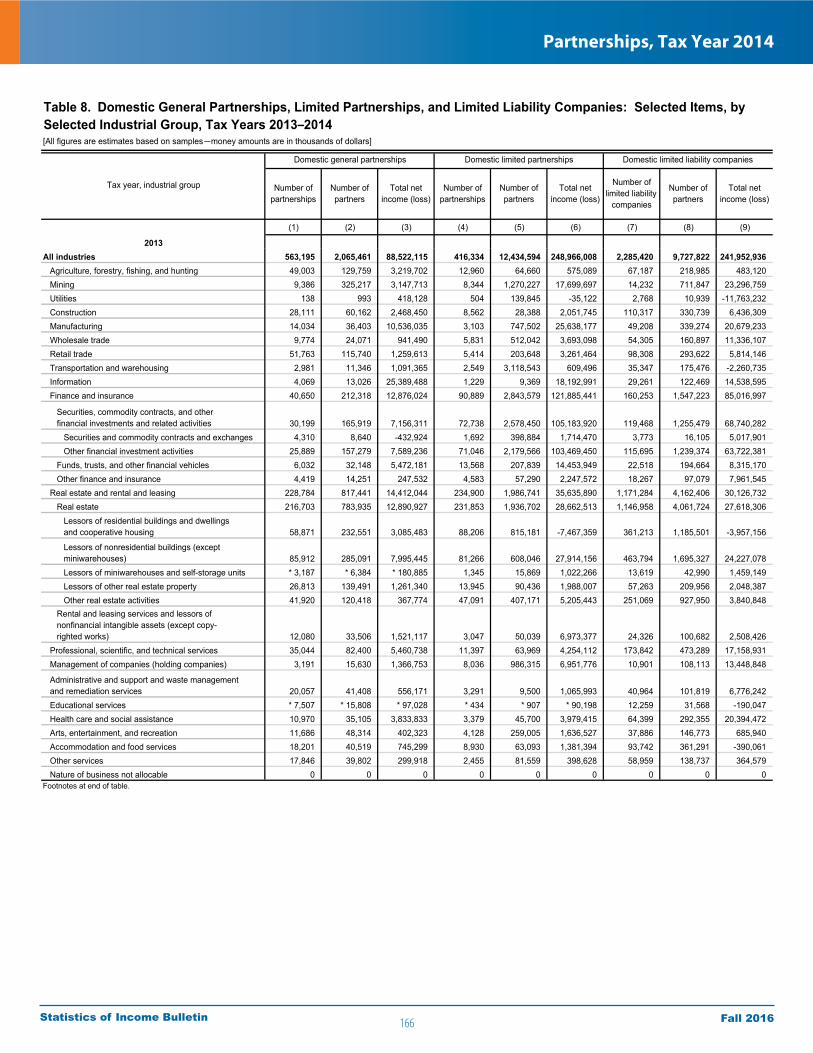
166
Partnerships, Tax Year 2014
Fall 2016Statistics of Income Bulletin
[All figures are estimates based on samples—money amounts are in thousands of dollars]
(1) (2) (3) (4) (5) (6) (7) (8) (9)
2013All industries 563,195 2,065,461 88,522,115 416,334 12,434,594 248,966,008 2,285,420 9,727,822 241,952,936 Agriculture, forestry, fishing, and hunting 49,003 129,759 3,219,702 12,960 64,660 575,089 67,187 218,985 483,120 Mining 9,386 325,217 3,147,713 8,344 1,270,227 17,699,697 14,232 711,847 23,296,759 Utilities 138 993 418,128 504 139,845 -35,122 2,768 10,939 -11,763,232 Construction 28,111 60,162 2,468,450 8,562 28,388 2,051,745 110,317 330,739 6,436,309 Manufacturing 14,034 36,403 10,536,035 3,103 747,502 25,638,177 49,208 339,274 20,679,233 Wholesale trade 9,774 24,071 941,490 5,831 512,042 3,693,098 54,305 160,897 11,336,107 Retail trade 51,763 115,740 1,259,613 5,414 203,648 3,261,464 98,308 293,622 5,814,146 Transportation and warehousing 2,981 11,346 1,091,365 2,549 3,118,543 609,496 35,347 175,476 -2,260,735 Information 4,069 13,026 25,389,488 1,229 9,369 18,192,991 29,261 122,469 14,538,595 Finance and insurance 40,650 212,318 12,876,024 90,889 2,843,579 121,885,441 160,253 1,547,223 85,016,997
Securities, commodity contracts, and other financial investments and related activities 30,199 165,919 7,156,311 72,738 2,578,450 105,183,920 119,468 1,255,479 68,740,282 Securities and commodity contracts and exchanges 4,310 8,640 -432,924 1,692 398,884 1,714,470 3,773 16,105 5,017,901 Other financial investment activities 25,889 157,279 7,589,236 71,046 2,179,566 103,469,450 115,695 1,239,374 63,722,381 Funds, trusts, and other financial vehicles 6,032 32,148 5,472,181 13,568 207,839 14,453,949 22,518 194,664 8,315,170 Other finance and insurance 4,419 14,251 247,532 4,583 57,290 2,247,572 18,267 97,079 7,961,545 Real estate and rental and leasing 228,784 817,441 14,412,044 234,900 1,986,741 35,635,890 1,171,284 4,162,406 30,126,732 Real estate 216,703 783,935 12,890,927 231,853 1,936,702 28,662,513 1,146,958 4,061,724 27,618,306 Lessors of residential buildings and dwellings and cooperative housing 58,871 232,551 3,085,483 88,206 815,181 -7,467,359 361,213 1,185,501 -3,957,156
Lessors of nonresidential buildings (except miniwarehouses) 85,912 285,091 7,995,445 81,266 608,046 27,914,156 463,794 1,695,327 24,227,078 Lessors of miniwarehouses and self-storage units * 3,187 * 6,384 * 180,885 1,345 15,869 1,022,266 13,619 42,990 1,459,149 Lessors of other real estate property 26,813 139,491 1,261,340 13,945 90,436 1,988,007 57,263 209,956 2,048,387 Other real estate activities 41,920 120,418 367,774 47,091 407,171 5,205,443 251,069 927,950 3,840,848 Rental and leasing services and lessors of nonfinancial intangible assets (except copy- righted works) 12,080 33,506 1,521,117 3,047 50,039 6,973,377 24,326 100,682 2,508,426 Professional, scientific, and technical services 35,044 82,400 5,460,738 11,397 63,969 4,254,112 173,842 473,289 17,158,931 Management of companies (holding companies) 3,191 15,630 1,366,753 8,036 986,315 6,951,776 10,901 108,113 13,448,848
Administrative and support and waste management and remediation services 20,057 41,408 556,171 3,291 9,500 1,065,993 40,964 101,819 6,776,242 Educational services * 7,507 * 15,808 * 97,028 * 434 * 907 * 90,198 12,259 31,568 -190,047 Health care and social assistance 10,970 35,105 3,833,833 3,379 45,700 3,979,415 64,399 292,355 20,394,472 Arts, entertainment, and recreation 11,686 48,314 402,323 4,128 259,005 1,636,527 37,886 146,773 685,940 Accommodation and food services 18,201 40,519 745,299 8,930 63,093 1,381,394 93,742 361,291 -390,061 Other services 17,846 39,802 299,918 2,455 81,559 398,628 58,959 138,737 364,579 Nature of business not allocable 0 0 0 0 0 0 0 0 0 Footnotes at end of table.
Number of limited liability
companies
Table 8. Domestic General Partnerships, Limited Partnerships, and Limited Liability Companies: Selected Items, by Selected Industrial Group, Tax Years 2013–2014
Domestic general partnerships Domestic limited partnerships Domestic limited liability companies
Tax year, industrial group Number of partnerships
Number of partners
Total net income (loss)
Number of partners
Total net income (loss)
Number of partnerships
Number of partners
Total net income (loss)

167
Partnerships, Tax Year 2014
Fall 2016Statistics of Income Bulletin
[All figures are estimates based on samples—money amounts are in thousands of dollars]
(1) (2) (3) (4) (5) (6) (7) (8) (9)
2014All industries 574,181 2,464,161 89,724,881 414,338 12,250,817 270,014,935 2,432,303 10,202,627 277,939,910 Agriculture, forestry, fishing, and hunting 51,368 133,348 4,444,494 13,453 59,866 651,086 72,077 238,319 2,713,329 Mining 10,777 342,390 4,296,767 7,426 1,544,180 19,865,871 12,051 634,903 25,127,447 Utilities 77 486 562,262 534 146,352 -395,127 4,377 16,537 -5,031,692 Construction 18,985 41,631 1,949,977 7,536 24,330 2,455,019 109,611 332,358 8,107,580 Manufacturing 14,332 45,252 9,360,737 5,839 469,935 23,894,753 44,640 308,415 23,243,761 Wholesale trade 9,519 339,220 1,549,762 6,650 283,995 3,663,027 61,772 181,996 12,647,642 Retail trade 51,719 118,217 1,278,453 4,931 208,801 3,270,628 103,781 315,263 6,721,401 Transportation and warehousing 7,163 16,007 1,186,066 3,269 2,917,797 5,013,808 35,057 115,338 -2,763,457 Information 7,638 20,875 25,151,913 1,134 5,915 15,778,518 33,231 146,461 14,174,708 Finance and insurance 39,408 250,148 14,846,507 85,776 3,101,827 138,088,766 178,777 1,658,253 92,996,946
Securities, commodity contracts, and other financial investments and related activities 29,714 206,232 8,196,997 67,483 2,729,805 120,095,549 131,953 1,310,692 75,812,437 Securities and commodity contracts and exchanges 3,554 7,190 -819,997 1,071 344,172 2,580,691 5,600 23,163 7,867,086 Other financial investment activities 26,160 199,042 9,016,994 66,412 2,385,633 117,514,858 126,352 1,287,529 67,945,351 Funds, trusts, and other financial vehicles 4,945 29,131 5,875,790 13,675 337,818 15,719,332 21,831 227,309 7,793,980 Other finance and insurance 4,749 14,785 773,720 4,618 34,204 2,273,885 24,994 120,251 9,390,529 Real estate and rental and leasing 239,045 851,746 13,481,111 234,792 1,894,284 37,984,786 1,269,183 4,534,967 38,095,073 Real estate 229,859 827,494 12,282,400 232,308 1,844,750 29,382,019 1,249,047 4,439,736 35,157,544
Lessors of residential buildings and dwellings and cooperative housing 77,280 249,287 2,750,915 95,301 795,059 -5,692,525 406,282 1,350,487 -2,700,958
Lessors of nonresidential buildings (except miniwarehouses) 94,484 328,898 7,505,506 82,874 579,136 26,852,233 527,065 1,886,331 26,536,724 Lessors of miniwarehouses and self-storage units * 3,338 * 6,735 * 251,688 1,307 18,146 1,277,461 13,622 43,133 1,734,188 Lessors of other real estate property 29,285 137,119 1,352,604 13,453 83,235 1,754,144 59,801 216,977 2,911,292 Other real estate activities 25,472 105,455 421,686 39,373 369,174 5,190,706 242,277 942,807 6,676,299 Rental and leasing services and lessors of nonfinancial intangible assets (except copy- righted works) 9,187 24,252 1,198,711 2,485 49,533 8,602,767 20,136 95,232 2,937,529 Professional, scientific, and technical services 26,925 61,776 4,702,405 13,210 66,483 4,365,148 146,315 482,691 19,501,404 Management of companies (holding companies) 3,720 11,130 999,281 7,008 1,078,900 6,743,038 18,437 109,731 13,279,654
Administrative and support and waste management and remediation services 19,724 40,789 816,362 3,192 12,816 1,399,265 41,307 107,917 4,440,121 Educational services 13,023 27,192 77,941 * 1,088 * 2,619 * 83,697 12,383 34,942 -234,072 Health care and social assistance 9,926 33,900 3,566,541 3,319 50,003 3,478,250 65,526 257,485 21,796,924 Arts, entertainment, and recreation 12,518 44,060 498,035 3,734 238,134 1,455,551 54,263 173,657 719,105 Accommodation and food services 23,037 54,056 714,687 7,450 56,590 1,710,620 105,732 399,606 1,543,247 Other services 15,278 31,939 241,580 3,998 87,987 508,228 63,784 153,789 860,788 Nature of business not allocable 0 0 0 0 0 0 0 0 0
Tax year, industrial grouping
Domestic general partnerships Domestic limited partnerships Domestic limited liability companies
* Estimate should be used with caution because of the small number of sample returns on which it is based.NOTES: Detail may not add to totals because of rounding. The sum of the number of partnerships for all three categories does not sum to the total number of partnerships in other tables and figures because companies classified as limited liability partnerships (LLPs), foreign partnerships, "other," or "nonresponse" were not included in this table due to the small number of returns. For 2014 there were 140,016 "LLPs," 17,201 "foreign," 8,725 "Other," and 24,490 "nonresponse."SOURCE: IRS, Statistics of Income Division, Partnerships, April 2016.
Table 8. Domestic General Partnerships, Limited Partnerships, and Limited Liability Companies: Selected Items, by Selected Industrial Group, Tax Years 2013–2014—Continued
Number of partnerships
Number of partners
Total net income (loss)
Number of partnerships
Number of partners
Total net income (loss)
Number of limited liability
companies
Number of partners
Total net income (loss)

168
Partnerships, Tax Year 2014
Fall 2016Statistics of Income Bulletin
Table 9a. Numbers of Partnerships, by Type of Entity and Profit Status, Tax Years 2005–2014[Numbers of partnerships are in thousands]
(1) (2) (3) (4) (5) (6) (7) (8) (9) (10) (11) (12) (13)
2005 2,764 486 243 255 159 746 719 60 40 4 1 29 21 2006 2,947 465 253 264 169 793 837 67 42 4 3 30 20 2007 3,096 450 244 252 174 873 946 60 50 6 2 17 23 2008 3,146 413 257 241 171 869 1,029 68 54 7 4 11 22 2009 3,169 390 234 221 176 912 1,057 60 58 7 5 18 30 2010 3,248 339 251 209 166 980 1,110 82 60 8 5 16 22 2011 3,285 341 245 235 159 1,045 1,066 87 61 7 7 10 22 2012 3,389 350 233 253 154 1,162 1,050 85 44 7 9 12 31 2013 3,461 366 197 263 153 1,199 1,087 80 54 12 3 25 23 2014 3,613 351 224 247 167 1,307 1,126 81 59 10 7 23 11
Netincome Loss
Domestic limited liability companies
Domesticlimited liability partnerships
Netincome
[1] Other partnerships are those which checked the "other" box, Form 1065, Schedule B, line 1, Type of Entity, or did not check a box.NOTES: Detail may not add to totals because of rounding. Domestic limited liability companies, domestic limited liability partnerships, and foreign partnerships are discussed in the Explanation of Selected Terms section. Net income or loss refers to "total net income or loss." Breakeven returns are included in the "loss" columns.SOURCE: IRS, Statistics of Income Division, Partnerships, April 2016.
Netincome Loss Net
income Loss
Taxyear
Totalnumber of
partnerships
Domestic general partnerships
Domestic limited partnerships
Netincome Loss Net
income Loss
Foreignpartnerships Other [1]
Loss
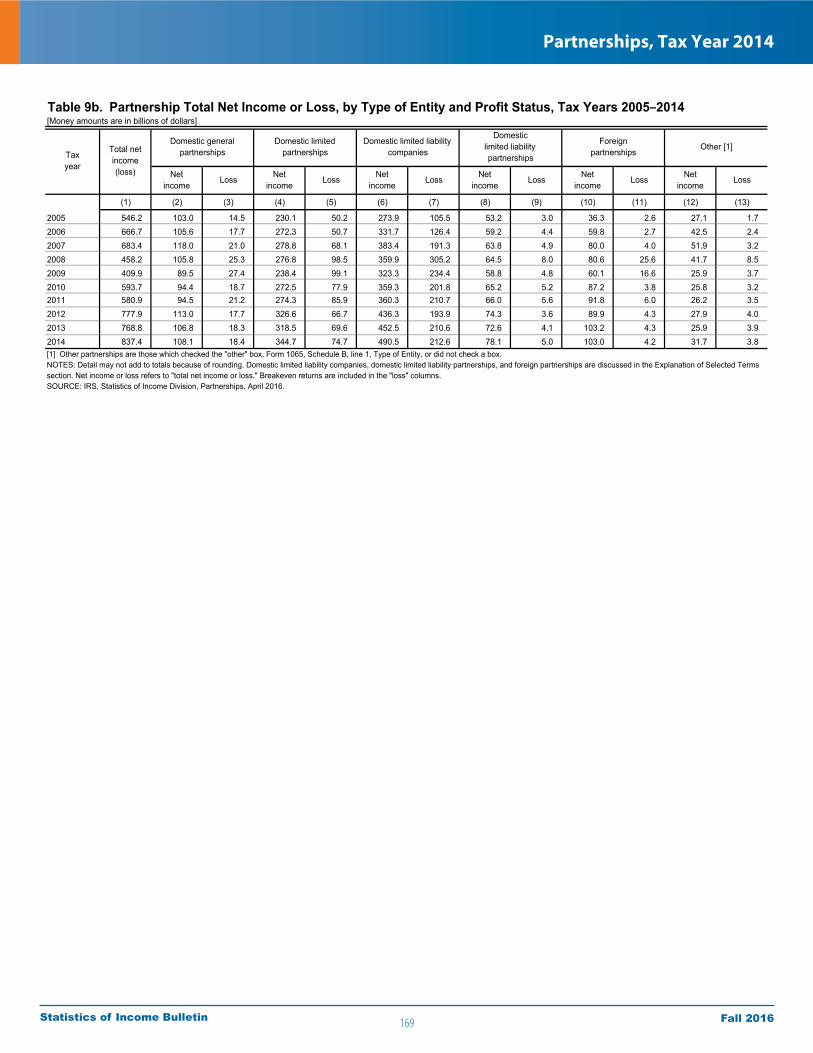
169
Partnerships, Tax Year 2014
Fall 2016Statistics of Income Bulletin
Table 9b. Partnership Total Net Income or Loss, by Type of Entity and Profit Status, Tax Years 2005–2014[Money amounts are in billions of dollars]
(1) (2) (3) (4) (5) (6) (7) (8) (9) (10) (11) (12) (13)
2005 546.2 103.0 14.5 230.1 50.2 273.9 105.5 53.2 3.0 36.3 2.6 27.1 1.7 2006 666.7 105.6 17.7 272.3 50.7 331.7 126.4 59.2 4.4 59.8 2.7 42.5 2.4 2007 683.4 118.0 21.0 278.8 68.1 383.4 191.3 63.8 4.9 80.0 4.0 51.9 3.2 2008 458.2 105.8 25.3 276.8 98.5 359.9 305.2 64.5 8.0 80.6 25.6 41.7 8.5 2009 409.9 89.5 27.4 238.4 99.1 323.3 234.4 58.8 4.8 60.1 16.6 25.9 3.7 2010 593.7 94.4 18.7 272.5 77.9 359.3 201.8 65.2 5.2 87.2 3.8 25.8 3.2 2011 580.9 94.5 21.2 274.3 85.9 360.3 210.7 66.0 5.6 91.8 6.0 26.2 3.5 2012 777.9 113.0 17.7 326.6 66.7 436.3 193.9 74.3 3.6 89.9 4.3 27.9 4.0 2013 768.8 106.8 18.3 318.5 69.6 452.5 210.6 72.6 4.1 103.2 4.3 25.9 3.9 2014 837.4 108.1 18.4 344.7 74.7 490.5 212.6 78.1 5.0 103.0 4.2 31.7 3.8
Netincome
Loss
Domestic limited liability companies
Domesticlimited liability partnerships
Netincome
[1] Other partnerships are those which checked the "other" box, Form 1065, Schedule B, line 1, Type of Entity, or did not check a box.NOTES: Detail may not add to totals because of rounding. Domestic limited liability companies, domestic limited liability partnerships, and foreign partnerships are discussed in the Explanation of Selected Terms section. Net income or loss refers to "total net income or loss." Breakeven returns are included in the "loss" columns.SOURCE: IRS, Statistics of Income Division, Partnerships, April 2016.
Netincome
Loss Netincome
Loss
Taxyear
Total net income(loss)
Domestic general partnerships
Domestic limited partnerships
Netincome
Loss Netincome
Loss
Foreignpartnerships
Other [1]
Loss

170
Partnerships, Tax Year 2014
Fall 2016Statistics of Income Bulletin
Table 9c. Numbers of Partners, by Type of Entity and Profit Status, Tax Years 2005–2014[Numbers of partners are in thousands]
(1) (2) (3) (4) (5) (6) (7) (8) (9) (10) (11) (12) (13)
2005 16,212 1,785 888 4,943 2,004 2,961 2,680 299 166 117 65 205 100 2006 16,728 1,723 943 5,054 1,685 3,157 3,205 350 138 110 71 231 61 2007 18,516 1,674 866 5,881 1,636 3,643 3,442 316 172 163 133 530 60 2008 19,300 1,706 917 4,997 2,058 3,671 3,853 333 205 392 145 854 169 2009 21,142 1,509 717 4,651 3,363 4,110 4,126 302 179 309 139 1,646 92 2010 22,428 1,400 775 5,730 3,132 4,394 4,008 357 185 292 327 1,749 80 2011 24,390 1,198 693 5,668 4,394 4,725 3,978 375 214 392 448 2,204 101 2012 25,334 1,500 686 6,804 3,949 5,283 3,955 383 138 440 112 1,952 129 2013 27,491 1,388 677 7,737 4,697 5,455 4,272 492 158 611 140 1,780 83 2014 27,714 1,631 833 8,301 3,949 5,942 4,261 478 186 565 133 1,382 54
Netincome
Loss
Domestic limited liability companies
Domesticlimited liability partnerships
Netincome
[1] Other partnerships are those which checked the "other" box, Form 1065, Schedule B, line 1, Type of Entity, or did not check a box.NOTES: Detail may not add to totals because of rounding. Domestic limited liability companies, domestic limited liability partnerships, and foreign partnerships are discussed in the Explanation of Selected Terms section. Net income or loss refers to "total net income or loss." Breakeven returns are included in the "loss" columns.SOURCE: IRS, Statistics of Income Division, Partnerships, April 2016.
Netincome
Loss Netincome
Loss
Taxyear
Totalnumber of partners
Domestic general partnerships
Domestic limited partnerships
Netincome
Loss Netincome
Loss
Foreignpartnerships Other [1]
Loss
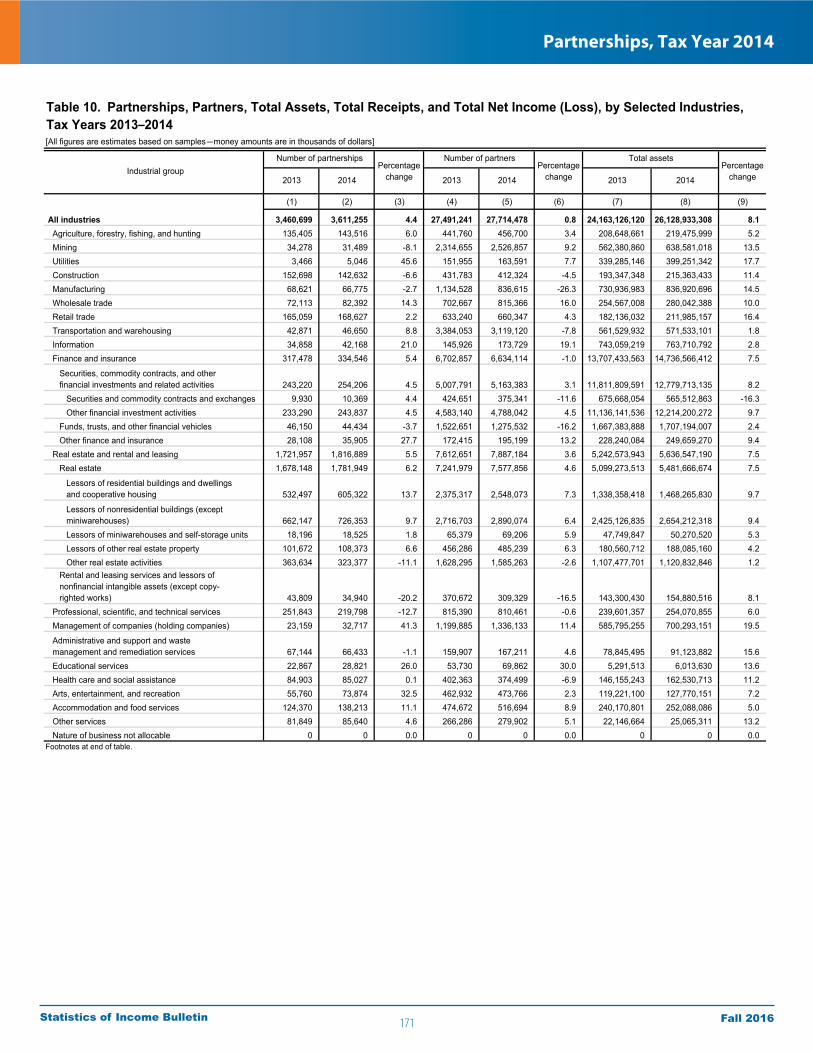
171
Partnerships, Tax Year 2014
Fall 2016Statistics of Income Bulletin
[All figures are estimates based on samples—money amounts are in thousands of dollars]
(1) (2) (3) (4) (5) (6) (7) (8) (9)
All industries 3,460,699 3,611,255 4.4 27,491,241 27,714,478 0.8 24,163,126,120 26,128,933,308 8.1 Agriculture, forestry, fishing, and hunting 135,405 143,516 6.0 441,760 456,700 3.4 208,648,661 219,475,999 5.2 Mining 34,278 31,489 -8.1 2,314,655 2,526,857 9.2 562,380,860 638,581,018 13.5 Utilities 3,466 5,046 45.6 151,955 163,591 7.7 339,285,146 399,251,342 17.7 Construction 152,698 142,632 -6.6 431,783 412,324 -4.5 193,347,348 215,363,433 11.4 Manufacturing 68,621 66,775 -2.7 1,134,528 836,615 -26.3 730,936,983 836,920,696 14.5 Wholesale trade 72,113 82,392 14.3 702,667 815,366 16.0 254,567,008 280,042,388 10.0 Retail trade 165,059 168,627 2.2 633,240 660,347 4.3 182,136,032 211,985,157 16.4 Transportation and warehousing 42,871 46,650 8.8 3,384,053 3,119,120 -7.8 561,529,932 571,533,101 1.8 Information 34,858 42,168 21.0 145,926 173,729 19.1 743,059,219 763,710,792 2.8 Finance and insurance 317,478 334,546 5.4 6,702,857 6,634,114 -1.0 13,707,433,563 14,736,566,412 7.5
Securities, commodity contracts, and other financial investments and related activities 243,220 254,206 4.5 5,007,791 5,163,383 3.1 11,811,809,591 12,779,713,135 8.2 Securities and commodity contracts and exchanges 9,930 10,369 4.4 424,651 375,341 -11.6 675,668,054 565,512,863 -16.3 Other financial investment activities 233,290 243,837 4.5 4,583,140 4,788,042 4.5 11,136,141,536 12,214,200,272 9.7 Funds, trusts, and other financial vehicles 46,150 44,434 -3.7 1,522,651 1,275,532 -16.2 1,667,383,888 1,707,194,007 2.4 Other finance and insurance 28,108 35,905 27.7 172,415 195,199 13.2 228,240,084 249,659,270 9.4 Real estate and rental and leasing 1,721,957 1,816,889 5.5 7,612,651 7,887,184 3.6 5,242,573,943 5,636,547,190 7.5 Real estate 1,678,148 1,781,949 6.2 7,241,979 7,577,856 4.6 5,099,273,513 5,481,666,674 7.5
Lessors of residential buildings and dwellings and cooperative housing 532,497 605,322 13.7 2,375,317 2,548,073 7.3 1,338,358,418 1,468,265,830 9.7
Lessors of nonresidential buildings (except miniwarehouses) 662,147 726,353 9.7 2,716,703 2,890,074 6.4 2,425,126,835 2,654,212,318 9.4 Lessors of miniwarehouses and self-storage units 18,196 18,525 1.8 65,379 69,206 5.9 47,749,847 50,270,520 5.3 Lessors of other real estate property 101,672 108,373 6.6 456,286 485,239 6.3 180,560,712 188,085,160 4.2 Other real estate activities 363,634 323,377 -11.1 1,628,295 1,585,263 -2.6 1,107,477,701 1,120,832,846 1.2 Rental and leasing services and lessors of nonfinancial intangible assets (except copy- righted works) 43,809 34,940 -20.2 370,672 309,329 -16.5 143,300,430 154,880,516 8.1 Professional, scientific, and technical services 251,843 219,798 -12.7 815,390 810,461 -0.6 239,601,357 254,070,855 6.0 Management of companies (holding companies) 23,159 32,717 41.3 1,199,885 1,336,133 11.4 585,795,255 700,293,151 19.5
Administrative and support and waste management and remediation services 67,144 66,433 -1.1 159,907 167,211 4.6 78,845,495 91,123,882 15.6 Educational services 22,867 28,821 26.0 53,730 69,862 30.0 5,291,513 6,013,630 13.6 Health care and social assistance 84,903 85,027 0.1 402,363 374,499 -6.9 146,155,243 162,530,713 11.2 Arts, entertainment, and recreation 55,760 73,874 32.5 462,932 473,766 2.3 119,221,100 127,770,151 7.2 Accommodation and food services 124,370 138,213 11.1 474,672 516,694 8.9 240,170,801 252,088,086 5.0 Other services 81,849 85,640 4.6 266,286 279,902 5.1 22,146,664 25,065,311 13.2 Nature of business not allocable 0 0 0.0 0 0 0.0 0 0 0.0 Footnotes at end of table.
20142014 2013 2014 2013
Percentagechange
Table 10. Partnerships, Partners, Total Assets, Total Receipts, and Total Net Income (Loss), by Selected Industries, Tax Years 2013–2014
Industrial groupNumber of partnerships
Percentagechange
Number of partnersPercentage
change
Total assets
2013
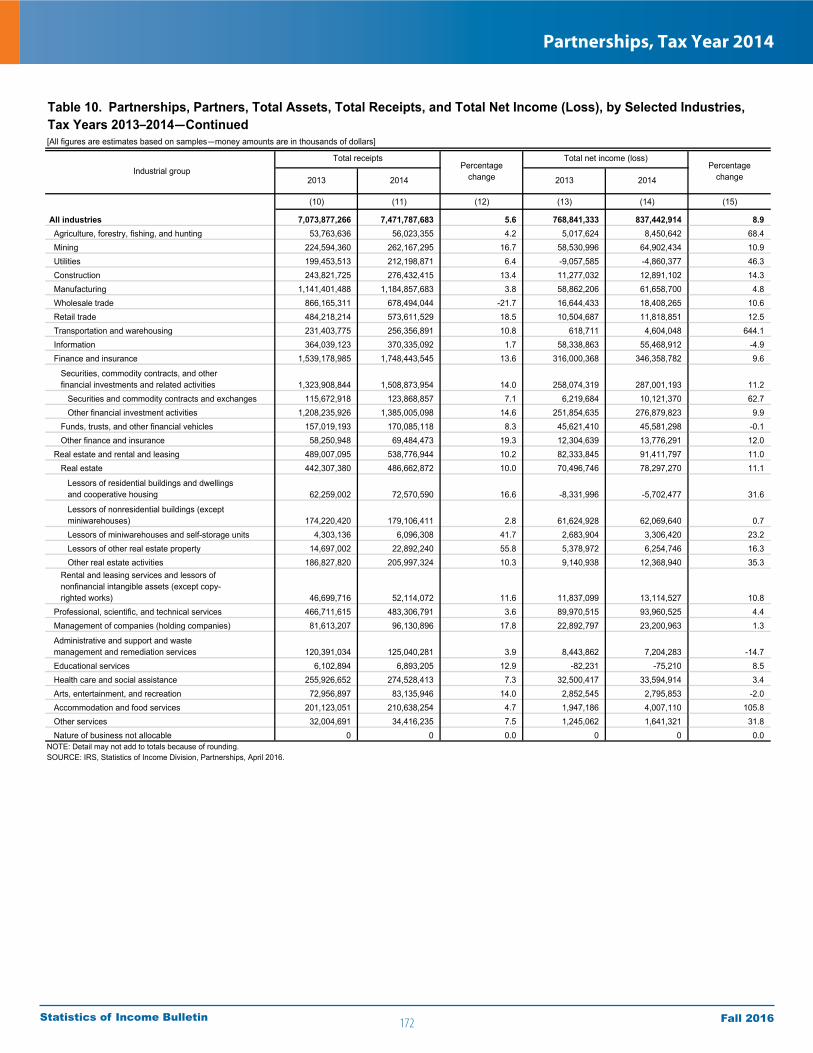
172
Partnerships, Tax Year 2014
Fall 2016Statistics of Income Bulletin
[All figures are estimates based on samples—money amounts are in thousands of dollars]
(10) (11) (12) (13) (14) (15)
All industries 7,073,877,266 7,471,787,683 5.6 768,841,333 837,442,914 8.9 Agriculture, forestry, fishing, and hunting 53,763,636 56,023,355 4.2 5,017,624 8,450,642 68.4 Mining 224,594,360 262,167,295 16.7 58,530,996 64,902,434 10.9 Utilities 199,453,513 212,198,871 6.4 -9,057,585 -4,860,377 46.3 Construction 243,821,725 276,432,415 13.4 11,277,032 12,891,102 14.3 Manufacturing 1,141,401,488 1,184,857,683 3.8 58,862,206 61,658,700 4.8 Wholesale trade 866,165,311 678,494,044 -21.7 16,644,433 18,408,265 10.6 Retail trade 484,218,214 573,611,529 18.5 10,504,687 11,818,851 12.5 Transportation and warehousing 231,403,775 256,356,891 10.8 618,711 4,604,048 644.1 Information 364,039,123 370,335,092 1.7 58,338,863 55,468,912 -4.9 Finance and insurance 1,539,178,985 1,748,443,545 13.6 316,000,368 346,358,782 9.6
Securities, commodity contracts, and other financial investments and related activities 1,323,908,844 1,508,873,954 14.0 258,074,319 287,001,193 11.2 Securities and commodity contracts and exchanges 115,672,918 123,868,857 7.1 6,219,684 10,121,370 62.7 Other financial investment activities 1,208,235,926 1,385,005,098 14.6 251,854,635 276,879,823 9.9 Funds, trusts, and other financial vehicles 157,019,193 170,085,118 8.3 45,621,410 45,581,298 -0.1 Other finance and insurance 58,250,948 69,484,473 19.3 12,304,639 13,776,291 12.0 Real estate and rental and leasing 489,007,095 538,776,944 10.2 82,333,845 91,411,797 11.0 Real estate 442,307,380 486,662,872 10.0 70,496,746 78,297,270 11.1
Lessors of residential buildings and dwellings and cooperative housing 62,259,002 72,570,590 16.6 -8,331,996 -5,702,477 31.6
Lessors of nonresidential buildings (except miniwarehouses) 174,220,420 179,106,411 2.8 61,624,928 62,069,640 0.7 Lessors of miniwarehouses and self-storage units 4,303,136 6,096,308 41.7 2,683,904 3,306,420 23.2 Lessors of other real estate property 14,697,002 22,892,240 55.8 5,378,972 6,254,746 16.3 Other real estate activities 186,827,820 205,997,324 10.3 9,140,938 12,368,940 35.3 Rental and leasing services and lessors of nonfinancial intangible assets (except copy- righted works) 46,699,716 52,114,072 11.6 11,837,099 13,114,527 10.8 Professional, scientific, and technical services 466,711,615 483,306,791 3.6 89,970,515 93,960,525 4.4 Management of companies (holding companies) 81,613,207 96,130,896 17.8 22,892,797 23,200,963 1.3
Administrative and support and waste management and remediation services 120,391,034 125,040,281 3.9 8,443,862 7,204,283 -14.7 Educational services 6,102,894 6,893,205 12.9 -82,231 -75,210 8.5 Health care and social assistance 255,926,652 274,528,413 7.3 32,500,417 33,594,914 3.4 Arts, entertainment, and recreation 72,956,897 83,135,946 14.0 2,852,545 2,795,853 -2.0 Accommodation and food services 201,123,051 210,638,254 4.7 1,947,186 4,007,110 105.8 Other services 32,004,691 34,416,235 7.5 1,245,062 1,641,321 31.8 Nature of business not allocable 0 0 0.0 0 0 0.0
2013 2014 2013
NOTE: Detail may not add to totals because of rounding.SOURCE: IRS, Statistics of Income Division, Partnerships, April 2016.
Table 10. Partnerships, Partners, Total Assets, Total Receipts, and Total Net Income (Loss), by Selected Industries,Tax Years 2013–2014—Continued
Industrial group2014
Total receiptsPercentage
change
Total net income (loss)Percentage
change
w w w . i r s . g o v / t a x s t a t sStatistics of Income Bulletin | Fall 2016
Transactions Between Large Foreign-Owned Domestic Corporations and Related Foreign Persons, Tax Year 2010
T his study covers transactions between reporting corpora-tions and related foreign persons. A reporting corporation is defined as either a domestic corporation that is 25-per-
cent-or-more owned by a single foreign person or a foreign cor-poration engaged in a U.S. trade or business (i.e., a U.S. branch of a foreign corporation). More than 95 percent of the reporting corporations included in this study are companies incorporated in the United States. These corporations must report transac-tions made with each related foreign party during the taxable year.1 Related foreign persons include any direct or indirect 25-percent foreign shareholder as well as any foreign person related to either the reporting corporation or a 25-percent for-eign shareholder as defined by the Internal Revenue Code.2 The transactions are reported on Form 5472, Information Return of a 25-Percent Foreign-Owned U.S. Corporation or a Foreign Corporation Engaged in a U.S. Trade or Business. A consoli-dated corporate tax return can and frequently does include mul-tiple Forms 5472, ranging from 1 to 1,252 for 2010. Data in this study are not published by individual reporting corporations but instead are published by the corporation on whose Form 1120 tax return the Form 5472 was filed (Table 1), by the country of the related foreign person (Table 2), or both (Table 3).
Statistics of Income has conducted this study annually be-ginning in 1988, then biennially since 1994.3,4 For inclusion in this study a corporation must report $500 million or more in total receipts and have filed a Form 5472. For 2010 a domestic corporation was required to file a Form 5472 if it was at least 25 percent foreign-owned and engaged in transactions with at least one foreign related party. The Internal Revenue Code sub-jects each reporting corporation to a fine of $10,000 for each related party failing to file all reportable transactions on the Form 5472.5
Congress, concerned that related party transactions could be manipulated to avoid U.S. taxation, added reporting require-ments to corporations so that they provide the Internal Revenue Service with more information about the nature and amount of these transactions. This led the IRS to publish and distribute Form 5472, which was attached to tax returns, starting in 1984.6
Highlights • The total value of nonloan transactions between large foreign-
owned domestic corporations (see “Explanation of Selected Terms”) and related foreign parties amounted to $1.208 trillion for Tax Year 2010, a 1.8-percent increase from the 2008 study’s $1.187 trillion. This represents the second-highest total since the incep-tion of the study, trailing only 2006’s $1.861 trillion. Sales (59.4 per-cent) and purchases of stock-in-trade (75.2 percent) represent the bulk of the total value of nonloan transactions, which is consistent with prior years.
• The total amounts received (excluding loan balances) dropped 2.5 percent between 2008 and 2010, from $375 billion to $366 billion. Total amounts paid increased from $812 billion to $842 billion, or 3.7 percent. The average amount received is the lowest since 2002, while the average amount paid has increased slightly from 2008 (from $37.6 million to $39.1 million). (See Figure A for comparisons among selected tax years, 1992 through 2010.)
• The large U.S. companies represented in this study continued to send out more in property, services, and money than they received through transactions with related foreign parties. However, this net outflow decreased by over 25 percent, from nearly $626 bil-lion for 2008 to about $469 billion for 2010. Despite this significant decrease, the 2010 net outflows are over twice the amount of the next-highest amount prior to the 2008 study. Net outflows are the difference between total outflows (total amounts paid plus the net amount loaned) and total inflows (total amounts received plus the net amount borrowed).
• There was a 1.4-percent decrease in the number of large foreign parent corporations included in this study since 2008, dropping from 926 to 913. The number of related persons decreased slightly between 2008 and 2010, from 21,599 to 21,549. (See the “Sample Selection” information below for an explanation of the sample size.) For 2010, the 913 large foreign-owned domestic corpora-tions filing Forms 5472, Information Return of a 25-Percent Foreign-Owned U.S. Corporation or a Foreign Corporation Engaged in a U.S. Trade or Business, comprised only 1.17 percent of all 25-percent-or-more foreign-owned domestic corporations but accounted for 78.56 percent of the total assets and 77.65 percent of the total re-ceipts. These large corporations accounted for 11.27 percent of the total assets and 12.47 percent of the total receipts reported by all domestic corporations for 2010. (See Figure B for more data.)
by Isaac J. Goodwin
1 Internal Revenue (IR) Code section 6038A.2 IR Code sections 267(b), 482, and 707(b)(1).3 Form 5472 statistics for Tax Years 1988 through 1990 covered all foreign-owned domestic corporations with total receipts of $1 billion or more. Statistics for Tax Years 1991 through 1994,
1996, 1998, 2000, 2002, 2004, 2006, and 2008 covered all foreign-owned domestic corporations with total receipts of $500 million or more. Consequently, data for 1991 and thereafter are not comparable to the earlier studies.
4 Additional information about Statistics of Income Form 5472 studies for Tax Years 1988 through 2008 may be found in the following Statistics of Income Bulletin issues: Tax Year 1988, Summer 1992, Volume 12, Number 1; Tax Year 1989, Spring 1993, Volume 12, Number 4; Tax Year 1990, Summer 1994, Volume 14, Number 1; Tax Year 1991, Summer 1995, Volume 15, Number 1; Tax Year 1992, Fall 1996, Volume 16, Number 2; Tax Year 1993, Fall 1997, Volume 17, Number 2; Tax Year 1994, Winter 1997-1998, Volume 17, Number 3; Tax Year 1996, Fall 1999, Volume 19, Number 2; Tax Year 1998, Fall 2001, Volume 21, Number 2; Tax Year 2000, Fall 2003, Volume 23, Number 2; Tax Year 2002, Winter 2006, Volume 25, Number 3; Tax Year 2004, Fall 2008, Volume 28, Number 2; Tax Year 2006, Fall 2009, Volume 29, Number 2; Tax Year 2008, Fall 2012, Volume 32, Number 2 (https://www.irs.gov/uac/soi-tax-stats-soi-bulletins).
5 IR Code section 6038A(d).6 For a more extensive discussion of the legislative history of this reporting requirement see Heather R. Duffy, “Transactions Between Large Foreign-Owned Domestic Corporations and
Related Foreign Persons, 2000,” Statistics of Income Bulletin, Fall 2003, Volume 23, Number 1 (https://www.irs.gov/pub/irs-soi/00frrltr.pdf). For the discussion of these requirements in the congressional record see 135 Cong.Rec. S13057-03, S13147.
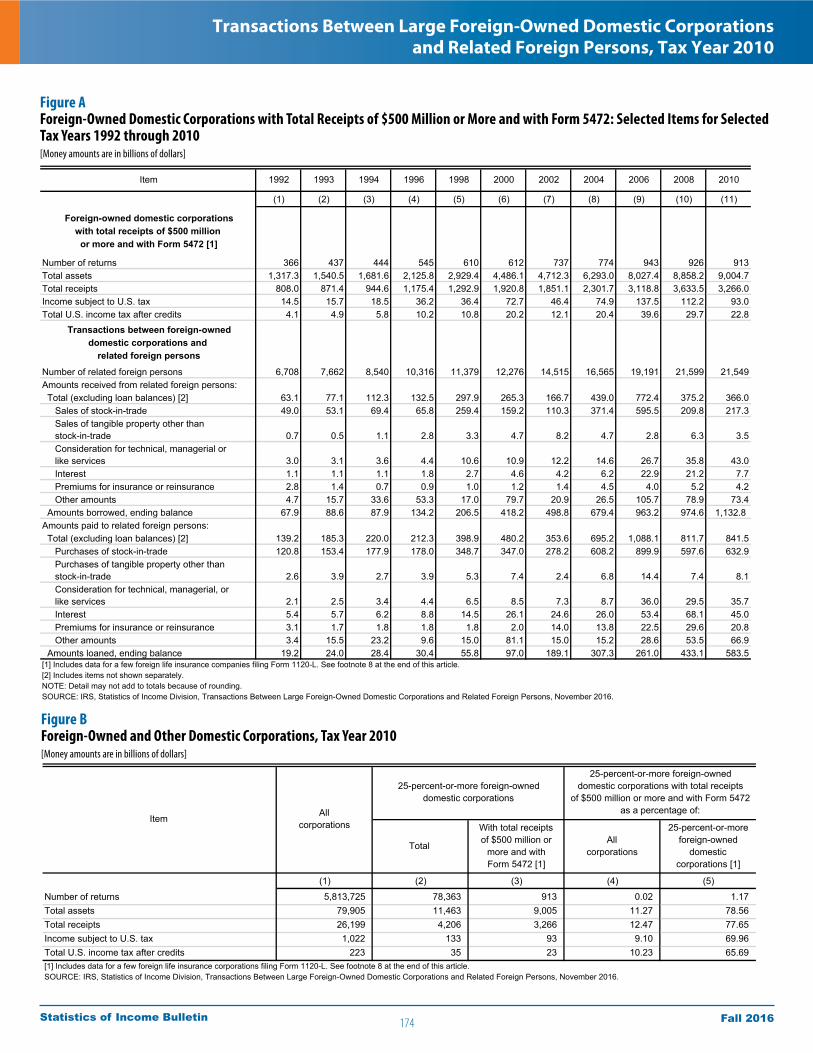
174
Transactions Between Large Foreign-Owned Domestic Corporations and Related Foreign Persons, Tax Year 2010
Fall 2016Statistics of Income Bulletin
Figure AForeign-Owned Domestic Corporations with Total Receipts of $500 Million or More and with Form 5472: Selected Items for Selected Tax Years 1992 through 2010[Money amounts are in billions of dollars]
Item 1992 1993 1994 1996 1998 2000 2002 2004 2006 2008 2010
(1) (2) (3) (4) (5) (6) (7) (8) (9) (10) (11)
Foreign-owned domestic corporationswith total receipts of $500 million
or more and with Form 5472 [1]
Number of returns 366 437 444 545 610 612 737 774 943 926 913Total assets 1,317.3 1,540.5 1,681.6 2,125.8 2,929.4 4,486.1 4,712.3 6,293.0 8,027.4 8,858.2 9,004.7Total receipts 808.0 871.4 944.6 1,175.4 1,292.9 1,920.8 1,851.1 2,301.7 3,118.8 3,633.5 3,266.0Income subject to U.S. tax 14.5 15.7 18.5 36.2 36.4 72.7 46.4 74.9 137.5 112.2 93.0Total U.S. income tax after credits 4.1 4.9 5.8 10.2 10.8 20.2 12.1 20.4 39.6 29.7 22.8
Transactions between foreign-owneddomestic corporations and
related foreign persons
Number of related foreign persons 6,708 7,662 8,540 10,316 11,379 12,276 14,515 16,565 19,191 21,599 21,549Amounts received from related foreign persons: Total (excluding loan balances) [2] 63.1 77.1 112.3 132.5 297.9 265.3 166.7 439.0 772.4 375.2 366.0 Sales of stock-in-trade 49.0 53.1 69.4 65.8 259.4 159.2 110.3 371.4 595.5 209.8 217.3 Sales of tangible property other than stock-in-trade 0.7 0.5 1.1 2.8 3.3 4.7 8.2 4.7 2.8 6.3 3.5 Consideration for technical, managerial or like services 3.0 3.1 3.6 4.4 10.6 10.9 12.2 14.6 26.7 35.8 43.0 Interest 1.1 1.1 1.1 1.8 2.7 4.6 4.2 6.2 22.9 21.2 7.7 Premiums for insurance or reinsurance 2.8 1.4 0.7 0.9 1.0 1.2 1.4 4.5 4.0 5.2 4.2 Other amounts 4.7 15.7 33.6 53.3 17.0 79.7 20.9 26.5 105.7 78.9 73.4 Amounts borrowed, ending balance 67.9 88.6 87.9 134.2 206.5 418.2 498.8 679.4 963.2 974.6 1,132.8Amounts paid to related foreign persons: Total (excluding loan balances) [2] 139.2 185.3 220.0 212.3 398.9 480.2 353.6 695.2 1,088.1 811.7 841.5 Purchases of stock-in-trade 120.8 153.4 177.9 178.0 348.7 347.0 278.2 608.2 899.9 597.6 632.9 Purchases of tangible property other than stock-in-trade 2.6 3.9 2.7 3.9 5.3 7.4 2.4 6.8 14.4 7.4 8.1 Consideration for technical, managerial, or like services 2.1 2.5 3.4 4.4 6.5 8.5 7.3 8.7 36.0 29.5 35.7 Interest 5.4 5.7 6.2 8.8 14.5 26.1 24.6 26.0 53.4 68.1 45.0 Premiums for insurance or reinsurance 3.1 1.7 1.8 1.8 1.8 2.0 14.0 13.8 22.5 29.6 20.8 Other amounts 3.4 15.5 23.2 9.6 15.0 81.1 15.0 15.2 28.6 53.5 66.9 Amounts loaned, ending balance 19.2 24.0 28.4 30.4 55.8 97.0 189.1 307.3 261.0 433.1 583.5[1] Includes data for a few foreign life insurance companies filing Form 1120-L. See footnote 8 at the end of this article.[2] Includes items not shown separately.NOTE: Detail may not add to totals because of rounding.SOURCE: IRS, Statistics of Income Division, Transactions Between Large Foreign-Owned Domestic Corporations and Related Foreign Persons, November 2016.
Figure BForeign-Owned and Other Domestic Corporations, Tax Year 2010[Money amounts are in billions of dollars]
(1) (2) (3) (4) (5)
Number of returns 5,813,725 78,363 913 0.02 1.17 Total assets 79,905 11,463 9,005 11.27 78.56 Total receipts 26,199 4,206 3,266 12.47 77.65 Income subject to U.S. tax 1,022 133 93 9.10 69.96 Total U.S. income tax after credits 223 35 23 10.23 65.69 [1] Includes data for a few foreign life insurance corporations filing Form 1120-L. See footnote 8 at the end of this article.SOURCE: IRS, Statistics of Income Division, Transactions Between Large Foreign-Owned Domestic Corporations and Related Foreign Persons, November 2016.
Item Allcorporations
Total
25-percent-or-more foreign-owneddomestic corporations
25-percent-or-more foreign-owneddomestic corporations with total receipts
of $500 million or more and with Form 5472 as a percentage of:
With total receiptsof $500 million or
more and withForm 5472 [1]
Allcorporations
25-percent-or-moreforeign-owned
domesticcorporations [1]
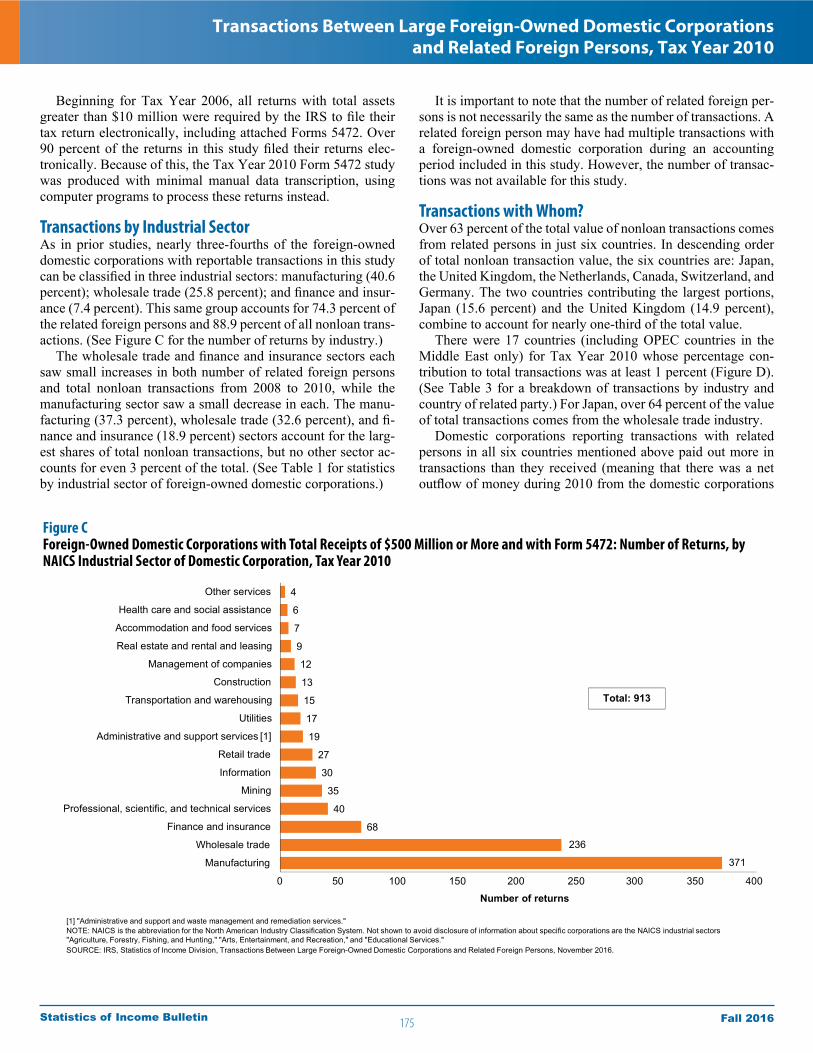
175
Transactions Between Large Foreign-Owned Domestic Corporations and Related Foreign Persons, Tax Year 2010
Fall 2016Statistics of Income Bulletin
Figure CForeign-Owned Domestic Corporations with Total Receipts of $500 Million or More and with Form 5472: Number of Returns, by NAICS Industrial Sector of Domestic Corporation, Tax Year 2010
371
236
68
40
35
30
27
19
17
15
13
12
9
7
6
4
Manufacturing
Wholesale trade
Finance and insurance
Professional, scientific, and technical services
Mining
Information
Retail trade
Administrative and support services [1]
Utilities
Transportation and warehousing
Construction
Management of companies
Real estate and rental and leasing
Accommodation and food services
Health care and social assistance
Other services
[1] "Administrative and support and waste management and remediation services."NOTE: NAICS is the abbreviation for the North American Industry Classification System. Not shown to avoid disclosure of information about specific corporations are the NAICS industrial sectors"Agriculture, Forestry, Fishing, and Hunting," "Arts, Entertainment, and Recreation," and "Educational Services."SOURCE: IRS, Statistics of Income Division, Transactions Between Large Foreign-Owned Domestic Corporations and Related Foreign Persons, November 2016.
Total: 913
Number of returns1500 50 100 250200 400350300
Beginning for Tax Year 2006, all returns with total assets greater than $10 million were required by the IRS to file their tax return electronically, including attached Forms 5472. Over 90 percent of the returns in this study filed their returns elec-tronically. Because of this, the Tax Year 2010 Form 5472 study was produced with minimal manual data transcription, using computer programs to process these returns instead.
Transactions by Industrial SectorAs in prior studies, nearly three-fourths of the foreign-owned domestic corporations with reportable transactions in this study can be classified in three industrial sectors: manufacturing (40.6 percent); wholesale trade (25.8 percent); and finance and insur-ance (7.4 percent). This same group accounts for 74.3 percent of the related foreign persons and 88.9 percent of all nonloan trans-actions. (See Figure C for the number of returns by industry.)
The wholesale trade and finance and insurance sectors each saw small increases in both number of related foreign persons and total nonloan transactions from 2008 to 2010, while the manufacturing sector saw a small decrease in each. The manu-facturing (37.3 percent), wholesale trade (32.6 percent), and fi-nance and insurance (18.9 percent) sectors account for the larg-est shares of total nonloan transactions, but no other sector ac-counts for even 3 percent of the total. (See Table 1 for statistics by industrial sector of foreign-owned domestic corporations.)
It is important to note that the number of related foreign per-sons is not necessarily the same as the number of transactions. A related foreign person may have had multiple transactions with a foreign-owned domestic corporation during an accounting period included in this study. However, the number of transac-tions was not available for this study.
Transactions with Whom?Over 63 percent of the total value of nonloan transactions comes from related persons in just six countries. In descending order of total nonloan transaction value, the six countries are: Japan, the United Kingdom, the Netherlands, Canada, Switzerland, and Germany. The two countries contributing the largest portions, Japan (15.6 percent) and the United Kingdom (14.9 percent), combine to account for nearly one-third of the total value.
There were 17 countries (including OPEC countries in the Middle East only) for Tax Year 2010 whose percentage con-tribution to total transactions was at least 1 percent (Figure D). (See Table 3 for a breakdown of transactions by industry and country of related party.) For Japan, over 64 percent of the value of total transactions comes from the wholesale trade industry.
Domestic corporations reporting transactions with related persons in all six countries mentioned above paid out more in transactions than they received (meaning that there was a net outflow of money during 2010 from the domestic corporations

176
Transactions Between Large Foreign-Owned Domestic Corporations and Related Foreign Persons, Tax Year 2010
Fall 2016Statistics of Income Bulletin
to the related persons from these particular countries). (See “Explanation of Selected Terms” at the end of this article for more information.) Additionally, nearly 85 percent of the 52 se-lected countries in this study had net outflows (many of which are shown in Table 2).
The largest net outflow of transactions from domestic corpo-rations went to related persons resident of and doing business in the UK ($126.8 billion), Japan ($97.9 billion), Hungary ($57.9 billion), and South Korea ($50.2 billion). The UK and Japan led in this category for 2008 as well. The largest net inflow of trans-actions for 2010 came from Australia, where the U.S. corpora-tions received $10.8 billion more than were paid to the foreign persons transacting with them. For 2008, the largest inflow was from Argentina. The wholesale trade industry had the largest net outflow of transactions ($200 billion more) paid out by U.S. corporations than received from related parties. The largest net
inflows ($6.5 billion) came to U.S. domestic corporations in the management of companies and enterprises sector.
Sample Selection, Data Sources, and LimitationsThe corporation Statistics of Income study is based on a sample of over 108,000 corporate income tax returns chosen from 6.26 million returns which companies filed for Tax Year 2010, i.e., accounting periods ending July 2010 through June 2011. These returns were selected after completion of administrative pro-cessing, but before the start of any audit examinations.7 From the sample, only those returns of domestic corporations reporting total receipts of $500 million or more and with attached Forms 5472, were selected for this study. Furthermore, returns with at least one Form 5472 attached and selected in previous studies were also included in these statistics, even if the corporation fell below the $500 million receipts threshold. Foreign corporations (filing Form 1120F) engaged in a U.S. trade or business were not included in these statistics, even though the corporation may have filed Forms 5472 for transactions with related foreign persons.8 Because corporation income tax returns with total re-ceipts of $500 million or more are sampled at the 100-percent rate, the data in this study are not subject to sampling variability, though possibly are subject to nonsampling error.
The industry code used to classify returns for Figure B and Tables 1 and 3 represents the principal business activity of the corporation filing the tax return (i.e., the activity that accounted for the largest portion of total receipts as reported in the corpora-tion’s income statement).9 However, a given return may refer to a company engaged in several business activities or an affiliated group of corporations that conducted different business activi-ties (consolidated return filing). To the extent that some consoli-dated (and nonconsolidated) returns were engaged in more than one type of business activity, transaction data in this article are not entirely related to the industrial activity under which they are shown.
Explanation of Selected TermsAmounts borrowed and loaned—Because the beginning and ending balances, in general, reflect only the amounts outstand-ing at the beginning and end of the accounting period, respec-tively, these amounts do not reflect amounts borrowed and loaned in transactions that took place entirely within the ac-counting period.
Country of residence of a related person—Based on the income tax regulations related to Internal Revenue Code section
Figure DTransactions Between Foreign-Owned Domestic Corporations with Total Receipts of $500 Million or More and Related Foreign Persons: Percentage of Total Nonloan Transactions by Country of Selected Related Foreign Persons, Tax Year 2010
Japan15.6%
United Kingdom14.9%
Netherlands9.2%
Switzerland8.3%Canada
8.0%
Germany7.6%
South Korea4.7%
France3.1%
Australia2.8%
Ireland2.2%
Taiwan2.0%
Bermuda1.8%
Mexico1.7%
Barbados1.5%
Hungary1.3%
OPEC countries(Middle East only) [1]
1.0% Other countries11.9%
Singapore2.3%
$1,208Billion
[1] Iran, Iraq, Kuwait, Qatar, Saudi Arabia, and the United Arab Emirates.NOTE: Percentages do not add up to 100 percent due to rounding.SOURCE: IRS, Statistics of Income Division, Transactions Between Large Foreign-Owned Domestic Corporations and Related Foreign Persons, November 2016.
7 For more information on the corporate sample and statistics on corporation income tax returns for 2010, see Statistics of Income—2010, Corporation Income Tax Returns, Publication 16, 2013 (https://www.irs.gov/pub/irs-soi/10coccr.pdf).
8 Foreign corporations (except life insurance companies) engaged in a U.S. trade or business file Form 1120-F (U.S. Income Tax Return of a Foreign Corporation). These returns are excluded from the Form 5472 statistics. However, data reported by a few foreign life insurance companies filing Form 1120-L (U.S. Life Insurance Company Income Tax Return) are included in the Form 5472 statistics to ensure completeness of the industry statistics for domestic corporations.
9 For the first time, for Tax Year 1998, corporate returns reported their principal business activity according to the North American Industry Classification System (NAICS). This system was developed as a result of the North American Free Trade Agreement (NAFTA) to standardize business classifications for the United States, Canada, and Mexico. NAICS divides the economy into 20 sectors, with an emphasis on production processes. NAICS replaced the Standard Industrial Classification (SIC) codes, which were used to classify corporations in past Statistics of Income studies, causing a break in the year-to-year comparability of the industrial data.
177
Transactions Between Large Foreign-Owned Domestic Corporations and Related Foreign Persons, Tax Year 2010
Fall 2016Statistics of Income Bulletin
6038A, Form 5472 requires the reporting of each country in which a related person files an income tax return as a resident under the tax laws of that country. The statistics in Tables 2 and 3 are based upon this reported residence and, within this definition, the related foreign person is a resident of a particular foreign country.
Foreign-owned domestic corporations—For purposes of these statistics, a domestic corporation was considered foreign-owned if at least 25 percent of the total voting power of all classes of stock was permitted to vote, or 25 percent of the total value of all classes of stock of the corporation, was owned, di-rectly or indirectly, at any time in the tax year, by a single for-eign shareholder (generally a foreign parent corporation). This is in contrast to the other Statistics of Income data on “foreign-controlled” domestic corporations, which are based on 50-per-cent or more ownership by a foreign person.10
Foreign person—The term “foreign person” generally in-cludes: (1) any partnership, association, company, or corpo-ration that was not created or organized under the laws of the United States or of any of its States; (2) any individual who is not a citizen or resident of the United States; (3) any individual who is a citizen of a U.S. possession, but is not otherwise a U.S. citizen or resident; and (4) any foreign trust, estate, or gov-ernment. For the most part, the foreign persons referred to in this article are corporations. See also “Related foreign person” below.
Net outflows/inflows—The flow of transactions can be calcu-lated by adding back net loaned amounts to amounts paid and net borrowed amounts to total received. The difference between this computed total received and total paid is the net flow of transactions. A negative amount indicates more money was paid out by the U.S. domestic corporations to related foreign parties than was received from them (net outflow); a positive amount is a net inflow.
Number of foreign persons—The data shown in the figures and tables, in general, represent the number of foreign persons reported on the Forms 5472 appended to the 913 income tax re-turns filed by domestic corporations with $500 million or more in total receipts (defined below) that were 25-percent-or-more owned by a foreign person. Domestic member corporations of an affiliated group that filed a consolidated income tax return could also join in filing a consolidated Form 5472 for transactions
with a given related foreign person. However, some affiliated domestic corporations that could have filed consolidated Forms 5472 filed separate forms instead. When these forms were iden-tified during statistical processing, the information on them was combined, and the result treated as a single Form 5472 for con-sistency. To this extent, the “number of persons” understates the actual number of Forms 5472 attached to the 913 income tax returns included in the statistics.
OPEC countries—Summary statistics are provided in Table 2 for the following Middle Eastern countries that were members of the Organization of Petroleum Exporting Countries (OPEC) for 2010: Iran, Iraq, Kuwait, Qatar, Saudi Arabia, and the United Arab Emirates. Data for non-Middle Eastern OPEC members are not shown by country.
Related foreign person—Persons related to the domestic cor-poration that filed a Form 5472 include the 25-percent-or-more foreign shareholder, any foreign person who was related to the reporting corporation or the 25-percent-or-more shareholder (as described in Internal Revenue Code sections 267(b) or 707(b)), or any other foreign person who was related to the reporting cor-poration within the meaning of Internal Revenue Code section 482 (covering the allocation of income and deductions among related taxpayers) and the associated regulations. See also “Foreign person,” above, for the definition of “person.”
Total nonloan transactions—A term used in the article for the total value of transactions paid to or received from a foreign related person excluding the net borrowed or loaned amount.
Total receipts—Total receipts is the total income of the do-mestic corporation as reported in the U.S. income tax return. In general, it is derived from the tax return as follows: (1) gross taxable receipts (before deduction of cost of sales and opera-tions, and ordinary and necessary business expenses), plus (2) tax-exempt interest received from State and local government obligations, less (1) net losses from sales of property other than capital assets and (2) certain taxable income from related for-eign corporations only constructively received.
Isaac J. Goodwin, economist with the Corporation Research Section, Corporation Statistics Branch, wrote this article under the direction of Glenn Hentz, Chief.
10 Statistics on domestic corporations controlled by foreign persons for 2010 are reported in James R. Hobbs, “Foreign-Controlled Domestic Corporations, 2010.” Statistics of Income Bulletin, Summer 2013, Volume 33, Number 1 (https://www.irs.gov/pub/irs-soi/13itsumbulfcdomcorp.pdf).

178
Transactions Between Large Foreign-Owned Domestic Corporations and Related Foreign Persons, Tax Year 2010
Fall 2016Statistics of Income Bulletin
(1) (2) (3) (4) (5)
All industries 913 9,004,738,533 3,266,037,017 92,958,307 22,809,020 Agriculture, forestry, fishing, and hunting d d d d d Mining 35 175,428,434 81,460,027 10,578,109 1,608,521 Utilities 17 119,542,991 61,652,892 321,167 111,093 Construction 13 19,880,362 28,369,486 418,263 136,920 Manufacturing 371 2,293,966,968 1,566,295,617 42,417,345 9,545,433 Wholesale trade 236 507,914,911 743,426,148 13,089,331 3,865,188 Retail trade 27 62,890,946 115,565,793 1,339,823 399,347 Transportation and warehousing 15 50,902,734 39,331,921 296,477 66,084 Information 30 174,029,269 80,519,191 2,350,017 716,839 Finance and insurance 68 4,231,285,547 335,243,391 11,231,011 3,669,606 Real estate and rental and leasing 9 24,591,408 8,017,295 41,054 12,518 Professional, scientific, and technical services 40 115,200,359 61,766,430 3,954,973 1,150,148 Management of companies 12 1,107,774,143 63,254,729 4,139,662 812,378 Administrative and support and waste management and remediation services 19 46,335,451 31,933,456 563,205 175,874 Educational services d d d d d Health care and social assistance 6 30,926,729 12,157,630 846,580 291,263 Arts, entertainment, and recreation d d d d d Accommodation and food services 7 25,197,763 22,919,715 1,253,758 213,640 Other services 4 9,745,039 6,154,812 38,348 7,076
(6) (7) (8) (9) (10) (11)
All industries 21,549 366,043,692 217,297,648 3,462,994 330,934 4,479,253 Agriculture, forestry, fishing, and hunting d d d d d d Mining 944 12,268,228 8,284,956 163,291 46,745 13,738 Utilities 99 1,311,397 958,624 78,385 0 0 Construction 190 427,883 727 35,646 0 6,741 Manufacturing 11,126 127,508,358 95,997,363 774,199 141,741 3,752,371 Wholesale trade 3,621 92,932,125 70,977,895 2,380,654 51,139 428,133 Retail trade 241 843,059 352,661 5,802 3,033 3,648 Transportation and warehousing 526 6,636,811 397,576 7,121 70,955 0 Information 861 6,557,940 599,239 2,521 3,528 13,769 Finance and insurance 1,274 92,312,468 38,779,683 90 12,125 0 Real estate and rental and leasing 153 466,146 22,502 0 0 750 Professional, scientific, and technical services 1,501 6,038,637 482,452 14,142 858 209,066 Management of companies 391 17,690,204 0 0 538 0 Administrative and support and waste management and remediation services 342 418,726 208,471 256 237 29,659 Educational services d 0 d d d d Health care and social assistance 48 214,253 210,797 0 0 0 Arts, entertainment, and recreation d 0 d d d d Accommodation and food services 117 267,083 0 0 35 13,445 Other services 64 114,775 8,285 886 0 0Footnotes at end of table.
TotalU.S. income
tax aftercredits
Numberof
returns
Totalassets
Totalreceipts
Incomesubject toU.S. tax
Sales ofstock-in-trade
Sales oftangibleproperty
other thanstock-in-trade
Rents
NAICS industrial sector of domestic corporationNumber
of relatedforeignpersons
Total(excluding
loan balances)
NAICS industrial sector of domestic corporation
Transactions between foreign-owned domestic corporations and related foreign persons
Amounts received from related foreign persons
Royalties
Table 1. Foreign-Owned Domestic Corporations with Total Receipts of $500 Million or More and with Forms 5472: Transactions Between Corporations and Related Foreign Persons, by NAICS Industrial Sector of Domestic Corporation, Tax Year 2010[Money amounts are in thousands of dollars]
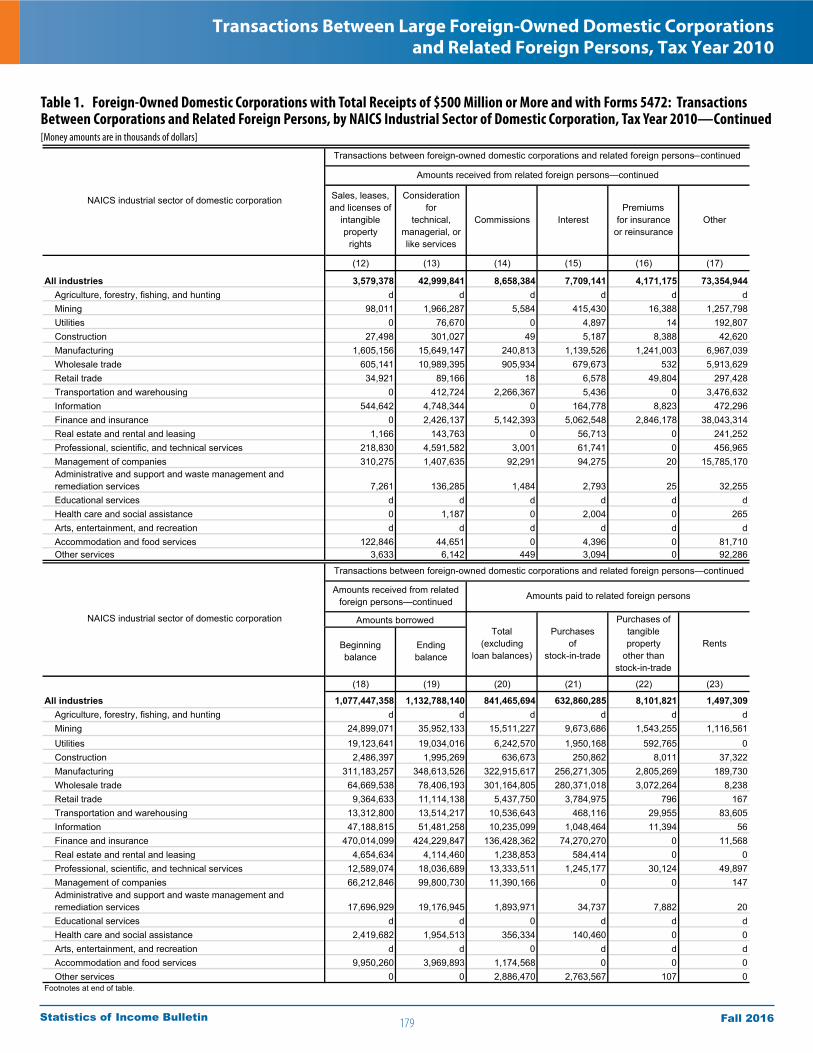
179
Transactions Between Large Foreign-Owned Domestic Corporations and Related Foreign Persons, Tax Year 2010
Fall 2016Statistics of Income Bulletin
(12) (13) (14) (15) (16) (17)
All industries 3,579,378 42,999,841 8,658,384 7,709,141 4,171,175 73,354,944 Agriculture, forestry, fishing, and hunting d d d d d d Mining 98,011 1,966,287 5,584 415,430 16,388 1,257,798 Utilities 0 76,670 0 4,897 14 192,807 Construction 27,498 301,027 49 5,187 8,388 42,620 Manufacturing 1,605,156 15,649,147 240,813 1,139,526 1,241,003 6,967,039 Wholesale trade 605,141 10,989,395 905,934 679,673 532 5,913,629 Retail trade 34,921 89,166 18 6,578 49,804 297,428 Transportation and warehousing 0 412,724 2,266,367 5,436 0 3,476,632 Information 544,642 4,748,344 0 164,778 8,823 472,296 Finance and insurance 0 2,426,137 5,142,393 5,062,548 2,846,178 38,043,314 Real estate and rental and leasing 1,166 143,763 0 56,713 0 241,252 Professional, scientific, and technical services 218,830 4,591,582 3,001 61,741 0 456,965 Management of companies 310,275 1,407,635 92,291 94,275 20 15,785,170 Administrative and support and waste management and remediation services 7,261 136,285 1,484 2,793 25 32,255 Educational services d d d d d d Health care and social assistance 0 1,187 0 2,004 0 265 Arts, entertainment, and recreation d d d d d d Accommodation and food services 122,846 44,651 0 4,396 0 81,710 Other services 3,633 6,142 449 3,094 0 92,286
(18) (19) (20) (21) (22) (23)
All industries 1,077,447,358 1,132,788,140 841,465,694 632,860,285 8,101,821 1,497,309 Agriculture, forestry, fishing, and hunting d d d d d d Mining 24,899,071 35,952,133 15,511,227 9,673,686 1,543,255 1,116,561 Utilities 19,123,641 19,034,016 6,242,570 1,950,168 592,765 0 Construction 2,486,397 1,995,269 636,673 250,862 8,011 37,322 Manufacturing 311,183,257 348,613,526 322,915,617 256,271,305 2,805,269 189,730 Wholesale trade 64,669,538 78,406,193 301,164,805 280,371,018 3,072,264 8,238 Retail trade 9,364,633 11,114,138 5,437,750 3,784,975 796 167 Transportation and warehousing 13,312,800 13,514,217 10,536,643 468,116 29,955 83,605 Information 47,188,815 51,481,258 10,235,099 1,048,464 11,394 56 Finance and insurance 470,014,099 424,229,847 136,428,362 74,270,270 0 11,568 Real estate and rental and leasing 4,654,634 4,114,460 1,238,853 584,414 0 0 Professional, scientific, and technical services 12,589,074 18,036,689 13,333,511 1,245,177 30,124 49,897 Management of companies 66,212,846 99,800,730 11,390,166 0 0 147 Administrative and support and waste management and remediation services 17,696,929 19,176,945 1,893,971 34,737 7,882 20 Educational services d d 0 d d d Health care and social assistance 2,419,682 1,954,513 356,334 140,460 0 0 Arts, entertainment, and recreation d d 0 d d d Accommodation and food services 9,950,260 3,969,893 1,174,568 0 0 0 Other services 0 0 2,886,470 2,763,567 107 0Footnotes at end of table.
Other
Total(excluding
loan balances)
Purchasesof
stock-in-trade
Purchases oftangibleproperty
other thanstock-in-trade
Rents
Commissions InterestPremiums
for insuranceor reinsurance
NAICS industrial sector of domestic corporation
NAICS industrial sector of domestic corporation
Sales, leases,and licenses of
intangibleproperty
rights
Considerationfor
technical,managerial, orlike services
Amounts borrowed
Beginningbalance
Endingbalance
Transactions between foreign-owned domestic corporations and related foreign persons—continued
Amounts received from related foreign persons—continued
Transactions between foreign-owned domestic corporations and related foreign persons—continued
Amounts paid to related foreign personsAmounts received from related foreign persons—continued
Table 1. Foreign-Owned Domestic Corporations with Total Receipts of $500 Million or More and with Forms 5472: Transactions Between Corporations and Related Foreign Persons, by NAICS Industrial Sector of Domestic Corporation, Tax Year 2010—Continued[Money amounts are in thousands of dollars]

180
Transactions Between Large Foreign-Owned Domestic Corporations and Related Foreign Persons, Tax Year 2010
Fall 2016Statistics of Income Bulletin
(24) (25) (26) (27) (28)
All industries 10,795,397 11,929,102 35,723,454 7,856,214 44,992,671 Agriculture, forestry, fishing, and hunting d d d d d Mining 1,500 19,888 830,971 41,528 1,461,745 Utilities 27,001 760 249,049 6 799,499 Construction 22,898 10,701 121,669 306 123,501 Manufacturing 5,500,521 5,052,659 13,784,213 265,810 16,902,911 Wholesale trade 3,911,031 620,497 2,573,908 329,970 3,148,650 Retail trade 164,292 105,853 232,108 6,964 744,949 Transportation and warehousing 0 0 3,019,506 4,606,426 869,703 Information 101,921 3,385,683 1,890,573 41,895 3,025,701 Finance and insurance 76,663 73,627 2,244,491 2,486,272 9,999,923 Real estate and rental and leasing 0 23,707 35,991 0 526,471 Professional, scientific, and technical services 742,598 1,734,440 8,064,416 438 845,869 Management of companies 0 659,343 2,174,594 76,599 4,477,823 Administrative and support and waste management and remediation services 144,410 73,158 260,625 0 1,268,230 Educational services d d d d d Health care and social assistance 14,831 0 34,439 0 132,703 Arts, entertainment, and recreation d d d d d Accommodation and food services 87,666 103,837 169,075 0 600,869 Other services 0 55,044 37,825 0 10,930
(29) (30) (31) (32)
All industries 20,769,720 66,939,721 534,850,081 583,541,392 Agriculture, forestry, fishing, and hunting d d d d Mining 20,393 801,700 23,415,541 28,890,847 Utilities 6,282 2,617,040 4,524,122 3,915,877 Construction 800 60,603 701,416 767,499 Manufacturing 1,444,892 20,698,307 71,804,514 83,585,971 Wholesale trade 79,766 7,049,463 22,316,390 27,346,146 Retail trade 167,154 230,492 6,493,551 5,452,490 Transportation and warehousing 19,355 1,439,977 819,852 557,785 Information 18,140 711,272 5,569,687 5,929,785 Finance and insurance 18,916,522 28,349,026 365,786,679 360,264,304 Real estate and rental and leasing 0 68,270 8,584,869 7,819,954 Professional, scientific, and technical services 23,891 596,661 4,230,688 5,185,658 Management of companies 2,493 3,999,167 18,260,612 51,661,004 Administrative and support and waste management and remediation services 49,824 55,085 1,434,381 1,176,610 Educational services d d d d Health care and social assistance 20,207 13,694 1,905 121 Arts, entertainment, and recreation d d d d Accommodation and food services 0 213,121 652,149 762,855 Other services 0 18,997 196,915 183,834
Royalties
Purchases,leases,
and licenses ofintangible
property rights
Considerationfor
technical,managerial, orlike services
Commissions Interest
Amounts loanedBeginningbalance
Endingbalance
Premiumsfor insurance
or reinsuranceOther
d—In order to avoid disclosure of information for specific corporations, some data have been deleted. Data are included in appropriate totals.NOTES: NAICS is the abbreviation for the North American Industry Classification System. Detail may not add to totals because of rounding.SOURCE: IRS, Statistics of Income Division, Foreign-Owned Domestic Corporations Study, September 2015.
NAICS industrial sector of domestic corporation
Transactions between foreign-owned domestic corporations and related foreign persons—continued
Amounts paid to related foreign persons—continued
NAICS industrial sector of domestic corporation
Transactions between foreign-owned domestic corporationsand related foreign persons—continued
Amounts paid to related foreign persons—continued
Table 1. Foreign-Owned Domestic Corporations with Total Receipts of $500 Million or More and with Forms 5472: Transactions Between Corporations and Related Foreign Persons, by NAICS Industrial Sector of Domestic Corporation, Tax Year 2010—Continued[Money amounts are in thousands of dollars]
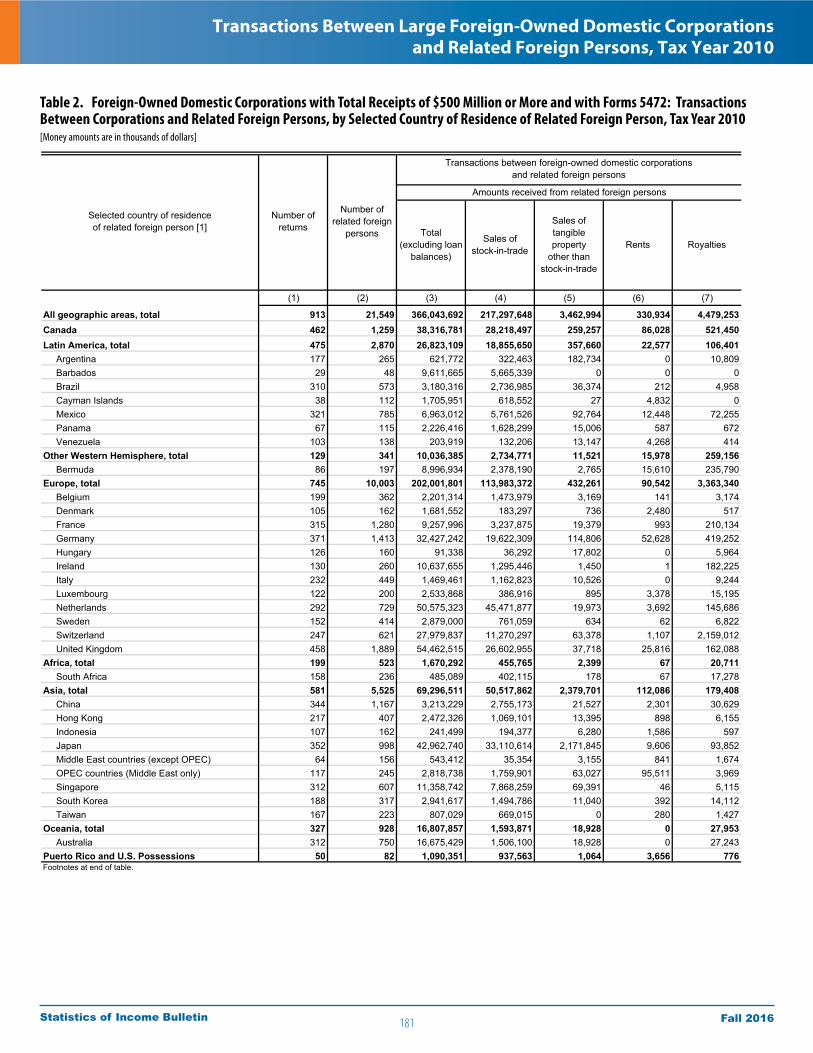
181
Transactions Between Large Foreign-Owned Domestic Corporations and Related Foreign Persons, Tax Year 2010
Fall 2016Statistics of Income Bulletin
Table 2. Foreign-Owned Domestic Corporations with Total Receipts of $500 Million or More and with Forms 5472: Transactions Between Corporations and Related Foreign Persons, by Selected Country of Residence of Related Foreign Person, Tax Year 2010[Money amounts are in thousands of dollars]
(1) (2) (3) (4) (5) (6) (7)
All geographic areas, total 913 21,549 366,043,692 217,297,648 3,462,994 330,934 4,479,253Canada 462 1,259 38,316,781 28,218,497 259,257 86,028 521,450Latin America, total 475 2,870 26,823,109 18,855,650 357,660 22,577 106,401 Argentina 177 265 621,772 322,463 182,734 0 10,809 Barbados 29 48 9,611,665 5,665,339 0 0 0 Brazil 310 573 3,180,316 2,736,985 36,374 212 4,958 Cayman Islands 38 112 1,705,951 618,552 27 4,832 0 Mexico 321 785 6,963,012 5,761,526 92,764 12,448 72,255 Panama 67 115 2,226,416 1,628,299 15,006 587 672 Venezuela 103 138 203,919 132,206 13,147 4,268 414Other Western Hemisphere, total 129 341 10,036,385 2,734,771 11,521 15,978 259,156 Bermuda 86 197 8,996,934 2,378,190 2,765 15,610 235,790Europe, total 745 10,003 202,001,801 113,983,372 432,261 90,542 3,363,340 Belgium 199 362 2,201,314 1,473,979 3,169 141 3,174 Denmark 105 162 1,681,552 183,297 736 2,480 517 France 315 1,280 9,257,996 3,237,875 19,379 993 210,134 Germany 371 1,413 32,427,242 19,622,309 114,806 52,628 419,252 Hungary 126 160 91,338 36,292 17,802 0 5,964 Ireland 130 260 10,637,655 1,295,446 1,450 1 182,225 Italy 232 449 1,469,461 1,162,823 10,526 0 9,244 Luxembourg 122 200 2,533,868 386,916 895 3,378 15,195 Netherlands 292 729 50,575,323 45,471,877 19,973 3,692 145,686 Sweden 152 414 2,879,000 761,059 634 62 6,822 Switzerland 247 621 27,979,837 11,270,297 63,378 1,107 2,159,012 United Kingdom 458 1,889 54,462,515 26,602,955 37,718 25,816 162,088Africa, total 199 523 1,670,292 455,765 2,399 67 20,711 South Africa 158 236 485,089 402,115 178 67 17,278Asia, total 581 5,525 69,296,511 50,517,862 2,379,701 112,086 179,408 China 344 1,167 3,213,229 2,755,173 21,527 2,301 30,629 Hong Kong 217 407 2,472,326 1,069,101 13,395 898 6,155 Indonesia 107 162 241,499 194,377 6,280 1,586 597 Japan 352 998 42,962,740 33,110,614 2,171,845 9,606 93,852 Middle East countries (except OPEC) 64 156 543,412 35,354 3,155 841 1,674 OPEC countries (Middle East only) 117 245 2,818,738 1,759,901 63,027 95,511 3,969 Singapore 312 607 11,358,742 7,868,259 69,391 46 5,115 South Korea 188 317 2,941,617 1,494,786 11,040 392 14,112 Taiwan 167 223 807,029 669,015 0 280 1,427Oceania, total 327 928 16,807,857 1,593,871 18,928 0 27,953 Australia 312 750 16,675,429 1,506,100 18,928 0 27,243Puerto Rico and U.S. Possessions 50 82 1,090,351 937,563 1,064 3,656 776Footnotes at end of table.
Selected country of residence of related foreign person [1]
Number of returns
Number of related foreign
persons Total(excluding loan
balances)
Sales ofstock-in-trade
Sales of tangibleproperty
other than stock-in-trade
Rents Royalties
Transactions between foreign-owned domestic corporationsand related foreign persons
Amounts received from related foreign persons
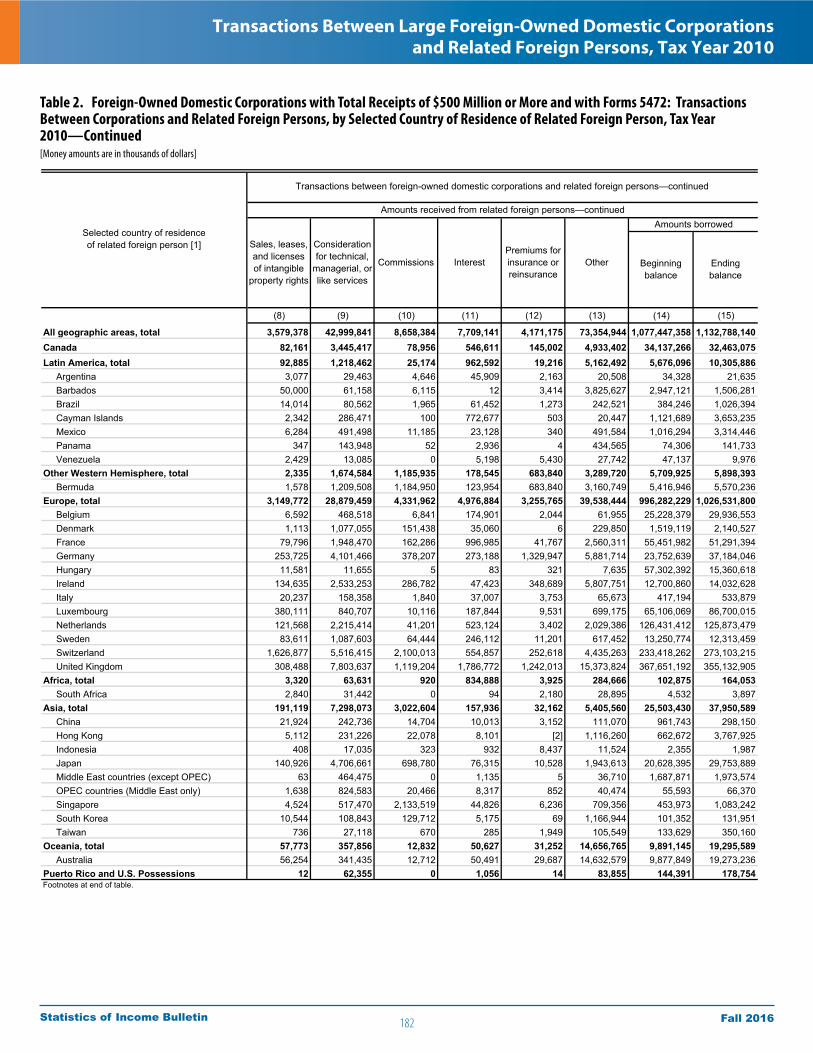
182
Transactions Between Large Foreign-Owned Domestic Corporations and Related Foreign Persons, Tax Year 2010
Fall 2016Statistics of Income Bulletin
Table 2. Foreign-Owned Domestic Corporations with Total Receipts of $500 Million or More and with Forms 5472: Transactions Between Corporations and Related Foreign Persons, by Selected Country of Residence of Related Foreign Person, Tax Year 2010—Continued[Money amounts are in thousands of dollars]
(8) (9) (10) (11) (12) (13) (14) (15)
All geographic areas, total 3,579,378 42,999,841 8,658,384 7,709,141 4,171,175 73,354,944 1,077,447,358 1,132,788,140Canada 82,161 3,445,417 78,956 546,611 145,002 4,933,402 34,137,266 32,463,075Latin America, total 92,885 1,218,462 25,174 962,592 19,216 5,162,492 5,676,096 10,305,886 Argentina 3,077 29,463 4,646 45,909 2,163 20,508 34,328 21,635 Barbados 50,000 61,158 6,115 12 3,414 3,825,627 2,947,121 1,506,281 Brazil 14,014 80,562 1,965 61,452 1,273 242,521 384,246 1,026,394 Cayman Islands 2,342 286,471 100 772,677 503 20,447 1,121,689 3,653,235 Mexico 6,284 491,498 11,185 23,128 340 491,584 1,016,294 3,314,446 Panama 347 143,948 52 2,936 4 434,565 74,306 141,733 Venezuela 2,429 13,085 0 5,198 5,430 27,742 47,137 9,976Other Western Hemisphere, total 2,335 1,674,584 1,185,935 178,545 683,840 3,289,720 5,709,925 5,898,393 Bermuda 1,578 1,209,508 1,184,950 123,954 683,840 3,160,749 5,416,946 5,570,236Europe, total 3,149,772 28,879,459 4,331,962 4,976,884 3,255,765 39,538,444 996,282,229 1,026,531,800 Belgium 6,592 468,518 6,841 174,901 2,044 61,955 25,228,379 29,936,553 Denmark 1,113 1,077,055 151,438 35,060 6 229,850 1,519,119 2,140,527 France 79,796 1,948,470 162,286 996,985 41,767 2,560,311 55,451,982 51,291,394 Germany 253,725 4,101,466 378,207 273,188 1,329,947 5,881,714 23,752,639 37,184,046 Hungary 11,581 11,655 5 83 321 7,635 57,302,392 15,360,618 Ireland 134,635 2,533,253 286,782 47,423 348,689 5,807,751 12,700,860 14,032,628 Italy 20,237 158,358 1,840 37,007 3,753 65,673 417,194 533,879 Luxembourg 380,111 840,707 10,116 187,844 9,531 699,175 65,106,069 86,700,015 Netherlands 121,568 2,215,414 41,201 523,124 3,402 2,029,386 126,431,412 125,873,479 Sweden 83,611 1,087,603 64,444 246,112 11,201 617,452 13,250,774 12,313,459 Switzerland 1,626,877 5,516,415 2,100,013 554,857 252,618 4,435,263 233,418,262 273,103,215 United Kingdom 308,488 7,803,637 1,119,204 1,786,772 1,242,013 15,373,824 367,651,192 355,132,905Africa, total 3,320 63,631 920 834,888 3,925 284,666 102,875 164,053 South Africa 2,840 31,442 0 94 2,180 28,895 4,532 3,897Asia, total 191,119 7,298,073 3,022,604 157,936 32,162 5,405,560 25,503,430 37,950,589 China 21,924 242,736 14,704 10,013 3,152 111,070 961,743 298,150 Hong Kong 5,112 231,226 22,078 8,101 [2] 1,116,260 662,672 3,767,925 Indonesia 408 17,035 323 932 8,437 11,524 2,355 1,987 Japan 140,926 4,706,661 698,780 76,315 10,528 1,943,613 20,628,395 29,753,889 Middle East countries (except OPEC) 63 464,475 0 1,135 5 36,710 1,687,871 1,973,574 OPEC countries (Middle East only) 1,638 824,583 20,466 8,317 852 40,474 55,593 66,370 Singapore 4,524 517,470 2,133,519 44,826 6,236 709,356 453,973 1,083,242 South Korea 10,544 108,843 129,712 5,175 69 1,166,944 101,352 131,951 Taiwan 736 27,118 670 285 1,949 105,549 133,629 350,160Oceania, total 57,773 357,856 12,832 50,627 31,252 14,656,765 9,891,145 19,295,589 Australia 56,254 341,435 12,712 50,491 29,687 14,632,579 9,877,849 19,273,236Puerto Rico and U.S. Possessions 12 62,355 0 1,056 14 83,855 144,391 178,754
Interest
Sales, leases, and licenses of intangible
property rights
Considerationfor technical,
managerial, or like services
CommissionsPremiums for insurance or reinsurance
Other
Amounts borrowed
Beginningbalance
Endingbalance
Footnotes at end of table.
Transactions between foreign-owned domestic corporations and related foreign persons—continued
Amounts received from related foreign persons—continued
Selected country of residence of related foreign person [1]

183
Transactions Between Large Foreign-Owned Domestic Corporations and Related Foreign Persons, Tax Year 2010
Fall 2016Statistics of Income Bulletin
Table 2. Foreign-Owned Domestic Corporations with Total Receipts of $500 Million or More and with Forms 5472: Transactions Between Corporations and Related Foreign Persons, by Selected Country of Residence of Related Foreign Person, Tax Year2010—Continued[Money amounts are in thousands of dollars]
(16) (17) (18) (19) (20) (21) (22)
All geographic areas, total 841,465,694 632,860,285 8,101,821 1,497,309 10,795,397 11,929,102 35,723,454Canada 58,852,567 45,588,640 2,228,557 117,561 67,191 341,833 4,967,936Latin America, total 39,930,615 35,911,566 203,106 485 115,178 25,496 1,244,970 Argentina 462,451 328,013 81 5 0 0 60,695 Barbados 8,535,005 7,775,406 0 0 0 0 2,481 Brazil 2,258,414 1,717,833 4,413 20 1,343 5,103 80,911 Cayman Islands 4,927,114 4,463,123 0 0 0 0 101,088 Mexico 14,074,287 12,635,623 175,968 379 113,805 20,218 880,655 Panama 1,112,428 765,507 2,011 81 0 0 7,481 Venezuela 7,011,569 6,989,844 134 0 0 0 5,843Other Western Hemisphere, total 13,027,447 3,924,419 30,924 82,573 4,217 300 419,346 Bermuda 12,282,509 3,744,222 25,521 1,866 4,171 0 187,674Europe, total 427,126,705 292,120,331 2,180,888 1,233,891 5,778,948 9,065,126 18,195,743 Belgium 5,553,728 2,842,542 854 24,962 121,846 15,232 415,739 Denmark 5,672,963 4,716,663 31,723 18,998 17,623 7,144 289,234 France 28,339,364 19,664,237 106,765 6,924 1,312,229 545,797 2,191,603 Germany 58,968,030 42,477,889 552,368 6,390 823,603 1,676,960 1,558,557 Hungary 16,049,250 2,057,617 580 278,737 42,125 50,983 164,453 Ireland 15,908,281 8,552,341 13,407 12,479 270,901 378,925 294,377 Italy 4,221,241 3,587,856 8,591 174 20,303 64,228 279,277 Luxembourg 9,452,615 885,950 3,247 0 13,727 677,732 1,040,553 Netherlands 60,033,558 52,013,345 112,029 6,401 163,344 222,328 1,180,714 Sweden 7,238,973 5,355,147 10,969 0 488,525 61,233 373,447 Switzerland 72,606,692 40,555,690 1,232,671 666,855 1,959,528 4,611,206 1,448,534 United Kingdom 125,854,864 97,491,437 69,882 158,614 529,421 653,078 7,529,800Africa, total 1,842,533 949,662 110 0 1,191 7 740,633 South Africa 262,141 210,818 80 0 1,191 0 35,532Asia, total 280,462,533 251,247,031 3,457,090 59,758 4,793,433 2,419,793 9,695,304 China 4,857,312 4,202,154 25,784 208 19 0 222,736 Hong Kong 7,309,030 6,088,879 47,041 353 576 0 161,857 Indonesia 298,480 259,566 335 0 0 0 20,889 Japan 145,387,896 133,350,408 3,063,429 8,331 4,529,356 2,254,255 927,457 Middle East countries (except OPEC) 8,144,441 6,648,240 589 50,301 12,007 0 857,171 OPEC countries (Middle East only) 9,566,276 9,482,347 1,555 1 0 0 27,186 Singapore 16,092,128 10,864,891 95,932 0 82 72 292,461 South Korea 53,223,169 50,449,853 192,791 120 249,401 164,945 1,927,552 Taiwan 23,506,135 23,385,420 32 0 59 0 62,715Oceania, total 18,515,092 1,585,162 931 3,041 35,121 76,546 453,232 Australia 17,628,246 709,957 931 3,041 32,687 76,546 449,737Puerto Rico and U.S. Possessions 1,487,741 1,313,524 25 0 118 0 5,989
Total (excluding loan balances)
Purchases of stock-in-trade Rents Royalties
Purchases,leases, and licenses of intangible
property rights
Considerationfor technical,
managerial, or like services
Purchases of tangibleproperty
other thanstock-in-trade
Footnotes at end of table.
Transactions between foreign-owned domestic corporations and related foreign persons—continued
Amounts paid to related forreign persons
Selected country of residence of related foreign person [1]

184
Transactions Between Large Foreign-Owned Domestic Corporations and Related Foreign Persons, Tax Year 2010
Fall 2016Statistics of Income Bulletin
Table 2. Foreign-Owned Domestic Corporations with Total Receipts of $500 Million or More and with Forms 5472: Transactions Between Corporations and Related Foreign Persons, by Selected Country of Residence of Related Foreign Person, Tax Year2010—Continued[Money amounts are in thousands of dollars]
(23) (24) (25) (26) (27) (28)
All geographic areas, total 7,856,214 44,992,671 20,769,720 66,939,721 534,850,081 583,541,392Canada 217,179 1,324,056 266,807 3,732,807 19,097,869 23,477,512Latin America, total 94,403 425,617 507,252 1,402,542 10,046,074 12,043,117 Argentina 6,693 718 13 66,233 989,908 136,317 Barbados 8,985 16,769 507,003 224,361 14,025 9,206 Brazil 43,632 19,574 0 385,585 890,359 663,845 Cayman Islands 897 356,302 0 5,704 5,565,521 5,541,663 Mexico 23,924 26,598 208 196,909 1,122,254 3,599,593 Panama 284 815 5 336,244 144,991 399,193 Venezuela 853 229 0 14,666 762,941 255,623Other Western Hemisphere, total 2,182 551,562 6,926,058 1,085,866 1,859,571 3,126,974 Bermuda 1,022 494,937 6,812,562 1,010,534 602,168 1,965,803Europe, total 834,714 41,504,667 12,996,342 43,216,055 479,746,764 513,132,555 Belgium 5,457 1,184,523 3,542 939,031 8,617,017 12,427,378 Denmark 123,061 224,294 1,028 243,195 3,143,459 4,071,829 France 51,190 1,582,992 66,887 2,810,740 35,883,152 25,132,523 Germany 16,533 1,527,889 1,943,647 8,384,194 6,594,436 4,376,703 Hungary 75 3,543,650 10 9,911,020 27,909 4,928 Ireland 50,540 1,004,655 3,501,995 1,828,661 12,550,211 7,736,973 Italy 1,286 20,951 71,624 166,951 694,010 630,193 Luxembourg 776 6,160,594 102,342 567,694 14,537,291 19,288,341 Netherlands 98,427 4,310,988 14,761 1,911,221 39,094,771 43,442,814 Sweden 7,713 478,683 148,457 314,799 8,216,649 11,538,618 Switzerland 56,436 10,260,607 6,824,520 4,990,645 85,053,748 77,958,889 United Kingdom 414,942 10,560,853 167,060 8,279,777 259,536,455 302,472,418Africa, total 1,626 104,502 22 44,780 82,614 107,451 South Africa 714 12 22 13,772 3,854 6,244Asia, total 4,909,974 590,462 56,187 3,233,501 16,617,297 26,610,893 China 8,644 4,315 0 393,452 80,260 117,011 Hong Kong 78,794 4,707 0 926,823 178,847 4,846,944 Indonesia 4,513 2,732 0 10,445 80,811 85,904 Japan 90,535 299,039 20,460 844,626 13,565,719 18,175,548 Middle East countries (except OPEC) 966 223,052 27,948 324,167 50,913 51,569 OPEC countries (Middle East only) 695 6,231 613 47,648 82,808 968,554 Singapore 4,696,011 33,218 5,117 104,344 611,125 819,573 South Korea 12,232 7,075 1,980 217,220 149,020 116,014 Taiwan 1,497 113 67 56,232 1,611,059 1,152,033Oceania, total 1,794,812 491,729 17,052 14,057,466 7,336,796 4,985,011 Australia 1,791,951 491,704 16,067 14,055,625 7,313,903 4,967,455Puerto Rico and U.S. Possessions 1,323 76 0 166,686 63,095 57,880
Amounts loaned
Beginningbalance Ending balance
Commissions Interest
[1] Includes returns with country not specified.[2] Less than $500.NOTE: Detail may not add to totals because of rounding.SOURCE: IRS, Statistics of Income Division, Foreign-Owned Domestic Corporations Study, September 2015.
Selected country of residence of related foreign person [1]
Transactions between foreign-owned domestic corporations and related foreign persons—continued
Amounts paid to related forreign persons—continued
Premiums for insurance or reinsurance
Other
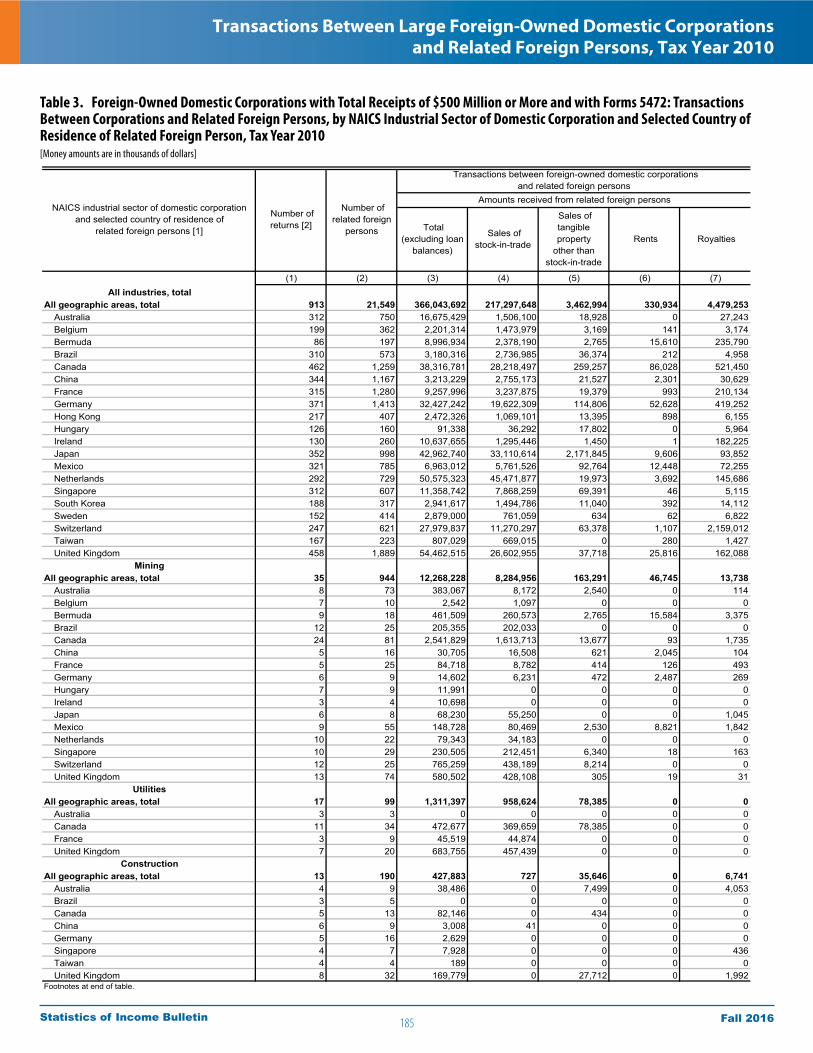
185
Transactions Between Large Foreign-Owned Domestic Corporations and Related Foreign Persons, Tax Year 2010
Fall 2016Statistics of Income Bulletin
Table 3. Foreign-Owned Domestic Corporations with Total Receipts of $500 Million or More and with Forms 5472: Transactions Between Corporations and Related Foreign Persons, by NAICS Industrial Sector of Domestic Corporation and Selected Country of Residence of Related Foreign Person, Tax Year 2010[Money amounts are in thousands of dollars]
(1) (2) (3) (4) (5) (6) (7)All industries, total
All geographic areas, total 913 21,549 366,043,692 217,297,648 3,462,994 330,934 4,479,253Australia 312 750 16,675,429 1,506,100 18,928 0 27,243Belgium 199 362 2,201,314 1,473,979 3,169 141 3,174Bermuda 86 197 8,996,934 2,378,190 2,765 15,610 235,790Brazil 310 573 3,180,316 2,736,985 36,374 212 4,958Canada 462 1,259 38,316,781 28,218,497 259,257 86,028 521,450China 344 1,167 3,213,229 2,755,173 21,527 2,301 30,629France 315 1,280 9,257,996 3,237,875 19,379 993 210,134Germany 371 1,413 32,427,242 19,622,309 114,806 52,628 419,252Hong Kong 217 407 2,472,326 1,069,101 13,395 898 6,155Hungary 126 160 91,338 36,292 17,802 0 5,964Ireland 130 260 10,637,655 1,295,446 1,450 1 182,225Japan 352 998 42,962,740 33,110,614 2,171,845 9,606 93,852Mexico 321 785 6,963,012 5,761,526 92,764 12,448 72,255Netherlands 292 729 50,575,323 45,471,877 19,973 3,692 145,686Singapore 312 607 11,358,742 7,868,259 69,391 46 5,115South Korea 188 317 2,941,617 1,494,786 11,040 392 14,112Sweden 152 414 2,879,000 761,059 634 62 6,822Switzerland 247 621 27,979,837 11,270,297 63,378 1,107 2,159,012Taiwan 167 223 807,029 669,015 0 280 1,427United Kingdom 458 1,889 54,462,515 26,602,955 37,718 25,816 162,088
MiningAll geographic areas, total 35 944 12,268,228 8,284,956 163,291 46,745 13,738
Australia 8 73 383,067 8,172 2,540 0 114Belgium 7 10 2,542 1,097 0 0 0Bermuda 9 18 461,509 260,573 2,765 15,584 3,375Brazil 12 25 205,355 202,033 0 0 0Canada 24 81 2,541,829 1,613,713 13,677 93 1,735China 5 16 30,705 16,508 621 2,045 104France 5 25 84,718 8,782 414 126 493Germany 6 9 14,602 6,231 472 2,487 269Hungary 7 9 11,991 0 0 0 0Ireland 3 4 10,698 0 0 0 0Japan 6 8 68,230 55,250 0 0 1,045Mexico 9 55 148,728 80,469 2,530 8,821 1,842Netherlands 10 22 79,343 34,183 0 0 0Singapore 10 29 230,505 212,451 6,340 18 163Switzerland 12 25 765,259 438,189 8,214 0 0United Kingdom 13 74 580,502 428,108 305 19 31
UtilitiesAll geographic areas, total 17 99 1,311,397 958,624 78,385 0 0
Australia 3 3 0 0 0 0 0Canada 11 34 472,677 369,659 78,385 0 0France 3 9 45,519 44,874 0 0 0United Kingdom 7 20 683,755 457,439 0 0 0
ConstructionAll geographic areas, total 13 190 427,883 727 35,646 0 6,741
Australia 4 9 38,486 0 7,499 0 4,053Brazil 3 5 0 0 0 0 0Canada 5 13 82,146 0 434 0 0China 6 9 3,008 41 0 0 0Germany 5 16 2,629 0 0 0 0Singapore 4 7 7,928 0 0 0 436Taiwan 4 4 189 0 0 0 0United Kingdom 8 32 169,779 0 27,712 0 1,992
Footnotes at end of table.
Transactions between foreign-owned domestic corporations and related foreign persons
Amounts received from related foreign personsNAICS industrial sector of domestic corporation
and selected country of residence ofrelated foreign persons [1]
Number of returns [2]
Number of related foreign
persons Total (excluding loan
balances)
Sales ofstock-in-trade
Sales oftangibleproperty
other thanstock-in-trade
Rents Royalties

186
Transactions Between Large Foreign-Owned Domestic Corporations and Related Foreign Persons, Tax Year 2010
Fall 2016Statistics of Income Bulletin
Table 3. Foreign-Owned Domestic Corporations with Total Receipts of $500 Million or More and with Forms 5472: Transactions Between Corporations and Related Foreign Persons, by NAICS Industrial Sector of Domestic Corporation and Selected Country of Residence of Related Foreign Person, Tax Year 2010—Continued[Money amounts are in thousands of dollars]
(1) (2) (3) (4) (5) (6) (7)Manufacturing
All geographic areas, total 371 11,126 127,508,358 95,997,363 774,199 141,741 3,752,371Australia 159 319 1,556,359 1,280,108 29 0 17,703Belgium 107 208 1,510,694 1,146,173 2,855 141 1,714Bermuda 27 52 690,522 217,085 0 0 232,414Brazil 176 337 1,505,233 1,376,663 33,342 212 3,135Canada 212 539 23,851,897 22,062,570 121,382 10,748 501,779China 196 742 2,332,120 2,239,392 10,969 257 27,898France 174 733 4,560,655 2,716,819 7,698 745 16,512Germany 195 862 14,186,331 11,318,665 113,344 4,876 414,546Hong Kong 94 163 826,350 761,844 13,221 676 5,307Hungary 65 89 67,222 34,789 17,802 0 5,964Ireland 51 117 2,309,814 1,120,177 1,450 0 181,375Japan 183 459 5,977,083 4,102,224 11,613 75 11,325Mexico 172 451 4,269,441 3,833,248 87,522 3,128 64,475Netherlands 142 411 7,997,834 5,869,881 19,112 0 137,448Singapore 145 266 2,823,498 2,339,405 5,843 27 369South Korea 108 175 672,316 561,664 10,596 0 6,402Sweden 90 269 1,652,108 557,216 634 0 566Switzerland 115 331 11,340,425 5,590,680 54,963 1,107 1,892,739Taiwan 77 99 367,272 361,315 0 0 983United Kingdom 208 850 24,918,426 18,390,542 7,478 25,403 99,326
Wholesale tradeAll geographic areas, total 236 3,621 92,932,125 70,977,895 2,380,654 51,139 428,133
Australia 68 97 229,860 206,523 242 0 1,490Belgium 39 65 420,763 324,769 0 0 1,460Bermuda 7 18 2,291,039 1,900,514 0 0 0Brazil 64 90 1,159,001 1,124,850 5 0 1,824Canada 96 205 5,158,853 3,611,530 38,004 1,588 9,267China 78 246 685,421 485,286 8,216 0 2,011France 61 162 1,185,739 272,650 9,385 0 246Germany 89 215 9,812,622 8,146,253 690 45,230 1,082Hong Kong 63 105 439,462 285,877 83 0 587Hungary 22 22 2,982 1,503 0 0 0Ireland 20 34 1,214,969 116,223 0 0 768Japan 90 390 35,066,080 28,898,676 2,160,231 281 70,053Mexico 76 135 1,799,296 1,515,622 137 42 3,669Netherlands 67 102 2,184,849 896,193 830 3,545 7,694Singapore 82 136 5,873,272 5,211,673 56,986 0 1,896South Korea 44 83 2,235,480 929,669 444 392 7,661Sweden 27 77 1,043,053 202,093 0 62 5,389Switzerland 49 100 6,821,081 4,692,569 46 0 266,253Taiwan 53 74 326,643 305,258 0 0 443United Kingdom 97 232 8,105,755 7,178,939 426 0 42,464
Retail tradeAll geographic areas, total 27 241 843,059 352,661 5,802 3,033 3,648
Australia 3 3 1,341 1,341 0 0 0Belgium 4 6 18,401 0 0 0 0Canada 8 16 22,553 12,822 0 0 0China 3 8 6,990 6,505 0 0 0France 5 39 39,541 35,767 0 0 0Germany 5 10 178,955 0 0 0 0Hong Kong 5 9 4,756 22 0 0 0
Footnotes at end of table.
Total (excluding loan
balances)
Sales ofstock-in-trade
Sales oftangibleproperty
other thanstock-in-trade
Rents Royalties
NAICS industrial sector of domestic corporationand selected country of residence of
related foreign persons [1]
Number of returns [2]
Number of related foreign
persons
Transactions between foreign-owned domestic corporations and related foreign persons
Amounts received from related foreign persons
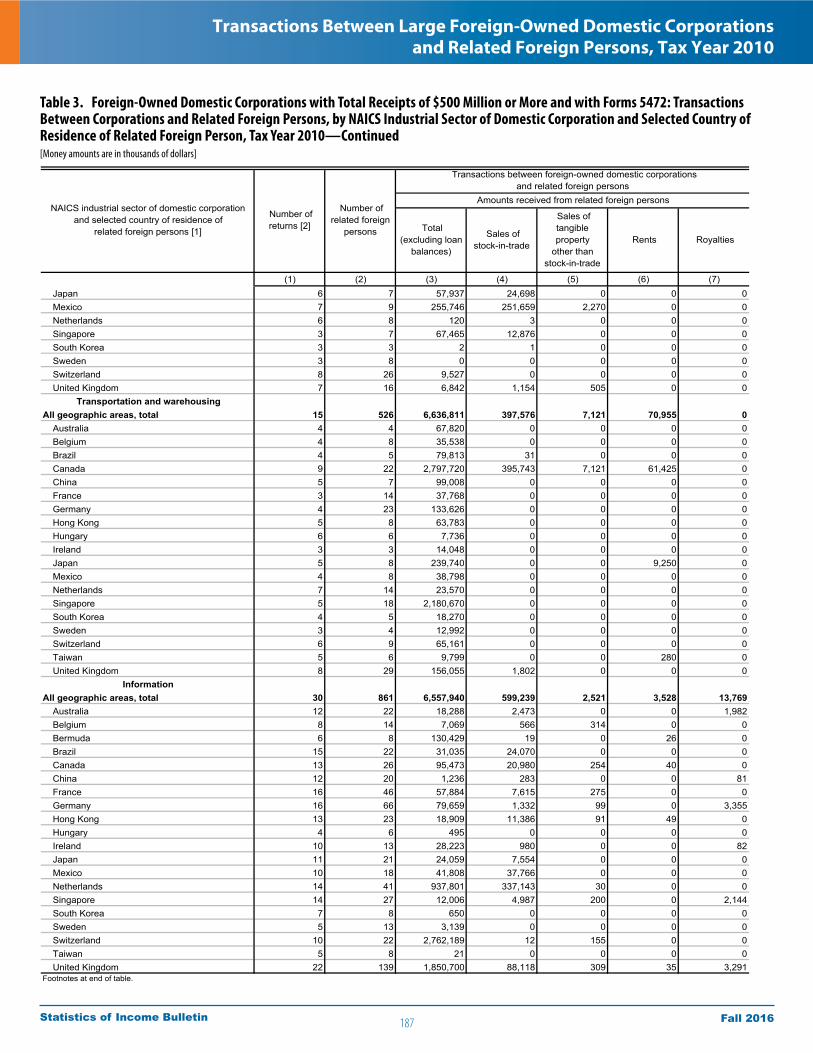
187
Transactions Between Large Foreign-Owned Domestic Corporations and Related Foreign Persons, Tax Year 2010
Fall 2016Statistics of Income Bulletin
Table 3. Foreign-Owned Domestic Corporations with Total Receipts of $500 Million or More and with Forms 5472: Transactions Between Corporations and Related Foreign Persons, by NAICS Industrial Sector of Domestic Corporation and Selected Country of Residence of Related Foreign Person, Tax Year 2010—Continued[Money amounts are in thousands of dollars]
(1) (2) (3) (4) (5) (6) (7)Japan 6 7 57,937 24,698 0 0 0Mexico 7 9 255,746 251,659 2,270 0 0Netherlands 6 8 120 3 0 0 0Singapore 3 7 67,465 12,876 0 0 0South Korea 3 3 2 1 0 0 0Sweden 3 8 0 0 0 0 0Switzerland 8 26 9,527 0 0 0 0United Kingdom 7 16 6,842 1,154 505 0 0
Transportation and warehousingAll geographic areas, total 15 526 6,636,811 397,576 7,121 70,955 0
Australia 4 4 67,820 0 0 0 0Belgium 4 8 35,538 0 0 0 0Brazil 4 5 79,813 31 0 0 0Canada 9 22 2,797,720 395,743 7,121 61,425 0China 5 7 99,008 0 0 0 0France 3 14 37,768 0 0 0 0Germany 4 23 133,626 0 0 0 0Hong Kong 5 8 63,783 0 0 0 0Hungary 6 6 7,736 0 0 0 0Ireland 3 3 14,048 0 0 0 0Japan 5 8 239,740 0 0 9,250 0Mexico 4 8 38,798 0 0 0 0Netherlands 7 14 23,570 0 0 0 0Singapore 5 18 2,180,670 0 0 0 0South Korea 4 5 18,270 0 0 0 0Sweden 3 4 12,992 0 0 0 0Switzerland 6 9 65,161 0 0 0 0Taiwan 5 6 9,799 0 0 280 0United Kingdom 8 29 156,055 1,802 0 0 0
InformationAll geographic areas, total 30 861 6,557,940 599,239 2,521 3,528 13,769
Australia 12 22 18,288 2,473 0 0 1,982Belgium 8 14 7,069 566 314 0 0Bermuda 6 8 130,429 19 0 26 0Brazil 15 22 31,035 24,070 0 0 0Canada 13 26 95,473 20,980 254 40 0China 12 20 1,236 283 0 0 81France 16 46 57,884 7,615 275 0 0Germany 16 66 79,659 1,332 99 0 3,355Hong Kong 13 23 18,909 11,386 91 49 0Hungary 4 6 495 0 0 0 0Ireland 10 13 28,223 980 0 0 82Japan 11 21 24,059 7,554 0 0 0Mexico 10 18 41,808 37,766 0 0 0Netherlands 14 41 937,801 337,143 30 0 0Singapore 14 27 12,006 4,987 200 0 2,144South Korea 7 8 650 0 0 0 0Sweden 5 13 3,139 0 0 0 0Switzerland 10 22 2,762,189 12 155 0 0Taiwan 5 8 21 0 0 0 0United Kingdom 22 139 1,850,700 88,118 309 35 3,291
Footnotes at end of table.
NAICS industrial sector of domestic corporationand selected country of residence of
related foreign persons [1]
Number of returns [2]
Number of related foreign
persons
Transactions between foreign-owned domestic corporations and related foreign persons
Amounts received from related foreign persons
Total (excluding loan
balances)
Sales ofstock-in-trade
Sales oftangibleproperty
other thanstock-in-trade
Rents Royalties
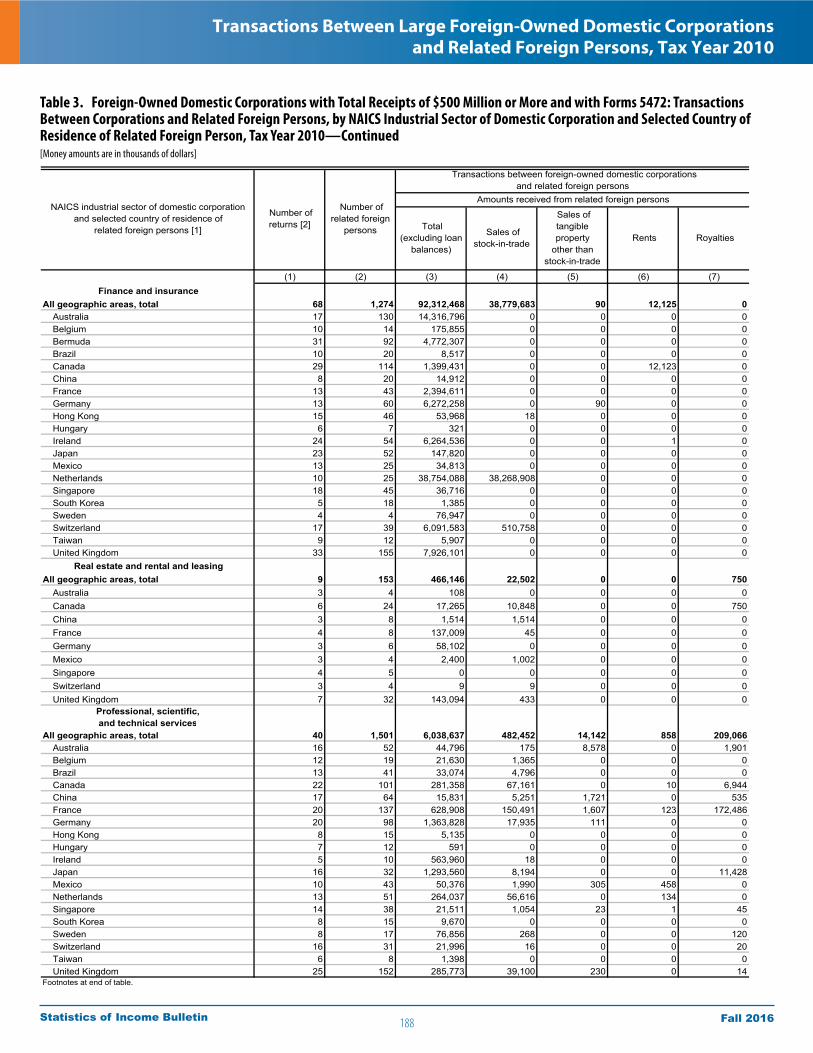
188
Transactions Between Large Foreign-Owned Domestic Corporations and Related Foreign Persons, Tax Year 2010
Fall 2016Statistics of Income Bulletin
Table 3. Foreign-Owned Domestic Corporations with Total Receipts of $500 Million or More and with Forms 5472: Transactions Between Corporations and Related Foreign Persons, by NAICS Industrial Sector of Domestic Corporation and Selected Country of Residence of Related Foreign Person, Tax Year 2010—Continued[Money amounts are in thousands of dollars]
(1) (2) (3) (4) (5) (6) (7)Finance and insurance
All geographic areas, total 68 1,274 92,312,468 38,779,683 90 12,125 0Australia 17 130 14,316,796 0 0 0 0Belgium 10 14 175,855 0 0 0 0Bermuda 31 92 4,772,307 0 0 0 0Brazil 10 20 8,517 0 0 0 0Canada 29 114 1,399,431 0 0 12,123 0China 8 20 14,912 0 0 0 0France 13 43 2,394,611 0 0 0 0Germany 13 60 6,272,258 0 90 0 0Hong Kong 15 46 53,968 18 0 0 0Hungary 6 7 321 0 0 0 0Ireland 24 54 6,264,536 0 0 1 0Japan 23 52 147,820 0 0 0 0Mexico 13 25 34,813 0 0 0 0Netherlands 10 25 38,754,088 38,268,908 0 0 0Singapore 18 45 36,716 0 0 0 0South Korea 5 18 1,385 0 0 0 0Sweden 4 4 76,947 0 0 0 0Switzerland 17 39 6,091,583 510,758 0 0 0Taiwan 9 12 5,907 0 0 0 0United Kingdom 33 155 7,926,101 0 0 0 0
Real estate and rental and leasingAll geographic areas, total 9 153 466,146 22,502 0 0 750
Australia 3 4 108 0 0 0 0Canada 6 24 17,265 10,848 0 0 750China 3 8 1,514 1,514 0 0 0France 4 8 137,009 45 0 0 0Germany 3 6 58,102 0 0 0 0Mexico 3 4 2,400 1,002 0 0 0Singapore 4 5 0 0 0 0 0Switzerland 3 4 9 9 0 0 0United Kingdom 7 32 143,094 433 0 0 0
Professional, scientific, and technical services
All geographic areas, total 40 1,501 6,038,637 482,452 14,142 858 209,066Australia 16 52 44,796 175 8,578 0 1,901Belgium 12 19 21,630 1,365 0 0 0Brazil 13 41 33,074 4,796 0 0 0Canada 22 101 281,358 67,161 0 10 6,944China 17 64 15,831 5,251 1,721 0 535France 20 137 628,908 150,491 1,607 123 172,486Germany 20 98 1,363,828 17,935 111 0 0Hong Kong 8 15 5,135 0 0 0 0Hungary 7 12 591 0 0 0 0Ireland 5 10 563,960 18 0 0 0Japan 16 32 1,293,560 8,194 0 0 11,428Mexico 10 43 50,376 1,990 305 458 0Netherlands 13 51 264,037 56,616 0 134 0Singapore 14 38 21,511 1,054 23 1 45South Korea 8 15 9,670 0 0 0 0Sweden 8 17 76,856 268 0 0 120Switzerland 16 31 21,996 16 0 0 20Taiwan 6 8 1,398 0 0 0 0United Kingdom 25 152 285,773 39,100 230 0 14
Footnotes at end of table.
NAICS industrial sector of domestic corporationand selected country of residence of
related foreign persons [1]
Number of returns [2]
Number of related foreign
persons
Transactions between foreign-owned domestic corporations and related foreign persons
Amounts received from related foreign persons
Total (excluding loan
balances)
Sales ofstock-in-trade
Sales oftangibleproperty
other thanstock-in-trade
Rents Royalties
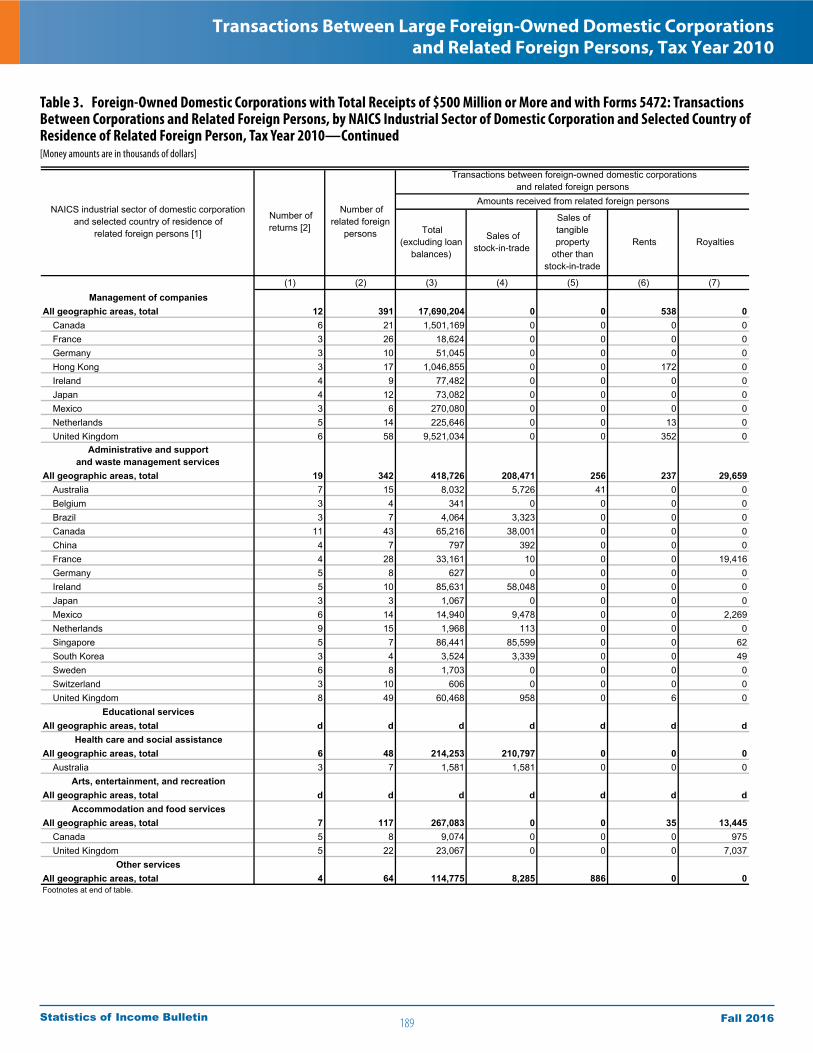
189
Transactions Between Large Foreign-Owned Domestic Corporations and Related Foreign Persons, Tax Year 2010
Fall 2016Statistics of Income Bulletin
Table 3. Foreign-Owned Domestic Corporations with Total Receipts of $500 Million or More and with Forms 5472: Transactions Between Corporations and Related Foreign Persons, by NAICS Industrial Sector of Domestic Corporation and Selected Country of Residence of Related Foreign Person, Tax Year 2010—Continued[Money amounts are in thousands of dollars]
(1) (2) (3) (4) (5) (6) (7)Management of companies
All geographic areas, total 12 391 17,690,204 0 0 538 0Canada 6 21 1,501,169 0 0 0 0France 3 26 18,624 0 0 0 0Germany 3 10 51,045 0 0 0 0Hong Kong 3 17 1,046,855 0 0 172 0Ireland 4 9 77,482 0 0 0 0Japan 4 12 73,082 0 0 0 0Mexico 3 6 270,080 0 0 0 0Netherlands 5 14 225,646 0 0 13 0United Kingdom 6 58 9,521,034 0 0 352 0
Administrative and supportand waste management services
All geographic areas, total 19 342 418,726 208,471 256 237 29,659Australia 7 15 8,032 5,726 41 0 0Belgium 3 4 341 0 0 0 0Brazil 3 7 4,064 3,323 0 0 0Canada 11 43 65,216 38,001 0 0 0China 4 7 797 392 0 0 0France 4 28 33,161 10 0 0 19,416Germany 5 8 627 0 0 0 0Ireland 5 10 85,631 58,048 0 0 0Japan 3 3 1,067 0 0 0 0Mexico 6 14 14,940 9,478 0 0 2,269Netherlands 9 15 1,968 113 0 0 0Singapore 5 7 86,441 85,599 0 0 62South Korea 3 4 3,524 3,339 0 0 49Sweden 6 8 1,703 0 0 0 0Switzerland 3 10 606 0 0 0 0United Kingdom 8 49 60,468 958 0 6 0
Educational servicesAll geographic areas, total d d d d d d d
Health care and social assistanceAll geographic areas, total 6 48 214,253 210,797 0 0 0
Australia 3 7 1,581 1,581 0 0 0Arts, entertainment, and recreation
All geographic areas, total d d d d d d dAccommodation and food services
All geographic areas, total 7 117 267,083 0 0 35 13,445Canada 5 8 9,074 0 0 0 975United Kingdom 5 22 23,067 0 0 0 7,037
Other servicesAll geographic areas, total 4 64 114,775 8,285 886 0 0Footnotes at end of table.
NAICS industrial sector of domestic corporationand selected country of residence of
related foreign persons [1]
Number of returns [2]
Number of related foreign
persons
Transactions between foreign-owned domestic corporations and related foreign persons
Amounts received from related foreign persons
Total (excluding loan
balances)
Sales ofstock-in-trade
Sales oftangibleproperty
other thanstock-in-trade
Rents Royalties

190
Transactions Between Large Foreign-Owned Domestic Corporations and Related Foreign Persons, Tax Year 2010
Fall 2016Statistics of Income Bulletin
Table 3. Foreign-Owned Domestic Corporations with Total Receipts of $500 Million or More and with Forms 5472: Transactions Between Corporations and Related Foreign Persons, by NAICS Industrial Sector of Domestic Corporation and Selected Country of Residence of Related Foreign Person, Tax Year 2010—Continued[Money amounts are in thousands of dollars]
(8) (9) (10) (11) (12) (13) (14) (15)All industries, total
All geographic areas, total 3,579,378 42,999,841 8,658,384 7,709,141 4,171,175 73,354,944 1,077,447,358 1,132,788,140Australia 56,254 341,435 12,712 50,491 29,687 14,632,579 9,877,849 19,273,236Belgium 6,592 468,518 6,841 174,901 2,044 61,955 25,228,379 29,936,553Bermuda 1,578 1,209,508 1,184,950 123,954 683,840 3,160,749 5,416,946 5,570,236Brazil 14,014 80,562 1,965 61,452 1,273 242,521 384,246 1,026,394Canada 82,161 3,445,417 78,956 546,611 145,002 4,933,402 34,137,266 32,463,075China 21,924 242,736 14,704 10,013 3,152 111,070 961,743 298,150France 79,796 1,948,470 162,286 996,985 41,767 2,560,311 55,451,982 51,291,394Germany 253,725 4,101,466 378,207 273,188 1,329,947 5,881,714 23,752,639 37,184,046Hong Kong 5,112 231,226 22,078 8,101 0 1,116,260 662,672 3,767,925Hungary 11,581 11,655 5 83 321 7,635 57,302,392 15,360,618Ireland 134,635 2,533,253 286,782 47,423 348,689 5,807,751 12,700,860 14,032,628Japan 140,926 4,706,661 698,780 76,315 10,528 1,943,613 20,628,395 29,753,889Mexico 6,284 491,498 11,185 23,128 340 491,584 1,016,294 3,314,446Netherlands 121,568 2,215,414 41,201 523,124 3,402 2,029,386 126,431,412 125,873,479Singapore 4,524 517,470 2,133,519 44,826 6,236 709,356 453,973 1,083,242South Korea 10,544 108,843 129,712 5,175 69 1,166,944 101,352 131,951Sweden 83,611 1,087,603 64,444 246,112 11,201 617,452 13,250,774 12,313,459Switzerland 1,626,877 5,516,415 2,100,013 554,857 252,618 4,435,263 233,418,262 273,103,215Taiwan 736 27,118 670 285 1,949 105,549 133,629 350,160United Kingdom 308,488 7,803,637 1,119,204 1,786,772 1,242,013 15,373,824 367,651,192 355,132,905
MiningAll geographic areas, total 98,011 1,966,287 5,584 415,430 16,388 1,257,798 24,899,071 35,952,133
Australia 0 32,629 0 1,013 3,779 334,820 2,684,562 12,618,703Belgium 0 973 0 1 2 469 1,090,181 1,230,144Bermuda 0 151,736 0 19,490 7,782 204 4,269,813 4,106,041Brazil 0 2,575 0 225 0 522 23,484 342,055Canada 0 543,000 0 181,404 368 187,839 1,737,267 1,802,562China 0 8,567 0 310 100 2,450 8,617 11,596France 0 46,659 42 163 188 27,851 697,793 629,098Germany 0 3,857 0 349 156 781 0 0Hungary 11,114 861 0 16 0 0 5,590,196 5,271,272Ireland 0 9,374 0 0 0 1,324 0 0Japan 0 1,767 0 0 33 10,135 343,813 364,397Mexico 0 34,308 0 3,847 25 16,886 219,604 5,336Netherlands 0 17,421 0 2,521 0 25,218 385,623 240,010Singapore 0 2,716 0 36 2,724 6,057 73,603 3,428Switzerland 84,394 131,765 5,442 30,153 98 67,004 4,482,074 4,388,057United Kingdom 0 61,493 0 44,053 97 46,396 2,239,246 3,754,670
UtilitiesAll geographic areas, total 0 76,670 0 4,897 14 192,807 19,123,641 19,034,016
Australia 0 0 0 0 0 0 201,227 201,227Canada 0 14,551 0 1,056 0 9,026 655,053 884,097France 0 645 0 0 0 0 385,000 435,000United Kingdom 0 46,074 0 3,841 0 176,401 11,629,504 14,352,583
ConstructionAll geographic areas, total 27,498 301,027 49 5,187 8,388 42,620 2,486,397 1,995,269
Australia 2,191 11,518 0 565 465 12,195 0 0Brazil 0 0 0 0 0 0 0 121Canada 5,122 75,107 0 61 898 524 2,021 22,072China 85 2,788 0 0 23 71 32 738Germany 1,038 1,214 0 0 245 132 350,104 427,740Singapore 953 5,327 0 0 398 814 12,997 0Taiwan 0 0 0 0 0 189 0 10,000United Kingdom 2,496 112,914 0 4,098 1,223 19,344 1,580,398 1,019,153
Footnotes at end of table.
NAICS industrial sector of domestic corporation
and selected country of residence ofrelated foreign persons [1]
Transactions between foreign-owned domestic corporations and related foreign persons—continued
Amounts received from related foreign persons—continued
Premiums for insurance or reinsurance
Sales, leases, and licenses of intangible
property rights
Considerationfor technical,
managerial, or like services
Commissions Interest Other
Amounts borrowed
Beginningbalance
Endingbalance
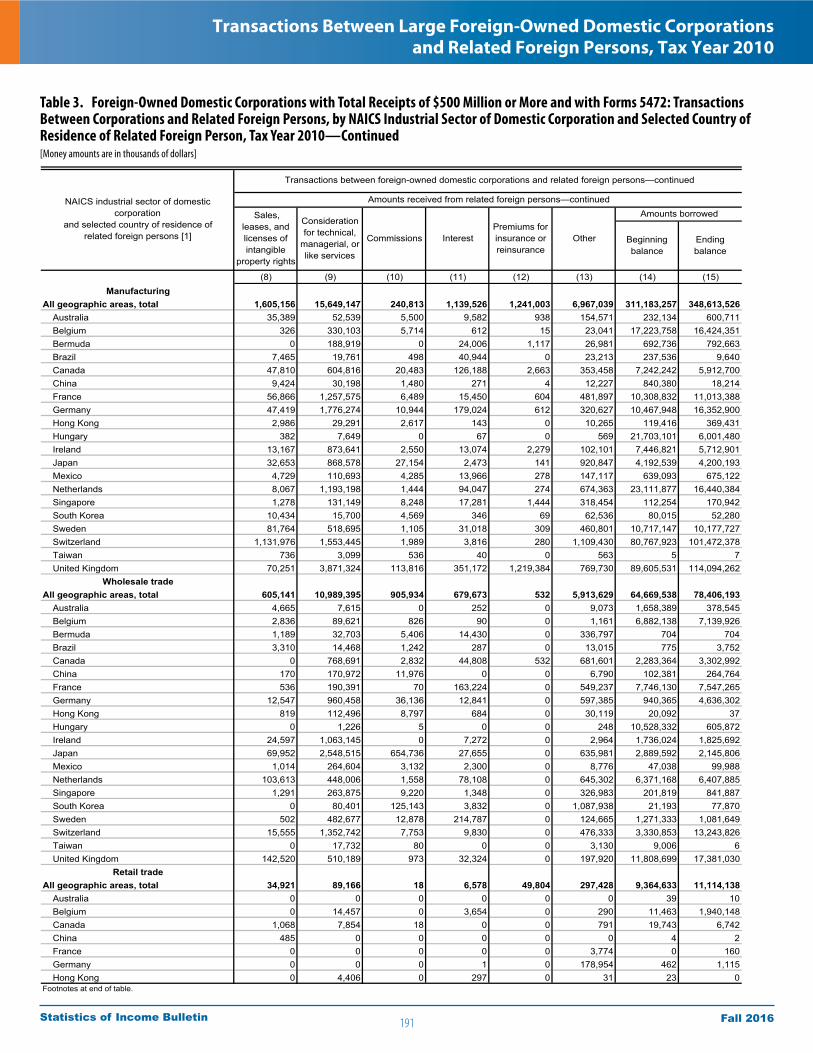
191
Transactions Between Large Foreign-Owned Domestic Corporations and Related Foreign Persons, Tax Year 2010
Fall 2016Statistics of Income Bulletin
Table 3. Foreign-Owned Domestic Corporations with Total Receipts of $500 Million or More and with Forms 5472: Transactions Between Corporations and Related Foreign Persons, by NAICS Industrial Sector of Domestic Corporation and Selected Country of Residence of Related Foreign Person, Tax Year 2010—Continued[Money amounts are in thousands of dollars]
(8) (9) (10) (11) (12) (13) (14) (15)Manufacturing
All geographic areas, total 1,605,156 15,649,147 240,813 1,139,526 1,241,003 6,967,039 311,183,257 348,613,526Australia 35,389 52,539 5,500 9,582 938 154,571 232,134 600,711Belgium 326 330,103 5,714 612 15 23,041 17,223,758 16,424,351Bermuda 0 188,919 0 24,006 1,117 26,981 692,736 792,663Brazil 7,465 19,761 498 40,944 0 23,213 237,536 9,640Canada 47,810 604,816 20,483 126,188 2,663 353,458 7,242,242 5,912,700China 9,424 30,198 1,480 271 4 12,227 840,380 18,214France 56,866 1,257,575 6,489 15,450 604 481,897 10,308,832 11,013,388Germany 47,419 1,776,274 10,944 179,024 612 320,627 10,467,948 16,352,900Hong Kong 2,986 29,291 2,617 143 0 10,265 119,416 369,431Hungary 382 7,649 0 67 0 569 21,703,101 6,001,480Ireland 13,167 873,641 2,550 13,074 2,279 102,101 7,446,821 5,712,901Japan 32,653 868,578 27,154 2,473 141 920,847 4,192,539 4,200,193Mexico 4,729 110,693 4,285 13,966 278 147,117 639,093 675,122Netherlands 8,067 1,193,198 1,444 94,047 274 674,363 23,111,877 16,440,384Singapore 1,278 131,149 8,248 17,281 1,444 318,454 112,254 170,942South Korea 10,434 15,700 4,569 346 69 62,536 80,015 52,280Sweden 81,764 518,695 1,105 31,018 309 460,801 10,717,147 10,177,727Switzerland 1,131,976 1,553,445 1,989 3,816 280 1,109,430 80,767,923 101,472,378Taiwan 736 3,099 536 40 0 563 5 7United Kingdom 70,251 3,871,324 113,816 351,172 1,219,384 769,730 89,605,531 114,094,262
Wholesale tradeAll geographic areas, total 605,141 10,989,395 905,934 679,673 532 5,913,629 64,669,538 78,406,193
Australia 4,665 7,615 0 252 0 9,073 1,658,389 378,545Belgium 2,836 89,621 826 90 0 1,161 6,882,138 7,139,926Bermuda 1,189 32,703 5,406 14,430 0 336,797 704 704Brazil 3,310 14,468 1,242 287 0 13,015 775 3,752Canada 0 768,691 2,832 44,808 532 681,601 2,283,364 3,302,992China 170 170,972 11,976 0 0 6,790 102,381 264,764France 536 190,391 70 163,224 0 549,237 7,746,130 7,547,265Germany 12,547 960,458 36,136 12,841 0 597,385 940,365 4,636,302Hong Kong 819 112,496 8,797 684 0 30,119 20,092 37Hungary 0 1,226 5 0 0 248 10,528,332 605,872Ireland 24,597 1,063,145 0 7,272 0 2,964 1,736,024 1,825,692Japan 69,952 2,548,515 654,736 27,655 0 635,981 2,889,592 2,145,806Mexico 1,014 264,604 3,132 2,300 0 8,776 47,038 99,988Netherlands 103,613 448,006 1,558 78,108 0 645,302 6,371,168 6,407,885Singapore 1,291 263,875 9,220 1,348 0 326,983 201,819 841,887South Korea 0 80,401 125,143 3,832 0 1,087,938 21,193 77,870Sweden 502 482,677 12,878 214,787 0 124,665 1,271,333 1,081,649Switzerland 15,555 1,352,742 7,753 9,830 0 476,333 3,330,853 13,243,826Taiwan 0 17,732 80 0 0 3,130 9,006 6United Kingdom 142,520 510,189 973 32,324 0 197,920 11,808,699 17,381,030
Retail tradeAll geographic areas, total 34,921 89,166 18 6,578 49,804 297,428 9,364,633 11,114,138
Australia 0 0 0 0 0 0 39 10Belgium 0 14,457 0 3,654 0 290 11,463 1,940,148Canada 1,068 7,854 18 0 0 791 19,743 6,742China 485 0 0 0 0 0 4 2France 0 0 0 0 0 3,774 0 160Germany 0 0 0 1 0 178,954 462 1,115Hong Kong 0 4,406 0 297 0 31 23 0
Footnotes at end of table.
Beginningbalance
Endingbalance
Other
Amounts borrowed Sales, leases, and licenses of intangible
property rights
Considerationfor technical,
managerial, or like services
Commissions InterestPremiums for insurance or reinsurance
NAICS industrial sector of domestic corporation
and selected country of residence ofrelated foreign persons [1]
Transactions between foreign-owned domestic corporations and related foreign persons—continued
Amounts received from related foreign persons—continued

192
Transactions Between Large Foreign-Owned Domestic Corporations and Related Foreign Persons, Tax Year 2010
Fall 2016Statistics of Income Bulletin
Table 3. Foreign-Owned Domestic Corporations with Total Receipts of $500 Million or More and with Forms 5472: Transactions Between Corporations and Related Foreign Persons, by NAICS Industrial Sector of Domestic Corporation and Selected Country of Residence of Related Foreign Person, Tax Year 2010—Continued[Money amounts are in thousands of dollars]
(8) (9) (10) (11) (12) (13) (14) (15)Japan 33,237 2 0 0 0 0 350,182 85Mexico 0 0 0 1,817 0 0 92,958 70,046Netherlands 0 117 0 0 0 0 4,026,891 2,336,925Singapore 0 54,581 0 0 0 8 0 0South Korea 0 1 0 0 0 0 0 0Sweden 0 0 0 0 0 0 206,000 0Switzerland 0 103 0 0 0 9,424 3,097,395 4,423,741United Kingdom 0 183 0 0 0 5,000 172,399 260,593
Transportation and warehousingAll geographic areas, total 0 412,724 2,266,367 5,436 0 3,476,632 13,312,800 13,514,217
Australia 0 8,428 0 0 0 59,392 0 0Belgium 0 2 2 0 0 35,534 14,779 0Brazil 0 15,855 0 0 0 63,927 2,598 1,581Canada 0 3,762 0 1,396 0 2,328,273 1,098,556 228,864China 0 11,532 1,221 0 0 86,255 0 849France 0 6,233 0 0 0 31,535 0 0Germany 0 27,110 196 0 0 106,320 366,830 279,617Hong Kong 0 13,872 210 0 0 49,701 0 0Hungary 0 919 0 0 0 6,817 4,524,586 0Ireland 0 468 0 0 0 13,580 0 0Japan 0 118,664 0 0 0 111,826 5,282 8,778Mexico 0 568 0 0 0 38,230 1 0Netherlands 0 3,126 1 1,159 0 19,284 549,376 424,020Singapore 0 29,349 2,113,138 506 0 37,677 38 0South Korea 0 2,091 0 0 0 16,179 0 1,582Sweden 0 435 0 0 0 12,557 0 0Switzerland 0 1,055 0 0 0 64,106 0 4,258,221Taiwan 0 2,639 38 0 0 6,842 0 0United Kingdom 0 99,614 123 2,258 0 52,258 4,737,355 4,742,769
InformationAll geographic areas, total 544,642 4,748,344 0 164,778 8,823 472,296 47,188,815 51,481,258
Australia 7,299 4,868 0 106 0 1,560 3,538 1,001Belgium 3,430 2,569 0 0 0 190 4,894 650Bermuda 0 119,851 0 1,527 8,823 183 1,046 1,565Brazil 3,239 2,088 0 43 0 1,595 2,043 22Canada 20,289 26,696 0 5,080 0 22,134 430,985 400,176China 0 870 0 0 0 2 0 18France 10,670 25,982 0 986 0 12,356 2,370,475 3,264,939Germany 13,351 25,633 0 17,156 0 18,733 221,915 158,776Hong Kong 1 7,230 0 136 0 16 229 0Hungary 85 410 0 0 0 0 67,152 71,504Ireland 0 26,953 0 0 0 208 3,460 0Japan 5,030 5,175 0 0 0 6,300 10 168Mexico 330 3,712 0 0 0 0 0 4Netherlands 6,312 293,587 0 3,485 0 297,244 14,042,059 20,298,570Singapore 57 4,102 0 365 0 151 16,011 16,103South Korea 110 540 0 0 0 0 0 0Sweden 1,345 1,239 0 98 0 457 154 0Switzerland 394,751 2,366,732 0 0 0 539 16,463,784 14,718,246Taiwan 0 21 0 0 0 0 0 0United Kingdom 57,484 1,578,676 0 88,673 0 34,114 11,542,748 9,630,192
Footnotes at end of table.
Transactions between foreign-owned domestic corporations and related foreign persons—continued
Amounts received from related foreign persons—continued
Sales, leases, and licenses of intangible
property rights
Considerationfor technical,
managerial, or like services
Commissions InterestPremiums for insurance or reinsurance
Other
Amounts borrowed
Beginningbalance
Endingbalance
NAICS industrial sector of domestic corporation
and selected country of residence ofrelated foreign persons [1]
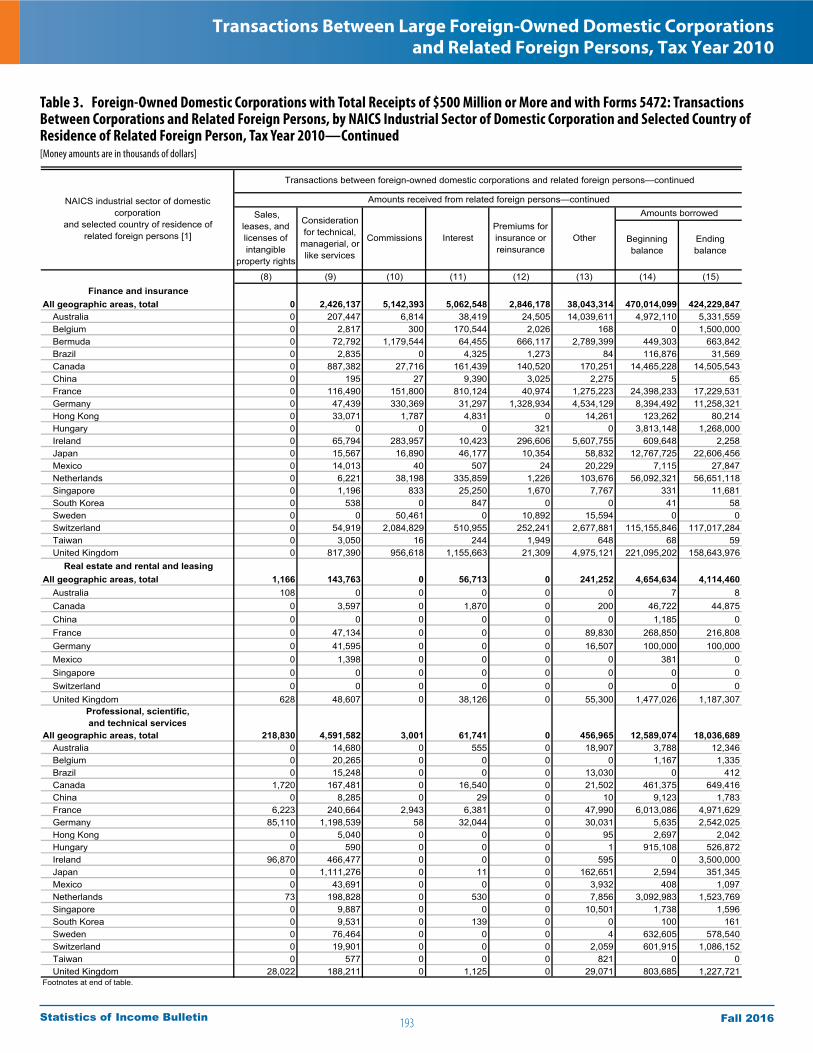
193
Transactions Between Large Foreign-Owned Domestic Corporations and Related Foreign Persons, Tax Year 2010
Fall 2016Statistics of Income Bulletin
Table 3. Foreign-Owned Domestic Corporations with Total Receipts of $500 Million or More and with Forms 5472: Transactions Between Corporations and Related Foreign Persons, by NAICS Industrial Sector of Domestic Corporation and Selected Country of Residence of Related Foreign Person, Tax Year 2010—Continued[Money amounts are in thousands of dollars]
(8) (9) (10) (11) (12) (13) (14) (15)Finance and insurance
All geographic areas, total 0 2,426,137 5,142,393 5,062,548 2,846,178 38,043,314 470,014,099 424,229,847Australia 0 207,447 6,814 38,419 24,505 14,039,611 4,972,110 5,331,559Belgium 0 2,817 300 170,544 2,026 168 0 1,500,000Bermuda 0 72,792 1,179,544 64,455 666,117 2,789,399 449,303 663,842Brazil 0 2,835 0 4,325 1,273 84 116,876 31,569Canada 0 887,382 27,716 161,439 140,520 170,251 14,465,228 14,505,543China 0 195 27 9,390 3,025 2,275 5 65France 0 116,490 151,800 810,124 40,974 1,275,223 24,398,233 17,229,531Germany 0 47,439 330,369 31,297 1,328,934 4,534,129 8,394,492 11,258,321Hong Kong 0 33,071 1,787 4,831 0 14,261 123,262 80,214Hungary 0 0 0 0 321 0 3,813,148 1,268,000Ireland 0 65,794 283,957 10,423 296,606 5,607,755 609,648 2,258Japan 0 15,567 16,890 46,177 10,354 58,832 12,767,725 22,606,456Mexico 0 14,013 40 507 24 20,229 7,115 27,847Netherlands 0 6,221 38,198 335,859 1,226 103,676 56,092,321 56,651,118Singapore 0 1,196 833 25,250 1,670 7,767 331 11,681South Korea 0 538 0 847 0 0 41 58Sweden 0 0 50,461 0 10,892 15,594 0 0Switzerland 0 54,919 2,084,829 510,955 252,241 2,677,881 115,155,846 117,017,284Taiwan 0 3,050 16 244 1,949 648 68 59United Kingdom 0 817,390 956,618 1,155,663 21,309 4,975,121 221,095,202 158,643,976
Real estate and rental and leasingAll geographic areas, total 1,166 143,763 0 56,713 0 241,252 4,654,634 4,114,460
Australia 108 0 0 0 0 0 7 8Canada 0 3,597 0 1,870 0 200 46,722 44,875China 0 0 0 0 0 0 1,185 0France 0 47,134 0 0 0 89,830 268,850 216,808Germany 0 41,595 0 0 0 16,507 100,000 100,000Mexico 0 1,398 0 0 0 0 381 0Singapore 0 0 0 0 0 0 0 0Switzerland 0 0 0 0 0 0 0 0United Kingdom 628 48,607 0 38,126 0 55,300 1,477,026 1,187,307
Professional, scientific, and technical services
All geographic areas, total 218,830 4,591,582 3,001 61,741 0 456,965 12,589,074 18,036,689Australia 0 14,680 0 555 0 18,907 3,788 12,346Belgium 0 20,265 0 0 0 0 1,167 1,335Brazil 0 15,248 0 0 0 13,030 0 412Canada 1,720 167,481 0 16,540 0 21,502 461,375 649,416China 0 8,285 0 29 0 10 9,123 1,783France 6,223 240,664 2,943 6,381 0 47,990 6,013,086 4,971,629Germany 85,110 1,198,539 58 32,044 0 30,031 5,635 2,542,025Hong Kong 0 5,040 0 0 0 95 2,697 2,042Hungary 0 590 0 0 0 1 915,108 526,872Ireland 96,870 466,477 0 0 0 595 0 3,500,000Japan 0 1,111,276 0 11 0 162,651 2,594 351,345Mexico 0 43,691 0 0 0 3,932 408 1,097Netherlands 73 198,828 0 530 0 7,856 3,092,983 1,523,769Singapore 0 9,887 0 0 0 10,501 1,738 1,596South Korea 0 9,531 0 139 0 0 100 161Sweden 0 76,464 0 0 0 4 632,605 578,540Switzerland 0 19,901 0 0 0 2,059 601,915 1,086,152Taiwan 0 577 0 0 0 821 0 0United Kingdom 28,022 188,211 0 1,125 0 29,071 803,685 1,227,721
Footnotes at end of table.
Sales, leases, and licenses of intangible
property rights
Considerationfor technical,
managerial, or like services
Commissions InterestPremiums for insurance or reinsurance
Other
Amounts borrowed
Beginningbalance
Endingbalance
NAICS industrial sector of domestic corporation
and selected country of residence ofrelated foreign persons [1]
Transactions between foreign-owned domestic corporations and related foreign persons—continued
Amounts received from related foreign persons—continued
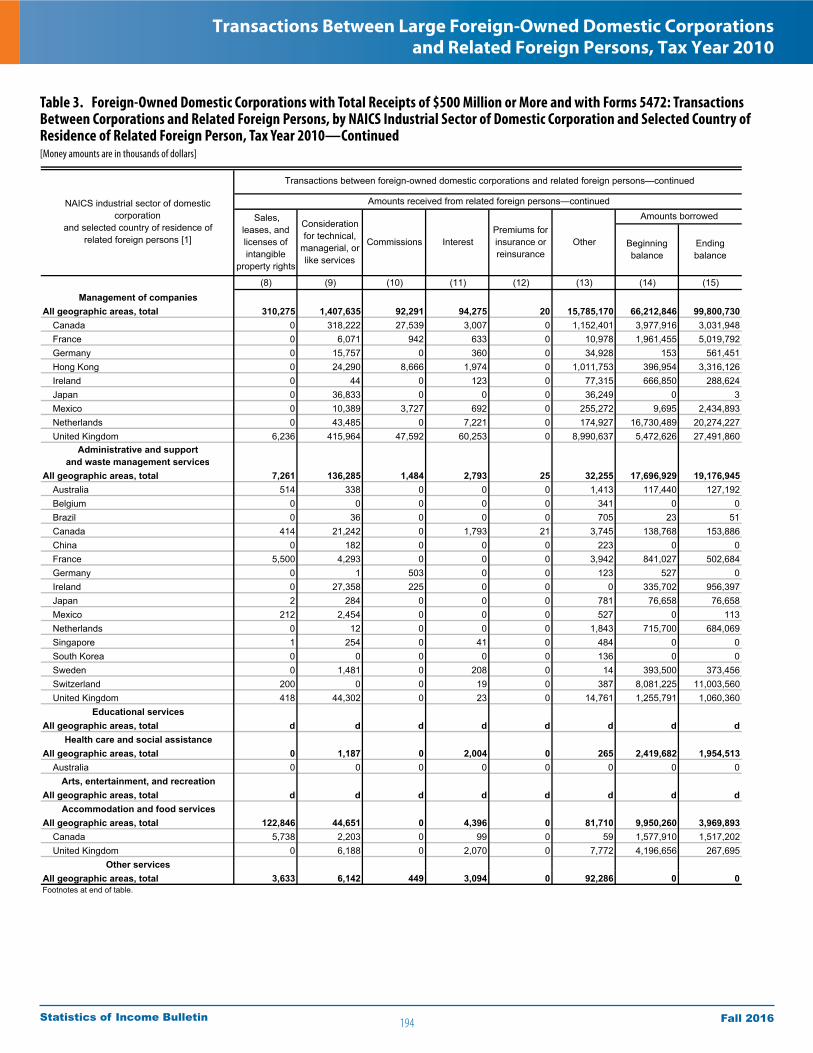
194
Transactions Between Large Foreign-Owned Domestic Corporations and Related Foreign Persons, Tax Year 2010
Fall 2016Statistics of Income Bulletin
Table 3. Foreign-Owned Domestic Corporations with Total Receipts of $500 Million or More and with Forms 5472: Transactions Between Corporations and Related Foreign Persons, by NAICS Industrial Sector of Domestic Corporation and Selected Country of Residence of Related Foreign Person, Tax Year 2010—Continued[Money amounts are in thousands of dollars]
(8) (9) (10) (11) (12) (13) (14) (15)Management of companies
All geographic areas, total 310,275 1,407,635 92,291 94,275 20 15,785,170 66,212,846 99,800,730Canada 0 318,222 27,539 3,007 0 1,152,401 3,977,916 3,031,948France 0 6,071 942 633 0 10,978 1,961,455 5,019,792Germany 0 15,757 0 360 0 34,928 153 561,451Hong Kong 0 24,290 8,666 1,974 0 1,011,753 396,954 3,316,126Ireland 0 44 0 123 0 77,315 666,850 288,624Japan 0 36,833 0 0 0 36,249 0 3Mexico 0 10,389 3,727 692 0 255,272 9,695 2,434,893Netherlands 0 43,485 0 7,221 0 174,927 16,730,489 20,274,227United Kingdom 6,236 415,964 47,592 60,253 0 8,990,637 5,472,626 27,491,860
Administrative and supportand waste management services
All geographic areas, total 7,261 136,285 1,484 2,793 25 32,255 17,696,929 19,176,945Australia 514 338 0 0 0 1,413 117,440 127,192Belgium 0 0 0 0 0 341 0 0Brazil 0 36 0 0 0 705 23 51Canada 414 21,242 0 1,793 21 3,745 138,768 153,886China 0 182 0 0 0 223 0 0France 5,500 4,293 0 0 0 3,942 841,027 502,684Germany 0 1 503 0 0 123 527 0Ireland 0 27,358 225 0 0 0 335,702 956,397Japan 2 284 0 0 0 781 76,658 76,658Mexico 212 2,454 0 0 0 527 0 113Netherlands 0 12 0 0 0 1,843 715,700 684,069Singapore 1 254 0 41 0 484 0 0South Korea 0 0 0 0 0 136 0 0Sweden 0 1,481 0 208 0 14 393,500 373,456Switzerland 200 0 0 19 0 387 8,081,225 11,003,560United Kingdom 418 44,302 0 23 0 14,761 1,255,791 1,060,360
Educational servicesAll geographic areas, total d d d d d d d d
Health care and social assistanceAll geographic areas, total 0 1,187 0 2,004 0 265 2,419,682 1,954,513
Australia 0 0 0 0 0 0 0 0Arts, entertainment, and recreation
All geographic areas, total d d d d d d d dAccommodation and food services
All geographic areas, total 122,846 44,651 0 4,396 0 81,710 9,950,260 3,969,893Canada 5,738 2,203 0 99 0 59 1,577,910 1,517,202United Kingdom 0 6,188 0 2,070 0 7,772 4,196,656 267,695
Other servicesAll geographic areas, total 3,633 6,142 449 3,094 0 92,286 0 0Footnotes at end of table.
Beginningbalance
Endingbalance
Amounts received from related foreign persons—continued
Sales, leases, and licenses of intangible
property rights
Considerationfor technical,
managerial, or like services
Commissions InterestPremiums for insurance or reinsurance
Other
Amounts borrowedNAICS industrial sector of domestic
corporationand selected country of residence of
related foreign persons [1]
Transactions between foreign-owned domestic corporations and related foreign persons—continued

195
Transactions Between Large Foreign-Owned Domestic Corporations and Related Foreign Persons, Tax Year 2010
Fall 2016Statistics of Income Bulletin
Table 3. Foreign-Owned Domestic Corporations with Total Receipts of $500 Million or More and with Forms 5472: Transactions Between Corporations and Related Foreign Persons, by NAICS Industrial Sector of Domestic Corporation and Selected Country of Residence of Related Foreign Person, Tax Year 2010—Continued[Money amounts are in thousands of dollars]
(16) (17) (18) (19) (20) (21) (22)All industries, total
All geographic areas, total 841,465,694 632,860,285 8,101,821 1,497,309 10,795,397 11,929,102 35,723,454Australia 17,628,246 709,957 931 3,041 32,687 76,546 449,737Belgium 5,553,728 2,842,542 854 24,962 121,846 15,232 415,739Bermuda 12,282,509 3,744,222 25,521 1,866 4,171 0 187,674Brazil 2,258,414 1,717,833 4,413 20 1,343 5,103 80,911Canada 58,852,567 45,588,640 2,228,557 117,561 67,191 341,833 4,967,936China 4,857,312 4,202,154 25,784 208 19 0 222,736France 28,339,364 19,664,237 106,765 6,924 1,312,229 545,797 2,191,603Germany 58,968,030 42,477,889 552,368 6,390 823,603 1,676,960 1,558,557Hong Kong 7,309,030 6,088,879 47,041 353 576 0 161,857Hungary 16,049,250 2,057,617 580 278,737 42,125 50,983 164,453Ireland 15,908,281 8,552,341 13,407 12,479 270,901 378,925 294,377Japan 145,387,896 133,350,408 3,063,429 8,331 4,529,356 2,254,255 927,457Mexico 14,074,287 12,635,623 175,968 379 113,805 20,218 880,655Netherlands 60,033,558 52,013,345 112,029 6,401 163,344 222,328 1,180,714Singapore 16,092,128 10,864,891 95,932 0 82 72 292,461South Korea 53,223,169 50,449,853 192,791 120 249,401 164,945 1,927,552Sweden 7,238,973 5,355,147 10,969 0 488,525 61,233 373,447Switzerland 72,606,692 40,555,690 1,232,671 666,855 1,959,528 4,611,206 1,448,534Taiwan 23,506,135 23,385,420 32 0 59 0 62,715United Kingdom 125,854,864 97,491,437 69,882 158,614 529,421 653,078 7,529,800
MiningAll geographic areas, total 15,511,227 9,673,686 1,543,255 1,116,561 1,500 19,888 830,971
Australia 508,962 1,800 0 1 0 0 182,016Belgium 123,597 0 0 0 0 0 2,961Bermuda 671,807 39,005 25,521 1,030 0 0 4,830Brazil 52,883 30,745 0 0 0 0 4,971Canada 5,506,478 4,880,762 130,767 43,894 0 67 100,069China 97,916 91,158 3,801 6 0 0 24France 106,285 11,937 16,048 321 79 17,913 24,100Germany 5,600 1,524 161 0 0 0 2,753Hungary 581,666 0 0 278,737 0 0 0Ireland 3,225 0 0 2,218 0 0 0Japan 120,930 8,325 6,953 806 0 0 918Mexico 80,185 1,615 67,857 27 0 0 8,363Netherlands 25,091 126 0 0 0 0 134Singapore 142,776 11,146 92,523 0 0 0 30,601Switzerland 3,401,195 1,359,282 1,156,555 666,496 0 0 11,456United Kingdom 397,557 201,144 27,114 13,655 70 0 100,375
UtilitiesAll geographic areas, total 6,242,570 1,950,168 592,765 0 27,001 760 249,049
Australia 26,523 0 0 0 0 0 0Canada 1,916,247 1,077,697 592,765 0 27,001 760 173,051France 213,501 111,905 0 0 0 0 7,567United Kingdom 1,079,253 460,224 0 0 0 0 55,461
ConstructionAll geographic areas, total 636,673 250,862 8,011 37,322 22,898 10,701 121,669
Australia 19,233 0 0 0 0 0 583Brazil 43 0 0 0 0 0 0Canada 22,084 0 324 0 0 0 21,617China 4,275 0 0 0 0 0 4,275Germany 55,502 0 1,702 0 0 0 5,817Singapore 50 0 0 0 0 0 50Taiwan 63 0 0 0 0 0 11United Kingdom 119,296 0 5,191 0 0 0 6,960
Footnotes at end of table.
NAICS industrial sector of domestic corporation and selected country of residence of related
foreign persons [1]
Transactions between foreign-owned domestic corporations and related foreign persons—continued
Amounts paid to related foreign persons
Total (excluding loan
balances)
Purchasesof
stock-in-trade
Purchasesof tangible property
other thanstock-in-trade
Royalties
Purchases, leases, and licenses of intangible
property rights
Consideration for technical,
managerial, or like services
Rents
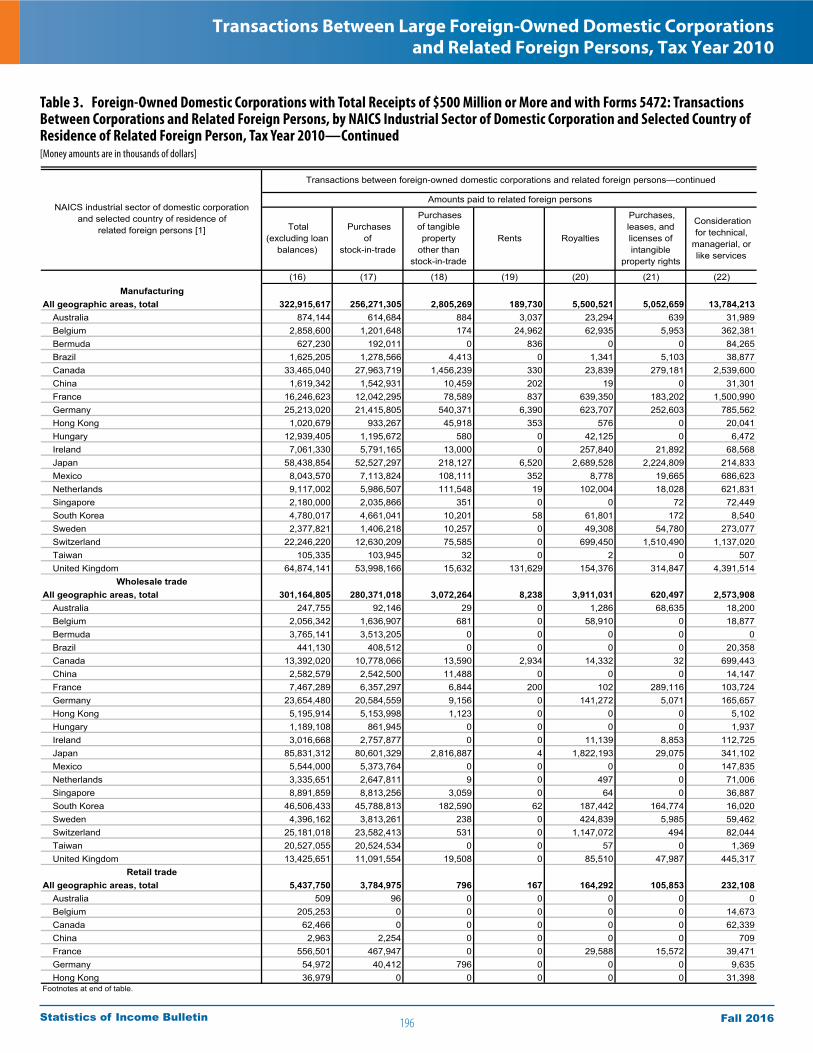
196
Transactions Between Large Foreign-Owned Domestic Corporations and Related Foreign Persons, Tax Year 2010
Fall 2016Statistics of Income Bulletin
Table 3. Foreign-Owned Domestic Corporations with Total Receipts of $500 Million or More and with Forms 5472: Transactions Between Corporations and Related Foreign Persons, by NAICS Industrial Sector of Domestic Corporation and Selected Country of Residence of Related Foreign Person, Tax Year 2010—Continued[Money amounts are in thousands of dollars]
(16) (17) (18) (19) (20) (21) (22)Manufacturing
All geographic areas, total 322,915,617 256,271,305 2,805,269 189,730 5,500,521 5,052,659 13,784,213Australia 874,144 614,684 884 3,037 23,294 639 31,989Belgium 2,858,600 1,201,648 174 24,962 62,935 5,953 362,381Bermuda 627,230 192,011 0 836 0 0 84,265Brazil 1,625,205 1,278,566 4,413 0 1,341 5,103 38,877Canada 33,465,040 27,963,719 1,456,239 330 23,839 279,181 2,539,600China 1,619,342 1,542,931 10,459 202 19 0 31,301France 16,246,623 12,042,295 78,589 837 639,350 183,202 1,500,990Germany 25,213,020 21,415,805 540,371 6,390 623,707 252,603 785,562Hong Kong 1,020,679 933,267 45,918 353 576 0 20,041Hungary 12,939,405 1,195,672 580 0 42,125 0 6,472Ireland 7,061,330 5,791,165 13,000 0 257,840 21,892 68,568Japan 58,438,854 52,527,297 218,127 6,520 2,689,528 2,224,809 214,833Mexico 8,043,570 7,113,824 108,111 352 8,778 19,665 686,623Netherlands 9,117,002 5,986,507 111,548 19 102,004 18,028 621,831Singapore 2,180,000 2,035,866 351 0 0 72 72,449South Korea 4,780,017 4,661,041 10,201 58 61,801 172 8,540Sweden 2,377,821 1,406,218 10,257 0 49,308 54,780 273,077Switzerland 22,246,220 12,630,209 75,585 0 699,450 1,510,490 1,137,020Taiwan 105,335 103,945 32 0 2 0 507United Kingdom 64,874,141 53,998,166 15,632 131,629 154,376 314,847 4,391,514
Wholesale tradeAll geographic areas, total 301,164,805 280,371,018 3,072,264 8,238 3,911,031 620,497 2,573,908
Australia 247,755 92,146 29 0 1,286 68,635 18,200Belgium 2,056,342 1,636,907 681 0 58,910 0 18,877Bermuda 3,765,141 3,513,205 0 0 0 0 0Brazil 441,130 408,512 0 0 0 0 20,358Canada 13,392,020 10,778,066 13,590 2,934 14,332 32 699,443China 2,582,579 2,542,500 11,488 0 0 0 14,147France 7,467,289 6,357,297 6,844 200 102 289,116 103,724Germany 23,654,480 20,584,559 9,156 0 141,272 5,071 165,657Hong Kong 5,195,914 5,153,998 1,123 0 0 0 5,102Hungary 1,189,108 861,945 0 0 0 0 1,937Ireland 3,016,668 2,757,877 0 0 11,139 8,853 112,725Japan 85,831,312 80,601,329 2,816,887 4 1,822,193 29,075 341,102Mexico 5,544,000 5,373,764 0 0 0 0 147,835Netherlands 3,335,651 2,647,811 9 0 497 0 71,006Singapore 8,891,859 8,813,256 3,059 0 64 0 36,887South Korea 46,506,433 45,788,813 182,590 62 187,442 164,774 16,020Sweden 4,396,162 3,813,261 238 0 424,839 5,985 59,462Switzerland 25,181,018 23,582,413 531 0 1,147,072 494 82,044Taiwan 20,527,055 20,524,534 0 0 57 0 1,369United Kingdom 13,425,651 11,091,554 19,508 0 85,510 47,987 445,317
Retail tradeAll geographic areas, total 5,437,750 3,784,975 796 167 164,292 105,853 232,108
Australia 509 96 0 0 0 0 0Belgium 205,253 0 0 0 0 0 14,673Canada 62,466 0 0 0 0 0 62,339China 2,963 2,254 0 0 0 0 709France 556,501 467,947 0 0 29,588 15,572 39,471Germany 54,972 40,412 796 0 0 0 9,635Hong Kong 36,979 0 0 0 0 0 31,398
Footnotes at end of table.
Rents Royalties
Purchases, leases, and licenses of intangible
property rights
Consideration for technical,
managerial, or like services
Total (excluding loan
balances)
Purchasesof
stock-in-trade
Purchasesof tangible property
other thanstock-in-trade
NAICS industrial sector of domestic corporationand selected country of residence of
related foreign persons [1]
Transactions between foreign-owned domestic corporations and related foreign persons—continued
Amounts paid to related foreign persons
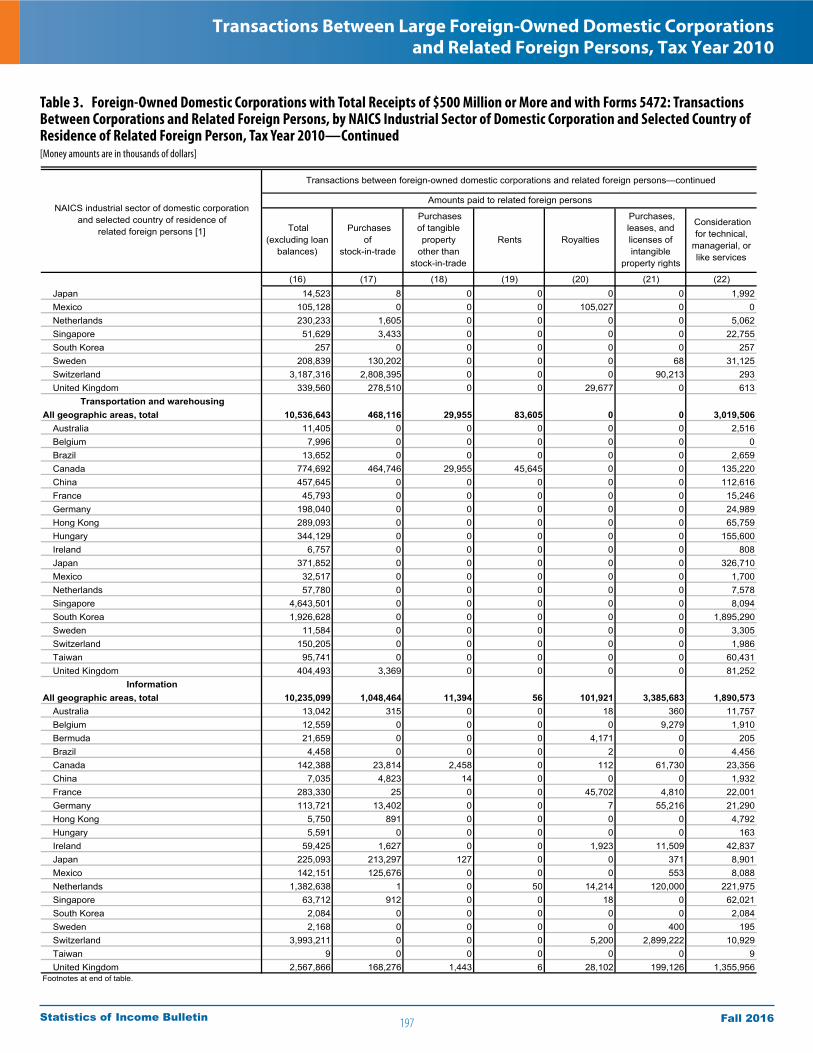
197
Transactions Between Large Foreign-Owned Domestic Corporations and Related Foreign Persons, Tax Year 2010
Fall 2016Statistics of Income Bulletin
Table 3. Foreign-Owned Domestic Corporations with Total Receipts of $500 Million or More and with Forms 5472: Transactions Between Corporations and Related Foreign Persons, by NAICS Industrial Sector of Domestic Corporation and Selected Country of Residence of Related Foreign Person, Tax Year 2010—Continued[Money amounts are in thousands of dollars]
(16) (17) (18) (19) (20) (21) (22)Japan 14,523 8 0 0 0 0 1,992Mexico 105,128 0 0 0 105,027 0 0Netherlands 230,233 1,605 0 0 0 0 5,062Singapore 51,629 3,433 0 0 0 0 22,755South Korea 257 0 0 0 0 0 257Sweden 208,839 130,202 0 0 0 68 31,125Switzerland 3,187,316 2,808,395 0 0 0 90,213 293United Kingdom 339,560 278,510 0 0 29,677 0 613
Transportation and warehousingAll geographic areas, total 10,536,643 468,116 29,955 83,605 0 0 3,019,506
Australia 11,405 0 0 0 0 0 2,516Belgium 7,996 0 0 0 0 0 0Brazil 13,652 0 0 0 0 0 2,659Canada 774,692 464,746 29,955 45,645 0 0 135,220China 457,645 0 0 0 0 0 112,616France 45,793 0 0 0 0 0 15,246Germany 198,040 0 0 0 0 0 24,989Hong Kong 289,093 0 0 0 0 0 65,759Hungary 344,129 0 0 0 0 0 155,600Ireland 6,757 0 0 0 0 0 808Japan 371,852 0 0 0 0 0 326,710Mexico 32,517 0 0 0 0 0 1,700Netherlands 57,780 0 0 0 0 0 7,578Singapore 4,643,501 0 0 0 0 0 8,094South Korea 1,926,628 0 0 0 0 0 1,895,290Sweden 11,584 0 0 0 0 0 3,305Switzerland 150,205 0 0 0 0 0 1,986Taiwan 95,741 0 0 0 0 0 60,431United Kingdom 404,493 3,369 0 0 0 0 81,252
InformationAll geographic areas, total 10,235,099 1,048,464 11,394 56 101,921 3,385,683 1,890,573
Australia 13,042 315 0 0 18 360 11,757Belgium 12,559 0 0 0 0 9,279 1,910Bermuda 21,659 0 0 0 4,171 0 205Brazil 4,458 0 0 0 2 0 4,456Canada 142,388 23,814 2,458 0 112 61,730 23,356China 7,035 4,823 14 0 0 0 1,932France 283,330 25 0 0 45,702 4,810 22,001Germany 113,721 13,402 0 0 7 55,216 21,290Hong Kong 5,750 891 0 0 0 0 4,792Hungary 5,591 0 0 0 0 0 163Ireland 59,425 1,627 0 0 1,923 11,509 42,837Japan 225,093 213,297 127 0 0 371 8,901Mexico 142,151 125,676 0 0 0 553 8,088Netherlands 1,382,638 1 0 50 14,214 120,000 221,975Singapore 63,712 912 0 0 18 0 62,021South Korea 2,084 0 0 0 0 0 2,084Sweden 2,168 0 0 0 0 400 195Switzerland 3,993,211 0 0 0 5,200 2,899,222 10,929Taiwan 9 0 0 0 0 0 9United Kingdom 2,567,866 168,276 1,443 6 28,102 199,126 1,355,956
Footnotes at end of table.
Purchasesof
stock-in-trade
Purchasesof tangible property
other thanstock-in-trade
Rents Royalties
Purchases, leases, and licenses of intangible
property rights
NAICS industrial sector of domestic corporationand selected country of residence of
related foreign persons [1]
Transactions between foreign-owned domestic corporations and related foreign persons—continued
Amounts paid to related foreign persons
Total (excluding loan
balances)
Consideration for technical,
managerial, or like services

198
Transactions Between Large Foreign-Owned Domestic Corporations and Related Foreign Persons, Tax Year 2010
Fall 2016Statistics of Income Bulletin
Table 3. Foreign-Owned Domestic Corporations with Total Receipts of $500 Million or More and with Forms 5472: Transactions Between Corporations and Related Foreign Persons, by NAICS Industrial Sector of Domestic Corporation and Selected Country of Residence of Related Foreign Person, Tax Year 2010—Continued[Money amounts are in thousands of dollars]
(16) (17) (18) (19) (20) (21) (22)Finance and insurance
All geographic areas, total 136,428,362 74,270,270 0 11,568 76,663 73,627 2,244,491Australia 15,832,969 0 0 2 0 6,886 141,549Belgium 204,213 0 0 0 0 0 5,106Bermuda 7,169,762 0 0 0 0 0 93,928Brazil 44,811 0 0 0 0 0 0Canada 1,279,217 0 0 3 11 32 594,281China 7,358 0 0 0 0 0 66France 833,289 0 0 0 0 1,260 29,225Germany 6,889,796 0 0 0 0 0 36,098Hong Kong 137,034 0 0 0 0 0 7,961Hungary 207,206 0 0 0 0 0 0Ireland 4,386,059 0 0 10,262 0 0 41,388Japan 298,997 0 0 0 0 0 11,029Mexico 12,724 0 0 0 0 0 1,003Netherlands 44,318,353 43,141,095 0 0 0 0 42,232Singapore 59,720 0 0 0 0 0 1,483South Korea 110 0 0 0 0 0 57Sweden 142,456 0 0 0 0 0 0Switzerland 13,176,788 0 0 0 20,289 39,286 157,044Taiwan 844 0 0 0 0 0 0United Kingdom 38,255,566 31,129,175 0 1,302 56,363 23,312 38,807
Real estate and rental and leasingAll geographic areas, total 1,238,853 584,414 0 0 0 23,707 35,991
Australia 0 0 0 0 0 0 0Canada 13,474 8,771 0 0 0 0 1,900China 0 0 0 0 0 0 0France 22,721 127 0 0 0 0 15,301Germany 214,948 210,511 0 0 0 0 0Mexico 499 499 0 0 0 0 0Singapore 18 18 0 0 0 0 0Switzerland 1,749 1,749 0 0 0 0 0United Kingdom 283,411 125,528 0 0 0 318 8,862
Professional, scientific, and technical services
All geographic areas, total 13,333,511 1,245,177 30,124 49,897 742,598 1,734,440 8,064,416Australia 65,888 284 0 2 8,089 0 56,023Belgium 5,918 2,831 0 0 1 0 3,086Brazil 8,764 10 0 0 0 0 7,313Canada 808,786 371,213 0 24,755 1,896 0 320,888China 45,703 18,467 21 0 0 0 27,019France 1,974,023 672,704 484 5,566 497,489 13,634 381,096Germany 2,373,736 133,016 182 0 43,785 1,364,070 490,515Hong Kong 6,801 0 0 0 0 0 5,535Hungary 45,500 0 0 0 0 0 280Ireland 465,888 52 408 0 0 336,573 16,214Japan 55,725 153 21,335 855 17,635 0 6,949Mexico 17,684 1,573 0 0 0 0 15,135Netherlands 385,510 161 472 6,332 0 10,758 166,780Singapore 14,412 135 0 0 0 0 13,961South Korea 291 0 0 0 158 0 133Sweden 44,091 0 0 0 0 0 5,765Switzerland 58,437 1,484 0 359 0 0 30,013Taiwan 391 0 0 0 0 0 388United Kingdom 607,088 26,748 758 12,022 168,792 9,318 258,741
Footnotes at end of table.
Purchases, leases, and licenses of intangible
property rights
Amounts paid to related foreign persons
Total (excluding loan
balances)
Consideration for technical,
managerial, or like services
Purchasesof
stock-in-trade
Purchasesof tangible property
other thanstock-in-trade
Rents Royalties
NAICS industrial sector of domestic corporationand selected country of residence of
related foreign persons [1]
Transactions between foreign-owned domestic corporations and related foreign persons—continued
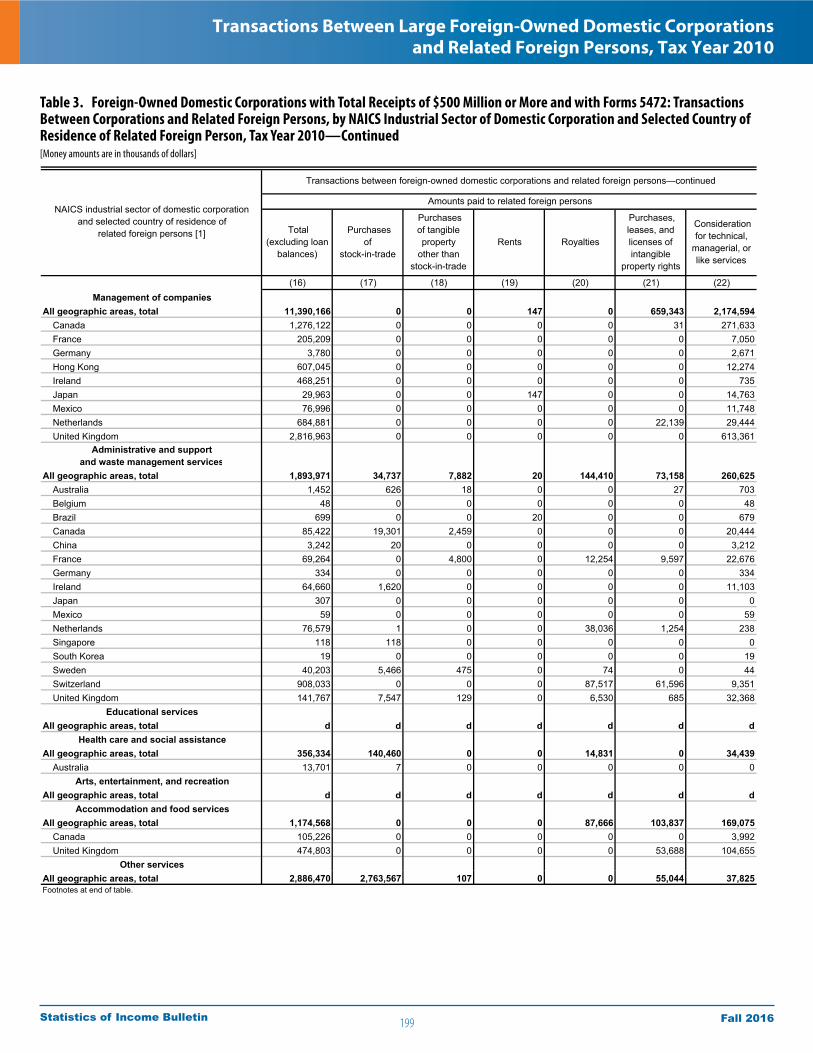
199
Transactions Between Large Foreign-Owned Domestic Corporations and Related Foreign Persons, Tax Year 2010
Fall 2016Statistics of Income Bulletin
Table 3. Foreign-Owned Domestic Corporations with Total Receipts of $500 Million or More and with Forms 5472: Transactions Between Corporations and Related Foreign Persons, by NAICS Industrial Sector of Domestic Corporation and Selected Country of Residence of Related Foreign Person, Tax Year 2010—Continued[Money amounts are in thousands of dollars]
(16) (17) (18) (19) (20) (21) (22)Management of companies
All geographic areas, total 11,390,166 0 0 147 0 659,343 2,174,594Canada 1,276,122 0 0 0 0 31 271,633France 205,209 0 0 0 0 0 7,050Germany 3,780 0 0 0 0 0 2,671Hong Kong 607,045 0 0 0 0 0 12,274Ireland 468,251 0 0 0 0 0 735Japan 29,963 0 0 147 0 0 14,763Mexico 76,996 0 0 0 0 0 11,748Netherlands 684,881 0 0 0 0 22,139 29,444United Kingdom 2,816,963 0 0 0 0 0 613,361
Administrative and supportand waste management services
All geographic areas, total 1,893,971 34,737 7,882 20 144,410 73,158 260,625Australia 1,452 626 18 0 0 27 703Belgium 48 0 0 0 0 0 48Brazil 699 0 0 20 0 0 679Canada 85,422 19,301 2,459 0 0 0 20,444China 3,242 20 0 0 0 0 3,212France 69,264 0 4,800 0 12,254 9,597 22,676Germany 334 0 0 0 0 0 334Ireland 64,660 1,620 0 0 0 0 11,103Japan 307 0 0 0 0 0 0Mexico 59 0 0 0 0 0 59Netherlands 76,579 1 0 0 38,036 1,254 238Singapore 118 118 0 0 0 0 0South Korea 19 0 0 0 0 0 19Sweden 40,203 5,466 475 0 74 0 44Switzerland 908,033 0 0 0 87,517 61,596 9,351United Kingdom 141,767 7,547 129 0 6,530 685 32,368
Educational servicesAll geographic areas, total d d d d d d d
Health care and social assistanceAll geographic areas, total 356,334 140,460 0 0 14,831 0 34,439
Australia 13,701 7 0 0 0 0 0Arts, entertainment, and recreation
All geographic areas, total d d d d d d dAccommodation and food services
All geographic areas, total 1,174,568 0 0 0 87,666 103,837 169,075Canada 105,226 0 0 0 0 0 3,992United Kingdom 474,803 0 0 0 0 53,688 104,655
Other servicesAll geographic areas, total 2,886,470 2,763,567 107 0 0 55,044 37,825Footnotes at end of table.
Consideration for technical,
managerial, or like services
Purchasesof
stock-in-trade
Purchasesof tangible property
other thanstock-in-trade
Rents Royalties
Purchases, leases, and licenses of intangible
property rights
Amounts paid to related foreign persons
Total (excluding loan
balances)
NAICS industrial sector of domestic corporationand selected country of residence of
related foreign persons [1]
Transactions between foreign-owned domestic corporations and related foreign persons—continued
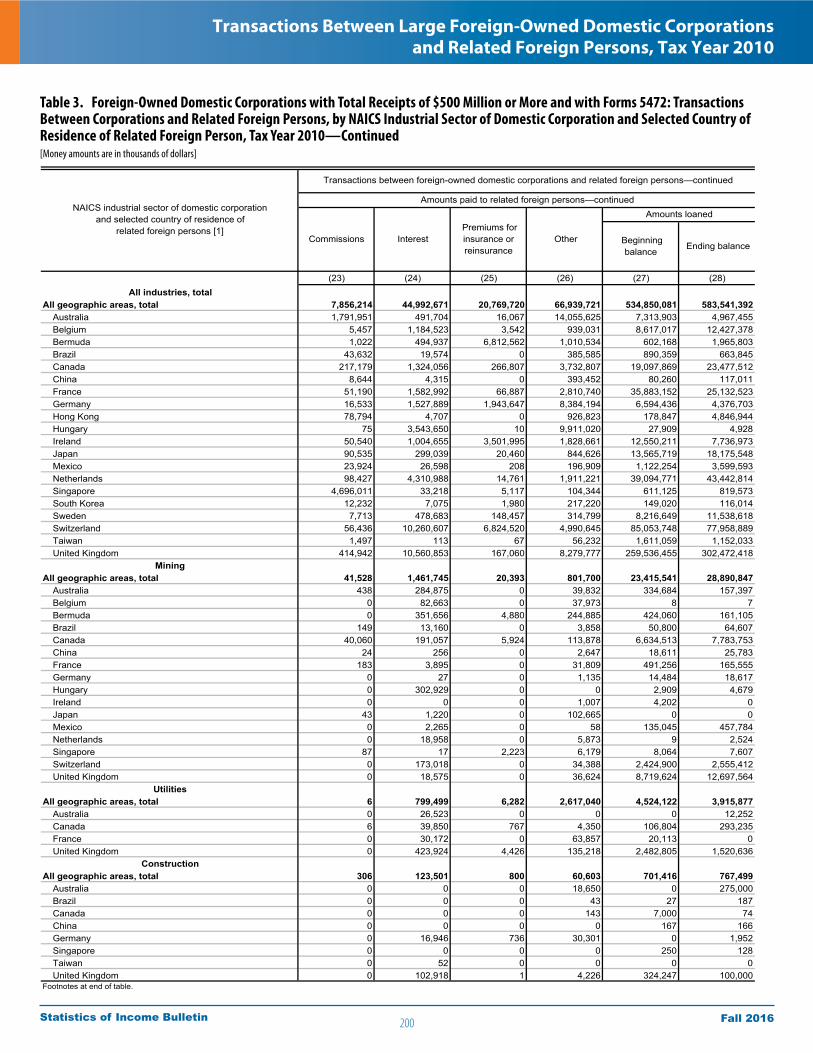
200
Transactions Between Large Foreign-Owned Domestic Corporations and Related Foreign Persons, Tax Year 2010
Fall 2016Statistics of Income Bulletin
Table 3. Foreign-Owned Domestic Corporations with Total Receipts of $500 Million or More and with Forms 5472: Transactions Between Corporations and Related Foreign Persons, by NAICS Industrial Sector of Domestic Corporation and Selected Country of Residence of Related Foreign Person, Tax Year 2010—Continued[Money amounts are in thousands of dollars]
(23) (24) (25) (26) (27) (28)All industries, total
All geographic areas, total 7,856,214 44,992,671 20,769,720 66,939,721 534,850,081 583,541,392Australia 1,791,951 491,704 16,067 14,055,625 7,313,903 4,967,455Belgium 5,457 1,184,523 3,542 939,031 8,617,017 12,427,378Bermuda 1,022 494,937 6,812,562 1,010,534 602,168 1,965,803Brazil 43,632 19,574 0 385,585 890,359 663,845Canada 217,179 1,324,056 266,807 3,732,807 19,097,869 23,477,512China 8,644 4,315 0 393,452 80,260 117,011France 51,190 1,582,992 66,887 2,810,740 35,883,152 25,132,523Germany 16,533 1,527,889 1,943,647 8,384,194 6,594,436 4,376,703Hong Kong 78,794 4,707 0 926,823 178,847 4,846,944Hungary 75 3,543,650 10 9,911,020 27,909 4,928Ireland 50,540 1,004,655 3,501,995 1,828,661 12,550,211 7,736,973Japan 90,535 299,039 20,460 844,626 13,565,719 18,175,548Mexico 23,924 26,598 208 196,909 1,122,254 3,599,593Netherlands 98,427 4,310,988 14,761 1,911,221 39,094,771 43,442,814Singapore 4,696,011 33,218 5,117 104,344 611,125 819,573South Korea 12,232 7,075 1,980 217,220 149,020 116,014Sweden 7,713 478,683 148,457 314,799 8,216,649 11,538,618Switzerland 56,436 10,260,607 6,824,520 4,990,645 85,053,748 77,958,889Taiwan 1,497 113 67 56,232 1,611,059 1,152,033United Kingdom 414,942 10,560,853 167,060 8,279,777 259,536,455 302,472,418
MiningAll geographic areas, total 41,528 1,461,745 20,393 801,700 23,415,541 28,890,847
Australia 438 284,875 0 39,832 334,684 157,397Belgium 0 82,663 0 37,973 8 7Bermuda 0 351,656 4,880 244,885 424,060 161,105Brazil 149 13,160 0 3,858 50,800 64,607Canada 40,060 191,057 5,924 113,878 6,634,513 7,783,753China 24 256 0 2,647 18,611 25,783France 183 3,895 0 31,809 491,256 165,555Germany 0 27 0 1,135 14,484 18,617Hungary 0 302,929 0 0 2,909 4,679Ireland 0 0 0 1,007 4,202 0Japan 43 1,220 0 102,665 0 0Mexico 0 2,265 0 58 135,045 457,784Netherlands 0 18,958 0 5,873 9 2,524Singapore 87 17 2,223 6,179 8,064 7,607Switzerland 0 173,018 0 34,388 2,424,900 2,555,412United Kingdom 0 18,575 0 36,624 8,719,624 12,697,564
UtilitiesAll geographic areas, total 6 799,499 6,282 2,617,040 4,524,122 3,915,877
Australia 0 26,523 0 0 0 12,252Canada 6 39,850 767 4,350 106,804 293,235France 0 30,172 0 63,857 20,113 0United Kingdom 0 423,924 4,426 135,218 2,482,805 1,520,636
ConstructionAll geographic areas, total 306 123,501 800 60,603 701,416 767,499
Australia 0 0 0 18,650 0 275,000Brazil 0 0 0 43 27 187Canada 0 0 0 143 7,000 74China 0 0 0 0 167 166Germany 0 16,946 736 30,301 0 1,952Singapore 0 0 0 0 250 128Taiwan 0 52 0 0 0 0United Kingdom 0 102,918 1 4,226 324,247 100,000
Footnotes at end of table.
Transactions between foreign-owned domestic corporations and related foreign persons—continued
Amounts paid to related foreign persons—continuedNAICS industrial sector of domestic corporation
and selected country of residence ofrelated foreign persons [1]
Other
Amounts loaned
Beginning balance Ending balance
Commissions Interest Premiums for insurance or reinsurance
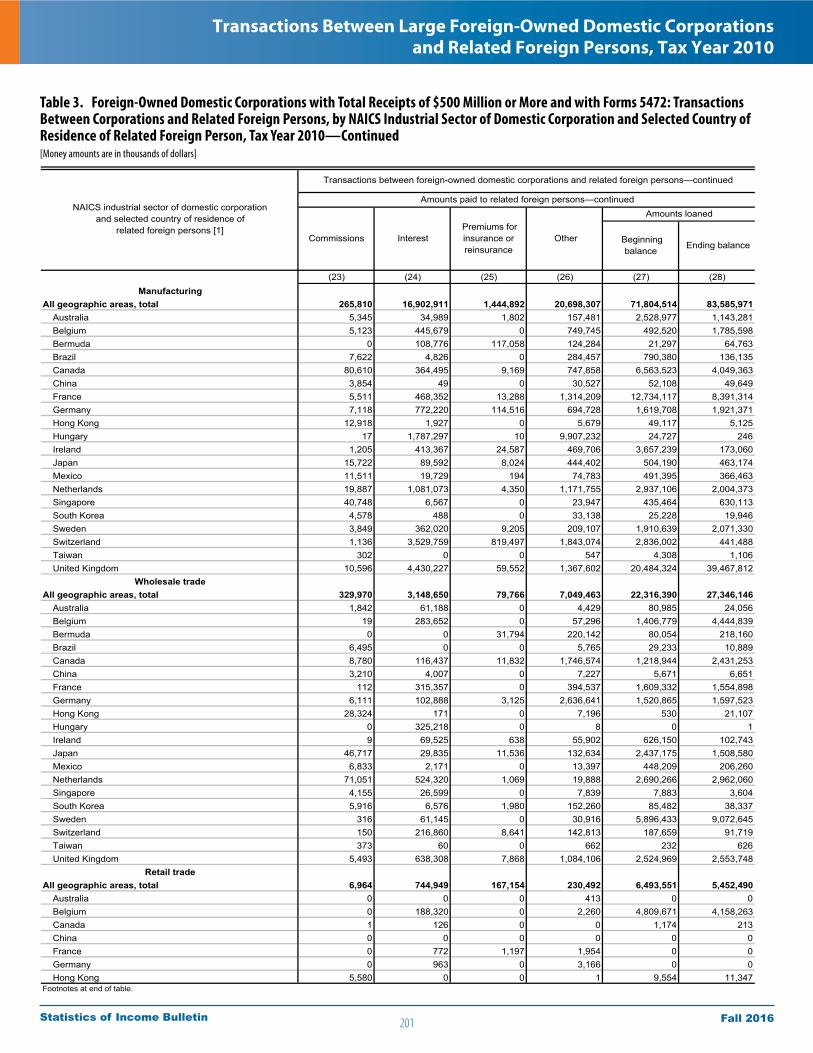
201
Transactions Between Large Foreign-Owned Domestic Corporations and Related Foreign Persons, Tax Year 2010
Fall 2016Statistics of Income Bulletin
Table 3. Foreign-Owned Domestic Corporations with Total Receipts of $500 Million or More and with Forms 5472: Transactions Between Corporations and Related Foreign Persons, by NAICS Industrial Sector of Domestic Corporation and Selected Country of Residence of Related Foreign Person, Tax Year 2010—Continued[Money amounts are in thousands of dollars]
(23) (24) (25) (26) (27) (28)Manufacturing
All geographic areas, total 265,810 16,902,911 1,444,892 20,698,307 71,804,514 83,585,971Australia 5,345 34,989 1,802 157,481 2,528,977 1,143,281Belgium 5,123 445,679 0 749,745 492,520 1,785,598Bermuda 0 108,776 117,058 124,284 21,297 64,763Brazil 7,622 4,826 0 284,457 790,380 136,135Canada 80,610 364,495 9,169 747,858 6,563,523 4,049,363China 3,854 49 0 30,527 52,108 49,649France 5,511 468,352 13,288 1,314,209 12,734,117 8,391,314Germany 7,118 772,220 114,516 694,728 1,619,708 1,921,371Hong Kong 12,918 1,927 0 5,679 49,117 5,125Hungary 17 1,787,297 10 9,907,232 24,727 246Ireland 1,205 413,367 24,587 469,706 3,657,239 173,060Japan 15,722 89,592 8,024 444,402 504,190 463,174Mexico 11,511 19,729 194 74,783 491,395 366,463Netherlands 19,887 1,081,073 4,350 1,171,755 2,937,106 2,004,373Singapore 40,748 6,567 0 23,947 435,464 630,113South Korea 4,578 488 0 33,138 25,228 19,946Sweden 3,849 362,020 9,205 209,107 1,910,639 2,071,330Switzerland 1,136 3,529,759 819,497 1,843,074 2,836,002 441,488Taiwan 302 0 0 547 4,308 1,106United Kingdom 10,596 4,430,227 59,552 1,367,602 20,484,324 39,467,812
Wholesale tradeAll geographic areas, total 329,970 3,148,650 79,766 7,049,463 22,316,390 27,346,146
Australia 1,842 61,188 0 4,429 80,985 24,056Belgium 19 283,652 0 57,296 1,406,779 4,444,839Bermuda 0 0 31,794 220,142 80,054 218,160Brazil 6,495 0 0 5,765 29,233 10,889Canada 8,780 116,437 11,832 1,746,574 1,218,944 2,431,253China 3,210 4,007 0 7,227 5,671 6,651France 112 315,357 0 394,537 1,609,332 1,554,898Germany 6,111 102,888 3,125 2,636,641 1,520,865 1,597,523Hong Kong 28,324 171 0 7,196 530 21,107Hungary 0 325,218 0 8 0 1Ireland 9 69,525 638 55,902 626,150 102,743Japan 46,717 29,835 11,536 132,634 2,437,175 1,508,580Mexico 6,833 2,171 0 13,397 448,209 206,260Netherlands 71,051 524,320 1,069 19,888 2,690,266 2,962,060Singapore 4,155 26,599 0 7,839 7,883 3,604South Korea 5,916 6,576 1,980 152,260 85,482 38,337Sweden 316 61,145 0 30,916 5,896,433 9,072,645Switzerland 150 216,860 8,641 142,813 187,659 91,719Taiwan 373 60 0 662 232 626United Kingdom 5,493 638,308 7,868 1,084,106 2,524,969 2,553,748
Retail tradeAll geographic areas, total 6,964 744,949 167,154 230,492 6,493,551 5,452,490
Australia 0 0 0 413 0 0Belgium 0 188,320 0 2,260 4,809,671 4,158,263Canada 1 126 0 0 1,174 213China 0 0 0 0 0 0France 0 772 1,197 1,954 0 0Germany 0 963 0 3,166 0 0Hong Kong 5,580 0 0 1 9,554 11,347
Footnotes at end of table.
Interest Premiums for insurance or reinsurance
Other
Amounts loaned
Beginning balance Ending balance
Commissions
NAICS industrial sector of domestic corporationand selected country of residence of
related foreign persons [1]
Transactions between foreign-owned domestic corporations and related foreign persons—continued
Amounts paid to related foreign persons—continued
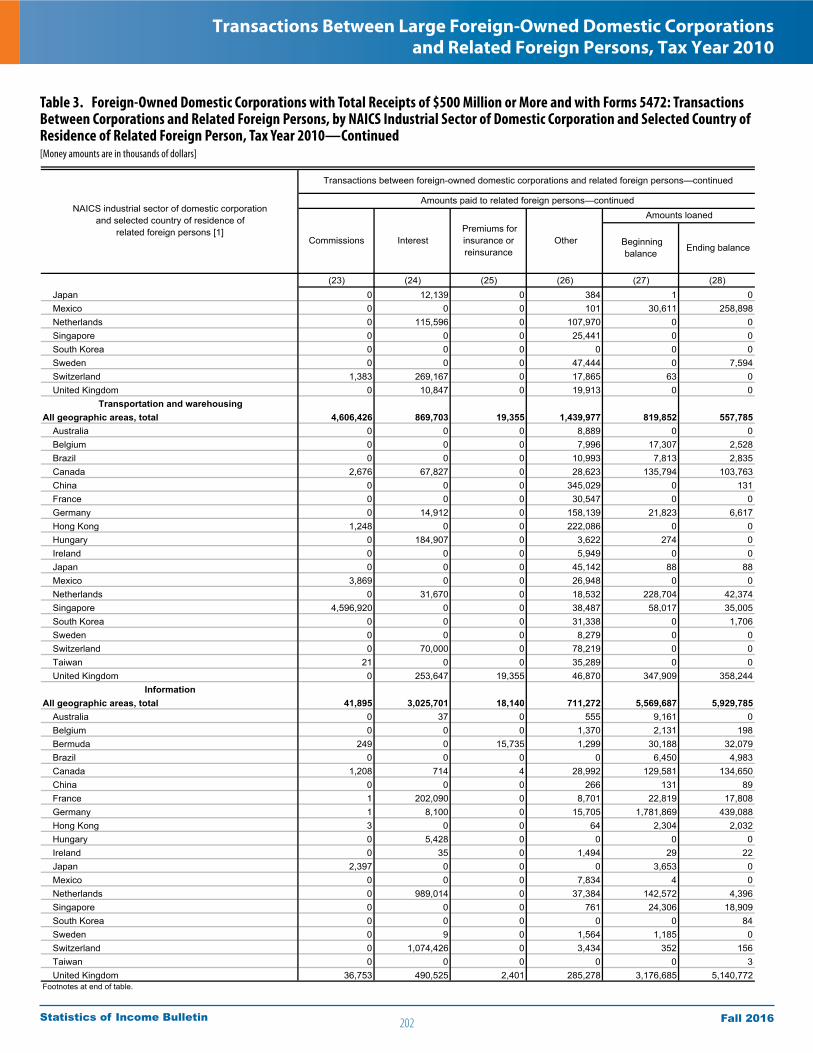
202
Transactions Between Large Foreign-Owned Domestic Corporations and Related Foreign Persons, Tax Year 2010
Fall 2016Statistics of Income Bulletin
Table 3. Foreign-Owned Domestic Corporations with Total Receipts of $500 Million or More and with Forms 5472: Transactions Between Corporations and Related Foreign Persons, by NAICS Industrial Sector of Domestic Corporation and Selected Country of Residence of Related Foreign Person, Tax Year 2010—Continued[Money amounts are in thousands of dollars]
(23) (24) (25) (26) (27) (28)Japan 0 12,139 0 384 1 0Mexico 0 0 0 101 30,611 258,898Netherlands 0 115,596 0 107,970 0 0Singapore 0 0 0 25,441 0 0South Korea 0 0 0 0 0 0Sweden 0 0 0 47,444 0 7,594Switzerland 1,383 269,167 0 17,865 63 0United Kingdom 0 10,847 0 19,913 0 0
Transportation and warehousingAll geographic areas, total 4,606,426 869,703 19,355 1,439,977 819,852 557,785
Australia 0 0 0 8,889 0 0Belgium 0 0 0 7,996 17,307 2,528Brazil 0 0 0 10,993 7,813 2,835Canada 2,676 67,827 0 28,623 135,794 103,763China 0 0 0 345,029 0 131France 0 0 0 30,547 0 0Germany 0 14,912 0 158,139 21,823 6,617Hong Kong 1,248 0 0 222,086 0 0Hungary 0 184,907 0 3,622 274 0Ireland 0 0 0 5,949 0 0Japan 0 0 0 45,142 88 88Mexico 3,869 0 0 26,948 0 0Netherlands 0 31,670 0 18,532 228,704 42,374Singapore 4,596,920 0 0 38,487 58,017 35,005South Korea 0 0 0 31,338 0 1,706Sweden 0 0 0 8,279 0 0Switzerland 0 70,000 0 78,219 0 0Taiwan 21 0 0 35,289 0 0United Kingdom 0 253,647 19,355 46,870 347,909 358,244
InformationAll geographic areas, total 41,895 3,025,701 18,140 711,272 5,569,687 5,929,785
Australia 0 37 0 555 9,161 0Belgium 0 0 0 1,370 2,131 198Bermuda 249 0 15,735 1,299 30,188 32,079Brazil 0 0 0 0 6,450 4,983Canada 1,208 714 4 28,992 129,581 134,650China 0 0 0 266 131 89France 1 202,090 0 8,701 22,819 17,808Germany 1 8,100 0 15,705 1,781,869 439,088Hong Kong 3 0 0 64 2,304 2,032Hungary 0 5,428 0 0 0 0Ireland 0 35 0 1,494 29 22Japan 2,397 0 0 0 3,653 0Mexico 0 0 0 7,834 4 0Netherlands 0 989,014 0 37,384 142,572 4,396Singapore 0 0 0 761 24,306 18,909South Korea 0 0 0 0 0 84Sweden 0 9 0 1,564 1,185 0Switzerland 0 1,074,426 0 3,434 352 156Taiwan 0 0 0 0 0 3United Kingdom 36,753 490,525 2,401 285,278 3,176,685 5,140,772
Footnotes at end of table.
Premiums for insurance or reinsurance
Other
NAICS industrial sector of domestic corporationand selected country of residence of
related foreign persons [1]
Transactions between foreign-owned domestic corporations and related foreign persons—continued
Amounts paid to related foreign persons—continuedAmounts loaned
Beginning balance Ending balance
Commissions Interest

203
Transactions Between Large Foreign-Owned Domestic Corporations and Related Foreign Persons, Tax Year 2010
Fall 2016Statistics of Income Bulletin
Table 3. Foreign-Owned Domestic Corporations with Total Receipts of $500 Million or More and with Forms 5472: Transactions Between Corporations and Related Foreign Persons, by NAICS Industrial Sector of Domestic Corporation and Selected Country of Residence of Related Foreign Person, Tax Year 2010—Continued[Money amounts are in thousands of dollars]
(23) (24) (25) (26) (27) (28)Finance and insurance
All geographic areas, total 2,486,272 9,999,923 18,916,522 28,349,026 365,786,679 360,264,304Australia 1,776,688 83,808 14,265 13,809,771 4,225,465 3,199,831Belgium 315 127,267 2,453 69,072 17 0Bermuda 292 34,504 6,621,116 419,922 46,551 1,283,481Brazil 24,035 1,181 0 19,595 1,015 25,284Canada 67,488 177,519 217,496 222,387 3,751,869 4,488,177China 1,556 0 0 5,736 2,067 3,124France 44,526 295,059 52,187 411,032 17,445,195 9,237,367Germany 2,618 411,706 1,825,271 4,614,103 1,407,022 82,237Hong Kong 23,411 103 0 105,559 49,491 69,443Hungary 59 206,990 0 157 0 0Ireland 49,326 73,713 3,386,330 825,040 1,886 70,666Japan 25,657 165,946 899 95,466 10,405,463 16,203,444Mexico 111 2,314 0 9,296 9,425 23,895Netherlands 7,489 898,587 9,329 219,621 27,861,913 30,665,542Singapore 53,935 34 2,893 1,375 9,724 79,268South Korea 42 11 0 0 33,286 53,164Sweden 3,548 0 131,167 7,741 7 11Switzerland 53,328 4,115,971 5,996,382 2,794,488 79,271,478 74,192,926Taiwan 247 1 67 529 261 189United Kingdom 333,779 2,653,951 66,370 3,952,507 210,546,654 211,887,523
Real estate and rental and leasingAll geographic areas, total 0 526,471 0 68,270 8,584,869 7,819,954
Australia 0 0 0 0 151 16Canada 0 2,685 0 118 45,962 47,258China 0 0 0 0 23 17France 0 5,311 0 1,982 24 194Germany 0 4,437 0 0 2 0Mexico 0 0 0 0 1,631 1,074Singapore 0 0 0 0 51 9Switzerland 0 0 0 0 1 9United Kingdom 0 138,707 0 9,996 295,300 310,256
Professional, scientific, and technical services
All geographic areas, total 438 845,869 23,891 596,661 4,230,688 5,185,658Australia 0 117 0 1,373 18,392 722Belgium 0 0 0 0 1,189 0Brazil 0 0 0 1,441 4,433 2,088Canada 0 30,209 21,615 38,210 58,638 555,270China 0 0 0 196 1,482 4,433France 0 198,420 165 204,465 2,997,282 2,267,585Germany 0 114,251 0 227,917 228,313 201,908Hong Kong 0 0 0 1,266 467 473Hungary 0 45,220 0 0 0 0Ireland 0 106,906 0 5,735 0 0Japan 0 0 0 8,798 215,141 100Mexico 0 0 14 962 2,833 4,366Netherlands 0 195,157 13 5,837 390,749 1,989,378Singapore 0 0 0 316 1,166 51South Korea 0 0 0 0 0 2,461Sweden 0 38,089 0 237 0 0Switzerland 438 22,673 0 3,470 0 271Taiwan 0 0 0 3 792 766United Kingdom 0 73,829 2,083 54,797 153,993 72,226
Footnotes at end of table.
Amounts paid to related foreign persons—continuedAmounts loaned
Beginning balance Ending balance
Commissions Interest Premiums for insurance or reinsurance
Other
NAICS industrial sector of domestic corporationand selected country of residence of
related foreign persons [1]
Transactions between foreign-owned domestic corporations and related foreign persons—continued

204
Transactions Between Large Foreign-Owned Domestic Corporations and Related Foreign Persons, Tax Year 2010
Fall 2016Statistics of Income Bulletin
Table 3. Foreign-Owned Domestic Corporations with Total Receipts of $500 Million or More and with Forms 5472: Transactions Between Corporations and Related Foreign Persons, by NAICS Industrial Sector of Domestic Corporation and Selected Country of Residence of Related Foreign Person, Tax Year 2010—Continued[Money amounts are in thousands of dollars]
(23) (24) (25) (26) (27) (28)Management of companies
All geographic areas, total 76,599 4,477,823 2,493 3,999,167 18,260,612 51,661,004Canada 16,348 194,562 0 793,548 424,534 3,574,347France 857 23,878 0 173,424 70,964 3,327,337Germany 686 73 0 350 0 106,965Hong Kong 7,310 2,506 0 584,955 66,429 4,735,380Ireland 0 2,967 722 463,827 58,696 17,041Japan 0 0 0 15,053 6 143Mexico 1,599 120 0 63,529 3,005 2,275,758Netherlands 0 371,074 0 262,224 4,714,114 5,610,547United Kingdom 28,321 936,033 0 1,239,248 9,297,239 26,861,691
Administrative and supportand waste management services
All geographic areas, total 0 1,268,230 49,824 55,085 1,434,381 1,176,610Australia 0 0 0 78 113,581 115,302Belgium 0 0 0 0 0 4Brazil 0 0 0 0 2 0Canada 0 37,474 0 5,744 17,628 16,035China 0 0 0 10 0 2France 0 12,309 51 7,577 492,051 170,467Germany 0 0 0 0 4 97Ireland 0 15,252 36,685 0 27,182 27,886Japan 0 307 0 0 0 0Mexico 0 0 0 0 96 5,095Netherlands 0 27,262 0 9,788 42 281Singapore 0 0 0 0 23,496 18,289South Korea 0 0 0 0 0 0Sweden 0 16,877 8,086 9,181 62,484 16,951Switzerland 0 746,732 0 2,837 314,173 219,817United Kingdom 0 76,830 5,002 12,676 349,386 555,130
Educational servicesAll geographic areas, total d d d d d d
Health care and social assistanceAll geographic areas, total 0 132,703 20,207 13,694 1,905 121
Australia 0 0 0 13,694 0 0Arts, entertainment, and recreation
All geographic areas, total d d d d d dAccommodation and food services
All geographic areas, total 0 600,869 0 213,121 652,149 762,855Canada 0 101,100 0 134 0 0United Kingdom 0 300,344 0 16,116 636,407 762,855
Other servicesAll geographic areas, total 0 10,930 0 18,997 196,915 183,834d—In order to avoid disclosure of information for specific corporations, some data have been deleted. Data are included in appropriate totals.[1] Selected country data have been deleted to prevent disclosure of information for individual taxpayers. However, the data are included in the appropriate totals.[2] Number of returns is not additive because some foreign-controlled domestic corporations had transactions with related parties in multiple foreign countries.NOTES: NAICS is the abbreviation for the North American Industry Classification System. Detail may not add to totals because of rounding.SOURCE: IRS, Statistics of Income Division, Foreign-Owned Domestic Corporations Study, September 2015.
Amounts loaned
Beginning balance Ending balance
Commissions Interest Premiums for insurance or reinsurance
Other
NAICS industrial sector of domestic corporationand selected country of residence of
related foreign persons [1]
Transactions between foreign-owned domestic corporations and related foreign persons—continued
Amounts paid to related foreign persons—continued

Publication 1136 (Rev. 11-2016) Catalogue Number 46996F Department of the Treasury Internal Revenue Service www.irs.gov